Ungerer, L.M. & Joubert, J.P.R. (2011). The role of personal values in lifestyle measures.
Upload
independentCategory
view
0download
0
Species differences in the expression of AHI1, a proteinimplicated in the neurodevelopmental disorder Joubertsyndrome, with preferential accumulation to stigmoid bodies
Jennifer E. Doering1,@, Kelly Kane1,@, Yi-Chun Hsiao1, Cong Yao1, Bingxing Shi1, AmberD. Slowik1, Bakul Dhagat1, Delisha D. Scott1, Jeffrey G. Ault2, Patrick S. Page-McCaw1, andRussell J. Ferland1,2,*
1Department of Biology, Center for Biotechnology and Interdisciplinary Studies, RensselaerPolytechnic Institute, Troy, NY 12180 (U.S.A.)2The Wadsworth Center, New York State Department of Health, Albany, NY 12201 (U.S.A.)
AbstractJoubert syndrome (JBTS) is an autosomal recessive disorder characterized by cerebellum andbrainstem malformations. Individuals with JBTS have abnormal breathing and eye movements,ataxia, hypotonia, and cognitive difficulty, and they display mirror movements. Mutations in theAbelson-helper integration site-1 gene (AHI1) cause JBTS in humans, suggesting that AHI1 isrequired for hindbrain development; however AHI1 may also be required for neuronal function.Support for this idea comes from studies demonstrating that the AHI1 locus is associated withschizophrenia. To gain further insight into the function of AHI1 in both the developing and matureCNS, we determined the spatial and temporal expression patterns of the gene products of AHI1orthologs throughout development, in human, mouse, and zebrafish. Murine Ahi1 was distributedthroughout the cytoplasm, dendrites, and axons of neurons, but was absent in glial cells. Ahi1expression in the mouse brain was observed as early as embryonic day 10.5 and persisted intoadulthood, with peak expression during the first post-natal week. Murine Ahi1 was observed inneurons of the hindbrain, midbrain, and ventral forebrain. Generally, the AHI1/Ahi1/ahi1orthologs had a conserved distribution pattern in human, mouse, and zebrafish, but mouse Ahi1was not present in the developing and mature cerebellum. Ahi1 was also observed consistently inthe stigmoid body, a poorly characterized cytoplasmic organelle found in neurons. Overall, theseresults suggest roles for AHI1 in neurodevelopmental processes that underlie most of theneuroanatomical defects in JBTS, and perhaps in neuronal functions that contribute toschizophrenia.
Keywordsmouse; human; zebrafish; hindbrain
IntroductionJoubert syndrome (JBTS) is a rare autosomal recessive neurodevelopmental disordercharacterized by multiple behavioral and neuroanatomical abnormalities. Individuals with
@These authors contributed equally to this project*Correspondence to: Russell J. Ferland, Ph.D. Rensselaer Polytechnic Institute Biology Department 110 8th Street, BT2227 Troy,NY 12180 Phone: (518) 276-4309 Fax: (518) 276-4344 E-mail: [email protected] Editor: John L. R. Rubenstein
NIH Public AccessAuthor ManuscriptJ Comp Neurol. Author manuscript; available in PMC 2009 November 10.
Published in final edited form as:J Comp Neurol. 2008 November 10; 511(2): 238–256. doi:10.1002/cne.21824.
NIH
-PA Author Manuscript
NIH
-PA Author Manuscript
NIH
-PA Author Manuscript

classic JBTS have ataxia, hyperpnea/apnea, abnormal eye movements, hypotonia(weakness), developmental delay, and varying degrees of cognitive difficulties (Cantani etal., 1990; Chance et al., 1999; Joubert et al., 1968; Joubert et al., 1969; Kendall et al., 1990;Maria et al., 1999; Parisi et al., 2007; Saraiva and Baraitser, 1992; van Dorp et al., 1991).Classic JBTS is characterized neuroradiographically by cerebellar vermal aplasia/hypoplasiaand by the molar tooth sign (an abnormal configuration of the superior cerebellar peduncles)(Friede and Boltshauser, 1978; Joubert et al., 1968; Joubert et al., 1969; Kendall et al., 1990;Maria et al., 1999; Niesen, 2002; Parisi et al., 2007; Quisling et al., 1999; van Dorp et al.,1991; Yachnis and Rorke, 1999). Neuropathological analyses of brains from individualswith JBTS catalogued multiple abnormalities in axonal tracts that cross the posterior midlineof the brain (e.g. the superior cerebellar peduncles and the corticospinal tract). However, notall midline crossing tracts are abnormal (e.g. the corpus callosum and optic chiasm properlydecussate) (Friede and Boltshauser, 1978; Joubert et al., 1968; Joubert et al., 1969; Kendallet al., 1990; Maria et al., 1999; Niesen, 2002; Quisling et al., 1999; van Dorp et al., 1991;Yachnis and Rorke, 1999). Other major neuroanatomical abnormalities in JBTS, particularlyin the hindbrain, include dysplasia/hypoplasia of the inferior olives, accessory olives, thesolitary nuclei and tracts, and the nucleus and spinal tracts of cranial nerve V (Friede andBoltshauser, 1978; Maria et al., 1999; Quisling et al., 1999; Yachnis and Rorke, 1999).Several non-brain features are associated with JBTS, such as retinal dysplasia and pathologyof the kidney and liver (Gleeson et al., 2004; Liao et al., 2005; Parisi et al., 2007; Utsch etal., 2006; Valente et al., 2006). The differences in clinical and neuropathologicalcharacteristics observed in the various subclasses of JBTS suggest that JBTS is aheterogeneous family of disorders (Gleeson et al., 2004; Parisi et al., 2007).
One of the first genes implicated in JBTS was the Abelson-helper integration site-1 gene,AHI1 (Dixon-Salazar et al., 2004; Ferland et al., 2004) in the JBTS3 locus on chromosome6q23 (Lagier-Tourenne et al., 2004). Individuals with AHI1 mutations have the classic brainmalformations of cerebellar vermis aplasia, the molar tooth sign, and limited involvement ofthe cerebral cortex. However, kidney disease in patients with AHI1 mutations is relativelyrare (Parisi et al., 2006; Utsch et al., 2006; Valente et al., 2006). The human AHI1 geneencodes a cytoplasmic multi-domain protein containing an N-terminal coiled-coil domain,multiple WD40 repeats, and a C-terminal SH3 domain (Jiang et al., 2002). The combinationof protein-binding domain motifs indicates that AHI1 is likely a signaling or scaffoldingprotein involved in protein-protein interactions (Ferland et al., 2004; Jiang et al., 2002).
Prior expression studies suggest that AHI1 is involved most specifically in the developmentof the hindbrain (Dixon-Salazar et al., 2004; Ferland et al., 2004). Northern blot analysisdemonstrates that AHI1 is expressed in human fetal brain and kidney (Dixon-Salazar et al.,2004; Ferland et al., 2004). In whole mouse brain, Ahi1 mRNA is found as early asembryonic day 10.5 with Ahi1 expression peaking during the first week of life and thencontinuing at lower levels into adulthood (Ferland et al., 2004). In situ hybridization studiesconfirmed this temporal pattern of expression of Ahi1 mRNA (Ferland et al., 2004).Moreover, Ahi1 mRNA is expressed throughout the brain, with the highest expression in thedeep cerebellar nuclei, brainstem, tectum, hypothalamus, and amygdala, but very weakexpression in the cerebellum and cerebral cortex (Ferland et al., 2004). Given these temporaland spatial expression patterns of murine Ahi1 mRNA, these data suggest that Ahi1 isinvolved in the development of the hindbrain and ventral forebrain, and possibly thecerebellum. Our present study has sought to determine the expression profiles of the geneproduct, AHI1/Ahi1/ahi1 in human, mouse, and zebrafish, respectively.
Ahi1 mRNA expression in the mouse brain persists into adulthood, suggesting that Ahi1 hasfunctions beyond its role in the development of the central nervous system (Ferland et al.,2004). Association studies, using single nucleotide polymorphism (SNP) genotyping, found
Doering et al. Page 2
J Comp Neurol. Author manuscript; available in PMC 2009 November 10.
NIH
-PA Author Manuscript
NIH
-PA Author Manuscript
NIH
-PA Author Manuscript

a high association between SNPs in human AHI1 and individuals with schizophrenia(Amann-Zalcenstein et al., 2006; Ingason et al., 2007). These studies suggest that AHI1 hasadditional roles in brain development, and possibly in the functioning of the mature nervoussystem, separate from the events during development in which mutations to AHI1 lead to themalformations of the posterior hindbrain associated with JBTS.
No formal examination of the temporal and spatial patterns of protein expression of theAHI1 orthologs has been conducted previously. Comparisons of the gene products of theAHI1 orthologs (primate, rodent, and zebrafish) indicate that, relative to the human andzebrafish protein, the rodent Ahi1 protein lacks an N-terminal, 140 amino acid putativecoiled-coil domain (5′-RACE analysis, database ESTs, known mRNAs for Ahi1, all fail toidentify this domain in mouse/rat)(Jiang et al., 2002). These differences suggest that AHI1may have been under evolutionary selection. To address this idea, comparisons of the AHI1gene sequences of various human and non-human primates were made and demonstrate thatthe primate AHI1 gene appears to be under positive selection along the human lineage(Ferland et al., 2004). This signifies that an understanding of species differences among theAHI1 orthologs will aid in the elucidation of the function of this gene in brain development.To explore species differences in the AHI1 family of genes, we sought to determine thelocalization pattern of AHI1 orthologs in multiple species. An understanding of thedifferences in AHI1-isoform expression at the neuroanatomical, cellular, and biochemicallevels will not only aid in elucidating the role of the protein in brain development, but willalso help in determining how mutations in AHI1 give rise to JBTS, and possiblyschizophrenia, in humans.
MATERIAL AND METHODSProduction and characterization of antibodies against human AHI1 and mouse Ahi1
Rabbit polyclonal antibodies specific for human AHI1 or mouse Ahi1 were raised againstvarious peptides derived from the human or mouse protein sequence, respectively.Specifically, peptides generated for the human AHI1 protein (Ab-813;PAPQKQSINKNKSQ, amino acids 1138-1151) and to four distance separate amino acidlocations in the mouse Ahi1 protein (N-terminus: Ab-82/83, PTADDSDDSREKTGIE,amino acids 21-36; C-terminus: Ab-809, RSPPLTPKEKTKPE, amino acids 973-986; C-terminus: Ab-84/85, SEKGKDQNVEDRGHK, amino acids 1014-1028; C-terminus:Ab-05/06, KKSEPVVRKVTLIE, amino acids 1034-1047). The synthesis and conjugation ofthe peptide and production of rabbit polyclonal antibodies were performed by eitherCovance (Denver, PA) or Sigma-Genosys (The Woodlands, TX). All antibodies wereaffinity purified using the corresponding peptide and the SulfoLink Kit (Pierce, Rockford,IL) according to the manufacturer’s instructions.
The specificity of each antibody was determined using standard Western blotting andimmunostaining techniques. Full-length human AHI1 and mouse Ahi1 sequences werecloned in-frame into an EGFP expression plasmid containing a CMV promoter (Human: N-terminal EGFP-AHI1 and C-terminal EGFP-AHI1; Mouse: N-terminal EGFP-Ahi1 and C-terminal EGFP-Ahi1). HEK293 cells (ATCC, Manassas, VA) were transiently transfectedwith each of these constructs using Lipofectamine 2000 (Invitrogen, Carlsbad, CA). AfterEGFP-expressing cells were observed (approximately 70% of the cells at confluence in eachculture dish expressed EGFP), they were lysed with boiling 2X sample buffer (62.5 mM Tris(pH 6.8), 2% SDS, 20% glycerol, 0.01% bromophenol blue, 5% β-mercaptoethanol (BME)),yielding protein lysates for separation on SDS/8% PAGE gels with electroblotting ontoPVDF transfer membrane (Millipore, Billerica, MA). Blots were probed with each AHI1/Ahi1 antibodies (rabbit IgG) in combination with EGFP antibodies in order to determinelocalization of both AHI1 and EGFP; co-immunoreactivity indicates the specificity of each
Doering et al. Page 3
J Comp Neurol. Author manuscript; available in PMC 2009 November 10.
NIH
-PA Author Manuscript
NIH
-PA Author Manuscript
NIH
-PA Author Manuscript

of the AHI1/Ahi1 antibodies (EGFP antibody: immunogen: full-length Aequorea victoriagreen fluorescent protein; mouse IgG; 1:2000; Cat. # 632381; Lot # 8010026; Clontech,Mountain View, CA); this antibody recognizes native and denatured GFP and EGFP as wellas N- and C-terminal fusion proteins; addition of this antibody to non-EGFP containingcultured neuronal cells or brain tissue results in no specific signal (data not shown; seemanufacturer’s technical data sheet). The N-terminal EGFP-human-AHI1 and C-terminalEGFP-human-AHI1 lysates were probed with Ab-813; and the N-terminal EGFP-mouse-Ahi1 and C-terminal EGFP-mouse-Ahi1 lysates were probed with Ab-82/83, Ab-809,Ab-84/85, and Ab-05/06 at varying concentrations. The primary antibodies were detectedwith goat anti-mouse IgG-Cy3 (for EGFP) and goat anti-rabbit IgG-Cy5 (for AHI1)fluorescent secondary antibodies (1:500; GE Healthcare, Piscataway, NJ). The signals wereanalyzed with a Typhoon Trio+ scanner and ImageQuant analysis software (GE Healthcare).Western blot analysis of these lysates demonstrated that the human AHI1 antibodyrecognized a band of ∼190 kDa corresponding to the size of the EGFP-human-AHI1 fusionprotein. Similar results were obtained for the mouse Ahi1 antibodies and the EGFP-mouse-Ahi1 fusion protein (∼160 kDa). The EGFP antibody detected an overlapping molecularmass signal with the AHI1/Ahi1 antibody signals (data not shown). In addition, incubationof each of the AHI1/Ahi1 antibodies with a 5X excess of the corresponding peptide was ableto completely abolish the signal corresponding to the AHI1/Ahi1 bands (data not shown).
In addition, HEK293 cells that expressed EGFP-tagged human AHI1 or mouse Ahi1 werealso immunostained with the corresponding species AHI1/Ahi1 antibodies in conjunctionwith an Alexa-546 goat anti-rabbit IgG secondary antibody (Invitrogen), to determinewhether AHI1/Ahi1 and EGFP co-localized in these cells. Over-expression of human AHI1-EGFP and mouse Ahi1-EGFP by transient transfections resulted in cytoplasmic expressionof the EGFP-tagged AHI1/Ahi1 proteins. In these transfected cell lines, immunostainingwith the corresponding human AHI1 antibody or mouse Ahi1 antibodies demonstratedoverlapping localization of EGFP and human AHI1 and mouse Ahi1, respectively (data notshown).
To further confirm the specificity of the mouse Ahi1 antibodies, we performed peptideblocking experiments in which the mouse Ahi1 antibodies were pre-incubated with a 5Xexcess of each corresponding peptide that was used to raise the antibodies. The antibody-peptide mixture was then added to mouse brain sections using standardimmunohistochemistry (as described below). Excess peptide was able to completely abolishthe immunostaining observed with the mouse Ahi1 antibodies alone (without peptide) (Fig.1a, b).
An additional confirmation method used to determine the specificity of each mouse Ahi1antibody was Western blot analyses of IMCD3 cells (a mouse inner medullary collectingduct cell line; ATCC, Manassas, VA). IMCD3 cells were grown according to themanufacturer’s instructions. IMCD3 cells were transfected with a pSUPER.gfp+neo RNAiconstruct (Oligoengine, Seattle, WA) containing a shRNAi sequence directed against mouseAhi1 or a scrambled sequence. After 3-5 days in culture, the IMCD3 cells were lysed andprocessed for mouse Ahi1 Western immunoblotting as described above. Wild-type IMCD3cells or cells transfected with scrambled sequence expressed full-length Ahi1 with amolecular mass of 130 kDa as determined by Western blotting with Ahi1 antibodies (Fig.1c). One additional ∼150 kDa protein band was also observed by Western blotting in wild-type IMCD3 cells and cells transfected with scrambled sequence (data not shown). No bandswere found with a molecular mass below 130 kDa. IMCD3 cells transfected with shRNAiconstructs against mouse Ahi1 demonstrated no detectable levels of the 130 kDa, full-lengthmouse Ahi1 protein (Fig. 1c). However, the additional ∼150 kDa protein band still remainedin Ahi1-knockdown cells (data not shown). Given this result, we performed
Doering et al. Page 4
J Comp Neurol. Author manuscript; available in PMC 2009 November 10.
NIH
-PA Author Manuscript
NIH
-PA Author Manuscript
NIH
-PA Author Manuscript
immunocytochemistry for Ahi1 in Ahi1-knockdown IMCD3 cells. Significant decreases inAhi1 immunoreactivity were observed in these cells (data not shown). This suggests that this∼150 kDa band observed by Western blotting was not observed in non-denatured,immunocytochemical experiments.
The final confirmation method used to determine the specificity of each mouse Ahi1antibody was immunostaining of primary mouse neurons that had been transfected withmouse Ahi1 siRNAs (details below). Primary neuronal cultures from mouse hypothalamuswere grown using modified neuronal culturing techniques (Banker and Goslin, 2002).Briefly, hypothalami from embryonic day 17.5 (E17.5) mice were dissected and placed intoice-cold Ca++/Mg++ free PBS. The tissue was minced into smaller pieces and added to atrypsin/EDTA solution for 30 minutes at 37°C. Following trypsin digestion, the tissue wasrinsed with a trypsin inhibitor and placed in Neurobasal medium supplemented with B27,glucose, sodium pyruvate, glutamine, and gentamicin (all at manufacturer’s suggestedconcentrations (Invitrogen (GIBCO), Carlsbad, CA)). The tissue was triturated multipletimes, to liberate individual cells from the tissue. Viable cells were counted on ahemocytometer, using the trypan blue exclusion assay, and were then plated onto poly-d-lysine treated glass coverslips at density of 2000-5000 cells/mm2. Following incubation for1-3 days, hypothalamic cell cultures were transfected, using Lipofectamine 2000(Invitrogen), with both an ON-TARGETplus SMARTpool of siRNAs directed againstmouse Ahi1 (Dharmacon, Chicago, IL) and an EGFP-expressing plasmid, all according tothe manufacturers’ suggested protocols. Neuronal cultures were allowed to grow for anadditional 3-5 days and were then fixed in cold 4% paraformaldehyde (PFA) and processedfor mouse Ahi1 immunostaining, as described below. The transfected cells were visualizedon a Zeiss AxioImager-A1 microscope with AxioVision Rel. 4.5 software (Carl ZeissMicroimaging, Thornwood, NY), with EGFP used as the indicator of any cell that was co-transfected with mouse Ahi1 siRNAs.
Primary cultures of hypothalamic neurons were immunostained with each mouse Ahi1antibody individually; they demonstrated diffuse cytoplasmic, dendritic, and axonallocalization (Fig. 1d). However, knockdown of mouse Ahi1 expression in hypothalamiccultures by siRNA resulted in greatly reduced expression or absence of Ahi1 staining onlywith mouse Ahi1 antibodies, Ab-84/85 and Ab-05/06 (data for Ab-05/06 shown in Fig. 1d).Antibody Ab-82/83 continued to show immunostaining in cultured Ahi1-knockdownneurons, although at a reduced level, suggesting that this antibody was not entirely specificfor mouse Ahi1 in non-denatured protein preparations (this antibody is specific for mouseAhi1 protein by Western blotting). Lastly, Ab-809 did not show any detectableimmunostaining of cultured neurons suggesting the epitope for this antibody is hidden in thefolded protein, under non-denaturing conditions (since this antibody is specific by Westernblotting). Given that all of the mouse Ahi1 antibodies are specific by Western blotting, butonly mouse Ab-84/85 and mouse Ab-05/06 are specific in immunohistochemical assays, wepresent all of following mouse experiments using Ab-05/06; however, Ab-84/85 gavesimilar results by immunohistochemistry and Western blotting. For experiments usinghuman AHI1 protein, we utilized human AHI1 antibody, Ab-813.
Animals and histological proceduresAll mice used to characterize the normal expression pattern of Ahi1 were wild-type SwissWebster mice obtained from Taconic (Germantown, NY). The mice were sacrificed atvarious developmental ages: embryonic day (E) 10.5, E12.5, E14.5, E16.5, E18.5, postnatalday (P) 0.5, P1.5, P3.5, P7.5, P10.5, P14.5, P21.5, and adult.
To obtain tissue for immunohistochemistry (IHC), we administered an overdose of eithersodium pentobarbital or avertin to mice, which were then perfused transcardially with 0.1M
Doering et al. Page 5
J Comp Neurol. Author manuscript; available in PMC 2009 November 10.
NIH
-PA Author Manuscript
NIH
-PA Author Manuscript
NIH
-PA Author Manuscript

phosphate-buffered saline (PBS; pH 7.4). This was followed by cold 4% PFA (made inPBS). Brains were dissected, post-fixed in 4% PFA, and stored at 4°C for up to 7 days.Following post-fixation, brains were cryoprotected in a 30% sucrose solution made in PBS.
Brains were sectioned on a Microm cryostat (Richard-Allan Scientific, Kalamazoo, MI), ineither the sagittal or coronal plane, at a thickness of 25-40 μm (depending on thedevelopmental stage). All sections were mounted on Superfrost Plus microscope slides(Fisher Scientific, Pittsburg, PA) and allowed to air dry for 30 minutes before being stored at-80°C.
All mouse procedures were performed under approval from the Institutional Animal Careand Use Committees of both Rensselaer Polytechnic Institute and the Wadsworth Center(NY State Department of Health), in accordance with The National Institutes of HealthGuide for the Care and Use of Laboratory Animals.
Zebrafish husbandryAB and TL Zebrafish were maintained under a 10 hour dark to 14 hour light cycle at 28.5°Cusing standard laboratory practices (Nüsslein-Volhard and Dahm, 2002). Zebrafish embryoswere obtained by natural mating and were staged by days post-fertilization (dpf) andaccording to standard morphological criteria (Kimmel et al., 1995). Embryos were raised at28.5°C until sacrificed and fixed at the desired stage. 1-phenyl-2-thiourea (0.003%) wasused to suppress pigmentation of embryos older than 24 hours post-fertilization (hpf). Allfish procedures were performed under approval from the Institutional Animal Care and UseCommittee of Rensselaer Polytechnic Institute.
Western blottingTissue was obtained for Western blotting from additional mice at the ages describedpreviously. Mice were administered an overdose of either sodium pentobarbital or avertin,and their brains and peripheral organs were harvested and immediately frozen in liquidnitrogen. For some animals, brains were dissected into sub-regions (cerebral cortex,hippocampus, striatum, thalamus, hypothalamus, brainstem, and cerebellum) and frozen inliquid nitrogen. All samples were stored at -80°C until processed into lysates.
Whole mouse brain (or sub-regions) or peripheral tissues were homogenized in RIPA buffer(50 mM Tris (pH 8), 150 mM NaCl, 1% NP-40, 0.5% Na-deoxycholate, 0.1% SDS, 1 mMDTT, 1 mM phenylmethylsulfonyl fluoride and 1X protease inhibitor cocktail (RocheApplied Science, Indianapolis, IN)) with a plastic mortar and pestle. Homogenized lysateswere incubated on ice for 30 minutes and centrifuged at 10,000 x g for 30 minutes to obtainthe supernatant. The protein concentration was determined for each supernatant sampleusing the Advanced Protein Assay reagent (Cytoskeleton Inc., Denver, CO) according to themanufacturer’s protocol. Protein lysates (5 μg of protein), isolated from brains of variouslyaged mice, from various regions of mouse brain, or from various peripheral organs, wereresolved by SDS/8% PAGE gel electrophoresis and electroblotted onto PVDF transfermembrane. The membrane was blocked with 3% non-fat dried milk in TBS-TX (100 mMTris (pH 7.4), 150 mM NaCl, 0.01% Triton X-100) for 1 hour at room temperature and thenprobed with the various mouse Ahi1 antibodies (at 1:1000 to 1:4000 dilution in blockingsolution) and with anti-βIII tubulin antibodies (chicken IgY; 1:4000; Chemicon, Temecula,CA) as a loading control, at room temperature overnight.
For human brain tissue Western blotting, a custom human normal brain tissue blot wasobtained (ProSci, Poway, CA) containing the following tissues: adult human amygdala,cerebellar peduncles, cerebellar hemispheres, cerebellar vermis, cerebral cortex, and medullaoblongata; and fetal human cerebellum and brainstem. Briefly, 15 μg of each protein lysate
Doering et al. Page 6
J Comp Neurol. Author manuscript; available in PMC 2009 November 10.
NIH
-PA Author Manuscript
NIH
-PA Author Manuscript
NIH
-PA Author Manuscript

were separated on a 4-20% gradient SDS-PAGE gel and transferred onto nitrocellulosemembranes. The membrane was blocked with 3% non-fat dried milk in TBS-TX for 1 hourat room temperature and then probed with our human AHI1 antibody (Ab-813; 1:100) andwith anti-βIII tubulin antibodies (chicken IgY; 1:10000; Chemicon) as a loading control, atroom temperature overnight.
Primary antibodies were detected with the SuperSignal West Femto Maximum SensitivitySubstrate Chemiluminescence Kit (Pierce, Rockford, IL). The signal was analyzed with aTyphoon Trio+ scanner and ImageQuant analysis software (GE Healthcare).
ImmunostainingAll tissue sections were allowed to dry at room temperature before being permeabilized for10 minutes in 0.04% Triton X-100 in PBS (pH 7.4; PBS-TX). Endogenous peroxidases wereremoved via incubation in 0.03% hydrogen peroxide/methanol for 30 minutes. Thishydrogen peroxide step was excluded if antibody detection was accomplished throughfluorescently tagged antibodies. Sections were then washed in PBS-TX and blocked for 1hour in 10% normal goat serum (NGS), followed by an overnight incubation with theprimary antibody. For the majority of the immunohistochemistry, we utilized the mouseAhi1 antibody designated Ab-06 (as described above) at a concentration of 1:1000 in 1%NGS/PBS-TX. However, the other Ahi1 antibodies, Ab-05 and Ab-84/85, gave similarresults. Tissue sections were again washed in PBS-TX, followed by primary antibodydetection using the Vector Elite ABC kit and a 3,3′-diaminobenzidine (DAB) kit (VectorLabs, Burlingame, CA) according to the manufacturer’s instructions. The slides wereallowed to dry overnight before a coverslip was applied with Cytoseal-60 (Richard-AllanScientific, Kalamazoo, MI); slides were visualized with a Zeiss AxioImager-Z1 microscopeand imaged with an AxioCam MRc camera with AxioVision Rel. 4.5 software and MosaiX(Carl Zeiss Microimaging). All images were processed using Adobe Photoshop CS2(version 9.0.2; Adobe Systems Inc., San Jose, CA). Contrast and brightness of images wereadjusted through linear level adjustments, as needed, to optimize the clarity of the imagespresented.
For fluorescence immunohistochemistry, we used the following antibodies: NeuN(immunogen: purified cell nuclei from mouse brain; clone: A60, mouse IgG; Cat. #MAB377; Lot # 060109159; Chemicon, Temecula, CA); this antibody recognizes theneuron-specific protein NeuN present in most neurons of the vertebrate CNS (Bulloch et al.,2008) and shows immunoreactivity in morphologically distinct neurons in culture (data notshown) and in brain tissue (Ferland et al., 2003); glial fibrillary acidic protein (GFAP)(immunogen: purified bovine GFAP; chicken IgY; Cat. # AB5541; Lot # 0605030036;Chemicon); this antibody recognizes GFAP in most astrocytes of the vertebrate CNS, reactswith both native and recombinant protein, and it shows immunoreactivity inmorphologically distinct glia in culture (data not shown; see manufacturer’s technical datasheet); LR11 (immunogen: human LR11 a.a. 1220-1337; clone: 48, mouse IgG; Cat. #611860; Lot # 74851; BD Transduction Laboratories, San Jose, CA); this antibodyrecognizes the lipoprotein receptor homologue that is expressed at high levels in the brain(Posse De Chaves et al., 2000) and it recognizes a 250 kDa band corresponding to thepredicted mass of LR11. Increased dilutions of the primary antibody result in decreasingimmunoreactivity (see manufacturer’s technical data sheet). LR11 antibodies also detectmorphologically distinct organelles known as stigmoid bodies (Gutekunst et al., 2003),therefore making LR11 an ideal marker for the stigmoid body; dynein (immunogen: bovinebrain cytoplasmic dynein (the antigenic site has been localized to the first 60 a.a. of the N-terminus of dynein); clone: 74.1, mouse IgG; Cat. # MAB1618; Lot # 0512018659;Chemicon); this antibody recognizes the 74 kDa intermediate chain subunit of cytoplasmicdynein (see manufacturer’s technical data sheet). Dynein antibodies demonstrate
Doering et al. Page 7
J Comp Neurol. Author manuscript; available in PMC 2009 November 10.
NIH
-PA Author Manuscript
NIH
-PA Author Manuscript
NIH
-PA Author Manuscript

immunoreactivity to neuronal growth cones (Grabham et al., 2007). The final workingconcentrations for the primary antibodies were as follows: Ahi1 (1:1000), NeuN (1:1000),GFAP (1:200), LR11 (1:1000), and dynein (1:100). Omission of all primary antibodies, usedin the present studies, resulted in the absence of any immunoreactivity (data not shown).
Tissue sections or cells on slides were washed extensively in 0.1M PBS (pH 7.4). Then, theywere washed in PBS-TX followed by blocking in 10% NGS made in PBS-TX, for at least 1hour. Primary antibodies were diluted to their final working concentrations in PBS-TXcontaining 1% NGS. The slides were incubated overnight at 4°C. The following day, allslides were washed in PBS-TX and then were incubated for at least 2 hours with theappropriate fluorophore-labeled secondary antibodies: Alexa Fluor 488 goat anti-mouseIgG, Alexa Fluor 546 goat anti-rabbit IgG, and Alexa Fluor 488 goat anti-chicken IgY (allfrom Invitrogen (Molecular Probes), Carlsbad, CA). Each fluorophore-labeled secondaryantibody was diluted 1:500 in PBS-TX containing 1% NGS. Following the 2 hourincubation with the fluorophore-labeled secondary antibodies, all sections were rinsed inPBS and mounted on slides, and a coverslip was applied with Fluoromount-G (SouthernBiotechnology, Birmingham, AL). All images were visualized with a Zeiss AxioImager-Z1microscope and imaged with an AxioCam MRm camera and AxioVision Rel. 4.5 software.All images were processed using Adobe Photoshop CS2. Contrast and brightness of imageswere adjusted through linear level adjustments, as needed, to optimize the intensity range ofthe images.
In situ hybridization probes for zebrafish ahi1Total RNA was isolated from zebrafish embryos at various stages using TRIzol reagentaccording to the manufacturer’s instructions. PCR and genomic analysis indicated that ahi1is a single gene in zebrafish. Gene-specific PCR primers were designed according toEnsembl (Ensembl release 47, Assembly Zv7) for the zebrafish ahi1 transcript (Ensembl ID:ENSDARG00000044056). Zebrafish ahi1 cDNA was obtained by reverse transcription, 3′-RACE, and 5′-RACE, following manufacturer’s instructions (GeneRace Kit, Invitrogen,Carlsbad, CA). PCR reactions were carried out using primers with T3/T7 polymerasebinding sites, and with zebrafish ahi1 cDNA as template. Digoxigenin-11-uridine-5′-triphosphate (DIG)/NTP mix (10 mM ATP, 10 mM GTP, 10 mM CTP, 6.5 mM UTP, 3.5mM DIG-11-UTP in Tris-neutralized solution, pH 7.5)(Roche, Indianapolis, IN) was usedinstead of dNTP. PCR products with the correct sizes were transcribed with T3/T7polymerase following the manufacturer’s instructions (MEGAscript T3 Kit, MEGAscript T7Kit, Roche). Primer pairs used to generate the five riboprobes used in this study are availableupon request. The probes were, in order from the 5′- to the 3′-end of the zebrafish cDNA:probe 1: nt 15-468; probe 2: nt 15-589; probe 3: nt 15-661; probe 4: nt 389-661; probe 5: nt15-389. Staining patterns for the individual probes were indistinguishable.
Whole-mount in situ hybridizationZebrafish embryos from 48 hpf to 5 dpf were sacrificed and fixed overnight in 4% PFA/PBT(0.1% Tween-20 in PBS) at 4°C, and were then transferred to methanol for at least 16 hoursat -20°C. Embryos were washed in 75%-, 50%-, 25%-methanol/PBT gradients, followed bywashes in PBT. Embryos at 2 dpf, 3 dpf, 4 dpf, 5 dpf were treated with 10 μg/ml proteinaseK for 20 , 22 , 24 , 26 minutes, respectively, followed by a 30 minute incubation in 4% PFA/PBT and washes in PBT at room temperature. Embryos were prehybridized in HYB buffer(50% formamide, 5X SSC, 500 μg/ml torula RNA, 50 μg/ml heparin, 0.1% Tween-20, 9mM citric acid at pH 6.0-6.5) for 2 hours at 68°C and then hybridized with ∼150 ng of probein HYB buffer overnight at 68°C.
Doering et al. Page 8
J Comp Neurol. Author manuscript; available in PMC 2009 November 10.
NIH
-PA Author Manuscript
NIH
-PA Author Manuscript
NIH
-PA Author Manuscript

On the next day, embryos were washed sequentially with 75% HYB/2X SSC, 50% HYB/2XSSC, 25% HYB/2X SSC, 2X SSC, 10 minutes for each step, followed by two 30 minutewashes with 0.2X SSC at 68°C. Embryos were then equilibrated to room temperature andwashed sequentially with 75% 0.2X SSC/PBT, 50% 0.2X SSC/PBT, 25% 0.2X SSC/PBT,and then PBT, 5 minutes for each wash. Embryos were incubated in 0.1 M glycine (pH 2.2)+ 0.1% Tween-20 at room temperature, to remove endogenous alkaline phosphatases; thiswas followed by washes in PBT. Blocking was performed in PBT with 2 mg/ml BSA and5% normal calf serum for 2 hours at room temperature. After blocking, embryos wereincubated in PBT/BSA with anti-DIG antibody (Anti-digoxigenin, Fab fragments; Roche) at1:2000 overnight at 4°C.
Embryos were washed in PBT/BSA and then further washed in NTMT buffer (0.1 M Tris-Cl(pH 9.5), 0.1 M NaCl, 0.05 M MgCl2, 0.1% Tween-20) at room temperature. Staining wasthen carried out in the dark at room temperature with 225 μg/ml NBT (4-Nitro bluetetrazolium chloride; Roche) and 175 μg/ml BCIP (5-bromo-4-chloro-3-indolyl-phosphate;Roche) in NTMT, until staining became visible. Embryos were imaged on a ZeissAxioImager-Z1 microscope with a Zeiss AxioCam MRc camera. Figures were preparedusing AxioVision 4.5 software and Adobe Illustrator; image manipulations were limited tolinear level adjustments, rotations and scaling.
Electron microscopyThe hypothalamus was dissected from E18.5 mouse brains and then fixed in either of twoelectron microscopy-compatible fixatives. The hypothalamus was processed either forimmuno-electron microscopy or for preservation of fine structure.
For immuno-electron microscopy, the tissue was fixed with cold 4% PFA/0.1%glutaraldehyde in PBS (pH 7.4) for 2 hours, washed twice in water, dehydrated in a gradedethanol series, and embedded in LR White. Semi-thin (0.08-0.20 μm) sections were cutusing a Diatome diamond knife on a Reichert Ultracut E ultramicrotome and were placed oncarbon-coated, Formvar-coated hexagonal nickel grids. The sections were blocked for 2hours in a blocking solution containing 40 μg/ml goat sera, 20 μg/ml BSA in TBS buffer(containing 1 μg/ml BSA, 0.05% Tween-20, 0.5 M NaCl, 20 mM NaN3, pH 7.4), exposed tothe anti-Ahi1 rabbit polyclonal antibody (Ab-05) in TBS buffer (4.0 μg/ml, pH 7.4).Following an overnight incubation in the Ahi1 antibody, the sections were washed fourtimes in TBS, and then labeled with a 1:100 dilution of 10-nm gold particles conjugated togoat anti-rabbit IgG antibodies (Ted Pella Inc., Redding, CA) in TBS buffer with 10 μg/mlgoat sera for 2 hours. Sections then were washed five times in TBS, and the antibodies werecovalently linked with 1% glutaraldehyde in water. The samples were stained with uranylacetate for 15 minutes, followed by three water washes. Substitution of rabbit IgG for theprimary antibody provided a negative control. Sections were analyzed at 80 kV with a Zeiss910 transmission electron microscope (Carl Zeiss, Oberkochen, Germany).
For fine structure studies, the tissue was fixed in cold 6.5% glutaraldehyde in PBS (pH 7.4)for 2 hours, washed two times, 10 minutes per wash in PBS, and rinsed in 0.1 M sodiumcacodylate buffer (pH 7.4) twice, 10 minutes per rinse. Samples were post-fixed in 1%osmium tetraoxide in cacodylate buffer for 1 hour, washed in water overnight, dehydrated ina graded acetone series, and embedded in Epon 812/Araldite. Semi-thin (0.08-0.20 μm)sections were stained with uranyl acetate and Reynold’s lead. Sections were viewed on aZeiss 910 transmission electron microscope at 80 kV.
Doering et al. Page 9
J Comp Neurol. Author manuscript; available in PMC 2009 November 10.
NIH
-PA Author Manuscript
NIH
-PA Author Manuscript
NIH
-PA Author Manuscript

ResultsExpression of Ahi1 in various mouse organs
Following confirmation of the specificity of our Ahi1 antibodies (Fig. 1), we performedWestern blot analysis of organs in the mouse and revealed widespread Ahi1 expression in anumber of organ systems (Fig. 2A). Ahi1 expression was highest in the brain and testes.Expression occurred in the pituitary (also see Fig. 3F) and at lower levels in the thymus,lung, and kidney (Fig. 2A). Ahi1 was expressed in the pancreas at levels so low, it couldonly be detected by Ahi1 immunoprecipitation (data not shown). No obvious expression wasfound in heart, liver, spleen, and thyroid.
Temporal expression of Ahi1 in the mouse brainWestern blot analysis of Ahi1 in whole organs clearly demonstrated high levels of Ahi1 inthe brain. Therefore, we further examined the patterns of spatial and temporal expression ofAhi1 in the mouse brain. Western blot analysis of whole mouse brain indicated that Ahi1was expressed at all ages examined (E10.5-adult). At E10.5, there was relatively weakexpression of Ahi1; expression gradually increased until birth (Fig. 2B,C). From P0.5 toP3.5, Ahi1 expression was maximal, but then from P3.5 to adult, decreased to levelscomparable to the level seen in embryogenesis (Fig. 2B,C). These results suggest that Ahi1levels are regulated during brain development, but the continued expression in the maturebrain may indicate an additional role of Ahi1 beyond that in brain development.
Spatial expression of Ahi1 in the mouse brainAnalysis of Ahi1 immunolocalization in the mouse brain indicated that the Ahi1 protein hada very restricted expression pattern, principally in the ventral regions of the developing andmature forebrain, midbrain, and hindbrain (Figs. 3&4). Ahi1 expression was found in thecytoplasm of neurons and in neuronal processes.
The olfactory bulb showed little Ahi1 immunoreactivity, except in the accessory olfactorybulb (Figs. 3F&4A,D,F,H,J). Accessory olfactory bulb immunoreactivity initially appearedin a single group of cells early in development. This expression gradually expanded, aroundP10.5, to two parallel groups of cells, the mitral and granular layers of the accessoryolfactory bulb, a pattern that continued through adulthood.
Cerebral cortical expression of Ahi1 was almost completely absent, at each developmentalage examined (Figs. 3&4). The exceptions were the medial entorhinal cortex, perirhinalcortex, and piriform cortex, all of which showed low levels of Ahi1 immunoreactivity. Theventrocaudal region of the cortex also had very low levels of Ahi1 immunoreactivity,beginning around E16.5.
The hippocampus had a restricted pattern of Ahi1 immunoreactivity, with expression ofAhi1 occurring specifically in the dentate gyrus (Figs. 3&4). Ahi1 expression in the dentategyrus was higher in the ventral hippocampus than in the dorsal hippocampus. During earlydevelopmental ages, dorsal hippocampal expression of Ahi1 was entirely absent (data notshown). Expression of Ahi1 in the ventral hippocampal dentate gyrus became evidentaround E14.5 and continued to increase into adulthood (Fig. 4E,G,I). The distributionbecame more comparable between dorsal and ventral hippocampus, by P21.5, but it wasskewed toward the ventral hippocampus at all time points (Fig. 4I,J). The CA fields showedlow levels of Ahi1 immunoreactivity, but only in the ventral hippocampus. Moderate Ahi1expression was observed in the fimbria and subiculum (Fig. 4I).
Doering et al. Page 10
J Comp Neurol. Author manuscript; available in PMC 2009 November 10.
NIH
-PA Author Manuscript
NIH
-PA Author Manuscript
NIH
-PA Author Manuscript
The amygdala and hypothalamus were the two brain structures with the highest levels ofAhi1 immunoreactivity (Figs. 3&4). In both amygdala and hypothalamus, Ahi1 expressionwas observed as early as E10.5; expression rose to its highest levels in the period from P0.5to P7.5. Significant reductions at P10.5 were noted in both amygdala and hypothalamus(data not shown). However, whereas levels of Ahi1 immunoreactivity in the hypothalamusremained steady into adulthood, levels of Ahi1 expression in the amygdala tapered off atP14.5 and remained constant into adulthood (data not shown). The hypothalamus had high,fairly uniform Ahi1 immunoreactivity in the majority of sub-nuclei (see Table 1) with thehighest levels of Ahi1 immunoreactivity in the ventromedial, dorsomedial, arcuatehypothalamic nuclei, dorsal nucleus, and the septohypothalamic nucleus. In the amygdala,Ahi1 was most preferentially observed in the central nucleus of the amygdala, the medialamygdaloid nucleus, the amygdalostriatal transition area, and the intercalated nuclei (seeTable 1 for other regions of Ahi1 expression in amygdala).
Other areas of the forebrain had varying levels of Ahi1 immunoreactivity (Figs. 3&4; Table1). Thalamic expression of Ahi1 was observed mainly around the exterior borders of thethalamus, including the lateral and medial geniculate nuclei (Fig. 3&4; Table 1). Thesupraoptic nucleus had very high levels of Ahi1 immunoreactivity, while only moderateexpression was noted in the median preoptic nucleus. The septal nucleus also demonstratedhigh Ahi1 immunoreactivity, particularly in the lateral nucleus. Moderate immunoreactivitywas observed in the ventral pallidum, but low Ahi1 levels were seen in the caudate-putamen.The stria terminalis had moderate Ahi1 immunoreactivity, but the bed nucleus of the striaterminalis showed significantly higher levels. The premammillary nucleus had relativelyhigh levels, particularly in ventral regions, but the remaining areas of the mammillary nucleiwere devoid of immunoreactivity. Lastly, the medial forebrain bundle and the nucleusaccumbens (core and shell) both had low levels of Ahi1, similar to the levels observed in thesubstantia innominata and the lateral habenural nucleus.
Ahi1 immunoreactivity was seen in numerous areas of the midbrain, including the tectumand a number of tegmental nuclei (Figs. 3&4; Table 2). High expression of Ahi1 was foundin the inferior colliculus, particularly in the exterior and dorsal cortex of this structure. Thecentral nucleus almost completely lacked expression. Ahi1 immunoreactivity tended to behigher in the ventral aspects of the inferior colliculus than in the dorsal inferior colliculus.Ahi1 levels in the superior colliculus varied depending on the layer and the age of themouse. The superficial gray layer had its highest Ahi1 levels at E14.5 and at P14.5, whileAhi1 immunoreactivity in the intermediate white layer was highest at E18.5 (Figs. 3&4).The optic nerve layer of the superior colliculus had one of the highest levels of Ahi1immunoreactivity of any region in the adult brain, although the deep gray layer, theintermediate gray layer, and the superficial gray layer all showed only moderate levels ofAhi1. High Ahi1 immunoreactivity was also observed in the caudal central gray and centralgray pons. The intercollicular nucleus as well as a number of tegmental nuclei had moderatelevels of Ahi1 expression. Other areas of the midbrain that had low levels of Ahi1immunoreactivity included the rhabdoid nucleus and the median raphe nucleus. Lastly, thedeep mesencephalic nucleus, the retrorubral field, and the locus coeruleus all had relativelylow levels of Ahi1 immunoreactivity.
Surprisingly, the majority of the developing and mature cerebellum, including the cerebellarvermis, was devoid of Ahi1 immunoreactivity; however, Ahi1 expression was seen in thedeep cerebellar nuclei, particularly the dentate nucleus (Figs. 3, 4, and 5A; Table 2). As awhole, the developing brainstem showed a more widespread expression of Ahi1 that becamerestricted by adulthood (Figs. 3&4). The decrease in Ahi1 immunoreactivity becameobvious at P14.5; from this age onward Ahi1 levels lessened.
Doering et al. Page 11
J Comp Neurol. Author manuscript; available in PMC 2009 November 10.
NIH
-PA Author Manuscript
NIH
-PA Author Manuscript
NIH
-PA Author Manuscript

Ahi1 immunoreactivity in the spinal trigeminal nucleus was restricted to the outer margins,forming a distinct band around the nucleus and leaving the center virtually devoid ofimmunoreactivity (Fig. 5D). The reticular nucleus, including the ventrolateral reticularnucleus and the gigantocellular reticular nucleus, had moderate Ahi1 immunoreactivity (Fig.5B,C). The solitary nucleus had moderate levels of Ahi1 immunoreactivity (Fig. 5C); theselevels were consistent throughout development and into adulthood. Ahi1 immunoreactivitywas also noted in the inferior olives (Fig. 5B). Moderate Ahi1 expression was also observedin the interior lateral parabrachial nucleus and the external cuneate nucleus. Low Ahi1immunoreactivity was found in the lateral lemniscus nuclei and the dorsomedial spinal 5nucleus.
Among the cranial nerve nuclei, the motor trigeminal nucleus, the facial nucleus, and thehypoglossal nucleus all displayed moderate Ahi1 levels beginning around P3.5, butimmunoreactivity had disappeared by adulthood. The motor trigeminal and facial nuclei hadtheir highest Ahi1 expression around P7.5, while the expression in the hypoglossal nucleuspeaked around P10.5.
AHI1 expression in the developing and mature human brainThe lack of Ahi1 expression that we found in the cerebellum of the mouse was striking,given that the cerebellum is one of the neuroanatomical structures malformed in humanswith JBTS. As mentioned previously, the gene and protein structures of human AHI1 aredistinct from those for rodent Ahi1, particularly with respect to the N-terminus of the geneproduct, a region containing a putative coiled-coil domain. Therefore, we determined theexpression profile of AHI1 in the developing and mature human brain. AHI1 was expressedin human fetal cerebellum and brainstem (Fig. 6). Similarly, AHI1 expression was observedin the adult cerebellar hemispheres, cerebellar peduncles, cerebellar vermis, and medulla.The adult cerebral cortex and amygdala also had AHI1 expression (Fig. 6). The highestexpression of AHI1 in adult tissue (normalized to β-tubulin levels) was in the maturecerebellar vermis and cerebellar peduncles, followed by cerebellum and cerebral cortex(data not shown). Amygdala and medulla had modest levels of AHI1 in our analysis.
ahi1 mRNA in situ hybridization in the developing zebrafishAHI1 orthologs are found in all vertebrates. Previous work demonstrates that zebrafish ahi1is expressed in adult zebrafish gonads, specifically in the primary spermatocytes and oocytes(Zhou and Song, 2006). To determine whether expression in the cerebellum is primate-specific, we examined the pattern of ahi1 mRNA distribution in the zebrafish. Whole-mountin situ hybridization for ahi1 mRNA in late embryo and larval-stage zebrafish (2.5 dpf, 3dpf, 3.2 dpf, 4.3 dpf, 4.5 dpf, and 5.2 dpf) demonstrated expression throughout the brain andretina, but expression was absent in the spinal cord (Fig. 7A-G). All antisense probes gavethe same expression pattern. In brain, ahi1 expression was detected in the olfactory bulb,telencephalon, diencephalon, tectum, and cerebellum, while no staining was seen in theanterior or postoptic commissure (Fig. 7A,B,D,E,G). In the retina, ahi1 expression wasobserved in the ganglion cell layer and the inner nuclear layer, but not in the inner plexiformlayer (Fig. 7C). Expression of ahi1 was also seen in the posterior brachial arches, thegastrointestinal tract, and the inner ear (Fig. 7A,D,F). Staining of the brachial archesoccurred in cells surrounding the cartilage cells, but apparently not in the cells of thecartilage itself, suggesting that these ahi1-expressing cells are derived from the neural crest(Fig. 7D,F).
Cellular localization of Ahi1: Neuronal cell bodies and processesTo assess the cellular localization of mouse Ahi1, we performed immunocytochemicalstaining in neuronal cultures and murine brain tissue sections. Ahi1 was localized in primary
Doering et al. Page 12
J Comp Neurol. Author manuscript; available in PMC 2009 November 10.
NIH
-PA Author Manuscript
NIH
-PA Author Manuscript
NIH
-PA Author Manuscript

hypothalamic neuronal cultures (E17.5) principally in the cytoplasm and the processes ofneurons (as determined by morphology and use of the nuclear neuronal marker, NeuN [datanot shown]), with little nuclear expression (Fig. 8A). Ahi1 expression in the mouse brainwas limited to post-mitotic, differentiated neurons, as indicated by the labeling of Ahi1 andNeuN in the same cells (Fig. 8B). To determine whether Ahi1 is associated with glial cells,we labeled mouse brain sections with the glial marker, GFAP. No match in labeling patternswas observed between Ahi1 and GFAP (data not shown) indicating that Ahi1 was notpresent in glial cells. Ahi1 was also consistently found in axons with concentratedimmunoreactivity in the axonal growth cone and in co-localization with a growth conemarker, dynein (Fig. 8C)(Grabham et al., 2007).
Subcellular localization of Ahi1: Stigmoid bodiesTo determine the subcellular distribution of Ahi1 within neurons, we carried out Ahi1immunostaining and electron microscopy. Our initial staining for Ahi1 consistently showedhigh expression levels of Ahi1 in distinct spherical punctate foci in the cytoplasm ofneurons, usually in close proximity to the nucleus, in many brain regions (Figs. 8A and9A,B). These foci were typically on the order of 1-3 μm in diameter. We eliminated thepossibility that these foci represent centrosomes or basal bodies, on the basis that they werenever found to contain centrosomal or basal body markers such as pericentrin and γ-tubulin(data not shown). Immuno-electron microscopy was conducted to identify any structureswithin the cell that were associated with these foci. Immunolabeling of Ahi1 on sectionsthrough the mouse hypothalamus identified a structure (Fig. 9C) that corresponds spatiallyand morphologically to the foci observed with immunohistochemistry and light microscopy(Fig. 9A,B). Since immuno-electron microscopy requires a balance between cellpreservation and antigenicity, we also performed electron microscopy on tissue fixed forultrastructural analysis, in the absence of antibody. The candidate structure, which wasusually found proximal to the nucleus and close to polyribosomes (Fig. 9C,D,D’), was anapparently proteinaceous mass consisting in part of the Ahi1 protein (Fig. 9C). Thisstructure seemed to correspond to previously reported non-membrane bound cytoplasmicorganelles called stigmoid bodies, also known as nematosomes, nucleolus-like bodies, ornucleolus-like inclusions (Gutekunst et al., 1998;Li et al., 1998;Shinoda et al., 1992). One ofthe proteins that has been reported to uniquely localize to the stigmoid body was LR11, alipoprotein receptor homologue that contains 11 low-density lipoprotein receptor repeats, 5low-density lipoprotein receptor YWTD repeats, a large fibronectin-type III hexarepeatdomain, and a domain similar to a yeast receptor involved in vacuolar protein sorting(Gutekunst et al., 2003). To further confirm the identity of this structure as a stigmoid body,we performed multiple marker immunocytochemistry for both Ahi1 and LR11. Ahi1 andLR11 both co-localized to the same cytoplasmic structure, the stigmoid body, in culturedhypothalamic cells (Fig. 9E), confirming that this structure is a stigmoid body. Moreover,the structural characteristics of this organelle in our electron micrographs (Fig. 9D,D’) wereconsistent with previous descriptions of stigmoid bodies (Gutekunst et al., 1998;Li et al.,1998;Shinoda et al., 1992).
Ahi1 localization to stigmoid bodies in the mouse brainAhi1 is associated with stigmoid bodies in some, but not all, neurons (and in some, but notall, brain regions) (Tables 1&2). Most neurons had only one Ahi1-immunoreactive stigmoidbody, but there were occasional neurons that had 2-3 stigmoid bodies. No obvious temporal(developmental) Ahi1 expression variations were noted for the stigmoid bodies, with theexception that Ahi1-immunoreactive stigmoid bodies were only present in post-mitotic,differentiated neurons. There were a few areas that lacked Ahi1-immunoreactive stigmoidbodies entirely, despite having Ahi1 expression (see Tables 1&2) while a number ofstructures were remarkable in their abundance of Ahi1-immunoreactive stigmoid bodies (see
Doering et al. Page 13
J Comp Neurol. Author manuscript; available in PMC 2009 November 10.
NIH
-PA Author Manuscript
NIH
-PA Author Manuscript
NIH
-PA Author Manuscript
Tables 1&2). There did not appear to be any correlation between the levels of Ahi1immunoreactivity and the presence of stigmoid bodies. Since Ahi1-immunoreactivestigmoid bodies were not observed in every neuron that had Ahi1 expression, we need todetermine whether non-immunoreactive stigmoid bodies are nevertheless present in thesecells, albeit not detected by the present methods.
DiscussionExpression analysis of Ahi1 indicates that the preponderance of the protein is found in thedeveloping and mature ventral forebrain (particularly in the amygdala and hypothalamus),midbrain, and hindbrain. However, cerebellar expression of Ahi1 was absent in the mouse,but expression was present in human (AHI1) and zebrafish (ahi1); this difference in patternsuggests differential regulation of the AHI1 gene orthologs among species. Mouse Ahi1 wasexpressed predominantly in the cytoplasm and processes of neurons, as well as in a novelorganelle called a stigmoid body. Moreover, the distinct expression patterns for Ahi1suggest a role for Ahi1 in the signaling pathways of the ventral forebrain and hindbrain,possibly explaining the association of AHI1 with schizophrenia in humans (Amann-Zalcenstein et al., 2006; Ingason et al., 2007). Our human AHI1 and mouse Ahi1 expressionresults are a first step in deciphering the role of AHI1 in the clinical and neuroanatomicalabnormalities observed in humans with JBTS, while uncovering unexpected areas ofexpression in the brain.
The developmental expression of Ahi1 in regions of the brain affected in individuals withJBTS suggests that AHI1 is critically involved in aspects of the development of these brainstructures. The spatial expression of Ahi1 in brain regions, such as the inferior olives,solitary nuclei, and nucleus of cranial nerve V, structures known to be malformed inindividuals with JBTS (i.e. (Yachnis and Rorke, 1999)), further demonstrates the importanceof Ahi1 for the development of these structures. Mouse Ahi1 and human AHI1 expressionwas also observed in the deep cerebellar nuclei and superior cerebellar peduncles. Deepcerebellar nuclei localization of AHI1 is noteworthy given that individuals with JBTS havethe presence of the molar tooth sign. The molar tooth sign is the hallmark radiographic signfor the diagnosis of JBTS, and is formed by an abnormal configuration of the tracts of thesuperior cerebellar peduncles projecting from the dentate nucleus of the cerebellum (Mariaet al., 1997). The presence of AHI1, in the dentate nuclei of the cerebellum, suggests adevelopmental role for AHI1 in the formation of this hindbrain tract.
Previous mRNA expression analyses for Ahi1 in mouse (Ferland et al., 2004) and ourcurrent Ahi1 protein expression data demonstrated consistent temporal and spatialexpression patterns. The two regions that did not share this pattern were regions of thecerebral cortex (not including the entorhinal, perirhinal, and piriform cortices) and thecerebellum. Whereas Ahi1 mRNA expression was observed in the mouse cerebral cortex andcerebellum, albeit at a weak level, Ahi1 protein was absent in these structures. There arethree possible explanations for these discrepancies. First, the lack of an immunoreactivesignal in the cerebral cortex and cerebellum could be the result of failure to detect very lowlevels of the protein. Second, the failure to detect protein in these regions may result from anabsence of the expression of the particular Ahi1 epitope(s) found in the cerebral cortex andcerebellum, despite the presence of Ahi1 protein isoforms in these areas. Finally, thedifferences between Ahi1 mRNA and Ahi1 protein may reflect the inherent backgroundsignals that can be observed with in situ hybridization preparations, especially consideringthat the Ahi1 mRNA expression levels were very weak in mouse cerebral cortex anddeveloping cerebellum (no Ahi1 mRNA was observed in more mature mouse cerebellum)(Ferland et al., 2004). Overall, we favor the third explanation since we have used multipleantibodies raised in different animals with 2 unique peptide antigens directed at alternative
Doering et al. Page 14
J Comp Neurol. Author manuscript; available in PMC 2009 November 10.
NIH
-PA Author Manuscript
NIH
-PA Author Manuscript
NIH
-PA Author Manuscript

regions of Ahi1. Antibodies against these 2 peptides gave consistent expression profiles inmouse brain suggesting that failure to observe Ahi1 protein with these antibodies is unlikelydue to the absence of both epitopes. These antibodies all have been tested usingimmunohistochemistry and Western blot analysis, and we have observed no Ahi1 protein incortical or cerebellar tissue. Although we cannot completely rule out cerebral cortical(except for the areas mentioned previously) or cerebellar expression in mouse at the presenttime, we do not believe full-length Ahi1 protein to be expressed in these tissues.
Although our studies did not reveal any significant mouse Ahi1 immunoreactivity in themouse cerebral cortex, except for low immunoreactivity in the entorhinal, perirhinal, andpiriform cortices, human AHI1 expression was observed in human cerebral cortical proteinlysates, by Western blotting. This suggests that AHI1 is expressed in the cerebral cortex ofthe developing and adult human brain. Unfortunately, our human AHI1 antibodies did notrecognize AHI1 in fixed human brain sections, barring us from examining the spatialexpression pattern of AHI1 in human brain tissue.
Individuals with JBTS and AHI1 mutations have agenesis of the cerebellar vermis,suggesting an involvement of AHI1 in cerebellar vermis development (Dixon-Salazar et al.,2004; Ferland et al., 2004). Surprisingly, mouse Ahi1 protein was not found to localize tothe developing cerebellar hemispheres or vermis in mouse, but it was observed in thedeveloping and mature human and zebrafish cerebellum. These results suggest significantspecies differences in AHI1 ortholog expression in the cerebellum. The differences in AHI1ortholog expression likely result from divergence in the genomic structure of AHI1 betweenhuman/zebrafish and mouse, since the mouse Ahi1 gene is lacking part of the 5′-end of theAhi1 gene sequence (which in part encodes a putative coiled-coil domain) (Ferland et al.,2004; Jiang et al., 2002). One possible explanation for the lack of Ahi1 expression in themouse cerebellum is that the coiled-coil domain of human/zebrafish AHI1, or more likelythe intronic regions adjacent to the region coding for the coiled-coil domain, containsregulatory elements responsible for human/zebrafish AHI1 expression in the developing andmature cerebellum. This could explain the lack of mouse Ahi1 immunoreactivity in themouse cerebellum, but presence of it in the human and zebrafish cerebellum. A secondexplanation could be differences in the promoter region of AHI1 among human, zebrafish,and mouse that possibly resulted when mouse lost the 5′-end of the Ahi1 gene. This loss of a5′-promoter region in mouse Ahi1, but not in human AHI1 or zebrafish ahi1 could haveresulted in differential regulation of AHI1 expression among these species. Future studiesare necessary to determine the exact causes of the species differences in expression of AHI1in the developing and mature cerebellum.
Given our current understanding of the neuropathological and behavioral abnormalities inJBTS, unexpected regions of Ahi1 expression were identified in the mouse that shouldinitiate further studies addressing whether these areas are also affected in individuals withJBTS and AHI1 mutations. Many brain areas that had high Ahi1 immunoreactivity areregions involved in either the relaying/processing of sensory information or are responsiblefor maintaining homeostasis. Among such regions were the amygdala, stria terminalis,ventral amygdalofugal pathway, and hypothalamus, suggesting a potential role of the AHI1orthologs in the development of these structures. In addition, Ahi1 expression continued inthe adult brain in these regions, suggesting a potential role for Ahi1 in signal transductionevents involved in sensory and homeostatic processing.
The hypothalamus had the highest levels of mouse Ahi1 among all regions of the brain thatwe analyzed. One of the main effectors of hypothalamic function, the pituitary, also hadextensive Ahi1 immunoreactivity. This suggests a potential role of Ahi1 in aspects of thehypothalamic-pituitary-adrenal axis and in hormone release from the pituitary. The
Doering et al. Page 15
J Comp Neurol. Author manuscript; available in PMC 2009 November 10.
NIH
-PA Author Manuscript
NIH
-PA Author Manuscript
NIH
-PA Author Manuscript

hypothalamus is a very complex region of the brain that receives inputs from the brainstem,olfactory bulb, amygdala, septum, and cerebral cortex (Canteras and Swanson, 1992; Clifferet al., 1991; Risold et al., 1997). The majority of these regions showed Ahi1 expression inour mouse experiments. Since the hypothalamus is considered the control center for mostautonomic regulation, Ahi1 may play a role in modulating appetite, feeding, homeostasis,sexual activity, and hormonal regulation, and it may modulate development of thehypothalamus and pituitary. Whether individuals with JBTS have correspondingabnormalities in hypothalamic or pituitary function remains unknown.
In the mouse hippocampus, we observed an interesting developmental and dorsal/ventralexpression pattern of Ahi1, mainly in the granule cells of the dentate gyrus. Early stage Ahi1immunoreactivity was observed at a low level and only in the ventral hippocampus. Asdevelopment continued, hippocampal Ahi1 expression became more pronounced in theventral hippocampus, with still only a low level of Ahi1 immunoreactivity in the dorsalhippocampus. Dorsal/ventral hippocampal differences have been noted in rodents for suchprocesses as adult hippocampal neurogenesis and plasticity (Burnham, 1975; Cameron et al.,1995; Ferland et al., 2002; Gould et al., 1998; Izaki et al., 2003; Maruki et al., 2001; Racineet al., 1977). Moreover, the entorhinal cortex, which projects to the hippocampus, was oneof the few regions of the cerebral cortex that we found having Ahi1 immunoreactivity.Output regions of the hippocampus, such as the subiculum and fimbria, also showed Ahi1immunoreactivity. Our data suggest that Ahi1 is present in many of the structures involvedin the beginning and ending of the classic hippocampal tri-synaptic loop; only thehippocampal CA fields showed relatively little, to no, expression of Ahi1. The significanceof this differential expression pattern for mouse Ahi1 remains to be determined, not only forthe development of the hippocampus and the formation of efferent/afferent pathways, butalso with respect to the functional role of this differential expression in the mature nervoussystem.
Mouse Ahi1 immunoreactivity and human AHI1 expression were observed in thedeveloping and mature brainstem, suggesting the importance of AHI1 in the development ofthis structure. Moreover, absence of expression of AHI1 in the brainstem of individuals withJBTS may account for the brainstem abnormalities associated with JBTS, such as abnormalbreathing and eye movements. The majority of the nuclei in the murine brainstemdemonstrated widespread Ahi1 immunoreactivity until P21.5; then, the expression becamerestricted to areas such as the external cuneate nucleus, the reticular nucleus, the spinaltrigeminal nucleus, and the caudal nucleus. The human counterparts of these nuclei, unlikethe inferior olives, the solitary nuclei, and the nucleus of cranial nerve V, have not beendescribed as being malformed, in individuals with JBTS. Whether individuals with JBTShave deficits in fine touch, in pain or temperature perception, or in regulating headmovement, as would be expected from disruption of such pathways (Rub et al., 2003), hasyet to be determined.
The stigmoid body was originally described in the 1960s (Toro and Rohlich, 1966) and hasbeen reported to contain both RNA and protein, but no evidence of any DNA content(Ockleford et al., 1987). It has been given multiple names over the years, such as anematosome, a nucleolus-like body, and a nucleolus-like inclusion. Stigmoid bodies aretypically found near the nucleus and the perinuclear Golgi apparatus in differentiated, post-mitotic neurons, as well as in the cells of the placenta (Jones and Ockleford, 1985). Notevery neuron in the brain has a stigmoid body that can be recognized by Ahi1immunoreactivity, as evidenced by the results of our expression studies. Why neurons thatshow Ahi1 immunoreactivity do not have Ahi1-positive stigmoid bodies remains unknown.The presence of stigmoid bodies that do not show Ahi1 immunoreactivity (Gutekunst et al.,2003; Li et al., 1998; Muneoka and Takigawa, 2003; Shinoda et al., 1992) suggests that
Doering et al. Page 16
J Comp Neurol. Author manuscript; available in PMC 2009 November 10.
NIH
-PA Author Manuscript
NIH
-PA Author Manuscript
NIH
-PA Author Manuscript

Ahi1 is not a structural component of stigmoid bodies; but instead, it may associate with thestigmoid body, so as to mediate a cell-signaling or post-translational processing function.
Other proteins have been found to label the stigmoid body (HAP1, sortilin, 5-HT7 receptor,and hPAX-P2) (Gutekunst et al., 2003; Li et al., 1998; Muneoka and Takigawa, 2003;Shinoda et al., 1992). Why such diverse proteins are partitioned to the stigmoid body isunknown, but it may be that these proteins participate in similar biological signalingpathways, either directly or indirectly. Various hypotheses concerning the exact function ofthese organelles have suggested a role as: a storage center for RNA, an inactive microtubuleorganizing center, an organelle involved in vesicular trafficking, and either a direct inhibitorof mitosis or a marker of a post-mitotic event (Ockleford et al., 1987). While the role of thestigmoid body remains elusive, the partitioning of Ahi1 to the stigmoid body and theassociation of Hap1 and Ahi1 with vesicular fractions (Gutekunst et al., 1998)(unpublishedobservations), suggest a possible link between these processes.
The association of particular SNPs in AHI1 with schizophrenia (Amann-Zalcenstein et al.,2006; Ingason et al., 2007) suggests either a direct or indirect link of genes involved in thisdisorder with AHI1. However, the observation of human AHI1 (and mouse Ahi1) expressionboth during development and in the mature brain, particularly in regions thought to beimplicated in schizophrenia (cerebral cortex, hippocampus, and the mesolimbic pathway)(Hirayasu, 2007; White et al., 2008), suggests an important role of AHI1 in neuronalfunction. Moreover, structures such as the medial geniculate nucleus, the dorsal cochlearnucleus, and the auditory cortex have been implicated in schizophrenia (Roger and Arnault,1989; Winer, 1985). Unlike the cells of the auditory cortex, which do not appear to expressAhi1, the cells of the inferior colliculus and dorsal cochlear nucleus do express Ahi1. Ahi1immunoreactivity in these subcortical/brainstem structures suggest a potential role of Ahi1in the subcortical processing of auditory information. The effects of Ahi1 in the auditorypathway may have direct relevance to the auditory processing deficits that can occur inindividuals with schizophrenia (Shergill et al., 2000).
Given the relative paucity of neuropathological cases for JBTS that have been published todate (Friede and Boltshauser, 1978; Maria et al., 1999; Quisling et al., 1999; Yachnis andRorke, 1999), our current study entailing localizations in human and zebrafish tissue, inaddition to the mouse experiments, reveals important information on expression changes inthe brain, through development and into adulthood. As a whole, our study demonstratedAhi1 expression in many brain regions that have been observed to be malformed inindividuals with JBTS. We also found expression in other brain regions that are not knownto be malformed in JBTS. It is possible that subtle defects in these brain regions or in thesignaling of cells in these areas, could lead to some of the behavioral impairments observedin the human disorder. These structures require detailed examination, to elucidate whetherthey are also involved in the JBTS phenotype.
AcknowledgmentsThis work was supported by NIMH grant 1K01MH71801 (to RJF). The authors wish to thank Dr. AdrianaVerschoor (Wadsworth Center) for critical reading and input on our manuscript. The electron microscopy portion ofthis work was done at the Wadsworth Center’s Electron Microscopy Core Facility.
Support (grant information): This work was supported by NIMH grant 1K01MH71801 (to RJF).
LITERATURE CITEDAmann-Zalcenstein D, Avidan N, Kanyas K, Ebstein RP, Kohn Y, Hamdan A, Ben-Asher E, Karni O,
Mujaheed M, Segman RH, Maier W, Macciardi F, Beckmann JS, Lancet D, Lerer B. AHI1, a
Doering et al. Page 17
J Comp Neurol. Author manuscript; available in PMC 2009 November 10.
NIH
-PA Author Manuscript
NIH
-PA Author Manuscript
NIH
-PA Author Manuscript

pivotal neurodevelopmental gene, and C6orf217 are associated with susceptibility to schizophrenia.Eur J Hum Genet. 2006; 14(10):1111–1119. [PubMed: 16773125]
Banker, G.; Goslin, K. Rat hippocampal neurons in low-density culture. Goslin, K.; Asmussen, H.;Banker, G., editors. MIT Press; Cambridge: 2002. p. 339-370.
Bulloch K, Miller MM, Gal-Toth J, Milner TA, Gottfried-Blackmore A, Waters EM, Kaunzner UW,Liu K, Lindquist R, Nussenzweig MC, Steinman RM, McEwen BS. CD11c/EYFP transgeneilluminates a discrete network of dendritic cells within the embryonic, neonatal, adult, and injuredmouse brain. J Comp Neurol. 2008; 508(5):687–710. [PubMed: 18386786]
Burnham WM. Primary and “transfer” seizure development in the kindled rat. Can J Neurol Sci. 1975;2(4):417–428. [PubMed: 1201529]
Cameron HA, McEwen BS, Gould E. Regulation of adult neurogenesis by excitatory input and NMDAreceptor activation in the dentate gyrus. J Neurosci. 1995; 15(6):4687–4692. [PubMed: 7790933]
Cantani A, Lucenti P, Ronzani GA, Santoro C. Joubert syndrome. Review of the fifty-three cases sofar published. Ann Genet. 1990; 33(2):96–98. [PubMed: 2241092]
Canteras NS, Swanson LW. Projections of the ventral subiculum to the amygdala, septum, andhypothalamus: a PHAL anterograde tract-tracing study in the rat. J Comp Neurol. 1992; 324(2):180–194. [PubMed: 1430328]
Chance PF, Cavalier L, Satran D, Pellegrino JE, Koenig M, Dobyns WB. Clinical nosologic andgenetic aspects of Joubert and related syndromes. J Child Neurol. 1999; 14(10):660–666. [PubMed:10511339]
Cliffer KD, Burstein R, Giesler GJ Jr. Distributions of spinothalamic, spinohypothalamic, andspinotelencephalic fibers revealed by anterograde transport of PHA-L in rats. J Neurosci. 1991;11(3):852–868. [PubMed: 1705972]
Dixon-Salazar T, Silhavy JL, Marsh SE, Louie CM, Scott LC, Gururaj A, Al-Gazali L, Al-Tawari AA,Kayserili H, Sztriha L, Gleeson JG. Mutations in the AHI1 gene, encoding jouberin, cause Joubertsyndrome with cortical polymicrogyria. Am J Hum Genet. 2004; 75(6):979–987. [PubMed:15467982]
Ferland RJ, Cherry TJ, Preware PO, Morrisey EE, Walsh CA. Characterization of Foxp2 and Foxp1mRNA and protein in the developing and mature brain. J Comp Neurol. 2003; 460(2):266–279.[PubMed: 12687690]
Ferland RJ, Eyaid W, Collura RV, Tully LD, Hill RS, Al-Nouri D, Al-Rumayyan A, Topcu M, GasconG, Bodell A, Shugart YY, Ruvolo M, Walsh CA. Abnormal cerebellar development and axonaldecussation due to mutations in AHI1 in Joubert syndrome. Nat Genet. 2004; 36(9):1008–1013.[PubMed: 15322546]
Ferland RJ, Gross RA, Applegate CD. Differences in hippocampal mitotic activity within the dorsaland ventral hippocampus following flurothyl seizures in mice. Neurosci Lett. 2002; 332(2):131–135. [PubMed: 12384228]
Friede RL, Boltshauser E. Uncommon syndromes of cerebellar vermis aplasia. I: Joubert syndrome.Dev Med Child Neurol. 1978; 20(6):758–763. [PubMed: 729929]
Gleeson JG, Keeler LC, Parisi MA, Marsh SE, Chance PF, Glass IA, Graham JM Jr, Maria BL,Barkovich AJ, Dobyns WB. Molar tooth sign of the midbrainhindbrain junction: occurrence inmultiple distinct syndromes. Am J Med Genet A. 2004; 125(2):125–134. [PubMed: 14981712]
Gould E, Tanapat P, McEwen BS, Flugge G, Fuchs E. Proliferation of granule cell precursors in thedentate gyrus of adult monkeys is diminished by stress. Proc Natl Acad Sci USA. 1998; 95(6):3168–3171. [PubMed: 9501234]
Grabham PW, Seale GE, Bennecib M, Goldberg DJ, Vallee RB. Cytoplasmic dynein and LIS1 arerequired for microtubule advance during growth cone remodeling and fast axonal outgrowth. JNeurosci. 2007; 27(21):5823–5834. [PubMed: 17522326]
Gutekunst CA, Li SH, Yi H, Ferrante RJ, Li XJ, Hersch SM. The cellular and subcellular localizationof huntingtin-associated protein 1 (HAP1): comparison with huntingtin in rat and human. JNeurosci. 1998; 18(19):7674–7686. [PubMed: 9742138]
Gutekunst CA, Torre ER, Sheng Z, Yi H, Coleman SH, Riedel IB, Bujo H. Stigmoid bodies containtype I receptor proteins SorLA/LR11 and sortilin: new perspectives on their function. J HistochemCytochem. 2003; 51(6):841–852. [PubMed: 12754295]
Doering et al. Page 18
J Comp Neurol. Author manuscript; available in PMC 2009 November 10.
NIH
-PA Author Manuscript
NIH
-PA Author Manuscript
NIH
-PA Author Manuscript

Hirayasu Y. Brain imaging in schizophrenia. Neuropathology. 2007; 27(6):601–603. [PubMed:18021383]
Ingason A, Sigmundsson T, Steinberg S, Sigurdsson E, Haraldsson M, Magnusdottir BB, Frigge ML,Kong A, Gulcher J, Thorsteinsdottir U, Stefansson K, Petursson H, Stefansson H. Support forinvolvement of the AHI1 locus in schizophrenia. Eur J Hum Genet. 2007; 15(9):988–991.[PubMed: 17473831]
Izaki Y, Takita M, Nomura M, Akema T. Differences between paired-pulse facilitation and long-termpotentiation in the dorsal and ventral hippocampal CA1-prefrontal pathways of rats. Brain Res.2003; 992(1):142–145. [PubMed: 14604783]
Jiang X, Hanna Z, Kaouass M, Girard L, Jolicoeur P. Ahi-1, a novel gene encoding a modular proteinwith WD40-repeat and SH3 domains, is targeted by the Ahi-1 and Mis-2 provirus integrations. JVirol. 2002; 76(18):9046–9059. [PubMed: 12186888]
Jones CJ, Ockleford CD. Nematosomes in the human placenta. Placenta. 1985; 6(4):355–361.[PubMed: 2414769]
Joubert M, Eisenring JJ, Andermann F. Familial dysgenesis of the vermis: a syndrome ofhyperventilation, abnormal eye movements and retardation. Neurology. 1968; 18(3):302–303.[PubMed: 5690407]
Joubert M, Eisenring JJ, Robb JP, Andermann F. Familial agenesis of the cerebellar vermis. Asyndrome of episodic hyperpnea, abnormal eye movements, ataxia, and retardation. Neurology.1969; 19(9):813–825. [PubMed: 5816874]
Kendall B, Kingsley D, Lambert SR, Taylor D, Finn P. Joubert syndrome: a clinico-radiological study.Neuroradiology. 1990; 31(6):502–506. [PubMed: 2352633]
Kimmel CB, Ballard WW, Kimmel SR, Ullmann B, Schilling TF. Stages of embryonic developmentof the zebrafish. Dev Dyn. 1995; 203(3):253–310. [PubMed: 8589427]
Lagier-Tourenne C, Boltshauser E, Breivik N, Gribaa M, Betard C, Barbot C, Koenig M.Homozygosity mapping of a third Joubert syndrome locus to 6q23. J Med Genet. 2004; 41(4):273–277. [PubMed: 15060101]
Li SH, Gutekunst CA, Hersch SM, Li XJ. Association of HAP1 isoforms with a unique cytoplasmicstructure. J Neurochem. 1998; 71(5):2178–2185. [PubMed: 9798945]
Liao M, Shen J, Zhang Y, Li SH, Li XJ, Li H. Immunohistochemical localization of huntingtin-associated protein 1 in endocrine system of the rat. J Histochem Cytochem. 2005; 53(12):1517–1524. [PubMed: 16087704]
Maria BL, Hoang KB, Tusa RJ, Mancuso AA, Hamed LM, Quisling RG, Hove MT, Fennell EB,Booth-Jones M, Ringdahl DM, Yachnis AT, Creel G, Frerking B. “Joubert syndrome” revisited:key ocular motor signs with magnetic resonance imaging correlation. J Child Neurol. 1997; 12(7):423–430. [PubMed: 9373798]
Maria BL, Quisling RG, Rosainz LC, Yachnis AT, Gitten J, Dede D, Fennell E. Molar tooth sign inJoubert syndrome: clinical, radiologic, and pathologic significance. J Child Neurol. 1999; 14(6):368–376. [PubMed: 10385844]
Maruki K, Izaki Y, Nomura M, Yamauchi T. Differences in paired-pulse facilitation and long-termpotentiation between dorsal and ventral CA1 regions in anesthetized rats. Hippocampus. 2001;11(6):655–661. [PubMed: 11811659]
Muneoka KT, Takigawa M. 5-Hydroxytryptamine7 (5-HT7) receptor immunoreactivity-positive‘stigmoid body’-like structure in developing rat brains. Int J Dev Neurosci. 2003; 21(3):133–143.[PubMed: 12711351]
Niesen CE. Malformations of the posterior fossa: current perspectives. Semin Pediatr Neurol. 2002;9(4):320–334. [PubMed: 12523556]
Nüsslein-Volhard, C.; Dahm, R. Zebrafish. Oxford University Press; New York: 2002.Ockleford CD, Nevard CH, Indans I, Jones CJ. Structure and function of the nematosome. J Cell Sci.
1987; 87(1):27–44. [PubMed: 2822737]Parisi MA, Doherty D, Chance PF, Glass IA. Joubert syndrome (and related disorders) (OMIM
213300). Eur J Hum Genet. 2007; 15(5):511–521. [PubMed: 17377524]Parisi MA, Doherty D, Eckert ML, Shaw DW, Ozyurek H, Aysun S, Giray O, Al Swaid A, Al
Shahwan S, Dohayan N, Bakhsh E, Indridason OS, Dobyns WB, Bennett CL, Chance PF, Glass
Doering et al. Page 19
J Comp Neurol. Author manuscript; available in PMC 2009 November 10.
NIH
-PA Author Manuscript
NIH
-PA Author Manuscript
NIH
-PA Author Manuscript

IA. AHI1 mutations cause both retinal dystrophy and renal cystic disease in Joubert syndrome. JMed Genet. 2006; 43(4):334–339. [PubMed: 16155189]
De Chaves, EI Posse; Vance, DE.; Campenot, RB.; Kiss, RS.; Vance, JE. Uptake of lipoproteins foraxonal growth of sympathetic neurons. J Biol Chem. 2000; 275(26):19883–19890. [PubMed:10867025]
Quisling RG, Barkovich AJ, Maria BL. Magnetic resonance imaging features and classification ofcentral nervous system malformations in Joubert syndrome. J Child Neurol. 1999; 14(10):628–635. [PubMed: 10511334]
Racine R, Rose PA, Burnham WM. Afterdischarge thresholds and kindling rates in dorsal and ventralhippocampus and dentate gyrus. Can J Neurol Sci. 1977; 4(4):273–278. [PubMed: 597802]
Risold PY, Thompson RH, Swanson LW. The structural organization of connections betweenhypothalamus and cerebral cortex. Brain Res Brain Res Rev. 1997; 24(2-3):197–254. [PubMed:9385455]
Roger M, Arnault P. Anatomical study of the connections of the primary auditory area in the rat. JComp Neurol. 1989; 287(3):339–356. [PubMed: 2778109]
Rub U, Schultz C, Del Tredici K, Gierga K, Reifenberger G, de Vos RA, Seifried C, Braak H,Auburger G. Anatomically based guidelines for systematic investigation of the centralsomatosensory system and their application to a spinocerebellar ataxia type 2 (SCA2) patient.Neuropathol Appl Neurobiol. 2003; 29(5):418–433. [PubMed: 14507334]
Saraiva JM, Baraitser M. Joubert syndrome: a review. Am J Med Genet. 1992; 43(4):726–731.[PubMed: 1341417]
Shergill SS, Brammer MJ, Williams SC, Murray RM, McGuire PK. Mapping auditory hallucinationsin schizophrenia using functional magnetic resonance imaging. Arch Gen Psychiatry. 2000;57(11):1033–1038. [PubMed: 11074868]
Shinoda K, Mori S, Ohtsuki T, Osawa Y. An aromatase-associated cytoplasmic inclusion, the“stigmoid body,” in the rat brain: I. Distribution in the forebrain. J Comp Neurol. 1992; 322(3):360–376. [PubMed: 1325485]
Toro I Jr. Rohlich P. A new cytoplasmic component in the trophoblast cells of the rat and mouse. AnatRec. 1966; 155(3):385–399. [PubMed: 5956902]
Utsch B, Sayer JA, Attanasio M, Pereira RR, Eccles M, Hennies HC, Otto EA, Hildebrandt F.Identification of the first AHI1 gene mutations in nephronophthisis-associated Joubert syndrome.Pediatr Nephrol. 2006; 21(1):32–35. [PubMed: 16240161]
Valente EM, Brancati F, Silhavy JL, Castori M, Marsh SE, Barrano G, Bertini E, Boltshauser E, ZakiMS, Abdel-Aleem A, Abdel-Salam GM, Bellacchio E, Battini R, Cruse RP, Dobyns WB,Krishnamoorthy KS, Lagier-Tourenne C, Magee A, Pascual-Castroviejo I, Salpietro CD, Sarco D,Dallapiccola B, Gleeson JG. AHI1 gene mutations cause specific forms of Joubert syndrome-related disorders. Ann Neurol. 2006; 59(3):527–534. [PubMed: 16453322]
van Dorp DB, Palan A, Kwee ML, Barth PG, van der Harten JJ. Joubert syndrome: a clinical andpathological description of an affected male and a female fetus from the same sibship. Am J MedGenet. 1991; 40(1):100–104. [PubMed: 1887836]
White T, Cullen K, Rohrer LM, Karatekin C, Luciana M, Schmidt M, Hongwanishkul D, Kumra S,Schulz S Charles, Lim KO. Limbic Structures and Networks in Children and Adolescents WithSchizophrenia. Schizophr Bull. 2008; 34(1):18–29. [PubMed: 17942479]
Winer JA. The medial geniculate body of the cat. Adv Anat Embryol Cell Biol. 1985; 86:1–97.[PubMed: 3976449]
Yachnis AT, Rorke LB. Neuropathology of Joubert syndrome. J Child Neurol. 1999; 14(10):655–659.[PubMed: 10511338]
Zhou W, Song P. Molecular cloning of a novel gene ZAhi-1 and its expression analysis duringzebrafish gametogenesis. Mol Biol Rep. 2006; 33(2):111–116. [PubMed: 16817020]
Doering et al. Page 20
J Comp Neurol. Author manuscript; available in PMC 2009 November 10.
NIH
-PA Author Manuscript
NIH
-PA Author Manuscript
NIH
-PA Author Manuscript

Figure 1.Characterization of the specificity of Ahi1 antibodies. A, Immunohistochemical detection ofAhi1 shows diffuse cytoplasmic staining in the mature murine hypothalamus. Bar indicates200 μm. B, Lack of detection of Ahi1 immunoreactivity in the presence of a 5X excess ofthe peptide, used to generate the antibody; this result demonstrates the specificity of theAhi1 antibody. Scale bar = 200 μm. 3V: third ventricle C, Knockdown of Ahi1 by shRNAiin IMCD3 cells results in an almost complete absence of the 130 kDa Ahi1 band ascompared to non-transfected cells (WT), in four independent shRNAi experiments; thisresult further demonstrates the specificity of the Ahi1 antibody. D, Knockdown of Ahi1 bysiRNA in cultured hypothalamic neurons also shows the specificity of the Ahi1 antibody.
Doering et al. Page 21
J Comp Neurol. Author manuscript; available in PMC 2009 November 10.
NIH
-PA Author Manuscript
NIH
-PA Author Manuscript
NIH
-PA Author Manuscript

Left panels show hypothalamic neurons that have been transfected with, and express, EGFPand siRNAs against Ahi1 (green cells). Middle panels ilustrate the typical distribution ofAhi1 immunoreactivity in these cells (red cells). Right panels are a merge of the previouspanels indicating a lack of Ahi1 expression in cells that have had Ahi1 knockdown. Note thelack of Ahi1 (in red) in the cells transfected with RNAis against Ahi1 (green). Bar indicates10 μm. Magenta-green converted images are available as supplemental figures(Supplementary Figure 1).
Doering et al. Page 22
J Comp Neurol. Author manuscript; available in PMC 2009 November 10.
NIH
-PA Author Manuscript
NIH
-PA Author Manuscript
NIH
-PA Author Manuscript

Figure 2.Western blot analyses of Ahi1 expression in mouse tissues. A, Ahi1 is expressed in variousorgans of the mouse. The highest levels of expression occur in brain and testes. High Ahi1expression is also observed in the pituitary gland (note that this blot was from anotherexperiment and expression levels cannot be directly compared) with lower Ahi1 levels in thethymus, lung, and kidney (higher concentrations of protein are needed to reveal Ahi1expression in the kidney (compare left kidney blot to right). B, Representative Western blotof the temporal expression pattern of Ahi1, in whole mouse brain, indicates that the highestlevels of expression occur during the first 4-days following birth. β-tubulin expressionserves as a loading control. C, Quantification of Ahi1 levels in whole mouse brains acrossdevelopmental ages. Ahi1 and β-tubulin levels are quantified and standardized according toβ-tubulin expression, averaged across 3 experiments, and presented as the ratio of Ahi1/ β-tubulin. E: embryonic day; P: post-natal day
Doering et al. Page 23
J Comp Neurol. Author manuscript; available in PMC 2009 November 10.
NIH
-PA Author Manuscript
NIH
-PA Author Manuscript
NIH
-PA Author Manuscript
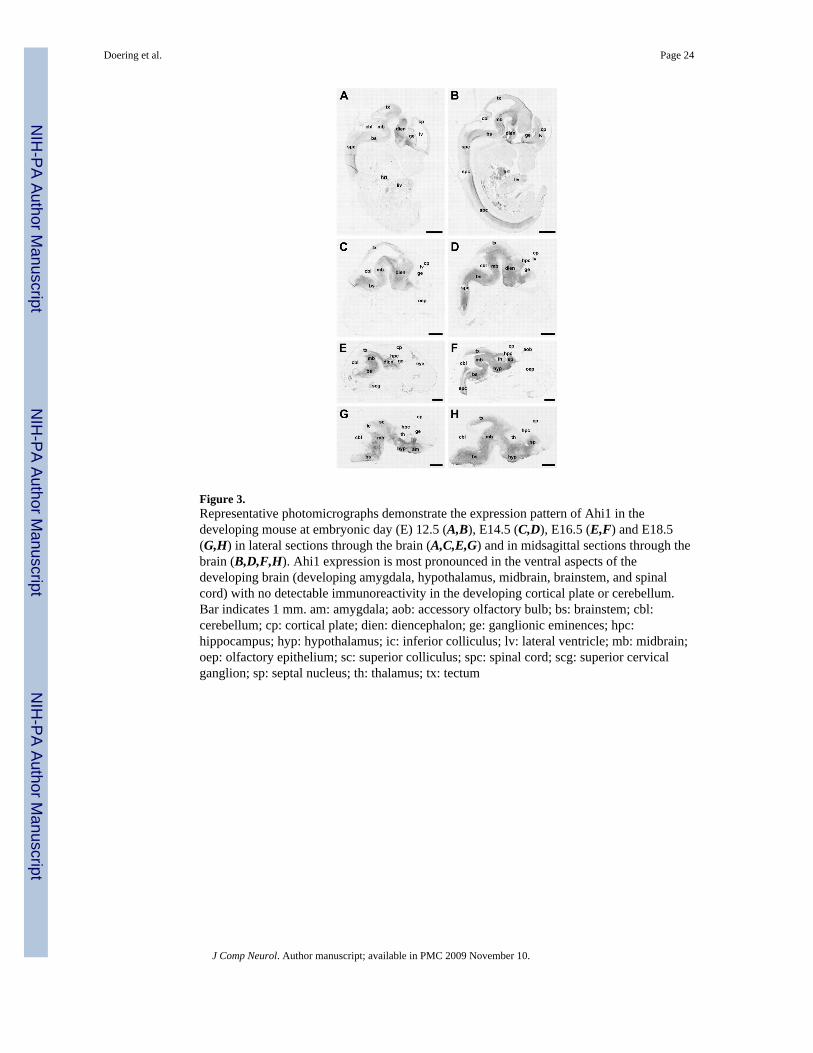
Figure 3.Representative photomicrographs demonstrate the expression pattern of Ahi1 in thedeveloping mouse at embryonic day (E) 12.5 (A,B), E14.5 (C,D), E16.5 (E,F) and E18.5(G,H) in lateral sections through the brain (A,C,E,G) and in midsagittal sections through thebrain (B,D,F,H). Ahi1 expression is most pronounced in the ventral aspects of thedeveloping brain (developing amygdala, hypothalamus, midbrain, brainstem, and spinalcord) with no detectable immunoreactivity in the developing cortical plate or cerebellum.Bar indicates 1 mm. am: amygdala; aob: accessory olfactory bulb; bs: brainstem; cbl:cerebellum; cp: cortical plate; dien: diencephalon; ge: ganglionic eminences; hpc:hippocampus; hyp: hypothalamus; ic: inferior colliculus; lv: lateral ventricle; mb: midbrain;oep: olfactory epithelium; sc: superior colliculus; spc: spinal cord; scg: superior cervicalganglion; sp: septal nucleus; th: thalamus; tx: tectum
Doering et al. Page 24
J Comp Neurol. Author manuscript; available in PMC 2009 November 10.
NIH
-PA Author Manuscript
NIH
-PA Author Manuscript
NIH
-PA Author Manuscript

Figure 4.Representative photomicrographs demonstrate the expression pattern of Ahi1 in thedeveloping and mature mouse brain at post-natal day (P) 0.5 (A,B), P1.5 (C,D), P3.5 (E,F),P7.5 (G,H), P21.5 (I,J) in lateral sections through the brain (A,C,E,G,I) and in midsagittalsections through the brain (B,D,F,H,J). Ahi1 expression is most pronounced in theaccessory olfactory bulb, amygdala, hypothalamus, ventral hippocampus (with weakexpression in the dorsal hippocampus), midbrain (various nuclei of the superior and inferiorcolliculus), and brainstem, with no detectable immunoreactivity in the cerebellum and mostof the cerebral cortex (exception entorhinal cortex). Bar indicates 1 mm. am: amygdala; an:nucleus accumbens; aob: accessory olfactory bulb; bs: brainstem; cbl: cerebellum; ctx:
Doering et al. Page 25
J Comp Neurol. Author manuscript; available in PMC 2009 November 10.
NIH
-PA Author Manuscript
NIH
-PA Author Manuscript
NIH
-PA Author Manuscript

cerebral cortex; cu: cuneate nucleus; ec: entorhinal cortex; gi: gigantocellular reticularnucleus; hpc: hippocampus; hyp: hypothalamus; ic: inferior colliculus; icp: internal capsule;lg: lateral geniculate nucleus; mb: midbrain; md: medullary reticular nucleus; ob: olfactorybulb; pag: periaqueductal gray; pc: piriform cortex; pn: pontine nucleus; po: preoptic area;pa: periolivary area; ps: parasubiculum; rn: reticular nucleus (pontine); sc: superiorcolliculus; sm: subiculum; sp: septal nucleus; str: striatum; th: thalamus; vn: vestibularnucleus, 7n: cranial nerve seven; 4v: fourth ventricle
Doering et al. Page 26
J Comp Neurol. Author manuscript; available in PMC 2009 November 10.
NIH
-PA Author Manuscript
NIH
-PA Author Manuscript
NIH
-PA Author Manuscript

Figure 5.High magnification photomicrographs demonstrate the expression of Ahi1 in sagittalsections through the dentate nucleus of the cerebellum (A), the inferior olive (B), the solitarynucleus (C), and the spinal 5 nucleus (D) from P0.5 brains (A,C,D) and P21.5 brain (B). Barindicates 100 μm. cbl: cerebellum; cu: cuneate nucleus; dn: dentate nucleus of thecerebellum; io: inferior olive; gi: gigantocellular reticular nucleus; md: medullary reticularnucleus; mlf: medial longitudinal fasciculus; pt: pyramidal tract; sn: solitary nucleus; svn:spinal vestibular nucleus; sp5c: spinal 5 nucleus, caudal; sp5i: spinal 5 nucleus, interpolar;sp5o: spinal 5 nucleus, oral.
Doering et al. Page 27
J Comp Neurol. Author manuscript; available in PMC 2009 November 10.
NIH
-PA Author Manuscript
NIH
-PA Author Manuscript
NIH
-PA Author Manuscript

Figure 6.AHI1 expression in human central nervous system. A, AHI1 expression in the adult and fetalhuman brain demonstrates that AHI1 is present in the developing cerebellum and brainstem,and is also present in the adult brain.
Doering et al. Page 28
J Comp Neurol. Author manuscript; available in PMC 2009 November 10.
NIH
-PA Author Manuscript
NIH
-PA Author Manuscript
NIH
-PA Author Manuscript

Figure 7.ahi1 expression in zebrafish central nervous system. A-G, Whole-mount in situhybridization was performed using D2.5 (A, B) D4.3 (E, F) and D5.2 (C, D, G) zebrafishembryos with ahi1 antisense riboprobe 1 (A, B) and riboprobe 2 (C-G). Eyes of the embryoswere dissected in D-F and only the brain is removed and shown in G. Bar indicates 50 μm.AC: anterior commissure; BrA: brachial arches; CB: cerebellum; D: diencephalon; GaT:gastrointestinal tract; GC: granule cell layer; H: hindbrain: Hy: hypothalamus; IE: inner ear;INL: inner nuclear layer; IPL: inner plexiform layer; M: midbrain; PoC: postopticcommissure; OB: olfactory bulb; SC: spinal cord; T: telencephalon; Te: tectum
Doering et al. Page 29
J Comp Neurol. Author manuscript; available in PMC 2009 November 10.
NIH
-PA Author Manuscript
NIH
-PA Author Manuscript
NIH
-PA Author Manuscript

Figure 8.Representative fluorescent photomicrographs demonstrate the expression of Ahi1 (red) incultured primary hypothalamic neurons (A), in the septal nucleus of mouse brain (B), and incultured primary hypothalamic neuronal axon growth cones (C). Ahi1 (red) is localized tothe cytoplasm of neurons as well as to neuronal processes (A) with low expression in thenucleus (A’,A”). Arrowheads indicate Ahi1-positive stigmoid bodies. Bar indicates 10 μm.Ahi1 primarily is expressed in neurons given the co-immunoreactivity of Ahi1 (red) (B)with NeuN (green), a marker of differentiated neurons (B’,B”). Bar indicates 50μm. ac:anterior commissure; sp: septal nucleus. Ahi1 (red) was observed in axons and axonalgrowth cones (C) with co-localization with a growth cone marker, dynein (C’,C”). Arrowsindicate Ahi1-positive growth cones. Bar indicates 5 μm. Magenta-green converted imagesare available as supplemental figures (Supplementary Figure 2).
Doering et al. Page 30
J Comp Neurol. Author manuscript; available in PMC 2009 November 10.
NIH
-PA Author Manuscript
NIH
-PA Author Manuscript
NIH
-PA Author Manuscript

Figure 9.Localization of Ahi1 to a non-membrane limited organelle called a stigmoid body.Immunohistochemical localization of Ahi1 to stigmoid bodies (black arrowheads) in the (A)amygdala and the (B) hypothalamus of the mouse brain. Bar indicates 20 μm. C, EMimmunolocalization of Ahi1 shows that Ahi1 antibodies (gold particles) localize to anorganelle, often found near the nucleus (n), called the stigmoid body (see black arrow). C,inset, The stigmoid body (gold-labeled) is ring-shaped in cross-section. D, D’, In well-preserved material, fixed for fine structure analysis, the ring-shaped stigmoid body (arrow)is confirmed not to be membrane bound, but has a chromatin-like appearance, whosecomponents were packed together with a certain periodicity, with nearby polyribosomes
Doering et al. Page 31
J Comp Neurol. Author manuscript; available in PMC 2009 November 10.
NIH
-PA Author Manuscript
NIH
-PA Author Manuscript
NIH
-PA Author Manuscript

(arrowheads). n, nucleus. Bars in C, D indicate 0.5 μm. LR11 also demonstrated co-localization to stigmoid bodies (Gutekunst et al., 2003) and therefore we performed co-labeling experiments for both LR11 and Ahi1. E, LR11 immunostaining (green) hadidentical labeling of stigmoid bodies as Ahi1 (red) demonstrating that Ahi1 is localized tostigmoid bodies (white arrows point to LR11/Ahi1 localization to stigmoid bodies). Bar in Eindicates 5 μm. Magenta-green converted images are available as supplemental figures(Supplementary Figure 3).
Doering et al. Page 32
J Comp Neurol. Author manuscript; available in PMC 2009 November 10.
NIH
-PA Author Manuscript
NIH
-PA Author Manuscript
NIH
-PA Author Manuscript

NIH
-PA Author Manuscript
NIH
-PA Author Manuscript
NIH
-PA Author Manuscript
Doering et al. Page 33
Table 1
Detailed expression patterns of Ahi1 in the Adult Mouse Forebrain
Anatomical Structure ExpressionLevels
Presence inStigmoidBodies
Olfactory bulb
Accessory olfactory bulb ++ -
Main olfactory bulb - -
Cerebral cortex
Entorhinal cortex + -
Perirhinal cortex + -
Piriform cortex + -
Other cortical regions - -
Hippocampus
Dentate gyrus
dorsal + -
ventral +++ -
Hilus - -
CA1 region
dorsal - -
ventral + -
CA3 region
dorsal - -
ventral + -
Subiculum ++ +
Fimbria ++ +
Amygdala
Basolateral nucleus - -
Basomedial nucleus ++ +
Central nucleus +++ +
Medial nucleus +++ +
Lateral nucleus + -
Cortical nucleus
Anterior ++ +
Posteromedial, ventral + +
Posterior ++ -
Intercalated cells +++ -
Amygdalopiriform transition area + -
Amygdalostriatal transition area +++ +
Amygdalohippocampal area + +
Interstitial nucleus of the posterior limb + +
J Comp Neurol. Author manuscript; available in PMC 2009 November 10.

NIH
-PA Author Manuscript
NIH
-PA Author Manuscript
NIH
-PA Author Manuscript
Doering et al. Page 34
Anatomical Structure ExpressionLevels
Presence inStigmoidBodies
of the anterior commissure
Septal and basal magnocellular nuclei
Bed nucleus of stria terminalis +++ +
Nucleus accumbens + +
Substantia innominata + +
Septal lateral nucleus +++ +
Septal medial nucleus +++ +
Striatopallidal system
Caudate putamen + -
Ventral pallidum ++ +
Thalamus
Anterior area ++ +
Dorsal area +++ +
Lateral area + +
Posterior area ++ +
Parafascicular nucleus +++ +
Paraventricular nucleus +++ +
Reticular nucleus + +
Ethmoid nucleus ++ +
Subthalamic nucleus + -
Zona incerta ++ +
Posterior intralaminar nucleus ++ +
Posterior triangular nucleus ++ +
Stria medullaris nucleus +++ +
Stria terminalis ++ +
Dorsal lateral geniculate nucleus, lateralaspects +++ +
Ventrolateral geniculate nucleus, lateralaspects +++ +
Medial geniculate nucleus
dorsal +++ +
ventral +++ +
Lateral habenular nucleus + +
Hypothalamus
Preoptic nucleus ++ +
Paraventricular nucleus ++ +
Dorsomedial nucleus +++ +
Ventromedial nucleus +++ +
Arcuate nucleus +++ +
J Comp Neurol. Author manuscript; available in PMC 2009 November 10.

NIH
-PA Author Manuscript
NIH
-PA Author Manuscript
NIH
-PA Author Manuscript
Doering et al. Page 35
Anatomical Structure ExpressionLevels
Presence inStigmoidBodies
Premammillary nucleus, ventral +++ +
Lateroanterior nucleus ++ +
Dorsal nucleus +++ +
Stigmoid nucleus ++ +
Septohypothalamic nucleus +++ +
Striohypothalamic nucleus ++ +
Tuberal nucleus + +
Terete nucleus + +
Parasubthalamic nucleus ++ +
Supraoptic nucleus +++ +
Medial forebrain bundle + +
+, present (for expression level, low); ++, moderate expression; +++, high expression; -, not present.
J Comp Neurol. Author manuscript; available in PMC 2009 November 10.
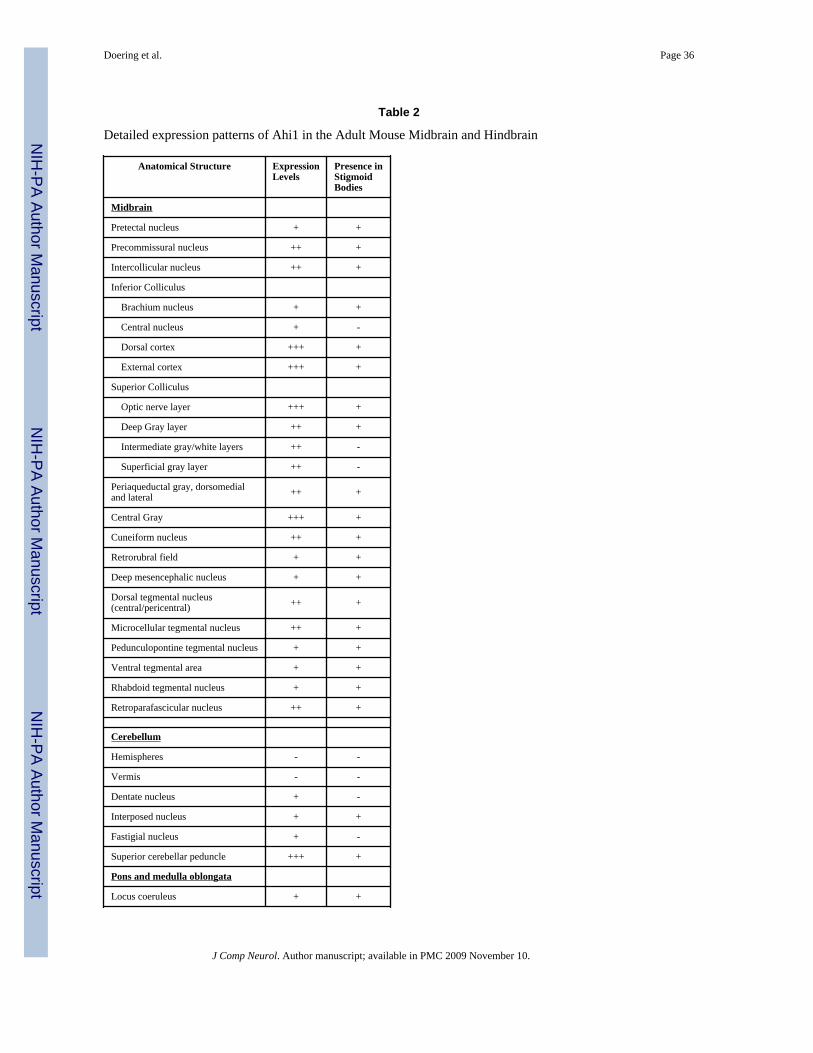
NIH
-PA Author Manuscript
NIH
-PA Author Manuscript
NIH
-PA Author Manuscript
Doering et al. Page 36
Table 2
Detailed expression patterns of Ahi1 in the Adult Mouse Midbrain and Hindbrain
Anatomical Structure ExpressionLevels
Presence inStigmoidBodies
Midbrain
Pretectal nucleus + +
Precommissural nucleus ++ +
Intercollicular nucleus ++ +
Inferior Colliculus
Brachium nucleus + +
Central nucleus + -
Dorsal cortex +++ +
External cortex +++ +
Superior Colliculus
Optic nerve layer +++ +
Deep Gray layer ++ +
Intermediate gray/white layers ++ -
Superficial gray layer ++ -
Periaqueductal gray, dorsomedialand lateral ++ +
Central Gray +++ +
Cuneiform nucleus ++ +
Retrorubral field + +
Deep mesencephalic nucleus + +
Dorsal tegmental nucleus(central/pericentral) ++ +
Microcellular tegmental nucleus ++ +
Pedunculopontine tegmental nucleus + +
Ventral tegmental area + +
Rhabdoid tegmental nucleus + +
Retroparafascicular nucleus ++ +
Cerebellum
Hemispheres - -
Vermis - -
Dentate nucleus + -
Interposed nucleus + +
Fastigial nucleus + -
Superior cerebellar peduncle +++ +
Pons and medulla oblongata
Locus coeruleus + +
J Comp Neurol. Author manuscript; available in PMC 2009 November 10.

NIH
-PA Author Manuscript
NIH
-PA Author Manuscript
NIH
-PA Author Manuscript
Doering et al. Page 37
Anatomical Structure ExpressionLevels
Presence inStigmoidBodies
Median raphe nucleus + +
Reticular nucleus ++ +
Solitary (tract) nucleus ++ +
Inferior olive + +
Lateral lemniscus + +
Parabrachial nucleus +++ +
External cuneate nucleus + +
Paralemniscal nucleus ++ +
Spinal trigeminal nucleus +++ +
Dorsomedial spinal 5 nucleus + +
+, present (for expression level, low); ++, moderate expression; +++, high expression; -, not present.
J Comp Neurol. Author manuscript; available in PMC 2009 November 10.
Copyright © 2022 FDOKUMEN