special review 1990 crime victimization survey - Census and ...
10
SPECIAL REVIEW 1990 CRIME VICTIMIZATION SURVEY A Crime Victimization Survey was conducted in January 1990 to collect information on criminal acts that took place during the calender year 1989. is article gives an outline of the objectives, the design and summary findings of the Survey. Hong Kong Monthly Digest of Statistics 1 anuary 1c1 111
-
Upload
khangminh22 -
Category
Documents
-
view
3 -
download
0
Transcript of special review 1990 crime victimization survey - Census and ...

SPECIAL REVIEW
1990 CRIME VICTIMIZATION SURVEY
A Crime Victimization Survey was conducted in January 1990 to collect information on criminal acts that took place during the calender year 1989. This article gives an outline of the
objectives, the design and summary findings of the Survey.
Hong Kong Monthly Digest of Statistics 1 anuary 1991 111

SPECIAL REVIEW
1990 CRIME VICTIMIZATION SURVEY
!.BACKGROUND
1.1 A crime victimization survey was conducted in January 1990 by the Census and Statistics Department under the
auspices of the Fight Crime Committee. Such a survey was conducted for the fourth time and it covered criminal acts that took
place during the calender year 1989. The survey was first conducted in 1979 and then repeated in 1982 and 1987.
2. OBJECTIVE OF mE SURVEY
2.1 The overall objective of the survey is to provide those involved in the administration of criminal justice with information, not otherwise available from official records, on the nature and extent of crime and reasons for not reporting crime, with a view to complementing data resources already on hand for purpose of planning, evaluation and analysis. Specifically,
the objective has four components :
(a) To measure the extent of crime
As the survey was conducted in the form of household interviews covering a representative and statistically valid sample of the entire population, it could unveil information about those crimes which, for a variety of reasons, were not reported to the police, hence providing a more accurate picture of the crime situation than that based only on crimes reported
to the police.
(b) To provide detailed information on crime and its victims
The crime statistics systems maintained by the law enforcement bodies for operational and administrative purposes focus on criminal offenders. The survey, on the other hand, also collected information on the characteristics of victims and more information on the circumstances under which criminal acts occurred.
(c) To provide information on victims' reporting behaviour
The survey could provide information on victims' reporting behaviour and on factors which influenced a victim's
decision whether to report the crime to the police.
(d) To measure changes in crime pattern and reporting behaviour
When conducted periodically, the survey could measure over time changes in the incidence and pattern of crime and in the reporting behaviour of victims. This will reflect to a certain extent the effectiveness of crime prevention measures taken by
the police· and the level of success in encouraging the public to report crime.
3. SURVEY MEffiODOLOGY
Sample design and sample size
3.1 The survey covered the entire land-based civilian population aged 12 and above, with the exception of those living on outlying islands other than those in Cheung Chau, Peng Chau, Mui Woo and Discovery Bay. However, transients (such as tourists), military personnel living in military barracks and inmates in institutions were not covered. The sample for the survey was selected using a stratified, systematic and replicated sample design. The sampling units were individual addresses of permanent quarters and area segments each consisting of 10 - 12 temporary structures. Based on the experience of previous surveys and the desired level of precision of data, and taking into account the total costs incurred, the sample size was set at about 19 500 quarters which were drawn from the computerized frame of quarters maintained by the Census and Statistics
Department. This represents a sampling fraction of around 1.1 %.
Data collection
3.2 The method of personal interview was employed in the survey. For each household in the sampled living quarters, a knowledgeable adult, usually the head of the household, was designated as the respondent for household questions. This person was required to answer questions about the household characteristics and criminal acts that had occurred to the household. Information concerning personal characteristics and criminal acts against persons was obtained from all individual
household members aged 12 and above.
112 Hong Kong Momhly Digest of Statistics January 1991

SPECIAL REVIEW
The questionnaire
3.3 Two questionnaires were used in the survey, namely a Screen Questionnaire and a Crime Incident Report. The Screen Questionnaire was designed to screen all victimizations before details of any specific incident were collected. It was also used to obtain information on the basic characteristics of each household and its members. Household screening questions were asked of the head of the household, whereas individual screening questions were asked of all household members aged 12 and above. Once the screening process was completed, the Crime Incident Report was used to. obtain details of each revealed crime incident, if any. The Crime Incident Report included questions concerning time and plaee of crime occurrence, the extent of victim harm, characteristics of offenders, anti-theft devices/measures taken. whether or not the police was informed, opinions on treatment of offenders and other pertinent details. In the 1990 Crime Victimization
Survey, a new section which consisted of six questions was included in the Screen Questionnaire to solicit public opinions on some issues of sentencing and the Triad Renunciation Scheme. Only persons aged 18 and above were asked on these questions.
Crime measurement and classification
3.4 "Victimization" was used as the basic measure of crime occurrence in this survey. A "victimization" is a specific criminal act affecting a single victim, whereas an "incident" is a specific criminal act affecting one or more victims. The definitions of crimes used this survey are compatible with conventional usage and general understanding. A basic distinction is made between two types of crime, namely :
(a) Crimes Against Persons (or Personal Crimes)
- Crimes of violence -Rape and �decent assault on female -Assault -Robbery -Blackmail - Criminal intimidation
- Crimes of theft -Snatching - Pickpocketing - Other personal theft -Fraud
(b) Crimes Against Households (or Household Crimes)
-Burglary - Theft of vehicle - Theft from vehicle - Other household theft - Criminal damage to property
3.5 Crimes reported during the interview are classified into the above categories according to a classification scheme based upon the presence (or absence) of certain elements in the incident. If there are two or more categories of crimes which fit the description of the incident, the classification scheme utilizes a hierarchy of seriousness to select only the more serious type of crime for classification; e.g. an incident involving both assault and robbery is classified as robbery only.
Results of enumeration
3.6 A total of 19 820 quarters were selected in the sample for the survey. Of these, 3 284 (or 16.6%) were unoccupied or demolished, or were non-domestic quarters. In addition, households in 408 living quarters could not be contacted even after repeated visits were made by the enumerators during the survey period. Assuming that each non-contact
· living quarters
contained only one household, a total of 17 464 households were enumerated in 16 $36 occupied living quarters. The non-response rate for the survey was about 1.2%. A total of 50 956 persons aged 12 and above were interviewed and 2 355 Crime Incident Reports were completed.
Hong Kong Monthly Digest of Statistics January 1991 113

SPECIAL REVIEW
4. SUMMARY OF MAIN FINDINGS
Crime Occurrence
4.1 It was estimated that about 81 500 households and 102 100 persons aged 12 and above were victimized at least once during the calender year 1989. This involved a total of some 213 800 victimizations of which 8 000 (4%) were series victimizations. Series victimization refers to a series of five or more similar criminal events about which the respondent was unable to recall details of each discrete incident and so data were collected only for the most recent crime incident. Given the limitations of the data, series victimizations are excluded from the following analysis. However, as series victimizations account for only a small proportion of the total number of crime incidents, their exclusion will not affect the findings of the survey in any significant manner.
4.2 Table 1 shows the number of victimizations and victimization rates by type of crime. Of the 205 800 non-series victimizations, 112 200 (55%) were committed against persons aged 12 and above, and 93 600 (45%) against households. The
victimization rate for personal crimes was 24 per 1 000 population; the rate for household crimes, 61 per 1 000 households.
4.3 Of the 112 200 personal crimes, 72% were crimes of theft and 28%, crimes of violence. Pickpocketing accounted for 55% (44 600) of non-violent crimes. Of the 93 600 household crimes, 33% were burglary and 41%, household theft other than burglary. (Table 1)
TABLE 1 NUMBER AND PERCENTAGE DISTRIBUTION OF VICTIMIZATIONS AND
VICTIMIZATION RATES, BY TYPE OF CRIME, 1989
Percent of persona V
household Percent of Rate Type of crime Number crimes all crimes per 1 000
All crimes 205 800
All personal crimes 112 200
Crimes of violence 31 200
Rape and indecent assault on female 3 500
Assault 6 900
Robbery 13 000
Blackmail 1 900
Criminal intimidation 5 800
Crimes of theft 81 000
Snatching 6 300
Pickpocketing 44 600
Other personal theft 22 900
Fraud 7 300
All household crimes 9 3600
Burglary 31 000
Theft of vehicle 3 500
Theft from vehicle 12 500
Other household thefl 38 600
Criminal damage to property 8 000
100. 0
27.8
3.2
6.2
11.6
1.7
5.2
7 2.1
5.6
39.7
20.4
6.5
100.0
33.1
3.8
13.4
41.2
8.5
100.0
54.5
15.1
1.7
3.4
6.3
0.9
2.8
39.3
3.0
21.7
11.1
3.5
4s.s·
15.0
1.7
6.1
18.7
3.9
Note: Victimization rate for personal crimes is expressed as the number of victimizations per 1 000 population aged 12 and over. Victimization rate for
household crimes is the number of victimizations per 1 000 households.
#The corresponding victimization rate for car-owning households is 23.7 per 1 000.
24.3
6.7
0.8
1.5
2.8
0.4
1.3
17.5
1.4
9.6
4.9
1.6
61.2
20.2
2.3 #
8.2
25.2
5.2
114 Hong Kong Monthly Digest of Statistics January 1991
SPECIAL REVIEW
Characteristics of victims
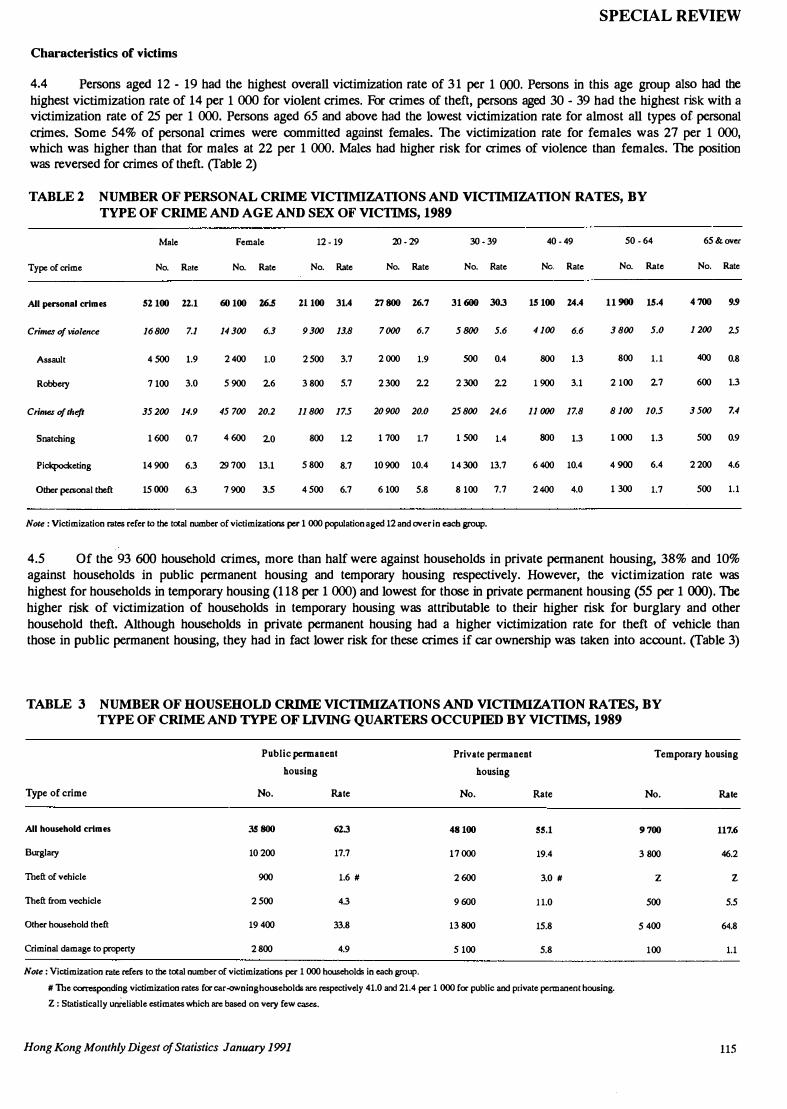
4.4 Persons aged 12 - 19 had the highest overall victimization rate of 31 per 1 000. Persons in this age group also had the highest victimization rate of 14 per 1 000 for violent crimes. For crimes of theft, persons aged 30- 39 had the highest risk with a victimization rate of 25 per 1 000. Persons aged 65 and above had the lowest victimization rate for almost all types of personal crimes. Some 54% of personal crimes were committed against females. The victimization rate for females was 27 per 1 000, which was higher than that for males at 22 per 1 000. Males had higher risk for crimes of violence than females. The position was reversed for crimes of theft. (fable 2)
TABLE 2 NUMBER OF PERSONAL CRIME VICTIMIZA TIONS AND VICTIMIZATION RATES, BY TYPE OF CRIME AND AGE AND SEX OF VICTIMS, 1989
Type of crime
All personal crimes
Crimes of violence
Assault
Robbery
Crimes of tlleft
Snatching
Pickpocketing
Other personal tbeft
Male
No. Rate
52100 22.1
16800 7.1
4 500 1.9
7100 3.0
35 200 14.9
1600 0.7
14900 6.3
15 000 6.3
Female
No. Rate
60100 26.5
14 300 6.3
2400 1.0
5900 26
45 700 20.2
4600 20
29 700 13.1
7 900 3.5
12-19
No. Rate
21100 31.4
9300 13.8
2500 3.7
3 800 5.7
11800 17.5
800 1.2
5 800 8.7
4 500 6.7
20-29
No. Rate
27 800 26.7
7000 6.7
2000 1.9
2300 22
20 900 20.0
1 700 1.7
10900 10.4
6100 5.8
30-39
No. Rate
31600 30.3
5800 5.6
500 0.4
2300 22
25800 24.6
1500 1.4
1 4 300 13.7
8100 7.7
Note : Victimization rates refer to the total number of victimizations per 1 000 population aged 12 and over in each group.
40-49
No. Rate
15100 24.4
4 100 6.6
800 1.3
1900 3.1
11000 17.8
800 1.3
6 400 10.4
2400 4.0
50 -64
No. Rate
11900 15.4
3800 5.0
800 1.1
2100 27
8 100 10.5
1000 1.3
4900 6.4
1 300 1.7
65&over
No. Rate
4 700 9.9
1 200 25
400 0.8
600 1.3
3 500 7.4
500 0.9
2200 4.6
500 1.1
4.5 Of the 93 600 household crimes, more than half were against households in private permanent housing, 38% and 10% against households in public permanent housing and temporary housing respectively. However, the victimization rate was highest for households in temporary housing (118 per 1 000) and lowest for those in private permanent housing (55 per 1 000). The higher risk of victimization of households in temporary housing was attributable to their higher risk for burglary and other household theft. Although households in private permanent housing bad a higher victimization rate for theft of vehicle than those in public permanent housing, they had in fact lower risk for these crimes if car ownership was taken into account. (fable 3)
TABLE 3 NUMBER OF HOUSEHOLD CRIME VICTIMIZATIONS AND VICTIMIZATION RATES, BY TYPE OF CRIME AND TYPE OF LIVING QUARTERS OCCUPffiD BY VICTIMS, 1989
Public permanent Private permanent Temporary housing
housing housing
Type of crime No. Rate No. Rate
All household crimes 35800 6 2.3 48100 55.1
Burglary 10 200 17.7 17 000 19.4
Theft of vehicle 900 1.6 # 2600 3.0 #
Theft from vechicle 2500 4.3 9600 11.0
Other household theft 19400 33.8 13800 15.8
Criminal damage to property 2800 4.9 5100 5.8
Note: Victimization rate refers to the total number of victimization& per 1 000 households in each group.
#The corresponding victimization rates for car-owning households are respectively 41.0 and 21.4 per 1 000 for public and private permanent housing.
Z: Statistically u�liable estimates which are based on very few cases.
Hong Kong M o11thly Digest of Statistics January 1991
No. Rate
9700 11 7.6
3 800 46.2
z z
500 5.5
5 400 64.8
100 1.1
115

SPECIAL REVIEW
Reporting crime to the Police
4.6 About 42% of personal crimes and 24% of household crimes were reported to the police. For individual types of crimes, the reporting rate ranged from 80% for theft of v_ehicle to only 3% for household theft other than burglary. The reporting rate for violent crimes was 45%; that for crimes of theft, 41%. (fable 4)
TABLE 4 NUMBER AND PERCENT OF VICTIMIZATIONS REPORTED TO THE POLICE, BY TYPE OF CRIME, 1989
Type of crime Number Percent
All crimes 70 100 34.0
All persomd crimes 47 400 42. 2
Crimes of violence 13 900 44.6
Rape and indecent assault on female 800 23.0
Assault 3900 56.5
Robbery 6 800 52.4
Blackmail 500 23.8
Criminal intimidation 1900 32.8
Crimes of theft 33 500 41.3
Snatching 3 300 52.1
Pickpocketing 23 400 52.5
Other personal theft 5600 24.6
All household crimes 22 700 24. 2
Burglary 12 700 41.1
Theft of vehicle 2 800 79.5
Theft from vehicle 3 600 29.0
Other household theft 1 100 2.8
Criminal damage to property 2 500 30.7
4.7 Victims of different types of crimes tended to have different reasons for reporting the incident to the police. For crimes of theft a significant proportion . of the victims ( 46%) cited that reporting to the police was a pre-requisite to obtaining replacement of documents or claiming insurance. For crimes of violence the most frequently cited reason by the victims was that they hoped to catch the offender. About 27% of victims of household crimes cited that they reported the incident in order that the police could improve the effectiveness of anti-crime measures. Only 10% of all crimes were reported to the police because victims considered it their duty, as a citizen, to report crime.
4.8 About 54% of the 135 700 crimes not reported to the police were not reported because the victims believed that there was no need to report the incident (either because they had suffered no serious loss or because they considered the incident not important). Less than one- quarter of the crimes were not reported because the victims thought that nothing could be done, particularly when there was lack of proof of the incident. Less than 15% of the crimes were not reported because the victims did not want to take time to do so, and about 68% of them actually considered the reporting procedures too cumbersome.
116 Hong Kong Monthly Digest of Statistics January 1991

SPECIAL REVIEW
Comparison with previous surveys
4.9 The total number of victimizations has decreased significantly over the period 1986-1989, from 293 400 to 205 800. While there was a general decrease in both personal and household crimes in 1989, compared with 1986, the decrease was more significant for the former (39%) than for the latter (14%). The decrease in personal crimes in 1989 was mainly attributable to the tremendous decrease in crimes of theft, especially pickpocketing which showed a drop of 51%. (fable 5)
4.10 Victimization rates for both personal and household crimes decreased, between 1986 and 1989, from 40 to 24 per 1 000 population aged 12 and above and from 74 to 61 per 1 000 households respectively. The decrease was more significant for the victimization rate for personal crimes (40%) than for the victimization rate for household crimes ( 17%). (fable 5)
4. 11 There was no difference in the broad pattern of household crimes between 1986 and 1989. Burglary and theft from vehicle together accounted for nearly half of all household crimes. For personal crimes the pattern was somewhat different: violent crimes had a larger share, but crimes of theft had a smaller share, of all personal crimes in 1989 than in 1986. (Table 5)
TABLE 5 NUMBER OF VICTIMIZATIONS AND VICTIMIZATION RATES, BY TYPE OF CRIME,
1978, 1981, 1986 AND 1989
Number of victimizations Rate per 1 000
Type of crime 1978 1981 1986 1989 1978 1981 1986 1989
All crimes 132 400 270600 293 400 205 800 *
All personal crimes 82200 161500 184500 112200. 21.9 39.2 40.2
Crimes of violence 36 900 40 300 43 400 31 200 * 9.8 9.8 9.5
Rape and indecent assault on female 1 300 800 3 400 3 500 0.3 0.2 0.7
Assault 2 200 4 300 12 400 6 900* 0.6 1.0 2.7 Robbery 30 400 32 600 15 700 13000 8.1 7.9 3.4 Blackmail 800 900 3 900 1900 * 0.2 0.2 0.8 Criminal intimidation 2 200 1 800 8 000 5 800 0.6 0.4 1.7
Crimes of theft 45 200 121 200 138 500 81 000 * 12.0 2 9.4 30.1
Snatching 3 600 7 500 9 500 6 300 * 1.0 1.8 2.1 Pickpocketing 3 1 400 92 500 90300 44 600 * 8.3 22.4 19.6 Other personal theft 9000 20 300 33 400 22900 * 2.4 4.9 7.3 Fraud 1 200 900 5 300 7 300 0.3 0.2 1.2
All household crimes 50200 109 100 108 900 93 600. 46.5 8 6. 4 73.7
Burglary 16 600 36 000 36 400 31 000 15.4 28.5 24.6 Theft of vehicle 1 100 2 700 3 900 3 500 1.0 2. 1 2.6 Theft from vehicle 9 000 16 600 16 100 12 500 8.3 13.2 10.9 Other household theft 21 800 50 000 47 300 38 600 * 20.2 39.6 32.0 Criminal damage to property 1 600 3 800 5 200 8 000* 1.5 3.0 3.5
Note: Victimization rate for personal crimes is expressed as the number of victimizations per 1 000 population aged 12 and over. Victimization rate for household crimes is the number of victimizations per 1 000 households.
An asterisk(*) indicates that the change in the value between 1986 and 1989 was statistically significant at the 95% confidence level.
The term "assault" used in this survey is the same as "serious assault" in previous surveys.
Ho11g Kong Monthly Digest of Statistics January 1991
24.3*
6.7 *
0.8 1.5 * 2.8 0.4 * 1.3
17.5 *
1.4 * 9.6 * 4.9 * 1.6
61.2 *
20.2 * 2.3 8.2 *
25.2 * 5.2 *
117

SPECIAL REVIEW
Public opinion on death sentence
4.12 On the question relating to the most appropriate treatment to offenders sentenced to death, 46% of the 4.1 million persons aged 1 8 and above thought that the most appropriate treatment was to commute their sentence to life imprisonment, 28% opined that they should be executed, and 21% had no opinion. Only 3% thought that they should be commuted to determinate terms of imprisonment. There tended to be a higher proportion of persons in the younger age groups who considered the offenders sentenced to death should be commuted to life imprisonment. There was no significant difference in opinion between males and females. (fable 6)
TABLE6 OPINION OF PERSONS AGED 18 AND OVER ON THE MOST APPROPRIATE TREATMENT
TO OFFENDERS SENTENCED TO DEATH, BY SEX AND AGE
Should be
Should be commuted to Should commuted to determinate
Sex/age be life terms of No group executed imprisonment imprisonment Others opinion Total
% % % % % %
Male
18- 19 20.9 62.9 4.4 0.9 11 .0 100.0 ( 81 000)
20- 29 26.8 56.6 3.0 1 .7 1 1.9 100.0 ( 523 000) 30 - 39 32.6 46.7 3.3 2.3 15.1 100.0 ( 540 800) 40-49 33.5 44.2 3.0 2.4 16.8 100.0 ( 335 400) 50-64 29.2 42.9 2.8 2.3 22.8 100.0 ( 403 800) 65 &over 24.5 33.9 2.5 1.6 37.5 100.0 ( 2 1 1 200)
All Males 29.4 47.4 3.0 2.1 18.1 100 .0 (2 0 95 100 )
Female
18- 19 20.3 63.8 5.4 1.9 8.7 100.0 ( 80 300)
20- 29 26.9 53.9 4.3 1.6 13.4 100.0 ( 519 800) 30- 39 32.0 44.4 3.5 2.8 17.3 100.0 ( 504 800) 40- 49 29.4 43.8 3.2 2.7 21.0 100.0 ( 281 500) 50- 64 23.0 36.1 2.9 1 .9 36.1 100.0 ( 365 100) 65 &over 15.7 25.9 2.3 1 .5 54.7 100.0 ( 267 000)
All Females 26.1 4 3.6 3.4 2.1 24.8 100 .0 (2 0 18 7 00 )
All Persons 27.8 45.5 3.2 2.1 21.3 100.0 (4 113 800)
Note : Figures in brackets refer to the total number of pesrsons in the sex/age group.
4.13 About half of the 4.1 million persons considered that death sentence should not be abolished. One-third of them thought that it should be abolished, and 20% had no opinion. A higher proportion of young persons in the 18-29 age group thought that death sentence should be abolished. Again, there was no significant difference in opinion between males and
females. (fable 7)
118 Hong Kong Monthly Digest of Statistics January 1991

SPECIAL REVIEW
TABLE7 OPINION OF PERSONS AGED 18 AND OVER ON WHETHER DEA m SENTENCE BEe
ABOLISHED, BY SEX AND AGE
Sex/age group Yes No No opinion Total
% % % %
Male 18-19 47.6 42.5 9.9 100.0 ( 81 000)
20-29 40.1 48.7 11.3 100.0 ( 523 000)
30-39 31.0 55.0 14.0 100.0 ( 540 800)
40-49 28.2 56.4 15.4 100.0 ( 335 400)
50-64 26.6 50.8 22.6 100.0 ( 403 800) 65 & over 22.4 41.8 35.8 100.0 ( 211 200)
All Males 31.7 51.0 17.2 100.0 (2 095 100)
Female 18-19 47.9 43.4 8.7 100.0 ( 80 300)
20-29 35.6 51.5 12.9 100.0 ( 519 800) 30-39 27.5 57.4 15.0 100.0 ( 504 800)
40-49 26.7 52.5 20.7 100.0 ( 281 500)
50-64 22.8 42.5 34.6 100.0 ( 365 100)
65 & over 16.4 30.4 53.3 100.0 ( U,7 000)
A/I Females 28.0 48.4 23.6 100.0 (2 018 700)
All Persons 29. 9 49.7 20.4 100.0 (4113 800)
Note :·Figures in brackets refer to the total number of persons in the sex/age g�oup.
Public Opinion on the Triad Renunciation Scheme
4.14 About 72% of the 4.1 million persons had heard of the Triad Renunciation Scheme. Of these persons, 48% thought that the scheme was effective in weakening the power of the triad society, while 31% thought that it was not effective, and 21% had no opinion. There was no appreciable difference in opinion between males and females. (fable 8)
TABLE 8 OPINION OF PERSONS AGED 18 AND OVER WHO HAD HEARD OF THE TRIAD RENUNCIATION SCHEME ON THE EFFECTIVENESS OF THE SCHEME, BY SEX AND AGE
Effective Not Effective No opinion Total
Sex/age group % % % %
Male
18-19 48.9 37.0 14.2 100.0 20-29 45.9 38.6 15.5 100.0 30-39 47.2 34.4 18.5 100.0 40-49 51.2 29.0 19.9 100.0 50-64 55.1 24.0 20.9 100.0 65 & over 53.8 22.9 23.3 100.0
All Males 49.3 32.4 18.4 100.0
Female 18-19 46.0 38.8 15.2 100.0 20-29 44.7 37.2 18.0 100.0 30-39 47.5 28.3 24.2 100.0 40-49 51.3 22.1 26.6 100.0 50-64 49.1 21.8 29.1 100.0 65 & over 48.1 18.8 33.1 100.0
All Females 47.3 29.5 23.2 100.0 All Persons 48.4 31.1 20.5 100.0
Note : Figures in brackets refer to the total number of persons in the sex/age group.
Hong Kong Monthly Digest of Statistics January 1991
( 71 500)
( 469000)
( 449 900) ( 256 400)
( 272 500)
( 107 100)
(1 626400)
( 71 600)
( 428 400)
( 379 400)
( 184 900) ( 180 500)
( 77 300)
(1322 100)
(2 948 600)
119

SPECIAL REVIEW
5. LIMITATIONS OF THE SURVEY
Crimes not measured
5.1 Although the crime victimization survey provides information on crimes that are of major interest to the general public, it cannot measure all criminal activities as information on certain crimes cannot be obtained through this kind of survey technique. Those crimes not covered by the survey include the followings :
(a) crimes without specific victims; (b) crimes of which the victim may not be aware; (c) crimes of a delicate or personal nature; (d) crimes in which the victim has shown a willingness to participate; (e) crimes against commercial establishments.
Sampling and non-sampling error
5.2 Data from the crime victimization survey are subject to sampling errors arising from the fact that information was obtained from a sample of the population rather than a complete census. In addition to sampling errors, the estimates are subject to non-sampling errors. A major source of such errors was found on the part of respondents. They may fail to remember the incidents, recall incorrectly the date of occurrence of the incidents or may be just unwilling to report the victimizations even if they remember them.
Survey data versus police statistics
5.3 Comparison of data obtained from the crime victimization survey with police statistics is not strictly appropriate. The latter were obtained from administrative records whereas the former were obtained through a household survey which is subject to limitations as discussed above. Besides, there are substantial differences in coverage between the two sources. Personal crimes covered in the survey relate only to persons aged 12 and above, whereas police statistics include crimes against persons of any age. Moreover, the survey included only crimes against individual persons and households while all crimes against commercial establishments are excluded. In addition, the classification scheme for the two sources are not fully compatible. The crime victimization survey classified incidents based solely on information as reported by victims in a structural questionnaire, while more details on the incidents are. available for police in classifying crimes. There are also discrepancies in the counting rules and reference dates for these two sources.
6. FURTHER INFORMATION
6.1 More detailed statistics collected by the 1990 Crime Victimization Survey can be found in the report entitled "Crime and its Victims in Hong Kong 1989" published by the Census and Statistics Department.
120 Hong Kong Monthly Digest of Statistics January 1991