Special Education in Toronto and Ontario: An Overview
15
SPECIAL EDUCATION IN THE TDSB AND ONTARIO: An Overview, 2011-13 Research & Information Services Toronto District School Board 12/13-13
Transcript of Special Education in Toronto and Ontario: An Overview
SPECIAL EDUCATION IN THE TDSB AND ONTARIO:
An Overview, 2011-13
Research & Information Services Toronto District School Board
12/13-13
R08(SpecialEducationRpts\SpecialEducationRpt2013\Special Education in the TDSB and Ontario An Overview 2011-13)rbgp.1485
Special Education in the TDSB and Ontario: An Overview, 2011-13 Robert S. Brown, Lisa Newton, Gillian Parekh, and Hayley Zaretsky Copyright © (August 2013) Toronto District School Board
Reproduction of this document for use in the schools of the Toronto District School Board is encouraged.
For any other purpose, permission must be requested and obtained in writing from: Organizational Development/Research & Information Services Toronto District School Board 1 Civic Centre Court, Lower Level Etobicoke, ON M9C 2B3
Tel.: 416-394-4929 Fax: 416-394-4946 Every reasonable precaution has been taken to trace the owners of copyrighted material and to make due acknowledgement. Any omission will gladly be rectified in future printings.
SPECIAL EDUCATION IN THE TORONTO DISTRICT SCHOOL BOARD AND ONTARIO: AN OVERVIEW, 2011-13 1
EXECUTIVE SUMMARY
In order to better understand how Special Education trends compare across the province, records from the Ontario Ministry of
Education, Education Quality and Accountability Office (EQAO), and the Toronto District School Board (TDSB) were employed.
Part 1: Special Education Overview: Looking across the TDSB, the GTA, and across Ontario
The proportion of students in the TDSB identified with Special Education Needs (SEN) (excluding Gifted) is currently 14.4%. The
proportion of students identified with SEN in the TDSB is similar to that of the province (currently at 13.7%). The proportion of
students in full-time Gifted programs in the TDSB is seven times that of those in boards outside the GTA, with other GTA boards
falling somewhere in between. The proportion of students in the TDSB who are in full-time Special Education classes (excluding
Gifted) is over twice that of those in boards outside the GTA, with, again, the other GTA boards falling somewhere in between. The
proportion of students identified with SEN (excluding Gifted) who are taught in regular classes across the TDSB is less than half of
those compared to boards outside the GTA, with the other GTA boards, again, falling somewhere in between (see Figure 1 and Table
1).
Part 2: Board Information on Special Education Needs from EQAO
The proportion and number of students with Special Education Needs (excluding Gifted) in Grades 3, 6, and 10, excluding Gifted
were compared across the TDSB, key GTA boards, and across Ontario.1 The TDSB information for Grades 3, 6, and 10 is generally
similar to the province as a whole. The proportion of TDSB students with Special Education Needs is above the provincial average in
Grade 3, but below the provincial average by Grade 10. From the most recent EQAO information available (2011-12):
19% of TDSB students in Grade 3 were students with SEN (excluding Gifted), compared to 16% for Ontario.
20% of TDSB students in Grade 6 were students with SEN, the same as the province.
16% of TDSB students in Grade 10 were students with SEN, compared to 17% in the province.
1 EQAO web site
2 SPECIAL EDUCATION IN THE TORONTO DISTRICT SCHOOL BOARD AND ONTARIO: AN OVERVIEW, 2011-13
Part 3: Changes in Special Education Needs, 2008-09 to 2012-13
Over the past five years, the proportion of students with Special Education Needs in the TDSB has increased from 15.5% to 17.4%
including Gifted and 13.6% to 15.0% excluding Gifted. Due to a time lag in reporting Individual Education Plan (IEP) setting
information, the Ministry numbers are lower than those reported by the TDSB’s research department, which is continuously
updated to include students with an IEP.
In terms of overall numbers, the largest category of students with SEN was students who only had an IEP without a formal
identification of exceptionality. As a group, students who only had an IEP had the largest increase of 2,894 students. Students
identified as Gifted had an increase of 1,286 students. Other exceptionality groups were almost unchanged. Although there is an
increase of students formally identified with SEN, it would appear that the trend to inclusive education is increasing. While there are
1,064 fewer students with exceptionalities (excluding Gifted) in Special Education classes, there is an increase of 1,062 students with
exceptionalities (excluding Gifted) now being taught in regular classes.
SPECIAL EDUCATION IN THE TORONTO DISTRICT SCHOOL BOARD AND ONTARIO: AN OVERVIEW, 2011-13 3
PART 1: OVERVIEW OF SPECIAL EDUCATION PLACEMENTS AND IDENTIFICATIONS: LOOKING ACROSS THE TDSB, THE GTA, AND ACROSS ONTARIO
What This Is: Table 1 shows the overall number of TDSB students identified with exceptionalities who are taught in Special
Education Classes (where students spend at least 50% of the day) as well as in regular classes. Table 1 also shows students who only
have an IEP (no formal exceptionality) and the overall number/proportion of students who have not been identified with SEN.2
Figure 1 graphically shows SEN patterns. Table 2 addresses specific exceptionalities including students who only have an IEP.
Key Findings
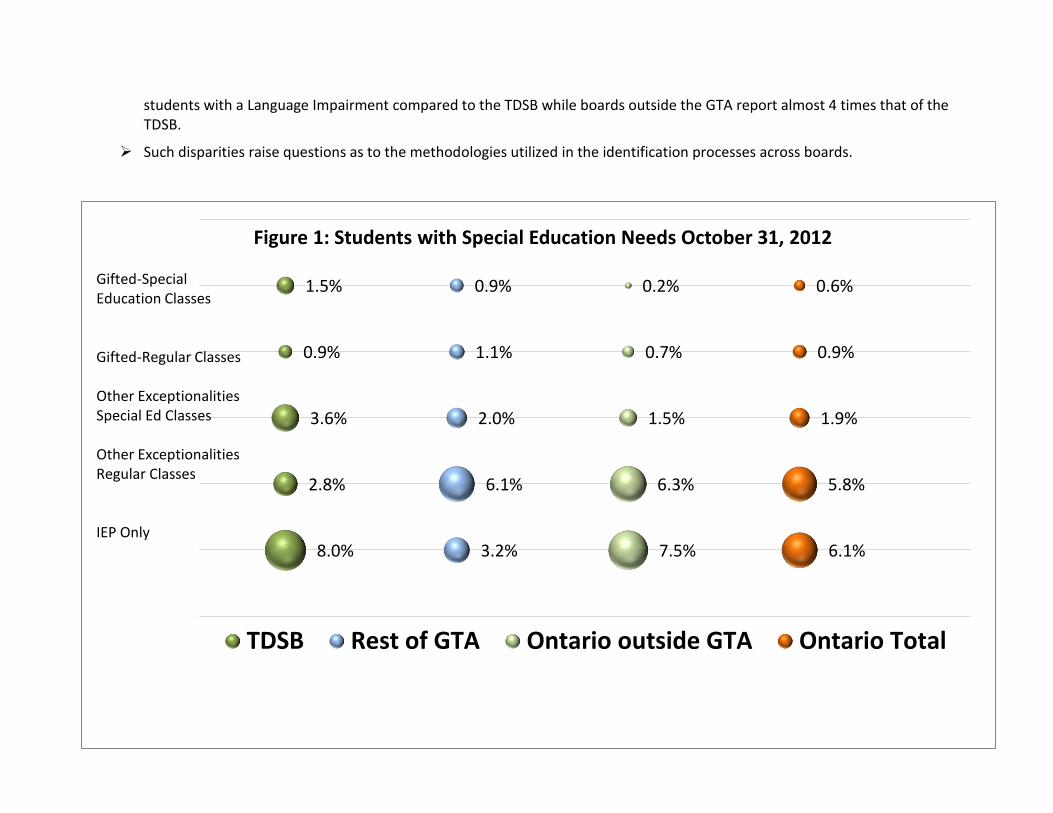
The proportion of students in the TDSB identified with SEN (excluding Gifted) is currently 14.4%. The proportion of students identified with SEN in the TDSB is similar to that of the province (currently at 13.7%)3.
The proportion of students in full-time Gifted programs in the TDSB is seven times that of those in full-time Gifted programs in boards outside the GTA, with other GTA boards falling somewhere in between (see Figure 1 and Table 1).
The proportion of students in the TDSB who are in full-time Special Education classes (excluding Gifted) is over twice that of those in boards outside the GTA, with the other GTA boards falling somewhere in between (see Figure 1 and Table 1 ).
The proportion of students identified with SEN (excluding Gifted) who are placed in general education classes across the TDSB is less than half of those compared to boards outside the GTA, with the other GTA boards, again, falling somewhere in between (see Figure 1 and Table 1).
The proportion of students in the TDSB who only have an IEP is similar to that of those outside the GTA; however, other GTA boards have a much lower proportion of students who only have an IEP than the TDSB.
The number of students identified with exceptionalities included in “Other” is almost non-existent in the TDSB yet accounts for 9% of all exceptionalities outside the GTA. From Fall 2006 data, we know that the TDSB reports few students with Multiple Exceptionalities yet this category is widely used outside of Toronto. In addition, there are relatively few students identified with a Language Impairment within the TDSB. However, other boards in the GTA report almost 8 times as many
2 Information from OnSIS, October 31, 2012, from Special Education Needs for the TDSB; for the nine boards in the GTA; for the rest of Ontario; and Ontario in total.
3 From information reported to the Ministry of Education as of October 31, 2012.
4 SPECIAL EDUCATION IN THE TORONTO DISTRICT SCHOOL BOARD AND ONTARIO: AN OVERVIEW, 2011-13
students with a Language Impairment compared to the TDSB while boards outside the GTA report almost 4 times that of the TDSB.
Such disparities raise questions as to the methodologies utilized in the identification processes across boards.
8.0%
2.8%
3.6%
0.9%
1.5%
3.2%
6.1%
2.0%
1.1%
0.9%
7.5%
6.3%
1.5%
0.7%
0.2%
6.1%
5.8%
1.9%
0.9%
0.6%
Figure 1: Students with Special Education Needs October 31, 2012
TDSB Rest of GTA Ontario outside GTA Ontario Total
Gifted-Special Education Classes Gifted-Regular Classes Other Exceptionalities Special Ed Classes Other Exceptionalities Regular Classes IEP Only
SPECIAL EDUCATION IN THE TORONTO DISTRICT SCHOOL BOARD AND ONTARIO: AN OVERVIEW, 2011-13 5
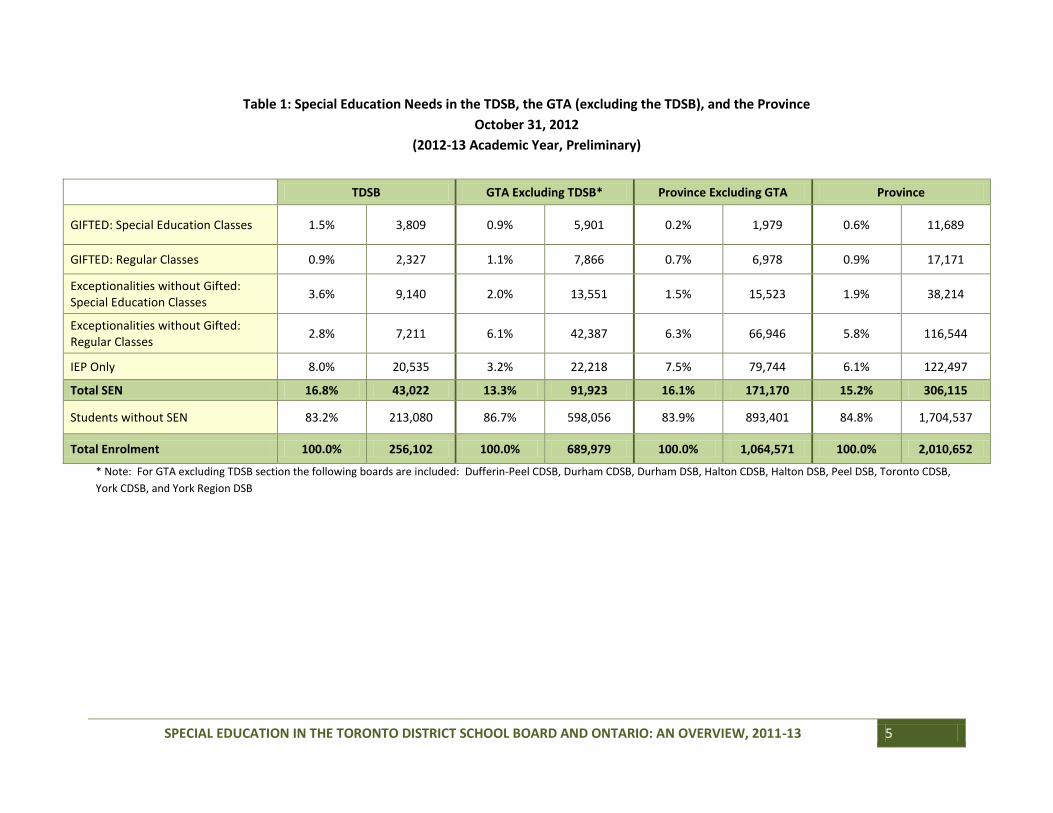
Table 1: Special Education Needs in the TDSB, the GTA (excluding the TDSB), and the Province
October 31, 2012
(2012-13 Academic Year, Preliminary)
TDSB GTA Excluding TDSB* Province Excluding GTA Province
GIFTED: Special Education Classes 1.5% 3,809 0.9% 5,901 0.2% 1,979 0.6% 11,689
GIFTED: Regular Classes 0.9% 2,327 1.1% 7,866 0.7% 6,978 0.9% 17,171
Exceptionalities without Gifted: Special Education Classes
3.6% 9,140 2.0% 13,551 1.5% 15,523 1.9% 38,214
Exceptionalities without Gifted: Regular Classes
2.8% 7,211 6.1% 42,387 6.3% 66,946 5.8% 116,544
IEP Only 8.0% 20,535 3.2% 22,218 7.5% 79,744 6.1% 122,497
Total SEN 16.8% 43,022 13.3% 91,923 16.1% 171,170 15.2% 306,115
Students without SEN 83.2% 213,080 86.7% 598,056 83.9% 893,401 84.8% 1,704,537
Total Enrolment 100.0% 256,102 100.0% 689,979 100.0% 1,064,571 100.0% 2,010,652
* Note: For GTA excluding TDSB section the following boards are included: Dufferin-Peel CDSB, Durham CDSB, Durham DSB, Halton CDSB, Halton DSB, Peel DSB, Toronto CDSB,
York CDSB, and York Region DSB
6 SPECIAL EDUCATION IN THE TORONTO DISTRICT SCHOOL BOARD AND ONTARIO: AN OVERVIEW, 2011-13
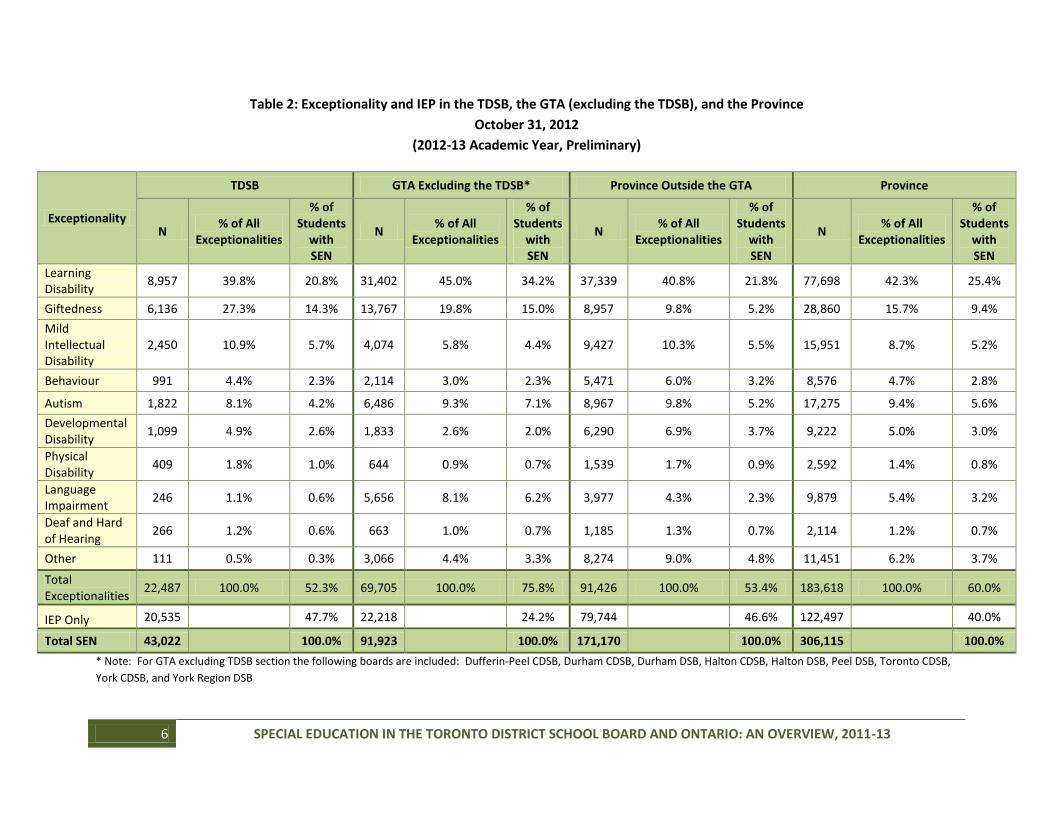
Table 2: Exceptionality and IEP in the TDSB, the GTA (excluding the TDSB), and the Province
October 31, 2012
(2012-13 Academic Year, Preliminary)
Exceptionality
TDSB GTA Excluding the TDSB* Province Outside the GTA Province
N % of All
Exceptionalities
% of Students
with SEN
N % of All
Exceptionalities
% of Students
with SEN
N % of All
Exceptionalities
% of Students
with SEN
N % of All
Exceptionalities
% of Students
with SEN
Learning Disability
8,957 39.8% 20.8% 31,402 45.0% 34.2% 37,339 40.8% 21.8% 77,698 42.3% 25.4%
Giftedness 6,136 27.3% 14.3% 13,767 19.8% 15.0% 8,957 9.8% 5.2% 28,860 15.7% 9.4%
Mild Intellectual Disability
2,450 10.9% 5.7% 4,074 5.8% 4.4% 9,427 10.3% 5.5% 15,951 8.7% 5.2%
Behaviour 991 4.4% 2.3% 2,114 3.0% 2.3% 5,471 6.0% 3.2% 8,576 4.7% 2.8%
Autism 1,822 8.1% 4.2% 6,486 9.3% 7.1% 8,967 9.8% 5.2% 17,275 9.4% 5.6%
Developmental Disability
1,099 4.9% 2.6% 1,833 2.6% 2.0% 6,290 6.9% 3.7% 9,222 5.0% 3.0%
Physical Disability
409 1.8% 1.0% 644 0.9% 0.7% 1,539 1.7% 0.9% 2,592 1.4% 0.8%
Language Impairment
246 1.1% 0.6% 5,656 8.1% 6.2% 3,977 4.3% 2.3% 9,879 5.4% 3.2%
Deaf and Hard of Hearing
266 1.2% 0.6% 663 1.0% 0.7% 1,185 1.3% 0.7% 2,114 1.2% 0.7%
Other 111 0.5% 0.3% 3,066 4.4% 3.3% 8,274 9.0% 4.8% 11,451 6.2% 3.7%
Total Exceptionalities
22,487 100.0% 52.3% 69,705 100.0% 75.8% 91,426 100.0% 53.4% 183,618 100.0% 60.0%
IEP Only 20,535
47.7% 22,218
24.2% 79,744
46.6% 122,497
40.0%
Total SEN 43,022
100.0% 91,923
100.0% 171,170
100.0% 306,115
100.0%
* Note: For GTA excluding TDSB section the following boards are included: Dufferin-Peel CDSB, Durham CDSB, Durham DSB, Halton CDSB, Halton DSB, Peel DSB, Toronto CDSB,
York CDSB, and York Region DSB
SPECIAL EDUCATION IN THE TORONTO DISTRICT SCHOOL BOARD AND ONTARIO: AN OVERVIEW, 2011-13 7
PART 2: BOARD INFORMATION ON SPECIAL EDUCATION NEEDS FROM EQAO
Students with SEN are students who have been identified with an Exceptionality (e.g., Gifted, Learning Disability, etc.) or students
who have an Individual Education Plan.
To compare proportion and number of students with SEN (excluding Gifted) across district school boards, it is best to examine EQAO
information for Grades 3, 6, and 10.
Generally, the TDSB information for Grades 3, 6, and 10 is similar to the province. The proportion of TDSB students with SEN is
above the provincial average in Grade 3, but below the provincial average by Grade 10. From the most recent EQAO information
available (2011-12):
19% of TDSB students in Grade 3 were students identified with SEN (excluding Gifted), compared to 16% for all of Ontario.
20% of TDSB students in Grade 6 were students identified with SEN, the same as the province.
16% of TDSB students in Grade 10 were students identified with SEN, compared to 17% in the province.
Note that the proportion of students with SEN increases between Grades 3 and 6, but declines by Grade 10 (Ontario Secondary
School Literacy Test [OSSLT]) - both in the province and in the TDSB
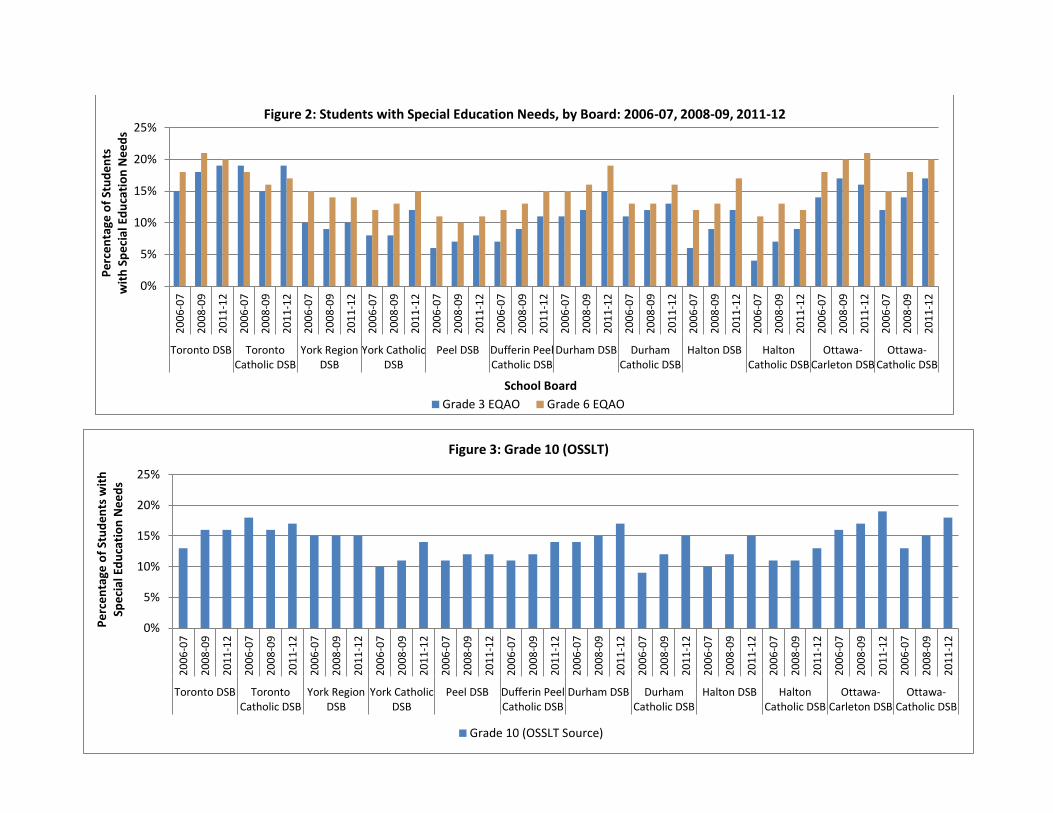
Figures 2 and 3 show proportion of students with SEN (excluding Gifted) from the TDSB compared to other school boards in the GTA
and Ottawa over three years: 2006-07, 2007-08, and 2011-12.
In Figure 2, the blue lines represent Grade 3 while the brown lines represent Grade 6. Figure 2 demonstrates OSSLT figures. The
data indicates that the proportion of TDSB students identified with SEN for Grades 3, 6, and 10 do not greatly differ from many other
public boards.
8 SPECIAL EDUCATION IN THE TORONTO DISTRICT SCHOOL BOARD AND ONTARIO: AN OVERVIEW, 2011-13
0%
5%
10%
15%
20%
25%
20
06
-07
20
08
-09
20
11
-12
20
06
-07
20
08
-09
20
11
-12
20
06
-07
20
08
-09
20
11
-12
20
06
-07
20
08
-09
20
11
-12
20
06
-07
20
08
-09
20
11
-12
20
06
-07
20
08
-09
20
11
-12
20
06
-07
20
08
-09
20
11
-12
20
06
-07
20
08
-09
20
11
-12
20
06
-07
20
08
-09
20
11
-12
20
06
-07
20
08
-09
20
11
-12
20
06
-07
20
08
-09
20
11
-12
20
06
-07
20
08
-09
20
11
-12
Toronto DSB TorontoCatholic DSB
York RegionDSB
York CatholicDSB
Peel DSB Dufferin PeelCatholic DSB
Durham DSB DurhamCatholic DSB
Halton DSB HaltonCatholic DSB
Ottawa-Carleton DSB
Ottawa-Catholic DSB
Pe
rce
nta
ge o
f St
ud
en
ts w
ith
Sp
eci
al E
du
cati
on
Ne
ed
s
Figure 3: Grade 10 (OSSLT)
Grade 10 (OSSLT Source)
0%
5%
10%
15%
20%
25%
20
06
-07
20
08
-09
20
11
-12
20
06
-07
20
08
-09
20
11
-12
20
06
-07
20
08
-09
20
11
-12
20
06
-07
20
08
-09
20
11
-12
20
06
-07
20
08
-09
20
11
-12
20
06
-07
20
08
-09
20
11
-12
20
06
-07
20
08
-09
20
11
-12
20
06
-07
20
08
-09
20
11
-12
20
06
-07
20
08
-09
20
11
-12
20
06
-07
20
08
-09
20
11
-12
20
06
-07
20
08
-09
20
11
-12
20
06
-07
20
08
-09
20
11
-12
Toronto DSB TorontoCatholic DSB
York RegionDSB
York CatholicDSB
Peel DSB Dufferin PeelCatholic DSB
Durham DSB DurhamCatholic DSB
Halton DSB HaltonCatholic DSB
Ottawa-Carleton DSB
Ottawa-Catholic DSB
Pe
rce
nta
ge o
f St
ud
en
ts
wit
h S
pe
cial
Ed
uca
tio
n N
ee
ds
School Board
Figure 2: Students with Special Education Needs, by Board: 2006-07, 2008-09, 2011-12
Grade 3 EQAO Grade 6 EQAO
SPECIAL EDUCATION IN THE TORONTO DISTRICT SCHOOL BOARD AND ONTARIO: AN OVERVIEW, 2011-13 9
PART 3A: CHANGES IN SPECIAL EDUCATION NEEDS, 2008-09 TO 2012-13
In Table 3, all students in the TDSB are listed in one of the following categories4:
Gifted exceptionality (Special Education and Regular classes);
Exceptionalities (excluding Gifted) (Special Education and Regular classes);
Students with an Individual Education Plan (IEP) only; and
Students without Special Education Needs.
Table 4 shows increases and decreases (both in total numbers and percentages) of students in the previously mentioned categories
between the 2008-09 and 2012-13 school years.
Over the past five years, the proportion of students with Special Education Needs (SEN) in the TDSB has increased from 15.5% to
17.4% including Gifted and 13.6% to 15.0% excluding Gifted. Due to a time lag in reporting IEP setting information, the Ministry
numbers are lower than those reported by the TDSB’s research department, which is continuously updated to include students with
an IEP.
In terms of overall numbers, the largest category of students with SEN was students who only had an IEP without a formal
identification of exceptionality. As a group, students who only had an IEP had the largest increase of 2,894 students. Students
identified as Gifted had an increase of 1,286 students. Other exceptionality groups were almost unchanged. Although there is an
increase of students formally identified with SEN, it would appear that the trend to inclusive education is increasing. While there are
1,064 fewer students with exceptionalities (excluding Gifted) in Special Education classes, there is an increase of 1,062 students with
exceptionalities (excluding Gifted) now being taught in regular classes.
4 Information from the Organizational Development/Research & Information Services’ Business Analytics department was used for all Toronto District School Board students
present as of October 31 over five years (October 31, 2008 through October 31, 2012).
Excluding Gifted. Source: EQAO
10 SPECIAL EDUCATION IN THE TORONTO DISTRICT SCHOOL BOARD AND ONTARIO: AN OVERVIEW, 2011-13
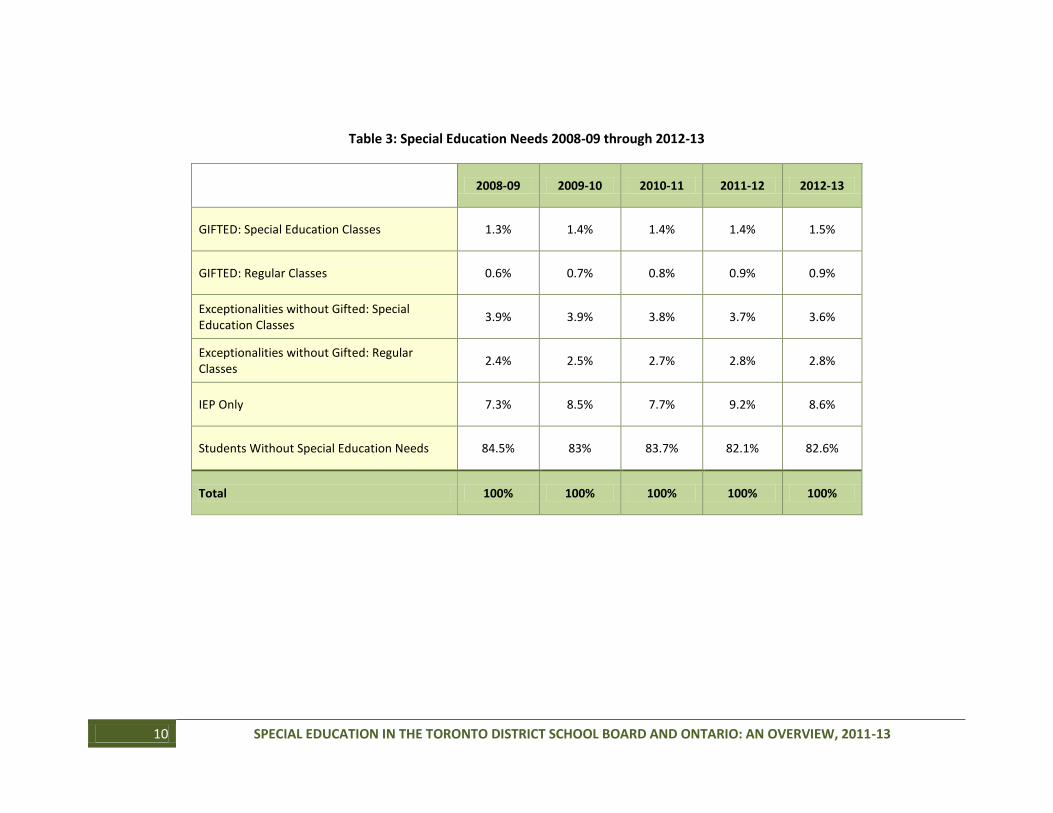
Table 3: Special Education Needs 2008-09 through 2012-13
2008-09 2009-10 2010-11 2011-12 2012-13
GIFTED: Special Education Classes 1.3% 1.4% 1.4% 1.4% 1.5%
GIFTED: Regular Classes 0.6% 0.7% 0.8% 0.9% 0.9%
Exceptionalities without Gifted: Special Education Classes
3.9% 3.9% 3.8% 3.7% 3.6%
Exceptionalities without Gifted: Regular Classes
2.4% 2.5% 2.7% 2.8% 2.8%
IEP Only 7.3% 8.5% 7.7% 9.2% 8.6%
Students Without Special Education Needs 84.5% 83% 83.7% 82.1% 82.6%
Total 100% 100% 100% 100% 100%
SPECIAL EDUCATION IN THE TORONTO DISTRICT SCHOOL BOARD AND ONTARIO: AN OVERVIEW, 2011-13 11
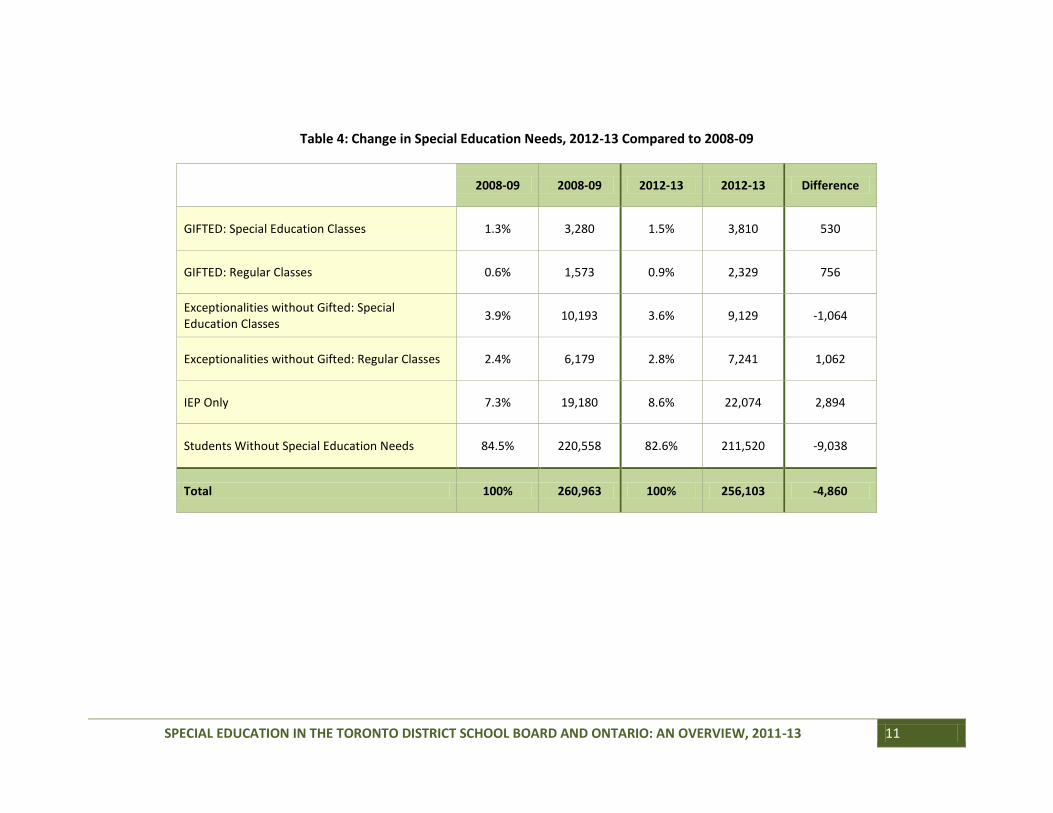
Table 4: Change in Special Education Needs, 2012-13 Compared to 2008-09
2008-09 2008-09 2012-13 2012-13 Difference
GIFTED: Special Education Classes 1.3% 3,280 1.5% 3,810 530
GIFTED: Regular Classes 0.6% 1,573 0.9% 2,329 756
Exceptionalities without Gifted: Special Education Classes
3.9% 10,193 3.6% 9,129 -1,064
Exceptionalities without Gifted: Regular Classes 2.4% 6,179 2.8% 7,241 1,062
IEP Only 7.3% 19,180 8.6% 22,074 2,894
Students Without Special Education Needs 84.5% 220,558 82.6% 211,520 -9,038
Total 100% 260,963 100% 256,103 -4,860
12 SPECIAL EDUCATION IN THE TORONTO DISTRICT SCHOOL BOARD AND ONTARIO: AN OVERVIEW, 2011-13
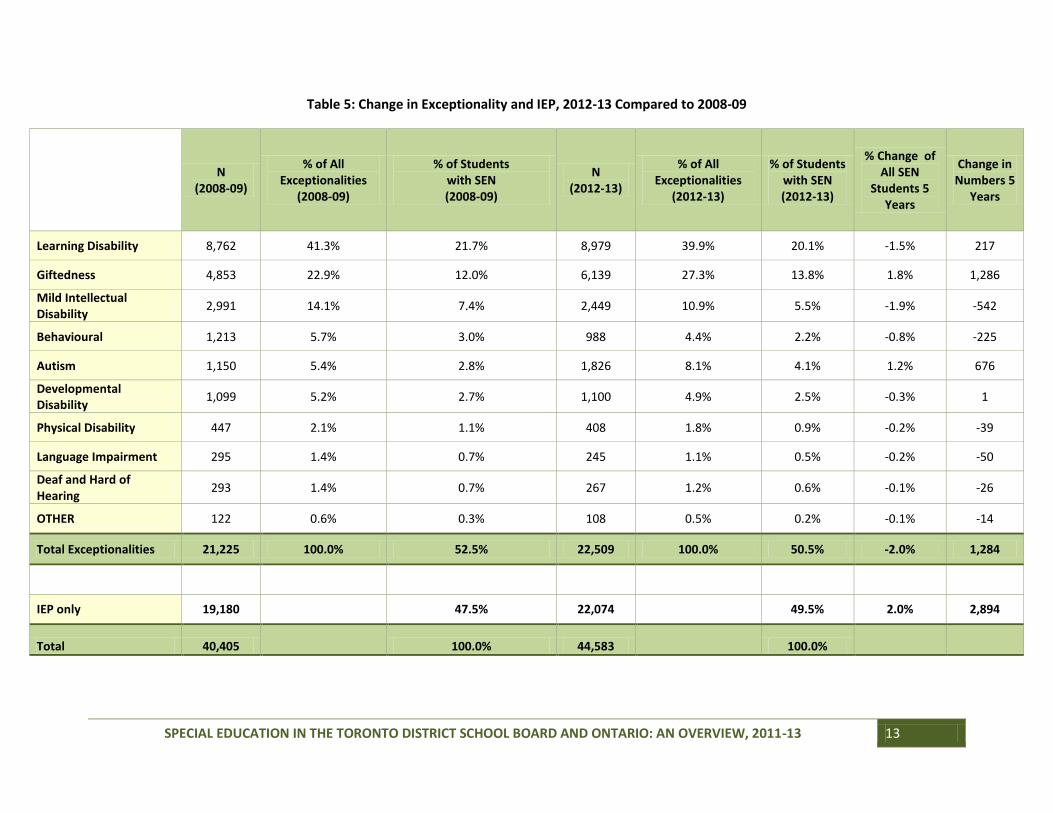
PART 3B: EXCEPTIONALITY CHANGES
Table 5 shows changes within specific exceptionality categories over five years. The population of students identified with SEN is
now divided between students who have been formally identified with exceptionalities and students who only have an IEP and no
formal identification. Table 5 shows changes between 2008-09 and 2012-13 for students in each category including the proportion
of the exceptionality out of all exceptionalities, and then the proportion of the exceptionality out of all students identified with SEN.
Overall, there has been an increase of 4,178 students identified with SEN – 1,284 students with exceptionalities and 2,894 students
who only have an IEP. Of exceptionality groups, the largest increases were Gifted (1,286), Autism (676), and Learning Disability
(217). The largest decreases were experienced in the following categories: Mild Intellectual Disability (542), Behavioral (225),
Language Impairment (50), Physical Disability (39), and Deaf/Hard of Hearing (26).
SPECIAL EDUCATION IN THE TORONTO DISTRICT SCHOOL BOARD AND ONTARIO: AN OVERVIEW, 2011-13 13
Table 5: Change in Exceptionality and IEP, 2012-13 Compared to 2008-09
N
(2008-09)
% of All Exceptionalities
(2008-09)
% of Students with SEN (2008-09)
N (2012-13)
% of All Exceptionalities
(2012-13)
% of Students with SEN (2012-13)
% Change of All SEN
Students 5 Years
Change in Numbers 5
Years
Learning Disability 8,762 41.3% 21.7% 8,979 39.9% 20.1% -1.5% 217
Giftedness 4,853 22.9% 12.0% 6,139 27.3% 13.8% 1.8% 1,286
Mild Intellectual Disability
2,991 14.1% 7.4% 2,449 10.9% 5.5% -1.9% -542
Behavioural 1,213 5.7% 3.0% 988 4.4% 2.2% -0.8% -225
Autism 1,150 5.4% 2.8% 1,826 8.1% 4.1% 1.2% 676
Developmental Disability
1,099 5.2% 2.7% 1,100 4.9% 2.5% -0.3% 1
Physical Disability 447 2.1% 1.1% 408 1.8% 0.9% -0.2% -39
Language Impairment 295 1.4% 0.7% 245 1.1% 0.5% -0.2% -50
Deaf and Hard of Hearing
293 1.4% 0.7% 267 1.2% 0.6% -0.1% -26
OTHER 122 0.6% 0.3% 108 0.5% 0.2% -0.1% -14
Total Exceptionalities 21,225 100.0% 52.5% 22,509 100.0% 50.5% -2.0% 1,284
IEP only 19,180
47.5% 22,074
49.5% 2.0% 2,894
Total 40,405
100.0% 44,583
100.0%