Speaker Detection and Conversation Analysis on Mobile Devices
71
FAKULTÄT FÜR INFORMATIK TECHNISCHE UNIVERSITÄT MÜNCHEN Master’s Thesis in Informatics Speaker Detection and Conversation Analysis on Mobile Devices Wahib Wahib-Ul-Haq
Transcript of Speaker Detection and Conversation Analysis on Mobile Devices

FAKULTÄT FÜR INFORMATIKTECHNISCHE UNIVERSITÄT MÜNCHEN
Master’s Thesis in Informatics
Speaker Detection and ConversationAnalysis on Mobile Devices
Wahib Wahib-Ul-Haq

FAKULTÄT FÜR INFORMATIKTECHNISCHE UNIVERSITÄT MÜNCHEN
Master’s Thesis in Informatics
Speaker Detection and ConversationAnalysis on Mobile Devices
Gesprächspersonerkennung undKonversationsanalyse auf Mobilgeräten
Author: Wahib Wahib-Ul-HaqSupervisor: Dr. Georg GrohAdvisor: Florian SchulzeSubmission Date: 15.05.2015

I assure the single handed composition of this master’s thesis in informatics onlysupported by declared resources.
Munich, 15.05.2015 Wahib Wahib-Ul-Haq

Acknowledgments
I would like to express my gratitude to Dr. Georg Groh who has provided me anopportunity to work on this thesis. I would also like to express my sincerest gratitudeto my advisor, Florian Schulze for his indispensable guidance during the execution ofthe Master Thesis. He has been extremely helpful, motivating and accommodatingthroughout the process.
I would also like to thank my beloved wife, Hira Sheikh who helped me witheverything related to latex and my friend, Ankitaa Bhowmick for the constant support.Lastly, I would like to thank my family and close friends for their encouragement andconfidence that have helped me so much during this period.

Abstract
This thesis topic presents design, implementation and evaluation of real-time voiceactivity detection system on the conversation, recorded by a smartphone to potentiallyidentify its owner. The findings and deliverable would become a basis for future workin smart mobile interruption management.
The project is implemented as an Android application and works in two modes.In autonomous mode, processing is performed on smartphone only while in servermode, recognition is done by transmitting extracted feature vectors to a server andreceiving classification results in response. We evaluated both modes with specialattention given to investigating battery consumption, phone CPU load and memoryaccumulated solely by this application. One of the implicit aims is also to look intomobile specific computational limits and understand the feasibility of executing audioanalysis processes on Android in autonomous mode. The comparison and evaluationfor two approaches of calculating Fast Fourier Transform in feature extraction processhave also been done. Finally, audio probing strategy has been proposed which limit thenumber of computations and offers an efficient approach for detecting idle, speech andspeaker modes.
iv

Contents
Acknowledgments iii
Abstract iv
1 Introduction 11.1 Overview . . . . . . . . . . . . . . . . . . . . . . . . . . . . . . . . . . . . 1
1.1.1 Voice Activity Detection . . . . . . . . . . . . . . . . . . . . . . . . 21.1.2 Speaker Recognition . . . . . . . . . . . . . . . . . . . . . . . . . . 3
1.2 Objective . . . . . . . . . . . . . . . . . . . . . . . . . . . . . . . . . . . . . 41.2.1 Proposed Work . . . . . . . . . . . . . . . . . . . . . . . . . . . . . 41.2.2 Process Flow . . . . . . . . . . . . . . . . . . . . . . . . . . . . . . 61.2.3 Concerns . . . . . . . . . . . . . . . . . . . . . . . . . . . . . . . . . 7
1.3 Outline . . . . . . . . . . . . . . . . . . . . . . . . . . . . . . . . . . . . . . 7
2 Fundamentals 92.1 Android . . . . . . . . . . . . . . . . . . . . . . . . . . . . . . . . . . . . . 9
2.1.1 Services . . . . . . . . . . . . . . . . . . . . . . . . . . . . . . . . . 92.1.2 Multithreading . . . . . . . . . . . . . . . . . . . . . . . . . . . . . 11
2.2 Feature Extraction . . . . . . . . . . . . . . . . . . . . . . . . . . . . . . . . 112.2.1 MFCC . . . . . . . . . . . . . . . . . . . . . . . . . . . . . . . . . . 11
2.2.1.1 Pre-Emphasis . . . . . . . . . . . . . . . . . . . . . . . . . 122.2.1.2 Frame Blocking and Windowing . . . . . . . . . . . . . 132.2.1.3 Fast Fourier Transform (FFT) . . . . . . . . . . . . . . . 142.2.1.4 Mel-spaced filter bank . . . . . . . . . . . . . . . . . . . 152.2.1.5 Cepstral Analysis . . . . . . . . . . . . . . . . . . . . . . 16
2.3 Machine learning approaches . . . . . . . . . . . . . . . . . . . . . . . . . 162.3.1 Random Forest . . . . . . . . . . . . . . . . . . . . . . . . . . . . . 172.3.2 Neural Network . . . . . . . . . . . . . . . . . . . . . . . . . . . . 18
2.4 Evaluation Metrics and Procedures . . . . . . . . . . . . . . . . . . . . . . 192.4.1 Mobile resources consumption . . . . . . . . . . . . . . . . . . . . 19
2.4.1.1 Battery level . . . . . . . . . . . . . . . . . . . . . . . . . 192.4.1.2 CPU usage . . . . . . . . . . . . . . . . . . . . . . . . . . 192.4.1.3 Memory usage . . . . . . . . . . . . . . . . . . . . . . . . 20
v

Contents
3 Contributions of the Present Work 213.1 Architecture . . . . . . . . . . . . . . . . . . . . . . . . . . . . . . . . . . . 213.2 Android Implementation details . . . . . . . . . . . . . . . . . . . . . . . 223.3 Audio Probing . . . . . . . . . . . . . . . . . . . . . . . . . . . . . . . . . . 24
3.3.1 Background . . . . . . . . . . . . . . . . . . . . . . . . . . . . . . . 243.3.2 Methodology . . . . . . . . . . . . . . . . . . . . . . . . . . . . . . 253.3.3 Reasoning . . . . . . . . . . . . . . . . . . . . . . . . . . . . . . . . 26
3.3.3.1 Idle State . . . . . . . . . . . . . . . . . . . . . . . . . . . 263.3.3.2 Speech State . . . . . . . . . . . . . . . . . . . . . . . . . 273.3.3.3 Speaker State . . . . . . . . . . . . . . . . . . . . . . . . . 28
3.4 Front-end processing . . . . . . . . . . . . . . . . . . . . . . . . . . . . . . 283.4.1 Background . . . . . . . . . . . . . . . . . . . . . . . . . . . . . . . 283.4.2 Methodology . . . . . . . . . . . . . . . . . . . . . . . . . . . . . . 293.4.3 Implementation . . . . . . . . . . . . . . . . . . . . . . . . . . . . . 30
3.4.3.1 Cooley–Tukey FFT . . . . . . . . . . . . . . . . . . . . . . 303.4.3.2 Superpowered FFT . . . . . . . . . . . . . . . . . . . . . 31
3.4.4 Evaluation and Results . . . . . . . . . . . . . . . . . . . . . . . . 313.4.4.1 Mobile device specifications . . . . . . . . . . . . . . . . 313.4.4.2 Runtime conditions . . . . . . . . . . . . . . . . . . . . . 323.4.4.3 Execution time . . . . . . . . . . . . . . . . . . . . . . . . 323.4.4.4 Energy Considerations . . . . . . . . . . . . . . . . . . . 34
Simulation . . . . . . . . . . . . . . . . . . . . . . . . . . . . 34Battery level . . . . . . . . . . . . . . . . . . . . . . . . . . . 35CPU Usage . . . . . . . . . . . . . . . . . . . . . . . . . . . 37Memory usage . . . . . . . . . . . . . . . . . . . . . . . . . 39
3.5 Voice Activity Detection . . . . . . . . . . . . . . . . . . . . . . . . . . . . 413.5.1 Background . . . . . . . . . . . . . . . . . . . . . . . . . . . . . . . 413.5.2 Implementation details . . . . . . . . . . . . . . . . . . . . . . . . 423.5.3 Feature Preparation . . . . . . . . . . . . . . . . . . . . . . . . . . 423.5.4 Dataset . . . . . . . . . . . . . . . . . . . . . . . . . . . . . . . . . . 433.5.5 Classification . . . . . . . . . . . . . . . . . . . . . . . . . . . . . . 44
3.5.5.1 Related Work . . . . . . . . . . . . . . . . . . . . . . . . . 443.5.5.2 Training and testing phase . . . . . . . . . . . . . . . . . 443.5.5.3 Evaluation and Results . . . . . . . . . . . . . . . . . . . 45
Energy consideration . . . . . . . . . . . . . . . . . . . . . . 453.6 Communication with server . . . . . . . . . . . . . . . . . . . . . . . . . . 49
3.6.1 Background . . . . . . . . . . . . . . . . . . . . . . . . . . . . . . . 493.6.2 Methodology . . . . . . . . . . . . . . . . . . . . . . . . . . . . . . 493.6.3 Implementation . . . . . . . . . . . . . . . . . . . . . . . . . . . . . 49
vi

Contents
3.6.4 Evaluation and Results . . . . . . . . . . . . . . . . . . . . . . . . 503.6.4.1 Energy consideration . . . . . . . . . . . . . . . . . . . . 50
Battery level . . . . . . . . . . . . . . . . . . . . . . . . . . . 50CPU Usage . . . . . . . . . . . . . . . . . . . . . . . . . . . 51Memory usage . . . . . . . . . . . . . . . . . . . . . . . . . 51
4 Summary and Outlook 534.1 Summary . . . . . . . . . . . . . . . . . . . . . . . . . . . . . . . . . . . . . 534.2 Outlook . . . . . . . . . . . . . . . . . . . . . . . . . . . . . . . . . . . . . . 54
List of Figures 55
List of Tables 57
Bibliography 58
vii
1 Introduction
For the first time, more than one-quarter of the global population will use smartphonesin 2015. The number of smartphone users worldwide will surpass 2 billion in 2016,according to new figures [1] .Now, the rapid rise of mobile devices is creating arequirement of intelligent interruption management.
Speech is an essential part of human communication. It is our simplest and mostfrequently used means of conveying and receiving information between humans. Thesound is a rich source of information that can be used to infer a person’s context indaily life. If pattern recognition is applied to sound data from human conversations,we can know a lot more about the nature of the conversation.
This Master Thesis was connected to the Ph.D. thesis [2] of my advisor at TUM.The aim of his research is to analyze the character of a conversation to determine thereceptivity state to mobile notifications for the user. Voice Activity Detection (VAD)and Speaker Recognition (SR) are the most important phases which further leads toCharacter/Emotion Recognition of the conversation. This thesis, in particular, focuseson design, implementation and challenges involved with doing speech operationson the mobile device that provides the audio input to the server pipeline [3]. Thebasic motivation behind this thesis is to design, implement and evaluate Voice ActivityDetection operations on the mobile device with a special focus on energy considerations.
1.1 Overview
The human voice encodes a wealth of information about emotion, mood, and mentalstate. As the user base of the smartphones have become mammoth[1] connectedapproaches have raised new problems and concerns. One of these concerns dealswith the following question: “In which situations should an owner be interruptedby the smartphone ?”. This interruption can be in the form of notification due to anincoming call, SMS or from any other application connected via internet, e.g., Facebook,WhatsApp, Viber, etc. A General approach [4] uses location context, calendar eventsand call logs to set certain restrictions (e.g.,) if in office premises then the phone shouldautomatically go in silent mode. Another way to evaluate the current situation of theuser is to consider owner’s emotional state. Emotions always play a very importantrole and considered as a medium of expression for one’s perspective or mental state.
1

1 Introduction
There are few universal emotions [5] viz. Neutral, Anger, Surprise, Fear, Happiness,Sadness. Such emotions can be pre-set to a boolean whether an interruption is allowedor not. For instance, if the owner is found with an angry tone, it reflects a heatedconversation and user shouldn’t be interrupted by the phone. Voice Activity Detectionand Target Speaker Identification on the server was already developed as described in[14] and considerable work on Emotion Recognition using audio files as input was alsofunctional as described in [3].
With mobile phones, this useful information is potentially available for analysis.Inferring user context using microphones has some advantages as compared to othermodalities: microphones are cheap, available in many wearable devices (such assmartphones) and work even if partly cloaked[6]. However, for implementation onsmartphone various design choices are required because of its resource intensive nature.For example, audio analysis operations could be realized by processing directly onthe phone, or by offloading the context processing to a server. Moreover, recognitiondelay, accuracy, memory consumption, battery consumption and CPU load are key todetermine the practicality of this approach.
In this work, a real-time voice activity detection has been proposed that works onan Android smartphone. We present the system design and its implementation in twomodes. In autonomous mode, the system is executed on the smartphone only and inserver mode, the recognition is done by transmitting extracted features to a server andreceiving classification results in response. Different approaches to extract features havebeen used and compared with each other. For evaluation, all approaches or modeshave been compared with reference to Battery usage, Memory usage, CPU usage, andrecognition time when running on different smartphone models.
1.1.1 Voice Activity Detection
Voice activity detection (VAD) in the presence of heavy, dynamic noise is a challengingproblem that has been a center of attention for researchers in recent years. In simplewords, VAD refers to the problem of identifying the speech and non-speech segments inan audio signal. It is a vital front-end of modern speech signal processing systems [7].With the increasing research focus on speech recognition [8], the machine learning basedVAD techniques are becoming more and more widely used now [9]. The VAD decisionis based on a feature vector x and it is usually language independent. In our casefor autonomous mode, the model is pre-trained using TIMIT and BuckEye corpus(withnoises mixed externally) based on Random Forest Classifier as classification techniqueto identify voiced region in a speech. To make it work, MFCC features are extractedfrom recorded audio signals and then used to distinguish voiced sections from unvoicedsections in speech. Features are extracted using various probing strategies that vary
2

1 Introduction
in frame size but have a constant frame step of 10ms ft. VAD system detail designexplained in Figure 1.1.
Figure 1.1: Voice Activity detection and Speaker Recognition.
1.1.2 Speaker Recognition
Speech signals also contain sufficient information about the identity of the speaker.Speaker Recognition (SR) mainly deals with extracting the identity of the speaker andmodeling the speaker-dependent characteristics of the speech signal that can effectivelydistinguish one person from another. Because of the physical properties of the humanvocal tract, larynx, and other production organs, no two human beings can haveidentical sound. SR techniques have been studied for several decades, and it is nowwidely used in smartphones in successful applications ranging from identifying theowner for the purpose of security [10] or as an alternate interface for interaction [11].
The general area of SR is divided into two operational modes : enrollment andrecognition. In the enrollment mode, features are extracted from speech signals, anda speaker model is generated and stored in a speaker database. This model is laterused to recognize a particular speaker by matching with a provided unknown speechsample. Recognition mode is further composed of two main components : identificationand verification. In verification mode, the goal is to determine from a voice sample if aperson is who he or she claims to be. In speaker identification, the goal is to determine
3

1 Introduction
which one of a group of known voices best matches the input voice sample. The voicedregion as detected by VAD system 1.1.1 sets the stage for target speaker identification.Predicted voiced regions are segmented and act as an enabler in identifying targetspeaker.
1.2 Objective
The main objective of the thesis is to investigate the feasibility of constant audio probing,recording audio and speech detection while all these operations are completely executedon the phone and also delegated to the server. In this context, the speaker is the ownerof the smartphone who is a part of the conversation that is recorded.
In order to achieve the objectives, a complete infrastructure is required. Serverend is already working, and this thesis focuses on mobile application and also thecommunication interface between server and the mobile application. The qualityof implementation is a measure of how efficiently all these operations run on thesmartphone. Special focus is given to code optimization, best practices, and necessarydesign patterns.
In reality, a conversation can occur at any possible location and thus, the applicationneeds to be in ‘always listening’ mode. But we also know that conversation can’t occurall the time and frequent gaps can also exist in one conversation. This requirementhas influenced the architecture and best effort is made to make it robust and resourceefficient while constantly probing for audio with delays in an intelligent way.
1.2.1 Proposed Work
We propose implementation for Android OS, which has the highest share of smart-phones worldwide [12]. This thesis contributes in the following way on mobile end:
• Audio Probing and Recording: It presents and implements concrete audio probingstrategy to avoid constant recording and helps in using resources in a moreefficient way by introducing frequent delays.
• Feature Extraction: It record audio, extracts mel-frequency cepstral coefficients(MFCCs) features from each frame, add buffer overlay and generate completevector array with time deltas. It also implements two different approaches forFast Fourier Transform (FFT) phase of MFCCs feature extraction.
• Integration of modules in a single system: VAD module is a prerequisite to SRmodule and extremely important. This thesis integrates individual modules along
4

1 Introduction
with VAD in a single system that has a potential to be extended in future workfor SR.
• It implements two modes of execution : autonomous (all operations executedon phone) and server mode (extracted MFCCs feature vectors sent to server tocontinue with server pipeline). Communication mechanism (web-service) and theserver component to receive vectors was also implemented as part of the thesis.
• Monitoring: It also implements monitoring mode which helps in investigating andanalyzing resource usage. It constantly dumps data regarding battery consump-tion, memory usage and CPU usage on the mobile device while performing alloperations. It was meant to help in doing feasibility study and understandingbottlenecks and challenges involved with speech processing operations on mobiledevices.
5

1 Introduction
1.2.2 Process Flow
Speaking about the process flow, focus is on autonomous mode and server mode as shownin Figure 1.2 and 1.3. On a more detailed level, Figure 1.1 explains how featureextraction, VAD and Speaker Recognition works. The following describes the modularprocess flow showing which steps would occur in a sequence on the android phoneand the server. Android application runs as Service1which runs in background becauseall these operations don’t require constant user interaction.
Figure 1.2: Autonomous Mode pipeline.
1Service in Android application development is referred as application component that can performlong-running operations in the background and does not provide a user interface.
6

1 Introduction
Figure 1.3: Server Mode Pipeline.
1.2.3 Concerns
As any other audio analysis applications on the smartphone, our work is also affectedby certain challenges. It can include the phone’s physical environment and noisepollution e.g office room or a cafe, smartphone’s hardware constraints and currentbattery life of smartphone.
Privacy is a user concern that is quite natural to come in mind whenever there is anymonitoring done on smartphone specially in private spaces and needs to be addressed.The current scope of the project is limited to speech detection, and important thing tounderstand is that there is no raw audio recorded at any step of the process flow. Onlyfeatures get extracted in real-time, and these features don’t reveal anything about theactual content spoken. We are not doing speech to text, so we don’t need raw audiosamples. Secondly, communication with the back-end server occurs but again only thefeature vectors are sent and nothing else. The server used is a trusted server providedby the university.
1.3 Outline
Chapter 2 - Fundamentals In this chapter, basic concepts of audio handling on An-droid, feature extraction, classification techniques are described which can be necessary
7

1 Introduction
to understand the voice activity detection. In case of feature extraction, MFCC fea-tures are explained, along with the extraction procedure and robustness techniques.Evaluation methods incorporated are also described.
Chapter 3 - Contributions of the present work In this chapter, all aspects of thearchitecture, Android application implementation, audio probing, front-end processingand voice activity detection (VAD) are discussed. The focus is on evaluation andanalysis of experiments to compare different methods and find the best energy efficientsolution.
Chapter 4 - Summary and Outlook Finally, a summary of the achievements andresults is given. Additionally an outlook for future works, to continue the topic isprovided.
8
2 Fundamentals
This chapter provides all necessary background information regarding main technicalcomponents involved in this thesis. In case of the Android, Services, Multithreading,Audio Recording and Optimisations are presented. Like most approaches to voiceactivity detection [13], this approach also proceeds in two stages: feature extraction,followed by classification. For features, Mel Frequency Cepstrum Coefficients (MFCC)is presented. The classifiers divide into Random Forest, GMM and Neural Network.
2.1 Android
The Android system consists of a Linux operating system ("native layer", programmablewith C++, using the Android NDK), and a Java layer on top of it (Android SDK). TheJava code runs in a virtual machine on top of Linux ("Dalvik VM").
2.1.1 Services
Many Android applications need to do some things in the background when an appli-cation isn’t open. Maybe there is a need to ping periodically a server for information,play music no matter what the user is doing, run a timer, check a server on an intervaland many other things. All of these cases are great examples when using a Servicewould be the best (and sometimes the only) method of accomplishing your task [14].
There are basically 2 types of Services which are called Started Service and BoundService.
Started Service
Started services are those that are launched by other application components like anActivity or a Broadcast Receiver. They can keep running indefinitely in the backgrounduntil and unless stopped or destroyed by the system to free up resources. By fault,a service will keep running within the same main thread as the application processfrom which it was launched. Thus, It is important to note that any CPU intensive tasksshould be performed in a new thread within the service. Services are bound to be givena high priority by the Android system and are amongst the last to get terminated inorder to free up resources.
9

2 Fundamentals
Bound Service
A bound service is similar to a started service with an exception that a started service doesnot generally return results or permit interaction with the component that launched it.A bound service offers a client-server interface that allows components to interact withthe service as illustrated in Fig 2.1, send requests, get results, and even do so acrossprocesses with interprocess communication (IPC). A bound service runs only as long asanother application component is bound to it. Multiple components can bind to theservice at once, but when all of them unbind, the service is destroyed [15].
The question arises when to use which type of service. A started service is used todo work if an application doesn’t have to interact with the service again. A boundservice needs to be used if an application would require interacting with the service atany step. A bound service can also be used if other apps need to be able to interactwith parts of our app [16]. The two types of Service Interface:
• Client and Service are in the same process. It is implemented using the Binderclass, and if Client is destroyed by the OS then Service also gets destroyedautomatically.
• Client and Service in different processes. In this case, either “Messenger” isused [16] to interact with a Service across processes or AIDL (Android InterfaceDefinition Language) is used [17] if there is a need to handle multiple requests atthe same time.
Figure 2.1: How Bound Service Works.
10

2 Fundamentals
2.1.2 Multithreading
The speed and efficiency of a long-running, data-intensive operation often improvewhen we split it into smaller operations running on multiple threads. On a devicethat has a CPU with multiple processors (cores), the system can run the threads inparallel, rather than making each sub-operation wait for a chance to run. For example,extracting features out of audio recorded frames runs substantially faster when we doeach extraction per frame on a separate thread [18].
Android supports the usage of the Thread class to perform asynchronous processing.The Handler class can be used to register to a thread and provides a simple channel tosend data to this thread. The ExecutorService [19] offers background and concurrentprocessing via thread pool managed by Android thus saving a lot of hassle for thedeveloper.
2.2 Feature Extraction
The classical front end analysis in speech recognition is a spectral analysis that param-eterized the speech signal into feature vectors. Mel Frequency Cepstral Coefficients(MFCC) are the most popular set of feature vectors used in recognition systems.
MFCC parameters have been widely used in recognition system partly to the follow-ing reasons:
• The calculation of this parameter leads to a source-filter separation.
• The parameters have an analytically tractable model.
• Experience proves that these parameters work well in recognition applications.
In the context of this thesis, features are necessary to detect voice activity by havingfeatures with known labels of speech and silence. Having a model of the voice activity,it can be found if the unknown sound input is speech or silence. In the same way, it isused for Speaker detection by using a model of the speaker and calculating to whatprobability the features belong to that speaker.
2.2.1 MFCC
Because humans tend to perceive spectral features of audio, at least on short time scales,it is quite natural to prefer frequency-domain rather over time-domain features in audioprocessing. There are a lot of features which have been tried for speech processing.The major ones are the mel-frequency cepstral coefficients (MFCC), perceptual linear
11

2 Fundamentals
prediction coefficients (PLP), linear prediction coefficients (LPC), rasta-PLP, power-normalized cepstral coefficients (PNCC) and recently deep bottleneck features (DBNF)[28]. MFCC is the most widely used feature of the speech, with a simple calculation,good ability of the distinction, anti-noise, and other advantages [20].
It is important to note that MFCC features carry information about the structure ofa signal and are thought to model the vocal tract characteristics of a speaker [21]. Asmentioned in [20] MFCCs are especially successful due to their ability to represent thespeech amplitude spectrum in a compact form.
The MFCC is a representation of the speech signal that is defined as the real cepstrum of awindowed short-time signal derived from the FFT of that signal[22]. Figure 2.2 illustrates anoverview of the different stages that take place in the feature extraction process whileFig 2.3 shows a detailed view. The sub-steps are then explained in chronological order.
Figure 2.2: General feature extraction process.
Figure 2.3: Spectral representation of steps involved in MFCC extraction [23].
2.2.1.1 Pre-Emphasis
The spectrum for voiced segments has more energy at lower frequencies than higherfrequencies, and it is called spectral tilt. For flattening speech spectrum, a pre-emphasis
12

2 Fundamentals
filter is used before spectral analysis. Pre-emphasis refers to boosting the energy in thehigh frequencies. Its goal is to compensate the high-frequency part of the speech signalthat was suppressed during the human sound production mechanism.
Figure 2.4: Spectral slice from the vowel [aa] before and after pre-emphasis [23].
This source [24] presents an example of such a lter function with a coefficient of 0.97,input x(t) and output y(t)
y(t) = x(t)− 0 : 97x(t− 1) (2.1)
2.2.1.2 Frame Blocking and Windowing
Speech is divided into a sequence of equally sized sections, called frames where eachframe instance can be analyzed independently and represented by a single featurevector. Since each frame is supposed to have stationary behaviour, a compromise,in order to make the frame blocking, is to use a 10-25 ms window applied at 10 msintervals (frame rate of 100 frames/s and overlap between adjacent windows of about50%), as exposed in [25]
13

2 Fundamentals
Figure 2.5: Illustration of framing and windowing [26].
2.2.1.3 Fast Fourier Transform (FFT)
Taking windowed signal as an input, the next immediate step in MFCC extractionprocess is to calculate the Fast Fourier Transform (FFT) of each frame and find itsmagnitude. The FFT is a computationally efficient algorithm of the Discrete FourierTransform (DFT). If the length of the FFT, is a power of two (K=2n), a faster algorithmcan be used, so a zero-padding to the nearest power of two within speech frame lengthis performed. FFT transforms the audio signal from the time domain into the frequencydomain.
14

2 Fundamentals
Figure 2.6: Spectrum of 25 ms hamming-windowed signal computed by FFT (plus othersmoothing) [26].
2.2.1.4 Mel-spaced filter bank
Human hearing is not equally sensitive to all frequency bands and becomes lesssensitive at higher frequencies, roughly greater than 1000 Hz. The next step involvesadapting the frequency resolution to a perceptual frequency scale that satisfies theproperties of the human ears [27], such as a perceptually mel-frequency scale. Thefilterbank is a set of overlapping triangular bandpass filter, that according to mel-frequency scale, the center frequencies of these filters are linear equally-spaced below 1kHz and logarithmic equally-spaced above [28].
fMEL = 100log(1 + fLIN/1000)
log2(2.2)
The Mel filterbank is illustrated in Figure 2-7. It is interesting to emphasize thatthese center frequencies correspond to Mel center frequencies uniformly spaced on themel-frequency domain.
Figure 2.7: Mel filterbank.
15

2 Fundamentals
The bank of Mel-scaled filter is applied to the spectrum, and each filtered output isthe sum of its filtered spectral components. Using the Mel filterbank is subjected totwo principal reasons:
• Smooth the magnitude spectrum such that the pitch of a speech signal is notpresented in MFCCs.
• Reduce the size of the features involved.
2.2.1.5 Cepstral Analysis
In the last step in the extraction process of MFCC, Discrete Fourier Transform (DCT) isapplied to the log mel-frequency coefficients (log mel spectrum) to derive the desiredMFCCs.
An implementation of MFCCs, also used in the thesis, is available via the “Funf:Open Sensing Framework”, written by Nadav Aharony, Wei Pan, Alex Pentland [29].
2.3 Machine learning approaches
Machine Learning can be considered a subfield of Artificial Intelligence (AI). It isabout building programs with tunable parameters (typically an array of floating pointvalues) that are adjusted automatically so as to improve their behavior by adapting topreviously seen data [30]. In simple words, machine-learning methods aim at findingstructural patterns in a set of observations.
[31] Pattern Classification belongs to Machine Learning and focuses on findingmethods for automatically extracting knowledge from sets of observations (so-calledinductive learning). Pattern Classification or Recognition, basically classifies a set ofdata points into classes that may be predefined according to prior information, orinferred from the data itself. A training set is devoted to building classification modelswhile a test set is dedicated to verifying their quality. The difficulty of the classificationtask is directly related to the degree of mismatch between the training and test data.Classification tasks used are supervised and also unsupervised, i.e we have a datasetconsisting of both features, labels and also without labels. The purpose of supervisedlearning is to construct an estimator that can predict the label of an object given the setof features. The purpose in unsupervised learning is to construct an estimator that iscapable of discovering labels from the data itself.
This section introduces the classification techniques that are relevant to this thesis; forcomplete account of Machine Learning, the reader is referred to the following books:"Pattern Recognition and Machine Learning" [32] and “Pattern Classification” [33]. Itprovides most of the fundamentals for the classification processes of this thesis.
16

2 Fundamentals
2.3.1 Random Forest
Decision trees are at the foundation of many modern and state-of-the-art algorithms,including forests of randomized trees. Understanding all algorithmic details of singledecision trees is considered a prerequisite for an in-depth understanding of RandomForest. Random forests form a family of methods that consist in building an ensemble(or forest) of decision trees grown from a randomized variant of the tree inductionalgorithm [34]. Decision trees are indeed ideal candidates for ensemble methods sincethey usually have low bias and high variance, making them very likely to benefit fromthe averaging process.
Figure 2.8: Random forest algorithm (flow chart) [35].
There are several advantages of using Random Forest as explained in [36] but themost important ones in our case were:
• It produces a highly accurate classifier, and learning is fast
• It runs efficiently on large datasets
• It can handle thousands of input variables without variable deletion
17

2 Fundamentals
• Output is generated that gives information about the relation between the vari-ables and the classification
2.3.2 Neural Network
The field of Neural Networks got its motivation from various sources, ranging from thehuman’s fascination with understanding and emulating the human brain, to copyinghuman capabilities such as speech to commercial, scientific and engineering disciplinesof pattern recognition, modelling and prediction [37]. In neural networks, as in MachineLearning, the excitement of technological progress is supplemented by the challenge ofreproducing intelligence itself.
Neural networks consist of layers of interconnected nodes as shown in Fig 2.9, eachnode producing a non-linear functions of its input. This input to a node may comefrom other nodes or directly from the input data. It has been argued that neuralnetworks mirror to a certain extent the behavior of the network of neurons in the brain.Interesting observation [38] shows that a baby’s brain learns a significantly better modelfor interpreting speech. It does this without any access to the underlying real words(labeled training examples). And, the total number of hours of speech Google usesto train its model in orders of magnitude more than the few thousand a child needsbefore fully comprehending language.
Figure 2.9: Describing how Neural Network works [39].
“Input” layer are sometimes called “features”. The “features” in a voice activity
18

2 Fundamentals
detection and speech recognition model can be described as measurements of thefrequencies of the audio over a fraction of a second. The neural network shown inFig 2.9 has two “hidden” layers between input and output that represent intermediatefeatures. The neural network’s architecture—its hierarchy of hidden layers—allows themodel to represent layers of abstraction, from acoustic energy to auditory concepts,much like our brains appear to do.
2.4 Evaluation Metrics and Procedures
In our case, there is a need to evaluate the resources consumption of mobile devicewhile all processes are running and also to verify the correctness of the voice activitydetection system. To verify certain criterias, below metrics are followed to evaluateenergy consumptions pattern and validate generated models.
2.4.1 Mobile resources consumption
In this evaluation three metrics are used, all of which are low better metrics, i.e. lowervalues indicate better performance. Since the mobile device is running a lot of otheroperations in parallel, these metric isolates the device resources solely used by theapplication being evaluated.
2.4.1.1 Battery level
Mobile devices primarily run on battery power. A device is bound to have finite "batterybudget", and when it is finished, the device is useless until it is recharged. Battery levelwould refer to the levels contributed by this application in total battery drainage.
2.4.1.2 CPU usage
It refers to the percentage of CPU resources used in real-time while process was running.It is using the top command from linux1 which is a part of the procps2 package and anideal tool to gather system statistics [40]. Special attention is given to CPU usage spikesduring different phases of execution, and that’s why Mean and Standard Deviation arecalculated. This percentage refers to the chunk of CPU resources dedicated to thisapplication. This gives a good idea about the CPU overhead due to the experiment thatis under consideration.
1http://linux.die.net/man/1/top2http://procps.sourceforge.net/
19

2 Fundamentals
2.4.1.3 Memory usage
It refers to the volume in megabytes (MB) that the process consumed while in execution.A lot of memory in Android (and Linux systems in general) is actually shared acrossmultiple processes. The key [41] here is to find the amount of “Private Dirty” RAMthat is the most expensive one because it is used by only the application process, andits contents exist only in RAM so can’t be paged to storage.
20

3 Contributions of the Present Work
3.1 Architecture
The aim of this thesis is to unobtrusively detect human voice activity in an on-goingconversation throughout the day. The Android application will run on the user’ssmartphone continuously probing for audio, extracting features and detecting speech.Although the scope of this thesis is limited to speech detection only, we have alsoincluded speaker recognition in the process flow just to simulate and to visualize thefully functioning probing strategy. In reality, speaker recognition won’t be happeningat the background but it is something that will be added later as a future extension tothis thesis.In this section, an overview of the overall architecture is presented whichdescribes how it would work from input to results. Figure 3.1 depicts the componentsof this system.
Figure 3.1: Architecture overview.
21

3 Contributions of the Present Work
The architecture was implemented as an Android app and has two distinct modes,autonomous and server which can not run in parallel. In autonomous mode, architecturecompletely functions locally on an Android smartphone while in server mode speechdetection part is performed by the server by transmitting extracted audio featurevectors and receiving classification results in response. The input of the system was theinternal microphone of the smartphone or the microphone of the connected headset.The microphone input is sampled with a sampling rate of 16 kHz and is processed bythe front-end processing. But this doesn’t happen continuously and is rather managedby Audio Probing Engine using a defined strategy.
The Front-end processing unit targets to extract MFCC features from the audio signal.The Voice Activity Detection unit compares a set of feature vectors of a speech segmentwith stored database speech models. If its a server mode then instead of moving on toVoice Activity Detection, MFCC feature vectors are sent to the server where they arereceived and used as input for the server pipeline [42] [3].
3.2 Android Implementation details
The thesis project was implemented as an Android application in Java SE 7 and runningon Android smartphone. The User Interface (UI) runs as an Activity, which is a classprovided by the Android framework to manage user interactions and display results.An Activity goes into paused state by the Android runtime every time a new applicationbecomes active, or the user presses the home button. Meanwhile, Android Operatingsystem can kill the application if it needs more resources.
For our components, we need the application to run continuously and unobtrusivelywithout being killed. Even if it gets killed by the OS, it should be recreated withoutthe need of user involvement. For this, the main components of the application wereimplemented as Service class. The Service class provides the leverage of carrying outoperations in the background in like a sleep mode, even when the user is using anyother application or when the screen is locked. When it is running, a notification isalways visible on the top in the status bar to show the status of the application. Forthis, NotificationCompat.Builder class is used, and when clicked, it opens the activity andbrings it on the foreground.
Fig 3.2 to 3.5 shows screenshots of the application. Fig 3.2 shows the home screenwhere Superpowered is selected as the default value. Buttons can be used to start andstop recording the experiment and if, in progress, it looks as shown in Fig 3.3. User isprovided three options as shown in Fig 3.4 which can be used to switch FFT betweenSuperpowered and Cooley-Tukey. Fig 3.5 shows notification of current status of theprocessing whether it is in idle state or extraction state.
22
3 Contributions of the Present Work
As explained in section 2.1.1, there are 2 types of Services, Started Services and BoundServices, and in this case Bound services are used. It allows to control the lifetime of thebackground service, send new requests, get results to the Activity and show displaythem on the UI. The operations run in a multi-threaded way using ExecutorService classas explained in section 2.1.2 and it allows the Service to have its independent lifetimewhile running operations in a more efficient way. The application is bound to performresource-intensive computations that require certain CPU and memory resources butthen it also becomes critical to manage it in the most optimized way possible. A lot oftime and effort was invested in making it resource friendly, computationally optimizedand free of any memory leaks.
Despite the fact that Service gets higher priority from Android OS, the applicationprocess can get killed due to many reasons, most importantly, to free up memoryspace. To cater to this problem, Service is recreated automatically after a very shortinterval as the START_STICKY option is enabled while implementing the Service. Fortest purposes, the user is allowed to start/stop the application anytime using thebuttons available on the screen. Scheduling of operations and time delays are managedby using ScheduledExecutorService class.
Another important component of the application is Monitoring, which helps inrecording values of Battery levels, CPU usage, and Dirty memory. For Battery level,Intent Filter and Battery Manager classes are used to calculate the current level of batteryout of 100. For keeping track of real-time CPU usage value, Runtime class is used toexecute shell command Top about our application process that gives the details of CPUcycles and usage. The CPU usage is then extracted from the output using BufferedReaderclass.
RunningAppProcessInfo class is used to find the TotalPrivateDirty memory used by theapplication process. As far as monitoring these values is concerned, Battery levels andDirty memory values are only recorded at start and end of the experiment. CPU usagevalues are recorded at mid and end of one MFCC extraction cycle. It is done to keep aclose look on CPU peaks during the extraction cycle and at the end mean and standarddeviation are calculated to give a more quantitative analysis of CPU usage during thewhole experiment. All these three parameters are written in separate text files usingPrintWriter class.
23

3 Contributions of the Present Work
Figure 3.2: Home Page Figure 3.3: In Progress Screen
Figure 3.4: Menu to switch FFT option toCooley-Tukey
Figure 3.5: Notification Bar shows status ofapplication
3.3 Audio Probing
3.3.1 Background
As already mentioned in previous section, this project aims at detecting speech con-tinuously, throughout the day. However, the cumulative processing burden criticallyimpacts the phone battery. The tracking of human voice activity requires a fairly contin-uous stream of information being recorded. A prominent example [43]is Google VoiceSearch where availability is extremely important to make spoken access ubiquitouslyavailable. [44]gives a very detailed analysis on the comparison between Apple’s push-
24

3 Contributions of the Present Work
to-talk Siri and Google’s always listening strategy. The launch of Apple’s iPhone 5S withits M7 “motion coprocessor” 1 and Moto G with its “contextual computing processor”has highlighted [45] a change in the way that future mobile devices could be designed.Apple’s M7 can now boost system performance by diverting resource-intensive tasksaway from the main processor using task-specific low-power coprocessors. Motorolahas gone a step further, and the newly introduced low-power coprocessors are special-ized in noise cancelation and speech recognition technology to constantly listen forvoice commands. Its always ‘on’ feature enables owners to wake the phone and interactwith it without touching the screen or even picking it up while reducing the load onthe main processor and conserving battery life.
Most smartphones in the market boast a quad-core or octa-core super-processors.Thus, computation capabilities are already less of a concern in common devices. Butthey aren’t the most power-efficient way to action every task. Till date, the biggestlimiting factor for smartphone applications that depend on sensor data is the inadequatebattery capacity of phones. This problem is aggravated in the case of microphonesensor, due to its high data rates. Further, as more of these sensing applicationsare installed and running on the devices, the high computational requirements ofsimultaneously running complex classifiers add to the energy burden. As a result, dutycycling strategies are commonly adopted [46]. But the side effect is a reduced coverageof captured sound events since these can be missed while the sensor is not sampling.
3.3.2 Methodology
In this work, an audio probing strategy is presented which basically involves a 3 stateapproach i.e., idle, speech and speaker and transition between these three states dependson classifier output, windows score and time delays count. It is done by Audio ProbingEngine unit that is continuously running and calculating when to continue when toswitch and when to go in sleep mode. Fig 3.6 shows the activity flow in the probingstrategy.
Three states are addressed in the probing strategy which areas follows : idle (low-frequency probing), speech(medium to high-frequency probing) and speaker (constantprobing). For making a decision of switching, count of all positive scores of windows isconsidered which reflects whether a window is a speech or a non-speech. A windowscore is the average value of all prediction results (true positive) from classifier appliedon all frames in that particular window. If window score is greater than 0.5, then it isconsidered a speech, otherwise non-speech. Total count of all True Speech i.e windowstagged as speech are then used to decide whether the state should be idle, speech or
1The function of a coprocessor is to assist the primary processor with specific tasks, increasingperformance or freeing up processing power that can be used for something else.
25

3 Contributions of the Present Work
Figure 3.6: Activity diagram of probing methodology.
speaker.
3.3.3 Reasoning
3.3.3.1 Idle State
In the idle state, system probed infrequently for "short" durations because this refers tothe state when there is no speech. As far as conditions are concerned, probing durationmust be a slightly greater than twice of the longest possible pause in a conversation.The system calculates average over all frames in a window of size X. For the window tobe classified as speech, at least X/2 frames need be classified as speech. For establishinga clear understanding, consider the worst possible scenario in which two people talk ina conversation and the longest possible pause happens to be 2000ms. Then as soon asthe pause is triggered, audio recording starts. When the speakers start talking again,we have 2000ms of silence but still we want to detect speech, so we must keep recordinguntil more than half of the frames are speech i.e. twice as long. An important thingto consider is that this doesn’t account for two things that are misclassification and
26

3 Contributions of the Present Work
short pauses in the speech segment that follows the long pause. If misclassification isbalanced between both classes, speech, and non-speech, then we can ignore it. But ifspeech is misclassified as non-speech (false negative rate) more frequently than speech(false positive rate), then it indicates a problem. For random forests on server pipeline,this was the case, and there was roughly 10% FPR and 12% FNR. Thus, there is a needto have twice of 2% offset as well.
Experiment [47] with segmenting 2-speaker telephone conversations by speakershows that median utterance duration of telephone conversations between customersof a major U.S. phone company and its customer service representatives is 2.76 secondswhile the average is 3.95 secs. For this thesis, the average value of roughly 4 sec is moreimportant. To determine the longest "possible" duration of a pause in spontaneousspeech [48] shows that more than 90% of pauses are below 2s. So to be on safe side,2s is being considered as the longest "possible" duration of a pause in spontaneousspeech. The above mentioned worst case scenario is 2s of silence followed by speech(on average 4s until the next pause). This establishes the need for a probing durationtwice as long as 2s that will be 4s and additional 4% i.e. 4.16s. In our scenario, thecaptured audio at this point contains 2s of silence followed by 2.16s of speech.
Micropauses, which are an integral part of speech, need to be accounted as well. Inour scenario, the captured audio at this point contains 2s of silence followed by 2.16s ofspeech. Micropauses, which are an integral part of speech, still need to be accounted.[49] compared micropause duration across five European languages (English, French,German, Spanish and Italian) by analyzing approximately 6,000 pauses in about 5.5hours of recorded speech. They found out that English has geometric mean micropauseduration of 453ms (0.45s). [50] reaffirms that silence durations between 0.50 and 0.99seconds are described as "micropauses" thus leading to consideration of 0.5s value.Once again, because of the averaging more than twice of all frames need to be speech,thus considering 1s for our experiments.
Overall, roughly 4.16s + 1s = 5.16s ,rounded off to 6 s, of minimum probing durationare there in idle mode to detect speech. So 6s were selected to be on safe side. If speechis detected, then it will go from idle state into speech state. In speech state, audio isconstantly recorded unless there is no speech for 30s in a row then it goes back to idlestate. The 30s threshold is an educated guess.
3.3.3.2 Speech State
The study [48] reveals that typical pauses in speech are about 0.5s. With 2s windows(good results in [51]), they are "averaged out of the picture". In the previous section, ithas been established that a typical utterance is roughly 4s long. From[52] we know thateach speaker concludes about 1.5 utterances per turn, which means the average turn is
27

3 Contributions of the Present Work
about 6s long. Therefore Six 2s windows cover, on average, one turn of each speaker.In a conversation in which the target speaker is engaged in, a participation rate
of roughly 50% is assumed. The objective is to detect conversations while assumingthem to have a certain minimum duration of the speech. Otherwise, detected speechwindows are assumed to be random utterances in the background. On the other hand,thoughtful conversations with longer pauses must be considered. Thus it was decidedto sample 12s (6 windows of 2s each) and set the decision criterion for a conversationto be speech if count of windows found containing speech is greater than two, so thatparticipate rate is min 50%.
3.3.3.3 Speaker State
As already mentioned, Speaker recognition is not in the scope of this thesis but speakerstate is included in the probing strategy so that a complete cycle can be simulated andit’s more helpful for future work as well. 2s windows are sampled for indefinite timesbut keeping a check on each passing 60s, if windows count with speech is greater thantwo or not. If yes, then it remains in speaker state otherwise it will go back to speechmode. The difference between speech and speaker is that the former is triggered whenspeech is detected, and we are unsure whether it’s from the conversation that our targetspeaker is engaged in. So we probe more frequently than when there is no speech at allbut not as often as when we are confident that there is a conversation involving ourtarget.
[53] reports that people (in that study: students) spend 69% of their time alone and24% talking to others. This leads to the assumptions that a) in the 31% of the daythat people spend in the company of others, words are spoken by someone, and b)in a common conversation people have roughly equal shares of speaking turns. Thatmeans, when a person detects speech on the device using the VAD classifier, there is a(24/31)/2 chance i.e., 39% that it stems from the target speaker. 24/31 is the fraction oftime that conversations involve the speaker and his or her speaking time is half of that.Therefore, simulated speaker detection function should return true with a probabilityof 39%assuming a properly functioning VAD classifier and calling speaker detectionfunction is used only when the VAD classifier detects speech.
3.4 Front-end processing
3.4.1 Background
Front-end processing involves the conversion of the acoustic signal into a sequenceof acoustic feature vectors. It involves three main steps as already described by Fig
28

3 Contributions of the Present Work
2.2 which are Pre-emphasis, Frame blocking, windowing and Feature extraction. We usedcontinuous sound captured from microphone as input.
3.4.2 Methodology
In a first step, a pre-emphasis filter is used to flatten speech spectrum. Its aim is tocompensate the high-frequency part of the speech signal that was suppressed duringthe human sound production mechanism [28]. The other two steps are more importantin this phase. Studies [51] have shown that higher sampling rate captures more high-frequency characteristics of the speaker’s voice, improving the identification accuracyat the cost of computation overhead. In the second step, Audio data is sampled at rateof 16kHz, 16 bit encoding is used and data is divided into frames where each frameis represented by a single feature vector and can be processed individually.A 32 msframe window is applied at 10ms intervals (overlap between adjacent frames of about30%), and each frame has 512 samples. So feature extraction happens every 10 ms (160samples) over 32ms (512 samples) frame length by applying a Fast Fourier Transform(FFT) to the sample data in the window.
For windowing, features of multiple frames are bundled into a window that representspeech utterances. In this case, window and frame window shouldn’t be confusedbecause frame window represents a duration that includes frame & overlap as shownin Fig 2.5 while window represents a collection of frames. Before a frame is added to awindow, admission checks are run so that frames that are not admitted get dropped.The role of the frame admission checks is to pick high-quality speech frames from thesampled audio and discard low-quality speech frames as well as silence frames thatoccur naturally from brief pauses in human speech [51]. Therefore, a window containssequential but not necessarily consecutive frames. By overlapping, it means frameprocessing is decoupled from audio recording operation. This mean audio recordinghappens more often, with every call 1/3rd of the samples (10ms), that are needed forprocessing (32ms), are read, and 32ms buffer is updated which is then processed.
As the buffer is First-In-First-Out (FIFO) circular buffer, whenever new samplesare added, the oldest samples get replaced. By decoupling, It is meant that readand process work with different sample amounts. The 512 most recent samples arealways processed, but 160 samples are constantly being read and 160 samples areconstantly being deleted. This eventually results in roughly 30% of overlapping. Thechoice of the window length dictates how fast the system would respond to changes inthe conversations (e.g., onset of the voice and speaker turn-taking). Considering theturn-taking patterns of everyday conversations, it is believed that 2s windows representa good balance between delay and accuracy. This has already been discussed in section3.2.2.
29
3 Contributions of the Present Work
In feature extraction, each window is first smoothed with a Hamming filter beforeany computations. Computations performed on each frame data in the sequenceincludes FFT, Power Spectral Density for each frequency band and followed by MFCCcoefficients at the end. We extracted the first 20 Mel-frequency cepstral coefficients,removing the first one resulting in a feature vector of 19 elements that are energy-independent. The output of the front-end unit is a N-dimensional feature vector−→x = [x1, x2, x3, . . . , xN ]
T. . For every window with 2 seconds of data, MFCC featuresare extracted, and classification procedures are performed.
3.4.3 Implementation
The Front-end processing module was done using our implementation. As an alternateapproach, this module can also be imported from a 3rd party framework such asTarsosDSP [45], CMUSphinx [54] and openSMILE [55]. CMUSphinx includes a completeVAD module but that is energy based and not suitable for the scenario, i.e., ambientnoises. Additionally, it also doesn’t offer a proper way to just use MFCC extraction part.openSMILE didn’t have a proper wiki for implementation on Android because it ismore focused on the desktop. TarsosDSP was found as the most appropriate alternativeas it provided flexibility to use MFCCs extraction module, and there was sufficient helpavailable in wikis. TarsosDSP is a Java library for audio processing. TarsosDSP usesJTransform2which incorporates optimized FFTs for real input data, but It certainly hassome major limitations. The main project implements FFT part using two differentapproaches which are Cooley-Tukey FFT and Superpowered FFT.
3.4.3.1 Cooley–Tukey FFT
The Cooley-Tukey algorithm is probably one of the most widely used of the FFT algo-rithms [56]. It borrows MFCC implementation from Funf: Open Sensing Framework3
which is an extensible sensing and data processing framework for mobile deviceswritten in Java. MFCC class and all of the depending classes were imported from Funflike FFT. The underlying FFT type used is radix-2 decimation-in-time (DIT) FFT4 whichis the simplest and most common form of the Cooley–Tukey FFT5.
2https://sites.google.com/site/piotrwendykier/software/jtransforms3http://www.funf.org/4http://cnx.rice.edu/content/m12016/latest/5https://en.wikipedia.org/wiki/Cooley%E2%80%93Tukey_FFT_algorithm
30

3 Contributions of the Present Work
3.4.3.2 Superpowered FFT
Superpowered provides high-performance audio development for mobile devices andclaims to be the fastest FFT for Android and iOS which is achieved through assembler-level optimization for the ARM CPU. The underlying FFT implementation has its originfrom Construction of a High-Performance FFT6.
3.4.4 Evaluation and Results
One very fundamental thing to consider is that Java code is always slower than nativecode, as it runs in a virtual machine, which translates the instructions to native ones.Java is not designed for real-time, higher performance applications, therefore TarsosDSPand Cooley-Tukey can not be more efficient than Superpowered. TarsosDSP usesJTransform library to compute FFT and according to JTransform’s website, their FFTsolution is slower than the native (C++) FFTW7 library. A general estimate is thatthe Superpowered FFT will be 8x faster than JTransforms [57]. The SuperpoweredFFT performs better than Cooley-Tukey Java implementation because it is built in fullAssembly code. It means it’s written in the most "native" thing one can get on Androiddevice that is, in fact, the lowest possible level, i.e., ARM Assembly (The CPU’s own"language"). Everything is hand-optimised, which is way better than a compiler can do.
3.4.4.1 Mobile device specifications
For all the test, two Android smartphone devices are used: Samsung Nexus S3 miniand Xiaomi Mi 3. Table 3.1 shows the specifications of both phones. By comparison[58], Mi3 has 2.03x more battery power, 4.60x faster CPU clock speed, 25% bigger screensize and 1 GB more RAM memory. The reason of using these two phones was to teston low-end (Mi 3) and the high-end (Mi3) smartphone to have a good understandingof energy consumption on both types of phones.
6http://edp.org/work/Construction.pdf7http://www.fftw.org/
31

3 Contributions of the Present Work
Table 3.1: Specifications of the two testing devices: Samsung Galaxy S3 Mini and XiaomiMi 3
.
Samsung Galaxy S3 Mini Xiaomi Mi 3CPU 1 GHz Dual-core Cortex-A9 2.3 GHz Quad-core Krait 400RAM 1 GB 2GBBattery Li-Ion 1500 mAh 3050 mAhScreen size 5" 4"
3.4.4.2 Runtime conditions
For an experiment, runtime conditions are chosen to be as normal as possible to areal-life scenario in order to reflect the real usage. In normal phone usage, the phonebecomes active when in use and is inactive when not in use. Most of the common appsare always email, messaging, browser and maybe games. For experiments, Wifi ha keptrunning in background and applications in use include Gmail, Whatsapp, Facebookand Browser as needed. These conditions were carefully designed to simulate a real-lifenormal daily routine, and it has no impact on the calculations because exact CPU usage,memory usage, and battery consumption was calculated by app.
The actual difference in battery level is logged using Android system but to findthe application specific contribution, 3rd party application “GSam Battery Monitor”is used. It helps in finding out how much of that total amount was consumed by ourapplication. This is one of the most important reading for our evaluation. The valuesare extrapolated to see how much it would consume for 24h day and then mean value iscalculated. Three experiment iterations were done for Superpowered and Cooley-Tukeyand for both phones.
3.4.4.3 Execution time
For the specific comparison of execution time between Cooley-Tukey and Superpowered,Trace8 class is used which writes trace events to the system trace buffer. These traceevents can be collected and visualized using the Systrace9 tool. In our case, this is usedto make a comparison for the average time taken by both implementations to performone FFT computation. For this, three traces were captured using Dalvik Debug MonitorServer (DDMS)10 tool and each trace was recorded for 10 seconds. From each trace,
8https://developer.android.com/reference/android/os/Trace.html9https://developer.android.com/tools/help/systrace.html
10http://developer.android.com/tools/debugging/ddms.html
32
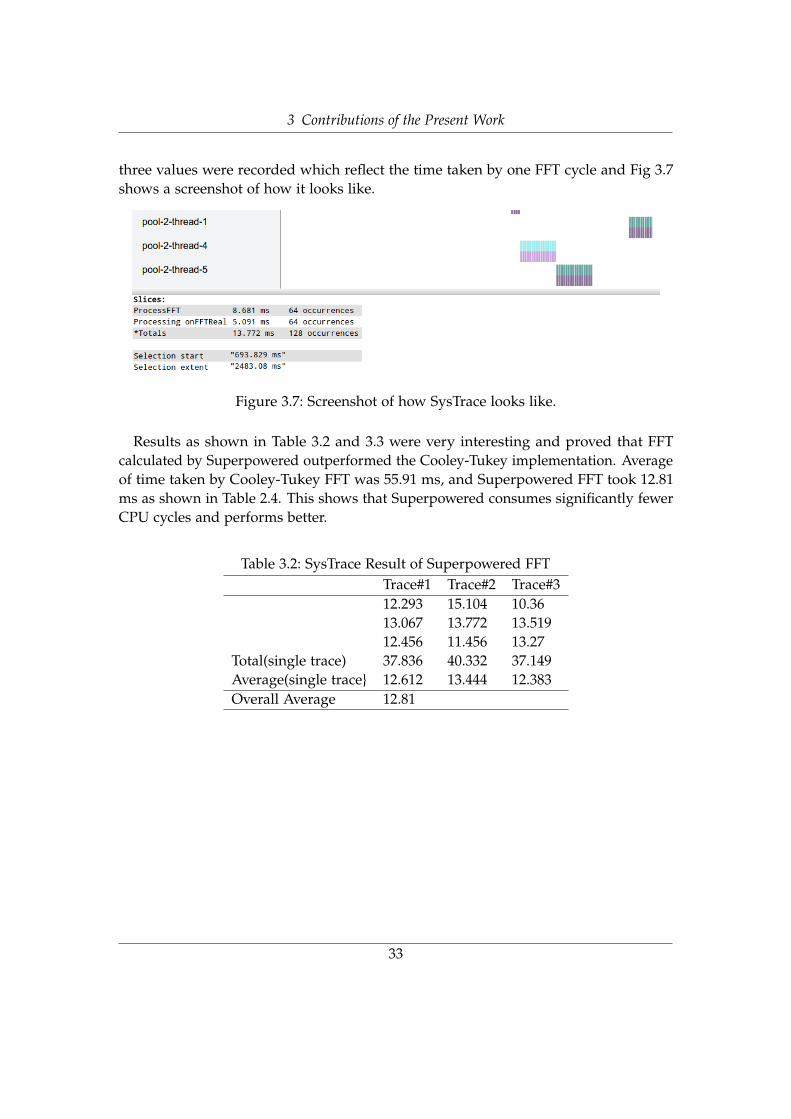
3 Contributions of the Present Work
three values were recorded which reflect the time taken by one FFT cycle and Fig 3.7shows a screenshot of how it looks like.
Figure 3.7: Screenshot of how SysTrace looks like.
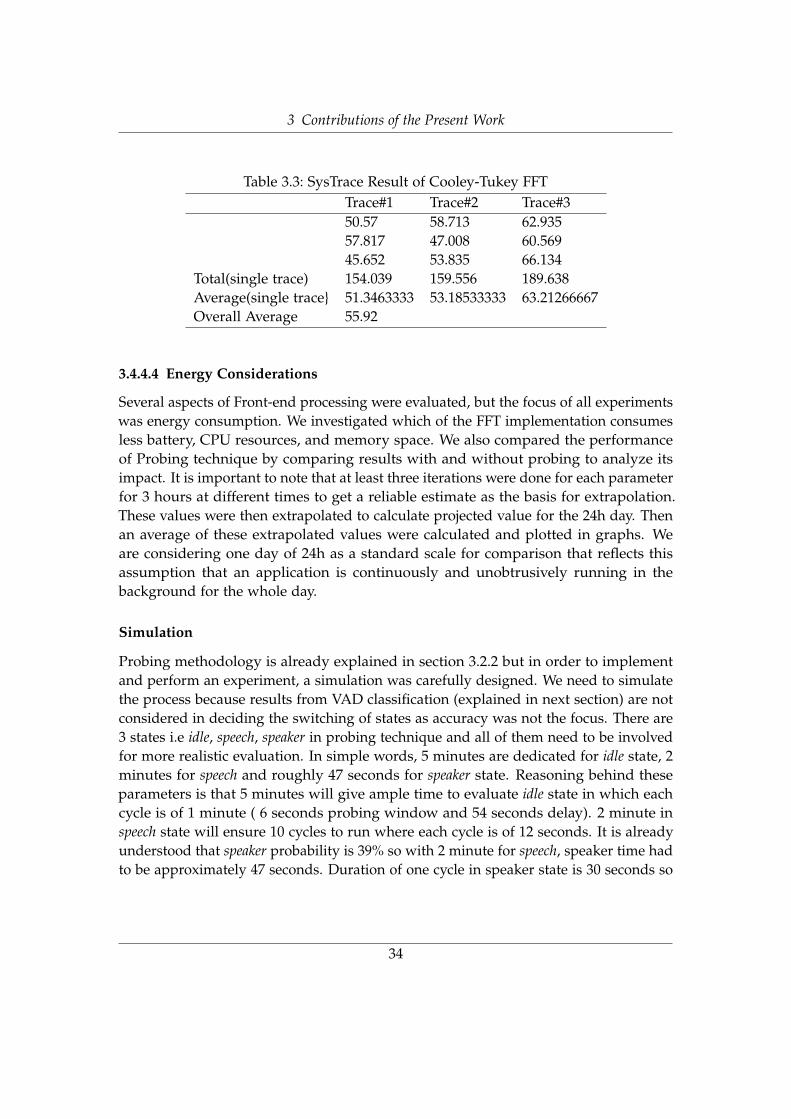
Results as shown in Table 3.2 and 3.3 were very interesting and proved that FFTcalculated by Superpowered outperformed the Cooley-Tukey implementation. Averageof time taken by Cooley-Tukey FFT was 55.91 ms, and Superpowered FFT took 12.81ms as shown in Table 2.4. This shows that Superpowered consumes significantly fewerCPU cycles and performs better.
Table 3.2: SysTrace Result of Superpowered FFTTrace#1 Trace#2 Trace#312.293 15.104 10.3613.067 13.772 13.51912.456 11.456 13.27
Total(single trace) 37.836 40.332 37.149Average(single trace} 12.612 13.444 12.383Overall Average 12.81
33
3 Contributions of the Present Work
Table 3.3: SysTrace Result of Cooley-Tukey FFTTrace#1 Trace#2 Trace#350.57 58.713 62.93557.817 47.008 60.56945.652 53.835 66.134
Total(single trace) 154.039 159.556 189.638Average(single trace} 51.3463333 53.18533333 63.21266667Overall Average 55.92
3.4.4.4 Energy Considerations
Several aspects of Front-end processing were evaluated, but the focus of all experimentswas energy consumption. We investigated which of the FFT implementation consumesless battery, CPU resources, and memory space. We also compared the performanceof Probing technique by comparing results with and without probing to analyze itsimpact. It is important to note that at least three iterations were done for each parameterfor 3 hours at different times to get a reliable estimate as the basis for extrapolation.These values were then extrapolated to calculate projected value for the 24h day. Thenan average of these extrapolated values were calculated and plotted in graphs. Weare considering one day of 24h as a standard scale for comparison that reflects thisassumption that an application is continuously and unobtrusively running in thebackground for the whole day.
Simulation
Probing methodology is already explained in section 3.2.2 but in order to implementand perform an experiment, a simulation was carefully designed. We need to simulatethe process because results from VAD classification (explained in next section) are notconsidered in deciding the switching of states as accuracy was not the focus. There are3 states i.e idle, speech, speaker in probing technique and all of them need to be involvedfor more realistic evaluation. In simple words, 5 minutes are dedicated for idle state, 2minutes for speech and roughly 47 seconds for speaker state. Reasoning behind theseparameters is that 5 minutes will give ample time to evaluate idle state in which eachcycle is of 1 minute ( 6 seconds probing window and 54 seconds delay). 2 minute inspeech state will ensure 10 cycles to run where each cycle is of 12 seconds. It is alreadyunderstood that speaker probability is 39% so with 2 minute for speech, speaker time hadto be approximately 47 seconds. Duration of one cycle in speaker state is 30 seconds so
34

3 Contributions of the Present Work
one cycle will always run in each instance of simulation and then it will move back toidle state and keep repeating.
Battery level
So first thing done is to show how much energy is consumed without any audiorecording and processing. In the first step, it is being tried to show how much energyis consumed when there is no audio recording and processing. This will establish abaseline for further experiments. For calculating Baseline values, battery consumptionof smartphone was monitored for the whole day (24h) during normal use in 3 iterationsand average was calculated.
Two kinds of usage criteria were selected for the experiment. Criteria #1 refers tomoderately heavy use in which wifi was constantly on and common messaging apps(WhatsApp, Facebook, email) were frequently used including gsm calls. Criteria #2refers to a relatively lighter use in which WiFi was turned on only when mobile appswere to be used, but otherwise it was disconnected. Most of the time phone was kept inthe idle state with the screen turned off. These two conditions were used to depict twomost dominant situations. Fig 3.8 shows that according to final results, Mi 3 batteryon average is expected to completely drain out in 16 hours while S3 Mini is expectedto take 22 hours. It also means that on average baseline value for drainage rate is 18.8levels per 3 hours for Mi 3 and 13.6 levels per 3 hours for S2 Mini. Mi 3 is a high-endphone with a bigger screen, and higher computation requirements so drain batterymore quickly.
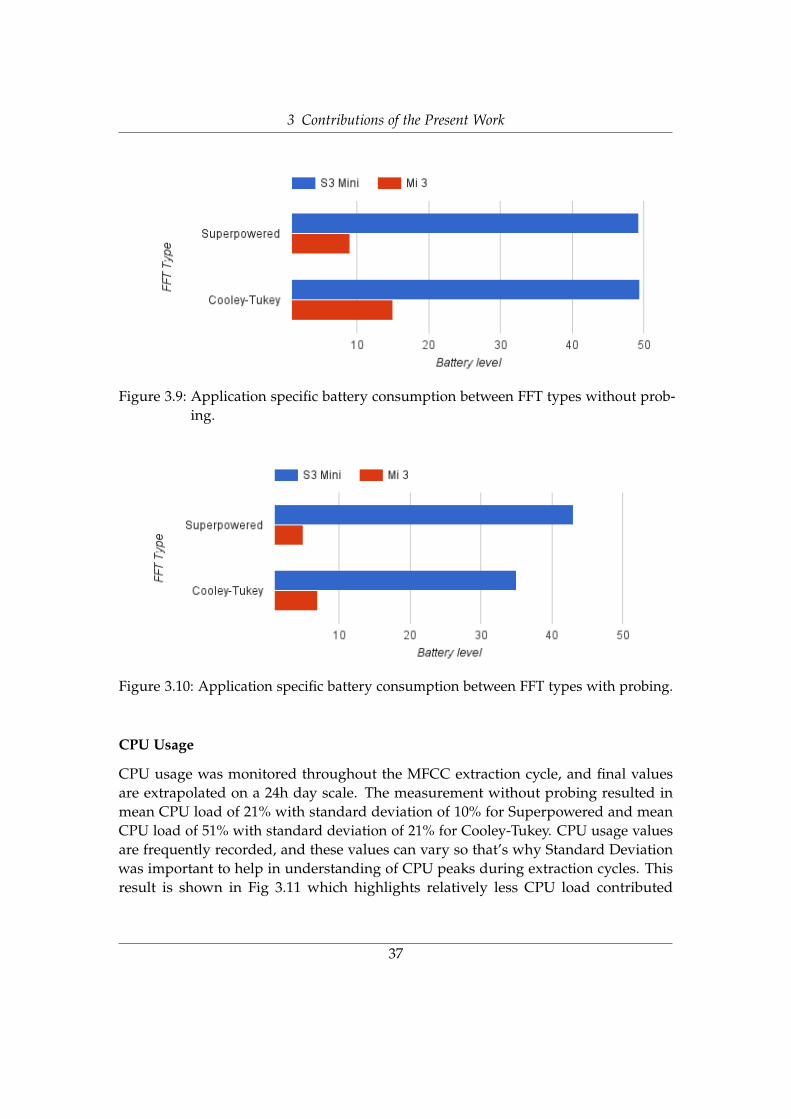
As already explained in section 3.4.4.2, 3rd party application was used to find an exactproportion of battery used by our application. So, comparison of Superpowered FFT andCooley-Tukey FFT was important along with the impact of Probing technique. Fig 3.9shows results without probing technique applied and shows that with Superpowered,average battery levels were 49 and 9 for S3 Mini and Mi3 respectively. For Cooley-Tukey, battery levels were 49 and 15 so clearly Superpowered performed better on Mi3. In our case, Mi 3 reflects a high-end phone while S3 Mini reflects a low-end phone.Hardware specifications and software specifications are different and seem like ourimplementation doesn’t create any difference on S3 Mini.
When the simulation was applied, results showed that Probing has an overall positiveimpact on Superpowered and Cooley-Tukey and on both phones. Fig 3.10 shows thispositive behavior because, for Superpowered, values dropped from 49 to 43 and 9to 5 while for Cooley-Tukey, it dropped from 49 to 35 and 15 to 7. This is a clearindication that because of involvement of state switching and relevant delays in probingtechnique, less energy is consumed as compared to constant MFCC extraction. Thisresult proves again that Superpowered FFT is more energy efficient than Cooley-Tukey
35

3 Contributions of the Present Work
Figure 3.8: Baseline values for battery drainage.
FFT, but front-end processing consumes more processing resources on the low-poweredprocessor.
36
3 Contributions of the Present Work
Figure 3.9: Application specific battery consumption between FFT types without prob-ing.
Figure 3.10: Application specific battery consumption between FFT types with probing.
CPU Usage
CPU usage was monitored throughout the MFCC extraction cycle, and final valuesare extrapolated on a 24h day scale. The measurement without probing resulted inmean CPU load of 21% with standard deviation of 10% for Superpowered and meanCPU load of 51% with standard deviation of 21% for Cooley-Tukey. CPU usage valuesare frequently recorded, and these values can vary so that’s why Standard Deviationwas important to help in understanding of CPU peaks during extraction cycles. Thisresult is shown in Fig 3.11 which highlights relatively less CPU load contributed
37

3 Contributions of the Present Work
by Superpowered FFT and very high CPU load and more CPU peaks occurring inCooley-Tukey implementation.
Figure 3.11: Application specific CPU usage for Superpowered and Cooley-Tukey with-out probing.
We further investigated how a probing technique can affect CPU usage for these twoFFT techniques. Fig 3.12 clearly shows that mean CPU usage of 19% with standarddeviation of 12% results in almost no difference for Superpowered. On the other hand,probing does make Cooley-Tukey more efficient by reducing the mean CPU usagevalues to 25% and standard deviation to 14%. Nevertheless, evaluation for CPU usageproves that Superpowered FFT is a better choice for performance.
38

3 Contributions of the Present Work
Figure 3.12: Application specific CPU usage for Superpowered and Cooley-Tukey withprobing.
Memory usage
Dirty Memory refers to the memory footprint of the application process, and it canquickly grow as one start doing work in that process. If the implementation is notdone in an optimized way and there are memory leaks left than memory footprint canincrease drastically. So monitoring memory usage was also important to validate ourimplementation, and it has gone through a lot of optimization phases. Dirty memoryvalue is recorded at start and end of the experiment to find out in total how big chunkof RAM was consumed by our application process. Fig 3.13 shows that on Mi 3, averagevalues were 56MB for Superpowered and 25MB for Cooley-Tukey and 10MB and 14MBfor S3 Mini phone respectively. The problem in the case of Mi 3 was quite clear and56MB was a concern if the experiment is running for the whole day. It is important thatthese results were without probing.
39

3 Contributions of the Present Work
Figure 3.13: Application specific memory usage for Superpowered and Cooley-Tukeywithout probing.
We further investigated on how probing can reduce the memory consumption of ourapplication specially for Superpowered. New results as shown in Fig 3.14 were quitepromising and reduced Memory footprint for Superpowered from 56MB to 24MB andalso for Cooley-Tukey.
We can make several observations based on the results from this section. First,Superpowered FFT execution time is fast, topping 43 ms. In addition, we demonstratedSuperpowered FFT energy efficiency is much better than its counterpart Cooley-TukeyFFT. The reason being Superpowered FFT involves improved algorithms and nativeimplementation. Lastly, it was also proved that when probing technique was applied,results improved significantly across the board. We observed that with the addition ofshort sleeping intervals due to probing technique, the phone can last up to approxi-mately 15-20 hours. The idea of using 3 states i.e idle, speech and speaker for continuousprobing ended up as an intelligent choice and saved considerable processing resources.We will now take in account Superpowered FFT and Probing for further analysis.
40

3 Contributions of the Present Work
Figure 3.14: Application specific memory usage for Superpowered and Cooley-Tukeywith probing.
3.5 Voice Activity Detection
3.5.1 Background
Voice activity detection (VAD) refers to the problem of identifying the speech andnon-speech segments in an audio signal. It is a front-end component of speaker andemotion recognition system that is the main aim of the research project [2] [3] associatedwith this thesis. Speech and noise exhibit different levels of non-stationarity so that thismeasure can be used for voice activity detection.
More recently these systems using smart-phone based solutions were proposed:[59] presented a framework for mobile sensing including sound, which was used torecognize the presence of human voices efficiently in real-time. [60] presented a systemto recognize emotions of the user; [61] shows how to detect user conversations and [62]
41

3 Contributions of the Present Work
proposed SoundSense, a smartphone implementation of a sound recognition systemfor voice, music and clustering ambient sounds. SoundSense divides ambient sound ofa user in a number of sound clusters that have to be manually labeled by the user.
Our work is focused on integrating design, implementation and evaluation of asmartphone-based VAD system for recognizing the human voice in real-time. Weevaluated the implementations for both modes - running the system in autonomousmode (completely on a smartphone only without need of internet) and in server mode(captured sound sent to server where classification is done). It is important to note thatour focus is more confined towards contribution and evaluation of VAD in autonomousmode. The feasibility and understanding of challenges and bottlenecks in autonomousmode is of great value for future work and will define the direction of future research.Section 3.6 highlights the server mode in more detail.
3.5.2 Implementation details
Our Random Forest implementation is based on an existing work done by Leo Breiman[63] which itself is a modified form of all related classes provided by Weka11 library.The model file is loaded from assets folder using AssetManager class and deserializedusing Kryo12 which is serialization framework for Java. For Neural Network, modelfile is loaded in a similar way but read using Serialize Classifier class provided by Wekalibrary.
3.5.3 Feature Preparation
The performance of speech recognition systems is strongly influenced by the qualityof the speech signal. The mismatch between the training conditions and the testingconditions has a deep impact on the accuracy of these systems and represents a barrierfor their operation in noisy environments. We are using MFCCs as features for VAD asalready explained in section 3.4. We are using the coefficients between the 2nd and the19th coefficient in order to only keep energy-independent features. An 18-dimensionalMFCC vector is then formed out of each 32 ms frame but still it is not in a goodshape to form a feature vector suitable for recognition and needs to go through sometransformations.
According to [64], The MFCC feature vector describes only the power spectralenvelope of a single frame, but it seems like speech would also have information inthe dynamics i.e. what are the trajectories of the MFCC coefficients over time. It turnsout that calculating the MFCC trajectories and appending them to the original feature
11http://www.cs.waikato.ac.nz/ml/weka/12https://github.com/EsotericSoftware/kryo
42

3 Contributions of the Present Work
vector increases recognition performance [65] further elaborates that the MFCC featurevectors that are extracted did not accurately capture the transitional characteristicsof the speech signal that contains the speaker specific information. It is possible toobtain more detailed speech features by using a derivation on the MFCC acousticvectors. This approach [66] permits the computation of the Delta MFCC (DMFCCs), asthe first order derivatives of the MFCC, which results in total 36-dimensional MFCC(including 18 delta) feature vectors in our case. For now, we are not calculating theDelta-Delta MFCC (DDMFCCs), being the second order derivatives of MFCCs andwe are using uncompensated MFCCs. Above mentioned studies have shown thatsystem performance may be enhanced by adding time derivatives to the static speechparameters.
To calculate the delta coefficients, the following formula is used:
dt =
N∑
n=1n(ct+n − ct−n)
N∑
n=1n2
(3.1)
where dt is a delta coefficient, from frame t computed in terms of the static coefficientsct+n to ct−n . A typical value for is N 2.
3.5.4 Dataset
For applying machine learning techniques, previously trained data is required to createmodels. The problem is that recording voice in combination with noise in all situationsand annotating the data by hand is infeasible. This is the reason a synthetical generationof the dataset is extremely important and additionally gives total control over howthe data will be mixed. There are many speech corpora used for VAD evaluationin the literature. For evaluation of our VAD system, the freely available TIMIT andBuckeye corpus was used to extract sources [42] [67].TIMIT corpus was designed to betask and speaker-independent and is suitable for general acoustic-phonetic research[68]. It contains 6300 sentences which were spoken by 630 speakers and that make upapproximately 5 hours of English speech. Buckeye is a conversational speech corpusthat consists of approximately 300.000 words, adding up to about 38 hours of Englishspeech, spoken by 40 different speakers.
For future work, it is important to mention that Speaker recognition requires traininga speaker model for each who needs to be recognized. It is a real challenge to acquirethe necessary training data directly from participants, typically by recording voice in aquiet environment. For generating best speaker models, it is important to have highquality of audio data which contains only single known person. [51] explains three
43

3 Contributions of the Present Work
approaches for acquiring training data from participants and discusses the advantagesand disadvantages. These three approaches includes using data collected during phonecalls, collect voice data from everyday one-to-one conversations and sharing speakermodels between phones.
3.5.5 Classification
3.5.5.1 Related Work
In Related work, AmbientSense [69], MyConverse [70] and SpeakerSense [51] haveachieved commendable results. AmbientSense is a real-time ambient sound recognitionsystem that works on Android. It also performs audio analysis and classification ondevice (without internet) and also by sending features to the server and receiving results.It used SVM classifier with a Gaussian kernel for acoustic classification. Training datawas recorded in the city of Zurich and Thailand in different buildings and locations.23 ambient sound classes were selected to reflect daily life locations and activities. Itachieved 58.45% recognition accuracy.
In MyConverse [70], a demonstration of personal conversation recogniser and visu-aliser for Android smart-phones. It identifies known speakers in conversations, andunknown speakers are detected and trained for further identification. For modeling,GMM-UBM (Gaussian Mixture Models - Universal Background Model) is used whichallows to have less training data and reduced computational complexity of training.MyConverse enables to visualize a single conversation or all conversations together.For testing, 3 participants were asked to record at least 8h of audio data in daily liferoutines. In average, accuracy for conversation detection was 89%, and speaker recogni-tion accuracy was 71%. The average CPU load was found to be 30% for continuousspeech and 5% for non-speech.
SpeakerSense [51]present the design and implementation of practical, energy efficientand unobtrusive speaker identification system. The unique thing about it is that ituses a heterogeneous multiprocessor based phone architecture to sample audio, detecthigh-quality voice and do speaker identification only when necessary. The speakeridentification stage used a modified version of GMM classifier. For training, 10 minutesof voice is collected through a call for each of 17 speakers. Results on low-poweredprocessor showed that speaker identification consumes a total of 771 mW of power andaccuracy of around 93%.
3.5.5.2 Training and testing phase
For training, five trees were used in Random Forest and 20 hidden nodes in NeuralNetwork. 10k samples were randomly filtered out of corpus and used for training and
44

3 Contributions of the Present Work
mixed according to the approach explained in Tobias master’s thesis [42]. Intuitively,recognition accuracy is directly proportional to the amount of training data because theVAD model can likely encode more information. However, collecting properly labeledtraining data is expensive and cumbersome. For our experiments, models were nottrained on the phone because of the high cost involved with it. They are created onthe server side and then just copied in the assets folder of the Android application andthen accessed using AssetManager class provided by an Android system. In the testingphase, the feature vectors are generated from the continuous audio data captured fromthe microphone every 2 seconds which is our window size.
3.5.5.3 Evaluation and Results
Several experiments were conducted and results of three VAD classification algorithmsin autonomous mode only were recorded. The VAD algorithms under consideration areRandom Forest, Gaussian Mixture Model, and Neural Network. These algorithms aretrained with labeled audio samples to generate classification model. Then the modelare used for the classification of input data to predict speech/non-speech. The analysisis mainly focused on the determination of energy consumption of VAD algorithmsand influence of VADs working in combination with probing technique and front-endprocessing. The performance of VAD algorithms is not evaluated because the scope ofthe thesis is primarily focused on energy consideration rather than recognition accuracy.
We are using two smartphones for our experiments as already stated in section 3.4.4.1and runtime conditions specified by section 3.4.4.2. As proved by results of front-endprocessing in section 3.4.4, Superpowered FFT along with Probing approach alreadydemonstrated energy efficiency and will be used for evaluation of VAD algorithms.
Energy consideration
We investigated which of the VAD algorithms consumes less battery, CPU resources,and memory space. It is important to note that at least three iterations were donefor each parameter for 5 hours at different times. These values were extrapolated tocalculate projected value for 24h day that is our current assumption. Then an averageof these extrapolated values were calculated and plotted in graphs. We are consideringone day of 24h as a standard scale for comparison that reflects this assumption thatan application is continuously and unobtrusively running in the background for thewhole day.
45
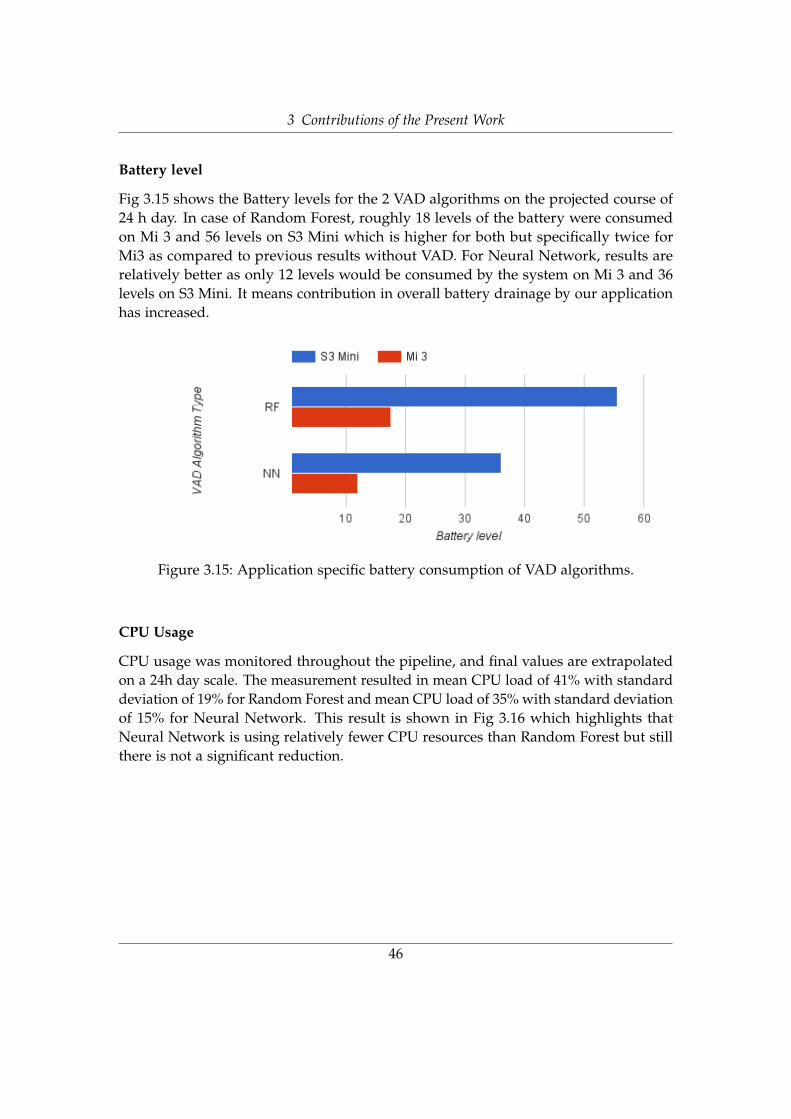
3 Contributions of the Present Work
Battery level
Fig 3.15 shows the Battery levels for the 2 VAD algorithms on the projected course of24 h day. In case of Random Forest, roughly 18 levels of the battery were consumedon Mi 3 and 56 levels on S3 Mini which is higher for both but specifically twice forMi3 as compared to previous results without VAD. For Neural Network, results arerelatively better as only 12 levels would be consumed by the system on Mi 3 and 36levels on S3 Mini. It means contribution in overall battery drainage by our applicationhas increased.
Figure 3.15: Application specific battery consumption of VAD algorithms.
CPU Usage
CPU usage was monitored throughout the pipeline, and final values are extrapolatedon a 24h day scale. The measurement resulted in mean CPU load of 41% with standarddeviation of 19% for Random Forest and mean CPU load of 35% with standard deviationof 15% for Neural Network. This result is shown in Fig 3.16 which highlights thatNeural Network is using relatively fewer CPU resources than Random Forest but stillthere is not a significant reduction.
46
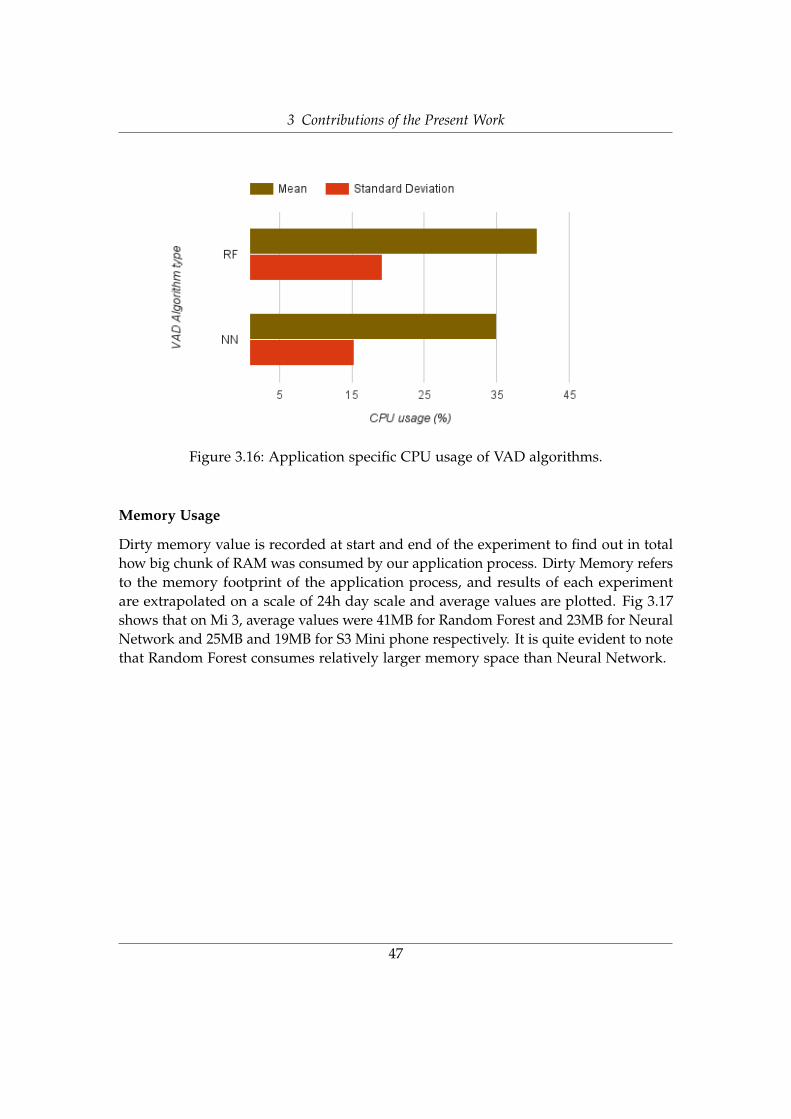
3 Contributions of the Present Work
Figure 3.16: Application specific CPU usage of VAD algorithms.
Memory Usage
Dirty memory value is recorded at start and end of the experiment to find out in totalhow big chunk of RAM was consumed by our application process. Dirty Memory refersto the memory footprint of the application process, and results of each experimentare extrapolated on a scale of 24h day scale and average values are plotted. Fig 3.17shows that on Mi 3, average values were 41MB for Random Forest and 23MB for NeuralNetwork and 25MB and 19MB for S3 Mini phone respectively. It is quite evident to notethat Random Forest consumes relatively larger memory space than Neural Network.
47
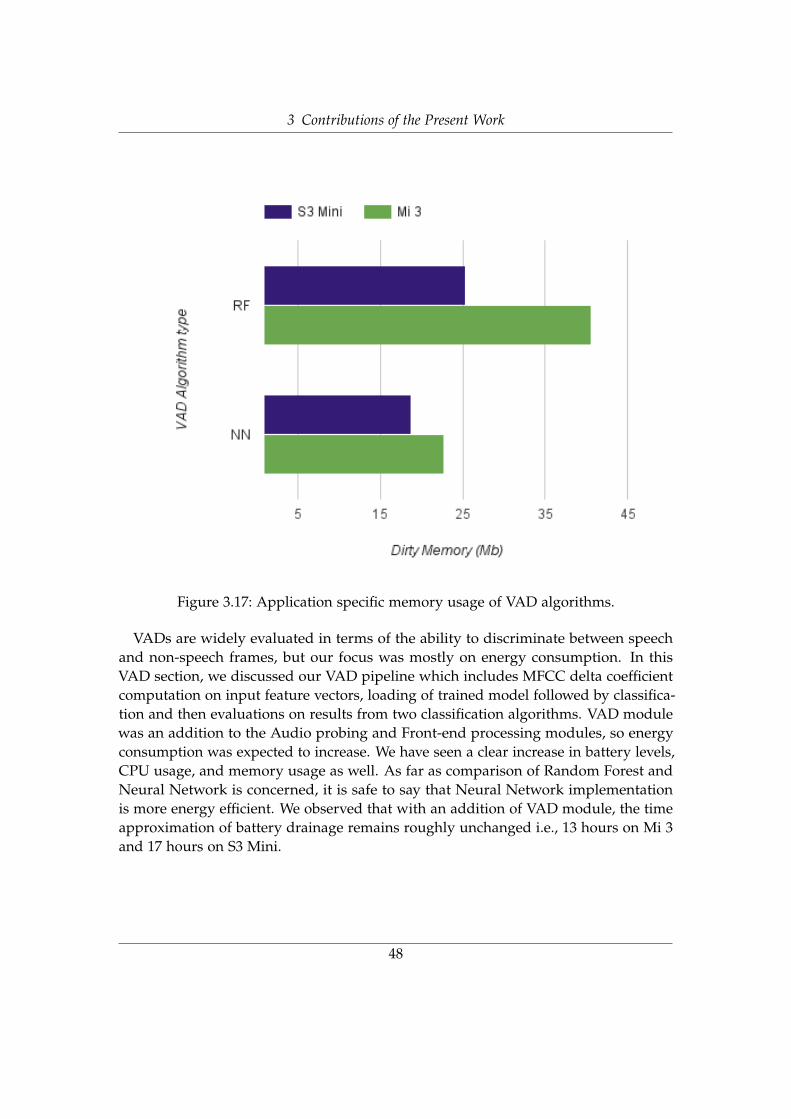
3 Contributions of the Present Work
Figure 3.17: Application specific memory usage of VAD algorithms.
VADs are widely evaluated in terms of the ability to discriminate between speechand non-speech frames, but our focus was mostly on energy consumption. In thisVAD section, we discussed our VAD pipeline which includes MFCC delta coefficientcomputation on input feature vectors, loading of trained model followed by classifica-tion and then evaluations on results from two classification algorithms. VAD modulewas an addition to the Audio probing and Front-end processing modules, so energyconsumption was expected to increase. We have seen a clear increase in battery levels,CPU usage, and memory usage as well. As far as comparison of Random Forest andNeural Network is concerned, it is safe to say that Neural Network implementationis more energy efficient. We observed that with an addition of VAD module, the timeapproximation of battery drainage remains roughly unchanged i.e., 13 hours on Mi 3and 17 hours on S3 Mini.
48

3 Contributions of the Present Work
3.6 Communication with server
3.6.1 Background
In the previous section, the autonomous mode was discussed in detail, and this sectionis about the other mode, i.e., the server mode which was already introduced in section3.1. As shown in fig 3.1, server mode refers to the alternate approach in which featurevectors are sent to a back-end server. It is then responsible for scoring feature vectors,classification, and recognition. This was already mentioned in the section 1.1 that theexisting server pipeline takes an audio file and performs feature extraction, featurepreparation, VAD, speaker recognition and returns emotion recognition result as output.Our project work has a limited scope and only provides a method on how mobile canbecome a primary source of input for the server pipeline instead of using audio files. Itis important to note that autonomous and server mode can not run in parallel.
In related work, EmotionSense [60] is a platform that helps in continuous detectionof emotions of the smartphone owner. It’s architecture is comprised of a speakerrecognition sub-system and silence detector that was used to filter out non-silent audio.EmotionSense offloads computation tasks to a server to save the battery from drainage.In another very similar example, AmbientSense also implements two modes and servermode was meant to send features to the server and received classification results inreturn. It specializes in real-time ambient sound recognition system for smartphones.Some examples [71] shows an alternate approach in which recorded audio files are sentinstead of vectors. An advantage of the server that accepts feature vectors, instead ofraw audio, is a lower cost of data transfer between the client and the server.
3.6.2 Methodology
In server mode, the smartphone sends feature vectors to the server continuously withshort breaks defined by the probing strategy. But before these features are sent, a vectoris converted to binary form and compressed. Reasons to do this is to have an efficientsetup with least communication overhead. Probing technique, in general, maintainsthree states but at a given point of time; it is either probing or going through a sleepmode. So whenever it is in audio probing phase, extracted feature vectors are sent tothe server. User is allowed to switch modes from the options menu.
3.6.3 Implementation
As far as implementation is concerned, Internet connectivity is critically important,and it is checked when a user selects server from the options. For a single instancein probing phase, after every two seconds a 36-dimensional Vector data is converted
49
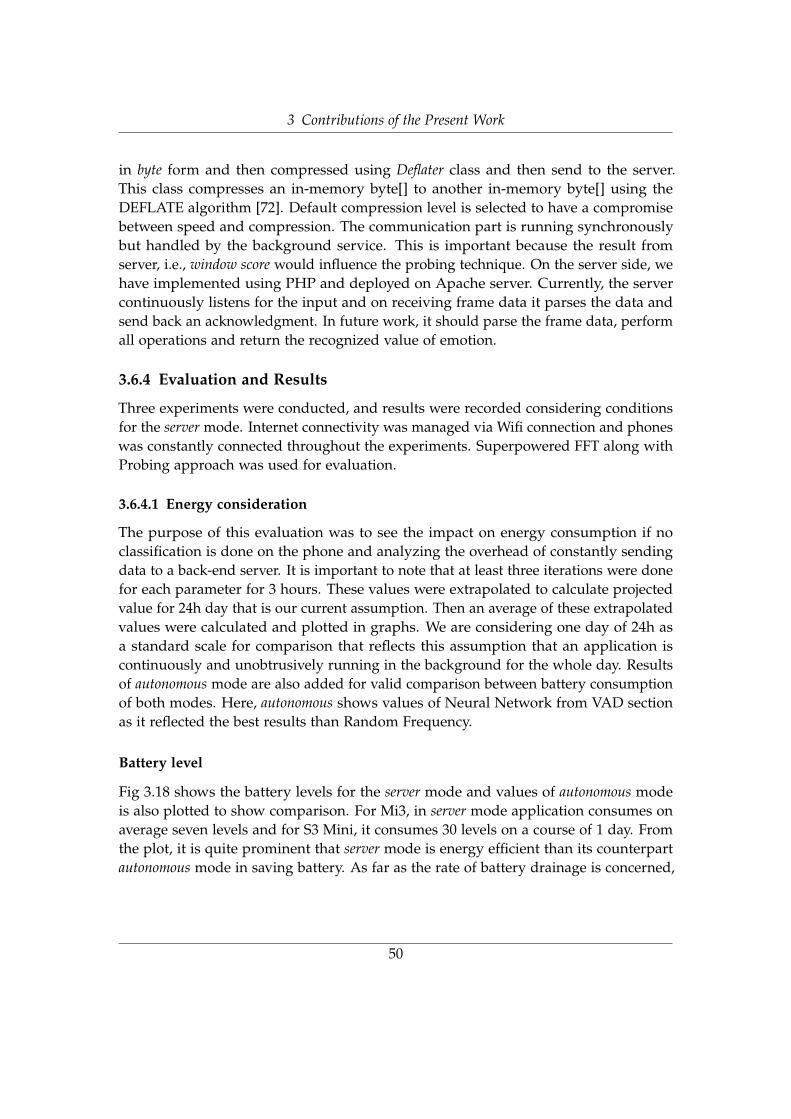
3 Contributions of the Present Work
in byte form and then compressed using Deflater class and then send to the server.This class compresses an in-memory byte[] to another in-memory byte[] using theDEFLATE algorithm [72]. Default compression level is selected to have a compromisebetween speed and compression. The communication part is running synchronouslybut handled by the background service. This is important because the result fromserver, i.e., window score would influence the probing technique. On the server side, wehave implemented using PHP and deployed on Apache server. Currently, the servercontinuously listens for the input and on receiving frame data it parses the data andsend back an acknowledgment. In future work, it should parse the frame data, performall operations and return the recognized value of emotion.
3.6.4 Evaluation and Results
Three experiments were conducted, and results were recorded considering conditionsfor the server mode. Internet connectivity was managed via Wifi connection and phoneswas constantly connected throughout the experiments. Superpowered FFT along withProbing approach was used for evaluation.
3.6.4.1 Energy consideration
The purpose of this evaluation was to see the impact on energy consumption if noclassification is done on the phone and analyzing the overhead of constantly sendingdata to a back-end server. It is important to note that at least three iterations were donefor each parameter for 3 hours. These values were extrapolated to calculate projectedvalue for 24h day that is our current assumption. Then an average of these extrapolatedvalues were calculated and plotted in graphs. We are considering one day of 24h asa standard scale for comparison that reflects this assumption that an application iscontinuously and unobtrusively running in the background for the whole day. Resultsof autonomous mode are also added for valid comparison between battery consumptionof both modes. Here, autonomous shows values of Neural Network from VAD sectionas it reflected the best results than Random Frequency.
Battery level
Fig 3.18 shows the battery levels for the server mode and values of autonomous modeis also plotted to show comparison. For Mi3, in server mode application consumes onaverage seven levels and for S3 Mini, it consumes 30 levels on a course of 1 day. Fromthe plot, it is quite prominent that server mode is energy efficient than its counterpartautonomous mode in saving battery. As far as the rate of battery drainage is concerned,
50
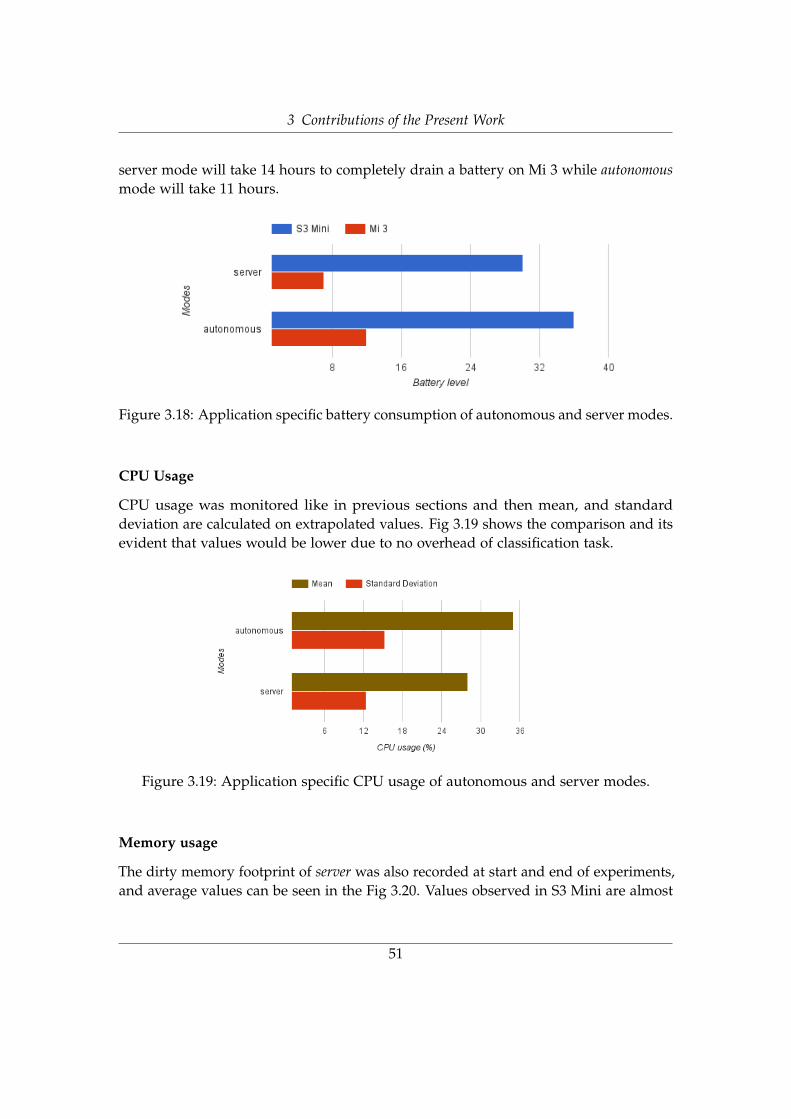
3 Contributions of the Present Work
server mode will take 14 hours to completely drain a battery on Mi 3 while autonomousmode will take 11 hours.
Figure 3.18: Application specific battery consumption of autonomous and server modes.
CPU Usage
CPU usage was monitored like in previous sections and then mean, and standarddeviation are calculated on extrapolated values. Fig 3.19 shows the comparison and itsevident that values would be lower due to no overhead of classification task.
Figure 3.19: Application specific CPU usage of autonomous and server modes.
Memory usage
The dirty memory footprint of server was also recorded at start and end of experiments,and average values can be seen in the Fig 3.20. Values observed in S3 Mini are almost
51

3 Contributions of the Present Work
the same but memory attained in Mi3 was relatively lower in server mode. This showsthat classification part does incur a memory overhead but still not at a critical level.
Figure 3.20: Application specific memory consumption of autonomous and servermodes.
52

4 Summary and Outlook
Finally, a summary of all accomplishments with learning, outcomes and future worksto continue with, is given.
4.1 Summary
The thesis was about integrating different components to build a VAD system in aform of Android application. Special attention was given to an evaluation of energyconsumption of all phases and approaches involved. The work developed is expectedto become an input module to an existing server pipeline mean to perform emotionrecognition as an ultimate goal.
In Introduction chapter (chapter 1), we have discussed the background of VAD andSpeaker recognition along with previous work done in these domains and challengeswere also explained briefly. Once the basic overview of systems is established, objectivesare outlines to show what are the expected goals of this project. Objective section alsoshows how system design should be carried out for autonomous mode and server mode.
The next chapter of Fundamentals (Chapter 2) explains all the basic concepts incontext of what are the important steps involved in MFCC feature extraction, RandomFrequency and Neural Network machine learning algorithms and about importantconcepts involved with Android implementation. Then evaluation metrics is explainedin detail which are an important element to quantify energy consumption.
The next chapter of Contributions (chapter 3) is the most important one and focuseson autonomous mode and server mode. It explains the actual work done in this thesisin the context of Audio probing strategy, MFCC extraction process and then doingVAD classification on the phone or sending features to the back-end server. TheArchitecture of the system is explained to show how the system looks like and what arethe arrangement of components in the pipeline. Audio probing is shown as a proposedsolution to the problem of power overhead when constant recording of conversation isdone. A thorough literature review was done to come up with a suitable audio probingstrategy involving three different states. MFCC feature extraction involves standardsteps, but we tried to focus more on the FFT part. Cooley-Tukey is widely used, and itscomparison was done with Superpowered FFT, which is a new implementation. It wasfound out that Superpowered is faster and also helps in saving energy.
53
4 Summary and Outlook
Chapter 3 then includes details of VAD system, the literature review of related workand evaluation of results when classification was done. The focus of the evaluation wasnot performance but energy consideration. Results showed that without probing, ahigh-end phone in use would take roughly 6 hours to completely drain a battery andwith probing, Superpowered and classification it would take 11 hours. Next comes thedescription of how server mode is incorporated in the system and the comparison ofboth modes. It was found out that for the high-end phone used, it would take 14 hoursto completely drain battery instead of 11 hours in autonomous mode. It is importantto mention that he results and the details in this chapter were presented in a way thatit helps in evaluating the feasibility of doing audio processing computations on thephone.
From an implementation point of view, the biggest challenge was to make Androidapplication keep running in background continuously without crashing. The appli-cation is bound to do resource intensive tasks in the background, so a considerableamount of time was spent on optimization.
4.2 Outlook
Future work of this thesis can be carried out in several directions. Most importantly,Audio probing technique can be verified by real training data and on the basis ofclassification results instead of simulation. Possible differences between the energyconsideration results between simulation and a real situation can be evaluated. This canlead to correction of parameters due to computational limits, for instance, the featuredimensions.
Current work can be continued, and speaker recognition is also included in au-tonomous mode and energy consideration results are evaluated. Feature preparation forVAD classification can be improved by including cepstral mean normalization and try-ing out with second order derivative approximation. In reference to classification, GMMand other machine learning algorithms can also be implemented and performance testis used to decide the best one.
Lastly, this system needs to be integrated with the existing server infrastructure. Thiswould help in evaluating emotion recognition system running on the server with realdata.
54

List of Figures
1.1 Voice Activity detection and Speaker Recognition. . . . . . . . . . . . . . 31.2 Autonomous Mode pipeline. . . . . . . . . . . . . . . . . . . . . . . . . . 61.3 Server Mode Pipeline. . . . . . . . . . . . . . . . . . . . . . . . . . . . . . 7
2.1 How Bound Service Works. . . . . . . . . . . . . . . . . . . . . . . . . . . 102.2 General feature extraction process. . . . . . . . . . . . . . . . . . . . . . . 122.3 Spectral representation of steps involved in MFCC extraction [23]. . . . 122.4 Spectral slice from the vowel [aa] before and after pre-emphasis [23]. . . 132.5 Illustration of framing and windowing [26]. . . . . . . . . . . . . . . . . 142.6 Spectrum of 25 ms hamming-windowed signal computed by FFT (plus
other smoothing) [26]. . . . . . . . . . . . . . . . . . . . . . . . . . . . . . 152.7 Mel filterbank. . . . . . . . . . . . . . . . . . . . . . . . . . . . . . . . . . . 152.8 Random forest algorithm (flow chart) [35]. . . . . . . . . . . . . . . . . . 172.9 Describing how Neural Network works [39]. . . . . . . . . . . . . . . . . 18
3.1 Architecture overview. . . . . . . . . . . . . . . . . . . . . . . . . . . . . . 213.2 Home Page . . . . . . . . . . . . . . . . . . . . . . . . . . . . . . . . . . . . 243.3 In Progress Screen . . . . . . . . . . . . . . . . . . . . . . . . . . . . . . . 243.4 Menu to switch FFT option to Cooley-Tukey . . . . . . . . . . . . . . . . 243.5 Notification Bar shows status of application . . . . . . . . . . . . . . . . 243.6 Activity diagram of probing methodology. . . . . . . . . . . . . . . . . . 263.7 Screenshot of how SysTrace looks like. . . . . . . . . . . . . . . . . . . . . 333.8 Baseline values for battery drainage. . . . . . . . . . . . . . . . . . . . . . 363.9 Application specific battery consumption between FFT types without
probing. . . . . . . . . . . . . . . . . . . . . . . . . . . . . . . . . . . . . . 373.10 Application specific battery consumption between FFT types with probing. 373.11 Application specific CPU usage for Superpowered and Cooley-Tukey
without probing. . . . . . . . . . . . . . . . . . . . . . . . . . . . . . . . . 383.12 Application specific CPU usage for Superpowered and Cooley-Tukey
with probing. . . . . . . . . . . . . . . . . . . . . . . . . . . . . . . . . . . 393.13 Application specific memory usage for Superpowered and Cooley-Tukey
without probing. . . . . . . . . . . . . . . . . . . . . . . . . . . . . . . . . 40
55

List of Figures
3.14 Application specific memory usage for Superpowered and Cooley-Tukeywith probing. . . . . . . . . . . . . . . . . . . . . . . . . . . . . . . . . . . 41
3.15 Application specific battery consumption of VAD algorithms. . . . . . . 463.16 Application specific CPU usage of VAD algorithms. . . . . . . . . . . . . 473.17 Application specific memory usage of VAD algorithms. . . . . . . . . . . 483.18 Application specific battery consumption of autonomous and server modes. 513.19 Application specific CPU usage of autonomous and server modes. . . . 513.20 Application specific memory consumption of autonomous and server
modes. . . . . . . . . . . . . . . . . . . . . . . . . . . . . . . . . . . . . . . 52
56

List of Tables
3.1 Specifications of the two testing devices: Samsung Galaxy S3 Mini andXiaomi Mi 3 . . . . . . . . . . . . . . . . . . . . . . . . . . . . . . . . . . . 32
3.2 SysTrace Result of Superpowered FFT . . . . . . . . . . . . . . . . . . . . 333.3 SysTrace Result of Cooley-Tukey FFT . . . . . . . . . . . . . . . . . . . . 34
57

Bibliography
[1] eMarketer, “2 billion consumers worldwide to get smart(phones) by 2016,” 2014.doi: http://www.emarketer.com/Article/2-Billion-Consumers-Worldwide-Smartphones-by-2016/1011694.
[2] F. Schulze and G. Groh, Studying How Character of Conversation Affects PersonalReceptivity to Mobile Notifications. Reading, Massachusetts, 2014.
[3] J. K. Baghel, “Audio-based characterization of conversations,” Masters Thesis inInformatik, Technische Universität München, Dec. 2014.
[4] K. Kuppusamy, L. M. Francis, and G. Aghila, “Cosmos: A ccontext itive model fordynamic configuration of smartphones using multifactor analysis,” InternationalJournal of Information Technology, Modeling and Computing (IJITMC), vol. 1, no. 3,2013. doi: http://arxiv.org/pdf/1309.2152.pdf.
[5] A. Joshi and R. Kaur, “Cosmos: A study of speech emotion recognition methods,”International Journal of Computer Science and Mobile Computing IJCSMC, vol. 2, no.4, 2013.
[6] E. Oliver, The challenges in large-scale smartphone user studies. New York, NY, USA:in Proceedings of the 2nd ACM International Workshop on Hot Topics in Planet-scale Measurement, 2010, vol. 14(1), 5:1–5:5.
[7] A. Benyassine, E. Shlomot, H. Y. Su, D.Massaloux, C. Lamblin, and J. P. Petit,“Itu-t recommendation g. 729 annex b: A silence compression scheme for usewith g. 729 optimized for v. 70 digital simultaneous voice and data applications,”IEEE Commun. Mag, vol. 35, no. 9, pp. 64–73, 1997.
[8] D. Y. A. Mohamed and L. Deng, “Investigation of full-sequence training of deepbelief networks for speech recognition,” In Proc.Interspeech-10, pp. 2846–2849,2010.
[9] J. W. Shin, J. H. Chang, and N. S. Kim, “Voice activity detection based on statisticalmodels and machine learning approaches,” Comput. Speech Lang, vol. 24, no. 3,pp. 515–530, 2010.
58

Bibliography
[10] K. A. Lee, A. Larcher, H. Thai, B. Ma, and H. Li, “Joint application of speechand speaker recognition for automation and security in smart home,” doi: http://citeseerx.ist.psu.edu/viewdoc/download?doi=10.1.1.459.865&rep=rep1&type=pdf.
[11] W. Oremus, I didn’t type this article, 2014. doi: http://www.slate.com/articles/technology/technology/2014/04/the_end_of_typing_speech_recognition_technology_is_getting_better_and_better.html.
[12] I. D. Corporation, Android and ios squeeze the competition, swelling to 96.3% ofthe smartphone operating system market for both 4q14 and cy14, according to idc,http://www.idc.com/getdoc.jsp?containerId=prUS25450615, Accessed Febru-ary 25, 2015.
[13] F. G. Germain, D. L. Sun, and G. J. Mysore, Speaker and Noise Independent VoiceActivity Detection. Adobe Research, 2013.
[14] “An overview of android started and bound services,” doi: http : / / www .techotopia.com/index.php/An_Overview_of_Android_Started_and_Bound_Services.
[15] “Bound services,” doi: http://developer.android.com/guide/components/bound-services.html.
[16] “Using a messenger,” doi: http://developer.android.com/guide/components/bound-services.html#Messenger.
[17] “Android interface definition language (aidl),” doi: http://developer.android.com/guide/components/aidl.html.
[18] “Sending operations to multiple threads,” doi: http://developer.android.com/training/multiple-threads/index.html.
[19] “Executor service,” doi: http://developer.android.com/reference/java/util/concurrent/ExecutorService.html.
[20] B. Logan, “Mel frequency cepstral coefficients for music modeling,” CambridgeResearch Laboratory, Tech. Rep., 2000.
[21] H. Beigi, Fundamentals of Speaker Recognition. Springer Science+Business Media,2011.
[22] X. Huang, A. Acero, and H. Hon, Spoken Language Processing - A Guide to Theory,Algorithm, and System Development. New Jersey: Prentice Hall PTR, 2001.
[23] D. J. Togneri and D. Pullella, “Feature extraction,” Accessed February 25, 2015.doi: http://web.stanford.edu/class/cs224s/lec/224s.14.lec6.pptx.
59
http://dx.doi.org/http://citeseerx.ist.psu.edu/viewdoc/download?doi=10.1.1.459.865&rep=rep1&type=pdf
http://dx.doi.org/http://citeseerx.ist.psu.edu/viewdoc/download?doi=10.1.1.459.865&rep=rep1&type=pdf

Bibliography
[24] R. Togneri and D. Pullella, “An overview of speaker identification: Accuracy androbustness issues,” IEEE Circuits and System Magzine, 2011.
[25] J. Holmes and W. Holmes, Speech Synthesis and Recognition, 2nd ed. London: Tailor& Francis, 2001.
[26] S. Young, HMMs and Related Speech Recognition Technologies. Springer Handbookof Speech Processing, 2008, pp. 539–557.
[27] S. Molau, M. pitz, R. Schlüter, and H. Ney, “Computing mel-frequency cep-stral coefficients on the power spectrum,” IEEE International Conference on Acous-tics,Speech and Signal Processing, pp. 73–76, 2001.
[28] N. A. Meseguer, “Speech analysis for automatic speech recognition,” MastersThesis in Electronics, Norwegian University of Science and Technology, 2009.
[29] “Funf : Open sensing framework,” doi: http://www.funf.org/.
[30] “Machine learning : General concepts,” doi: http://www.astroml.org/sklearn_tutorial/general_concepts.html.
[31] G. Salvi, “Mining speech sounds - machine learning methods for automaticspeech recognition and analysis,” Doctoral Thesis in Computer Science, PhDthesis, KTH School of Computer Science and Communication, 2006.
[32] C. M. Bishop, PATTERN RECOGNITION AND MACHINE LEARNING. SpringerScience+Business Media, 2006.
[33] R. O. Duda, P. E. Hart, and D. G. Stork, Pattern Classification. Wiley Inter-science,John Wiley & Sons, INC., 2001.
[34] G. Louppe, “Understanding random forests - from theory to practice,” PhD thesis,University of Liège], 2014.
[35] M. Al-Hawamdah, “Random forest,” doi: http://www.slideshare.net/m80m07/random-forest.
[36] A. W. Moore, “Clustering with gaussian mixtures,” doi: http://www.autonlab.org/tutorials/gmm14.pdf.
[37] D. Michie, D. Spiegelhalter, and C. Taylor, “Machine learning, neural and statisti-cal classification,” Feb. 1994. doi: http://www1.maths.leeds.ac.uk/~charles/statlog/whole.pdf.
[38] “A resurgence of neural networks in machine learning,” doi: http : / /datascience.berkeley.edu/machine-learning-neural-systems/.
[39] M. Nielsen, “Using neural nets to recognize handwritten digits,” Dec. 2014. doi:http://uralnetworksanddeeplearning.com/chap1.html.
60

Bibliography
[40] M. Santosa, “Uncover the meaning of top’s statistics,” Sep. 2009. doi: https://www.linux.com/learn/tutorials/42048-uncover-the-meaning-of-tops-statistics.
[41] “Viewing overall memory allocations,” doi: http://developer.android.com/tools/debugging/debugging-memory.html#ViewingAllocations.
[42] T. Seitle, “Audio based social interaction detection for mobile interruption man-agement,” Masters Thesis in Informatik, Technische Universität München, Jul.2014.
[43] J. Schalkwyk, D. Beeferman, F. Beaufays, B. Byrne, C. Chelba, M. Cohen, M.Garret, and B. Strope, “Google search by voice: A case study,”
[44] R. Ritchie, “Apple’s push-to-talk siri vs. google’s always-listening now: Which isbetter?,” Mar. 2014. doi: http://www.imore.com/apples-push-talk-siri-vs-googles-always-listening-which-better.
[45] Joren, “Tarsosdsp - java library for audio processing,” Apr. 2015. doi: http://0110.be/tags/TarsosDSP.
[46] P. Georgiev, N. D. Laney, K. K. Rachuriz, and C. Mascolo, “Dsp.ear: Leveragingco-processor support for continuous audio sensing on smartphones,”
[47] A. E. Rosenberg, A. Gorin, Z. Liu, and S. Parthasarathy, “Unsupervised speakersegmentation of telephone conversations,”
[48] E. Campione and J. Véronis, “A large-scale multilingual study of silent pauseduration,” 2002.
[49] E. Campione and J. Véronis., A large-scale multilingual study of silent pause duration.Université de Provence, France, 2002.
[50] R. R. Smolash, “Conversational turn loss due to silent pauses in aphasic speech,”Masters Thesis, Northeastern University, 1997, p. 83.
[51] H. Lu, A. B. Brush, B. Priyantha, A. K. Karlson, and J. Liu, “Speakersense: Energyefficient unobtrusive speaker identification on mobile phones,”
[52] A. Panunzi and T. R. H. Mello, “Pragmatics and prosody. illocution, modality,attitude, information patterning and speech annotation,” 2012.
[53] J. W. Mehl M. R. & Pennebaker, “The sounds of social life: A psychometric analysisof student’s daily social environments and natural conversations,” Personality andSocial Psychology, vol. 84, no. 4, pp. 857–870, 2003.
[54] “Cmusphinx - speech recognition systems developed at carnegie mellon univer-sity,” doi: http://cmusphinx.sourceforge.net/.
61
http://dx.doi.org/https://www.linux.com/learn/tutorials/42048-uncover-the-meaning-of-tops-statistics
http://dx.doi.org/https://www.linux.com/learn/tutorials/42048-uncover-the-meaning-of-tops-statistics
Bibliography
[55] F. Eyben, F. Weninger, M. Woellmer, and B. Schuller, “Opensmile - speech &music interpretation by large - space extraction,” doi: http://www.audeering.com/research/opensmile.
[56] P. Kumar, P. Jain, R. Kiran, R. N, and R. K, FFT Algorithms: A Survey. The In-ternational Journal Of Engineering and Science (IJES), 2013, vol. 2(4), pp. 22–26.
[57] “Superpowered audio engine for 64-bit arm for android and ios 8,” Jan. 2015.doi: http://superpowered.com/superpowered-audio-engine-64-bit-arm-android-ios/#axzz3YST2EBOs.
[58] “Xiaomi mi3 vs samsung galaxy s3 mini,” doi: http://versus.com/en/xiaomi-mi3-vs-samsung-galaxy-s3-mini.
[59] E. Miluzzo, N. D. Lane, K. Fodor, R. Peterson, H. Lu, M. Musolesi, S. B. Eisen-man, X. Zheng, and A. Campbell, Sensing meets mobile social networks: The design,implementation and evaluation of the cenceme application. in Proceedings of the 6thACM conference on Embedded network sensor systems, 2008, pp. 337–350.
[60] K. K. Rachuri, C. Mascolo, P. J. Rentfrow, and C. Longworth, EmotionSense : AMobile Phones based Adaptive Platform for Experimental Social Psychology. In Proc.UbiComp, 2010.
[61] H. Lu, A. J. B. Brush, A. K. Priyantha B. andKarlson, and J. Liu, Speakersense:Energy efficient unobtrusive speaker identification on mobile phones. In Proc. Pervasive,2011.
[62] H. Lu, W. Pan, T. Lane N. D.and Choudhury, and A. Campbell, Soundsense: Scal-able sound sensing for people-centric applications on mobile phones. In Proc. MobiSys,2009.
[63] L. Breiman, “Random forests,” Machine Learning, vol. 45, no. 1, pp. 5–32, 2001.
[64] A. Klautau, “The mfcc,” doi: http://www.cic.unb.br/~lamar/te073/Aulas/mfcc.pdf.
[65] S. Memon, M. Lech, and L. He, Using information theoretic vector quantization forinverted mfcc based speaker verification. 2nd International Conference on Computer,Control and Communication, 2009. IC4 2009, 2009, vol. 14(1), pp. 1–5.
[66] R. Togneri and D. Pullella, An Overview of Speaker Identification: Accuracy andRobustness Issues. IEEE CIRCUITS and SYSTEMS MAGAZINE, 2011.
[67] J. S. Garofolo, L. F. Lamel, W. M. Fisher, J. G. Fiscus, and D. S. Pallett, “Darpa timitacoustic-phonetic continous speech corpus cd-rom.,” NASA STI/Recon TechnicalReport N, vol. 93, 1993.
62

Bibliography
[68] V. ZUE, S. SENEFF, and J. GLASS, SPEECH DATABASE DEVELOPMENT ATMIT: TIMIT AND BEYOND. Massachusetts 02139, U,S.A.: Spoken LanguageSystems Group, Laboratory for Computer Science. Massachusetts institute ofTechnology, 2009.
[69] M. Rossi, S. Fees, O. Amft, N. Braune, S. Martis, and G. Troster, AmbientSense :A Real-Time Ambient Sound Recognition System for Smartphones. San Diego, U.S.A:International Workshop on the Impact of Human Mobility in Pervasive Systemsand Applications, 2013.
[70] M. Rossi, O. Amft, S. Feese, C. Kaslin, and G. Troster, MyConverse : Recognis-ing and Visualising Personal Conversations using Smartphones. UbiComp’13 Zurich,Switzerland, 2013.
[71] “Ahima e-him work group on speech recognition in the ehr,” doi: http://library.ahima.org/xpedio/groups/public/documents/ahima/bok1_022192.hcsp?dDocName=bok1_022192.
[72] Z. J. and L. A., A Universal Algorithm for Sequential Data Compression. IEEE Trans-actions on Information Theory, 1977, vol. 23(3), pp. 337–343.
[73] A. J. Eronen, V. T. Peltonen, J. T. Tuomi, A. P. Klapuri, S. Fagerlund, T. Sorsa,G. Lorho, and J. Huopaniemi, Audio-based context recognition. IEEE Transactionson Audio, Speech, and Language Processing, 2006, vol. 14(1), pp. 321–329.
[74] T. Franke, P. Lukowicz, K. Kunze, and D. Bannach, “Can a mobile phone in apocket reliably recognize ambient sounds?” International Symposium on WearableComputers (ISWC ’09), pp. 161–162, 2009.
[75] J. H. Chang, N. S. Kim, and S. K.Mitra, “Voice activity detection based on multiplestatistical models,” IEEE Trans. Signal Process, vol. 54, no. 6, pp. 1965–1976, 2006.
[76] C. Kim and R. M. Stern, Power-normalized cepstral coefficients (PNCC) for robustspeech recognition. Acoustics, Speech and Signal Processing (ICASSP), 2012 IEEEInternational Conference on. IEEE, 2012.
[77] T. Huang, H. Peng, and K. Zhang, “Model selection for gaussian mixture models,”Jan. 2013. doi: http://arxiv.org/pdf/1301.3558.pdf.
[78] Clive, “Bound services: What you should know!,” doi: http://www.101apps.co.za/articles/bound-services-what-you-should-know.html.
63