
SuperVoice: Text-Independent Speaker Verification Using ...
15
SuperVoice: T ext-Independent Speaker Verification Using Ultrasound Energy in Human Speech Hanqing Guo [email protected] Michigan State University East Lansing, MI, USA Qiben Yan [email protected] Michigan State University East Lansing, MI, USA Nikolay Ivanov [email protected] Michigan State University East Lansing, MI, USA Ying Zhu [email protected] Michigan State University East Lansing, MI, USA Li Xiao [email protected] Michigan State University East Lansing, MI, USA Eric J. Hunter [email protected] Michigan State University East Lansing, MI, USA ABSTRACT Voice-activated systems are integrated into a variety of desktop, mobile, and Internet-of-Things (IoT) devices. However, voice spoof- ing attacks, such as impersonation and replay attacks, in which malicious attackers synthesize the voice of a victim or simply re- play it, have brought growing security concerns. Existing speaker verification techniques distinguish individual speakers via the spec- trographic features extracted from an audible frequency range of voice commands. However, they often have high error rates and/or long delays. In this paper, we explore a new direction of human voice research by scrutinizing the unique characteristics of human speech at the ultrasound frequency band. Our research indicates that the high-frequency ultrasound components (e.g. speech frica- tives) from 20 to 48 kHz can significantly enhance the security and accuracy of speaker verification. We propose a speaker verification system, SuperVoice that uses a two-stream DNN architecture with a feature fusion mechanism to generate distinctive speaker models. To test the system, we create a speech dataset with 12 hours of audio (8,950 voice samples) from 127 participants. In addition, we create a second spoofed voice dataset to evaluate its security. In order to balance between controlled recordings and real-world ap- plications, the audio recordings are collected from two quiet rooms by 8 different recording devices, including 7 smartphones and an ultrasound microphone. Our evaluation shows that SuperVoice achieves 0.58% equal error rate in the speaker verification task, which reduces the best equal error rate of the existing systems by 86.1%. SuperVoice only takes 120 ms for testing an incoming utterance, outperforming all existing speaker verification systems. Moreover, within 91 ms processing time, SuperVoice achieves 0% equal error rate in detecting replay attacks launched by 5 different loudspeakers. Finally, we demonstrate that SuperVoice can be used in retail smartphones by integrating an off-the-shelf ultrasound microphone. CCS CONCEPTS • Security and privacy → Biometrics. KEYWORDS Voice Authentication; Ultrasound; Speaker Verification Figure 1: The workflow of SuperVoice. 1 INTRODUCTION Modern devices increasingly adopt biometric technologies for user authentication. Among various types of human biometrics, such as fingerprint, facial, iris, etc., voice biometric demonstrates great benefits in its high usability, convenience, and security. Speaker Verification (SV) systems commonly use voice biometrics to auto- matically accept or reject a voice input based on the speaker models stored on the smart devices or cloud. Nowadays, all the popular voice assistants, such as Siri, Alexa, and Google Assistant, have integrated SV algorithms for certain wake words (e.g., “Hey, Siri”, “Ok, Google”). A more appealing approach, called text-independent speaker veri- fication, could accurately and efficiently verify arbitrary utterances from a target speaker based on a limited set of enrolled sentences. Recently, security researchers have demonstrated the susceptibility of SV systems to voice mimicry attacks and replay attacks, where the attackers imitate victims’ voices or record/replay them to bypass the SV systems [4, 24, 30, 58]. As the number of sensitive applica- tions (e.g., banking [52]) of voice assistants is growing, practical SV systems aim to achieve not only high accuracy in text-independent speaker verification but also high efficacy in defending spoofing attacks under a limited time budget. Recent SV studies have explored the distinctive vocal or non- vocal features such as phoneme position [64], cumulative spec- trum [3], mouth motion [33, 63], body vibration [14], and sound field [59]. Based on these features, conventional machine learn- ing models have been used to generate speaker models, including correlation (CORR), support vector machine (SVM), Gaussian mix- ture models (GMM), etc. Meanwhile, deep neural network (DNN) based SV systems use robust neural networks for building speaker models with the prototypical features (e.g., waveform [21, 38, 42], arXiv:2205.14496v1 [cs.SD] 28 May 2022
-
Upload
khangminh22 -
Category
Documents
-
view
0 -
download
0
Transcript of SuperVoice: Text-Independent Speaker Verification Using ...
SuperVoice: Text-Independent Speaker Verification UsingUltrasound Energy in Human Speech
Hanqing [email protected]
Michigan State UniversityEast Lansing, MI, USA
Qiben [email protected]
Michigan State UniversityEast Lansing, MI, USA
Nikolay [email protected]
Michigan State UniversityEast Lansing, MI, USA
Ying [email protected]
Michigan State UniversityEast Lansing, MI, USA
Michigan State UniversityEast Lansing, MI, USA
Eric J. [email protected]
Michigan State UniversityEast Lansing, MI, USA
ABSTRACT
Voice-activated systems are integrated into a variety of desktop,mobile, and Internet-of-Things (IoT) devices. However, voice spoof-ing attacks, such as impersonation and replay attacks, in whichmalicious attackers synthesize the voice of a victim or simply re-play it, have brought growing security concerns. Existing speakerverification techniques distinguish individual speakers via the spec-trographic features extracted from an audible frequency range ofvoice commands. However, they often have high error rates and/orlong delays. In this paper, we explore a new direction of humanvoice research by scrutinizing the unique characteristics of humanspeech at the ultrasound frequency band. Our research indicatesthat the high-frequency ultrasound components (e.g. speech frica-tives) from 20 to 48 kHz can significantly enhance the security andaccuracy of speaker verification. We propose a speaker verificationsystem, SuperVoice that uses a two-stream DNN architecture witha feature fusion mechanism to generate distinctive speaker models.To test the system, we create a speech dataset with 12 hours ofaudio (8,950 voice samples) from 127 participants. In addition, wecreate a second spoofed voice dataset to evaluate its security. Inorder to balance between controlled recordings and real-world ap-plications, the audio recordings are collected from two quiet roomsby 8 different recording devices, including 7 smartphones and anultrasound microphone. Our evaluation shows that SuperVoiceachieves 0.58% equal error rate in the speaker verification task,which reduces the best equal error rate of the existing systemsby 86.1%. SuperVoice only takes 120 ms for testing an incomingutterance, outperforming all existing speaker verification systems.Moreover, within 91 ms processing time, SuperVoice achieves 0%equal error rate in detecting replay attacks launched by 5 differentloudspeakers. Finally, we demonstrate that SuperVoice can be usedin retail smartphones by integrating an off-the-shelf ultrasoundmicrophone.
CCS CONCEPTS
• Security and privacy→ Biometrics.
KEYWORDS
Voice Authentication; Ultrasound; Speaker Verification
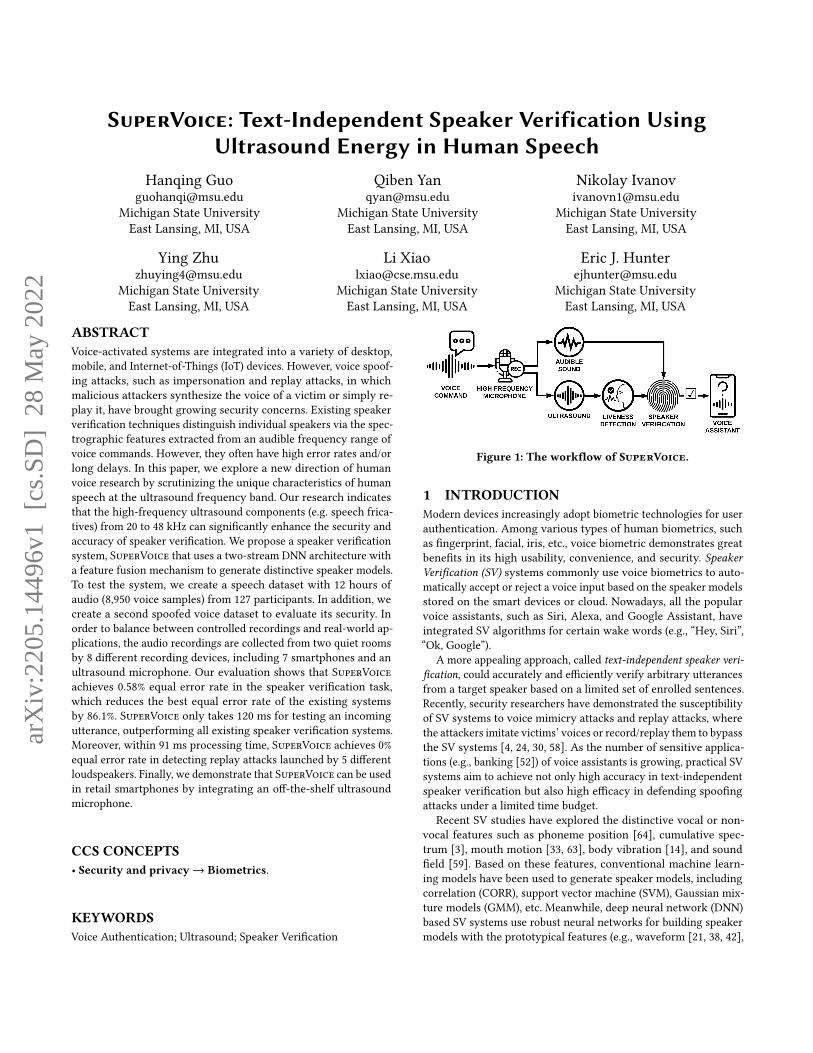
Figure 1: The workflow of SuperVoice.
1 INTRODUCTION
Modern devices increasingly adopt biometric technologies for userauthentication. Among various types of human biometrics, suchas fingerprint, facial, iris, etc., voice biometric demonstrates greatbenefits in its high usability, convenience, and security. SpeakerVerification (SV) systems commonly use voice biometrics to auto-matically accept or reject a voice input based on the speaker modelsstored on the smart devices or cloud. Nowadays, all the popularvoice assistants, such as Siri, Alexa, and Google Assistant, haveintegrated SV algorithms for certain wake words (e.g., “Hey, Siri”,“Ok, Google”).
A more appealing approach, called text-independent speaker veri-fication, could accurately and efficiently verify arbitrary utterancesfrom a target speaker based on a limited set of enrolled sentences.Recently, security researchers have demonstrated the susceptibilityof SV systems to voice mimicry attacks and replay attacks, wherethe attackers imitate victims’ voices or record/replay them to bypassthe SV systems [4, 24, 30, 58]. As the number of sensitive applica-tions (e.g., banking [52]) of voice assistants is growing, practical SVsystems aim to achieve not only high accuracy in text-independentspeaker verification but also high efficacy in defending spoofingattacks under a limited time budget.
Recent SV studies have explored the distinctive vocal or non-vocal features such as phoneme position [64], cumulative spec-trum [3], mouth motion [33, 63], body vibration [14], and soundfield [59]. Based on these features, conventional machine learn-ing models have been used to generate speaker models, includingcorrelation (CORR), support vector machine (SVM), Gaussian mix-ture models (GMM), etc. Meanwhile, deep neural network (DNN)based SV systems use robust neural networks for building speakermodels with the prototypical features (e.g., waveform [21, 38, 42],
arX
iv:2
205.
1449
6v1
[cs
.SD
] 2
8 M
ay 2
022

spectrogram [20, 35, 55], and MFCC (Mel-Frequency Cepstral Co-efficients) [50]). As summarized in Table 1, most of the existingSV systems cannot simultaneously achieve effective speaker veri-fication and defense against spoofing attacks [3, 33, 63, 64], whileothers have limitations in their usability, e.g., with the requirementof wearing extra devices [14], staying at the same positions as theenrollment phase [59], etc. Moreover, their discovered vocal or non-vocal features cannot be transferred across different speaker models.Although existing DNN-based SV systems [20, 35, 38, 50, 55] donot deal with rigid features, they tend to yield relatively high errorrates due to the lack of speaker representative features.Motivation: In this research, we aim to explore the ultrasoundenergy in human speech to enhance the accuracy and security oftext-independent speaker verification. More specifically, we inves-tigate the unique properties of the human speech in the human-
inaudible ultrasound frequency band (i.e., frequencies greater than20 kHz). High-frequency ultrasound components in human speechpresent several unique properties: first, they are imperceptible byhumans but can be captured by an ultrasound microphone; second,individual human speakers can produce ultrasound waves with dis-tinct characteristics, determined by the unique shape of the speechproduction system and the particular use (e.g. timing) of the system.Recent attacks towards voice assistants, such as DolphinAttack [62]and SurfingAttack [60], leveraged the inaudible ultrasound signalsto inject commands into voice assistants. Here, we take a reversedapproach: rather than utilizing the ultrasound signals for attack,we take advantage of the unique properties of the high-frequencyaudio spectrum for defense, with the goal of offering a more robustand accurate SV system.
We propose SuperVoice, a robust and secure text-independentSV system,which is applicable to commoditymobile devices equippedwith an ultrasound microphone. SuperVoice analyzes an incomingvoice command to the device microphone, as shown in Fig. 1. Theaudio spectrum of the voice command includes both the audible (be-low 20 kHz) and ultrasound (above 20 kHz) frequency components.SuperVoice then processes these components to extract both thelow-frequency and high-frequency feature representations usinga liveness detection module and a two-stream DNN architecture.These features are fused to a second level of classifier to generateor match a speaker embedding for the speaker verification purpose.Challenges: The design of SuperVoice faces 3 critical challenges.i) How to ascertain that the ultrasound feature can represent speaker’s
voiceprint? Prior acoustic studies show the evidences that high-frequency energy (from 8-16 kHz) contains useful features to iden-tify an individual speaker [17, 26, 43]. However, none of them fo-cuses on the ultrasound frequency band above 20 kHz. The existingfeature engineering techniques such as LPCC (Linear PredictionCepstral Coefficients), Filter banks, and MFCC cannot be directlyapplied in high-frequency data, as they are designed for the narrow-band speech data (below 8 kHz). To better utilize the ultrasoundfeatures, we design signal processing techniques to extract theunique characteristics from the ultrasound components. ii) Howto use the ultrasound features to detect replay attacks that involve
multiple playback devices? Since the attackers can use differentdevices (e.g., smartphones, ultrasonic microphone, and ultrasonicspeaker) to record and replay the voice signals, it is challenging
Table 1: SuperVoice in comparison with other SV systems.
System Feature Model Text
Indep.
Secu-
rity
Trans-
fer
VoiceLive [64] Phoneme CORR ✗ ✓ ✗
VoiceGes. [63] Mouth CORR ✗ ✓ ✗
WiVo [33] Mouth CORR ✗ ✓ ✗
VAuth [14] Body CORR ✓ ✓ ✗
Void [3] Cum. Spec SVM ✓ ✓ ✗
CaField [59] Sound field GMM ✓ ✓ ✗
TE2E [20] Spectrum CNN ✓ ✗ ✓
GE2E [55] Spectrum CNN ✓ ✗ ✓
Siri [50] MFCC RNN ✓ ✗ ✓
SincNet [38] Waveform CNN ✓ ✗ ✓
VGGVox [35] Spectrum CNN ✓ ✗ ✓
SuperVoice Ultrasound CNN ✓ ✓ ✓
to design an liveness detection method to cope with different at-tack devices with varied signal characteristics. iii) How to design a
neural network structure to integrate the ultrasound features? Sincethe speech production theory of the low-frequency features andhigh-frequency features are very different, the integration of bothfeatures is particularly challenging. We design a two-stream DNNstructure with convolutional filters to process and integrate theultrasound features.Contributions: To the best of our knowledge, we are the first toprove that ultrasound components (20 ∼ 48 kHz) in human speechcan be used to enhance the accuracy, robustness, and security of theSV systems. We demonstrate that the ultrasound components aremodel-agnostic by integrating them into multiple SV models, all ofwhich achieve enhanced performance in the SV tasks. Surprisingly,the ultrasound components in human speech have been largelyneglected prior to this work [25]. In summary, our paper makes thefollowing contributions:
• We demonstrate that human speech does include ultrasoundcomponents, and those components can help distinguishamong different human speakers. Moreover, the ultrasoundcomponents in speech signals can be utilized to identifyspoofing attacks by measuring the signals’ cumulative en-ergy levels at the high-frequency range.
• We design SuperVoice, a speaker verification and spoof-ing detection system. By incorporating a two-stream neuralnetwork structure with time-frequency spectrogram filtersand feature fusion mechanism, SuperVoice achieves highaccuracy in text-independent speaker verification.
• We launch a human voice study and collect two datasets forspeaker verification and spoofing detection. We recruit 127participants and record 8,950 audios by 8 different smartdevices, including 7 smartphones and an ultrasound mi-crophone. We also replay 500 audio samples to constructa spoofed voice dataset with 5 playback devices. In total, ourdatasets involve 127 participants with a total of 12 hoursaudios. We make our datasets publicly available at https://supervoiceapp.github.io/.
• We evaluate the performance of SuperVoice and compare itagainst other SV systems. The result shows that SuperVoiceachieves 0.58% equal error rate (EER) in speaker verification,which improves the EER of the top-performing SV system by86.1%. Remarkably, it only takes 120 ms to test an incomingutterance. Moreover, SuperVoice achieves 0% EER with 91

ms processing time for liveness detection, outperforming allexisting approaches. The two-week longevity experimentdemonstrates that SuperVoice is suitable for a long-termuse, and its performance is barely impacted by the changesin distances and angles.
2 BACKGROUND
2.1 Threat Model
We consider voice spoofing attack, which is a malicious attempt toimpersonate a genuine speaker in order to execute an unauthorizedcommand on a voice assistant. Three most popular types of voicespoofing attacks include replay, synthesis, and conversion [58]. Ina replay attack, the adversary records the legitimate command ut-tered by a genuine speaker, and replays this command later. Thesynthesis attack uses the text-to-speech (TTS) generation to createartificial voice commands acceptable by a voice assistant. The con-version attack converts an existing voice command into a differentone that can bypass speaker verification. To provide effective coun-termeasures against voice spoofing attacks, this research aims todevelop an end-to-end SV system that can perform both livenessdetection and speaker verification.
2.2 Can Humans Produce Ultrasound?
The sounds in human speech are commonly divided into vowelsand consonants: the vowels are produced when the air steadilyflows through the vocal tract above the larynx (see Fig. 2), while theconsonants are more transient in nature and are produced whenthe flow of air is partially restricted or completely stopped at thevocal fold. The consonants are characterized by voicing, place ofarticulation, and manner of articulation [10, 23]. Voicing refers tothe inclusion of vocal fold vibration as sound source which arequasi-steady and generally harmonic in nature, and the place ofarticulation represents the location of constriction in the vocal tractwhich usually results in a highly transient noise. The manner ofarticulation describes how a sound is altered by the manipulationof airstream flows from the lungs. More specifically,
when two speech organs narrow the airstream to cause friction tooccur as it passes through, Fricatives are produced. If the airstreamis stopped and then released, Stop or Affricate is produced.
Particularly, the Stop, Affricate, and Fricative consonants areknown to exhibit high frequency energy (HFE), since the airstreamis deformed by articulations. In this work, we aim to scrutinize this
under-explored and largely neglected phenomenon in human speech,
i.e., the consonants carry high energy in the human-inaudible ultra-
sound frequency range. We perform experiments to validate thata human speech production generates energy in the ultrasoundspectrum during a normal utterance, primarily within speech com-ponents such as the Stop, Affricate, and Fricatives. Fig. 3(a) showsthe human voice frequency spectra sensed by an ultrasound mi-crophone, in which a significant portion of the acoustic energy isobserved beyond 20 kHz. In this study, we are the first to show thatthe acoustic energy beyond 20 kHz (i.e., ultrasound voice compo-nents) plays an important role in the speaker verification task andoffers an effective and economical solution for liveness detection.
Figure 2: Human’s vocal tract and place of articulation.
2.3 Can Ultrasound Components Improve SV
Performance?
Carefully examining Fig. 3(a), we find that HFE is produced bycertain phonemes (marked by dashed rectangles), such as /sh/, /s/,/sy/, and /s/ within the particular phrase. Fig. 3(b) shows the lowfrequency spectrum of these phonemes, from which we can see thatthe phonemes with HFE exhibit less energy below 2 kHz comparedwith other phonemes.Remark 1: The phonemes with HFE may lack low-frequency en-ergy (LFE). This phenomenon implies that the traditional LFE-basedSV systems may not be able to capture sufficient characteristics ofthe phonemes with HFE.
Everyone has a unique vocal track, which leads to a distinctivepitch, formant, and harmonic pattern on the traditional sonic voicespectrum. The modern SV models follow this principle to identifyvoiceprint by modeling the energy distribution pattern from theLFE spectrum. Fig. 3(c) shows an obvious difference in the voicespectrum between the phonemes with HFE and the ones withoutHFE. Therefore, by capturing the unique high-frequency character-istics in the phonemes with HFE, the ultrasound components mayhelp boost the performance of the text-independent SV systems.
The most common audio sampling rate of a recorder or loud-speaker is 44.1 (or 48) kHz. Due to the Nyquist theorem, any acous-tic energy beyond 22.1 (or 24) kHz will be discarded as shown inFig. 3(d). Even though some recorders and loudspeakers have highersampling rate, their frequency responses tend not to be as flat acrossa wide frequency band as the human speech.Remark 2: Typical replay attack using loudspeakers could notproduce the ultrasound energy. Therefore, the ultrasound energyin human speech can be used to quickly identify loudspeaker-basedspoofing attacks.
In this following sections, we present our new discoveries on thespecific features of human voice components, which become thecore elements of SuperVoice. By conducting a preliminary studyon the high-frequency ultrasound components in human speech,we lay the foundation for the rest of this work. The preliminarystudy aims to answer the following four complementary researchquestions:
• RQ1: Can the ultrasound components in human speech reflect
the speaker identity?
• RQ2: How consistent are the ultrasound features for each
speaker over different speech contents?
• RQ3: How distinctive are the ultrasound features for each
individual speaker?

sh s sys
(a) Spectrum of a given phrase
sh s sys
Harmonic
(b) Spectrum of LFE components (c) Voice spectrum comparison
Noise
(d) Replayed audio spectrum
Figure 3: Observation of high frequency energy (HFE) and low frequency energy (LFE) of the phrase “She had your dark suitin greasy wash water all year” uttered by a human speaker.
• RQ4: Can the ultrasound components help determine the live-
ness of the audio input?
2.4 Ultrasound Components and Speaker
Identity
To answer RQ1, we conduct a theoretical analysis based on theprinciple of human speech. Generally, the production of speech canbe divided into two separate elements: 1) sources of sound suchas the larynx, and 2) filters that modify the sources such as thevocal tract. Different from the vowels that only use voicing source,the consonants coordinate three sources: frication, aspiration, andvoicing. Moreover, vowels are produced by relatively open vocaltract, while consonants are produced by constrictions in the vocaltract, as explained in Section 2.2. Specifically, the production ofconsonants involves more sources, faster changes in articulators,changes in the shape of the vocal tract, and more complicated artic-ulation changes such as the movement of the tongue, lips, and jaw.As a result, the consonants naturally produce a more diverse set offrequency components, which extends to the ultrasound frequencyrange. Clearly, the uniqueness of the consonant pronunciation de-pends on a human’s vocal tract shape, nasal cavity, oral cavitystructure, and the lip and tongue shapes. Among all consonants,we focus on the Stop, Affricate, and Fricative consonants, since theyproduce high-frequency components with a significantly higherenergy level (see Fig. 3(a)).
2.5 Consistency of Ultrasound Components
To address RQ2, we design an experiment to evaluate whether theultrasound frequency components are consistent across differentspeech contents. Conceptually, the ultrasound component refersto the speech component with a non-trivial energy above 20 kHz.We first identify the high-energy ultrasound components in anutterance by computing the Short-time Fourier transform (STFT)spectrum of the voice input. The STFT uses a Hann window oflength 10 ms, hop length of 2 ms, and FFT size of 2,048 pointsunder 192 kHz sampling rate, which results in 93.75 Hz ( 192,0002,048 )frequency resolution. Suppose an utterance is divided into𝑁 framesas each lasts 𝑇 in time. We consider the top 𝑀 frames with thehighest cumulative energy above 20 kHz as the frames that containultrasound components. Based on empirical observations, 𝑀 isconfigured as 100 in this paper.
However, existing studies have demonstrated that STFT spec-trum of different phonemes present notable deviations across cer-tain frequency ranges [34, 49]. This indicates that the impact ofspeech contents could pose a challenge for text-independent SVscenarios. To address this challenge, we calculate the long term
average (LTA) of the energies of ultrasound components, and theLTA is more stable within the time frame 𝑇 , expressed as follows:
𝑆𝐿𝑇𝐴 (𝑓 ) =1𝑀
𝑀∑︁𝑡=1
𝑆 (𝑓 , 𝑡), (1)
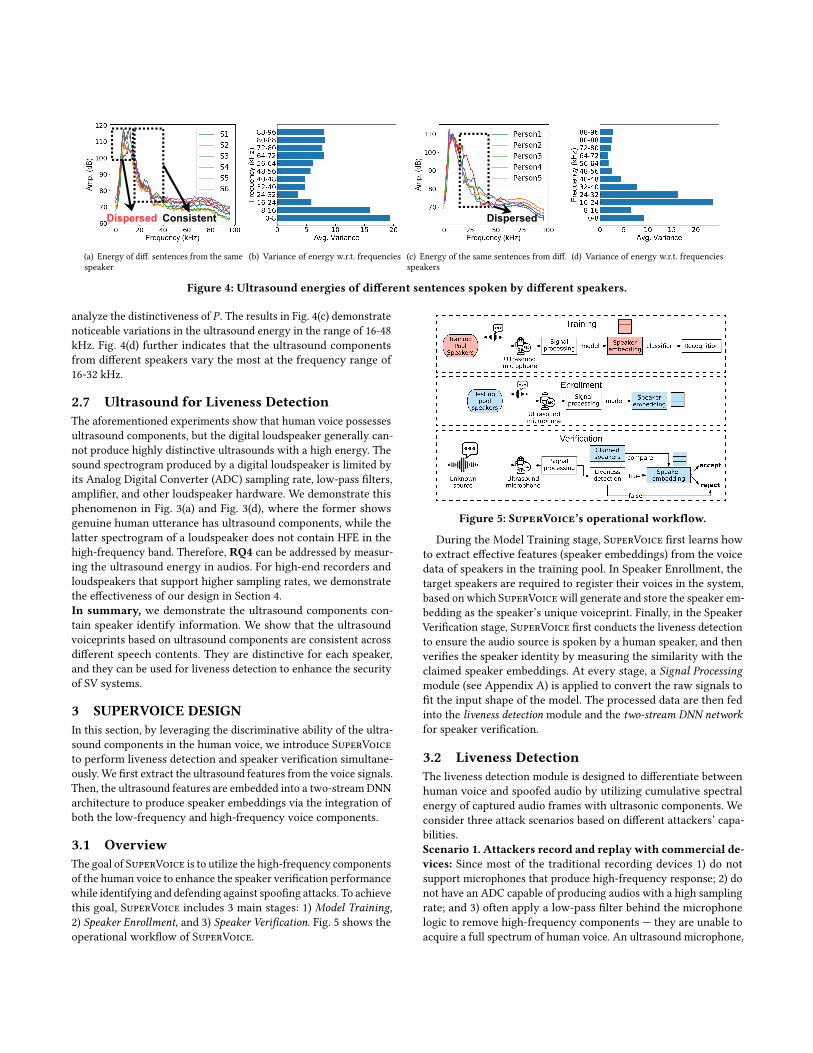
where𝑀 is the number of frames that contain high-frequency ul-trasound components, 𝑆 (𝑓 , 𝑡) is the STFT spectrogram at frequency𝑓 and frame 𝑡 , and 𝑡 is the frame index within 𝑇 . The spectrumaveraging techniques such as LTA have been used to compare theproperties of acoustic signals from random speech data [59]. Inessence, LTA can help reduce the impact of different phonemes onthe speaker profile. Here, we ask one volunteer to read the sentencesS1-S6 (refer to the website https://supervoiceapp.github.io), and col-lect the spectrogram data to compute 𝑆𝐿𝑇𝐴 . The results in Fig. 4(a)show that 𝑆𝐿𝑇𝐴 remains consistent within the frequency rangebetween 16-48 kHz across different speech contents. The varianceof 𝑆𝐿𝑇𝐴 is shown in Fig. 4(b). It is worth noting that 𝑆𝐿𝑇𝐴 (adaptedfor low frequency) varies significantly within the low frequencyrange between 0-16 kHz, which further corroborates that LTA ofultrasound components can be used to improve the performance ofSV systems.
2.6 Distinctiveness of Ultrasound
Next, we aim to address RQ3, i.e., whether the ultrasound featuresfrom human speech are unique to each speaker, given that eachspeaker’s vocal tract is unique. Prior to answering this researchquestion, we formalize the ultrasound voiceprint for each speaker.The creation of a voiceprint typically involves trainingwithmultiplesentences to achieve a reliable and robust voiceprint. Suppose theenrollment dataset is D. The ultrasound voiceprint 𝑃 is defined as:
𝑃 =1|D|
∑︁𝑠∈D
𝑆𝐿𝑇𝐴 (𝑠), (2)
where 𝑠 denotes the sentence index, and 𝑆𝐿𝑇𝐴 (𝑠) is the LTA of theultrasound energy within the sentence 𝑠 . The ultrasound voiceprintrepresents the average energy distributions of multiple enrollmentsentences.
To evaluate the capability of 𝑃 in distinguishing among speakers,we enroll the voice of five volunteers (3 males and 2 females) and
ConsistentDispersed
(a) Energy of diff. sentences from the samespeaker
(b) Variance of energy w.r.t. frequencies
Dispersed
(c) Energy of the same sentences from diff.speakers
(d) Variance of energy w.r.t. frequencies
Figure 4: Ultrasound energies of different sentences spoken by different speakers.
analyze the distinctiveness of 𝑃 . The results in Fig. 4(c) demonstratenoticeable variations in the ultrasound energy in the range of 16-48kHz. Fig. 4(d) further indicates that the ultrasound componentsfrom different speakers vary the most at the frequency range of16-32 kHz.
2.7 Ultrasound for Liveness Detection
The aforementioned experiments show that human voice possessesultrasound components, but the digital loudspeaker generally can-not produce highly distinctive ultrasounds with a high energy. Thesound spectrogram produced by a digital loudspeaker is limited byits Analog Digital Converter (ADC) sampling rate, low-pass filters,amplifier, and other loudspeaker hardware. We demonstrate thisphenomenon in Fig. 3(a) and Fig. 3(d), where the former showsgenuine human utterance has ultrasound components, while thelatter spectrogram of a loudspeaker does not contain HFE in thehigh-frequency band. Therefore, RQ4 can be addressed by measur-ing the ultrasound energy in audios. For high-end recorders andloudspeakers that support higher sampling rates, we demonstratethe effectiveness of our design in Section 4.In summary, we demonstrate the ultrasound components con-tain speaker identify information. We show that the ultrasoundvoiceprints based on ultrasound components are consistent acrossdifferent speech contents. They are distinctive for each speaker,and they can be used for liveness detection to enhance the securityof SV systems.
3 SUPERVOICE DESIGN
In this section, by leveraging the discriminative ability of the ultra-sound components in the human voice, we introduce SuperVoiceto perform liveness detection and speaker verification simultane-ously. We first extract the ultrasound features from the voice signals.Then, the ultrasound features are embedded into a two-stream DNNarchitecture to produce speaker embeddings via the integration ofboth the low-frequency and high-frequency voice components.
3.1 Overview
The goal of SuperVoice is to utilize the high-frequency componentsof the human voice to enhance the speaker verification performancewhile identifying and defending against spoofing attacks. To achievethis goal, SuperVoice includes 3 main stages: 1) Model Training,2) Speaker Enrollment, and 3) Speaker Verification. Fig. 5 shows theoperational workflow of SuperVoice.
Figure 5: SuperVoice’s operational workflow.
During the Model Training stage, SuperVoice first learns howto extract effective features (speaker embeddings) from the voicedata of speakers in the training pool. In Speaker Enrollment, thetarget speakers are required to register their voices in the system,based on which SuperVoicewill generate and store the speaker em-bedding as the speaker’s unique voiceprint. Finally, in the SpeakerVerification stage, SuperVoice first conducts the liveness detectionto ensure the audio source is spoken by a human speaker, and thenverifies the speaker identity by measuring the similarity with theclaimed speaker embeddings. At every stage, a Signal Processingmodule (see Appendix A) is applied to convert the raw signals tofit the input shape of the model. The processed data are then fedinto the liveness detection module and the two-stream DNN network
for speaker verification.
3.2 Liveness Detection
The liveness detection module is designed to differentiate betweenhuman voice and spoofed audio by utilizing cumulative spectralenergy of captured audio frames with ultrasonic components. Weconsider three attack scenarios based on different attackers’ capa-bilities.Scenario 1. Attackers record and replay with commercial de-
vices: Since most of the traditional recording devices 1) do notsupport microphones that produce high-frequency response; 2) donot have an ADC capable of producing audios with a high samplingrate; and 3) often apply a low-pass filter behind the microphonelogic to remove high-frequency components — they are unable toacquire a full spectrum of human voice. An ultrasound microphone,

No Power
Limited HFE
Low Response
(d) Scenario 3(c) Scenario 2(b) Scenario1(a) HumanFigure 6: Spectrograms from different replay attackers.
on the other hand, can capture a wider spectrum of human voice(see Fig. 6a), including the ultrasound components up to 48 kHz.The digital components of a loudspeaker usually have a samplingrate at or below 48 kHz. Therefore, the replayed audio will notcarry any high-frequency ultrasound components as opposed tothe genuine human voice (Fig. 6b). As a result, the captured ultra-sound components in human voice provide a unique opportunityfor developing accurate and efficient liveness detection withoutheavy computation.Scenario 2. Attackers recordwithhigh-endmicrophones and
replay with commercial speakers: Let us consider an attacker,who uses a high-end microphones (e.g., a microphone with highsampling rate, high-resolution ADC, and wide frequency response)to eavesdrop a victim’s voice, and replays it with a commercialspeaker such as smartphones or high-quality speakers. In such ascenario, the replayed audio will still carry limited HFE due to thecutoff frequency of commercial speakers, as shown in Fig. 6c. Incomparison with Fig. 6a, the lack of HFE in Fig. 6c constitutes aunique feature of the replay attacks.Scenario 3. Attackers recordwithhigh-endmicrophones and
replay with ultrasound speakers: The attackers can also beequipped with high-end microphones and professional ultrasoundspeakers. In this scenario, although the spectrogram of the replayedaudio carries HFE, it possesses limited LFE, as shown in Fig. 6d.
The energy difference between the replayed audio and genuinehuman voice is evident: the former has nearly zero energy below 1kHz, while the later presents an intact spectrum.
Based on our observations in Fig. 6, we leverage the cumulativespectral energy of the frames with ultrasonic components anddesign an accurate, efficient, and lightweight liveness detector toidentify if the audio source comes from a loudspeaker or a genuinehuman speaker. The detector relies on the normalized cumulativeenergy 𝑆𝑝 in different frequency ranges, as defined below:
𝑆𝑝 (𝑓 ) =∑︁𝑡 ∈𝑀
𝑆 (𝑓 , 𝑡) −∑︁𝑓
∑︁𝑡 ∈𝑇
𝑆 (𝑓 , 𝑡), (3)
where 𝑆 is the STFT spectrogram, 𝑡 is the index of frames, 𝑇 is thetotal number of frames, and𝑀 is the number of frames with ultra-sonic components. The first term of the right-hand side summarizesthe energies for all the frames with ultrasonic components, and thesecond term is used for normalization and noise reduction.
To defend against the attacks in Scenarios 1 and 2, we define 𝑅1as the ratio of the ultrasonic energy over the entire spectrum as
follows:
𝑅1 =
∑ℎ𝑖𝑔ℎ1𝑓 =𝑙𝑜𝑤1
𝑆𝑝 (𝑓 )∑ℎ𝑖𝑔ℎ1𝑓 =0 𝑆𝑝 (𝑓 )
. (4)
The numerator is composed of the normalized accumulative energyon the high-frequency band (from 𝑙𝑜𝑤1 Hz to ℎ𝑖𝑔ℎ1 Hz), whilethe denominator uses the energy of the entire spectrum (up toℎ𝑖𝑔ℎ1 Hz). In this paper, 𝑙𝑜𝑤1 and ℎ𝑖𝑔ℎ1 are set as 24 and 48 kHz,respectively. Typically, a legitimate human voicewill yield a positivevalue of 𝑅1, since its HFE is greater than the average energy of theentire spectrum (see Fig. 6a). In contrast, a replay attacker with acommercial speaker will yield a negative 𝑅1.
For Scenario 3 in which the attacker possesses a professionalultrasoundmicrophone and high-end loudspeaker, we propose𝑅2 toexamine the proportion of LFE over all frequency bands as follows:
𝑅2 =
∑𝑙𝑜𝑤2𝑓 =0 𝑆𝑝 (𝑓 )∑ℎ𝑖𝑔ℎ2𝑓 =0 𝑆𝑝 (𝑓 )
. (5)
The normalized accumulative energy below 1 kHz is supposed tobe negative for replayed audio, since it has lower energy as shownin the dotted frame in Fig. 6d with a dark color. For instance, weset 𝑙𝑜𝑤2 as 1 kHz and ℎ𝑖𝑔ℎ2 as 4 kHz.
By integrating 𝑅1 and 𝑅2, we consider a voice input as belongingto a genuine human if it satisfies the (𝑅1 > 0) ∧ (𝑅2 > 0) condition.Otherwise, it will be classified as a replayed audio.
3.3 Two-Stream DNN Model
After performing the liveness detection, SuperVoice begins pro-cessing the genuine human speech to verify the speaker identity.For speaker verification, we design a two-stream DNN model tobetter integrate ultrasound features to improve the SV performance.
Almost all the prior SV studies consider low-frequency audiosbelow 8 kHz, because the typical voice characteristics such as pitchand formants only exist in low frequency range below 8 kHz. How-ever, we observe that the spectrum features above 8 kHz can indeedcontribute to the speaker verification. Thus, the question we aim toaddress in this section is: how to embed the high-frequency features
into the speaker model?
DNN System Design: Typical machine learning based SV systemsuse the Neural Network (NN) to obtain feature embeddings [9,20, 53]. Followed by the feature embedding network, a classifierwill perform the classification based on the extracted feature em-beddings. SuperVoice follows such a structure, i.e., the first level

Figure 7: SuperVoice system architecture (L-Feat. represents low-frequency feature embedding; H-Feat. represents high-
frequency feature embedding).
of networks conducts feature embedding, while the second levelperforms the classification.Feature Fusion:Different from the typical machine learning basedSV system, SuperVoice contains two streams of DNN models: oneperforms feature embedding using the low-frequency components,and the other one embeds high-frequency features. These featureswill be fused together to construct one coherent feature vector, andthen fed into a classifier to produce a unique speaker embeddingfor every enrolled speaker.3.3.1 System Architecture. The overall SuperVoice architectureis presented in Fig. 7, which is comprised of three NNs: CNN-1,CNN-2, and an NN classifier.CNN-1: CNN has been widely used in image recognition tasks,which applies convolutional computation to shrink the input size toobtain a high-level representation of high-dimensional features [61].We feed the downsampled raw audio containing low-frequencycomponents into the CNN to obtain a low-frequency feature vector.Inspired by SincNet [38], we use Sinc-filters to simulate the behaviorof band-pass filters, and add two one-dimensional convolutionallayers to further compress the low-frequency feature space.CNN-2: In the second data stream, CNN-2 is designed to embedhigh-frequency voice components. Since the existing CNNs, suchas VGGNet [45], ResNet [19], Inception [48], are designed for imageclassification, they apply multiple convolutional layers with differ-ent shapes (mostly squared shape) of filters to capture the uniquecharacteristics of different object shapes in the image. As opposedto the image which consists of pixels, the spectrogram data pos-sesses both time and frequency components. Here, we design a newCNN architecture with three complementary time-frequency con-volutional filters to extract the HFE distribution and phoneme-levelhigh-frequency representations.F-Filters: The purpose of these frequency-domain filters (F-Filters)is to extract the HFE distribution 𝑆 (𝑓 ) at the frequency domain.We design a sequence of vertical shaped filters to convolve thehigh-frequency spectrogram. The size of F-Filter is determined bythe range of frequencies involved in the convolutional computation.Based on the observation that HFE distribution can be used as thespeaker voiceprint (see Fig. 4(a), 4(c)), in order to extract a finer-grained energy distribution with a higher frequency resolutionacross the frequency range, we construct 64 F-Filters, whose sizeis 9×1 with dilation 1×1 and 2×1. As a result, the filters cover the
frequency range from 9 · 93.75 = 843.75 Hz to 9 · 2 · 93.75 = 1, 687.5Hz.T-Filter: Two time-domain filters (T-Filter) are designed to learnthe high-frequency phoneme-level representation. The T-Filtercovers a time duration, which is shorter than a phoneme lengthto ensure that the convolution process can occur within a sin-gle phoneme. The time-domain resolution can be computed byℎ𝑜𝑝𝑆𝑇𝐹𝑇 /192 𝑘𝐻𝑧 ≈ 2.7 ms. After applying the 64 1×9 T-Filtersthat is dilated by 1×1 and 1×2, the convolution computation cov-ers the time-domain resolution between 9 · 2.7 = 24.3 ms and9 · 2.7 · 2 = 48.6 ms. Since 48 ms is shorter than typical phonemes,the time-domain frames can represent the detailed informationfrom a single phoneme.F/T-Filter: At the final stage of CNN-2, we design a sequence ofsquare filters (F/T-Filter) with the size of 5×5 to convolve both time-domain and frequency-domain features concurrently. F/T-Filtermerges the extracted high-frequency characteristics from both thetime and frequency domains, in order to yield a more representativeultrasound energy distribution for a particular speaker.NN classifier: Finally, the NN classifier takes the fused featuresthat are concatenated by the output feature vectors of the CNN-1and CNN-2 and compresses them into a desired speaker embeddingdimension. Here, we use a fully connected layer as the NN classifier.More detailed neural network parameter settings can be found inAppendix B.Speaker Embedding Generation and Matching: The speakerembedding is generated by the NN, as shown in Fig. 7. The NN isessentially a fully connected layer, which maps the fused featurevector to a speaker embedding vector. Please refer to Appendix Cfor the details of feature alignment.
When the speaker model produces the speaker embedding basedon the given audio source, SuperVoice will compare the cosinedistance with the existing speaker embeddings, which have beengenerated during the enrollment stage. Every sentence spokenby an authorized speaker will produce a representative speakerembedding. For example, if speaker A enrolls three sentences intoSuperVoice, the model will generate three embeddings for A. Toaccept the audio as belonging to speaker A, the average cosinesimilarity between the tested speaker embedding and the enrolledone should be greater than a similarity threshold 𝛾 as shown below:

Figure 8: Dataset collection platform.
𝑑𝑒𝑐𝑖𝑠𝑖𝑜𝑛 =
{𝑎𝑐𝑐𝑒𝑝𝑡, 𝑠𝑖𝑚𝑖𝑙𝑎𝑟𝑖𝑡𝑦 ≥ 𝛾𝑟𝑒 𝑗𝑒𝑐𝑡, 𝑠𝑖𝑚𝑖𝑙𝑎𝑟𝑖𝑡𝑦 < 𝛾
(6)
where 𝑠𝑖𝑚𝑖𝑙𝑎𝑟𝑖𝑡𝑦 =∑𝑁𝑖=0 𝑐𝑜𝑠 (𝑒𝑚𝑏𝑖 , 𝑒𝑚𝑏)/𝑁 , 𝑁 is number of en-
rolled audios for the speaker, 𝑒𝑚𝑏𝑖 is the 𝑖th speaker embedding,and 𝑒𝑚𝑏 is the speaker embedding to be verified.3.3.2 Model Training/Testing. It is noteworthy that although thepurpose of the NN models is to extract the speaker embedding, theyoperate differently in three stages (see Fig. 5). The model will learnhow to extract the most representative speaker embeddings viatraining with a speaker recognition task. It means that the outputof NN will connect to another fully-connected layer that maps theresult dimension from speaker embedding to the number of classesin the speaker recognition task. For example, the model will predicta speaker label for the test utterance, and then refine the networkparameters via the backpropagation of losses. In Speaker Enroll-ment stage, however, the model simply loads the set of parametersthat achieve the best results in speaker recognition task, and thenextracts the speaker embeddings for the enrolled speakers.
4 EVALUATION
In this section, we evaluate the performance of SuperVoice onspoofing detection and speaker verification, i.e., howwell SuperVoicecan verify a claimed speaker and reject a spoofed audio or a stranger’svoice. Furthermore, we integrate the high-frequency features ex-tracted by SuperVoice into existing SV models to show the trans-ferability of high-frequency features in enhancing different typesof SV models. To have a fair evaluation, we collect several speechdatasets as listed in Section 4.1. Our experiments are conductedon a desktop with Intel i7-7700k CPUs, 64GB RAM, and NVIDIA1080Ti GPU, running 64-bit Ubuntu 18.04 LTS operating system.The model complexity and time consumption are measured in sucha hardware configuration.
4.1 Speech Data Collection
Human Voice Recording. The voice data in all the existing publicdatasets is collected using regular microphones with at most 48kHz sampling rate [16, 36] to record data within [0-24] kHz.
In order to investigate the high-frequency ultrasound compo-nents in the human speech, we collect our datasets for evaluation,including Voice-1, Voice-2, and Voice-3 datasets. The Voice-1 iscollected by a high-end ultrasound microphone, Voice-2 is collectedby regular microphones on various smartphones, and Voice-3 is
collected by a low-end ultrasound microphone. In total, we collected
9,050 speech utterances from 127 volunteers, the data collection process
and user study have been approved by our school’s IRB board.
Dataset Collection Platform: There are many options for the off-the-shelf ultrasound microphone (i.e., SiSonic SPU0410LR5H_QBMESE [46] and Avisoft condenser microphone CM16 [5]). The firstmicrophone can capture the ultrasound frequency band up to 96kHz, which only requires a 1.5 V to 3.6 V power supply. The lowpower consumption and low cost ($2/piece) make it suitable formost smartphones. The second microphone provides a more flatfrequency response over the entire frequency band, allowing it tocollect better-quality ultrasound recordings. For this reason, wedeploy both SiSonic SPU0410LR5H_QB microphone and Avisoftmicrophone for data collection. The microphone and data capturingequipment are displayed in Fig. 8. For each participant, we informedthem of the purpose of the experiment and then recorded theirvoice. The participants spoke facing forward to the microphonewith a distance of 30 cm. Each participant was requested to speak 4types of sentences, totaling 100 sentences. The instruction for theexperiment and a part of the sentences can be found in Appendix D.Voice-1: Voice-1 includes the voice data from 77 volunteers, to-talling 7,700 utterances using 192 kHz sampling rate. Among the77 volunteers, most of them are college students with ages rangingfrom 18 to 56, including 38males and 40 females. For detailed datasetinformation, please refer towebsitehttps://supervoiceapp.github.io.Voice-2: Voice-2 is constructed by recording 25 sentences by 50 par-ticipants with different models of smartphones listed in Appendix D.The smartphones’ sampling rate is 48 kHz. As traditional speakermodel leverages voice features below 8 kHz, Voice-2 helps validatethe effectiveness of high-frequency features within [8, 24] kHzrange recorded using different phones. In total, Voice-2 includes1, 250 utterances with 48 kHz sampling rate.Voice-3: Voice-3 includes 200 audios recorded from 20 participants.Different from Voice-1, we collect Voice-3 by the cheap SiSonicultrasound microphone. Every participant read a sentence twicein Common type (See Appendix D), in total 10 audios per vol-unteer. The purpose of Voice-3 is to validate the performance ofSuperVoice with a cheap ultrasound microphone that can be inte-grated into smartphones [22].Spoofing Voice Dataset: We implement the spoofing attacks byreplaying the voice data collected in Voice-1 using 5 playback de-vices and 2 recording devices, including 2 smartphones, 2 high-endcommercial loudspeakers, and one ultrasonic speaker. To detectthe replay attack, we deploy an ultrasound microphone to recordthe replayed spoofing audio. The purpose of this dataset is to com-prehensively evaluate the capability of ultrasound components forliveness detection.
4.2 Performance Metrics
The performancemetrics we use for the SV task are False AcceptanceRate (FAR), False Reject Rate (FRR), and Equal Error Rate (EER). FARrepresents the rate of SuperVoice falsely accepting an unautho-rized speaker, FRR is the rate of SuperVoice rejecting a legitimatevoice, and EER is the rate where the FRR and FAR are equal. Wefurther use Classification Error Rate (CER) to evaluate the speaker

recognition (SR) performance, which is defined as the ratio of mis-classified recordings versus the total recordings. For the user study,we develop SuperVoice as an end-to-end desktop application, anduse Success Rate to measure the percentage of successful attackdefenses by SuperVoice, i.e., the times of correct recognition of thevoice owner over the total number of attempts.
4.3 Speaker Verification Performance of
Integrated Models
To make a fair comparison with other existing speaker models, wereproduce all the models in Pytorch framework. We use the Pytorchversion 1.2.0 with Python version 3.6.9. The GE2E [55] and Void [3]are closed source, which we reproduce based on their descriptions.The GMM-UBM [39], VGGVox [35] have open-source MATLABcodes, while SincNet [38] and STFT+LCNN [31] are implementedwith the Pytorch framework. All of the models are evaluated withthe same datasets described in Section 4.1.Direct Ultrasound Integration: First, we conduct a performanceevaluation of 4 popular SV models: GMM-UBM, SincNet, VGGVox,and GE2E. We follow each model’s specification to configure theinput and model parameters. Then, we evaluate their performanceusing the downsampled low frequency data ([0-8] kHz) and theoriginal data ([0-96] kHz for Voice-1 and [0-24] kHz for Voice-2).The performance comparison is presented in Table 2. The perfor-mance with low-frequency data is relatively consistent with theirreported results. When the high-frequency data is included in themodeling process, the performance of every model deterioratessignificantly. This indicates that the high-frequency data cannot bedirectly used to distinguish among different speakers.
Table 2: EER performance (%) comparison among GMM-
UBM, SincNet, VGGVox, GE2E with two different datasets.
Speaker Model Voice-1 Voice-2
(kHz) [0 − 8] [0 − 96] [0 − 8] [0 − 24]GMM-UBM 12.25 42.23 13.33 17.56SincNet 4.17 18.23 4.19 7.04VGGVox 4.64 16.63 4.66 6.75GE2E 4.98 19.15 4.97 6.96
Improved Ultrasound Integration: For a better integration ofthe high-frequency data, we adopt the architecture of SuperVoice:(1) using CNN-2 to handle high frequency data, and (2) replacingCNN-1 with the existing speaker models. To validate the efficiencyof integrating high frequency data in the smartphones, we conductan experiment with Voice-2 ([0-24] kHz) and present the resultsin Fig. 9(a). The green bar with rectangle pattern indicates theEER performance with the downsampled [0,8] kHz data, and theorange bar with cross pattern shows the performance with theaddition of high-frequency features in the range of [8, 24] kHz thatare extracted by CNN-2 and feature fusion technique. The resultsshow that the EER of SincNet has a drop from 4.19% to 2.89%, andthe EER of VGGVox decreased from 4.66% to 4.12%. Overall, theEER performance improvement is around 16.93% on average withSincNet, VGGVox, and GE2E. For the GMM-UBM model, the EERperformance has also improved slightly. The results demonstrate
(a) Performance improvement (b) EER of SuperVoice
Figure 9: Performance of: (a) ultrasound integration in exist-
ing models (1, 2, 3, and 4 represent SincNet, VGGVox, GMM-
UBM, and GE2E models), tested on Voice-2; (b) ultrasound
integration in SuperVoice system, tested on Voice-1.
SuperVoice’s transferability, i.e., it improves other SV models’ per-formance by integrating the high-frequency feature embeddings.We then evaluate the performance of ultrasound integration inSuperVoice using Voice-1 dataset. The result in Fig. 9(b) showsthe FAR and FRR of SuperVoice w.r.t. similarity threshold 𝛾 , and itindicates that the EER performance of SuperVoice is 0.58%.
Table 3: EER performance (%) of SuperVoice on different
datasets
SuperVoice Voice-1 Voice-2 Voice-3
SV SR SV SR SV SRNo HFE 4.17 5.87 4.19 6.74 6.75 7.84
[8-16] kHz 3.98 4.79 3.77 4.87 5.74 5.95[8-24] kHz 2.89 2.27 3.21 3.32 3.45 4.51[8-48] kHz 0.58 1.61 - - 1.87 3.01
[8-96] kHz 5.79 7.31 - - 9.52 14.2
4.4 Impact of Frequency Ranges
Next, we evaluate the performance of SuperVoice with differentfrequency ranges of the high-frequency data. Both SV (i.e., to verifythe voice is from an authorized user) and speaker recognition (SR)(i.e., to recognize the voice of a specific authorized user) tasks areconducted to measure the EER and CER performance. The resultsin Table 3 show that SuperVoice can achieve the EER performanceof 0.58% with Voice-1, the best among all the existing speaker mod-els. It is noteworthy that the best models that tested on Voice-1is SincNet, which has 4.17% EER (see Table 2). To further eval-uate SuperVoice on smartphones with an affordable ultrasoundmicrophone (e.g., SiSonic SPU0410LR5H), we evaluate the perfor-mance with the Voice-3 dataset. The results show that, even withlow-end ultrasonic microphone, SuperVoice achieves significantperformance improvement.
Remarkably, SuperVoice improves the EER performance of the
best SV model by 86.1% (or 55.1% with low-end microphone), via the
incorporation of ultrasound frequency components. We also find thatincorporating high-frequency features below 48 kHz will producebetter performance compared with the higher frequency range.Among all the configurations of frequency ranges, the range of[8, 48] kHz provides the best SV and SR performance in terms of EERand CER. Unsurprisingly, with a complete spectrum of [0, 96] kHz,

(a) t-SNE result (b) Distance vs. success rate (c) Angle vs. success rate (d) Durability vs. success rate
Figure 10: The user study of SuperVoice.
both SV and SR performance degrades, as more indistinguishablenoises are incorporated in the model to perplex the SR/SV tasks.
4.5 User Study
Besides the benchmark evaluation presented in the previous sec-tions, we perform two user studies to further test the effectivenessand robustness of our system. (a) Flexibility Study: users use oursystem at home and make speeches from random positions; (b)Longevity Study: users use our system over a long time span.Fig. 10(a) visualize the t-SNE result [32] of 20 participants in a 2Dspace, which clearly shows the 20 clusters of speakers.
To conduct the user studies more efficiently, we develop an end-to-end SuperVoice desktop application.Flexibility Study:We deploy the end-to-end application and ask8 volunteers to enroll in the application. Once they are successfullyenrolled, they are instructed to speak to the ultrasound microphoneat different distances and angles to test the system’s recognitionperformance. Each volunteer makes 20 test attempts. Figs. 10(b) and10(c) present the impact of distance and angle, respectively. Theresults show that SuperVoice reaches high success rate (95− 100%)within 50 cm. Although the success rate may drop to 85% beyond50 cm in the worst case, the average accuracy at 400 cm reaches87.5%. As for different angles, the recognition performance declinesfrom 95% to 85% when the speaker is side facing the microphone.The performance degradation is caused by a specific characteristicof the ultrasound microphone (i.e., CM-16 delivers different gainsat different angles according to its polar diagram).Longevity Study: For the second user study, we test the longevityperformance of our system by tracking the usage of 4 users over11 days. The participants enroll their voices on the first day, andattempt 20 times per day to use SuperVoice to identify their respec-tive voices. As illustrated in Fig. 10(d), the average success rate ismore than 95%, which means less than 1 over 20 attempts failed. Inthe end, we found no evidence of a degrading performance patternover time.
4.6 Runtime Performance
In this section, we compare the training time and testing time ofSuperVoicewith SincNet, VGGVox, GMM-UBM, and GE2E models.The training time is the total time used to create a speaker modelwith the training pool of Voice-1, while the testing time representsthe time spent to verify an incoming utterance.
Table 4 presents the runtime result. Among all the models, theGMM-UBMmodel is the fastest in terms of training and testing timewith the worst EER. SincNet converges very fast during the training
Table 4: Runtime comparison.
Model
Training Testing
time (sec.) time (sec.)
GMM-UBM 7,149 0.074VGGVox 11,308 0.279GE2E 10,348 0.21SincNet 8,180 0.134
SuperVoice 8,413 0.120
phase due to its special convolutional neural design, while the pro-posed SuperVoice also delivers comparable training time. Duringthe testing, SuperVoice outperforms VGGVox and GE2E modelsdue to its lightweight model with a small number of parameters. Itis worth noting that introducing high-frequency features does notaffect the testing speed. The results show that SuperVoice couldretain comparable runtime performance with enhanced speakerverification performance.
4.7 Liveness Detection Performance
In this section, we conduct experiments to verify the performance ofliveness detection described in Section 3.2. We prepare two types ofrecorders and 5 playback devices to replay the recordings. For everyspeaker, we replay 20 audios at a fixed position (facing forwardin 10cm) and volume (60𝑑𝐵𝑆𝑃𝐿). The defender uses the low-costSiSonic ultrasonic microphone to monitor the replayed audios.Attackers Record with Common Recorder: We first replay au-dios that were recorded from a smartphone (Samsung S9). Theboxplot in Fig. 11(a) demonstrates the results with different speak-ers. From left to right, we have Human genuine voice (Hm), BoseSoundTouch 10 speaker [7], Vifa ultrasonic speaker [6], SamsungS9 phone (Sg), iPhone 12 (Ip), and SADA D6 speaker [41]. The re-sults show that all the replay devices present a negative 𝑅1. This isattributed to the lack of HFE in the recorded audios by the smart-phone. In contrast, the genuine human voices have positive 𝑅1 and𝑅2, which is consistent with our analysis in Section 3.2. In the end,SuperVoice achieves 0% EER.Attackers Record with Ultrasound Recorder: Now, we con-sider the attackers use a high-end ultrasonic microphone to recordthe victims’ voices. We select 20 audio samples with 192 kHz sam-pling rate in Voice-1 as the source to replay them by 5 loudspeakers.The result in Fig. 11(b) shows that the commercial speakers stillcannot produce any HFE, yielding all negative 𝑅1. Moreover, a sub-stantial gap exists between the genuine and replayed voice fromany specific replay devices, which indicates that the liveness de-tection of SuperVoice is robust against any attack devices. For

(a) Recorded by smartphone recorder (b) Recorded by ultrasound microphone
Figure 11: Replay attacks
Table 5: Liveness detection performance comparison.
Models # Feat. Time (sec.) EER(%)
CQCC + GMM[30] 14,020 0.159 12.08LPC + CQCC + GMM 14,026 0.173 13.74STFT + LCNN[31] 84,770 0.321 8.8Void[3] 97 0.103 11.6SuperVoice 4 0.091 0
the attacker with an ultrasonic speaker (Vifa), we observe a posi-tive 𝑅1. However, its negative 𝑅2 signifies the low LFE. In the end,SuperVoice again achieves 0% EER, consistently confirmed by 200attack attempts.Defense Performance Comparison: Here, we compare the live-ness detection performance with 4 state-of-the-art liveness or spoof-ing detection models. We first justify our reproductions by testingthem on ASVSpoof [30] dataset and all of them reach similar perfor-mance as they claimed. We then evaluate all the models using ourspoofing dataset in terms of the number of features, average detec-tion time, and the EER performance. Table 5 presents the livenessdetection performance comparison results. Among all the models,the STFT+LCNN model runs the slowest with the most number offeatures, while its EER performance is the best among the four mod-els. Compared with the existing models, SuperVoice only uses fouraccumulative power features in 𝑅1 and 𝑅2, and achieves the fastestruntime performance with 0% EER. In consistent with the mea-sured data in Fig. 11, which visualizes the manifest gap betweengenuine and spoofed sound, SuperVoice achieves superior live-ness detection performance in terms of both the runtime and EERperformance for both the traditional loudspeakers and ultrasoundspeakers.
5 DISCUSSION
In this section, we discuss the limitations of SuperVoice, the de-fense against the inaudible attacks, and the future research direc-tions.Commands Without Fricative Consonant: As mentioned be-fore, we observed that some phonemes, especially the fricative andstop consonants, retain high energy above 20 kHz. However, if aspoken sentence does not contain any fricatives, we may not beable to find an energy spike in the spectrum. Fortunately, we ob-serve the HFE from most of Non-fricative command because the
(a) Inaudible attack on regular micro-phone
(b) Inaudible attack captured bySuperVoice
Figure 12: The defense against inaudible attacks.
speaker always alters the air flow by their articulations, and thishigh-frequency component can be adopted by SuperVoice as anextra feature for speaker verification. For those sentences that onlyinclude low-frequency energy (below 8 kHz), the low-frequencystream of our DNN architecture guarantees that SuperVoice doesnot experience any performance degradation with high-frequencyfeatures extracted from the non-fricative commands.Long-Range Speaker Verification: In this paper, we assume thatthe human speakers are within a close distance from the ultrasoundmicrophone. Prior research found that long range speaker veri-fication is challenging mainly due to the reverberation of soundand attenuation of the acoustic energy [37]. In SuperVoice, therange of voice commands will affect the received power of both thelow-frequency and high-frequency components, especially for thefricative and plosive consonants. A power amplifier may be ableto address the power attenuation issue, and we plan to evaluateits effectiveness in a long-range speaker verification in the futurework.SuperVoice on Smartphone: In our experiments, we run Super-Voice on a desktop with an ultrasound microphone. We experimentwith smartphones supporting high sampling rate (i.e., 192 kHz) tocapture high-frequency voice components. Yet, we find that, dueto the low-pass filter in the microphone system, all the frequencycomponents above 24 kHz have been filtered out.
One possible solution is to replace the microphone in the smart-phone with the one supporting ultrasound frequency [46], or usean external microphone that can be connected to the smartphone.We also evaluate the performance of an external ultrasound micro-phone, i.e., Echo Meter Touch 2 [57], in capturing high-frequencycomponents in voice signals. The external ultrasound microphoneis attached to Samsung Galaxy S9 with a sampling rate of 256kHz. The results show that the voice data captured by externalmicrophone can achieve similar SV performance as the standaloneultrasound microphone.Inaudible Attack Defense: The inaudible attacks leverage thenon-linearity of a microphone to perform an inaudible commandinjection attack through ultrasonic speakers [40, 60, 62]. The basicidea is to modulate the voice commands to ultrasound frequencyband, and then transmit the modulated signal through an ultrasonicspeakers. Due to the non-linearity of the regular microphone, theultrasonic signal will shift frequency to the audible frequency rangein the microphone. As a result, the command can be perceived byvoice-activated devices.
We evaluate SuperVoice’s capability in detecting inaudible at-tacks. We use a voice command “She had your dark suit in greasy

wash water all year" from Google TTS as a legitimate signal. Thiscommand is modulated to the inaudible frequency at𝑤𝑐 = 28 kHz.Figs. 12(a) and 12(b) show the spectrogram of inaudible attack to-wards both a regular microphone and SuperVoice’s ultrasoundmicrophone. The regular microphone only captures frequency com-ponents in the range [0, 8] kHz, while SuperVoice can capturea 2𝑤𝑐 = 56 kHz component that can be used to immediately de-tect the inaudible attack. Therefore, SuperVoice effectively defeatsinaudible command injection attacks to voice assistants.
6 RELATEDWORK
Speaker Verification: Prior studies have identified different voicefeatures for speaker verification models. They use speech spectrum,speaker pitch and formants, and even raw audio waveforms as in-puts [20, 21, 29, 38, 42], from which various voice features can be ex-tracted, such as Filter Banks, MFCC (Mel-Frequency Cepstral Coef-ficients), LPC (Linear Prediction Coefficients), LPCC (Linear Predic-tion Cepstral Coefficients), or any combination of them [11, 47, 53].With the voice features in hand, researchers further use GMM-UBM (Gaussian Mixture Model Universal Background Model) [8],JPA (Joint Factor Analysis) [27], and neural networks [9, 12, 13,20, 35, 36, 38, 53, 55] to generate speaker models. Based on thespeaker models, several classifiers such as support vector machine(SVM) [8, 56], cosine similarity [20, 44], and PLDA (ProbabilisticLinear Discriminant Analysis) [13, 28] have been employed to make(mostly probabilistic) SV decisions.SpoofingDetection: Existing spoofing detection solutions exploreboth non-vocal and vocal physical parameters of the human speakerto differentiate between human voice and spoofed sound. Amongthe approaches that use non-vocal physical parameters is Voice-Live [64], which leverages smartphone’s two microphones to cap-ture the difference in the time of arrival (ToA) of phonemes to iden-tify spoofing attacks. Although VoiceLive does not require heavycomputation, the detection accuracy largely depends on the dis-tance between the speaker and the microphones. VoiceGesture [63]performs liveness detection by identifying human gestures fromthe microphone-sensed Doppler shifts. VoiceGesture is designed forsmartphones, which cannot be directly applied for voice-controlledIoT devices due to its stringent requirement on the positions ofdevices’ microphones. Recently, WiVo [33] uses wireless sensingto detect lip movements associated with the syllables in the voicecommand, which requires to place wireless antennas very close tothe speaker. Tom et al. [51] achieve a significant reduction of errorsin replay attack detection using an adaptation of the ResNet-18model. Void [3] proposes a set of lightweight features in the audiblespectrum to distinguish the voice source, and achieves low latencywhile maintaining relatively high detection accuracy. CaField [59]leverages the sound field characteristics to detect loudspeaker-basedspoofing attacks.
Although the existing studies have achieved remarkable successin utilizing audible information of human voice, they either sufferfrom low accuracy on text-independent verification task, or requiresubstantial computational resource usage. Different from all theprevious approaches, the proposed SuperVoice aims to provide amore accurate and realistic SV solution using the high-frequencyultrasound components in the human voice.
Speaker Recognition Using High Frequency: The utilizationof high-frequency components of human voice for speaker recog-nition has been studied before [17, 18, 34]. These studies, however,are lacking of crucial technical details necessary for designing acontemporary high-performance text-independent SV system.
7 CONCLUSION
In this paper, we initiate an exploration on the underexplored ultra-sound voice components in human speech, and we find that theycan be used to enhance the performance of speaker verificationand liveness detection. We design a speaker verification system,SuperVoice, to show the strength of ultrasound frequency compo-nents in the speaker models. Specifically, we design a two-streamDNN structure to fuse the low-frequency and high-frequency fea-tures. SuperVoice significantly improves the speaker verificationand liveness detection performance in comparison with the existingmodels. We further demonstrate the possibility of integrating ultra-sound frequency features in the existing models to enhance theirverification performance. SuperVoice is accurate, lightweight, andsecure, which can be integrated into smartphones with a modifica-tion of smartphone’s microphone component.
ACKNOWLEDGEMENT
We would like to thank the anonymous reviewers for providingvaluable feedback on our work. This work was supported in part byNational Science Foundation grants CNS-1950171 and CCF-2007159.Parts of the research reported in this publication was supportedby the National Institute on Deafness and Other CommunicationDisorders, grant number R01DC012315. The content is solely theresponsibility of the author and does not necessarily representthe official views of the National Science Foundation and NationalInstitutes of Health.
REFERENCES
[1] 1993. TIMIT Acoustic-Phonetic Continuous Speech Corpus.https://catalog.ldc.upenn.edu/LDC93S1. Accessed: 2020-05-04.
[2] 2020. FFmpeg. https://www.ffmpeg.org/. Accessed: 2021-11-02.[3] Muhammad Ejaz Ahmed, Il-Youp Kwak, Jun Ho Huh, Iljoo Kim, Taekkyung Oh,
and Hyoungshick Kim. 2020. Void: A fast and light voice liveness detectionsystem. In USENIX Security.
[4] Federico Alegre, Ravichander Vipperla, Nicholas Evans, and Benoït Fauve. 2012.On the vulnerability of automatic speaker recognition to spoofing attacks with ar-tificial signals. In 2012 Proceedings of the 20th european signal processing conference(EUSIPCO). IEEE, 36–40.
[5] Avisoft. [n.d.]. http://www.avisoft.com/ultrasound-microphones/cm16-cmpa/.[6] Avisoft. [n.d.]. http://www.avisoft.com/playback/vifa/.[7] Bose. [n.d.]. https://www.bose.com/en_us/support/products/bose_speakers_
support/bose_smarthome_speakers_support/soundtouch-10-wireless-system.html.
[8] William M Campbell, Douglas E Sturim, and Douglas A Reynolds. 2006. Supportvector machines using GMM supervectors for speaker verification. IEEE signal
processing letters 13, 5 (2006), 308–311.[9] Yu-hsin Chen, Ignacio Lopez-Moreno, Tara N Sainath, Mirkó Visontai, Raziel
Alvarez, and Carolina Parada. 2015. Locally-connected and convolutional neuralnetworks for small footprint speaker recognition. In Sixteenth Annual Conference
of the International Speech Communication Association.[10] Noam Chomsky and Morris Halle. 1968. The sound pattern of English. (1968).[11] Anurag Chowdhury and Arun Ross. 2019. Fusing MFCC and LPC Features using
1D Triplet CNN for Speaker Recognition in Severely Degraded Audio Signals.IEEE Transactions on Information Forensics and Security (2019).
[12] Joon Son Chung, Arsha Nagrani, and Andrew Zisserman. 2018. Voxceleb2: Deepspeaker recognition. arXiv preprint arXiv:1806.05622 (2018).
[13] Najim Dehak, Patrick J Kenny, Réda Dehak, Pierre Dumouchel, and Pierre Ouellet.2010. Front-end factor analysis for speaker verification. IEEE Transactions on

Audio, Speech, and Language Processing 19, 4 (2010), 788–798.[14] Huan Feng, Kassem Fawaz, and Kang G Shin. 2017. Continuous authentication
for voice assistants. In Proceedings of the 23rd Annual International Conference on
Mobile Computing and Networking. 343–355.[15] Todor Ganchev, Nikos Fakotakis, and George Kokkinakis. 2005. Comparative
evaluation of various MFCC implementations on the speaker verification task. InProceedings of the SPECOM, Vol. 1. 191–194.
[16] John S Garofolo. 1993. TIMIT acoustic phonetic continuous speech corpus.Linguistic Data Consortium, 1993 (1993).
[17] Shoji Hayakawa and Fumitada Itakura. 1994. Text-dependent speaker recognitionusing the information in the higher frequency band. In Proceedings of ICASSP’94.
IEEE International Conference on Acoustics, Speech and Signal Processing, Vol. 1.IEEE, I–137.
[18] Shoji Hayakawa and Fumitada Itakura. 1995. The influence of noise on the speakerrecognition performance using the higher frequency band. In 1995 International
Conference on Acoustics, Speech, and Signal Processing, Vol. 1. IEEE, 321–324.[19] Kaiming He, Xiangyu Zhang, Shaoqing Ren, and Jian Sun. 2016. Deep residual
learning for image recognition. In Proceedings of the IEEE conference on computer
vision and pattern recognition. 770–778.[20] Georg Heigold, Ignacio Moreno, Samy Bengio, and Noam Shazeer. 2016. End-to-
end text-dependent speaker verification. In 2016 IEEE International Conference on
Acoustics, Speech and Signal Processing (ICASSP). IEEE, 5115–5119.[21] Yedid Hoshen, Ron J Weiss, and Kevin WWilson. 2015. Speech acoustic modeling
from raw multichannel waveforms. In 2015 IEEE International Conference on
Acoustics, Speech and Signal Processing (ICASSP). IEEE, 4624–4628.[22] HOTENDA. 2013. https://www.hotenda.com/datasheet-
html/2493/1/SPU0410LR5H-QB.html.[23] Roman Jakobson, C Gunnar Fant, and Morris Halle. 1951. Preliminaries to speech
analysis: The distinctive features and their correlates. (1951).[24] Artur Janicki, Federico Alegre, and Nicholas Evans. 2016. An assessment of
automatic speaker verification vulnerabilities to replay spoofing attacks. Securityand Communication Networks 9, 15 (2016), 3030–3044.
[25] N. S. Jayant and Peter Noll. 1984. Digital Coding of Waveforms, Principles and
Applications to Speech and Video. Prentice-Hall, Englewood Cliffs NJ, USA, 688.N. S. Jayant: Bell Laboratories; ISBN 0-13-211913-7.
[26] Allard Jongman, RatreeWayland, and SerenaWong. 2000. Acoustic characteristicsof English fricatives. The Journal of the Acoustical Society of America 108, 3 (2000),1252–1263.
[27] Patrick Kenny. 2005. Joint factor analysis of speaker and session variability:Theory and algorithms. CRIM, Montreal,(Report) CRIM-06/08-13 14 (2005), 28–29.
[28] Patrick Kenny, Themos Stafylakis, Pierre Ouellet, Md Jahangir Alam, and PierreDumouchel. 2013. PLDA for speaker verification with utterances of arbitraryduration. In 2013 IEEE International Conference on Acoustics, Speech and Signal
Processing. IEEE, 7649–7653.[29] Tomi Kinnunen and Haizhou Li. 2010. An overview of text-independent speaker
recognition: From features to supervectors. Speech communication 52, 1 (2010),12–40.
[30] Tomi Kinnunen, Md Sahidullah, Héctor Delgado, Massimiliano Todisco, NicholasEvans, Junichi Yamagishi, and Kong Aik Lee. 2017. The ASVspoof 2017 challenge:Assessing the limits of replay spoofing attack detection. (2017).
[31] Galina Lavrentyeva, Sergey Novoselov, Egor Malykh, Alexander Kozlov, OlegKudashev, and Vadim Shchemelinin. 2017. Audio Replay Attack Detection withDeep Learning Frameworks.. In Interspeech. 82–86.
[32] Laurens van der Maaten and Geoffrey Hinton. 2008. Visualizing data using t-SNE.Journal of machine learning research 9, Nov (2008), 2579–2605.
[33] Yan Meng, ZichangWang, Wei Zhang, Peilin Wu, Haojin Zhu, Xiaohui Liang, andYao Liu. 2018. Wivo: Enhancing the security of voice control system via wirelesssignal in iot environment. In Proceedings of the Eighteenth ACM International
Symposium on Mobile Ad Hoc Networking and Computing. 81–90.[34] Brian B Monson, Eric J Hunter, Andrew J Lotto, and Brad H Story. 2014. The
perceptual significance of high-frequency energy in the human voice. Frontiersin psychology 5 (2014), 587.
[35] Arsha Nagrani, Joon Son Chung, Weidi Xie, and Andrew Zisserman. 2020. Vox-celeb: Large-scale speaker verification in the wild. Computer Speech & Language
60 (2020), 101027.[36] Arsha Nagrani, Joon Son Chung, and Andrew Zisserman. 2017. Voxceleb: a
large-scale speaker identification dataset. arXiv preprint arXiv:1706.08612 (2017).[37] Mahesh Kumar Nandwana, Julien van Hout, Mitchell McLaren, Allen R Stauffer,
Colleen Richey, Aaron Lawson, and Martin Graciarena. 2018. Robust SpeakerRecognition from Distant Speech under Real Reverberant Environments UsingSpeaker Embeddings.. In Interspeech. 1106–1110.
[38] Mirco Ravanelli and Yoshua Bengio. 2018. Speaker recognition from raw wave-form with sincnet. In 2018 IEEE Spoken Language Technology Workshop (SLT).IEEE, 1021–1028.
[39] Douglas A Reynolds, Thomas F Quatieri, and Robert B Dunn. 2000. Speakerverification using adapted Gaussian mixture models. Digital signal processing 10,1-3 (2000), 19–41.
[40] Nirupam Roy, Haitham Hassanieh, and Romit Roy Choudhury. 2017. Backdoor:Making microphones hear inaudible sounds. In Proceedings of the 15th Annual
International Conference on Mobile Systems, Applications, and Services. 2–14.[41] Sada. [n.d.]. https://www.aliexpress.com/item/4001241222763.html.[42] Tara N Sainath, Ron J Weiss, Andrew Senior, Kevin WWilson, and Oriol Vinyals.
2015. Learning the speech front-end with raw waveform CLDNNs. In Sixteenth
Annual Conference of the International Speech Communication Association.[43] Martin F Schwartz. 1968. Identification of speaker sex from isolated, voiceless
fricatives. The Journal of the Acoustical Society of America 43, 5 (1968), 1178–1179.[44] Stephen Shum, Najim Dehak, Reda Dehak, and James R Glass. 2010. Unsupervised
Speaker Adaptation based on the Cosine Similarity for Text-Independent SpeakerVerification.. In Odyssey. 16.
[45] Karen Simonyan and Andrew Zisserman. 2014. Very deep convolutional networksfor large-scale image recognition. arXiv preprint arXiv:1409.1556 (2014).
[46] SiSonic. [n.d.]. https://www.digikey.com/product-detail/en/knowles/SPU0410LR5H-QB-7/423-1139-1-ND/2420983.
[47] David Snyder, Daniel Garcia-Romero, Daniel Povey, and Sanjeev Khudanpur. 2017.Deep Neural Network Embeddings for Text-Independent Speaker Verification..In Interspeech. 999–1003.
[48] Christian Szegedy, Wei Liu, Yangqing Jia, Pierre Sermanet, Scott Reed, DragomirAnguelov, Dumitru Erhan, Vincent Vanhoucke, and Andrew Rabinovich. 2015.Going deeper with convolutions. In Proceedings of the IEEE conference on computer
vision and pattern recognition. 1–9.[49] Marija Tabain. 2001. Variability in fricative production and spectra: Implications
for the hyper-and hypo-and quantal theories of speech production. Languageand speech 44, 1 (2001), 57–93.
[50] Siri Team. 2017. Hey siri: An on-device dnn-powered voice trigger for apple’spersonal assistant. Apple Machine Learning Journal 1, 6 (2017).
[51] Francis Tom, Mohit Jain, and Prasenjit Dey. 2018. End-To-End Audio ReplayAttack Detection Using Deep Convolutional Networks with Attention.. In Inter-
speech. 681–685.[52] usbank. 2020. How voice-activated devices work with banks.
https://www.usbank.com/financialiq/manage-your-household/personal-finance/how-voice-activated-devices-work-with-banks.html.
[53] Ehsan Variani, Xin Lei, Erik McDermott, Ignacio Lopez Moreno, and JavierGonzalez-Dominguez. 2014. Deep neural networks for small footprint text-dependent speaker verification. In 2014 IEEE ICASSP. IEEE, 4052–4056.
[54] Jesús Villalba and Eduardo Lleida. 2011. Preventing replay attacks on speakerverification systems. In 2011 Carnahan Conference on Security Technology. IEEE,1–8.
[55] Li Wan, Quan Wang, Alan Papir, and Ignacio Lopez Moreno. 2018. Generalizedend-to-end loss for speaker verification. In 2018 IEEE International Conference on
Acoustics, Speech and Signal Processing (ICASSP). IEEE, 4879–4883.[56] VincentWan and Steve Renals. 2005. Speaker verification using sequence discrim-
inant support vector machines. IEEE transactions on speech and audio processing
13, 2 (2005), 203–210.[57] WILDLIFE. [n.d.]. https://www.wildlifeacoustics.com/products/echo-meter-
touch-2-pro-ios.[58] Zhizheng Wu, Nicholas Evans, Tomi Kinnunen, Junichi Yamagishi, Federico Ale-
gre, and Haizhou Li. 2015. Spoofing and countermeasures for speaker verification:A survey. speech communication 66 (2015), 130–153.
[59] Chen Yan, Yan Long, Xiaoyu Ji, andWenyuan Xu. 2019. The Catcher in the Field: AFieldprint based Spoofing Detection for Text-Independent Speaker Verification. InProceedings of the 2019 ACM SIGSAC Conference on Computer and Communications
Security. 1215–1229.[60] Qiben Yan, Kehai Liu, Qin Zhou, Hanqing Guo, and Ning Zhang. 2020. Surfin-
gAttack: Interactive Hidden Attack on Voice Assistants Using Ultrasonic GuidedWave. In Network and Distributed Systems Security (NDSS) Symposium.
[61] Matthew D Zeiler and Rob Fergus. 2014. Visualizing and understanding convolu-tional networks. In European conference on computer vision. Springer, 818–833.
[62] Guoming Zhang, Chen Yan, Xiaoyu Ji, Tianchen Zhang, Taimin Zhang, andWenyuan Xu. 2017. DolphinAttack: Inaudible voice commands. In Proceedings of
the 2017 ACM CCS. 103–117.[63] Linghan Zhang, Sheng Tan, and Jie Yang. 2017. Hearing your voice is not enough:
An articulatory gesture based liveness detection for voice authentication. InProceedings of the 2017 ACM CCS. 57–71.
[64] Linghan Zhang, Sheng Tan, Jie Yang, and Yingying Chen. 2016. Voicelive: Aphoneme localization based liveness detection for voice authentication on smart-phones. In Proceedings of the 2016 ACM CCS. 1080–1091.
APPENDIX
A SIGNAL PROCESSING
The Signal Processing module takes raw voice signals as input. Itfirst preprocesses the raw signals to remove the recorded silence.

Then, it extracts ultrasound features from the original audio data,and downsamples the very high-quality audio to separate and ex-tract low-frequency features.
Signal Preprocessing: The signal preprocessing removes the non-speech portions of the audio. Specifically, the silence periods withinthe speech are cropped to produce a clean speech signal. The origi-nal voice signal 𝑠 (𝑡) is first segmented into𝐾 frames 𝑠𝑖 (𝑡), 𝑖 ∈ [1, 𝐾](typically a segmentation length 𝐾 is 800 samples for 16 kHz data).To crop the silence periods in 𝑠𝑖 (𝑡), we initialize a silence period
counter 𝑓 (𝑠𝑖 (𝑡)) to count the number of contiguous silence periods:
𝑓 (𝑠𝑖 (𝑡)) ={0, if (𝑠𝑖 (𝑡))2 > \
𝑓 (𝑠𝑖 (𝑡)) + 1, if (𝑠𝑖 (𝑡))2 ≤ \,(7)
\ =𝑚𝑖𝑛((𝑠𝑖 (𝑡))2) + (𝑚𝑎𝑥 ((𝑠𝑖 (𝑡))2) −𝑚𝑖𝑛((𝑠𝑖 (𝑡))2)) ∗ \𝑟𝑎𝑡𝑖𝑜 .
If the mean square power (𝑠𝑖 (𝑡))2 of the current segment 𝑠𝑖 (𝑡) isless than a pre-defined threshold \ , this segment is marked as asilence period, and 𝑓 (𝑠𝑖 (𝑡)) will be incremented. We configure aconstant number 𝑐 to indicate the toleration of contiguous silenceframes. Segment 𝑠𝑖 (𝑡) will be discarded if 𝑓 (𝑠𝑖 (𝑡)) > 𝑐 , i.e., if all theprevious 𝑐 frames are regarded as silence periods. The threshold inEq. (7) depends on the power of the current frame and a constantvalue \𝑟𝑎𝑡𝑖𝑜 , which specifies the percentile of the power distributionthat we consider as background noise. Here, we empirically set the\𝑟𝑎𝑡𝑖𝑜 as 0.25. The tolerance number 𝑐 is set to 25, which means thatif there are contiguous 25 frames below the threshold, the upcomingframes will be discarded until a higher power frame arrives, wherethe higher power frame refers to a frame with its average powerexceeding \ .
Ultrasound Feature Extraction: After the removal of the silenceperiods, we obtain the clean speech 𝑠 ′(𝑡), and thenwe perform STFTto convert the sound waveform into STFT spectrogram, which isa common approach adopted by the existing SV systems [20, 35,56]. Specifically, 𝑠 ′(𝑡) is first segmented into time frames of 2,048samples, and then STFT results are computed using a Hann windowwith 1/4 window length. We convert the amplitude spectrum to dB-scale. The FFT length is set as 2,048, while the sampling rate is 192kHz, and the frequency resolution is 192 kHz/2, 048 = 93.75 Hz. Inthe end, the feature extraction produces a matrix of STFT featureswith the size of 1, 024 × 𝐿, and 𝐿 can be expressed as follows:
𝐿 =𝑙𝑒𝑛(𝑠 ′(𝑡)) −𝑤𝑖𝑛𝑆𝑇𝐹𝑇
ℎ𝑜𝑝𝑆𝑇𝐹𝑇+ 1, (8)
where 𝑤𝑖𝑛𝑆𝑇𝐹𝑇 = 2, 048, ℎ𝑜𝑝𝑆𝑇𝐹𝑇 = 512. The STFT spectrogramcan be divided into different frequency ranges. The ultrasoundcomponents between 24-60 kHz are used for liveness detection,while the components across the range of 8-96 kHz are adopted forspeaker verification.Downsampling: Besides the high-frequency components, we alsoextract the low frequency components as a separate input to theSV system. To do that, we perform a downsampling procedureusing FFmpeg [2] tool to reduce the sampling rate of clean speech𝑠 ′(𝑡) from 192 to 16 kHz, and therefore obtain low frequency audioranging in the interval [0, 8] kHz. The downsampled data containsthe essential low-frequency components for SV [15, 54].
B NEURAL NETWORK IMPLEMENTATION
DETAILS
CNN-1: The CNNs are utilized to extract low-frequency features.As the input of low-frequency feature is raw signals, we choose theSinc-based convolutional layer [38]. The Sinc-based convolutionalnetwork has demonstrated high efficiency and accuracy on speakerverification and recognition tasks because it leverages interpretablefilters with less network parameters. In our implementation, Sinc-based convolutional layer uses 80 filters with length 𝐿 = 251. TheSync layer is followed by 2 standard one-dimensional convolutionallayers, both using 60 filters of length 5. We also apply a layer of nor-malization for all the convolutional layers, and use the LeakyRelufunction at every hidden layer to ensure the non-linearity of theCNNs model. The output dimension of the CNNs is 6420×1.CNN-2: This network takes high frequency cropped matrix asinput and generates a high level feature of the high-frequencycomponents. It contains 8 layers, the first two layers include 64F-Filters with size of 9×1 and dilated by 1×1 and 2×1 respectively.Followed by two horizontal layers, it contains 64 T-Filters with sizeof 1×9 and dilated by 1×1 and 1×2. The next 4 layers are composedby square F/T filters, each layer has 48 filters with size of 5×5, anddilated in various scale 2×2, 4×4, 8×8 and 16×16. The 8 layers arefollowed by an average pooling layer that produces a feature mapwith 512×1 dimension.NN: The last NN model is used to produce speaker embeddingsusing the fused features from CNNs-1 and CNNs-2. It is a fullyconnected layer that takes features with a dimension of 6420+512×1and output 2048×1 dimension as the speaker embedding. Notethat during the training procedure, the NN model also containsanother fully connected layer and a softmax classifier, such that itis able to map 2048×1 dimension to 𝑐𝑙𝑎𝑠𝑠×1 to process the speakerrecognition task, where 𝑐𝑙𝑎𝑠𝑠 is the number of speakers in thetraining pool.Hyperparameters: In the training stage, we use RMSprop opti-mizer, with a learning rate 𝑙𝑟 = 0.001, 𝛼 = 0.95, 𝜖 = 10−7, and thedefault minibatch is 128.
C FEATURE ALIGNMENT
One of the key challenges in SuperVoice is to generate the inputfeatures from the low-frequency raw audio and high-frequencyspectrum simultaneously. For this purpose, the CNN-1 and CNN-2models require the aligned inputs of different formats (i.e., rawaudio versus spectrum data). Given an incoming audio, we useone window to generate low-frequency raw audio frames, andanother window to collect the windowed STFT spectrum data tobe fit into the models. The window used for CNN-2 model matchesthe low-frequency window of the CNN model. In this paper, weset the window size of the low-frequency data 𝐿𝑤𝑖𝑛 to 200 ms,corresponding to 200 ms × 16 kHz = 3, 200 samples, and the hopsize 𝐿ℎ𝑜𝑝 to 10 ms with 10 ms × 16 kHz = 160 samples. Then,the high-frequency window size 𝐻𝑤𝑖𝑛 and hop size 𝐻ℎ𝑜𝑝 can becomputed as follows:
𝐻𝑤𝑖𝑛 = 𝐿𝑤𝑖𝑛 × 𝛼/ℎ𝑜𝑝𝑆𝑇𝐹𝑇 ,𝐻ℎ𝑜𝑝 = 𝐿ℎ𝑜𝑝 × 𝛼/ℎ𝑜𝑝𝑆𝑇𝐹𝑇 ,
(9)

where ℎ𝑜𝑝𝑆𝑇𝐹𝑇 is the hop length of STFT spectrum (i.e., 512 in thispaper), and 𝛼 is the ratio of high and low sampling rates. Here, thehigh and low sampling rates are 192 kHz and 16 kHz, respectively,i.e., 𝛼 = 12.ℎ𝑜𝑝𝑆𝑇𝐹𝑇 is used to convert the number of samples in thelow-frequency components into the number of columns in the STFTmatrix of the corresponding high-frequency components. This win-dow alignment scheme guarantees that these two types of featurescorresponding to the same original audio input are generated at thesame time. Therefore, different types of input features, includingboth the low-frequency voice feature and ultrasound voice feature,can be fused together to form a coherent feature vector.
D DATASET COLLECTION AND
COMPOSITION
Dataset Collection Routine: To formulate our ultrasound dataset(e.g. Voice-1 and Voice-2), we recruit volunteers as many as we canby spreading information via social media, public Facebook page,and posters on information boards. We provide each volunteer $5gift card for compensation. Here are the procedures we follow foreach volunteer to conduct our experiment.
Step 1: Schedule a remote instruction session with each volun-teer.
Step 2: Prepare scripts for the volunteer and disinfection onmicrophones and door handles.
Step 3: Instruct the volunteer outside the data collection room(e.g. getting familiar with the user interface).
Step 4: Register the basic information of the volunteer.Step 5: Conduct the voice recording experiment.
Types of Sentences: There are 4 types of sentences we designed.1. Common type: The common type contains 5 sentences, two ofwhich are from the dialect set of TIMIT dataset [1],
while the other three sentences are “This is a test", “Please identifyme", and “OK, please recognize my voice". For this type of sentence,each participant will speak every sentence twice, resulting in 10recordings.2. Compact type: The compact type has 200 sentences in total.They are randomly chosen from the TIMIT dataset, and designedto provide a good coverage of phonemes, with extra occurrences ofphonetic contexts that are considered either difficult or of particularinterest. Each participant reads 40 sentences from this type.3. Fricative command: The fricative commands are collected fromthe website ok-google.io, which provides commonly used com-mands on Google Assistant. We select 50 sentences that have frica-tive phonemes, e.g., “find my phone", “turn on my lights". Eachspeaker randomly picks 25 sentences from this type of commands.4. Non-fricative command: Similar to the fricative commands,the non-fricative commands are also collected from ok-google.io,which do not contain any fricatives. We randomly pick 25 sentencesand ask every participant to read 25 sentences from this type.
Table 6: Training and testing pools (# of sentences).
Dataset
Training pool Testing pool
Training Valid. Enroll Verif.
Voice-1 2,400 600 144 4656Voice-2 - - 75 1,175Voice-3 - - 60 140
Table 6 shows the breakdown of training and testing pools forVoice-1 and Voice-2. For Voice-1, 30 participants are randomlyselected into the training pool, and their recordings are then dividedinto the training and validation sets as described in Table 6. Forparticipants in the training pool, their audios in the training set areused to train the SuperVoice model, while audios in validation setare applied to validate the training process every 10 epochs. As forthose in testing pool, the recordings are split into the enrollmentand verification sets. In the testing procedure, SuperVoice loadsthe trained model and uses the enrollment utterances to generatethe speakers’ embedding, and then it produces the embedding andcalculates the similarity to make SV decision (i.e., accept or reject).All participants’ voice data in Voice-2 are only used for testing.For Voice-2, we used 7 smartphones: iPhone X, iPhone XS, iPhone8, iPhone Pro Max (Apple), Mi 9 (Xiaomi), and Mate 20 (Huawei).For Voice-3, we recruit 20 volunteers to speak 10 sentences. Then,we use 3 audios from every speaker as enrollment, and the rest ofaudios are used to verify the enrolled volunteers.