Spatio–temporal variation in microclimate, the surface energy balance and ablation over a cirque...
26
INTERNATIONAL JOURNAL OF CLIMATOLOGY Int. J. Climatol. 20: 733–758 (2000) SPATIO – TEMPORAL VARIATION IN MICROCLIMATE, THE SURFACE ENERGY BALANCE AND ABLATION OVER A CIRQUE GLACIER DAVID M. HANNAH*, ANGELA M. GURNELL and GLENN R. McGREGOR School of Geography and En6ironmental Sciences, Uni6ersity of Birmingham, Birmingham, UK Recei6ed 9 May 1999 Re6ised 20 July 1999 Accepted 25 July 1999 ABSTRACT Climatic processes, operating at a range of scales, drive energy fluxes at the glacier surface which control meltwater generation and ultimately runoff. Nevertheless, to date, most glacier microclimate research has been both temporally (short-term) and spatially (single station) restricted. This paper addresses this knowledge gap by reporting on a detailed, empirical study which characterizes spatio – temporal variations in and linkages between glacier microcli- mate, surface energy and mass exchanges within a small glacierized cirque (Taillon Glacier, French Pyre ´ne ´es) over two melt seasons. Data collected at five automatic weather stations (AWSs) and over ablation stake networks suggest that topoclimates, altitude and transient snowline position primarily determine the distribution of glacier energy receipt and, in turn, snow- and ice-melt patterns. Generally net radiation is the dominant energy source, followed by sensible heat, while latent heat is an energy sink. However, the magnitude and partitioning of energy balance terms, and consequently ablation, vary across the glacier both seasonally and with prevailing weather conditions. Impor- tantly, this paper demonstrates that such monitoring programmes are required to truly represent and provide a sound basis for modelling glacier energy and mass-balances in both space and time. Copyright © 2000 Royal Meteorolog- ical Society. KEY WORDS: microclimate; energy budget; snow- and ice-melt; glacierized basin; French Pyre ´ne ´es 1. INTRODUCTION Climatic processes, operating at a range of spatial and temporal scales, drive energy exchanges at the glacier surface which control meltwater generation and ultimately proglacial runoff. Micrometeorological observations were first made on glaciers during the 1930s (e.g. Angstrom, 1933), while more detailed energy balance studies were carried out in the early 1950s (e.g. Hoinkes, 1953). Since then, both the instrumentation and the equations have been continually refined, allowing energy budgets to be computed in nival and glacierized environments from the poles (e.g. Braithwaite, 1981) to the equator (e.g. Hastenrath and Patnaik, 1980). Previous energy balance studies may be divided into two main groups: (i) attempts to relate the heat budget to ablation measurements, in order to improve flux parameterization or to elucidate the relative influence of the energy balance components on melting (e.g. Hay and Fitzharris, 1988; Braithwaite and Olesen, 1990; Munro, 1990; Van de Wal et al., 1992); and (ii) energy balance models used to predict mass-balance gradients for specific glaciers under climatic change scenarios (e.g. Munro, 1991; Oerlermans, 1992a,b). The former are focused upon in this paper. Despite this considerable interest, energy balance research has been both temporally and spatially restricted; therefore, the representativeness of results obtained could be questioned. Studies are almost invariably conducted for short time periods during the ablation season; consequently, data strongly reflect prevailing weather conditions (e.g. McGregor and Gellatly, 1996). Furthermore, flux variations over these * Correspondence to: School of Geography and Environmental Sciences, University of Birmingham, Edgbaston, Birmingham B15 2TT, UK. Tel.: +44 121 4146925; fax: +44 121 4145528; e-mail: [email protected] Copyright © 2000 Royal Meteorological Society
Transcript of Spatio–temporal variation in microclimate, the surface energy balance and ablation over a cirque...

INTERNATIONAL JOURNAL OF CLIMATOLOGY
Int. J. Climatol. 20: 733–758 (2000)
SPATIO–TEMPORAL VARIATION IN MICROCLIMATE, THESURFACE ENERGY BALANCE AND ABLATION OVER A CIRQUE
GLACIERDAVID M. HANNAH*, ANGELA M. GURNELL and GLENN R. McGREGOR
School of Geography and En6ironmental Sciences, Uni6ersity of Birmingham, Birmingham, UK
Recei6ed 9 May 1999Re6ised 20 July 1999
Accepted 25 July 1999
ABSTRACT
Climatic processes, operating at a range of scales, drive energy fluxes at the glacier surface which control meltwatergeneration and ultimately runoff. Nevertheless, to date, most glacier microclimate research has been both temporally(short-term) and spatially (single station) restricted. This paper addresses this knowledge gap by reporting on adetailed, empirical study which characterizes spatio–temporal variations in and linkages between glacier microcli-mate, surface energy and mass exchanges within a small glacierized cirque (Taillon Glacier, French Pyrenees) overtwo melt seasons. Data collected at five automatic weather stations (AWSs) and over ablation stake networks suggestthat topoclimates, altitude and transient snowline position primarily determine the distribution of glacier energyreceipt and, in turn, snow- and ice-melt patterns. Generally net radiation is the dominant energy source, followed bysensible heat, while latent heat is an energy sink. However, the magnitude and partitioning of energy balance terms,and consequently ablation, vary across the glacier both seasonally and with prevailing weather conditions. Impor-tantly, this paper demonstrates that such monitoring programmes are required to truly represent and provide a soundbasis for modelling glacier energy and mass-balances in both space and time. Copyright © 2000 Royal Meteorolog-ical Society.
KEY WORDS: microclimate; energy budget; snow- and ice-melt; glacierized basin; French Pyrenees
1. INTRODUCTION
Climatic processes, operating at a range of spatial and temporal scales, drive energy exchanges at theglacier surface which control meltwater generation and ultimately proglacial runoff. Micrometeorologicalobservations were first made on glaciers during the 1930s (e.g. Angstrom, 1933), while more detailedenergy balance studies were carried out in the early 1950s (e.g. Hoinkes, 1953). Since then, both theinstrumentation and the equations have been continually refined, allowing energy budgets to be computedin nival and glacierized environments from the poles (e.g. Braithwaite, 1981) to the equator (e.g.Hastenrath and Patnaik, 1980). Previous energy balance studies may be divided into two main groups: (i)attempts to relate the heat budget to ablation measurements, in order to improve flux parameterizationor to elucidate the relative influence of the energy balance components on melting (e.g. Hay andFitzharris, 1988; Braithwaite and Olesen, 1990; Munro, 1990; Van de Wal et al., 1992); and (ii) energybalance models used to predict mass-balance gradients for specific glaciers under climatic change scenarios(e.g. Munro, 1991; Oerlermans, 1992a,b). The former are focused upon in this paper.
Despite this considerable interest, energy balance research has been both temporally and spatiallyrestricted; therefore, the representativeness of results obtained could be questioned. Studies are almostinvariably conducted for short time periods during the ablation season; consequently, data strongly reflectprevailing weather conditions (e.g. McGregor and Gellatly, 1996). Furthermore, flux variations over these
* Correspondence to: School of Geography and Environmental Sciences, University of Birmingham, Edgbaston, BirminghamB15 2TT, UK. Tel.: +44 121 4146925; fax: +44 121 4145528; e-mail: [email protected]
Copyright © 2000 Royal Meteorological Society

D.M. HANNAH ET AL.734
brief time periods could be disproportionately influenced by measurement inaccuracies (Marcus et al.,1992). Ideally, energy balance terms should be estimated over longer time periods in order to experi-ence a range of weather conditions and to obtain representative figures (Paterson, 1994).
Microclimate studies on glaciers have been limited to either single locations or, to a lesser extent,one-dimensional altitudinal transects (e.g. Oerlermans and Vugts, 1993; Greuell et al., 1997; Greuelland Bohm, 1998). The interactions between aspect (e.g. Young, 1971), surface properties (e.g. Ambach,1985), wind exposure (e.g. Marcus et al., 1985), elevation (e.g. Rothlisberger and Lang, 1987) andposition with respect to the surrounding terrain (e.g. Dozier and Outcalt, 1979) cause marked energybalance variations across glaciers. Nevertheless, virtually no spatially-distributed studies have beenconducted. Two-dimensional energy balance models have been developed by Munro and Young (1982)for the Peyto Glacier, Alberta, Canada, and by Escher-Vetter (1985) for Vernagtferner, Oeztal Alps,Austria; however, both models have fairly coarse spatial resolutions, 200 m2 and 100 m2 respectively.Munro and Young (1982) modelled shortwave radiation only and neither model parameterized localsurface albedo variations accurately. More recently, Arnold et al. (1996) produced a three-dimensionalenergy balance model for the Haut Glacier d’Arolla, Valais, Switzerland, based on the equations usedby Braithwaite and Olesen (1990) to model ablation on the margin of the Greenland Ice Sheet.Although this model has a considerably finer spatial resolution (20 m2) than its predecessors, modelassumptions were tested and validation was undertaken using point and one-dimensional data sets.Surface albedo was internally parameterized (as a function of distance from the equilibrium line andcumulative melt) but still proved to be the main source of error between modelled and measuredablation.
Thus, it is necessary to set-up monitoring networks over longer time periods in order to collectempirical heat budget and ablation data across the glacier surface. This paper seeks to addressthis research gap by reporting on a detailed, field-based study which aims to characterize spatialand temporal patterns in (and the linkages between) glacier microclimate, the surface energy balanceand snow- and ice-melt within a small cirque in the French Pyrenees, under a range of melt sea-son conditions over the course of two summers. The spatially and temporally variable climato-logical, glaciological and hydrological controls on ablation are identified and, in doing so, the repre-sentativeness of measurements typically recorded at one station over short time periods is assessed.
2. STUDY AREA
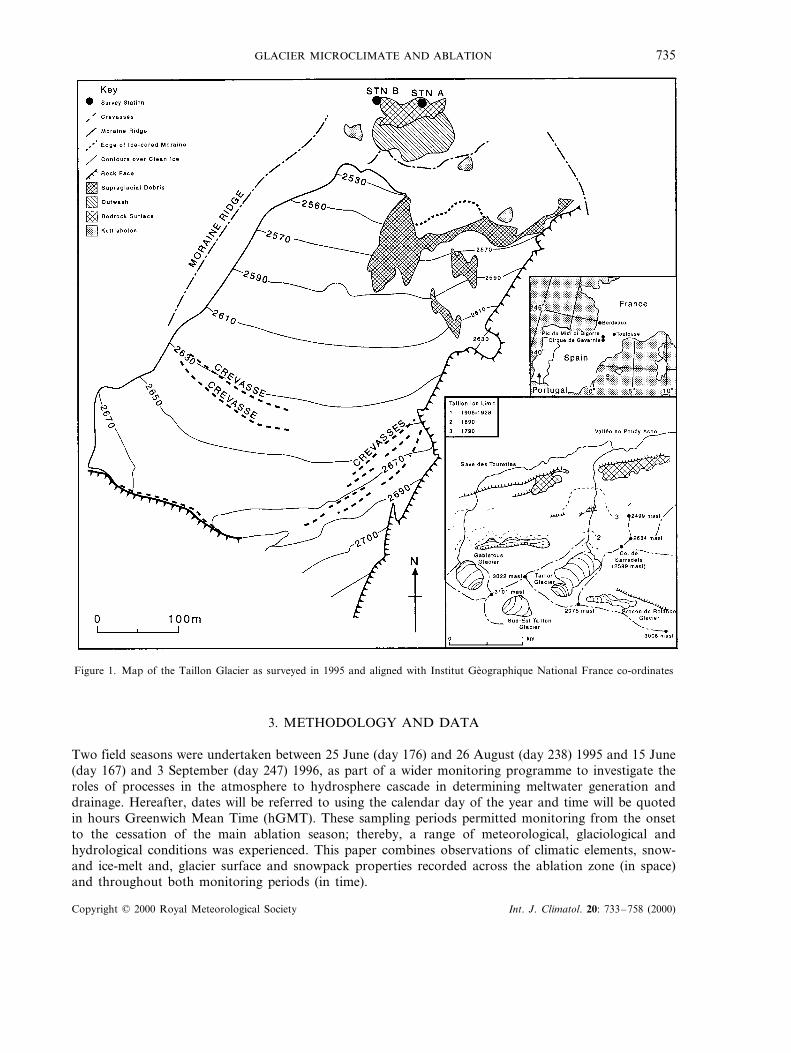
The Taillon Glacier, Cirque de Gavarnie, French Pyrenees (Figure 1), was selected as being particu-larly suitable for detailed hydrometeorological monitoring as it is relatively small, accessible and hasfew major crevasses. This glacier is situated 144 km from the Atlantic Ocean (43°06%N, 0°01%W) in anortheast-facing cirque at the climatically-sensitive southern limit of contemporary European glacia-tion. It covers an area of 22.4 ha (61.4% of the well-defined 36.5 ha catchment) and is the thirdlargest of the 50 remaining Pyrenean glaciers (McGregor and Gellatly, 1996). It spans an altitudinalrange of almost 500 m, descending from the cirque headwall at 3022 metres above sea level (m.a.s.l.)to the terminus at 2526 m.a.s.l.
Since the late-19th century, the Taillon Glacier has experienced retreat and downwasting, with a29% decrease in area and a 57% reduction in volume between 1906 and 1989 (Gellatly et al., 1995).Nevertheless, periods of glacier advance (1906–1911, 1926–1928, 1945 and 1963–1964) have beenassociated with below-average seasonal temperatures and above-average winter precipitation (McGre-gor et al., 1995). Topographic controls on local climate have been suggested as important in determin-ing the survival of this and other vestigial Pyrenean glaciers, especially given their comparatively lowsnout altitude and southerly geographical location (Grove and Gellatly, 1992).
Copyright © 2000 Royal Meteorological Society Int. J. Climatol. 20: 733–758 (2000)
GLACIER MICROCLIMATE AND ABLATION 735
Figure 1. Map of the Taillon Glacier as surveyed in 1995 and aligned with Institut Geographique National France co-ordinates
3. METHODOLOGY AND DATA
Two field seasons were undertaken between 25 June (day 176) and 26 August (day 238) 1995 and 15 June(day 167) and 3 September (day 247) 1996, as part of a wider monitoring programme to investigate theroles of processes in the atmosphere to hydrosphere cascade in determining meltwater generation anddrainage. Hereafter, dates will be referred to using the calendar day of the year and time will be quotedin hours Greenwich Mean Time (hGMT). These sampling periods permitted monitoring from the onsetto the cessation of the main ablation season; thereby, a range of meteorological, glaciological andhydrological conditions was experienced. This paper combines observations of climatic elements, snow-and ice-melt and, glacier surface and snowpack properties recorded across the ablation zone (in space)and throughout both monitoring periods (in time).
Copyright © 2000 Royal Meteorological Society Int. J. Climatol. 20: 733–758 (2000)

D.M. HANNAH ET AL.736
3.1. Monitoring climatic 6ariables
Meteorological data were continuously recorded by automatic weather stations (AWSs). Five AWSswere set-up in a diamond shaped network over the 1995 monitoring period (Figure 2(a)). The cross-valleytransect (using the East, Middle and West AWSs) was intended to characterize topographic shadingeffects, while the longitudinal transect (using the Bottom, Middle and Top AWSs) investigated theinfluences of surface elevation and increasing distance from the glacier terminus. In 1996, one AWS waslocated in the approximate centre of the glacier and another in the upper ablation zone (Figure 2(a)), thusfacilitating a comparative study between the energy budget over a melting snowpack (at the Top AWS)and an ice surface (at the Middle AWS) later in the melt season.
The difficulties encountered in setting-up AWSs on ablating surfaces are well documented (e.g. Munro,1990). During 1995, the Bottom and Middle AWSs were mounted on tripods; the Top, East and WestAWSs were erected on a central pole drilled into the glacier and secured using guy wires. The West AWShad to be set-up as a ‘floating’ station (e.g. Stenning et al., 1981) once ice became exposed. In 1996, bothAWSs were mounted on tripods. AWS cross-arms were maintained daily at 0.5 m or 1 m above the glaciersurface, keeping sensors within the constant flux layer (McGregor and Gellatly, 1996). Details of theinstrumentation used at the Bottom, Middle and Top AWSs are given by Hannah and McGregor (1997).The East and West sites employed standard UK Institute of Hydrology AWS instruments, as describedby Strangeways (1981). Weather station sensors were scanned at 10 s intervals from which 15 minaverages were calculated and sent to final storage on Campbell Scientific dataloggers. Observations ofatmospheric pressure, net radiation, humidity, air temperature and wind speed provided the basis forcomputation of the energy balance. Wind direction measurements identified switching between anabaticand katabatic wind drainage. Incoming and reflected shortwave radiation allowed direct, continuousmonitoring of surface albedo.
The West AWS’s net radiometer was irrevocably damaged during a severe hail (20–30 mm in diameter)storm on day 211 in 1995. Early and late in the 1996 season, freezing temperatures caused riming ofsensors and complete failure of both hygrometers and the upper (1 m) thermistor at the Middle AWS and,the upper hygrometer at the Top AWS on day 208. The quality of all automatically-recorded data wascarefully evaluated (based on field observations and inter- and intra-station data comparison) and anysuspect readings eliminated from analysis.
In addition to the AWSs, valley wall temperatures (integrated over 0.5 m2) were monitored with ahand-held infrared Digatron thermometer to investigate heat advection from the surrounding cirque.
Figure 2. Spatial sampling framework: (a) deployment of automatic weather stations 1995 and 1996; and (b) ablation stake network1996
Copyright © 2000 Royal Meteorological Society Int. J. Climatol. 20: 733–758 (2000)

GLACIER MICROCLIMATE AND ABLATION 737
Measurements were taken under a range of different weather conditions at the eastern and westernextremities of the ablation stake lines.
3.2. Energy balance computation
The energy budget for a melting glacier may be expressed most simply as the sum of the net radiative(Q*), sensible heat (Qh) and latent heat (Qe) fluxes, given the negligible magnitude and difficulties withaccurate measurement of the precipitation heat (Qp) and conductive heat (Qg) fluxes (Male and Gray,1981; Paterson, 1994). Conventionally, fluxes are considered to be positive when directed towards thesurface (Ishikawa et al., 1992).
The methods employed for measuring and estimating the components of the energy balance are thoseoutlined by Hay and Fitzharris (1988) and Ishikawa et al. (1992). Net radiation was monitored directly.For estimation of the turbulent fluxes the bulk aerodynamic approach was adopted. This approachderives bulk transfer coefficients from empirical air temperature, wind speed and humidity measurementsat one or two heights above the glacier surface and from estimated flux–gradient relationships. Duringboth monitoring periods, surface temperatures were typically at or near melting point with almostsaturated surface humidities, thus permitting the application of the bulk aerodynamic approach. It wasrequired that further assumptions (amplified by Moore, 1983) be accepted, including the validity of theequations for neutral (stable) conditions and similarity of exchange coefficients for water vapour, heat andmomentum. Specific humidity was estimated from relative humidity measurements for the Bottom,Middle and Top AWSs (or from dry- and wet-bulb temperatures for the East and West AWSs) andatmospheric pressure measurements (McIlveen, 1992). The bulk Richardson number was used to correctfor unstable conditions in the boundary layer (Moore, 1983). Surface roughness was estimated from thelogarithmic wind profile between the glacier surface, or lower sensor level, and the upper sensor level (Hayand Fitzharris, 1988) but also directly using the microtopographic approach (Munro, 1989). Monitorednet radiation and the turbulent heat flux estimates were summed to give the energy available for melt(Qm).
3.3. Monitoring snow- and ice-melt
Ablation was monitored using a nested sampling design comprising: (i) a spatially-distributed ablationstake network measured daily, and (ii) electronic ablatometers (Lewkowicz, 1985) logging every 15 min atthe Top and the Middle AWSs. In addition, a dense microablation stake network was employed in 1996.The ablatometer data have been discussed, in part, by Hannah and McGregor (1997); this paper focuseson the ablation stake networks.
Bamboo canes were used as ablation stakes (to monitor surface lowering) as they are light, inexpensive,durable and, most importantly, have a minimal influence on ablation (Østrem and Brugman, 1991). Inareas with extensive snow cover, 2.5 m stakes were easily inserted but, where a thin snowpack or exposedice was present, 1.8 m stakes required drilling into the ice. During 1995, a hand-drill was employed(similar to Collins, 1981); unfortunately, it took over 1 h to bore 0.5 m. In 1996, a more efficient Kovacsice-drill was employed (Østrem and Brugman, 1991). Stakes were reset when less than 0.5 m (in 1995) or1.0 m (in 1996) remained in the glacier.
Because point ablation measurements are required to represent a wider area, a regular geometricpattern was designed, with a longitudinal transect down the central glacier axis and transverse linesbranching off at regular intervals (Figure 2(b)). Ablation was monitored by the ‘straight edge method’(Muller and Keeler, 1969) and the exposed stake length read to the nearest 1 mm. Readings wereundertaken between 13:00 hGMT and 15:00 hGMT, beginning on the top line and working downglacierto ensure comparability between readings. Melt depths were calculated from the cumulative stake record.
In 1996, a 25 m×25 m microablation stake network was set-up on the proglacial snowpack.Twenty-five ablation stakes were inserted in five equally-spaced rows and columns to form a regular grid.This network allowed the assessment of microscale spatial variation and an approximation of measure-ment error, since the energy balance over this exposed, relatively flat area should be fairly uniform.
Copyright © 2000 Royal Meteorological Society Int. J. Climatol. 20: 733–758 (2000)

D.M. HANNAH ET AL.738
3.4. Monitoring glacier surface and snowpack properties
Melt depths are presented in meters of snow water equivalent (mSWE) to allow comparison of ablationfor snow and ice surfaces with different densities. Snow samples were taken, throughout both meltseasons, within a 1 m radius of the ablation stakes and the average (of three replicates) density obtained6ia the gravimetric approach (Goodison, 1981). Glacial ice density was assumed from the literature to be890 kg m−3 (Fohn, 1973; Munro, 1990). This value lies within the midrange of values tabulated byPaterson (1994).
Glacier surface albedo determines the absorption of solar radiation and varies markedly in space (Vande Wal et al., 1992) and time (McGuffie and Henderson-Sellers, 1985); hence, three albedo estimates werecarried out within a 1 m radius of each ablation stake. In 1996, a Skye pyranometer connected to a Grant1200 series datalogger served as a portable albedometer. The pyranometer was held level at arms lengthand incoming shortwave radiation was read, and then immediately inverted to measure outgoingradiation. Albedo was estimated as a fraction of the reflected to incoming shortwave flux.
3.5. Sur6eying and mapping
The ice extent, surface elevation, glacial features, location of AWSs and ablation stakes were surveyed.The survey points easting (mE), northing (mN) and altitude (m.a.s.l.) were calculated and aligned with theInstitut Geographique National (IGN), France, grid co-ordinate system.
The lower altitudinal limit of the glacier snowline (an important boundary in terms of energy balanceand hydrological processes) was mapped using a chronological series of photographs taken from a fixedreference point in both 1995 and 1996. Transient snowline position was also recorded with respect toablation stake networks. Photographs were scaled using the known altitudinal ranges between ablationstake lines, AWS and prominent surface features.
3.6. Analytical techniques
The aggregated 1995 and 1996 meteorological data set for the Middle AWS was classified, using acomputer-assisted synoptic typing approach (Hannah et al., 1999), into distinct categories of days withsimilar weather conditions to aid more objective identification of spatial and temporal (diurnal andseasonal) trends in microclimate, the energy budget, and snow- and ice-melt. These groups (termedsynoptic categories) may be used to ‘standardize’ or to ‘control’ for climatic influences, becauseintra-category weather variability should be limited (Kalkstein et al., 1987), and thus to explore the roleof other factors. Alternatively, climatic processes and forcing may be examined by comparison of differentsynoptic categories, if other factors are maintained approximately ‘constant’. Similar approaches havebeen used in other studies (e.g. Hodson et al., 1998) in order to elucidate interactions betweenmeteorological and hydrological processes. Table I summarizes the local glacier climates associated withthe synoptic category discussed herein.
4. RESULTS AND DISCUSSION
4.1. Microclimate and the surface energy balance
4.1.1. Spatial trends in microclimate o6er the melt season. Data from the five weather stations set-upduring 1995 provide the basis for examining variations in microclimate and the energy balance over theglacier surface. The net radiation and air temperature data are focused upon, as exploratory analysesrevealed the other meteorological elements to exhibit limited spatial differences (Table II). Moreover, netradiation is typically the primary component of the energy budget over snow and ice surfaces (Paterson,1994); while air temperature provides ‘a good lumped measure of most of the climatic parameters ofimportance for snow [and ice] melt ’ (Lundquist, 1982, p. 133) and, in part, drives the sensible heat flux(Kuhn, 1979). Estimates of specific humidity allow direct comparison of atmospheric moisture between
Copyright © 2000 Royal Meteorological Society Int. J. Climatol. 20: 733–758 (2000)

GLACIER MICROCLIMATE AND ABLATION 739
stations at different air temperatures. A discrepancy between the East and the West AWSs and the otherstations is evident because of unresolved measurement errors, owing to differences in the instrumentation(dry- and wet-bulb thermistors and electronic hygrometers, respectively) used to derive humidity esti-mates. Nonetheless, AWSs with identical sensors yield roughly equivalent humidity which suggests thatatmospheric moisture relates to large-scale air-mass properties rather than local glacier climate (Hannahand McGregor, 1997). Wind speeds were extremely spatially-variable over short time periods; thus, noconsistent trends could be identified. However, the tabulated seasonal averages show the lowest windspeeds at the sheltered AWS on the eastern margin and highest at the exposed Middle AWS, indicatingpossible glacier–cirque topographic controls. A lack of spatial variation in wind speed was noted whenlocal glacier winds were drowned by synoptic-scale flows (Hannah and McGregor, 1997). At a muchlarger scale, Greuell et al. (1997) found variations in both 2 m wind speed and specific humidity(monitored at six sites ranging from 2075 m.a.s.l to 3225 m.a.s.l.) to be almost constant along the centralflow line of Pasterze, Austria’s biggest glacier.
The most frequently occurring synoptic category (i.e. category 1 with 32 of 57 days in 1995) was chosento ‘standardize’ weather conditions, thus highlighting seasonal trends in microclimatic and energy balanceprocesses. Five days within this group, spanning the melt season and yielding high quality data for allAWSs (days 179, 187, 200, 210 and 230), were selected for detailed analysis.
Spatial trends of 15 min net radiation averages, for both the cross-valley and altitudinal transects, areillustrated in Figure 3. Daily flux densities increase from east to west as a result of the longer durationof incoming radiation. Typically, the West AWS receives radiation approximately 0.25 h and 2.5 h beforethe Middle and East AWSs, respectively. These lags are the result of the glacier’s northerly aspectpromoting topographic shading by the cirque rim. The eastern margin remains shaded until the sun passesa gap in the cirque wall at 07:45 hGMT; but shading is quickly re-established and persists until
Table I. Summary statistics for the synoptic categories considered herein
WindSynoptic NumberAir Atmospheric TotalIncoming SpecificNetof rainshortwave temperature numberpressurehumidityradiation speedcategory
(hPa)(g kg−1) (m s−1)(°C) days(W m−2)(W m−2) of days
178.99 6.96 5.98 2.24 747.99 311 6772.09(142.88) (259.33) (2.25) (1.32) (1.16) (2.68)
2 101.70 213.55 7.09 5.43 2.11 745.19 8 19(278.18) (2.43) (1.33) (0.81) (2.94)(188.95)
3 62.21 145.85 0.25 4.78 1.12 745.64 2 5(130.11) (212.68) (1.85) (0.65) (0.83) (2.28)
4 141748.1589.26 2.105.107.11263.99(2.87)(1.00)(1.46)(2.11)(331.59)(178.05)
273.67 10.77 5.81 2.33 752.445 3 7143.48(1.38)(0.67)(1.02)(2.24)(335.52)(249.51)
26 153.58 258.96 112.50 4.14 3.58 749.21(2.15) (1.45) (1.88)(1.70)(320.84)(252.38)
5.76 5.18 2.50 749.458 1 498.80 226.39(307.94) (2 45) (1.24) (1.24) (1.64)(181.54)
177.1 −2.58 4.14 4.189 744.78 0 115.45(0.53)(2.62)(0.74)(1.47)(224.72)(55.02)
3.244.56293.12119.5910 61748.831.54(363.33)(228.86) (2.81)(0.66)(1.28)(2.56)
Note: Means of 15 min Middle AWS observations, at 1 m above the glacier surface, are provided for the meteorological elements,with S.D.s given in parentheses.
Copyright © 2000 Royal Meteorological Society Int. J. Climatol. 20: 733–758 (2000)

D.M. HANNAH ET AL.740
Table II. Summary statistics illustrating the spatial variability in 15 min averages of the key meteorological variablesover the 1995 monitoring period
Automatic Weather Station Bottom Middle Top East West
Net radiationMean (W m−2) 99.42 96.06 82.64 57.99 Sensor failure onMean daily total (MJ m−1 day−1) 8.59 8.30 7.14 5.01 day 211 1995Minimum (W m−2) −85.00 −191.20 −106.50 −98.80Maximum (W m−2) 693.00 763.00 636.0 510.40S.D. (W m−2) 181.59 192.36 154.51 125.57
Air temperature (°C)Mean 8.91 7.28 7.23 7.34 7.88Minimum −1.06 −2.09 −1.49 −1.84 −1.71Maximum 19.61 16.62 15.58 17.15 18.11S.D. 3.25 2.96 2.82 3.34 3.04
Specific humidity (g kg−1)Mean 5.81 5.83 5.86 6.95 7.07Minimum 0.71 0.54 0.69 0.60 0.60Maximum 10.11 9.65 9.45 12.98 12.58S.D. 1.22 1.36 1.32 1.79 1.74
Wind speed (m s−1)Mean 1.99 2.22 2.00 1.64 2.07Minimum 0.12 0.00 0.00 0.00 0.00Maximum 7.68 8.06 9.28 8.45 9.60S.D. 0.86 1.12 1.03 1.12 1.11
Statistics were calculated for the upper sensor level, 1 m above the glacier surface between days 185–235 1995.
09:00 hGMT, when the sun moves above the effective horizon. In the evening, shading occurs almostsynchronously at all sites as the sun sets behind the western cirque rim. Topography has been welldocumented as a key controlling factor in the radiation balance in steeply sloping terrain (Dozier andOutcalt, 1979; Varley et al., 1996). Differences in incoming radiation duration between east and west siteswiden over the ablation season (from 1.75 h on day 179 to 4 h on day 210) due to increased shadowlengths as the solar zenith angle decreases with time from the summer solstice on day 172. The amplitudeof diurnal net radiation cycles shows increasing disparities between the East AWS and other two stationsover the melt season as a result of spatial variations in surface albedo. The East AWS was located overa snow surface for the whole monitoring period; however, transient snowline retreat resulted in icesurfaces being exposed at the Middle and West AWSs after days 203 and 198, respectively. The averagesurface albedo at the Middle AWS was 0.58 for snow and 0.28 for glacier ice. Consequently, a greaterproportion of shortwave radiation is absorbed for ice surfaces, accounting for the increasing peakednessof diurnal cycles at the Middle and West AWSs.
Moving upglacier, the duration of radiative inputs shows an overall increasing trend (except for day230) probably due to the steepness of the lower part of the glacier (Figure 1) influencing solar geometry.However, a corresponding pattern in daily net radiation totals is absent; instead, a seasonal-scaletransition occurs with the highest totals being observed at the Top AWS initially and the Bottom AWSby late season. This is explained by declining surface albedo at the Bottom and Middle AWSs as thehighly reflective snowpack retreated. The Bottom AWS became situated on moraine (after day 200) withan average albedo of 0.15, permitting even more shortwave radiation to be absorbed than for glacier iceat the Middle AWS.
Figure 4 presents spatial trends of 15 min air temperature averages for both the cross-valley andaltitudinal transects. Air temperatures are typically greatest at the West AWS followed by the East and
Copyright © 2000 Royal Meteorological Society Int. J. Climatol. 20: 733–758 (2000)

GLACIER MICROCLIMATE AND ABLATION 741
Figure 3. Spatial patterns of 15 min net radiation averages (Wm−2) for both the cross-valley and altitudinal AWS transects withinsynoptic category 1 over the 1995 monitoring period
Copyright © 2000 Royal Meteorological Society Int. J. Climatol. 20: 733–758 (2000)

D.M. HANNAH ET AL.742
Figure 4. Spatial patterns of 15 min air temperature averages (°C) for both the cross-valley and altitudinal AWS transects withinsynoptic category 1 over the 1995 monitoring period
Copyright © 2000 Royal Meteorological Society Int. J. Climatol. 20: 733–758 (2000)

GLACIER MICROCLIMATE AND ABLATION 743
Middle AWSs, in turn. This may be explained, in part, by the above contrasts in solar heating. Heat advectionfrom the warm cirque walls (averaging 14.3°C and 22.5°C for the east and west side, respectively) couldaccount for the higher than expected air temperatures at the more shaded East AWS. Similarly, Wendler(1975) found increased air temperatures resulting from advection of warm air close to non-glacierized valleysides at the McCall Glacier, Alaska, USA. Conversely, Van de Wal et al. (1992) recorded lower mean airtemperatures at the edges that in the centre of Hintereisferner, Austrian Alps, because of the tendency forcold air accumulation along the margin of this large glacier.
The altitudinal transect shows that air temperatures decrease with elevation (Figure 4). This relationshiphas been well documented for other valley glaciers (e.g. Kuhn, 1979; Rothlisberger and Lang, 1987; Vande Wal et al., 1992; Oerlermans and Vugts, 1993; Greuell et al., 1997) and explained in terms of atmosphericlapse rates and reduced advection of warm valley-air with distance from the glacier snout. All sites mirrorthe seasonal trend in air temperatures which increased up to a mid-season peak (days 205–206) followedby a gradual decline towards the end of the summer.
4.1.2. Spatial trends in the energy balance o6er the melt season. The magnitude and partitioning of thesurface energy balance components at all sites over the ablation season are presented in Figure 5. The energybalance is dominated by net radiation, it being the largest heat source on all days except day 200. Althoughvariability in the glacier wind field complicates interpretation of the turbulent fluxes (Ohata, 1989), thereare some discernible spatial trends. Overall, sensible heat is greatest at the Bottom AWS as a result of higherambient air temperatures and warm air advection from the proglacial zone. Similarly, Young and Lewkowicz(1990) observed a decline in sensible heating with distance from the lower margin of a perennial snowpack,Melville Island, NWT, Canada. The West AWS experiences the second largest sensible heat flux, most likelyas a result of its open situation and heat advection from the cirque wall. Since air temperatures and, toa lesser extent, wind speeds are not too dissimilar at the Middle and Top AWSs, their daily sensible heattotals are, on average, within 0.1 MJ m2 day−1 of each other. The East AWS experiences the smallest sensibleheat flux, probably as a result of its shaded, sheltered location. The magnitude of sensible heat fluxes atall sites reflects seasonal trends in air temperatures. Latent heat acts as an energy sink on all days exceptfor day 200, when condensation occurs as a result of near saturated atmospheric conditions. Typically, latentheat fluxes vary little between sites, although evaporative losses are slightly higher at the Middle AWS,possibly as a result of exposure to higher wind speeds (Table II).
4.1.3. Spatial trends in microclimate under different weather conditions. Spatial trends in microclimate andthe energy budget were investigated for 5 days, with high quality data for all AWSs, under the differentweather conditions (i.e. synoptic categories) observed during the 1995 monitoring programme. These dayswere selected within a limited time period (days 186–209) to reduce non-climatic influences.
Figure 6 presents 15 min net radiation averages for both the cross-valley and altitudinal transects undersynoptic categories 2, 3, 4, 5 and 6; categories are arranged in descending order with respect to cloud cover.Although these categories exhibit similar spatial trends to those described for category 1, the extent of spatialcontrast appears to vary both within and between synoptic categories. Spatial differences are reduced undermore overcast conditions (categories 2, 3 and 4) compared with cloudless skies (categories 5 and 6). Thisis probably due to cloud cover increasing the proportion of diffuse to direct-beam shortwave radiation,which results in a more uniform distribution of solar energy. Conversely, direct-beam radiation most likelydominates under cloudless skies; hence, topographic shading effects are accentuated. The rapid rise andfall in net radiation under cloudless skies highlights the significant topographic controls on shortwaveradiation within this steep-walled, north-facing cirque.
Spatial trends of 15 min air temperature averages for synoptic categories 2, 3, 4, 5 and 6 for both thecross-valley and the altitudinal transects are illustrated in Figure 7. Overcast conditions (categories 2, 3 and 4)produce similar cross-valley air temperatures trends to those for synoptic category 1, with the highest tempera-tures at the West followed by the East and Middle AWSs, in turn. Air temperature peaks at around 08:00hGMT at the West AWS under category 3 because of a break in cloud cover while the other two AWSsremain in the shade. For cloudless skies (categories 5 and 6), air temperatures mirror radiative inputs withthe lowest temperatures on the more shaded eastern margin followed by either the Middle or the West AWS.
Copyright © 2000 Royal Meteorological Society Int. J. Climatol. 20: 733–758 (2000)

D.M. HANNAH ET AL.744
Figure 5. Spatial patterns in the magnitude (MJ m−2 day−1) and partitioning (%) of the energy balance components for thecross-valley and altitudinal AWS transects within synoptic category 1 over the 1995 monitoring period (Key to bar shading:
stipple=Q*, hatched=Qh, black=Qe)
Copyright © 2000 Royal Meteorological Society Int. J. Climatol. 20: 733–758 (2000)

GLACIER MICROCLIMATE AND ABLATION 745
Figure 6. Spatial patterns of 15 min net radiation averages (Wm−2) for both the cross-valley and altitudinal AWS transects underdifferent synoptic categories during the 1995 monitoring period
Copyright © 2000 Royal Meteorological Society Int. J. Climatol. 20: 733–758 (2000)

D.M. HANNAH ET AL.746
Figure 7. Spatial patterns of 15 min air temperature averages (°C) for both the cross-valley and altitudinal AWS transects underdifferent synoptic categories during the 1995 monitoring period
Copyright © 2000 Royal Meteorological Society Int. J. Climatol. 20: 733–758 (2000)

GLACIER MICROCLIMATE AND ABLATION 747
Figure 8. Spatial patterns in the magnitude (MJ m−2 day−1) and partitioning (%) of the energy balance components for thecross-valley and altitudinal AWS transects under different synoptic categories during the 1995 monitoring period (Key to bar
shading: stipple=Q*, hatched=Qh, black=Qe)
Copyright © 2000 Royal Meteorological Society Int. J. Climatol. 20: 733–758 (2000)

D.M. HANNAH ET AL.748
The altitudinal air temperature decline is less marked under cloudy (categories 2, 3 and 4) than clear skyconditions (categories 5 and 6). Overall, air temperatures are lower under overcast than cloudless skiesdue to reduced direct radiation. Notably, under the cloudiest weather conditions (category 3) airtemperatures at the Top AWS were 0.4°C greater than the Middle AWS. The markedly higher airtemperatures observed at the Bottom AWS (03:00–12:00 hGMT) for category 6 are associated withanabatic drainage of warm valley air.
4.1.4. Spatial trends in the energy balance under different weather conditions. Figure 8 allows comparisonof the magnitude and partitioning of the surface energy balance components between synoptic categoriesat all sites. The total energy available for melt is inversely associated with cloud cover, as would beexpected given net radiation is typically the primary heat source. The energy budget for category 3 isdominated by net radiation, despite overcast skies, as the turbulent fluxes are limited by near freezing airtemperatures. For the other cloudy categories (2 and 4), sensible heat supplies approximately 40% of thetotal energy and minimal spatial variation in energy flux partitioning is observed. These two categoriesshow altitudinal and cross-valley trends in total energy receipt similar to those for category 1. Forcloudless skies (categories 5 and 6), the energy balance is dominated by net radiation; consequently,spatial trends in total energy available follow those previously described for this component. Also forclear sky conditions, spatial trends in the sensible heat flux generally correspond with those for airtemperature; however, a greater proportion of the total energy available is supplied by sensible heat inmore shaded locations (i.e. Top and East AWSs). Latent heat acts as a heat sink under all synopticcategories and at all sites.
4.2. Snow- and ice-melt
4.2.1. E6aluation and spatial interpolation of ablation stake measurements. The more detailed 1996ablation stake measurements form the main data set for investigation of variations in snow- and ice-melt.Errors in stake measurements over short time-scales are well documented (La Chapelle, 1959; Muller andKeeler, 1969) but still many researchers fail to appraise data quality. The accuracy of 1996 stake readingswas assessed: (i) using comparative statistics for daily stake (‘predicted’) and ablatometer (‘observed’)data; and (ii) by estimation of inter-stake melt variations over the microablation stake network. A scatterplot of daily stake number 40 readings against Middle AWS ablatometer totals (located within 5 m ofeach other) is provided in Figure 9. Data are presented only for periods when both the ablatometer andthe stake were situated on either snow or ice to avoid differences resulting from changing surfaceproperties. The correlation is relatively high (r=0.74; p=0.00) and the data points lie close to the 1:1relationship line. Moreover, the mean absolute error and root mean squared error are both fairly low(−0.003 and 0.008 mSWEd−1, respectively) while Willmott’s (1981) index of agreement (d) is relativelyhigh at 0.87 (1.0 indicates perfect agreement). These error indices provide some confidence in the accuracyof the stake measurements and show lack of estimate bias. Stake readings over a 25 m×25 m network
Figure 9. Scatter plot of daily stake number 40 readings against Middle AWS ablatometer totals for the 1996 monitoring period
Copyright © 2000 Royal Meteorological Society Int. J. Climatol. 20: 733–758 (2000)

GLACIER MICROCLIMATE AND ABLATION 749
for 18 days were used to quantify microscale melt variation and measurement error. (Note that thisnetwork covers an area equal to the cell size used for interpolation of point stake data across the glacier,as discussed below.) Analysis of variance (ANOVA) and multiple t-tests conducted on measurements overthe 25 stake micronetwork revealed significantly different (p=0.05) melt rates only between one stake andthree others. These limited differences are most likely the result of variations in surface microtopography,which determines surface roughness and aspect, and also albedo (Brugman, 1991). Adams (cited in Cogleyet al., 1996) showed stake measurements on the White Glacier, Axel Heiberg Island, Canada, to bereproducible within 95.0 mm (equal to Muller and Keeler’s, 1969, error term). Braithwaite and Olesen(1990) found stake ‘error rates’ to be 913.0–19.0 mmSWEd−1 on the Greenland Ice Sheet; while Youngand Lewkowicz (1990) estimated measurement accuracy as 95.0–20.0 mmd−1 for a perennial snowpack,Melville Island, NWT, Canada. Total ablation across the micronetwork varied by 911.4 mmSWEd−1.This value is comparable with the literature but larger than the actual measurement error, as it alsoincludes genuine microscale variations. This ‘error’ margin will be considered when interpreting spatialmelt patterns.
Point ablation stake measurements were interpolated over the ablation zone (approximately 80% of theglacier’s area) to aid interpretation of spatial patterns in snow- and ice-melt. Stake data were interpolatedto a regular grid (with 25 m×25 m cells) using the bilinear interpolation routine in the UNIRAS graphicspackage module UNIMAP (UNIRAS, 1992). The same routine has been used to interpolate elevationdata for the Haut Glacier d’Arolla, Valais, Switzerland (Sharp et al., 1993; Arnold et al., 1996). The griddata were contoured to produce isopleth maps.
4.2.2. Spatial patterns in cumulati6e ablation for the 1995 and 1996 melt seasons. Spatial patterns incumulative snow- and ice-melt for 1995 and 1996 are illustrated in Figure 10. Both years exhibit similartrends, although ablation is approximately 0.4 mSWE higher for the longer 1996 monitoring period.Maximum melt occurs in the northwest of the glacier and decreases towards the southeast. Thiscorresponds with the distribution of energy receipt, as determined by topographic shading and altitudinaleffects. In addition, nocturnal refreezing of meltwater is likely to be greater at altitude in the more shadedsoutheast and, as a result, more energy expenditure is required to achieve surface lowering. Retreat of thetransient snowline could further explain these ablation patterns. Figure 11 plots snowline altitude over the1995 and 1996 observation periods with respect to the glacier’s hypsometry and surface albedo monitoredat the Middle AWS. During 1995, strong snow-melt resulted in rapid retreat of the snowline, uncoveringan extensive area of lower albedo glacier ice by mid-season. In contrast, for the majority of 1996, theglacier remained snow-covered with the snowline only beginning to slowly reveal glacier ice by late season.In both years, snowline retreat produced a marked reduction in albedo at the Middle AWS. The decreasein albedo immediately before the snowline reached the AWSs elevation is due to the penetration of solarradiation through the thinning snowpack into glacier ice, thus increasing absorptivity.
4.2.3. Spatial patterns in ablation o6er the 1996 melt season. Spatial trends in ablation were investigatedfor 5 days (days 171, 186, 202, 224 and 240) spanning the 1996 melt season (Figure 12). These days wereselected, based on the availability of high quality ablation stake data, from the most prevalent synopticcategory (i.e. category 1 with 35 of the 71 days in 1996) thus allowing climatic influences to be‘controlled’. For all 5 days, the differences between maximum and minimum daily ablation rates aregreater than the stake ‘error’ margin. In early season (days 171 and 186), ablation is highest in thesouthwest but, as the season progresses, the region of greatest melt moves downglacier to the northwest(days 202, 224 and 240). This seasonal transition corresponds with the spatio–temporal patterns in netradiation totals for 1995, explained in terms of topographic shading, glacier–solar geometry and surfacealbedo changes. A strong cross-valley ablation gradient (increasing from east to west) is evidentthroughout the season but, as shadows lengthen with time from the summer solstice, the shaded area onthe eastern margin extends westwards.
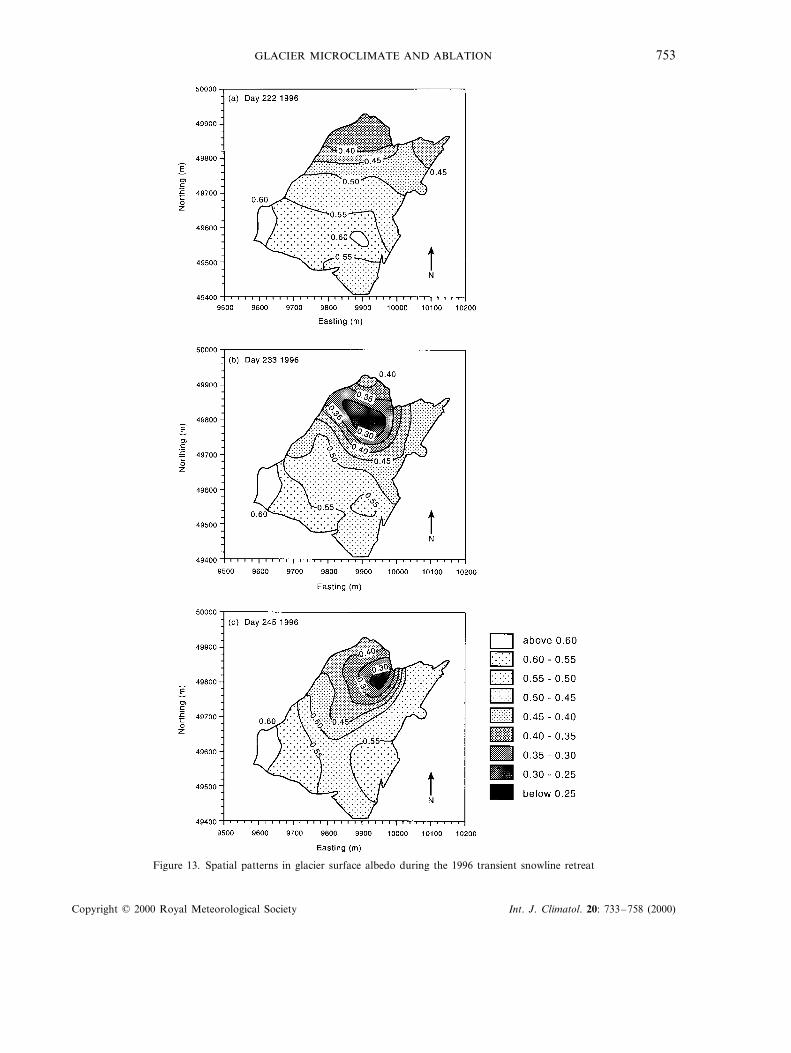
Seasonal patterns in ablation over the glacier may be further explained by changing surface propertieswith snowline retreat. Figure 13 presents spatial patterns in albedo for 3 days (days 222, 233 and 245)spanning the onset of snowline retreat to the near maximum upglacier snowline limit for 1996. Hail and
Copyright © 2000 Royal Meteorological Society Int. J. Climatol. 20: 733–758 (2000)

D.M. HANNAH ET AL.750
Figure 10. Spatial patterns in cumulative ablation totals (mSWE) for the (a) 1995 and (b) 1996 monitoring period
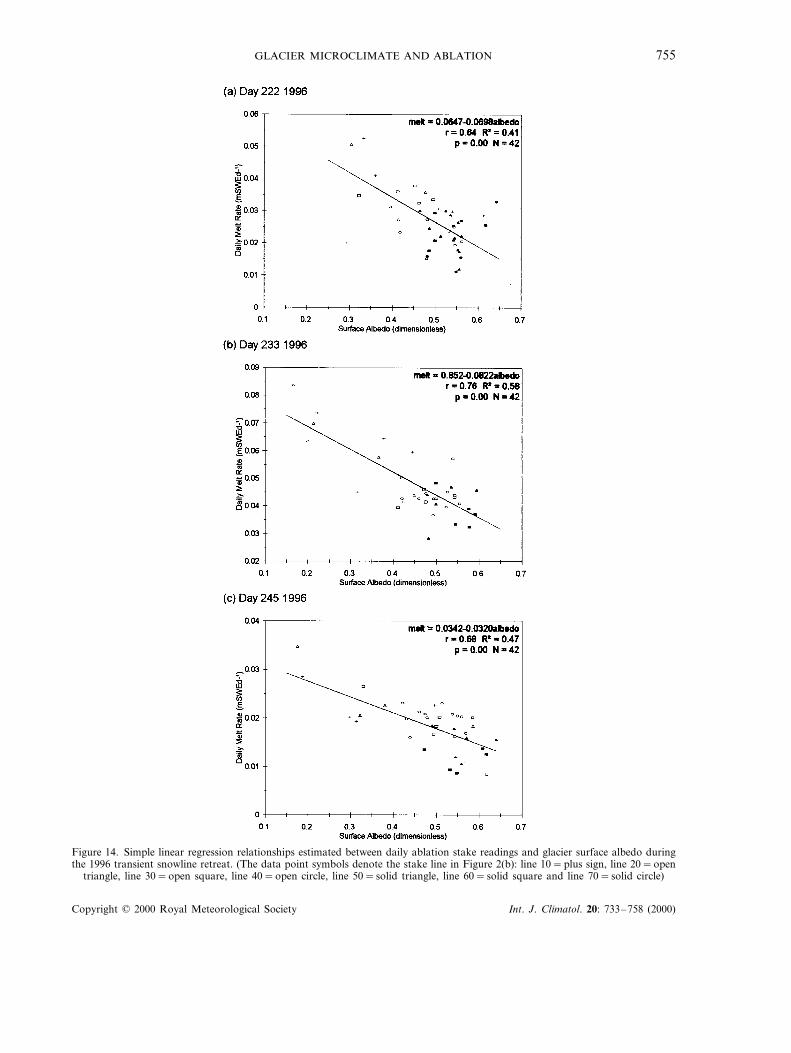
fresh snow fell on days 234–235 (increasing surface albedo; Figure 11), so influencing albedo patterns forday 245. Point albedo data were interpolated using the same procedure as was used for ablation stakemeasurements. As lower albedo (B0.3) is associated with ice surfaces and higher albedo with snowsurfaces, these diagrams provide an indication of glacier snow cover. Snowline retreat appears to beforced by topographic shading, with glacier ice being revealed on the western margin but snow persistingin the more shaded east. These patterns in albedo are inversely associated with ablation. Regressionrelationships between daily stake measurements and albedo for days 222, 233 and 245 are estimated in
Copyright © 2000 Royal Meteorological Society Int. J. Climatol. 20: 733–758 (2000)

GLACIER MICROCLIMATE AND ABLATION 751
Figure 11. (a) Hypsometric curve (altitudinal distribution) and integral (area distribution) for the Taillon Glacier in 1995; (b)snowline altitude and surface albedo at the Middle AWS over the 1995 monitoring period; and (c) snowline altitude and surface
albedo at the Middle AWS over the 1996 monitoring period
Copyright © 2000 Royal Meteorological Society Int. J. Climatol. 20: 733–758 (2000)

D.M. HANNAH ET AL.752
Figure 12. Spatial patterns in daily ablation rates (mSWEd−1) within synoptic category 1 over the 1996 monitoring period
Copyright © 2000 Royal Meteorological Society Int. J. Climatol. 20: 733–758 (2000)
GLACIER MICROCLIMATE AND ABLATION 753
Figure 13. Spatial patterns in glacier surface albedo during the 1996 transient snowline retreat
Copyright © 2000 Royal Meteorological Society Int. J. Climatol. 20: 733–758 (2000)
D.M. HANNAH ET AL.754
Figure 14, showing increasing ablation with decreasing albedo. Data are arranged by stake elevationalong the regression line with higher elevation, lower albedo points at the top-left and lower elevation,higher albedo observations at the bottom-right. Van de Wal et al. (1992), for Hintereisferner, AustrianAlps, and Wolfe and English (1995), for the Quviagivaa Glacier, Ellesmere Island, Canada, both notedsimilar altitudinal albedo–melt associations. The residuals can be generally explained by topographiccontrols on insolation, with ablation being underestimated at the shaded western stakes (i.e. positiveresiduals) and overestimated at the more openly situated eastern stakes (i.e. negative residuals) by theregression relationship. Stake 21 is a notable exception, consistently exhibiting the lowest albedo and thehighest ablation rates because it was situated on heavily debris-laden ice close to the western supraglacialmoraine.
4.2.4. Spatial patterns in ablation under different weather conditions. Composite daily melt rates for thedifferent weather conditions observed in 1996 (i.e. synoptic categories 1, 2, 3, 4, 5, 8, 9 and 10) werecalculated for each ablation stake and interpolated over the glacier surface (Figure 15). These seasonally-averaged plots reduce measurement errors (Willis et al., 1993) and yield more representative patterns thando individual days. In Figure 15, synoptic categories are arranged in ascending order with respect toablation. Topographic and altitudinal controls on the distribution of energy receipt are reflected in meltpatterns for all synoptic categories, but the extent of spatial variation differs markedly between categories.Synoptic categories 3 and 9 exhibit very low ablation and spatial contrasts within the range of the stake‘error’ estimate. These limited differences are because of extensive cloud cover producing a more uniformenergy distribution across the glacier. In contrast, category 5 produces high ablation and a stronglytopographically-controlled east to west melt gradient, exceeding the stake ‘error’ margin. Synopticcategories 1, 2, 4, 8 and 10 illustrate spatial patterns (which exceed the stake ‘error’ estimate) rangingbetween these two extremes, largely dependent upon prevailing sky conditions.
5. CONCLUSIONS
This paper has presented and interpreted empirical observations of microclimate, surface energy ex-changes, and snow- and ice-melt collected over a small cirque glacier (Taillon Glacier, French Pyrenees),under a wide range of melt season conditions. These data generate several key findings and, in doing so,clearly demonstrate that short-term, single location studies are unlikely to truly represent climatic andablation processes in space and time. In this study, microclimate (influenced by topographic shading andaltitudinal effects) and transient snowline retreat are the primary controls on the distribution of glacierenergy receipt and, in turn, melt. However, advection of warm air from the cirque walls could increasesensible heating close to the glacier margin. Although typically net radiation is the dominant energysource for melt, followed by sensible heat, and latent heat is an energy sink, the magnitude andpartitioning of energy balance terms vary seasonally and with prevailing weather. As the melt seasonprogresses, the region of maximum energy for melt and measured ablation shifts downglacier in responseto increasing shadow effects of the cirque rim, as the solar zenith angle decreases, and the transientsnowline retreats (exposing glacier ice, and thus reducing surface albedo). Superimposed upon seasonaltrends, spatial variations in energy receipt and snow- and ice-melt are more marked under cloudless skiesthan overcast conditions as a result of accentuated topographic shading effects.
Despite the Taillon Glacier’s limited size and altitudinal range, as compared with other temperateglaciers, clear spatial variations in the surface energy balance and ablation are evident. These patterns arestrongly influenced by topoclimatic controls which may be vital in determining the survival of cirqueglaciers in the French Pyrenees. In the winter, net radiation is most likely a heat sink, especially in cirqueswith northerly aspects, such as the Taillon basin. This may explain, in part, the persistence of snowpackswell into the summer (as observed in 1996) and thus the survival of vestigial glaciers on northerly slopesas energy for melt in early to mid-season is consumed in ablating winter snow overlying glacier ice.Although air temperature variations over the Taillon Glacier’s range in surface elevation are less striking
Copyright © 2000 Royal Meteorological Society Int. J. Climatol. 20: 733–758 (2000)
GLACIER MICROCLIMATE AND ABLATION 755
Figure 14. Simple linear regression relationships estimated between daily ablation stake readings and glacier surface albedo duringthe 1996 transient snowline retreat. (The data point symbols denote the stake line in Figure 2(b): line 10=plus sign, line 20=open
triangle, line 30=open square, line 40=open circle, line 50=solid triangle, line 60=solid square and line 70=solid circle)
Copyright © 2000 Royal Meteorological Society Int. J. Climatol. 20: 733–758 (2000)

D.M. HANNAH ET AL.756
Figure 15. Spatial patterns in daily ablation rates (mSWEd−1) for synoptic category composites for the 1996 monitoring period
Copyright © 2000 Royal Meteorological Society Int. J. Climatol. 20: 733–758 (2000)

GLACIER MICROCLIMATE AND ABLATION 757
than those published for glaciers with larger altitudinal ranges (e.g. Rothlisberger and Lang, 1987; Van deWal et al., 1992), nevertheless differences in energy flux contributions are apparent. It could behypothesized therefore that thermal advection from bare proglacial areas and cirque walls may be moreimportant in determining altitudinal and cross-valley differences in snow- and ice-melt for small glacierscompared with larger glaciers for which lapse rates in air temperature and moisture could be moreimportant. Irrespective of glacier size, however, changes in surface albedo with upglacier retreat of thesnowline produce significant contrasts in net radiation.
Finally, the distributions of meteorological variables and surface albedo observed in this paper could beused to drive, parameterize and calibrate a numerical energy balance model while the ablation stakemeasurements allow independent model validation. These empirical data could improve and refine thebasic algorithms used to compute energy budget terms over glacier surfaces. However, the distributionsand parameterization derived from observations presented herein would most probably be site-specific;hence, further spatially- and temporally-distributed empirical studies are required on other glaciers. Suchan approach would permit more accurate modelling of glacier mass-balance gradients under climaticchange scenarios and the estimation of spatio–temporal meltwater inputs to support hydrologicalresearch.
ACKNOWLEDGEMENTS
The Parc National des Pyrenees are thanked for their kind permissions to undertake work in the Tailloncatchment. The authors also wish to thank the numerous people who helped with data collection duringboth field seasons and A.G. Lewkowicz for the loan of an ablatometer in 1995. NERC provided twoautomatic weather stations from their equipment pool in 1995. A. Ankorn and K. Burkhill redrew severalof the diagrams. D.M. Hannah gratefully acknowledges the receipt of a School of Geography, Universityof Birmingham, research studentship (1994–1997).
REFERENCES
Ambach, W. 1985. ‘Characteristics of the heat balance of the Greenland Ice Sheet for modelling’, J. Glaciol., 31, 2–13.Angstrom, A. 1933. ‘On the dependence of ablation on air temperature, radiation and wind’, Geogr. Ann., 15, 264–271.Arnold, N.S., Willis, I.C., Sharp, M.J., Richards, K.S. and Lawson, W.J. 1996. ‘A distributed surface energy balance model for a
small valley glacier I: Development and testing for the Haut Glacier d’Arolla, Valais, Switzerland’, J. Glaciol., 42, 77–89.Braithwaite, R.J. 1981. ‘On glacier energy balance, ablation and air temperature’, J. Glaciol., 27, 381–391.Braithwaite, R.J. and Olesen, O.B. 1990. ‘A simple energy balance model to calculate ice ablation at the margin of the Greenland
Ice Sheet’, J. Glaciol., 36, 222–228.Brugman, M.M. 1991. ‘Scale dependent albedo variations and runoff from glacierised alpine basins’, Snow Hydrology and Forests
(Proceedings of the Vienna Symposium), IAHS publication no. 205, 61–71Cogley, J.G., Adams, W.P., Ecclestone, M.A., Jung-Rothenhausler, F. and Ommanney, C.S.L. 1996. ‘Mass balance of the White
Glacier, Axel Heiberg Island, NWT, Canada’, J. Glaciol., 42, 548–563.Collins, D.N. 1981. ‘Glacial processes’, in Goudie, A. (ed.), Geomorphological Techniques, Allen and Unwin, London, 302–320.Dozier, J. and Outcalt, S.I. 1979. ‘An approach to a energy balance simulation over rugged terrain’, Geogr. Anal., 11, 65–85.Escher-Vetter, H. 1985. ‘Energy budget for the ablation period 1982 at Vernagtferner, Oetzal Alps’, Ann. Glaciol., 6, 158–160.Fohn, P.M.B. 1973. ‘Short-term snow melt and ablation derived from heat- and mass-balance measurements’, J. Glaciol., 12,
275–289.Gellatly, A.F., Grove, J.M., Bucher, A., Latham, R. and Whalley, W.B. 1995. ‘Recent fluctuations of the Glacier du Taillon’, Phys.
Geogr., 15, 399–413.Goodison, B.E. 1981. ‘Measurement and analysis’, in Gray, D.M. and Male, D.H. (eds), Handbook of Snow: Principles, Processes,
Management and Use, Pergamon Press, Canada, 191–265.Greuell, W. and Bohm, R. 1998. ‘2 m temperatures along melting mid-latitude glaciers, and implications for the sensitivity of the
mass balance to variations in temperature’, J. Glaciol., 44, 9–20.Greuell, W., Knap, W.H. and Smeets, P.C. 1997. ‘Elevational changes in meteorological variables along a midlatitude glacier during
summer’, J. Geophys. Res., 10, 941–954.Grove, J.M. and Gellatly, A.F. 1992. Reconstruction of Past Mediterranean Climates in the Historic Period: Glacial History, Vol. 1.
EU Report EV4C-0044-UK.Hannah, D.M. and McGregor, G.R. 1997. ‘Evaluating the impact of climate on snow and ice melt in the Taillon basin, French
Pyrenees’, J. Glaciol., 43, 563–568.Hannah, D.M., Gurnell, A.M. and McGregor, G.R. 1999. ‘Identifying links between large-scale atmospheric circulation and local
glacier ablation climates in the French Pyrenees’, Interactions between the Cryosphere, Climate and Greenhouse Gases (Proceedingsof IUGG’99 Symposium HS2, Birmingham), IAHS publication 256, 155–163.
Copyright © 2000 Royal Meteorological Society Int. J. Climatol. 20: 733–758 (2000)

D.M. HANNAH ET AL.758
Hastenrath, S. and Patnaik, J.K. 1980. ‘Radiation measurements on Lewis Glacier, Mount Kenya’, J. Glaciol., 25, 439–444.Hay, J.E. and Fitzharris, B.B. 1988. ‘A comparison of energy balance and bulk aerodynamic approaches in estimating glacier melt’,
J. Glaciol., 34, 145–153.Hodson, A.J., Gurnell, A.M., Washington, R., Tranter, M., Clark, M.J. and Hagen, J.O. 1998. ‘Meteorological and runoff time
series characteristics in a small, high-Arctic glaciated basin, Svalbard’, Hydrol. Process., 12, 509–526.Hoinkes, H.C. 1953. ‘Warmeumsatz und ablation auf Alpengletschern II: Hornkees (Zillertale Alpen)’, Geogr. Ann. A., 25, 116–140.Ishikawa, N., Owens, I. and Sturman, P. 1992. ‘Heat balance characteristics during fine periods on the lower part of the Franz Josef
Glacier, South Westland, New Zealand’, Int. J. Climatol., 12, 397–410.Kalkstein, L.S., Tan, G. and Skindlov, J.A. 1987. ‘An evaluation of three clustering procedures for use in synoptic climatological
classifications’, J. Clim. Appl. Meteorol., 26, 717–730.Kuhn, M. 1979. ‘On computation of heat transfer coefficients from energy balance gradients on a glacier’, J. Glaciol., 22, 263–272.La Chapelle, E. 1959. ‘Errors in ablation measurements from settlement and sub-surface melting’, J. Glaciol., 3, 458–467.Lewkowicz, A.G. 1985. ‘Use of an ablatometer to measure short-term ablation of exposed ground ice’, Can. J. Earth Sci., 22,
1767–1773.Lundquist, D. 1982. ‘Modelling runoff from a glacierized basin’, Hydrological Aspects of Mountain Areas (Proceedings of the Exeter
Symposium), IAHS publication no. 138, 131–136.Male, D.H. and Gray, D.M. 1981. ‘Snowcover ablation and runoff’, in Gray, D.M. and Male, D.H. (eds), Handbook of Snow:
Principles, Processes, Management and Use, Pergamon Press, Canada, 360–429.Marcus, M.G., Chambers, F.B. and Brazel, A.J. 1992. ‘Climate and glacier change: the dilemma of the representative station’, Z.
Geomorphol. N. F., 86, 1–14.Marcus, M.G., Moore, R.D. and Owens, I.F. 1985. ‘Short-term estimates of surface energy transfers and ablation on the Lower
Franz Josef Glacier, South Westland, New Zealand’, N. Z. J. Geol. Geophys., 28, 559–567.McGregor, G.R. and Gellatly, A.F. 1996. ‘The energy balance of a melting snowpack in the French Pyrenees during warm
anticyclonic conditions’, Int. J. Climatol., 16, 1–8.McGregor, G.R., Gellatly, A.F., Bucher, A., and Grove, J.M. 1995. ‘Climate change and response in the Pyrenees 1878–1994’, Z.
Gletsch. Glazialgeol., 31, 207–214.McGuffie, K. and Henderson-Sellers, A. 1985. ‘The diurnal hysteresis of snow albedo’, J. Glaciol., 31, 188–189.McIlveen, J.F.R. 1992. Fundamentals of Weather and Climate, Chapman and Hall, London.Moore, R.D. 1983. ‘The bulk aerodynamic formulae over melting snow’, Nord. Hydrol., 14, 193–206.Muller, F. and Keeler, C.M. 1969. ‘Errors in short term ablation measurements’, J. Glaciol., 8, 91–105.Munro, D.S. 1989. ‘Surface roughness and bulk heat transfer on a glacier: a comparison with eddy correlation’, J. Glaciol., 35,
343–348.Munro, D.S. 1990. ‘Comparison of melt energy computations and ablatometer measurements on melting ice and snow’, Arct. Alp.
Res., 22, 153–162.Munro, D.S. 1991. ‘A surface energy exchange model of glacier melt and mass balance’, Int. J. Climatol., 11, 689–700.Munro, D.S. and Young, G.J. 1982. ‘Operational net shortwave radiation model for glacier basins’, Water Resour. Res., 18,
220–230.Oerlermans, J. 1992a. ‘A model of the surface balance of ice masses: Part 1 alpine glaciers’, Z. Gletsch. Glazialgeol., 27, 63–83.Oerlermans, J. 1992b. ‘Climate sensitivity of glaciers in southern Norway: Application of an energy-balance model to Nigardsbreen,
Hellstugubreen and Alfotbreen’, J. Glaciol., 38, 223–232.Oerlermans, J. and Vugts, H.F. 1993. ‘A meteorological experiment in the melting zone of the Greenland Ice Sheet’, Bull. Am.
Meteorol. Soc., 73, 355–365.Ohata, T. 1989. ‘Effects of glacier wind on local climate, turbulent heat fluxes and ablation’, Z. Gletsch. Glazialgeol., 25, 49–68.Østrem, G. and Brugman, M. 1991. Glacier Mass-balance Measurements: A Manual for Field and Office Work, National
Hydrological Research Institute science report no. 4, Environment Canada and Norwegian Energy Administration, Canada.Paterson, W.S.B. 1994. The Physics of Glaciers, 3rd edn, Pergamon Press, Oxford.Rothlisberger, H. and Lang, H. 1987. ‘Glacial hydrology’, in Gurnell, A.M. and Clarke, M.J. (eds), Glacio– flu6ial Sediment Transfer
(eds), Wiley, Chichester, pp. 207–284.Sharp, M., Richards, K., Arnold, N., Nienow, P. Lawson, W. and Tison, J.-L. 1993. ‘Geometry, bed topography and drainage
system structure of the Haut Glacier d’Arolla, Switzerland’, Earth Surf. Process. Landf., 18, 557–571.Stenning, A.J., Banfield, C.E. and Young, G.J. 1981. ‘Synoptic controls over katabatic layer characteristics above a melting glacier’,
J. Climatol., 1, 309–329.Strangeways, I. 1981. ‘Instruments for mountainous areas’, Nord. Hydrol., 12, 289–296.UNIRAS. 1992. UNIMAP 2000 Users Manual, UNIRAS Ltd., Denmark.Van de Wal, R.S.W., Oerlemans, J. and Van der Hage, J.C. 1992. ‘A study of ablation variation of the tongue of Hinterisferner,
Austrian Alps’, J. Glaciol., 38, 319–324.Varley, M.J., Beven, K.J. and Oliver, H.R. 1996. ‘Modelling solar radiation in steeply sloping terrain’, Int. J. Climatol., 16, 93–104.Wendler, G. 1975. ‘A note on the advection of warm air towards a glacier: A contribution to the IHD’, Z. Gletsch. Glazialgeol., 10,
199–205.Willis, I.C., Sharp, M.J. and Richards, K.S. 1993. ‘Studies of the water balance of Midtdalsbreen, Hardangerjokulen, Norway, I:
The calculation of surface water inputs from basic meteorological data’, Z. Gletsch. Glazialgeol., 27, 97–115.Willmott, C.J. 1981. ‘On validation of models’, Phys. Geogr., 2, 184–194.Wolfe, P.M. and English, M.C. 1995. ‘Hydro–meteorological relationships in a glacierized catchment in the Canadian High Arctic’,
Hydrol. Process., 9, 911–921.Young, G.J. 1971. ‘Accumulation and ablation patterns as functions of the surface geometry of the glacier’, Snow and Ice, IAHS
publication no. 104, pp. 134–138.Young, K.C. and Lewkowicz, A.G. 1990. ‘Surface energy balance of a perennial snowpack, Melville Island, NWT, Canada’, Arct.
Alp. Res., 22, 290–301.
Copyright © 2000 Royal Meteorological Society Int. J. Climatol. 20: 733–758 (2000)
.