Spatio-temporal variation in the demographic attributes of a generalist mesopredator
14
RESEARCH ARTICLE Spatio-temporal variation in the demographic attributes of a generalist mesopredator James C. Beasley • Zachary H. Olson • Guha Dharmarajan • Timothy S. Eagan II • Olin E. Rhodes Jr. Received: 30 August 2010 / Accepted: 28 May 2011 / Published online: 11 June 2011 Ó Springer Science+Business Media B.V. 2011 Abstract Human land-use practices have dramati- cally altered the composition and configuration of native habitats throughout many ecosystems. Within heterogeneous landscapes generalist predators often thrive, causing cascading effects on local biological communities, yet there are few data to suggest how attributes of fragmentation influence local population dynamics of these species. We monitored 25 raccoon (Procyon lotor) populations from 2004 to 2009 in a fragmented agricultural landscape to evaluate the influence of local and landscape habitat attributes on spatial and temporal variation in demography. Our results indicate that agricultural ecosystems support increased densities of raccoons relative to many other rural landscapes, but that spatial and temporal variation in demography exists that is driven by non-agricultural habitat attributes rather than the availability of crops. At the landscape scale, both density and population stability were positively associated with the size and contiguity of forest patches, while at the local scale density was posi- tively correlated with plant diversity and the density of tree cavities. In addition, populations occupying forest patches with greater levels of plant diversity and stable water resources exhibited less temporal variability than populations with limited plant species complexity or water availability. The proportion of populations comprised of females was most strongly influenced by the availability of tree cavities and soft mast. Despite the abundance of mesopredators in heterogeneous landscapes, our results indicate that all patches do not contribute equally to the regional abundance and persistence of these species. Thus, a clear understanding of how landscape attributes contribute to variation in demography is critical to the optimization of management strategies. Electronic supplementary material The online version of this article (doi:10.1007/s10980-011-9619-x) contains supplementary material, which is available to authorized users. J. C. Beasley (&) Á Z. H. Olson Á G. Dharmarajan Á T. S. Eagan II Á O. E. Rhodes Jr. Department of Forestry and Natural Resources, Purdue University, 195 Marsteller Street, West Lafayette, IN 47907, USA e-mail: [email protected] Present Address: G. Dharmarajan Laboratory of Malaria and Vector Research, National Institute of Allergy and Infectious Diseases, National Institutes of Health, 12735 Twinbrook Parkway, Room 2W-13, Rockville, MD 20852, USA Present Address: T. S. Eagan II Michigan State University, G-100 Veterinary Medical Center, East Lansing, MI 48824, USA Present Address: O. E. Rhodes Jr. United States Department of Agriculture, Animal Plant Health Inspection Service, Wildlife Services, National Wildlife Research Center, 4101 LaPorte Ave., Fort Collins, CO 80521, USA 123 Landscape Ecol (2011) 26:937–950 DOI 10.1007/s10980-011-9619-x
-
Upload
independent -
Category
Documents
-
view
0 -
download
0
Transcript of Spatio-temporal variation in the demographic attributes of a generalist mesopredator

RESEARCH ARTICLE
Spatio-temporal variation in the demographic attributesof a generalist mesopredator
James C. Beasley • Zachary H. Olson •
Guha Dharmarajan • Timothy S. Eagan II •
Olin E. Rhodes Jr.
Received: 30 August 2010 / Accepted: 28 May 2011 / Published online: 11 June 2011
� Springer Science+Business Media B.V. 2011
Abstract Human land-use practices have dramati-
cally altered the composition and configuration of
native habitats throughout many ecosystems. Within
heterogeneous landscapes generalist predators often
thrive, causing cascading effects on local biological
communities, yet there are few data to suggest how
attributes of fragmentation influence local population
dynamics of these species. We monitored 25 raccoon
(Procyon lotor) populations from 2004 to 2009 in a
fragmented agricultural landscape to evaluate the
influence of local and landscape habitat attributes on
spatial and temporal variation in demography. Our
results indicate that agricultural ecosystems support
increased densities of raccoons relative to many other
rural landscapes, but that spatial and temporal
variation in demography exists that is driven by
non-agricultural habitat attributes rather than the
availability of crops. At the landscape scale, both
density and population stability were positively
associated with the size and contiguity of forest
patches, while at the local scale density was posi-
tively correlated with plant diversity and the density
of tree cavities. In addition, populations occupying
forest patches with greater levels of plant diversity
and stable water resources exhibited less temporal
variability than populations with limited plant species
complexity or water availability. The proportion of
populations comprised of females was most strongly
influenced by the availability of tree cavities and soft
mast. Despite the abundance of mesopredators in
heterogeneous landscapes, our results indicate that all
patches do not contribute equally to the regional
abundance and persistence of these species. Thus, a
clear understanding of how landscape attributes
contribute to variation in demography is critical to
the optimization of management strategies.
Electronic supplementary material The online version ofthis article (doi:10.1007/s10980-011-9619-x) containssupplementary material, which is available to authorized users.
J. C. Beasley (&) � Z. H. Olson � G. Dharmarajan �T. S. Eagan II � O. E. Rhodes Jr.
Department of Forestry and Natural Resources, Purdue
University, 195 Marsteller Street, West Lafayette, IN
47907, USA
e-mail: [email protected]
Present Address:G. Dharmarajan
Laboratory of Malaria and Vector Research, National
Institute of Allergy and Infectious Diseases, National
Institutes of Health, 12735 Twinbrook Parkway, Room
2W-13, Rockville, MD 20852, USA
Present Address:T. S. Eagan II
Michigan State University, G-100 Veterinary Medical
Center, East Lansing, MI 48824, USA
Present Address:O. E. Rhodes Jr.
United States Department of Agriculture, Animal Plant
Health Inspection Service, Wildlife Services, National
Wildlife Research Center, 4101 LaPorte Ave., Fort
Collins, CO 80521, USA
123
Landscape Ecol (2011) 26:937–950
DOI 10.1007/s10980-011-9619-x

Keywords Age structure � Agricultural ecosystem �Disease � Habitat quality � Population dynamics �Predation � Procyon lotor � Program MARK �Raccoon � Sex ratio
Introduction
Worldwide, anthropogenic activities such as the
clearing of land for agricultural production and
grazing cattle have dramatically altered the spatial
arrangement and composition of native habitat
patches. As a result, understanding the consequences
of habitat destruction and fragmentation for wildlife
populations is an intrinsic concern of wildlife
professionals. Habitat fragmentation threatens the
stability and persistence of local populations due to
increased genetic, demographic, or environmental
stochasticity (Wiens 1976; Gilpin and Hanski 1991;
Andren 1994). Moreover, fragmentation ultimately
leads to reductions in the total amount of native
habitat available, as well as to changes in the quality
of remaining habitats through increased patch isola-
tion, and deleterious edge effects (Yahner 1988).
Habitat fragmentation can alter the spatial struc-
ture of vertebrate populations, as the abundance and
distribution of wildlife populations often are influ-
enced by the spatial arrangement and composition of
habitats within landscapes (Saunders et al. 1991;
Kozakiewicz et al. 1999). More importantly, habitat
fragmentation can alter the spatial arrangement of
critical resources within a landscape, potentially
resulting in disparate demographic patterns (e.g.,
sex ratio, abundance, etc.) for species among habitat
patches. However, the degree to which fragmentation
alters the demography of wildlife populations should
vary as a function of the behavioural plasticity of
individual species (Bender et al. 1998; Nupp and
Swihart 2000). Generalist species and those with an
affinity to edges, often are less affected by habitat
fragmentation than are interior species or habitat
specialists (Nupp and Swihart 1996; Bender et al.
1998; Hokit and Branch 2003).
Although habitat fragmentation occurs in many
contexts throughout the world, the Midwestern United
States serves as a renowned example of this type of
landscape disturbance, where remnant native habitats
persist as a mosaic of small patches within a matrix
dominated by agricultural crops and anthropogenic
features (Moore and Swihart 2005). Within the agri-
cultural ecosystems of the Midwestern U.S., generalist
species with broad habitat tolerances and good mobil-
ity often thrive, presumably, at least in part, because of
their ability to adapt to the displacement of native food
resources by utilizing corn and other crops (Oehler and
Litvaitis 1996; Beasley et al. 2007a; Beasley and
Rhodes 2008).
Raccoons (Procyon lotor) undoubtedly are among
the most plastic of mammals in terms of their ability
to modify their ecology and behaviour relative to
local environmental conditions, exhibiting substan-
tive variance in nearly every aspect of their ecology
across their range (Gehrt 2003). Raccoons are
abundant in agricultural ecosystems, where they
occur in densities that generally exceed those of
raccoons occupying less disturbed landscapes (Beas-
ley and Rhodes 2008). However, despite their general
adaptability and behavioural plasticity, previous
research suggests that habitat fragmentation can lead
to spatial variation in raccoon movement behaviour
(Beasley and Rhodes 2010) and levels of kin structure
(Dharmarajan et al. 2009) among local populations,
presumably in response to variation in local patch
quality; although the effects of forest fragmentation
on the ecology of raccoon populations are poorly
understood. Consequently, demographic parameters
of raccoon populations also are likely to vary among
habitat patches in heterogeneous landscapes due to
local variation in habitat attributes.
For raccoons or other predator species, spatial and
temporal variability in population size can have
significant consequences on the abundance and
persistence of prey species, as well as on the
transmission dynamics of infectious diseases. For
example, in years of high raccoon abundance,
survival of local ground-nesting bird or small mam-
mal populations may be drastically reduced, either
through direct predation, or through an increased
prevalence of infectious diseases (Robinson et al.
1995; Donovan et al. 1997; Heske et al. 1999; Page
et al. 1999). Moreover, spatial variation in the gender
composition of raccoon populations could directly
influence patch specific reproductive levels, poten-
tially leading to variation in reproductive potential
among local populations for this species in agricul-
tural ecosystems. Given the apparent success of
mesopredators in fragmented agricultural environ-
ments, as well as the potential cascading effects that
938 Landscape Ecol (2011) 26:937–950
123

these species can have on broader ecological pro-
cesses (e.g. disease transmission, predation, etc.),
elucidating the relationships between habitat attri-
butes and population dynamics of such generalist
predators is critical to understanding how these
complex ecosystems function.
In this study, we utilized a relatively long-term
(6-year) mark-recapture data set for raccoons occupying
25 distinct forest patches in a highly fragmented
agricultural ecosystem to evaluate the influence of local
and landscape habitat attributes on raccoon demography
(density, gender ratio, age composition), as well as on
the temporal stability of each of these demographic
metrics among forest patches. Our objective in this
research was to test the hypotheses that (1) the
demographic parameters of local raccoon populations
exhibit significant levels of spatial and temporal vari-
ation, and that (2) habitat attributes associated with
fragmentation (e.g. patch size), and patch quality (e.g.
water availability) directly contribute to this variance.
Methods
Study area
Our 1,165 km2 study area was located in the Upper
Wabash River Basin (UWB) in north-central Indiana,
USA. Approximately 71% of the land area within the
UWB was in agricultural use, with corn and soybeans
comprising the primary crops. All contiguous forest
tracts within the study area were confined to major
drainages where frequent flooding or locally steep
topography made the land unsuitable for crop
production. The remaining native forests (predomi-
nantly oak-hickory-maple [Quercus-Carya-Acer]) in
the basin were highly fragmented, with the distribu-
tion of forest patch sizes dominated by patches\5 ha
(75%; Moore and Swihart 2005).
Within this landscape raccoon activity is predom-
inantly concentrated within forested habitat or along
forest-agricultural interfaces, with little activity occur-
ring within the agricultural matrix (Beasley et al.
2007b; Beasley and Rhodes 2010). Thus, we selected
25 distinct forest patches from our general study area to
examine spatial and temporal variation in raccoon
demographic characteristics. Forest patches were
selected in an effort to represent the distribution of
local and landscape level patch characteristics present
within the landscape. Based on the spatial distribution
of patches sampled throughout our study area (average
Euclidean distance between the centre of trapped
patches was [16 km) and small home range sizes of
raccoons in the UWB ( �X = 73 ha; Beasley et al.
2007a), we considered each patch to represent a ‘‘local
population’’ of raccoons.
Raccoon trapping
Raccoon trapping was conducted in each of the 25
patches annually (late March-early June) from 2004 to
2009 prior to the emersion of young from den sites. We
captured raccoons using box live traps (Tomahawk
Live Trap Co., Tomahawk, Wisconsin, USA) baited
with commercial cat food. Traps were placed in a grid
(50-m spacing) within forest patches and pre-baited for
1–3 nights. Following the pre-baiting period traps were
opened and maintained for 10 consecutive nights. The
total number of traps per grid varied with patch size,
with a maximum of 30 traps placed in any single forest
patch (range 4–30, �X = 19.4). We immobilized cap-
tured raccoons with Telazol (Fort Dodge Animal
Health, Fort Dodge, IA, USA) at a dosage of five mg/kg
of estimated body mass.
Sex was determined for all newly captured raccoons
which were subsequently ear-tagged (Monel #3,
National Band and Tag Company, Newport, Kentucky,
USA), weighed, and aged via tooth-wear (Grau et al.
1970). Raccoons were classified as juveniles (1 year),
yearlings (2 year), or adults (C3 year). In addition, we
collected tissue samples (ear biopsy) from each
captured individual for genetic analyses. Tagged
raccoons captured in subsequent years were immobi-
lized and processed as new individuals (with the
exception of tagging and tissue collection) to obtain
updated demographic information. All trapping and
handling methods conformed to the American Society
of Mammalogists guidelines (Gannon et al. 2007) as
well as Purdue University Animal Care and Use
Committee policies under Protocol 01-079.
Landscape-scale characteristics
To quantify landscape level habitat attributes associ-
ated with each forest patch and its local raccoon
population, we used a GIS database developed from
1998 U.S. Geological survey digital orthophotos
Landscape Ecol (2011) 26:937–950 939
123

(DOQs) of 1-m resolution. Habitats were delineated
into 8 land use classes: forest, shrubland, wooded
corridors, grassland, agriculture, water, developed,
and roads. Specific details of habitat delineations are
provided in Retamosa et al. (2008). In addition, we
incorporated two additional layers into our GIS, the
National Hydrography Dataset and the National
Wetlands Inventory, to more precisely define water
availability.
We used ArcMap 9.2 to estimate landscape-level
attributes associated with trapped forest patches. We
estimated the size, as well as total area (ha) of forest,
agriculture, developed, wetland (including ponds/lakes),
and stream (length) habitats within a 92 ha buffer of the
centroid of each trapped patch. A 92 ha buffer was
chosen to account for the movement behaviour of
raccoons in our landscape; it represents an area equal to
the average home range size (95% fixed kernel) of male
raccoons, which maintain larger home ranges than
females, in our study area (Beasley et al. 2007a).
To obtain annual crop specific data for all agricul-
tural fields proximal to forest patches trapped for
raccoons, we used remote sensing cropland data layers
(CDLs; 30-m resolution) for Indiana, collected by the
U.S Department of Agriculture-National Agriculture
Statistics Service (USDA-NASS) from 2003 to 2008
(USDA-NASS 2004–2009). Because trapping occurred
during the spring prior to the development of crops,
crop types were assigned to fields based on CDL’s for
crops planted during the previous year. We classified
all crop fields (corn, soybeans, or wheat) within a 92 ha
buffer (see above) of the centroid of forest patches
trapped for raccoons each year and estimated the
proportion of each buffer comprised of corn.
To evaluate the influence of weather on interan-
nual variation in raccoon demographics, we obtained
daily precipitation and temperature data for our study
area from the National Oceanic Atmospheric Admin-
istration’s National Climatic Data Centre for
2003–2009. From these data we calculated average
minimum winter temperatures (Dec–Feb) and cumu-
lative annual precipitation for the period prior to
trapping each year (March through February).
Fine-scale patch characteristics
To estimate the potential number of den sites
available in each forest patch, we conducted raccoon
den surveys prior to leaf emergence during March
2009. For each forest patch we surveyed the entire
patch or a maximum area of 20 ha centred on the
trapping grid, which was an area equivalent to the
average core area of male raccoons in our study area
(Beasley et al. 2007a). Consequently, den site esti-
mates represent a complete census of the area
surveyed. Prior to conducting den surveys we
performed double blind surveys to ensure den counts
were consistent among all field personnel.
Forest patches were partitioned into grid sections
and systematically searched for potential den sites.
We recorded the den type (tree cavity, ground den,
brush pile, hollow log) for all observed dens and
marked them with chalk to avoid double counting.
Tree cavities were visually examined using binocu-
lars to ensure they were sufficiently deep to house
raccoons, not positioned to hold water, and only tree
cavities with openings estimated to be [8 cm in
diameter were counted (Robb et al. 1996). Due to the
large number of patches surveyed it was logistically
impossible to visually inspect the inside of all tree
cavities for their potential utility as a den site. Thus,
the number of estimated den sites likely is an
overestimate of the true number of available dens
as some cavities may not have been suitable for use
by raccoons (i.e., held water, not deep enough, etc.).
However, there is no reason to suspect that systematic
bias existed among forest patches in the proportion of
putative dens that were inhospitable. We estimated
den tree density and overall density of den sites
within each forest patch by dividing the number of
dens observed by the total area surveyed.
During the summer of 2008 we conducted vege-
tation surveys in each of the 25 patches sampled for
raccoons to characterize the fine-scale vegetative
composition of each patch. Surveys were conducted
in nested plots (range 4–10 plots/patch) representing
*5% of the area of each forest patch. Nested plots
consisted of one circular 0.081 ha overstory plot
(trees [25.6 cm dbh), one circular 0.0405 ha under-
story plot (trees and shrubs\25.6 cm dbh), and three,
3 m2 herbaceous groundcover plots. Species in each
level were characterized in terms of their density and
frequency, as well as their percent coverage in the
case of herbaceous plants. We calculated basal area
for overstory trees to produce basal area densities
(BAD) for each taxon and a total BAD for each patch.
Within understory plots we counted the number of
understory tree or shrub stems as a measure of
940 Landscape Ecol (2011) 26:937–950
123

understory stand density. In addition, within the
understory we also estimated the density of soft mast
producing species (including Acer spp.) Overall
species diversity for each patch was calculated using
Shannon’s diversity index (Krebs 1999), incorporat-
ing overstory, understory, and herbaceous plant
compositions.
Raccoon demography
Based on patterns of ear tearing/scarring, we
observed numerous instances of presumed tag
removal by raccoons. Thus, to maximize the utility
of our data set while eliminating any effects of tag
loss on demographic parameter estimates, we used
genetic data collected for all individuals within our
study population to evaluate whether unidentified
matching genotypes were present within our sample
set, representing individuals that had lost their tags
and been reassigned as new individuals on a
subsequent trapping occasion. Using data generated
from 14 highly polymorphic microsatellites devel-
oped in our lab (See Fike et al. 2007; Dharmarajan
et al. 2009 for details), we employed CERVUS 3.0
(Kalinowski et al. 2007) to identify individuals with
matching multilocus genotypes. The probability of
identity (i.e., probability of finding two identical
genotypes in our populations) was 1.02 9 10-16 for
our suite of loci. Matching multilocus genotypes with
B2 mismatches were re-evaluated to confirm allele
assignments. Moreover, individuals with matching
multilocus genotypes were further evaluated to
ensure that compatibility among demographic param-
eters (i.e., gender, age, weight, location) existed.
We computed raccoon abundance estimates using
the Huggins closed capture-recapture modelling pro-
cedure (Huggins 1989) in Program MARK (White
and Burnham 1999). We chose Huggins models
because this approach allows the incorporation of
covariates (e.g., gender, age) into models. Moreover,
the Huggins estimator excludes population estimates
from the likelihood function, allowing initial efforts
to be centred on obtaining parsimonious estimates of
capture (p) and recapture (c) probabilities for the
combined data set, which then can be used to
generate more accurate estimates of N for subsets
of the data (e.g., local populations; White 2005).
For many forest patches we captured too few
individuals (average number captured/patch = 8) to
reliably estimate patch specific detection probabilities
using only data from a single year. To overcome
problems associated with low numbers of individuals
per patch, we modelled the combined data from all 25
patches during each year to obtain parsimonious
models of the p and c parameters for the combined
data set, but obtained patch specific estimates of N by
treating each patch as a disparate attribute group in
MARK (White 2005). We developed separate models
for each of the 6 years to minimize violations of the
closure assumption. By constraining the p and
c parameters to be constant among patches during
each year it is assumed that all populations are closed
during the entire sampling period (B2.5 months).
Although it is possible that violations of the closure
assumption occurred during our sampling period
which could thus bias estimates of population size
using Huggins models, any violations likely were
minimal as trapping occurred prior to the availability
of young (young were constrained to natal dens
during our sampling period), spring mortality rates
are low for raccoons C1 year of age, and dispersal
primarily occurs during the fall (Gehrt 2003). Both
gender and age of raccoons were considered in the
models as covariates. Model fit was evaluated using a
bias-corrected version of Akaike’s information crite-
rion (AICc) and we used model averaging to deter-
mine final population sizes for all models deviating
B4 AICc units from one another (Burnham and
Anderson 2002).
Based on MARK estimated population sizes, we
calculated year specific density estimates for each
patch by overlaying a buffer encompassing an area
equal to the average raccoon’s home range size in our
study area (73 ha; Beasley et al. 2007a) centred on
the centroid of each trapping grid. This buffer was
assigned to approximate the effective area of our
trapping grid by accounting for raccoon movements.
In addition to density, we also calculated annual as
well as overall average adult gender (female:male)
and age bias (adult: juvenile ? yearling) for each
patch. Because a number of patch/year combinations
contained missing age or gender cohorts (e.g., no
males), to avoid problems associated with dividing by
zero we estimated patch-specific gender and age bias
as (Na - Nb)/NT, where a represents the number of
females or adults, and b the number of males or
juveniles ? yearlings. This equation results in gender
and age bias estimates ranging from -1 to 1, with
Landscape Ecol (2011) 26:937–950 941
123

values of -1 indicating male or juvenile ? yearling
biased populations and 1 representing populations
comprised exclusively of females or adults. The
number of juveniles and yearlings were combined for
the estimation of population age structure because
both of these age classes have higher probabilities of
dispersal than adults (Gehrt 2003).
Spatial and temporal analyses of raccoon
demography
To test whether significant temporal (years) or spatial
(forest patches) variation existed in overall raccoon
population density, adult gender bias, or age bias for
our study area (all 25 patches combined) over the
course of the study, we used Analysis of Variance
(ANOVA) incorporating both year and patch as main
effects. Because patch specific raccoon demographic
variables represent a single value for each year (i.e.,
no variance), these models lacked the degrees of
freedom necessary to evaluate the interaction of year
and patch in the models; therefore, we limit our
interpretation of these findings to the main effects
(see ‘‘Results’’ section). In addition, when specific
demographic metrics were found to vary across years,
we evaluated whether interannual variation in rainfall
or average minimum winter temperatures contributed
significantly to temporal variance in those metrics
using univariate ANOVA.
Local and landscape effects on raccoon
demography
Pearson correlation tests revealed that several of our
landscape attributes or local-scale habitat variables
were highly correlated. For example, the availability
of streams and Shannon’s diversity index both were
highly correlated with forest patch size, and the
amount of forest within a home range buffer of
trapped patches. Many of these variables also
contained redundant information (e.g. total den site
density and tree cavity density); thus, to pare down
the number of habitat variables (N = 25) we elimi-
nated redundant variables by selecting only those of
greatest interest based upon previous studies of
raccoon ecology (N = 12 culled; Table S1). Subse-
quently, for instances in which C2 variables of
interest were correlated at P B 0.05, we retained the
variable with the strongest correlation with each
dependent variable of interest. After removing corre-
lated and redundant variables, 13 variables were
retained for subsequent analyses (Table 1).
We evaluated the influence of local and landscape
habitat attributes on raccoon demography using linear
mixed models with repeated measures (PROC
MIXED, SAS ver. 9.1, SAS Institute, Cary, N.C.).
We developed separate models for raccoon density,
adult gender bias, and age bias, with habitat variables
incorporated into each model as fixed effects, patch
as a random effect, and year as the repeated measure.
For each dependent variable we developed a global
model incorporating all habitat variables. Using the
global model we first investigated the covariance
structure of this model for each dependent variable by
evaluating model fit for each of four common
covariance structures (compound symmetry, unstruc-
tured, autoregressive, and heterogeneous autoregres-
sive) using AICc (Burnham and Anderson 2002).
Based on these analyses an autoregressive covariance
structure was found to most closely fit our data for
each dependent variable and was used for all
subsequent analyses. Using the residuals from each
global model, we examined normal probability plots
and Kolmogorov–Smirnov goodness of fit statistics to
confirm that our data conformed to the assumptions
of normality and homoscedasticity. For each depen-
dent variable, we then developed a series of models
incorporating all combinations of habitat variables
and ranked candidate models relative to the global
model using AICc. In addition, we also calculated
Akaike weights (wi) for all models within two AICc
units of the top model to assist in model selection.
We also were interested in modelling the influence
of habitat characteristics on the number of adult male
and female raccoons present within patches. Using
the same repeated measures mixed models approach
described above, we developed a suite of models
incorporating all combinations of habitat variables as
independent variables and the number of male or
female raccoons captured each year as dependent
variables and ranked competing models using AICc.
Previous research has suggested that den trees may be
a potentially limiting resource for raccoons (Endres
and Smith 1993). Therefore, we used univariate
regressions to further explore the nature of the
relationship between den tree density (as opposed to
overall den site density) within habitat patches and
the following variables (each averaged across the
942 Landscape Ecol (2011) 26:937–950
123

6 years of our study): number of females captured,
number of males captured, and gender bias (1 patch
was an outlier due to its size (0.5 ha) and thus was
removed from these analyses).
In addition to our spatial analyses, we evaluated
temporal variation in raccoon demography by esti-
mating the coefficient of variation (CV = SD/ �X)
associated with estimates of raccoon density calcu-
lated over the 6-year study period. We then devel-
oped a series of best subsets multiple regression
models, incorporating all combinations of habitat
variables, to evaluate the influence of habitat charac-
teristics on interannual variance (as measured by CV)
in raccoon density, and ranked competing models
using AICc and wi. All statistical analyses were
performed using SAS (SAS ver. 9.1).
Finally, because many of our habitat variables were
correlated we were unable to explore the relationship
between several variables of interest and spatial or
temporal variance in raccoon demography in our
previous analyses. Therefore, we also regressed patch
specific estimates of mean raccoon density, mean adult
gender ratio, the average number of females captured,
and density CV against habitat variables excluded from
our previous analyses associated with forest fragmen-
tation (e.g. patch size), and additional attributes
thought to be important to raccoons based on previous
research on this species (e.g. water availability) using
univariate linear regression (Figs. S1-S3).
Results
Raccoon trapping and demography
A total of 852 unique raccoons were captured 2,214
times during the 6 years of this study. The within
year recapture rate for the global population (all
patches combined) was 43%. A total of 236 raccoons
were captured in [1 year and 81 individuals were
captured in C3 years. The number of raccoons
captured within a single 10-day trapping period was
highly variable among forest patches, ranging from 0
to 22 ( �X = 8.03, SD = 4.51). Based upon our genetic
Table 1 Description of habitat variables (retained after eliminating redundant variables) used to examine the influence of habitat
characteristics on raccoon population dynamics in north-central Indiana, USA, 2004–2009
Acronym Description Density Density coefficient
of variation
Gender
composition
Age
structure
DIVa Overall Shannon’s diversity index of plant composition X X
FORBUFFab Amount of forest (ha) within a home range buffer
(0.73 km2) surrounding patches
X X
PROPCORNb Proportion of corn within a home range buffer
surrounding patches
X
URBBUFF Amount of developed (ha) within a home range buffer
surrounding patches
X X X X
TREECAV Density of potential den tree cavities (tree cavities/ha) X X X X
SOFTMASTc Density of softmast producing species including
understory
Acer spp.(plants/ha)
X X
GRASScd Average % coverage grass spp. X X
BADd Basal area of overstory trees X X
WETLAND Area of wetlands (ha) within patches X X X X
SHRUB Density of woody stems \25.6 cm DBH (stems/ha) X X X X
FORBS Density of forbs (plants/m2) X X X X
STREAMe Length of streams (m) within a home range buffer
surrounding patches
X X X
PSIZEe Forest patch area (ha) X X X
X’s indicate habitat variables included in models for each demographic variablea–d Habitat variables sharing the same superscript were correlated at P \ 0.05e Variables evaluated only using univariate regression
Landscape Ecol (2011) 26:937–950 943
123
analyses, 124 matching genotypes were present
within our data set representing 43 unique individuals
that had lost their tags between years and been
retagged as new individuals (several individuals were
tagged [2 times); no instances of misread tags
occurred and no individuals lost both tags within a
trapping round. Interestingly, of the 43 individuals
that were retagged during this study, 41 (95%) were
males. This exemplifies the value of combining
genetic and demographic techniques in mark-recap-
ture studies, as failing to account for a gender bias in
tag loss could result in inaccurate gender-specific
estimates of demography (e.g. survival, density).
Based on our MARK analyses, local raccoon popu-
lation estimates ranged from 0 to 29 ( �X = 10.17, SD =
5.64) across the 6 year sampling period. Density
estimates derived from these abundance estimates
ranged from 0 to 40 raccoons/km2 ( �X = 13.93, SD =
7.73). Modified adult gender bias (see ‘‘Methods’’
section) averaged across the 6 years of our study also
was highly variable among patches, ranging from -1
to 0.48 ( �X = - 0.21, SD = 0.34). Similarly, average
modified age bias (see ‘‘Methods’’ section) ranged
from -1 to 0.73 ( �X = 0.30, SD = 0.21) among forest
patches.
Spatial and temporal analyses of raccoon
demography
Neither overall raccoon density nor adult gender bias
differed over the 6 years of our study for the global
population (F = 2.01, P = 0.08; F = 0.46, P = 0.80,
respectively). However, significant differences among
forest patches were observed for each of these demo-
graphic measures (density: F = 5.71, P \ 0.0001, adult
gender bias: F = 2.28, P = 0.002). Tukey post-hoc
tests adjusted for multiple comparisons revealed that
several patches differed significantly from one another
in density as well as in adult gender bias (See Tables S2
and S3 for pairwise comparisons of all populations).
In contrast, no differences were observed in raccoon
age bias among forest patches (F = 1.27, P = 0.20),
but differences were observed in age bias among years
for the global population (F = 2.71, P = 0.02);
although a Tukey post-hoc comparisons test failed to
identify differences among specific years. Because the
age bias of raccoon populations was found to differ
among years, we evaluated whether variation in
weather parameters among years explained a signifi-
cant portion of this variance. From this analysis,
raccoon age bias (adult: juvenile ? yearling) within
habitat patches was found to be positively associated
with the annual amount of precipitation during the
previous year (F = 7.0, P = 0.009).
Local and landscape effects on raccoon
demography
Analyses of the influence of habitat attributes on
spatial variation in raccoon density produced four
highly competitive models retaining 3–5 habitat
variables (DAICc \ 4; Table 2). Our analysis of
raccoon adult gender bias produced a single best-fit
model, in which the variables TREECAV and
PROPCORN were retained (b = 0.28, F = 8.321,96,
P = 0.005; b = 0.50, F = 3.501,96, P = 0.065,
respectively). Similarly, a single best-fit model was
identified for raccoon age bias, in which only overall
plant species diversity (DIV) was retained (b = 0.43,
F = 5.671,123, P = 0.02).
Analyses of the influence of habitat characteristics
on the number of adult females captured within patches
produced two competing models (DAICc = 1.5), with
the best-fit model containing the variables FORBUFF,
TREECAV, and GRASS, all of which were significant
in the model (b = 0.05, F = 9.421,125, P = 0.003;
b = 1.22, F = 13.821,125, P \ 0.001; b = -7.0,
F = 7.011,125, P = 0.009, respectively). For deter-
mining the influence of habitat characteristics on the
number of adult males captured within patches, a single
best-fit model was produced in which FORBUFF
(b = 0.07, F = 40.961,124, P \ 0.001) and GRASS
(b = -3.07, F = 2.951,124, P = 0.088) were retained.
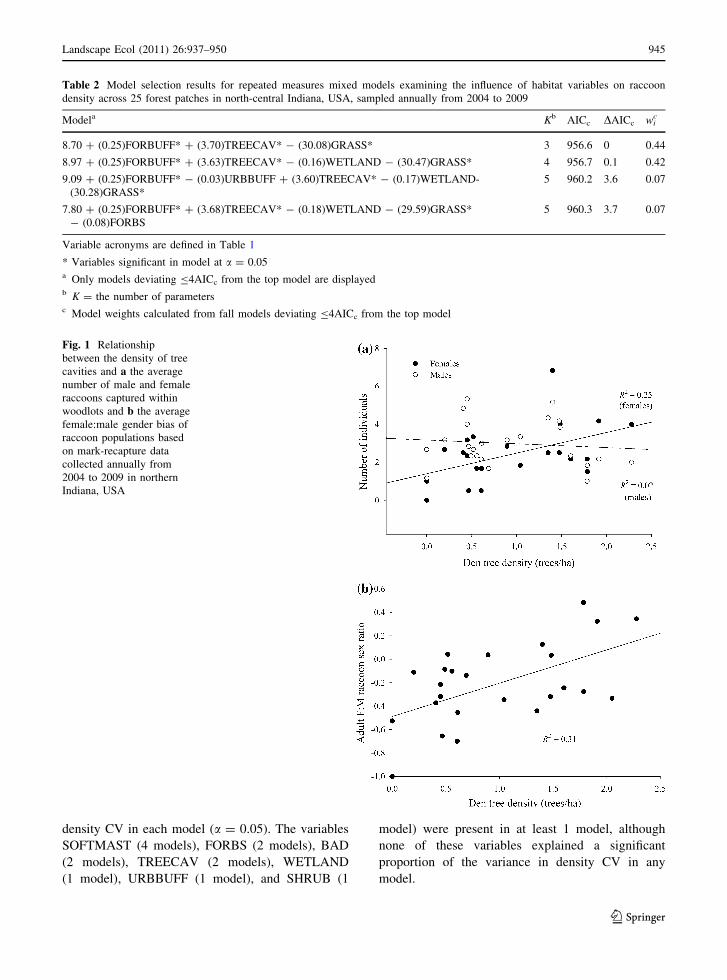
Among the univariate analyses performed, den tree
density was significantly positively correlated with the
average number of females captured (F = 7.491,23,
P = 0.01) and the average raccoon gender bias
(F = 13.851,23, P = 0.001) within local populations
(Fig. 1). In contrast, no relationship was observed
between den tree density and the number of males
captured within a patch (F = 0.401,23, P = 0.53;
Fig. 1)
The examination of temporal variation (CV across
years) in raccoon density produced 11 competitive
models (DAICc \ 2; Table 3). The variable FOR-
BUFF appeared in all 11 models, and explained a
significant proportion of the variance in raccoon
944 Landscape Ecol (2011) 26:937–950
123
density CV in each model (a = 0.05). The variables
SOFTMAST (4 models), FORBS (2 models), BAD
(2 models), TREECAV (2 models), WETLAND
(1 model), URBBUFF (1 model), and SHRUB (1
model) were present in at least 1 model, although
none of these variables explained a significant
proportion of the variance in density CV in any
model.
Table 2 Model selection results for repeated measures mixed models examining the influence of habitat variables on raccoon
density across 25 forest patches in north-central Indiana, USA, sampled annually from 2004 to 2009
Modela Kb AICc DAICc wic
8.70 ? (0.25)FORBUFF* ? (3.70)TREECAV* - (30.08)GRASS* 3 956.6 0 0.44
8.97 ? (0.25)FORBUFF* ? (3.63)TREECAV* - (0.16)WETLAND - (30.47)GRASS* 4 956.7 0.1 0.42
9.09 ? (0.25)FORBUFF* - (0.03)URBBUFF ? (3.60)TREECAV* - (0.17)WETLAND-
(30.28)GRASS*
5 960.2 3.6 0.07
7.80 ? (0.25)FORBUFF* ? (3.68)TREECAV* - (0.18)WETLAND - (29.59)GRASS*
- (0.08)FORBS
5 960.3 3.7 0.07
Variable acronyms are defined in Table 1
* Variables significant in model at a = 0.05a Only models deviating B4AICc from the top model are displayedb K = the number of parametersc Model weights calculated from fall models deviating B4AICc from the top model
Fig. 1 Relationship
between the density of tree
cavities and a the average
number of male and female
raccoons captured within
woodlots and b the average
female:male gender bias of
raccoon populations based
on mark-recapture data
collected annually from
2004 to 2009 in northern
Indiana, USA
Landscape Ecol (2011) 26:937–950 945
123

Discussion
Raccoons arguably are one of the most plastic
mammals in terms of their ability to adapt to and
exploit nearly all terrestrial ecosystems throughout
their range (Fritzell 1978; Prange et al. 2004; Beasley
et al. 2007a). Despite this plasticity, our results
suggest that even in landscapes in which raccoons
appear to flourish, this apparent productivity reflects
considerable spatial and temporal variance that is
directly tied to local and landscape habitat attributes.
Accordingly, our results imply that all patches do not
contribute equally to the regional abundance and
persistence of raccoon populations in fragmented
landscapes, and that a fraction of patches likely
contribute most (probably as a source of emigrants) to
overall population abundance. Given the patterns of
variation in demographic parameters we observed for
raccoons, interpatch variation in demography likely is
magnified for species that are sensitive to the high
levels of spatial and temporal variation in resource
distribution that are typical of fragmented agricultural
landscapes, and may explain the limited success of
such species in these landscapes (Nupp and Swihart
2000; Rushton et al. 2000).
The importance of forested habitat to wildlife
inhabiting human-altered landscapes has been well
established in the scientific literature (e.g. Chamber-
lain et al. 2003; Henner et al. 2004; Beasley et al.
2007b). However, the magnitude to which underlying
fine-scale attributes of forest habitat contribute to
patch-specific variation in population dynamics has
received considerably less attention. At the landscape
scale, both raccoon density and overall population
stability were positively associated with the size and
contiguity of forest patches. Similarly, Beasley and
Rhodes (2010) observed that home range size in
raccoons is inversely related to both forest patch size
and patch isolation in fragmented agricultural land-
scapes, presumably due to the higher quality of large,
contiguous patches. Within intensively farmed land-
scapes, contiguous forest tracts primarily are confined
to river drainages where the local topography makes
land unsuitable for agricultural production. Conse-
quently, these larger forest tracts likely have
increased water availability, as well as more diverse
plant communities than small, isolated patches due to
a greater variance in microhabitat conditions. Indeed,
both the overall length of streams and Shannon’s
diversity index were highly correlated with forest
patch size and the amount of forest within a home
range buffer surrounding target patches in our study.
Within fragmented landscapes, large, contiguous
patches also undoubtedly facilitate dispersal, either
Table 3 Model selection results from multiple regression
models examining the influence of habitat variables on the
coefficient of variation (CV) for raccoon density, based on
mark-recapture data from 25 forest patches sampled annually
from 2004 to 2009 in north-central Indiana, USA
Modela R2 Kb AICc DAICc wic
0.50 - (0.005)FORBUFF* 0.30 1 -114.53 0 0.09
0.45 - (0.005)FORBUFF* ? (0.001)SOFTMAST 0.32 2 -114.34 0.19 0.08
0.53 - (0.005)FORBUFF* - (0.0004)BAD 0.29 2 -113.08 1.46 0.04
0.48 - (0.005)FORBUFF* - (0.0004)BAD ? (0.0001)SOFTMAST 0.31 3 -113.07 1.46 0.04
0.51 - (0.005)FORBUFF* - (0.003)URBBUFF 0.28 2 -112.94 1.60 0.04
0.51 - (0.005)FORBUFF* - (0.005)WETLAND 0.28 2 -112.85 1.68 0.04
0.53 - (0.005)FORBUFF* - (0.002)FORBS 0.28 2 -112.83 1.70 0.04
0.48 - (0.005)FORBUFF* ? (0.0001)SOFTMAST-(0.002)FORBS 0.30 3 -112.59 1.95 0.03
0.47 - (0.005)FORBUFF* ? (0.0001)SOFTMAST-(0.01)TREECAV 0.30 3 -112.56 1.98 0.03
0.50 - (0.005)FORBUFF* ? (0.000003)SHRUB 0.27 2 -112.54 2.0 0.03
0.50 - (0.005)FORBUFF* - (0.001) TREECAV 0.27 2 -112.54 2.0 0.03
Variable acronyms are defined in Table 1
*Variables significant at a = 0.05 in modela Only models deviating B2AICc from the top model are displayedb K = the number of parametersc Model weights calculated from all models deviating B4AICc from the top model
946 Landscape Ecol (2011) 26:937–950
123

through increased detection probabilities of patches,
or by facilitating movement within the landscape
(Gustafson and Gardner 1996; Zollner and Lima
1999; Selonen and Hanski 2004). Thus, local popu-
lations within contiguous habitat patches likely are
buffered from stochasticity in resource availability
and survival to a greater degree than small, isolated
populations due to the increased availability of
dispersers. Alternatively, contiguous patches may
simply facilitate high rates of reproductive success
and juvenile survival due to the presence of streams
and increased prevalence of non-agricultural food
resources. Although the underlying mechanism driv-
ing this observed variance in population stability was
unclear, our data suggest that emergent properties
associated with fragmented agricultural landscapes
contribute to spatial and temporal variation in
raccoon density.
In addition to landscape-level factors associated
with fragmentation, our results indicate that variabil-
ity in habitat quality also contributes to spatial and
temporal variation in density. At the local scale,
raccoon density was negatively associated with the
proportion of the forest floor comprised of grass, but
positively correlated with plant diversity and the
density of tree cavities. These findings are biologi-
cally intuitive as increased plant diversity likely
corresponds to a greater diversity of food resources,
higher densities of tree cavities should result in
greater reproductive output, and patches with higher
proportions of grass likely have reduced densities of
overstory and understory trees. Indeed, grass avail-
ability was negatively correlated with both overstory
basal area (P \ 0.001) and the density of understory
trees (P = 0.004).
Similarly, the temporal stability of raccoon popu-
lations was positively correlated with a number of fine-
scale habitat attributes associated with patch quality.
Populations occupying forest patches with greater
plant diversity and stable water resources (streams)
exhibited less temporal variability than populations
occupying patches with limited plant species com-
plexity or water availability. Water has been identified
as a critical resource to raccoons (Gehrt and Fritzell
1998; Beasley and Rhodes 2010); thus, the positive
relationship between population stability and water
availability is not surprising. Similarly, greater plant
diversity likely minimizes interannual variation in
food availability. Interestingly, we failed to detect a
response in raccoon density to changes in the avail-
ability of corn, despite the importance of corn in the
diet of raccoons inhabiting agricultural ecosystems
(Rivest and Bergeron 1981; Beasley and Rhodes
2008). This suggests that large quantities of corn are
not necessary to maintain high densities of raccoons
and that local variation in non-agricultural resources
may have a greater influence on raccoon population
sizes and temporal stability than the availability of
corn.
Among mammals, female site fidelity often is tied
to the distribution of critical resources as female
reproductive success is linked to their ability to
exploit these resources, whereas male reproductive
success is driven by their ability to find and mate with
females (Wrangham 1980; Rowell 1988; Clutton-
Brock 1989). Accordingly, in addition to variation in
density among local populations, we also observed
substantive spatial variance in raccoon gender bias,
with the proportion of local populations comprised of
females most strongly influenced by local habitat
attributes associated with patch quality. In particular,
female biased populations were positively associated
with the availability of tree cavities and soft mast
species (e.g., Prunus serotina, Acer spp., Vitis spp.,
Rubus spp.) within local patches.
Although raccoons exhibit a large degree of
plasticity in terms of den site selection (e.g. tree
cavities, brush piles, rock outcroppings, etc.), females
preferentially select tree cavities to rear young,
presumably due to the increased protection against
predation afforded by these structures (Rabinowitz
and Pelton 1986; Endres and Smith 1993). The strong
relationship observed between female abundance and
den tree density suggests that the availability of den
trees is critical to the overall reproductive success of
a habitat patch, and ultimately patch-specific varia-
tion in den tree availability may lead to reproductive
variance among forest patches throughout highly
fragmented landscapes. Indeed, recent genetic anal-
yses have revealed high levels of variance in kin
structure among local raccoon populations, although
the influence of den tree availability on this pattern
has yet to be evaluated (Dharmarajan et al. 2009).
In contrast to the patterns observed for raccoon
density and gender composition, the age bias of local
raccoon populations did not differ among patches
within the landscape; although in general, adult-
biased populations were associated with increased
Landscape Ecol (2011) 26:937–950 947
123
plant diversity. However, we did detect significant
interannual variation in the age bias of the global
population, with adult-biased populations positively
associated with the total rainfall during the previous
year. Interannual variation in the age structure of a
population suggests that survival of specific age
classes may vary from year to year. Increased rainfall
has the potential to contribute to greater softmast
production (Kelly and Sork 2002), as well as
increased availability (and likely stability) of water
and likely food resources associated with water (e.g.,
crayfish, amphibians, etc.; Kiesecker et al. 2001).
Thus, increased rainfall may have contributed to
greater adult survival and increased patch philopatry
among adults due to the higher quality of forest
patches in terms of food and water availability during
years of abundant rainfall, but increased dispersal and
consequently mortality among young due to the
saturation of patches by adults.
Conclusions
Our results clearly indicate that variance in demo-
graphic parameters occurs among local raccoon
populations in heterogeneous landscapes, likely as a
consequence of the variation in composition and
configuration of habitat attributes associated with
agricultural ecosystems. Thus, even for a species
which exhibits high levels of abundance in discon-
tinuous landscapes, there are habitat patches which
presumably are net exporters and importers of
individuals. Future research utilizing both genetic
and fine scale demographic data will be needed to test
this intriguing hypothesis about the spatial dynamics
of raccoon demography in fragmented ecosystems.
A final ramification of this research pertains to
disease transmission dynamics associated with rac-
coons and other wildlife species inhabiting agricul-
tural ecosystems, and may provide a foundation for
understanding how diseases and parasites are
expected to be distributed and spread in these types
of environments. Recent research suggests that the
prevalence of infectious diseases can vary consider-
ably among local populations of wildlife species in
fragmented landscapes, both as a function of popu-
lation demography (Dharmarajan et al. Unpublished
Data) and degree of habitat fragmentation (Page et al.
2001; reviewed by Ostfeld et al. 2005). Given the
large number of infectious diseases and parasites
associated with raccoons and other generalist species
which thrive in anthropogenically modified land-
scapes (Kazacos and Boyce 1989; Schmidt and
Ostfeld 2001; Raizman et al. 2009), a clear under-
standing of how landscape configuration alters pop-
ulation demography and subsequently disease
transmission dynamics is of eminent concern. In
particular, as raccoon rabies continues to spread
westward across the United States towards the
heavily fragmented landscapes of the Midwest, a
greater understanding of how landscape attributes
contribute to spatial and temporal variance in raccoon
demography will greatly enhance our ability to
effectively manage this disease.
Acknowledgements This study would not have been
possible without the cooperation of numerous landowners
who permitted us access to their land. We thank M. Retamosa,
J. Fike, and the numerous field technicians for their assistance
with this research. We also thank P. Zollner, B. Pijanowski,
and two anonymous reviewers for providing comments on
drafts of this manuscript. Funding for this research was
provided by the Department of Forestry and Natural Resources
at Purdue University.
References
Andren H (1994) Effects of habitat fragmentation on birds and
mammals in landscapes with different proportions of
suitable habitat: a review. Oikos 71:355–366
Beasley JC, Rhodes OE Jr (2008) Relationship between rac-
coon abundance and crop damage. Hum-Wildl Confl
2:36–47
Beasley JC, Rhodes OE Jr (2010) Influence of patch and
landscape level attributes on the movement behaviour of
raccoons in agriculturally fragmented landscapes. Can J
Zool 88:161–169
Beasley JC, DeVault TL, Rhodes OE Jr (2007a) Home range
attributes of raccoons in a fragmented agricultural region
of northern Indiana. J Wildl Manag 71:844–850
Beasley JC, DeVault TL, Retamosa MI, Rhodes OE Jr (2007b)
A hierarchical analysis of habitat selection by raccoons in
northern Indiana. J Wildl Manag 71:1125–1133
Bender DJ, Contreras TA, Fahrig L (1998) Habitat loss and
population decline: a meta-analysis of the patch size
effect. Ecology 79:517–533
Burnham KP, Anderson DR (2002) Model selection and mul-
timodel inference: a practical information-theoretic
approach, 2nd edn. Springer, New York
Chamberlain MJ, Conner LM, Leopold BD, Hodges KM
(2003) Space use and multi-scale habitat selection of adult
raccoons in Central Mississippi. J Wildl Manag
67:334–340
948 Landscape Ecol (2011) 26:937–950
123

Clutton-Brock TH (1989) Mammalian mating systems. P R
Soc Lond B Bio 236:339–372
Dharmarajan G, Beasley JC, Fike JA, Rhodes OE Jr (2009)
The population genetic structure of raccoons (Procyonlotor) inhabiting a highly fragmented landscape. Can J
Zool 87:814–824
Donovan TM, Jones PJ, Annand EM, Thompson FR III (1997)
Variation in local-scale edge effects: mechanisms and
landscape context. Ecology 78:2064–2075
Endres KM, Smith WP (1993) Influence of age, sex, season,
and availability on den selection by raccoons within the
central basin of Tennessee. Am Midl Nat 129:116–131
Fike JA, Drauch AM, Beasley JC, Dharmarajan G, Rhodes OE
Jr (2007) Development of fourteen multiplexed micro-
satellite loci for raccoons (Procyon lotor). Mol Ecol Notes
7:525–527
Fritzell EK (1978) Aspects of raccoon (Procyon lotor) social
organization. Can J Zool 56:260–271
Gannon WL, Sikes RS, The Animal Care and Use Committee
of the American Society of Mammalogists (2007)
Guidelines of the American Society of Mammalogists for
the use of wild mammals in research. J Mammal 88:
809–823
Gehrt SD (2003) Raccoon. In: Feldhamer GA, Thompson BC,
Chapman JA (eds) Wild mammals of North America:
biology, management, and conservation. Johns Hopkins
University Press, Baltimore, MD, pp 611–634
Gehrt SD, Fritzell EK (1998) Resource distribution, female
home range dispersion and male spatial interactions:
group structure in a solitary carnivore. Anim Behav 55:
1211–1227
Gilpin M, Hanski I (eds) (1991) Metapopulation dynamics:
empirical and theoretical investigations. Academic Press,
London
Grau GA, Sanderson GC, Rogers JP (1970) Age determination
of raccoons. J Wildl Manag 34:364–372
Gustafson EJ, Gardner RH (1996) The effect of landscape
heterogeneity on the probability of patch colonization.
Ecology 77:94–107
Henner CM, Chamberlain MJ, Leopold BD, Wes Burger L Jr
(2004) A multi-resolution assessment of raccoon den
selection. J Wildl Manag 68:179–187
Heske EJ, Robinson SK, Brawn JD (1999) Predator activity
and predation on songbird nests on forest-field edges in
east-central Illinois. Landscape Ecol 14:345–354
Hokit DG, Branch LC (2003) Habitat patch size affects
demographics of the Florida scrub lizard (Sceloporuswoodi). J Herpetol 37:257–265
Huggins RM (1989) On the statistical analysis of capture-
recapture experiments. Biometrika 76:133–140
Kalinowski ST, Taper ML, Marshall TC (2007) Revising how
the computer program CERVUS accommodates geno-
typing error increases success in paternity assignment.
Mol Ecol 16:1099–1106
Kazacos KR, Boyce WM (1989) Baylisascaris larva migrans.
J Am Vet Med Assoc 195:894–903
Kelly D, Sork VL (2002) Mast seeding in perennial plants:
why, how, where? Ann Rev Ecol Syst 33:427–447
Kiesecker JM, Blaustein AR, Belden LK (2001) Complex
causes of amphibian population declines. Nature
410:681–684
Kozakiewicz M, Gortat T, Kozakiewicz A, Barkowska M
(1999) Effects of habitat fragmentation on four rodent
species in a Polish farm landscape. Landscape Ecol
14:391–400
Krebs CJ (1999) Ecological methodology, 2nd edn. Addison-
Wesley Educational Publishers, New York
Moore JE, Swihart RK (2005) Modelling patch occupancy by
forest rodents: incorporating detectability and spatial
autocorrelation with hierarchically structured data. J Wildl
Manag 69:933–949
Nupp TE, Swihart RK (1996) Effect of forest patch area on
population attributes of white-footed mice (Peromyscusleucopus) in fragmented landscapes. Can J Zool 74:
467–472
Nupp TE, Swihart RK (2000) Landscape-level correlates of
small-mammal assemblages in forest fragments of farm-
land. J Mammal 81:512–526
Oehler JD, Litvaitis JA (1996) The role of spatial scale in
understanding responses of medium- sized carnivores to
forest fragmentation. Can J Zool 74:2070–2079
Ostfeld RS, Glass GE, Keesing F (2005) Spatial epidemiology:
an emerging (or re-emerging) discipline. Trends Ecol
Evol 20:328–336
Page KL, Swihart RK, Kazacos KR (1999) Implications of
raccoon latrines in the epizootiology of Baylisascariasis.
J Wildlife Dis 35:474–480
Page KL, Swihart RK, Kazacos KR (2001) Changes in trans-
mission of Baylisascaris procyonis to intermediate hosts
as a function of spatial scale. Oikos 93:213–220
Prange S, Gehrt SD, Wiggers EP (2004) Influences of anthro-
pogenic resources on raccoon (Procyon lotor) movements
and spatial distribution. J Mammal 85:483–490
Rabinowitz AR, Pelton MR (1986) Day-bed use by raccoons.
J Mammal 67:766–769
Raizman EA, Dharmarajan G, Beasley JC, Wu CC, Pogranichniy
RM, Glickman L, Rhodes OE Jr (2009) Serological survey
for select infectious diseases in raccoons (Procyon lotor) in
Indiana, USA. J Wildlife Dis 45:531–536
Retamosa MI, Humberg LA, Beasley JC, Rhodes OE Jr (2008)
Modelling wildlife damage to crops in northern Indiana:
relative influence of landscape composition and configu-
ration. Hum-Wildl Confl 2:225–239
Rivest P, Bergeron JM (1981) Density, food habits, and eco-
nomic importance of raccoons (Procyon lotor) in Quebec
agrosystems. Can J Zool 59:1755–1762
Robb JR, Cramer MS, Parker AR, Urbanek RP (1996) Use of
tree cavities by fox squirrels and raccoons in Indiana.
J Mammal 77:1017–1027
Robinson SK, Thompson FR III, Donovan TM, Whitehead DR,
Faaborg J (1995) Regional forest fragmentation and the
nesting success of migratory birds. Science 267:1897–1990
Rowell TE (1988) Beyond the one-male group. Behaviour
104:189–201
Rushton SP, Barreto GW, Cormack RM, Macdonald DW,
Fuller R (2000) Modelling the effects of mink and habitat
fragmentation on the water vole. J Appl Ecol 37:475–490
Saunders DA, Hobbs RJ, Margules CR (1991) Biological
consequences of ecosystem fragmentation: a review.
Conserv Biol 5:18–32
Schmidt KA, Ostfeld RS (2001) Biodiversity and the dilution
effect in disease ecology. Ecology 82:609–619
Landscape Ecol (2011) 26:937–950 949
123
Selonen V, Hanski IK (2004) Young flying squirrels (Pteromysvolans) dispersing in fragmented forests. Behav Ecol
15:564–571
United States Department of Agriculture (USDA), National
Agricultural Statistics Service (NASS) (2004–2009)
USDA-NASS’S 1:100,000-scale [2003–2008] cropland
data layer. A Crop-Specific Digital Data Layer for Indiana
http://www.nass.usda.gov/research/Cropland/SARS1a.htm.
Accessed 5 August 2009
White GC (2005) Correcting wildlife counts using detection
probabilities. Wildl Res 32:211–216
White GC, Burnham KP (1999) Program MARK: survival
estimation from populations of marked animals. Bird
Study Suppl 46:120–138
Wiens JA (1976) Population responses to patchy environments.
Ann Rev Ecol Syst 7:81–120
Wrangham R (1980) An ecological model of female-bonded
primate groups. Behaviour 75:262–300
Yahner RH (1988) Changes in wildlife communities near
edges. Conserv Biol 2:333–339
Zollner PA, Lima SL (1999) Search strategies for landscape
level inter-patch movements. Ecology 80:1019–1030
950 Landscape Ecol (2011) 26:937–950
123