Spatial scales of bacterial community diversity at cold seeps (Eastern Mediterranean Sea)
13
OPEN ORIGINAL ARTICLE Spatial scales of bacterial community diversity at cold seeps (Eastern Mediterranean Sea) Petra Pop Ristova 1,2,3 , Frank Wenzho ¨fer 1,2,3 , Alban Ramette 1,2 , Janine Felden 1,2,3 and Antje Boetius 1,2,3 1 HGF-MPG Group for Deep Sea Ecology and Technology, Alfred-Wegener-Institut Helmholtz Zentrum fu ¨r Polar und Meeresforschung, Bremerhaven, Germany; 2 Max Planck Institute for Marine Microbiology, Bremen, Germany and 3 MARUM—Centre for Marine Environmental Science, University of Bremen, Bremen, Germany Cold seeps are highly productive, fragmented marine ecosystems that form at the seafloor around hydrocarbon emission pathways. The products of microbial utilization of methane and other hydrocarbons fuel rich chemosynthetic communities at these sites, with much higher respiration rates compared with the surrounding deep-sea floor. Yet little is known as to the richness, composition and spatial scaling of bacterial communities of cold seeps compared with non-seep communities. Here we assessed the bacterial diversity across nine different cold seeps in the Eastern Mediterranean deep-sea and surrounding seafloor areas. Community similarity analyses were carried out based on automated ribosomal intergenic spacer analysis (ARISA) fingerprinting and high-throughput 454 tag sequencing and were combined with in situ and ex situ geochemical analyses across spatial scales of a few tens of meters to hundreds of kilometers. Seep communities were dominated by Deltaproteobacteria, Epsilonproteobacteria and Gammaproteobacteria and shared, on average, 36% of bacterial types (ARISA OTUs (operational taxonomic units)) with communities from nearby non-seep deep-sea sediments. Bacterial communities of seeps were significantly different from those of non-seep sediments. Within cold seep regions on spatial scales of only tens to hundreds of meters, the bacterial communities differed considerably, sharing o50% of types at the ARISA OTU level. Their variations reflected differences in porewater sulfide concentrations from anaerobic degradation of hydrocarbons. This study shows that cold seep ecosystems contribute substantially to the microbial diversity of the deep-sea. The ISME Journal advance online publication, 12 December 2014; doi:10.1038/ismej.2014.217 Introduction Cold seeps are seafloor ecosystems fueled by chemical energy originating from microbial trans- formation of hydrocarbons and sulfide. They are characterized by the largest biomass and highest productivity of all deep-sea ecosystems (Jørgensen and Boetius, 2007; Levin and Sibuet 2012; Boetius and Wenzho ¨fer 2013). Because of the localized, spatially and temporarily dynamic supply of hydro- carbons from deep subsurface reservoirs, cold seeps have a highly fragmented distribution along con- tinental margins and represent isolated habitats on the vast deep-sea floor (Sibuet and Olu, 1998; Levin, 2005). Main questions about biodiversity patterns, dispersal capabilities and life history of fauna and microbes restricted to these chemosynthetic habitats need to be answered in order to understand the interconnectivity and resilience of these dynamic ecosystems (Tyler and Young, 1999; Pradillon et al., 2005, 2007). Moreover, as biodiversity changes over multiple spatial scales (Green and Bohannan, 2006; Ramette and Tiedje, 2007; Martiny et al., 2011; Hanson et al., 2012), a better understanding of the interconnectivity between these fragmented ecosys- tems needs to be based on quantitative assessments of spatial patterns of species diversity. Members of the domains Bacteria and Archaea contribute the main functions, that is, hydrocarbon degradation, sulfide production and consumption and chemosynthetic CO 2 fixation (Jørgensen and Boetius, 2007) at cold seep and at other types of chemosynthetic ecosystems. The prevailing energy sources at seeps select for specific types of bacteria and their metabolic functions (Knittel and Boetius, 2009; Goffredi and Orphan, 2010), which differ from those of the surrounding oligotrophic, particle-flux dependent deep-sea ecosystem (Orcutt et al., 2011; Quaiser et al., 2011). But still little quantitative information is available about the similarity and spatial variation of bacterial communities at cold Correspondence: P Pop Ristova or A Boetius, MARUM—Centre for Marine Environmental Science, University of Bremen, Leobener Strasse, Bremen 28359, Germany. E-mails: [email protected] or [email protected] Received 28 May 2014; revised 9 October 2014; accepted 10 October 2014 The ISME Journal (2014), 1–13 & 2014 International Society for Microbial Ecology All rights reserved 1751-7362/14 www.nature.com/ismej
-
Upload
independent -
Category
Documents
-
view
2 -
download
0
Transcript of Spatial scales of bacterial community diversity at cold seeps (Eastern Mediterranean Sea)
OPEN
ORIGINAL ARTICLE
Spatial scales of bacterial community diversity atcold seeps (Eastern Mediterranean Sea)
Petra Pop Ristova1,2,3, Frank Wenzhofer1,2,3, Alban Ramette1,2, Janine Felden1,2,3
and Antje Boetius1,2,3
1HGF-MPG Group for Deep Sea Ecology and Technology, Alfred-Wegener-Institut Helmholtz Zentrum furPolar und Meeresforschung, Bremerhaven, Germany; 2Max Planck Institute for Marine Microbiology, Bremen,Germany and 3MARUM—Centre for Marine Environmental Science, University of Bremen, Bremen, Germany
Cold seeps are highly productive, fragmented marine ecosystems that form at the seafloor aroundhydrocarbon emission pathways. The products of microbial utilization of methane and otherhydrocarbons fuel rich chemosynthetic communities at these sites, with much higher respirationrates compared with the surrounding deep-sea floor. Yet little is known as to the richness,composition and spatial scaling of bacterial communities of cold seeps compared with non-seepcommunities. Here we assessed the bacterial diversity across nine different cold seeps in theEastern Mediterranean deep-sea and surrounding seafloor areas. Community similarity analyseswere carried out based on automated ribosomal intergenic spacer analysis (ARISA) fingerprintingand high-throughput 454 tag sequencing and were combined with in situ and ex situ geochemicalanalyses across spatial scales of a few tens of meters to hundreds of kilometers. Seep communitieswere dominated by Deltaproteobacteria, Epsilonproteobacteria and Gammaproteobacteria andshared, on average, 36% of bacterial types (ARISA OTUs (operational taxonomic units)) withcommunities from nearby non-seep deep-sea sediments. Bacterial communities of seeps weresignificantly different from those of non-seep sediments. Within cold seep regions on spatial scalesof only tens to hundreds of meters, the bacterial communities differed considerably, sharing o50%of types at the ARISA OTU level. Their variations reflected differences in porewater sulfideconcentrations from anaerobic degradation of hydrocarbons. This study shows that cold seepecosystems contribute substantially to the microbial diversity of the deep-sea.The ISME Journal advance online publication, 12 December 2014; doi:10.1038/ismej.2014.217
Introduction
Cold seeps are seafloor ecosystems fueled bychemical energy originating from microbial trans-formation of hydrocarbons and sulfide. They arecharacterized by the largest biomass and highestproductivity of all deep-sea ecosystems (Jørgensenand Boetius, 2007; Levin and Sibuet 2012; Boetiusand Wenzhofer 2013). Because of the localized,spatially and temporarily dynamic supply of hydro-carbons from deep subsurface reservoirs, cold seepshave a highly fragmented distribution along con-tinental margins and represent isolated habitats onthe vast deep-sea floor (Sibuet and Olu, 1998; Levin,2005). Main questions about biodiversity patterns,dispersal capabilities and life history of fauna andmicrobes restricted to these chemosynthetic habitats
need to be answered in order to understand theinterconnectivity and resilience of these dynamicecosystems (Tyler and Young, 1999; Pradillon et al.,2005, 2007). Moreover, as biodiversity changes overmultiple spatial scales (Green and Bohannan, 2006;Ramette and Tiedje, 2007; Martiny et al., 2011;Hanson et al., 2012), a better understanding of theinterconnectivity between these fragmented ecosys-tems needs to be based on quantitative assessmentsof spatial patterns of species diversity.
Members of the domains Bacteria and Archaeacontribute the main functions, that is, hydrocarbondegradation, sulfide production and consumptionand chemosynthetic CO2 fixation (Jørgensen andBoetius, 2007) at cold seep and at other types ofchemosynthetic ecosystems. The prevailing energysources at seeps select for specific types of bacteriaand their metabolic functions (Knittel and Boetius,2009; Goffredi and Orphan, 2010), which differ fromthose of the surrounding oligotrophic, particle-fluxdependent deep-sea ecosystem (Orcutt et al., 2011;Quaiser et al., 2011). But still little quantitativeinformation is available about the similarity andspatial variation of bacterial communities at cold
Correspondence: P Pop Ristova or A Boetius, MARUM—Centrefor Marine Environmental Science, University of Bremen,Leobener Strasse, Bremen 28359, Germany.E-mails: [email protected] or [email protected] 28 May 2014; revised 9 October 2014; accepted 10October 2014
The ISME Journal (2014), 1–13& 2014 International Society for Microbial Ecology All rights reserved 1751-7362/14
www.nature.com/ismej
seeps (Pop Ristova et al., 2012) and at other types ofchemosynthetic ecosystems (Huber et al., 2007;Bienhold et al., 2013), as compared with the deep-sea floor (Jacob et al., 2013 and references therein).At the global scale, it was shown that chemosyn-thetic ecosystems displayed the highest heterogeneityin bacterial community structure across all oceanicecosystems (Zinger et al., 2011). Spatial turnover, thatis, the relative change in community compositionalong a spatial gradient (Anderson et al., 2011), ofbacterial communities in the deep-sea was previouslyfound to occur not only at large spatial scales inpelagic sediments (41000s of km; Schauer et al.,2010; Zinger et al., 2011) but also to lesser extent atsmall scales (o1 km; Pop Ristova et al., 2012; Meyeret al., 2013; Ruff et al., 2013) among reduced habitatsof individual systems, mainly due to variations inenergy availability and environmental heterogeneity,as well as spatial separation.
Here we investigated bacterial diversity patternsof seep ecosystems of the oligotrophic EasternMediterranean deep-sea, with the specific aim tounderstand how bacterial communities of fragmen-ted, highly reduced sediment habitats vary withspatial scales. Bacterial communities of nine loca-tions distributed over three seep regions werestudied using a combined approach, includingbacterial community fingerprinting and 454 mas-sively parallel tag sequencing (MPTS), porewatergeochemistry, quantification of element fluxes andmicrobial consumption rates. This allowed for acomparison of microbial diversity at geographicalscales ranging from tens of centimeters to hundredsof kilometers. The main aims were to better under-stand (i) how bacterial communities of reducedmethane-seeping habitats compare with those inha-biting surrounding oxidized deep-sea sediments,(ii) which biogeochemical factors shape the bacterialdiversity of cold seeps and (iii) if and how bacterialcommunities of cold seep ecosystems vary withspatial scales.
Material and methods
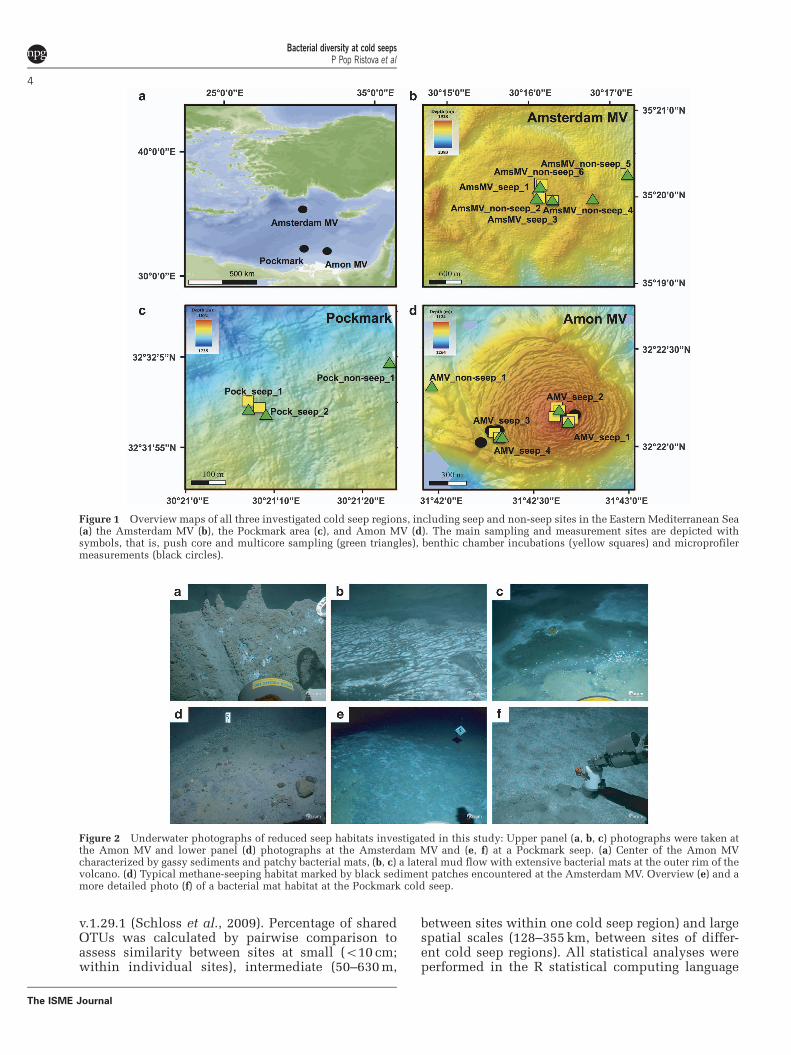
Description of sampling sites and of analyticalproceduresDuring two consecutive expeditions MSM13/3 and4 in 2009, on board the RV Maria S Merian, similartypes of reduced sediments were sampled fromthree cold seep regions in the Eastern Mediterraneandeep-sea, that is, the Amon Mud Volcano (AMV),the Central Pockmark (Pock) area of the Nile Deep-sea Fan and the Amsterdam Mud Volcano (AmsMV),at depths of 1120–2030 m, located at 128–355 kmdistance from each other (Table 1, SupplementaryTable S1 and Figure 1). In each of the three regions,2–4 sites were sampled upon visual identification astypical patches of greyish to blackish color, some ofwhich were covered by thin, white thiotrophicbacterial mats (Figure 2b). Geochemically, all seep
sites were characterized by methane-seepage and highsulfide concentrations (Table 2). Of these, the AMV_seep_2 samples were obtained from a recentlygas-vented seafloor area in the active center of theAmon MV, with not yet fully established activemethane-oxidizing community (Felden et al., 2013).Additional non-seep sediment samples were obtainedfrom the immediate vicinity of the cold seep sites(Table 1) and also from distant sites outside of theseepage regions sampled during previous missions(Table 3, also see Supplementary Information).
Total oxygen fluxes and methane effluxes weredetermined in situ with a remotely operated vehicle(ROV QUEST, Marum, Bremen, Germany) benthicchamber module, in which changes in soluteconcentrations were monitored with an oxygenoptode (Aanderaa, Bergen, Norway) and a prepro-grammed syringe system sampling bottom waters formethane concentrations (Felden et al., 2013and references therein). A deep-sea modular micro-profiler was used to carry out high-resolution(200 mm) microsensor measurements of oxygenconcentrations and to calculate diffusive oxygenuptakes, as described elsewhere (Glud et al., 2009).Total numbers of single cells (1-cm resolution, about20-cm sediment depth) were determined byapplying the acridine orange direct count methodaccording to Boetius and Lochte (1996). Porewaterwas extracted at a resolution of 1 cm using theRhizon moisture samplers (Seeberg-Elverfeldt et al.,2005; pore size 0.1 mm), and subsamples wereimmediately fixed for different types of analyses,that is, NH4
þ , total H2S, SO42� , PO4
3� , dissolvedinorganic carbon (DIC) and alkalinity, in the homelaboratory. Sulfate reduction (SR) rates were deter-mined ex situ by the whole-core injection methodwith a 35SO4 radiotracer (Kallmeyer et al., 2004;Felden et al., 2010). Detailed description ofall analytical procedures can be found in theSupplementary Information. All biogeochemicaldata are available open access via the PANGAEAdatabase (Pop Ristova et al., 2014; http://doi.pangaea.de/10.1594/PANGAEA.830241).
Bacterial community structure at seep andnearby non-seep sites was assessed with automatedribosomal intergenic spacer analysis (ARISA; 1-cmlayers, 5-cm sediment depth). In short, DNA wasamplified in triplicates with the ITSR and HEX-labeled ITSF primers (Cardinale et al., 2004),targeting the internal transcribed spacer region asdescribed elsewhere (Pop Ristova et al., 2012, alsosee Supplementary Information). In addition,bacterial communities of seep sites were analyzedby 454 MPTS of the V4–V6 region of the 16 SrRNA gene (10-cm sediment depth) from thesame DNA extracts, using the 518 F and 1064R primers, and following the protocols publishedon http://vamps.mbl.edu. Data were processedwith mothur (v.1.29) following the standard operatingprocedure (Schloss et al., 2009; also seeSupplementary Information for detailed information).
Bacterial diversity at cold seepsP Pop Ristova et al
2
The ISME Journal
SFF files of all sequence data have been submittedto the GenBank Sequence Read Archives (http://www.ncbi.nlm.nih.gov) under BioProject ID:PRJNA244496. For the comparison of the communitycomposition of seep regions (V4–V6-based sequences)to non-seep regions (V6-based sequences), only the V6hypervariable region was compared, and data setswere processed together using the mothur (seeSupplementary Information for detailed information).Comparability between the derived V6-excised andthe original data set was high and significant at thelevel of beta-diversity (change in community structurebetween sites), Shannon diversity index and thetaxonomical level of class (Supplementary Table S2and Supplementary Figures S1–S3).
Statistical analyses. ARISA peaks were binned(2-bp bin size; Interactive Binner function,http://www.ecology-research.com; Ramette, 2009),
and ARISA PCR triplicates were merged into aconsensus profile by keeping only operationaltaxonomic units (OTU) that appeared in at leasttwo of the PCR replicates and by averaging thecorresponding relative peak intensities. 454 MPTSsequences were clustered at 97% sequence’s simi-larity level (OTU0.03). Singletons were counted asOTU0.03 represented by only one sequence in thewhole data set. Shannon diversity index was used tocompare the diversity of seep and non-seep regions,as this index was shown to be reliable and stableacross studies and data sets based on differentprimer sets (He et al., 2013). Additionally, variationsin the diversity of seep sites were compared bycalculating the Chao1 and ACE richness estimates(same primer set). For both analyses, samplediversity was calculated on normalized 454 MPTSsubset based on the sample with the least number ofsequences (Pock_seep_2, 7925), using mothur
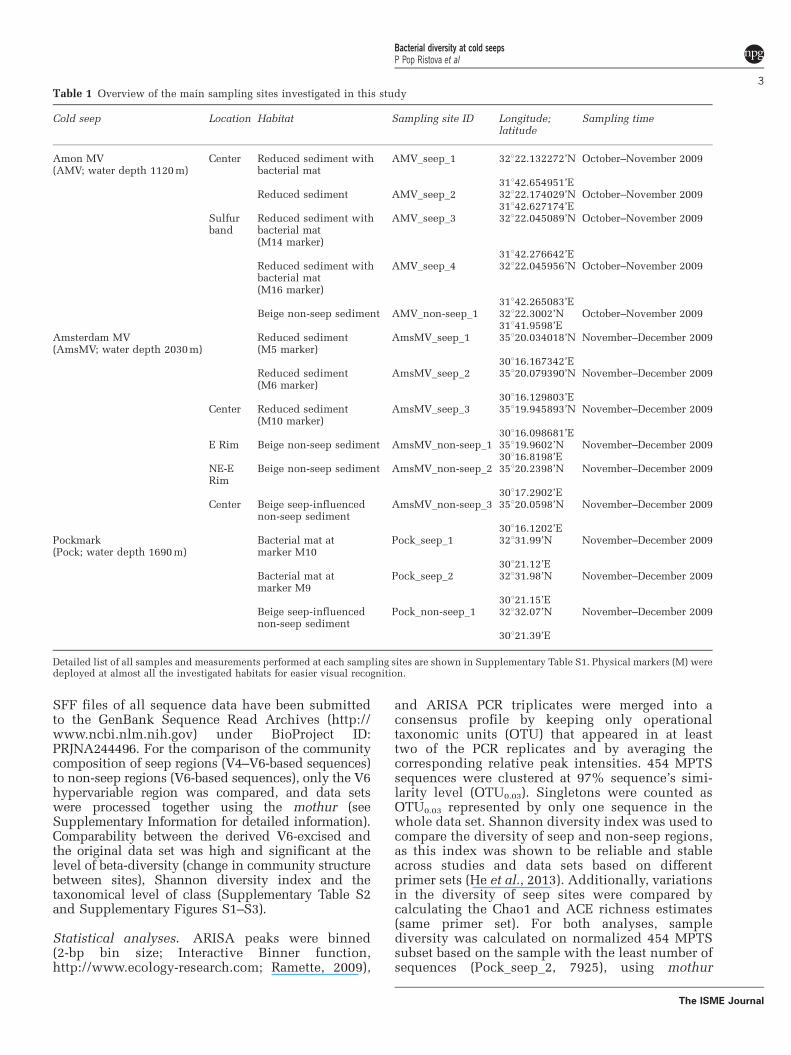
Table 1 Overview of the main sampling sites investigated in this study
Cold seep Location Habitat Sampling site ID Longitude;latitude
Sampling time
Amon MV(AMV; water depth 1120 m)
Center Reduced sediment withbacterial mat
AMV_seep_1 32122.132272’N October–November 2009
31142.654951’EReduced sediment AMV_seep_2 32122.174029’N October–November 2009
31142.627174’ESulfurband
Reduced sediment withbacterial mat(M14 marker)
AMV_seep_3 32122.045089’N October–November 2009
31142.276642’EReduced sediment withbacterial mat(M16 marker)
AMV_seep_4 32122.045956’N October–November 2009
31142.265083’EBeige non-seep sediment AMV_non-seep_1 32122.3002’N October–November 2009
31141.9598’EAmsterdam MV(AmsMV; water depth 2030 m)
Reduced sediment(M5 marker)
AmsMV_seep_1 35120.034018’N November–December 2009
30116.167342’EReduced sediment(M6 marker)
AmsMV_seep_2 35120.079390’N November–December 2009
30116.129803’ECenter Reduced sediment
(M10 marker)AmsMV_seep_3 35119.945893’N November–December 2009
30116.098681’EE Rim Beige non-seep sediment AmsMV_non-seep_1 35119.9602’N November–December 2009
30116.8198’ENE-ERim
Beige non-seep sediment AmsMV_non-seep_2 35120.2398’N November–December 2009
30117.2902’ECenter Beige seep-influenced
non-seep sedimentAmsMV_non-seep_3 35120.0598’N November–December 2009
30116.1202’EPockmark(Pock; water depth 1690 m)
Bacterial mat atmarker M10
Pock_seep_1 32131.99’N November–December 2009
30121.12’EBacterial mat atmarker M9
Pock_seep_2 32131.98’N November–December 2009
30121.15’EBeige seep-influencednon-seep sediment
Pock_non-seep_1 32132.07’N November–December 2009
30121.39’E
Detailed list of all samples and measurements performed at each sampling sites are shown in Supplementary Table S1. Physical markers (M) weredeployed at almost all the investigated habitats for easier visual recognition.
Bacterial diversity at cold seepsP Pop Ristova et al
3
The ISME Journal
v.1.29.1 (Schloss et al., 2009). Percentage of sharedOTUs was calculated by pairwise comparison toassess similarity between sites at small (o10 cm;within individual sites), intermediate (50–630 m,
between sites within one cold seep region) and largespatial scales (128–355 km, between sites of differ-ent cold seep regions). All statistical analyses wereperformed in the R statistical computing language
Figure 1 Overview maps of all three investigated cold seep regions, including seep and non-seep sites in the Eastern Mediterranean Sea(a) the Amsterdam MV (b), the Pockmark area (c), and Amon MV (d). The main sampling and measurement sites are depicted withsymbols, that is, push core and multicore sampling (green triangles), benthic chamber incubations (yellow squares) and microprofilermeasurements (black circles).
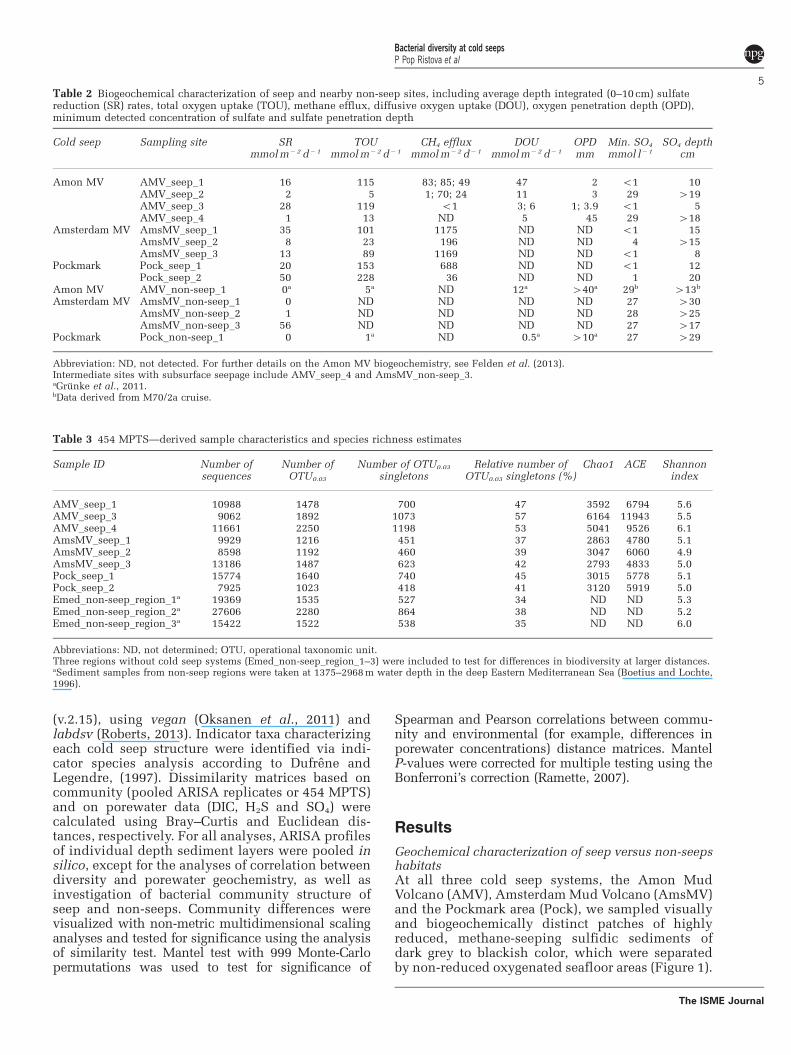
Figure 2 Underwater photographs of reduced seep habitats investigated in this study: Upper panel (a, b, c) photographs were taken atthe Amon MV and lower panel (d) photographs at the Amsterdam MV and (e, f) at a Pockmark seep. (a) Center of the Amon MVcharacterized by gassy sediments and patchy bacterial mats, (b, c) a lateral mud flow with extensive bacterial mats at the outer rim of thevolcano. (d) Typical methane-seeping habitat marked by black sediment patches encountered at the Amsterdam MV. Overview (e) and amore detailed photo (f) of a bacterial mat habitat at the Pockmark cold seep.
Bacterial diversity at cold seepsP Pop Ristova et al
4
The ISME Journal
(v.2.15), using vegan (Oksanen et al., 2011) andlabdsv (Roberts, 2013). Indicator taxa characterizingeach cold seep structure were identified via indi-cator species analysis according to Dufrene andLegendre, (1997). Dissimilarity matrices based oncommunity (pooled ARISA replicates or 454 MPTS)and on porewater data (DIC, H2S and SO4) werecalculated using Bray–Curtis and Euclidean dis-tances, respectively. For all analyses, ARISA profilesof individual depth sediment layers were pooled insilico, except for the analyses of correlation betweendiversity and porewater geochemistry, as well asinvestigation of bacterial community structure ofseep and non-seeps. Community differences werevisualized with non-metric multidimensional scalinganalyses and tested for significance using the analysisof similarity test. Mantel test with 999 Monte-Carlopermutations was used to test for significance of
Spearman and Pearson correlations between commu-nity and environmental (for example, differences inporewater concentrations) distance matrices. MantelP-values were corrected for multiple testing using theBonferroni’s correction (Ramette, 2007).
Results
Geochemical characterization of seep versus non-seepshabitatsAt all three cold seep systems, the Amon MudVolcano (AMV), Amsterdam Mud Volcano (AmsMV)and the Pockmark area (Pock), we sampled visuallyand biogeochemically distinct patches of highlyreduced, methane-seeping sulfidic sediments ofdark grey to blackish color, which were separatedby non-reduced oxygenated seafloor areas (Figure 1).
Table 2 Biogeochemical characterization of seep and nearby non-seep sites, including average depth integrated (0–10 cm) sulfatereduction (SR) rates, total oxygen uptake (TOU), methane efflux, diffusive oxygen uptake (DOU), oxygen penetration depth (OPD),minimum detected concentration of sulfate and sulfate penetration depth
Cold seep Sampling site SR TOU CH4 efflux DOU OPD Min. SO4 SO4 depthmmol m�2 d�1 mmol m� 2 d�1 mmol m�2 d�1 mmol m�2 d� 1 mm mmol l�1 cm
Amon MV AMV_seep_1 16 115 83; 85; 49 47 2 o1 10AMV_seep_2 2 5 1; 70; 24 11 3 29 419AMV_seep_3 28 119 o1 3; 6 1; 3.9 o1 5AMV_seep_4 1 13 ND 5 45 29 418
Amsterdam MV AmsMV_seep_1 35 101 1175 ND ND o1 15AmsMV_seep_2 8 23 196 ND ND 4 415AmsMV_seep_3 13 89 1169 ND ND o1 8
Pockmark Pock_seep_1 20 153 688 ND ND o1 12Pock_seep_2 50 228 36 ND ND 1 20
Amon MV AMV_non-seep_1 0a 5a ND 12a 440a 29b 413b
Amsterdam MV AmsMV_non-seep_1 0 ND ND ND ND 27 430AmsMV_non-seep_2 1 ND ND ND ND 28 425AmsMV_non-seep_3 56 ND ND ND ND 27 417
Pockmark Pock_non-seep_1 0 1a ND 0.5a 410a 27 429
Abbreviation: ND, not detected. For further details on the Amon MV biogeochemistry, see Felden et al. (2013).Intermediate sites with subsurface seepage include AMV_seep_4 and AmsMV_non-seep_3.aGrunke et al., 2011.bData derived from M70/2a cruise.
Table 3 454 MPTS—derived sample characteristics and species richness estimates
Sample ID Number ofsequences
Number ofOTU0.03
Number of OTU0.03
singletonsRelative number of
OTU0.03 singletons (%)Chao1 ACE Shannon
index
AMV_seep_1 10988 1478 700 47 3592 6794 5.6AMV_seep_3 9062 1892 1073 57 6164 11943 5.5AMV_seep_4 11661 2250 1198 53 5041 9526 6.1AmsMV_seep_1 9929 1216 451 37 2863 4780 5.1AmsMV_seep_2 8598 1192 460 39 3047 6060 4.9AmsMV_seep_3 13186 1487 623 42 2793 4833 5.0Pock_seep_1 15774 1640 740 45 3015 5778 5.1Pock_seep_2 7925 1023 418 41 3120 5919 5.0Emed_non-seep_region_1a 19369 1535 527 34 ND ND 5.3Emed_non-seep_region_2a 27606 2280 864 38 ND ND 5.2Emed_non-seep_region_3a 15422 1522 538 35 ND ND 6.0
Abbreviations: ND, not determined; OTU, operational taxonomic unit.Three regions without cold seep systems (Emed_non-seep_region_1–3) were included to test for differences in biodiversity at larger distances.aSediment samples from non-seep regions were taken at 1375–2968 m water depth in the deep Eastern Mediterranean Sea (Boetius and Lochte,1996).
Bacterial diversity at cold seepsP Pop Ristova et al
5
The ISME Journal
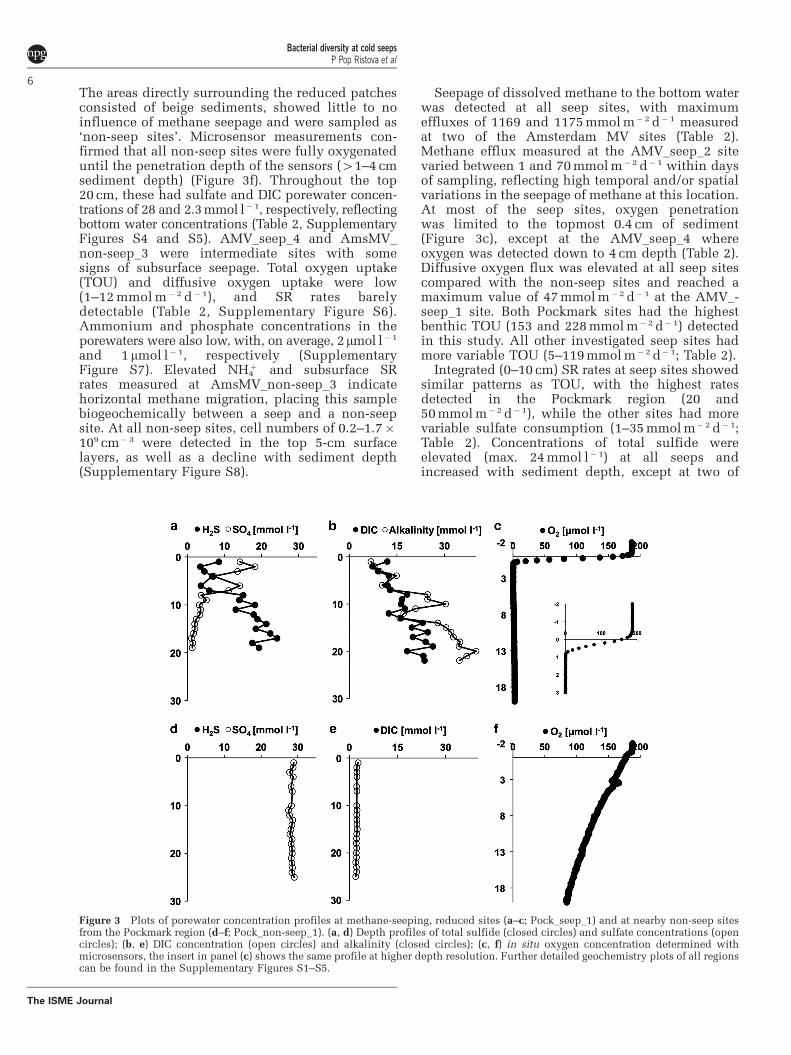
The areas directly surrounding the reduced patchesconsisted of beige sediments, showed little to noinfluence of methane seepage and were sampled as‘non-seep sites’. Microsensor measurements con-firmed that all non-seep sites were fully oxygenateduntil the penetration depth of the sensors (41–4 cmsediment depth) (Figure 3f). Throughout the top20 cm, these had sulfate and DIC porewater concen-trations of 28 and 2.3 mmol l� 1, respectively, reflectingbottom water concentrations (Table 2, SupplementaryFigures S4 and S5). AMV_seep_4 and AmsMV_non-seep_3 were intermediate sites with somesigns of subsurface seepage. Total oxygen uptake(TOU) and diffusive oxygen uptake were low(1–12 mmol m� 2 d�1), and SR rates barelydetectable (Table 2, Supplementary Figure S6).Ammonium and phosphate concentrations in theporewaters were also low, with, on average, 2mmol l�1
and 1 mmol l� 1, respectively (SupplementaryFigure S7). Elevated NH4
þ and subsurface SRrates measured at AmsMV_non-seep_3 indicatehorizontal methane migration, placing this samplebiogeochemically between a seep and a non-seepsite. At all non-seep sites, cell numbers of 0.2–1.7�109 cm� 3 were detected in the top 5-cm surfacelayers, as well as a decline with sediment depth(Supplementary Figure S8).
Seepage of dissolved methane to the bottom waterwas detected at all seep sites, with maximumeffluxes of 1169 and 1175 mmol m�2 d� 1 measuredat two of the Amsterdam MV sites (Table 2).Methane efflux measured at the AMV_seep_2 sitevaried between 1 and 70 mmol m�2 d� 1 within daysof sampling, reflecting high temporal and/or spatialvariations in the seepage of methane at this location.At most of the seep sites, oxygen penetrationwas limited to the topmost 0.4 cm of sediment(Figure 3c), except at the AMV_seep_4 whereoxygen was detected down to 4 cm depth (Table 2).Diffusive oxygen flux was elevated at all seep sitescompared with the non-seep sites and reached amaximum value of 47 mmol m�2 d� 1 at the AMV_-seep_1 site. Both Pockmark sites had the highestbenthic TOU (153 and 228 mmol m�2 d�1) detectedin this study. All other investigated seep sites hadmore variable TOU (5–119 mmol m� 2 d�1; Table 2).
Integrated (0–10 cm) SR rates at seep sites showedsimilar patterns as TOU, with the highest ratesdetected in the Pockmark region (20 and50 mmol m�2 d�1), while the other sites had morevariable sulfate consumption (1–35 mmol m� 2 d� 1;Table 2). Concentrations of total sulfide wereelevated (max. 24 mmol l� 1) at all seeps andincreased with sediment depth, except at two of
Figure 3 Plots of porewater concentration profiles at methane-seeping, reduced sites (a–c; Pock_seep_1) and at nearby non-seep sitesfrom the Pockmark region (d–f; Pock_non-seep_1). (a, d) Depth profiles of total sulfide (closed circles) and sulfate concentrations (opencircles); (b, e) DIC concentration (open circles) and alkalinity (closed circles); (c, f) in situ oxygen concentration determined withmicrosensors, the insert in panel (c) shows the same profile at higher depth resolution. Further detailed geochemistry plots of all regionscan be found in the Supplementary Figures S1–S5.
Bacterial diversity at cold seepsP Pop Ristova et al
6
The ISME Journal
the Amon MV sites (AMV_seep_2 and AMV_seep_4)where no free sulfide was detected throughout thecomplete investigated sediment depth (Figure 3a,Supplementary Figure S4). At all other seep sites,sulfate concentration profiles steeply decreasedwith depth, and sulfate was often completelyconsumed (Table 2). Alkalinity and DIC concentra-tions were substantially elevated (max. 33–37 mmol l�1) and increased with depth, except atthe AMV_seep_2 and AMV_seep_4 where back-ground values (2.4 mmol l�1) were measuredthrough the complete core depth (Figure 3b,Supplementary Figure S5). Ammonium concentra-tions varied substantially between different sitesand mainly increased with sediment depth, to reacha maximum value of 4.4 mmol l�1 at the AMV_seep_3 (Supplementary Figure S7). Phosphate con-centrations (average 3mmol l�1) were similar at allseeps, exceeding those of non-seep sites. All of theseeps, except AMV_seep_2, had higher bacterial cellnumbers compared with the non-seep sites, withmaximum values of 0.3–6.7� 109 cm�3 in thetopmost 5-cm sediment depth. Differences inthe cell numbers between non-seeps and seeps(excluding the newly formed AMV_seep_2 site)were statistically significant (Mann–WhitneyW¼ 30, P¼ 0.01). Cell numbers at all seeps declinedwith sediment depth to reach 0.1� 109 cm� 3 at15 cm (Supplementary Figure S8).
Comparison of bacterial communities between seepand non-seep regionsThe Shannon diversity index did not differ betweenseep regions (5.3±0.4 s.d., n¼ 8) and non-seepregions of the Eastern Mediterranean Sea (5.5±0.5s.d., n¼ 3; Mann–Whitney W¼ 7, P-value¼ 0.4;Table 3). Within the seep regions, observed ARISAOTU numbers were also not different betweenmethane-seeping sites (241±31 s.d., n¼ 9) andnon-seeping sites (212±55, n¼ 5; Mann–WhitneyW¼ 28, P¼ 0.5).
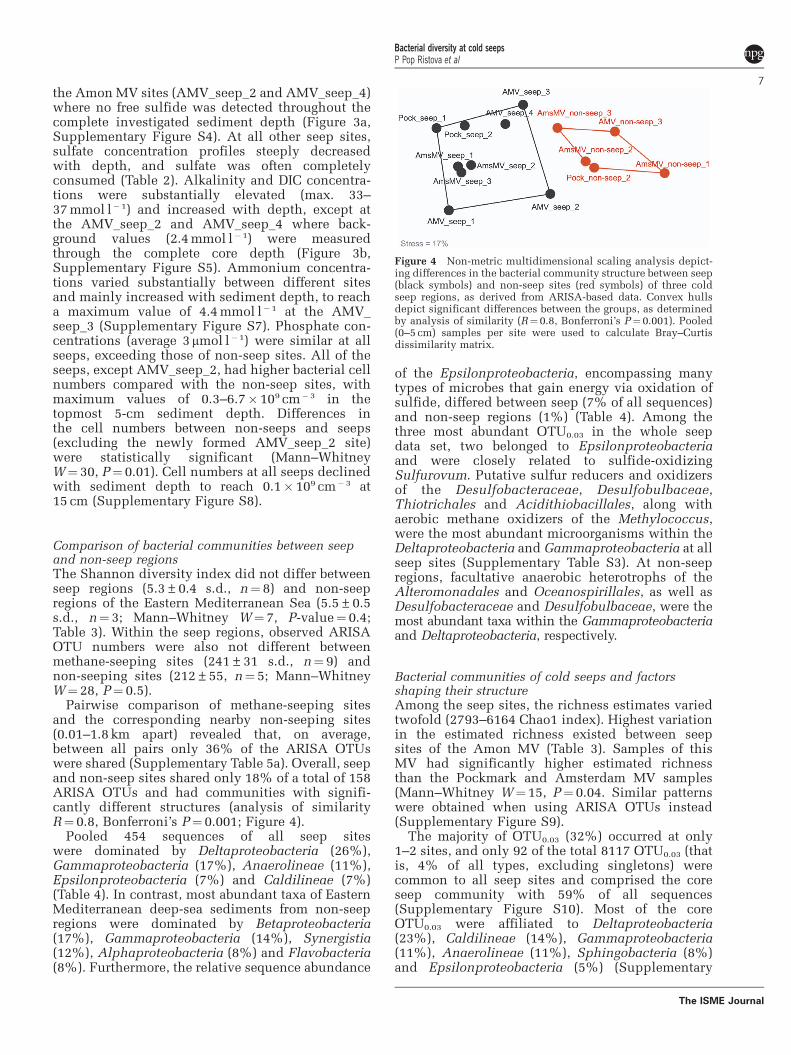
Pairwise comparison of methane-seeping sitesand the corresponding nearby non-seeping sites(0.01–1.8 km apart) revealed that, on average,between all pairs only 36% of the ARISA OTUswere shared (Supplementary Table 5a). Overall, seepand non-seep sites shared only 18% of a total of 158ARISA OTUs and had communities with signifi-cantly different structures (analysis of similarityR¼ 0.8, Bonferroni’s P¼ 0.001; Figure 4).
Pooled 454 sequences of all seep siteswere dominated by Deltaproteobacteria (26%),Gammaproteobacteria (17%), Anaerolineae (11%),Epsilonproteobacteria (7%) and Caldilineae (7%)(Table 4). In contrast, most abundant taxa of EasternMediterranean deep-sea sediments from non-seepregions were dominated by Betaproteobacteria(17%), Gammaproteobacteria (14%), Synergistia(12%), Alphaproteobacteria (8%) and Flavobacteria(8%). Furthermore, the relative sequence abundance
of the Epsilonproteobacteria, encompassing manytypes of microbes that gain energy via oxidation ofsulfide, differed between seep (7% of all sequences)and non-seep regions (1%) (Table 4). Among thethree most abundant OTU0.03 in the whole seepdata set, two belonged to Epsilonproteobacteriaand were closely related to sulfide-oxidizingSulfurovum. Putative sulfur reducers and oxidizersof the Desulfobacteraceae, Desulfobulbaceae,Thiotrichales and Acidithiobacillales, along withaerobic methane oxidizers of the Methylococcus,were the most abundant microorganisms within theDeltaproteobacteria and Gammaproteobacteria at allseep sites (Supplementary Table S3). At non-seepregions, facultative anaerobic heterotrophs of theAlteromonadales and Oceanospirillales, as well asDesulfobacteraceae and Desulfobulbaceae, were themost abundant taxa within the Gammaproteobacteriaand Deltaproteobacteria, respectively.
Bacterial communities of cold seeps and factorsshaping their structureAmong the seep sites, the richness estimates variedtwofold (2793–6164 Chao1 index). Highest variationin the estimated richness existed between seepsites of the Amon MV (Table 3). Samples of thisMV had significantly higher estimated richnessthan the Pockmark and Amsterdam MV samples(Mann–Whitney W¼ 15, P¼ 0.04. Similar patternswere obtained when using ARISA OTUs instead(Supplementary Figure S9).
The majority of OTU0.03 (32%) occurred at only1–2 sites, and only 92 of the total 8117 OTU0.03 (thatis, 4% of all types, excluding singletons) werecommon to all seep sites and comprised the coreseep community with 59% of all sequences(Supplementary Figure S10). Most of the coreOTU0.03 were affiliated to Deltaproteobacteria(23%), Caldilineae (14%), Gammaproteobacteria(11%), Anaerolineae (11%), Sphingobacteria (8%)and Epsilonproteobacteria (5%) (Supplementary
Figure 4 Non-metric multidimensional scaling analysis depict-ing differences in the bacterial community structure between seep(black symbols) and non-seep sites (red symbols) of three coldseep regions, as derived from ARISA-based data. Convex hullsdepict significant differences between the groups, as determinedby analysis of similarity (R¼0.8, Bonferroni’s P¼0.001). Pooled(0–5 cm) samples per site were used to calculate Bray–Curtisdissimilarity matrix.
Bacterial diversity at cold seepsP Pop Ristova et al
7
The ISME Journal
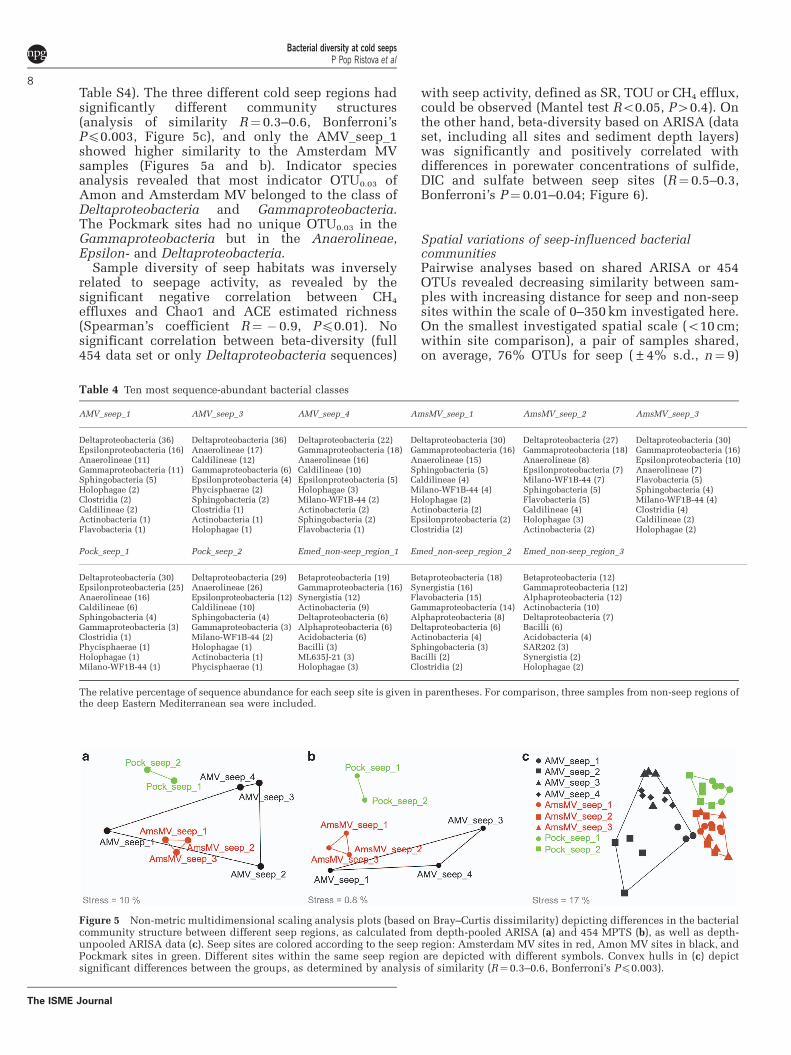
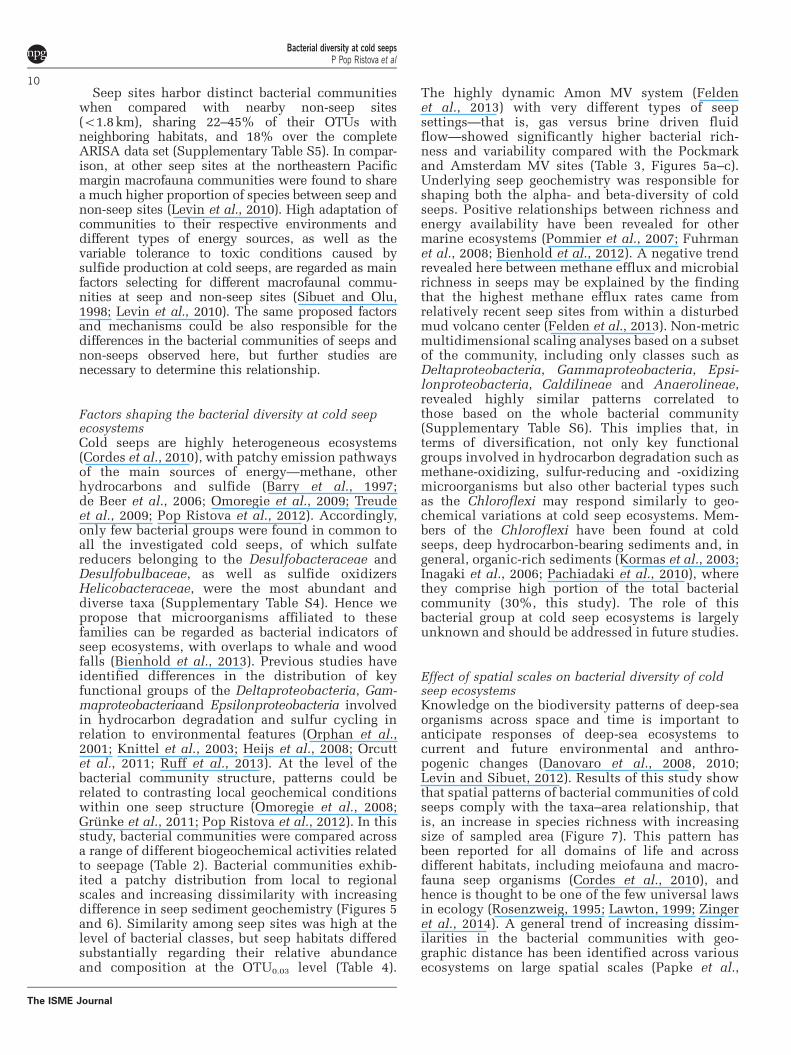
Table S4). The three different cold seep regions hadsignificantly different community structures(analysis of similarity R¼ 0.3–0.6, Bonferroni’sPp0.003, Figure 5c), and only the AMV_seep_1showed higher similarity to the Amsterdam MVsamples (Figures 5a and b). Indicator speciesanalysis revealed that most indicator OTU0.03 ofAmon and Amsterdam MV belonged to the class ofDeltaproteobacteria and Gammaproteobacteria.The Pockmark sites had no unique OTU0.03 in theGammaproteobacteria but in the Anaerolineae,Epsilon- and Deltaproteobacteria.
Sample diversity of seep habitats was inverselyrelated to seepage activity, as revealed by thesignificant negative correlation between CH4
effluxes and Chao1 and ACE estimated richness(Spearman’s coefficient R¼ � 0.9, Pp0.01). Nosignificant correlation between beta-diversity (full454 data set or only Deltaproteobacteria sequences)
with seep activity, defined as SR, TOU or CH4 efflux,could be observed (Mantel test Ro0.05, P40.4). Onthe other hand, beta-diversity based on ARISA (dataset, including all sites and sediment depth layers)was significantly and positively correlated withdifferences in porewater concentrations of sulfide,DIC and sulfate between seep sites (R¼ 0.5–0.3,Bonferroni’s P¼ 0.01–0.04; Figure 6).
Spatial variations of seep-influenced bacterialcommunitiesPairwise analyses based on shared ARISA or 454OTUs revealed decreasing similarity between sam-ples with increasing distance for seep and non-seepsites within the scale of 0–350 km investigated here.On the smallest investigated spatial scale (o10 cm;within site comparison), a pair of samples shared,on average, 76% OTUs for seep (±4% s.d., n¼ 9)
Table 4 Ten most sequence-abundant bacterial classes
AMV_seep_1 AMV_seep_3 AMV_seep_4 AmsMV_seep_1 AmsMV_seep_2 AmsMV_seep_3
Deltaproteobacteria (36) Deltaproteobacteria (36) Deltaproteobacteria (22) Deltaproteobacteria (30) Deltaproteobacteria (27) Deltaproteobacteria (30)Epsilonproteobacteria (16) Anaerolineae (17) Gammaproteobacteria (18) Gammaproteobacteria (16) Gammaproteobacteria (18) Gammaproteobacteria (16)Anaerolineae (11) Caldilineae (12) Anaerolineae (16) Anaerolineae (15) Anaerolineae (8) Epsilonproteobacteria (10)Gammaproteobacteria (11) Gammaproteobacteria (6) Caldilineae (10) Sphingobacteria (5) Epsilonproteobacteria (7) Anaerolineae (7)Sphingobacteria (5) Epsilonproteobacteria (4) Epsilonproteobacteria (5) Caldilineae (4) Milano-WF1B-44 (7) Flavobacteria (5)Holophagae (2) Phycisphaerae (2) Holophagae (3) Milano-WF1B-44 (4) Sphingobacteria (5) Sphingobacteria (4)Clostridia (2) Sphingobacteria (2) Milano-WF1B-44 (2) Holophagae (2) Flavobacteria (5) Milano-WF1B-44 (4)Caldilineae (2) Clostridia (1) Actinobacteria (2) Actinobacteria (2) Caldilineae (4) Clostridia (4)Actinobacteria (1) Actinobacteria (1) Sphingobacteria (2) Epsilonproteobacteria (2) Holophagae (3) Caldilineae (2)Flavobacteria (1) Holophagae (1) Flavobacteria (1) Clostridia (2) Actinobacteria (2) Holophagae (2)
Pock_seep_1 Pock_seep_2 Emed_non-seep_region_1 Emed_non-seep_region_2 Emed_non-seep_region_3
Deltaproteobacteria (30) Deltaproteobacteria (29) Betaproteobacteria (19) Betaproteobacteria (18) Betaproteobacteria (12)Epsilonproteobacteria (25) Anaerolineae (26) Gammaproteobacteria (16) Synergistia (16) Gammaproteobacteria (12)Anaerolineae (16) Epsilonproteobacteria (12) Synergistia (12) Flavobacteria (15) Alphaproteobacteria (12)Caldilineae (6) Caldilineae (10) Actinobacteria (9) Gammaproteobacteria (14) Actinobacteria (10)Sphingobacteria (4) Sphingobacteria (4) Deltaproteobacteria (6) Alphaproteobacteria (8) Deltaproteobacteria (7)Gammaproteobacteria (3) Gammaproteobacteria (3) Alphaproteobacteria (6) Deltaproteobacteria (6) Bacilli (6)Clostridia (1) Milano-WF1B-44 (2) Acidobacteria (6) Actinobacteria (4) Acidobacteria (4)Phycisphaerae (1) Holophagae (1) Bacilli (3) Sphingobacteria (3) SAR202 (3)Holophagae (1) Actinobacteria (1) ML635J-21 (3) Bacilli (2) Synergistia (2)Milano-WF1B-44 (1) Phycisphaerae (1) Holophagae (3) Clostridia (2) Holophagae (2)
The relative percentage of sequence abundance for each seep site is given in parentheses. For comparison, three samples from non-seep regions ofthe deep Eastern Mediterranean sea were included.
Figure 5 Non-metric multidimensional scaling analysis plots (based on Bray–Curtis dissimilarity) depicting differences in the bacterialcommunity structure between different seep regions, as calculated from depth-pooled ARISA (a) and 454 MPTS (b), as well as depth-unpooled ARISA data (c). Seep sites are colored according to the seep region: Amsterdam MV sites in red, Amon MV sites in black, andPockmark sites in green. Different sites within the same seep region are depicted with different symbols. Convex hulls in (c) depictsignificant differences between the groups, as determined by analysis of similarity (R¼0.3–0.6, Bonferroni’s Pp0.003).
Bacterial diversity at cold seepsP Pop Ristova et al
8
The ISME Journal
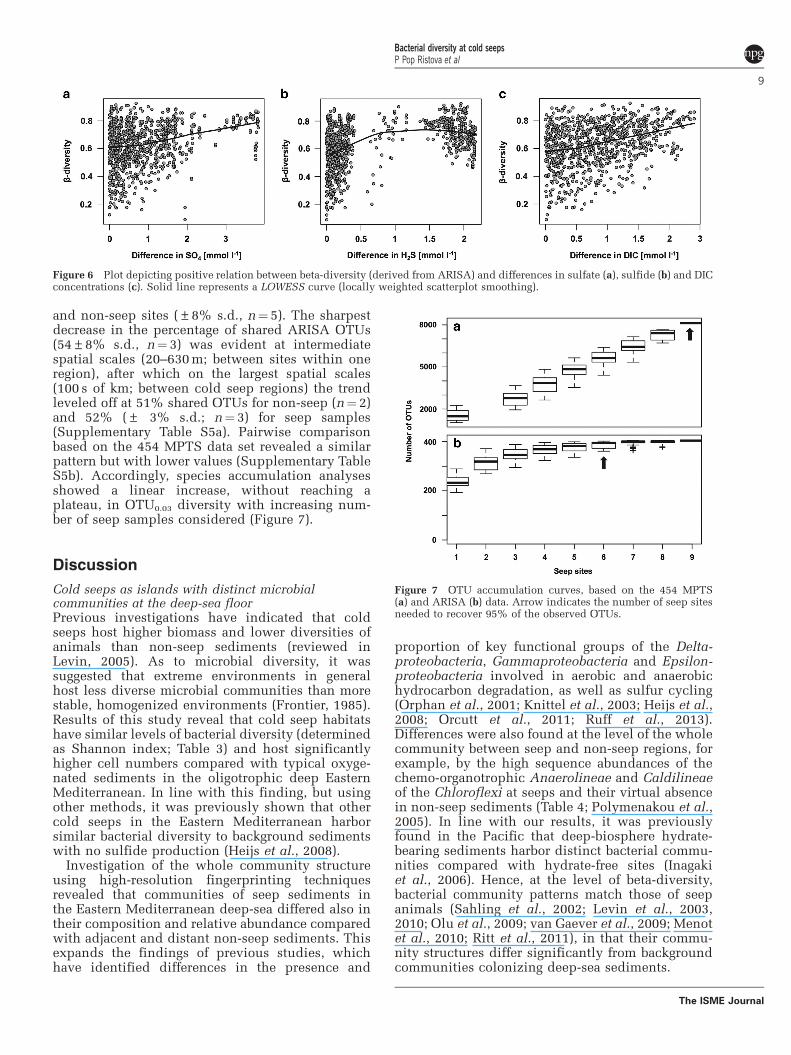
and non-seep sites (±8% s.d., n¼ 5). The sharpestdecrease in the percentage of shared ARISA OTUs(54±8% s.d., n¼ 3) was evident at intermediatespatial scales (20–630 m; between sites within oneregion), after which on the largest spatial scales(100 s of km; between cold seep regions) the trendleveled off at 51% shared OTUs for non-seep (n¼ 2)and 52% (± 3% s.d.; n¼ 3) for seep samples(Supplementary Table S5a). Pairwise comparisonbased on the 454 MPTS data set revealed a similarpattern but with lower values (Supplementary TableS5b). Accordingly, species accumulation analysesshowed a linear increase, without reaching aplateau, in OTU0.03 diversity with increasing num-ber of seep samples considered (Figure 7).
Discussion
Cold seeps as islands with distinct microbialcommunities at the deep-sea floorPrevious investigations have indicated that coldseeps host higher biomass and lower diversities ofanimals than non-seep sediments (reviewed inLevin, 2005). As to microbial diversity, it wassuggested that extreme environments in generalhost less diverse microbial communities than morestable, homogenized environments (Frontier, 1985).Results of this study reveal that cold seep habitatshave similar levels of bacterial diversity (determinedas Shannon index; Table 3) and host significantlyhigher cell numbers compared with typical oxyge-nated sediments in the oligotrophic deep EasternMediterranean. In line with this finding, but usingother methods, it was previously shown that othercold seeps in the Eastern Mediterranean harborsimilar bacterial diversity to background sedimentswith no sulfide production (Heijs et al., 2008).
Investigation of the whole community structureusing high-resolution fingerprinting techniquesrevealed that communities of seep sediments inthe Eastern Mediterranean deep-sea differed also intheir composition and relative abundance comparedwith adjacent and distant non-seep sediments. Thisexpands the findings of previous studies, whichhave identified differences in the presence and
proportion of key functional groups of the Delta-proteobacteria, Gammaproteobacteria and Epsilon-proteobacteria involved in aerobic and anaerobichydrocarbon degradation, as well as sulfur cycling(Orphan et al., 2001; Knittel et al., 2003; Heijs et al.,2008; Orcutt et al., 2011; Ruff et al., 2013).Differences were also found at the level of the wholecommunity between seep and non-seep regions, forexample, by the high sequence abundances of thechemo-organotrophic Anaerolineae and Caldilineaeof the Chloroflexi at seeps and their virtual absencein non-seep sediments (Table 4; Polymenakou et al.,2005). In line with our results, it was previouslyfound in the Pacific that deep-biosphere hydrate-bearing sediments harbor distinct bacterial commu-nities compared with hydrate-free sites (Inagakiet al., 2006). Hence, at the level of beta-diversity,bacterial community patterns match those of seepanimals (Sahling et al., 2002; Levin et al., 2003,2010; Olu et al., 2009; van Gaever et al., 2009; Menotet al., 2010; Ritt et al., 2011), in that their commu-nity structures differ significantly from backgroundcommunities colonizing deep-sea sediments.
Figure 6 Plot depicting positive relation between beta-diversity (derived from ARISA) and differences in sulfate (a), sulfide (b) and DICconcentrations (c). Solid line represents a LOWESS curve (locally weighted scatterplot smoothing).
Figure 7 OTU accumulation curves, based on the 454 MPTS(a) and ARISA (b) data. Arrow indicates the number of seep sitesneeded to recover 95% of the observed OTUs.
Bacterial diversity at cold seepsP Pop Ristova et al
9
The ISME Journal
Seep sites harbor distinct bacterial communitieswhen compared with nearby non-seep sites(o1.8 km), sharing 22–45% of their OTUs withneighboring habitats, and 18% over the completeARISA data set (Supplementary Table S5). In compar-ison, at other seep sites at the northeastern Pacificmargin macrofauna communities were found to sharea much higher proportion of species between seep andnon-seep sites (Levin et al., 2010). High adaptation ofcommunities to their respective environments anddifferent types of energy sources, as well as thevariable tolerance to toxic conditions caused bysulfide production at cold seeps, are regarded as mainfactors selecting for different macrofaunal commu-nities at seep and non-seep sites (Sibuet and Olu,1998; Levin et al., 2010). The same proposed factorsand mechanisms could be also responsible for thedifferences in the bacterial communities of seeps andnon-seeps observed here, but further studies arenecessary to determine this relationship.
Factors shaping the bacterial diversity at cold seepecosystemsCold seeps are highly heterogeneous ecosystems(Cordes et al., 2010), with patchy emission pathwaysof the main sources of energy—methane, otherhydrocarbons and sulfide (Barry et al., 1997;de Beer et al., 2006; Omoregie et al., 2009; Treudeet al., 2009; Pop Ristova et al., 2012). Accordingly,only few bacterial groups were found in common toall the investigated cold seeps, of which sulfatereducers belonging to the Desulfobacteraceae andDesulfobulbaceae, as well as sulfide oxidizersHelicobacteraceae, were the most abundant anddiverse taxa (Supplementary Table S4). Hence wepropose that microorganisms affiliated to thesefamilies can be regarded as bacterial indicators ofseep ecosystems, with overlaps to whale and woodfalls (Bienhold et al., 2013). Previous studies haveidentified differences in the distribution of keyfunctional groups of the Deltaproteobacteria, Gam-maproteobacteriaand Epsilonproteobacteria involvedin hydrocarbon degradation and sulfur cycling inrelation to environmental features (Orphan et al.,2001; Knittel et al., 2003; Heijs et al., 2008; Orcuttet al., 2011; Ruff et al., 2013). At the level of thebacterial community structure, patterns could berelated to contrasting local geochemical conditionswithin one seep structure (Omoregie et al., 2008;Grunke et al., 2011; Pop Ristova et al., 2012). In thisstudy, bacterial communities were compared acrossa range of different biogeochemical activities relatedto seepage (Table 2). Bacterial communities exhib-ited a patchy distribution from local to regionalscales and increasing dissimilarity with increasingdifference in seep sediment geochemistry (Figures 5and 6). Similarity among seep sites was high at thelevel of bacterial classes, but seep habitats differedsubstantially regarding their relative abundanceand composition at the OTU0.03 level (Table 4).
The highly dynamic Amon MV system (Feldenet al., 2013) with very different types of seepsettings—that is, gas versus brine driven fluidflow—showed significantly higher bacterial rich-ness and variability compared with the Pockmarkand Amsterdam MV sites (Table 3, Figures 5a–c).Underlying seep geochemistry was responsible forshaping both the alpha- and beta-diversity of coldseeps. Positive relationships between richness andenergy availability have been revealed for othermarine ecosystems (Pommier et al., 2007; Fuhrmanet al., 2008; Bienhold et al., 2012). A negative trendrevealed here between methane efflux and microbialrichness in seeps may be explained by the findingthat the highest methane efflux rates came fromrelatively recent seep sites from within a disturbedmud volcano center (Felden et al., 2013). Non-metricmultidimensional scaling analyses based on a subsetof the community, including only classes such asDeltaproteobacteria, Gammaproteobacteria, Epsi-lonproteobacteria, Caldilineae and Anaerolineae,revealed highly similar patterns correlated tothose based on the whole bacterial community(Supplementary Table S6). This implies that, interms of diversification, not only key functionalgroups involved in hydrocarbon degradation such asmethane-oxidizing, sulfur-reducing and -oxidizingmicroorganisms but also other bacterial types suchas the Chloroflexi may respond similarly to geo-chemical variations at cold seep ecosystems. Mem-bers of the Chloroflexi have been found at coldseeps, deep hydrocarbon-bearing sediments and, ingeneral, organic-rich sediments (Kormas et al., 2003;Inagaki et al., 2006; Pachiadaki et al., 2010), wherethey comprise high portion of the total bacterialcommunity (30%, this study). The role of thisbacterial group at cold seep ecosystems is largelyunknown and should be addressed in future studies.
Effect of spatial scales on bacterial diversity of coldseep ecosystemsKnowledge on the biodiversity patterns of deep-seaorganisms across space and time is important toanticipate responses of deep-sea ecosystems tocurrent and future environmental and anthro-pogenic changes (Danovaro et al., 2008, 2010;Levin and Sibuet, 2012). Results of this study showthat spatial patterns of bacterial communities of coldseeps comply with the taxa–area relationship, thatis, an increase in species richness with increasingsize of sampled area (Figure 7). This pattern hasbeen reported for all domains of life and acrossdifferent habitats, including meiofauna and macro-fauna seep organisms (Cordes et al., 2010), andhence is thought to be one of the few universal lawsin ecology (Rosenzweig, 1995; Lawton, 1999; Zingeret al., 2014). A general trend of increasing dissim-ilarities in the bacterial communities with geo-graphic distance has been identified across variousecosystems on large spatial scales (Papke et al.,
Bacterial diversity at cold seepsP Pop Ristova et al
10
The ISME Journal
2003; Whitaker et al., 2003; Martiny et al., 2006;Ramette and Tiedje, 2007; Schauer et al., 2010;Zinger et al., 2014). In our study, the percentage ofshared ARISA bacterial types was the highest withinsites (76%), substantially declined between sites(54%) and remained at the same level betweendifferent cold seep regions (52%) (SupplementaryTable S5). Hence, highest spatial turnover occurredon intermediate spatial scales (o1 km), withinindividual seep regions, among locations spatiallyseparated by few meters to hundreds of meters. Withapproximately one-third of the microbial diversitybeing unique to the individual seep habitats, that is,patches of reduced sediments of only a few metersin diameter, these localities significantly contributeto the biodiversity of deep-sea, explaining why coldseep systems can be regarded as biodiversity hot-spots. The small, reduced habitats may have acritical role for the connectivity and diversity ofmargin communities and might provide resilience toperturbations caused by increased anthropogenicimpact. This is a relevant finding with regard tospatial management of deep-water ecosystems, suchas for deep-sea oil and gas resources; however, thisalso suggests that cold seep communities could bevulnerable to habitat losses at the scale of theindividual seep ecosystem (Ramirez-Llodra et al.,2011; van Dover et al., 2011).
Conflict of Interest
The authors declare no conflict of interest.
Acknowledgements
We thank the crew of RV Maria S Merian and the pilots ofROV Quest (Marum, University Bremen) for their invalu-able help during the MSM13/3 and 4 cruises. ChristinaBienhold, Viola Beier, Gabriele Schuussler, Rafael Stiens,Volker Asendorf, Axel Nordhausen, Journ Patrick Meyer,Wiebke Rentzsch, Erika Weiz, Sebastian Strau�, ChristianQuast and Marianne Jacob are gratefully acknowledged forhelp with onboard and laboratory work and discussionson data analyses. We thank Mitchell Sogin and his team atthe MBL (Woods Hole) for 454 sequencing, GerhardBohrmann for providing microbathymetry data of theAmsterdam MV (expeditions M70/3 and MSM13/4), andStefanie Meyer and Paul Wintersteller for help withprocessing. The research was carried out in the frameworkof the EC FP7 HERMIONE project (no. 226354) and theDFG Research Center/Cluster of Excellence Marum ‘TheOcean in the Earth System’ of the University Bremen. Wealso thank the DFG (MERIAN expeditions) and Leibnizproject to AB and the MPG for providing additional fundsto the study.
References
Anderson MJ, Crist TO, Chase JM, Vellend M, Inouye BD,Freestone AL et al. (2011). Navigating the multiple
meanings of beta-diversity: a roadmap for the practi-cing ecologist. Ecol Lett 14: 19–28.
Barry JP, Kochevar RE, Baxter CH. (1997). The influenceof pore-water chemistry and physiology on thedistribution of vesicomyid clams at cold seeps inMonterey Bay: implications for patterns of chemosyn-thetic community organization. Limnol Oceanogr 42:318–328.
Bienhold C, Boetius A, Ramette A. (2012). The energy-diversity relationship of complex bacterial commu-nities in Arctic deep-sea sediments. ISME J 6: 1–9.
Bienhold C, Pop Ristova P, Wenzhofer F, Dittmar T,Boetius A. (2013). How deep-sea wood falls sustainchemosynthetic life. PLoS One 8: e53590.
Boetius A, Lochte K. (1996). Effect of organic enrichmentson hydrolytic potentials and growth of bacteria indeep-sea sediments. Mar Ecol Prog Ser 140: 239–250.
Boetius A, Wenzhofer F. (2013). Seafloor oxygenconsumption fuelled by methane from cold seeps.Nat Geosci 6: 725–734.
Cardinale M, Brusetti L, Quatrini P, Borin S, Puglia AM,Rizzi A et al. (2004). Comparison of different primersets for use in automated ribosomal intergenic spaceranalysis of complex bacterial communities. ApplEnviron Microbiol 70: 6147–6156.
Cordes EE, Cunha MR, Galeron J, Mora C, Olu-Le Roy K,Sibuet M et al. (2010). The influence of geological,geochemical, and biogenic habitat heterogeneity onseep biodiversity. Mar Ecol 31: 51–65.
Danovaro R, Company JB, Corinaldesi C, D’Onghia G,Galil B, Gambi C et al. (2010). Deep-sea biodiversity inthe Mediterranean Sea: the known, the unknown, andthe unknowable. PLoS One 5: e11832.
Danovaro R, Gambi C, Dell’Anno A, Corinaldesi C,Fraschetti S, Vanreusel A et al. (2008). Exponentialdecline of deep-sea ecosystem functioning linked tobenthic biodiversity loss. Curr Biol 18: 1–8.
de Beer D, Sauter E, Niemann H, Kaul N, Foucher J-P,Witte U et al. (2006). In situ fluxes and zonation ofmicrobial activity in surface sediments of theHakon Mosby Mud Volcano. Limnol Oceanogr 51:1315–1331.
Dufrene M, Legendre P. (1997). Species assemblages andindicator species: the need to a flexible asymmetricalapproach. Ecol Monogr 67: 345–366.
Felden J, Lichtschlag A, Wenzhofer F, de Beer D,Feseker T, Pop Ristova P et al. (2013). Limitations ofmicrobial hydrocarbon degradation at the Amonmud volcano (Nile deep-sea fan). Biogeosciences 10:3269–3283.
Felden J, Wenzhofer F, Feseker T, Boetius A. (2010).Transport and consumption of oxygen and methane indifferent habitats of the Hakon Mosby Mud Volcano(HMMV). Limnol Oceanogr 55: 2366–2380.
Frontier S. (1985). Diversity and structure in aquaticecosystems. Oceanogr Mar Biol 23: 253–312.
Fuhrman JA, Steele JA, Hewson I, Schwalbach MS,Brown MV, Green JL et al. (2008). A latitudinaldiversity gradient in planktonic marine bacteria. ProcNatl Acad Sci USA 105: 7774–7778.
Glud RN, Stahl H, Berg P, Wenzhofer F, Oguri K,Kitazato H. (2009). In situ microscale variation indistribution and consumption of O2: A case studyfrom a deep ocean margin sediment (Sagami Bay,Japan). Limnol Oceanogr 54: 1–12.
Goffredi SK, Orphan VJ. (2010). Bacterial communityshifts in taxa and diversity in response to localized
Bacterial diversity at cold seepsP Pop Ristova et al
11
The ISME Journal
organic loading in the deep sea. Environ Microbiol 12:344–363.
Green J, Bohannan B. (2006). Spatial scaling of microbialbiodiversity. Trends Ecol Evol 21: 501–507.
Grunke S, Felden J, Lichtschlag A, Girnth A, de Beer D,Wenzhofer F et al. (2011). Niche differentiation amongmat-forming, sulfide-oxidizing bacteria at cold seepsof the Nile Deep Sea Fan (Eastern Mediterranean Sea).Geobiology 9: 330–348.
Hanson CA, Fuhrman JA, Horner-Devine MC,Martiny JBH. (2012). Beyond biogeographic patterns:processes shaping the microbial landscape. Nat RevMicrobiol 10: 497–506.
He Y, Zhou BJ, Deng GH, Jiang XT, Zhang H, Zhou HW.(2013). Comparison of microbial diversity determinedwith the same variable tag sequence extracted fromtwo different PCR amplicons. BMC Microbiol 13: 1–8.
Heijs SK, Laverman AM, Forney LJ, Hardoim PR,van Elsas JD. (2008). Comparison of deep-sea sedimentmicrobial communities in the Eastern Mediterranean.FEMS Microbiol Ecol 64: 362–377.
Huber JA, Mark Welch DB, Morrison HG, Huse SM,Neal PR, Butterfield DA et al. (2007). Microbialpopulation structures in the deep marine biosphere.Science 318: 97–100.
Inagaki F, Nunoura T, Nakagawa S, Teske A, Lever M,Lauer A et al. (2006). Biogeographical distribution anddiversity of microbes in methane hydrate-bearing deepmarine sediments on the Pacific Ocean Margin. ProcNatl Acad Sci USA 103: 2815–2820.
Jacob M, Soltwedel T, Boetius A, Ramette A. (2013).Biogeography of Deep-sea benthic bacteria at regionalscale (LTER HAUSGARTEN, Fram Strait, Arctic).PLoS One 8: e72779.
Jørgensen BB, Boetius A. (2007). Feast and famine —microbial life in the deep-sea bed. Nature 5:770–781.
Kallmeyer J, Ferdelman TG, Weber A, Fossing H,Jørgensen BB. (2004). A cold chromium distillationprocedure for radiolabeled sulfide applied to sulfatereduction measurements. Limnol Oceanogr Methods2: 171–180.
Knittel K, Boetius A. (2009). Anaerobic oxidation ofmethane: progress with an unknown process. AnnuRev Microbiol 63: 311–334.
Knittel K, Boetius A, Lemke A, Eilers H, Lochte K,Pfannkuche O et al. (2003). Activity, distribution,and diversity of sulfate reducers and other Bacteria insediments above gas hydrate (Cascadia Margin,Oregon). Geomicrobiol J 20: 269–294.
Kormas KA, Smith DC, Edgcomb V, Teske A. (2003).Molecular analysis of deep subsurface microbialcommunities in Nankai Trough sediments (ODP Leg190, Site 1176). FEMS Microbiol Ecol 45: 115–125.
Lawton JH. (1999). Are there general laws in ecology?Oikos 84: 177–192.
Levin LA. (2005). Ecology of cold seep sediment: interac-tions of fauna with flow, chemistry and microbes.Oceanogr Mar Biol Annu Rev 43: 1–46.
Levin LA, Mendoza GF, Gonzalez JP, Thurber AR,Cordes EE. (2010). Diversity of bathyal macrofaunaon the northeastern Pacific margin: the influence ofmethane seeps and oxygen minimum zones. Mar Ecol31: 94–110.
Levin LA, Sibuet M. (2012). Understanding continentalmargin biodiversity: a new imperative. Ann Rev MarSci 4: 79–112.
Levin LL, Ziebis W, Mendoza GF, Growney VA, Tryon MD,Brown KB et al. (2003). Spatial heterogeneity ofmacrofauna at northern California methane seeps:influence of sulfide concentration and fluid flow.Mar Ecol Prog Ser 265: 123–139.
Martiny JBH, Bohannan BJM, Brown J, Colwell R,Fuhrman J, Green J et al. (2006). Microbialbiogeography: putting microorganisms on the map.Nat Rev Microbiol 4: 102–112.
Martiny JBH, Eisen JA, Penn K, Allison SD,Claire Horner-Devine M. (2011). Drivers of bacterialbeta-diversity depend on spatial scale. Proc Natl AcadSci USA 108: 1–5.
Menot L, Galeron J, Olu K, Caprais J-C, Crassous P,Khripounoff A et al. (2010). Spatial heterogeneity ofmacrofaunal communities in and near a giantpockmark area in the deep Gulf of Guinea. Mar Ecol31: 78–93.
Meyer S, Wegener G, Lloyd K, Teske A, Boetius A,Ramette A. (2013). Microbial habitat connectivityacross spatial scales and hydrothermal temperaturegradients at Guaymas Basin. Front Microbiol 4: 1–11.
Oksanen J, Blanchet FG, Roeland K, Legendre P,Minchin PR, O’Hara RB et al. (2011). vegan: Commu-nity Ecology Package. R package version 2.0-2. http://CRAN.R-project.org/package=vegan.
Olu K, Caprais JC, Galeron J, Causse R, von Cosel R,Budzinski H et al. (2009). Influence of seep emissionon the non-symbiont-bearing fauna and vagrantspecies at an active giant pockmark in the Gulf ofGuinea (Congo–Angola margin). Deep-Sea Res Pt II 56:2380–2393.
Omoregie EO, Mastalerz V, de Lange G, Straub KL,Kappler A, Røy H et al. (2008). Biogeochemistry andcommunity composition of iron- and sulfur-precipi-tating microbial mats at the Chefren Mud Volcano(Nile Deep Sea Fan, Eastern Mediterranean). ApplEnviron Microbiol 74: 3198–3215.
Omoregie EO, Niemann H, Mastalerz V, de Lange G,Stadnitskaia A, Mascle J et al. (2009). Microbialmethane oxidation and sulfate reduction at cold seepsof the deep Eastern Mediterranean Sea. Mar Geol 261:114–127.
Orcutt BN, Sylvan JB, Knab NJ, Edwards KJ. (2011).Microbial ecology of the dark ocean above, at, and belowthe Seafloor. Microbiol Mol Biol Rev 75: 361–422.
Orphan VJ, Hinrichs K, Ussler W III, Paull CK, Taylor LT,Sylva SP et al. (2001). comparative analysis ofmethane-oxidizing archaea and sulfate-reducingbacteria in anoxic marine sediments. Appl EnvironMicrobiol 67: 1922–1934.
Pachiadaki MG, Lykousis V, Stefanou EG, Kormas KA.(2010). Prokaryotic community structure and diversityin the sediments of an active submarine mud volcano(Kazan mud volcano, East Mediterranean Sea). FEMSMicrobiol Ecol 72: 429–444.
Papke R, Ramsing NB, Bateson MM, Ward DM. (2003).Geographical isolation in hot spring cyanobacteria.Environ Microbiol 5: 650–659.
Polymenakou PN, Bertilsson S, Tselepides A, Stephanou EG.(2005). Bacterial community composition in differentsediments from the Eastern Mediterranean Sea:a comparison of four 16 S ribosomal DNA clonelibraries. Microb Ecol 50: 447–462.
Pommier T, Canback B, Riemann L, Bostrom KH, Simu K,Lundberg P et al. (2007). Global patterns of diversity
Bacterial diversity at cold seepsP Pop Ristova et al
12
The ISME Journal
and community structure in marine bacterioplankton.Mol Ecol 16: 867–880.
Pop Ristova P, Wenzhofer F, Ramette A, Zabel M,Fischer D, Kasten S et al. (2012). Bacterial diversityand biogeochemistry of different chemosynthetichabitats of the REGAB cold seep (West African margin,3160 m water depth). Biogeosciences 9: 5031–5048.
Pop Ristova P, Wenzhofer F, Ramette A, Fleden J,Boetius A. (2014). Biogeochemical investigation ofcold seep sediments in the Eastern Mediterranean Sea.doi:10.1594/PANGAEA.830241. http://wiki.pangaea.de/wiki/Citation.
Pradillon F, Schmidt A, Peplies J, Dubilier N. (2007).Species identification of marine invertebrate earlystages by whole-larvae in situ hybridisation of 18Sribosomal RNA. Mar Ecol Prog Ser 333: 103–116.
Pradillon F, Zbinden M, Mullineaux LS, Gaill F. (2005).Colonisation of newly-opened habitat by a pioneerspecies, Alvinella pompejana (Polychaeta: Alvinellidae),at East Pacific Rise vent sites. Mar Ecol Prog Ser 302:147–157.
Quaiser A, Zivanovic Y, Moreira D, Lopez-Garcıa P. (2011).Comparative metagenomics of bathypelagic planktonand bottom sediment from the Sea of Marmara. ISME J5: 285–304.
Ramette A. (2007). Multivariate analyses in microbialecology. FEMS Microbiol Ecol 62: 142–160.
Ramette A. (2009). Quantitative community fingerprintingmethods for estimating the abundance of operationaltaxonomic units in natural microbial communities.Appl Environ Microbiol 75: 2495–2505.
Ramette A, Tiedje JM. (2007). Multiscale responses ofmicrobial life to spatial distance and environmentalheterogeneity in a patchy ecosystem. Proc Natl AcadSci USA 104: 2761–2766.
Ramirez-Llodra E, Tyler Pa, Baker MC, Bergstad OA,Clark MR, Escobar E et al. (2011). Man and the lastgreat wilderness: human impact on the deep sea. PLoSOne 6: e22588.
Ritt B, Pierre C, Gauthier O, Wenzhofer F, Boetius A,Sarrazin J. (2011). Diversity and distribution ofcold-seep fauna associated with different geologicaland environmental settings at mud volcanoes andpockmarks of the Nile Deep-Sea Fan. Mar Biol 158:1187–1210.
Roberts DW. (2013). labdsv: Ordination and MultivariateAnalysis for Ecology. R package version 1.6-1. http://CRAN.R-project.org/package=labdsv.
Rosenzweig ML. (1995). Species Diversity in Space andTime. Cambridge University Press: Cambridge, UK.
Ruff SE, Arnds J, Knittel K, Amann R, Wegener G,Ramette A et al. (2013). Microbial communities ofdeep-sea methane seeps at Hikurangi continentalmargin (New Zealand). PLoS One 8: e72627.
Sahling H, Rickert D, Lee RW, Linke P, Suess E. (2002).Macrofaunal community structure and sulfide flux atgas hydrate deposits from the Cascadia convergentmargin, NE Pacific. Mar Ecol Prog Ser 231: 121–138.
Schauer R, Bienhold C, Ramette A, Harder J. (2010).Bacterial diversity and biogeography in deep-seasurface sediments of the South Atlantic Ocean.ISME J 4: 159–170.
Schloss PD, Westcott SL, Ryabin T, Hall JR, Hartmann M,Hollister EB et al. (2009). Introducing mothur: open-source, platform-independent, community-supportedsoftware for describing and comparing microbialcommunities. Appl Environ Microbiol 75: 7537–7541.
Seeberg-Elverfeldt J, Schluter M, Feseker T, Koelling M.(2005). Rhizon sampling of porewaters near thesediment-water interface of aquatic systems. LimnolOceanogr Methods 3: 361–371.
Sibuet M, Olu K. (1998). Biogeography, biodiversity andfluid dependence of deep-sea cold-seep communitiesat active and passive margins. Deep-Sea Res Pt II 45:517–567.
Treude T, Smith CR, Wenzhofer F, Carney E, BernardinoAF, Hannides AK et al. (2009). Biogeochemistry of adeep-sea whale fall: sulfate reduction, sulfide effluxand methanogenesis. Mar Ecol Prog Ser 382: 1–21.
Tyler PA, Young CM. (1999). Reproduction and dispersalat vents and cold seeps. J Mar Biol Assoc UK 79:193–208.
van Dover C, Smith C, Ardron J, Arnaud S, Beaudoin Y.(2011). Environmental management of deep-seachemosynthetic ecosystems: justification of andconsiderations for a spatially-based approach. ISATechnical Study No. 9. International Seabed Authority,Kingston, Jamaica, 2011, 90pp. http://www.isa.org.jm/files/documents/EN/Pubs/TS9/index.html#/.
van Gaever S, Galeron J, Sibuet M, Vanreusel A. (2009).Deep-sea habitat heterogeneity influence on meiofau-nal communities in the Gulf of Guinea. Deep-Sea ResPt II 56: 2259–2269.
Whitaker RJ, Grogan DW, Taylor JW. (2003). Geographicbarriers isolate endemic populations of hyper-thermophilic archaea. Science 301: 976–978.
Zinger L, Amaral-Zettler LA, Fuhrman JA, Horner-Devine MC,Huse SM, Welch DBM et al. (2011). Global patterns ofbacterial beta-diversity in seafloor and seawaterecosystems. PLoS One 6: e24570.
Zinger L, Boetius A, Ramette A. (2014). Bacterial taxa-areaand distance-decay relationships in marine environ-ments. Mol Ecol 23: 954–964.
This work is licensed under a CreativeCommons Attribution-NonCommercial-
NoDerivs 3.0 Unported License. The images or otherthird party material in this article are included in thearticle’s Creative Commons license, unless indicatedotherwise in the credit line; if the material is notincluded under the Creative Commons license, userswill need to obtain permission from the license holderto reproduce the material. To view a copyof this license, visit http://creativecommons.org/licenses/by-nc-nd/3.0/
Supplementary Information accompanies this paper on The ISME Journal website (http://www.nature.com/ismej)
Bacterial diversity at cold seepsP Pop Ristova et al
13
The ISME Journal