
Spatial Intuition in Elementary Arithmetic: A Neurocomputational Account
23
Beyond the mental number line: A neural network model of number–space interactions Qi Chen, Tom Verguts * Ghent University, Belgium article info Article history: Accepted 4 January 2010 Keywords: Numerical cognition Computational modeling abstract It is commonly assumed that there is an interaction between the representations of number and space (e.g., Dehaene, Bossini, & Gir- aux, 1993; Walsh, 2003), typically ascribed to a mental number line. The exact nature of this interaction has remained elusive, however. Here we propose that spatial aspects are not inherent to number representations, but that instead spatial and numerical representations are separate. However, cultural factors establish ties between them. By extending earlier models (Gevers, Verguts, Reynvoet, Caessens, & Fias, 2006; Verguts, Fias, & Stevens, 2005) based on this hypothesis, the authors present computer simula- tions showing that a model incorporating this idea can account for data from a series of studies. These results suggest that num- ber–space interactions are emergent properties resulting from the interaction between different brain areas. Ó 2010 Elsevier Inc. All rights reserved. 1. Introduction It is hard to find a dimension that is as concrete as physical space, and equally hard to find a dimen- sion that is as abstract as symbolic number. Despite, or maybe because of this, great mathematicians and physicists such as Albert Einstein have often emphasized the importance of number–space inter- actions in their thinking (e.g., Hadamard, 1954). Number–space connections are not exclusive for mathematicians but exist in nonmathematicians as well. Already in the 19th century, Francis Galton pointed out that some individuals perceive num- bers as spatially organized (Galton, 1880). The modern impetus to study number–space interactions 0010-0285/$ - see front matter Ó 2010 Elsevier Inc. All rights reserved. doi:10.1016/j.cogpsych.2010.01.001 * Corresponding author. Address: Department of Psychology, Ghent University, H. Dunantlaan 2, 9000 Ghent, Belgium. Fax: +32 9 264.64.96. E-mail address: [email protected] (T. Verguts). Cognitive Psychology 60 (2010) 218–240 Contents lists available at ScienceDirect Cognitive Psychology journal homepage: www.elsevier.com/locate/cogpsych
-
Upload
independent -
Category
Documents
-
view
3 -
download
0
Transcript of Spatial Intuition in Elementary Arithmetic: A Neurocomputational Account
Cognitive Psychology 60 (2010) 218–240
Contents lists available at ScienceDirect
Cognitive Psychology
journal homepage: www.elsevier .com/locate/cogpsych
Beyond the mental number line: A neural network modelof number–space interactions
Qi Chen, Tom Verguts *
Ghent University, Belgium
a r t i c l e i n f o
Article history:Accepted 4 January 2010
Keywords:Numerical cognitionComputational modeling
0010-0285/$ - see front matter � 2010 Elsevier Indoi:10.1016/j.cogpsych.2010.01.001
* Corresponding author. Address: Department of+32 9 264.64.96.
E-mail address: [email protected] (T. Verg
a b s t r a c t
It is commonly assumed that there is an interaction between therepresentations of number and space (e.g., Dehaene, Bossini, & Gir-aux, 1993; Walsh, 2003), typically ascribed to a mental numberline. The exact nature of this interaction has remained elusive,however. Here we propose that spatial aspects are not inherentto number representations, but that instead spatial and numericalrepresentations are separate. However, cultural factors establishties between them. By extending earlier models (Gevers, Verguts,Reynvoet, Caessens, & Fias, 2006; Verguts, Fias, & Stevens, 2005)based on this hypothesis, the authors present computer simula-tions showing that a model incorporating this idea can accountfor data from a series of studies. These results suggest that num-ber–space interactions are emergent properties resulting fromthe interaction between different brain areas.
� 2010 Elsevier Inc. All rights reserved.
1. Introduction
It is hard to find a dimension that is as concrete as physical space, and equally hard to find a dimen-sion that is as abstract as symbolic number. Despite, or maybe because of this, great mathematiciansand physicists such as Albert Einstein have often emphasized the importance of number–space inter-actions in their thinking (e.g., Hadamard, 1954).
Number–space connections are not exclusive for mathematicians but exist in nonmathematiciansas well. Already in the 19th century, Francis Galton pointed out that some individuals perceive num-bers as spatially organized (Galton, 1880). The modern impetus to study number–space interactions
c. All rights reserved.
Psychology, Ghent University, H. Dunantlaan 2, 9000 Ghent, Belgium. Fax:
uts).
Q. Chen, T. Verguts / Cognitive Psychology 60 (2010) 218–240 219
however was given by the finding of the SNARC effect (Spatial–Numerical Association of ResponseCodes; Dehaene et al., 1993). This means that participants consistently respond more quickly to smallnumbers with left-sided responses and to large numbers with right-sided responses. A related findingis that when irrelevant digits are presented at fixation, spatial attention is automatically directed tothe left side of space for relatively small numbers and to the right side of space for relatively largenumbers (Fischer, Castel, Dodd, & Pratt, 2003).
The most compelling evidence in favor of number–space interactions derives from patients withright-hemisphere damage who typically show left-hemifield neglect (paying attention only to theright side of their visual field; e.g., Marshall & Halligan, 1990). For example, when asked to bisect aline, these patients bias the perceived midpoint of the line to the right of center. Surprisingly, neglectpatients also show a bias towards larger numbers when asked to report the middle of a numericalinterval (e.g., when asked about the middle between 1 and 9, they might respond 7; Priftis, Zorzi,Meneghello, Marenzi, & Umilta, 2006; Zorzi, Priftis, & Umiltà, 2002). Both spatial and numerical biasesare alleviated by wearing adaptation prisms (Rossetti et al., 2004). Another finding is that, when askedto judge whether a single number shown at fixation is smaller or larger than the standard 5, patientswith neglect are selectively slower to respond to 4 than to 6, but when asked to compare numbers tothe standard 7 they are selectively slower to respond to 6 than to 8 (Vuilleumier, Ortigue, & Brugger,2004). Hence, in each case the ‘‘left” number closest to the standard was disproportionally slowed. Fi-nally, numerous studies of single neurons in monkeys (e.g., Nieder & Miller, 2004), lesion localizationin neurological patients (e.g., Dehaene & Cohen, 1997), and neuroimaging and TMS in healthy humans(e.g., Dehaene et al., 1999; Eger, Sterzer, Russ, Giraud, & Kleinschmidt, 2003; Göbel, Calabria, Farne, &Rossetti, 2006; Oliveri, Rausei, Torriero, Turriziani, & Caltagirone, 2004) have demonstrated thatnumerical tasks involve parietal areas (for review, see Dehaene, Piazza, Pinel, & Cohen, 2003). It is wellknown that parietal cortex is involved in space perception and spatial attention (Husain & Nachev,2007), so the fact that it consistently activates in number processing also again suggests that thereis a link between number and space representations.
A popular conceptualization to link all these data together is that of the mental number line (Deh-aene, 1997). The idea here is that presentation of a number (e.g., 3) leads to activation on the left sideof a spatially oriented line in the participant’s mind. Activation of a slightly larger number (e.g., 5)leads to partially overlapping activation but shifted to the right of 3. In this model, number and phys-ical space are inherently linked and accounting for number–space interactions is hence straightfor-ward. However, the model as typically formulated in the literature suffers from two mainshortcomings. First, although a rigorous characterization of the mental number line has been proposed(Dehaene, 2007), it has not been specified how the mental number line performs or enables numberparity judgment, number bisection, and other tasks, in the process generating a host of specific find-ings such as these outlined above.
Second, and more importantly, there are findings indicating that the link between number andspace is not as tight as suggested by the mental number line model. For example, Rossetti et al.(2004) and Doricchi, Guariglia, Gasparini, and Tomaiuolo (2005) found that a dissociation can be ob-tained between physical line bisection and mental number line bisection among different neglect pa-tient groups. Rossetti et al. (2004) observed that neglect patients with a fronto-temporoparietalischemia exhibited mild leftward shifts on physical line bisection but significant rightward shifts onmental number line bisection. In Doricchi et al., a group of patients with chronic neglect and completehemianopia exhibited large shifts on physical line bisection but only small shifts on mental numberbisection. In contrast, patients with chronic neglect and no hemianopia exhibited small shifts on phys-ical line bisection and large shifts on mental number bisection. Hence, some data point toward num-ber–space associations and some toward number–space dissociations. It is unclear how the mentalnumber line can be brought to bear in interpreting these apparently contradictory data. To go beyondthis impasse, computational modeling can help to link together the empirical evidence to produce anunderstanding of how the system works. The main goal of this article is to set up such a model, whichis called the number–space model. This will provide us with a specific and testable account of howexactly number and space interact.
The remainder of the paper is organized as follows. First, we outline the main features of our model.Second, we describe the basic network architecture in more detail, along with the mechanisms used to
220 Q. Chen, T. Verguts / Cognitive Psychology 60 (2010) 218–240
assess the performance of the network in a variety of experimental tasks. Third, we compare the re-sults obtained with the model with those of several representative experiments. Finally, we discussthe implications of this model.
2. The number–space model: biological and cultural determinants
Our model is based on two separate strands, one physiological and one cultural. The physiologicalpart is based on data concerning the (monkey) lateral intraparietal area (LIP), a subdivision of the infe-rior parietal lobe (Grefkes & Fink, 2005). This area is involved in the guidance of spatial attention. LIPprovides a salience map of the external world, that is, a topographic visual representation that encodesthe locations of salient or behaviorally relevant objects (Gottlieb, 2007). LIP units have receptive fieldswhose centers (the retinal location at which the peak response occurs) tend to be located in the con-tralateral visual field (Andersen, Asanuma, Essick, & Siegel, 1990). Stated otherwise, LIP contains con-tralateral spatial neuronal gradients: left space is represented more strongly in right LIP, and rightspace is represented more strongly in left LIP. For humans, the same contralateral spatial neuronal gra-dients have been found in a region of the superior parietal cortex (medial wall of intraparietal sulcus,or mIPS), which is thought to correspond to the LIP in macaque monkeys (Grefkes & Fink, 2005; Seren-o, Pitzalis, & Martinez, 2001). However, because the salience map is most intensively studied in themonkey and therefore typically associated with LIP, we will refer to the location of the saliencemap in humans as the human homologue of LIP (hLIP).
Second, we assume that cultural influences will affect the interaction between number and space.The fact that culture influences both behavior and brain organization has been widely documented(e.g., Hedden, Ketay, Aron, Markus, & Gabrieli, 2008; Nisbett, Peng, Choi, & Norenzayan, 2001). In par-ticular the embodied cognition literature has repeatedly emphasized that environmental correlationsimpose a signature on the cognitive systems dealing with such correlations (e.g., Barsalou, 1999; Estes,Verges, & Barsalou, 2008), also in the domain of numerical cognition (e.g., Pica, Lemer, Izard, & Deh-aene, 2004; Tang et al., 2006). In the current context, we assume that an environmental correlationbetween symbolic (e.g., Arabic) numbers and physical space (left or right positions) leaves its signa-ture in the brain. Note that this same assumption is also invoked to explain the SNARC effect (e.g.,Dehaene et al., 1993; Hubbard, Piazza, Pinel, & Dehaene, 2005). Indeed, it is difficult to see whatthe origin of the SNARC effect might be if this assumption would turn out to be false. In fact, the SNARCeffect has been shown to be very sensitive to cultural factors (e.g., Shaki & Fischer, 2008; Shaki, Fischer,& Petrusic, 2009; Zebian, 2005). Applied to the present context, when children in Western cultures goto school and begin to learn Arabic numbers, Arabic numbers 1–9 are often physically representedfrom left to right (e.g., on the blackboard and in school books). This practice introduces an environ-mental correlation between number and space in that smaller numbers (e.g., 1 and 2) tend to occurmore often left than right, and larger numbers (e.g., 8 and 9) tend to appear more often on the right.We hypothesize that Hebbian learning processes will pick up this correlation and install a strongercoupling between small numbers and left side of space on the one hand and between large numbersand right side of space on the other. A similar assumption has been invoked in the visual word recog-nition literature to account for different findings (Shillcock, Ellison, & Monaghan, 2000; see below).
3. Network architecture
3.1. Representational components
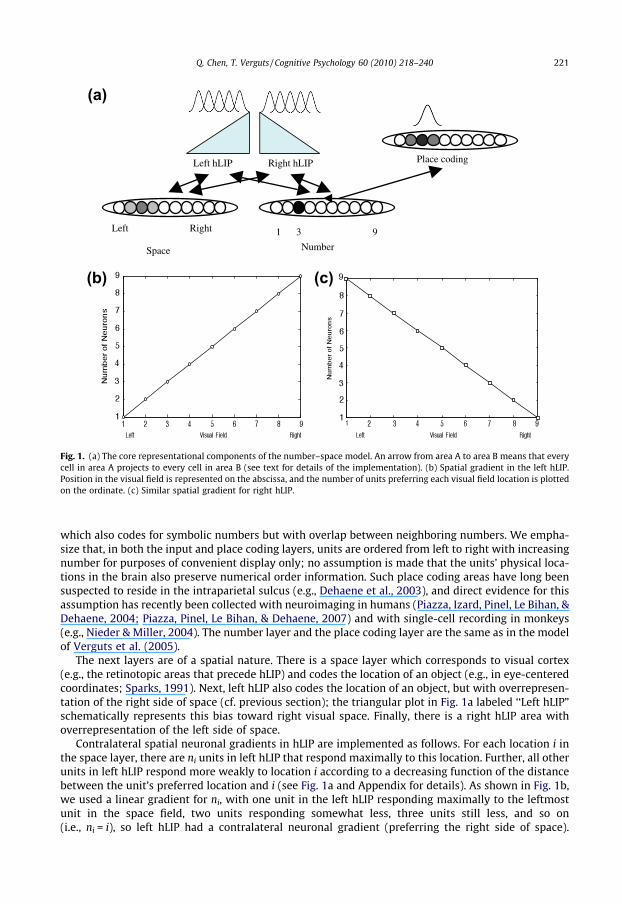
The core representational components of our number–space model are shown in Fig. 1a. First, thereis a number layer where each unit codes for a specific number (number 3 is activated in the example)in a localist fashion. The localist assumption is taken for convenience rather than representing a the-oretical stance. This layer codes for symbolic (Arabic) numbers, and corresponds to the visual Arabicnumber form in the Dehaene – Cohen triple-code model (e.g., Dehaene & Cohen, 1995; Dehaene,1992). Dehaene and Cohen tentatively localize this area in the ventral visual pathway, possibly inor around the fusiform word form area (e.g., Vinckier et al., 2007). Second, there is a place coding layer
(a)
(b) (c)
Space
Left Right 1 3 9
Number
Place codingLeft hLIP Right hLIP
Fig. 1. (a) The core representational components of the number–space model. An arrow from area A to area B means that everycell in area A projects to every cell in area B (see text for details of the implementation). (b) Spatial gradient in the left hLIP.Position in the visual field is represented on the abscissa, and the number of units preferring each visual field location is plottedon the ordinate. (c) Similar spatial gradient for right hLIP.
Q. Chen, T. Verguts / Cognitive Psychology 60 (2010) 218–240 221
which also codes for symbolic numbers but with overlap between neighboring numbers. We empha-size that, in both the input and place coding layers, units are ordered from left to right with increasingnumber for purposes of convenient display only; no assumption is made that the units’ physical loca-tions in the brain also preserve numerical order information. Such place coding areas have long beensuspected to reside in the intraparietal sulcus (e.g., Dehaene et al., 2003), and direct evidence for thisassumption has recently been collected with neuroimaging in humans (Piazza, Izard, Pinel, Le Bihan, &Dehaene, 2004; Piazza, Pinel, Le Bihan, & Dehaene, 2007) and with single-cell recording in monkeys(e.g., Nieder & Miller, 2004). The number layer and the place coding layer are the same as in the modelof Verguts et al. (2005).
The next layers are of a spatial nature. There is a space layer which corresponds to visual cortex(e.g., the retinotopic areas that precede hLIP) and codes the location of an object (e.g., in eye-centeredcoordinates; Sparks, 1991). Next, left hLIP also codes the location of an object, but with overrepresen-tation of the right side of space (cf. previous section); the triangular plot in Fig. 1a labeled ‘‘Left hLIP”schematically represents this bias toward right visual space. Finally, there is a right hLIP area withoverrepresentation of the left side of space.
Contralateral spatial neuronal gradients in hLIP are implemented as follows. For each location i inthe space layer, there are ni units in left hLIP that respond maximally to this location. Further, all otherunits in left hLIP respond more weakly to location i according to a decreasing function of the distancebetween the unit’s preferred location and i (see Fig. 1a and Appendix for details). As shown in Fig. 1b,we used a linear gradient for ni, with one unit in the left hLIP responding maximally to the leftmostunit in the space field, two units responding somewhat less, three units still less, and so on(i.e., ni = i), so left hLIP had a contralateral neuronal gradient (preferring the right side of space).
222 Q. Chen, T. Verguts / Cognitive Psychology 60 (2010) 218–240
An opposite contralateral gradient was used between the right hLIP and the space layer (in particular,ni = 9 � i; see Fig. 1c). The linear gradient is used here for convenience, as there are no clear dataregarding the exact nature of the gradient function. However, different linear and nonlinear gradientsas the one used here gave qualitatively similar results.
To instantiate cultural effects in mapping number to space, we set up the connection weights be-tween the number layer and hLIP in a similar way as the space layer to hLIP projections. In particular,right hLIP has a stronger response to small numbers (e.g., 1, 2), and left hLIP has a stronger response tolarge numbers (e.g., 8, 9). Detailed specifications can be found in the Appendix.
All connections described in the previous paragraph are bidirectional. For simplicity, we used thesame decreasing functions of distance for the hLIP to space and the hLIP to number layer mappings.Our results do not depend on the details of our implementation; other gradients and parameter valueslead to qualitatively similar results as those reported here.
3.2. Full model
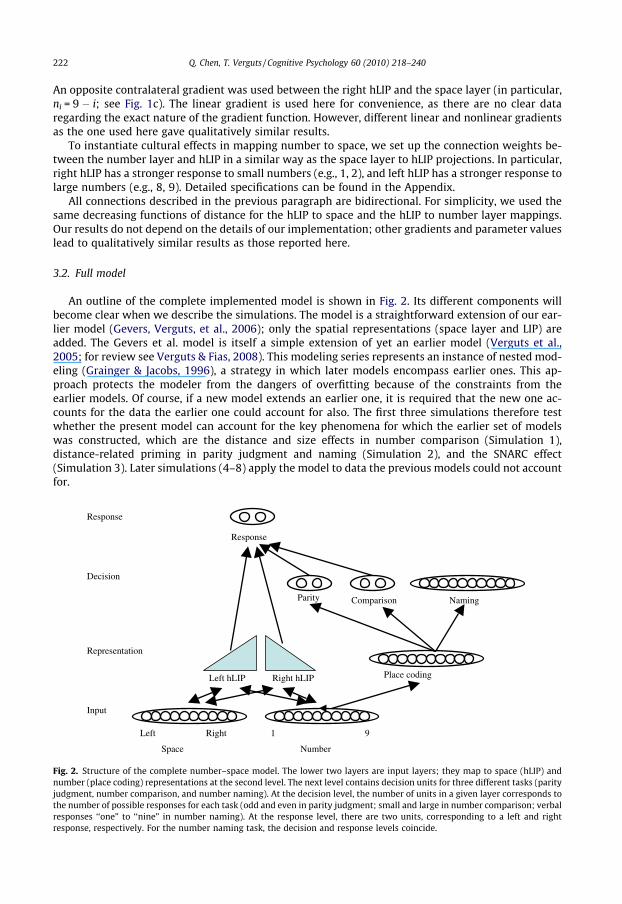
An outline of the complete implemented model is shown in Fig. 2. Its different components willbecome clear when we describe the simulations. The model is a straightforward extension of our ear-lier model (Gevers, Verguts, et al., 2006); only the spatial representations (space layer and LIP) areadded. The Gevers et al. model is itself a simple extension of yet an earlier model (Verguts et al.,2005; for review see Verguts & Fias, 2008). This modeling series represents an instance of nested mod-eling (Grainger & Jacobs, 1996), a strategy in which later models encompass earlier ones. This ap-proach protects the modeler from the dangers of overfitting because of the constraints from theearlier models. Of course, if a new model extends an earlier one, it is required that the new one ac-counts for the data the earlier one could account for also. The first three simulations therefore testwhether the present model can account for the key phenomena for which the earlier set of modelswas constructed, which are the distance and size effects in number comparison (Simulation 1),distance-related priming in parity judgment and naming (Simulation 2), and the SNARC effect(Simulation 3). Later simulations (4–8) apply the model to data the previous models could not accountfor.
Space
Left Right 1 9
Number
Place coding
Naming ComparisonParity
Response
Left hLIP Right hLIP
Response
Decision
Representation
Input
Fig. 2. Structure of the complete number–space model. The lower two layers are input layers; they map to space (hLIP) andnumber (place coding) representations at the second level. The next level contains decision units for three different tasks (parityjudgment, number comparison, and number naming). At the decision level, the number of units in a given layer corresponds tothe number of possible responses for each task (odd and even in parity judgment; small and large in number comparison; verbalresponses ‘‘one” to ‘‘nine” in number naming). At the response level, there are two units, corresponding to a left and rightresponse, respectively. For the number naming task, the decision and response levels coincide.
Q. Chen, T. Verguts / Cognitive Psychology 60 (2010) 218–240 223
4. Simulation 1: distance and size effects in number comparison
Number comparison is a very popular paradigm to investigate numerical cognition (e.g., Moyer &Landauer, 1967; Schwarz & Stein, 1998). Typical and very robust findings are the distance effect (com-parison is easier with larger distances between numbers) and the size effect (comparison is easier withsmaller numbers). Although these effects are traditionally considered support for an interaction be-tween number and space (e.g., Chiao, Bordeaux, & Ambaby, 2004; Walsh, 2003), Verguts et al.(2005) suggested that they did not result from number–space interactions but instead from the deci-sion process (see also Banks, 1977; Van Opstal, Gevers, De Moor, & Verguts, 2008). Here, we first rep-licate the results of our previous model in the current one.
Because two numbers were represented simultaneously in the study we will model here (Schwarz& Stein, 1998), we implemented two number layers. These two number layers map to two place cod-ing layers. These two layers send activation to a comparison layer, which makes a comparison decisionand projects to the response layer (Fig. 2). The dynamics of the model are described in the Appendix.The connection weights of the model were taken from Verguts et al. (2005). Because the left/right cod-ing of the response level is unimportant here, we read out the model’s response directly from the deci-sion level; when one of the comparison layer units crossed a threshold value (0.8), simulated responsetime (RT) was taken to be the number of steps needed to reach this threshold. Results are similar if aresponse is read out from the response level. The same number pairs were presented as in the originalempirical study (all pairs composed of numbers 3–7). Each number pair was presented once in thesimulation.
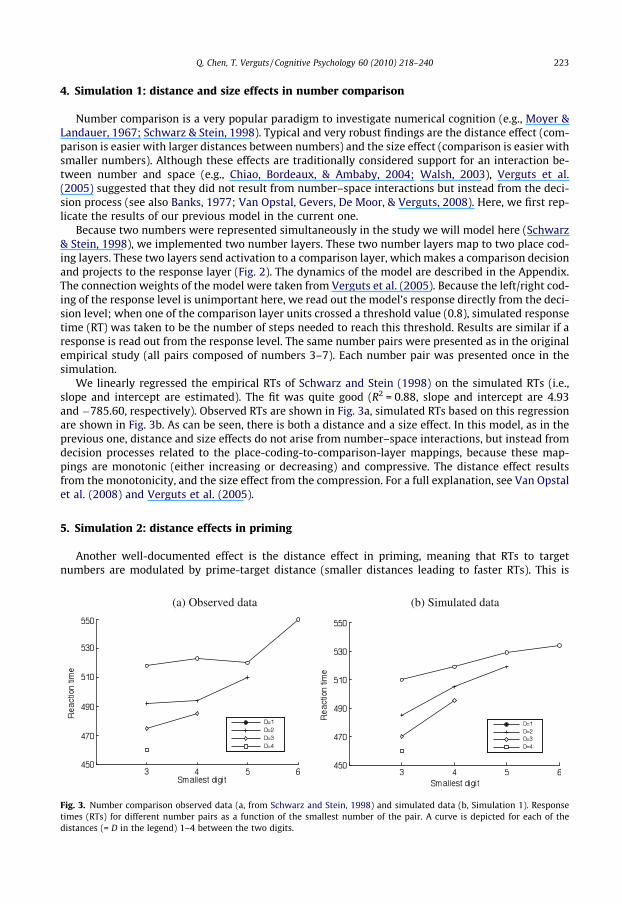
We linearly regressed the empirical RTs of Schwarz and Stein (1998) on the simulated RTs (i.e.,slope and intercept are estimated). The fit was quite good (R2 = 0.88, slope and intercept are 4.93and �785.60, respectively). Observed RTs are shown in Fig. 3a, simulated RTs based on this regressionare shown in Fig. 3b. As can be seen, there is both a distance and a size effect. In this model, as in theprevious one, distance and size effects do not arise from number–space interactions, but instead fromdecision processes related to the place-coding-to-comparison-layer mappings, because these map-pings are monotonic (either increasing or decreasing) and compressive. The distance effect resultsfrom the monotonicity, and the size effect from the compression. For a full explanation, see Van Opstalet al. (2008) and Verguts et al. (2005).
5. Simulation 2: distance effects in priming
Another well-documented effect is the distance effect in priming, meaning that RTs to targetnumbers are modulated by prime-target distance (smaller distances leading to faster RTs). This is
(a) Observed data (b) Simulated data
Fig. 3. Number comparison observed data (a, from Schwarz and Stein, 1998) and simulated data (b, Simulation 1). Responsetimes (RTs) for different number pairs as a function of the smallest number of the pair. A curve is depicted for each of thedistances (= D in the legend) 1–4 between the two digits.
224 Q. Chen, T. Verguts / Cognitive Psychology 60 (2010) 218–240
especially well studied in number naming and parity judgment tasks (Den Heyer & Briand, 1986; Rey-nvoet & Brysbaert, 1999, 2004).
To simulate the naming and parity judgment tasks, we implemented a decision layer for each task(see Appendix for details), as shown in Fig. 2. The connection weights for these tasks are copied fromVerguts et al. (2005). Numbers from 1 to 9 are used, and all possible number pairs are presented once.Primes were first presented for 40 time steps, followed by 20 time steps during which nothing waspresented; after this, the target was presented until response. Responses were again read out fromthe decision level (cf. Simulation 1).
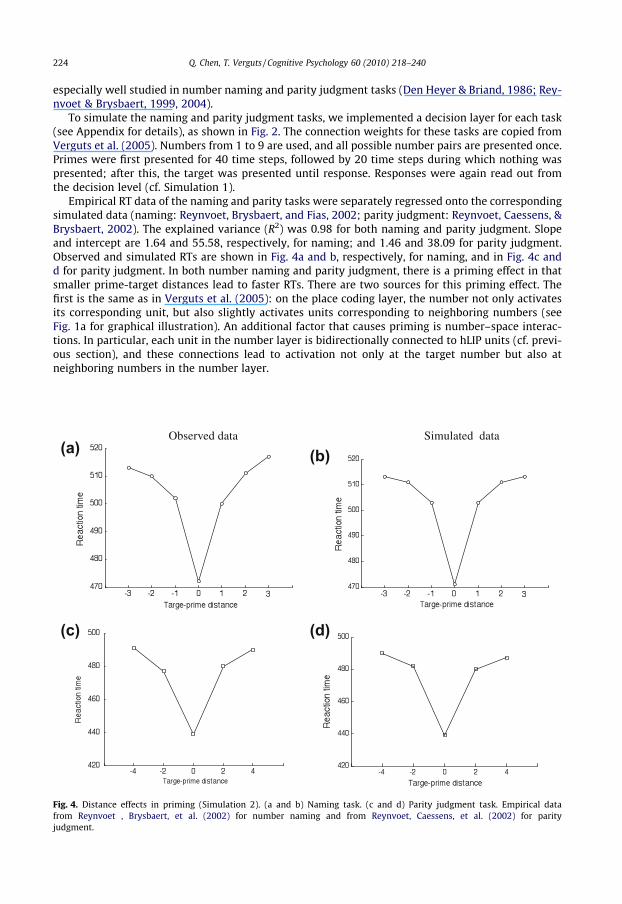
Empirical RT data of the naming and parity tasks were separately regressed onto the correspondingsimulated data (naming: Reynvoet, Brysbaert, and Fias, 2002; parity judgment: Reynvoet, Caessens, &Brysbaert, 2002). The explained variance (R2) was 0.98 for both naming and parity judgment. Slopeand intercept are 1.64 and 55.58, respectively, for naming; and 1.46 and 38.09 for parity judgment.Observed and simulated RTs are shown in Fig. 4a and b, respectively, for naming, and in Fig. 4c andd for parity judgment. In both number naming and parity judgment, there is a priming effect in thatsmaller prime-target distances lead to faster RTs. There are two sources for this priming effect. Thefirst is the same as in Verguts et al. (2005): on the place coding layer, the number not only activatesits corresponding unit, but also slightly activates units corresponding to neighboring numbers (seeFig. 1a for graphical illustration). An additional factor that causes priming is number–space interac-tions. In particular, each unit in the number layer is bidirectionally connected to hLIP units (cf. previ-ous section), and these connections lead to activation not only at the target number but also atneighboring numbers in the number layer.
Observed data Simulated data(a) (b)
(c) (d)
Fig. 4. Distance effects in priming (Simulation 2). (a and b) Naming task. (c and d) Parity judgment task. Empirical datafrom Reynvoet , Brysbaert, et al. (2002) for number naming and from Reynvoet, Caessens, et al. (2002) for parityjudgment.

Q. Chen, T. Verguts / Cognitive Psychology 60 (2010) 218–240 225
6. Simulation 3: the SNARC effect
As mentioned above, an important finding with respect to number–space interactions is the SNARCeffect: relatively small numbers are responded to faster with left-sided responses, and relatively largenumbers are responded to faster with right-sided responses (Dehaene et al., 1993). In the Gevers, Ver-guts, et al. (2006) model, a decision concerning the number’s relative size (small or large; representedat the decision level in Fig. 2) automatically activates a lateralized response (left or right; representedat the response level in Fig. 2). This response can be either congruent or incongruent with the correctresponse that is selected according to the task instructions (e.g., to judge a number’s parity status).Conflict between the two responses is resolved at the response layer. Direct evidence for this is re-ported by Gevers, Ratinckx, De Baene, and Fias (2006): when lateralized readiness potentials were re-corded at motor cortex, they found that SNARC-incongruent conditions resulted in an initial diptoward the wrong response hand. As noted before, the current model extends the Gevers et al. modelby adding number–space interactions as implemented by bidirectional connections between the num-ber input layer and hLIP (see Fig. 1b).
We ran the model on a parity judgment and magnitude comparison task to compute its SNARC ef-fect. Responses were read out from the response level in similar manner as described before. The num-bers from 1 to 9, except 5, are used for parity judgment, and all possible number and response (left orright) pairs are used once. We computed the SNARC effect using a regression analysis method adoptedfrom Fias, Brysbaert, Geypens, and d’Ydewalle (1996). This method starts by computing the differencein RT (dRT) between right hand and left hand responses (right RT–left RT) for each number separately.The SNARC effect entails smaller dRT values with increasing number size, hence a negative slope ispredicted when regressing dRT on number size.
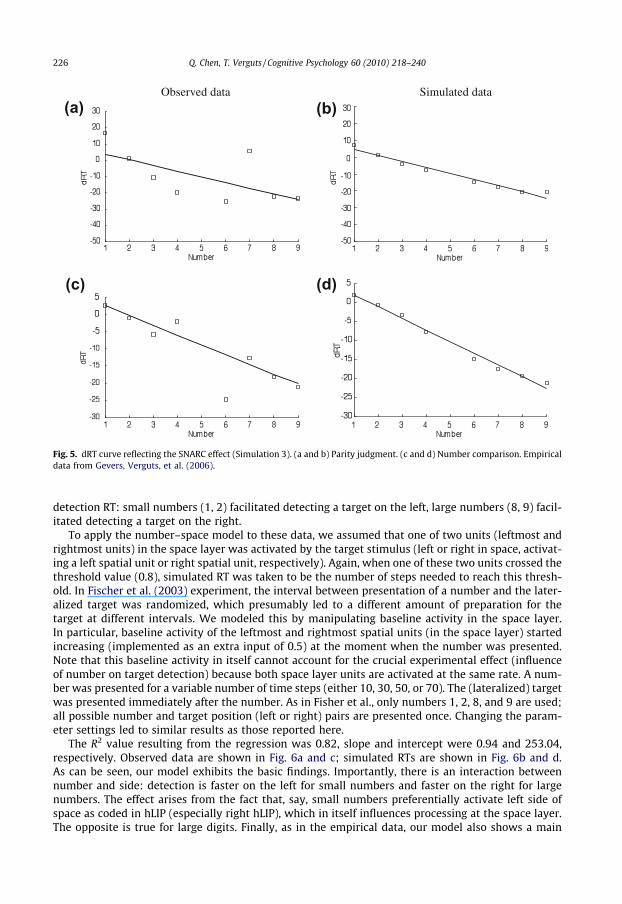
The dRT values were entered in a regression as in Simulations 1 and 2 (empirical data from Gevers,Ratinckx, et al., 2006; Gevers, Verguts, et al., 2006). R2 was 0.45 for the parity judgment task, slope andintercept were 1.00 and �11.87, respectively. The observed and simulated dRT curves for parityjudgment are shown in Fig. 5a and b, respectively. There are two sources contributing to the SNARCeffect here. The first is due to the automatically triggered comparison response. This is the samesource as in Gevers, Verguts, et al. (2006), and it derives from the fact that small and large are linkedto left and right, respectively (see Gevers et al. for discussion). The second results from interactionsbetween number and space. As noted above, small numbers will preferentially activate left-codingspatial units in hLIP, and these units facilitate the ‘‘Left” response (see Fig. 2). Large numbers on theother hand preferentially activate right-coding spatial units in hLIP, and these units facilitate a ‘‘Right”response. In line with this two-source hypothesis, Gevers et al. (in press) and Van Dijck, Gevers, andFias (2009) recently showed empirically that both verbal–spatial response codes (as when small andlarge are connected to left and right, respectively) and visuo-spatial codes contribute to the SNARCeffect.
For the magnitude comparison task, the R2 value was 0.78, slope and intercept were 0.89 and�11.40, respectively. In Fig. 5c and d, we show observed and simulated RTs, respectively. In contrastto Gevers, Verguts, et al. (2006) we do not obtain a step-function dRT curve. A simple change of param-eters does generate a step-function curve, but we chose to fix the parameters throughout allsimulations.
7. Simulation 4: the Posner-SNARC effect
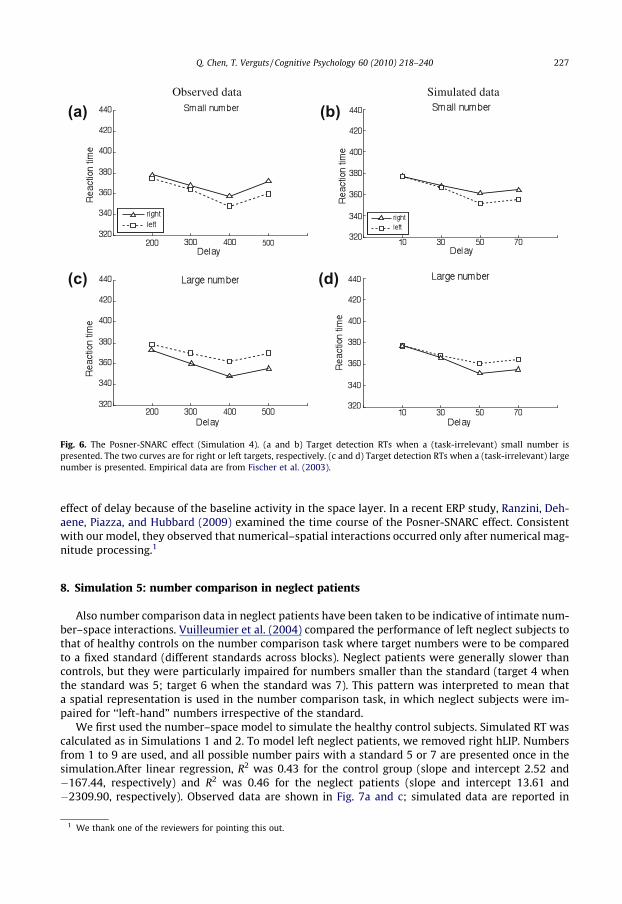
Simulations 1–3 concerned findings that were ascribed here and in our previous work at least par-tially to factors other than number–space interactions. The remaining findings are more directly indic-ative of such interactions. The first is the Posner-SNARC effect reported by Fischer et al. (2003; see alsoRistic, Wright, & Kingstone, 2006).These authors used the typical attentional cuing paradigm proposedby Posner (1980), but with numbers acting as cues. They presented single-digit number cues (1, 2, 8, or9) at fixation, followed by a non-numerical target in either the left visual field (LVF) or right visual field(RVF). The number cues were not predictive for target location. The participant’s task was simply todetect the target. It was found that presentation of the (irrelevant) number influenced the target
Observed data Simulated data
(a) (b)
(c) (d)
Fig. 5. dRT curve reflecting the SNARC effect (Simulation 3). (a and b) Parity judgment. (c and d) Number comparison. Empiricaldata from Gevers, Verguts, et al. (2006).
226 Q. Chen, T. Verguts / Cognitive Psychology 60 (2010) 218–240
detection RT: small numbers (1, 2) facilitated detecting a target on the left, large numbers (8, 9) facil-itated detecting a target on the right.
To apply the number–space model to these data, we assumed that one of two units (leftmost andrightmost units) in the space layer was activated by the target stimulus (left or right in space, activat-ing a left spatial unit or right spatial unit, respectively). Again, when one of these two units crossed thethreshold value (0.8), simulated RT was taken to be the number of steps needed to reach this thresh-old. In Fischer et al. (2003) experiment, the interval between presentation of a number and the later-alized target was randomized, which presumably led to a different amount of preparation for thetarget at different intervals. We modeled this by manipulating baseline activity in the space layer.In particular, baseline activity of the leftmost and rightmost spatial units (in the space layer) startedincreasing (implemented as an extra input of 0.5) at the moment when the number was presented.Note that this baseline activity in itself cannot account for the crucial experimental effect (influenceof number on target detection) because both space layer units are activated at the same rate. A num-ber was presented for a variable number of time steps (either 10, 30, 50, or 70). The (lateralized) targetwas presented immediately after the number. As in Fisher et al., only numbers 1, 2, 8, and 9 are used;all possible number and target position (left or right) pairs are presented once. Changing the param-eter settings led to similar results as those reported here.
The R2 value resulting from the regression was 0.82, slope and intercept were 0.94 and 253.04,respectively. Observed data are shown in Fig. 6a and c; simulated RTs are shown in Fig. 6b and d.As can be seen, our model exhibits the basic findings. Importantly, there is an interaction betweennumber and side: detection is faster on the left for small numbers and faster on the right for largenumbers. The effect arises from the fact that, say, small numbers preferentially activate left side ofspace as coded in hLIP (especially right hLIP), which in itself influences processing at the space layer.The opposite is true for large digits. Finally, as in the empirical data, our model also shows a main
Observed data Simulated data
(a) (b)
(c) (d)
Fig. 6. The Posner-SNARC effect (Simulation 4). (a and b) Target detection RTs when a (task-irrelevant) small number ispresented. The two curves are for right or left targets, respectively. (c and d) Target detection RTs when a (task-irrelevant) largenumber is presented. Empirical data are from Fischer et al. (2003).
Q. Chen, T. Verguts / Cognitive Psychology 60 (2010) 218–240 227
effect of delay because of the baseline activity in the space layer. In a recent ERP study, Ranzini, Deh-aene, Piazza, and Hubbard (2009) examined the time course of the Posner-SNARC effect. Consistentwith our model, they observed that numerical–spatial interactions occurred only after numerical mag-nitude processing.1
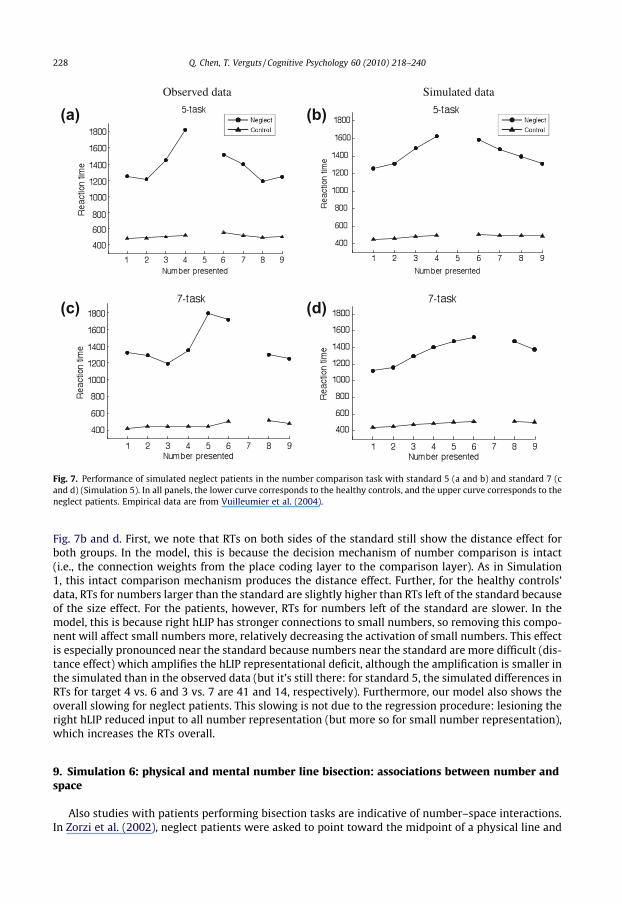
8. Simulation 5: number comparison in neglect patients
Also number comparison data in neglect patients have been taken to be indicative of intimate num-ber–space interactions. Vuilleumier et al. (2004) compared the performance of left neglect subjects tothat of healthy controls on the number comparison task where target numbers were to be comparedto a fixed standard (different standards across blocks). Neglect patients were generally slower thancontrols, but they were particularly impaired for numbers smaller than the standard (target 4 whenthe standard was 5; target 6 when the standard was 7). This pattern was interpreted to mean thata spatial representation is used in the number comparison task, in which neglect subjects were im-paired for ‘‘left-hand” numbers irrespective of the standard.
We first used the number–space model to simulate the healthy control subjects. Simulated RT wascalculated as in Simulations 1 and 2. To model left neglect patients, we removed right hLIP. Numbersfrom 1 to 9 are used, and all possible number pairs with a standard 5 or 7 are presented once in thesimulation.After linear regression, R2 was 0.43 for the control group (slope and intercept 2.52 and�167.44, respectively) and R2 was 0.46 for the neglect patients (slope and intercept 13.61 and�2309.90, respectively). Observed data are shown in Fig. 7a and c; simulated data are reported in
1 We thank one of the reviewers for pointing this out.
Observed data Simulated data
(a) (b)
(c) (d)
Fig. 7. Performance of simulated neglect patients in the number comparison task with standard 5 (a and b) and standard 7 (cand d) (Simulation 5). In all panels, the lower curve corresponds to the healthy controls, and the upper curve corresponds to theneglect patients. Empirical data are from Vuilleumier et al. (2004).
228 Q. Chen, T. Verguts / Cognitive Psychology 60 (2010) 218–240
Fig. 7b and d. First, we note that RTs on both sides of the standard still show the distance effect forboth groups. In the model, this is because the decision mechanism of number comparison is intact(i.e., the connection weights from the place coding layer to the comparison layer). As in Simulation1, this intact comparison mechanism produces the distance effect. Further, for the healthy controls’data, RTs for numbers larger than the standard are slightly higher than RTs left of the standard becauseof the size effect. For the patients, however, RTs for numbers left of the standard are slower. In themodel, this is because right hLIP has stronger connections to small numbers, so removing this compo-nent will affect small numbers more, relatively decreasing the activation of small numbers. This effectis especially pronounced near the standard because numbers near the standard are more difficult (dis-tance effect) which amplifies the hLIP representational deficit, although the amplification is smaller inthe simulated than in the observed data (but it’s still there: for standard 5, the simulated differences inRTs for target 4 vs. 6 and 3 vs. 7 are 41 and 14, respectively). Furthermore, our model also shows theoverall slowing for neglect patients. This slowing is not due to the regression procedure: lesioning theright hLIP reduced input to all number representation (but more so for small number representation),which increases the RTs overall.
9. Simulation 6: physical and mental number line bisection: associations between number andspace
Also studies with patients performing bisection tasks are indicative of number–space interactions.In Zorzi et al. (2002), neglect patients were asked to point toward the midpoint of a physical line and

Q. Chen, T. Verguts / Cognitive Psychology 60 (2010) 218–240 229
report the middle number of various numerical intervals. As is typically observed in neglect patients,they shifted the midpoint of the physical line to the right. In addition, patients also deviated the mid-point of numerical intervals towards larger number. Both deviations were larger for larger intervals.Also data in healthy subjects indicate that physical and mental number line bisection are associated(Longo & Lourenco, 2007).
Before considering how to model number line bisection, it is important to consider the role ofworking memory in this task. Typically, participants are instructed not to calculate the answer, butto respond fast. Such a task demand makes it likely that mental imagery in working memory isadopted to complete the task successfully. Recently, Doricchi et al. (2005) also conducted physical lineinterval and numerical interval bisection tasks in patients with right hemisphere brain damage. Theyfound that neglect patients with prefrontal cortex (PFC) lesions deviated more on mental number linebisection than neglect patients without PFC lesions. This finding suggests an important role of PFC innumber line bisection. Given the well-known role of PFC in working memory (e.g., Goldman-Rakic,1987), we speculate that the role of PFC in the number line bisection task also is to form a ‘‘mentalimage” of a number line in working memory. Modeling the exact contribution of PFC to this task isbeyond the scope of the present paper; we here simply implemented this contribution by an increasedconnectivity between number layers and hLIP layers when PFC is active.
Within each hemisphere, large-scale cortical networks coordinate the operations of spatial workingmemory (Chafee & Goldman-Rakic, 2002; Corbetta & Shulman, 2002; LaBerge, Auclair & Sieroff, 2000;Mesulam, 1981; Posner & Petersen, 1990). Important components of these networks include the dor-solateral PFC and the posterior parietal cortex (of which hLIP is a part). What is important for the cur-rent purpose is that connectivity is largely hemisphere-specific (e.g., Hagmann et al., 2008). Weimplemented this by assuming that signals which amplify number layer–hLIP connectivity originatingfrom left PFC go to left hLIP and from right PFC go to right hLIP. See Fig. 8 for graphical illustration.
To allow the model to perform the physical and numerical interval bisection tasks, we added adecision component for both (a response is read out from the decision layer; see next paragraph).The model as applied to these tasks is shown in Fig. 8. Note that the same hLIP layers (but different
Number Space layer
Left hLIPRight hLIP
Left PFC Right PFC
Space output Number output
Decision
Representation
Input
Fig. 8. Influence of prefrontal cortex on number-to-hLIP connectivity.
230 Q. Chen, T. Verguts / Cognitive Psychology 60 (2010) 218–240
input and output layers) are used for the physical and numerical interval bisection tasks. The connec-tion weights between hLIP and space output (for the physical line bisection task) and between hLIPand number output (for the number line bisection task) are trained by the standard Widrow–Hoff(delta) learning rule for a sigmoid output function. This procedure was repeated 10 times, and theaverage across the 10 simulations is reported. RTs are typically not recorded in bisection studies (onlyaccuracy), so we do not consider RTs either.
To implement a bisection judgment, the model made a ‘‘center of gravity” calculation on the outputlayer, as in previous work modeling neglect (Monaghan & Shillcock, 1998; Pouget & Sejnowski, 2001).The center of gravity is the point at which the activity in the output units to the left of that pointequals the activity of the units to the right. If this point is between two units, then the center of gravityis linearly interpolated between these two units. To model neglect patients, we removed right hLIP.
Here, and also in Simulation 7, the dependent variable is not (dependent on) RT, so scaling is less ofan issue. For this reason, we simply report the simulated deviations. After training, our model achievesgood performance in both tasks, as shown in Fig. 9b (physical line bisection) and 9f (number linebisection); observed data appear in 9a and 9e, respectively. The performance of the neglect modelis shown in Fig. 9d and h (observed data in Fig. 9c and g). In both physical and number line bisection,the model deviates to the ‘‘right” of the middle. This is because hLIP plays a similar role for represent-ing a physical line and a number line. In particular, right (left) hLIP overrepresents the left (right) partof a physical line and a number line. Hence, lesioning right hLIP leads to a diminished representationof the left part of a physical and number line, so the midpoints are shifted to the right in both tasks.
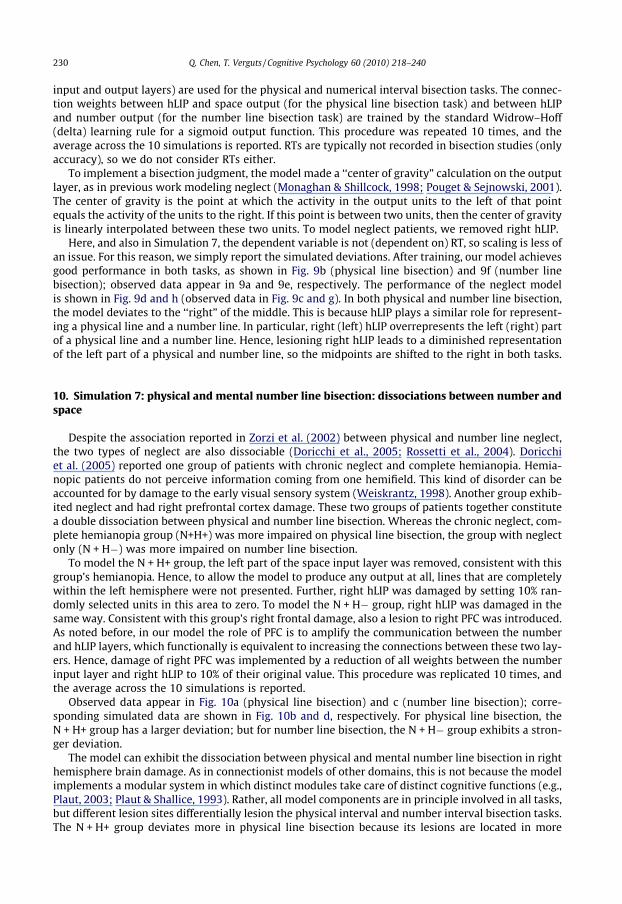
10. Simulation 7: physical and mental number line bisection: dissociations between number andspace
Despite the association reported in Zorzi et al. (2002) between physical and number line neglect,the two types of neglect are also dissociable (Doricchi et al., 2005; Rossetti et al., 2004). Doricchiet al. (2005) reported one group of patients with chronic neglect and complete hemianopia. Hemia-nopic patients do not perceive information coming from one hemifield. This kind of disorder can beaccounted for by damage to the early visual sensory system (Weiskrantz, 1998). Another group exhib-ited neglect and had right prefrontal cortex damage. These two groups of patients together constitutea double dissociation between physical and number line bisection. Whereas the chronic neglect, com-plete hemianopia group (N+H+) was more impaired on physical line bisection, the group with neglectonly (N + H�) was more impaired on number line bisection.
To model the N + H+ group, the left part of the space input layer was removed, consistent with thisgroup’s hemianopia. Hence, to allow the model to produce any output at all, lines that are completelywithin the left hemisphere were not presented. Further, right hLIP was damaged by setting 10% ran-domly selected units in this area to zero. To model the N + H� group, right hLIP was damaged in thesame way. Consistent with this group’s right frontal damage, also a lesion to right PFC was introduced.As noted before, in our model the role of PFC is to amplify the communication between the numberand hLIP layers, which functionally is equivalent to increasing the connections between these two lay-ers. Hence, damage of right PFC was implemented by a reduction of all weights between the numberinput layer and right hLIP to 10% of their original value. This procedure was replicated 10 times, andthe average across the 10 simulations is reported.
Observed data appear in Fig. 10a (physical line bisection) and c (number line bisection); corre-sponding simulated data are shown in Fig. 10b and d, respectively. For physical line bisection, theN + H+ group has a larger deviation; but for number line bisection, the N + H� group exhibits a stron-ger deviation.
The model can exhibit the dissociation between physical and mental number line bisection in righthemisphere brain damage. As in connectionist models of other domains, this is not because the modelimplements a modular system in which distinct modules take care of distinct cognitive functions (e.g.,Plaut, 2003; Plaut & Shallice, 1993). Rather, all model components are in principle involved in all tasks,but different lesion sites differentially lesion the physical interval and number interval bisection tasks.The N + H+ group deviates more in physical line bisection because its lesions are located in more

Observed data Simulated data
(a) (b)
(c) (d)
(e) (f)
(g) (h)
Fig. 9. Data of physical line bisection and mental number line bisection (Simulation 6). (a and b) Physical line bisection, controlsubjects. (c and d) Physical line bisection, neglect patients. (e and f) Number line bisection, control subjects. (g and h) Numberline bisection, neglect patients. Empirical data are from Zorzi et al. (2006).
Q. Chen, T. Verguts / Cognitive Psychology 60 (2010) 218–240 231
Observed data Simulated data(a) (b)
(c) (d)
Fig. 10. Results for physical line bisection (a and b) and number line bisection (c and d) with different lesion sites (Simulation7). Empirical data are from Doricchi et al. (2005).
232 Q. Chen, T. Verguts / Cognitive Psychology 60 (2010) 218–240
‘‘perceptual” layers. On the other hand, the number line bisection task is thought to require mentalimagery, and the prefrontal–parietal network is crucial to set up the mental number line image. There-fore, the N + H� group (with PFC lesion) deviates more in number line bisection. Our choice of whereto lesion the model in the different patient groups was partly arbitrary because clear data concerningwhich lesions are associated with which pathology is still lacking at this moment. However, the mainpoints to be taken from this simulation remain. A first one is that different tasks use partly overlappingcircuits (left and right hLIP), leading to associations between physical line and number line deficits.Indeed, patients with one type of disorder will usually also have the other type (Zorzi, Priftis, Meneg-hello, Marenzi, & Umiltà, 2006). Second, however, because each task uses different pathways to reachhLIP (space-layer-to-hLIP connections and number-layer-to-hLIP pathway, respectively: see Fig. 8),these pathways can be differentially impaired. As a result, also number–space dissociations are pos-sible. The only aspect where the model deviates from the data is that the model does not exhibit across-over effect: this refers to the finding that the rightward bias of neglect patients reverses for smalllines (Halligan & Marshall, 1998) and for number intervals (Zorzi et al., 2002). However, it is relativelyeasy to incorporate cross-over in the model (see General Discussion).
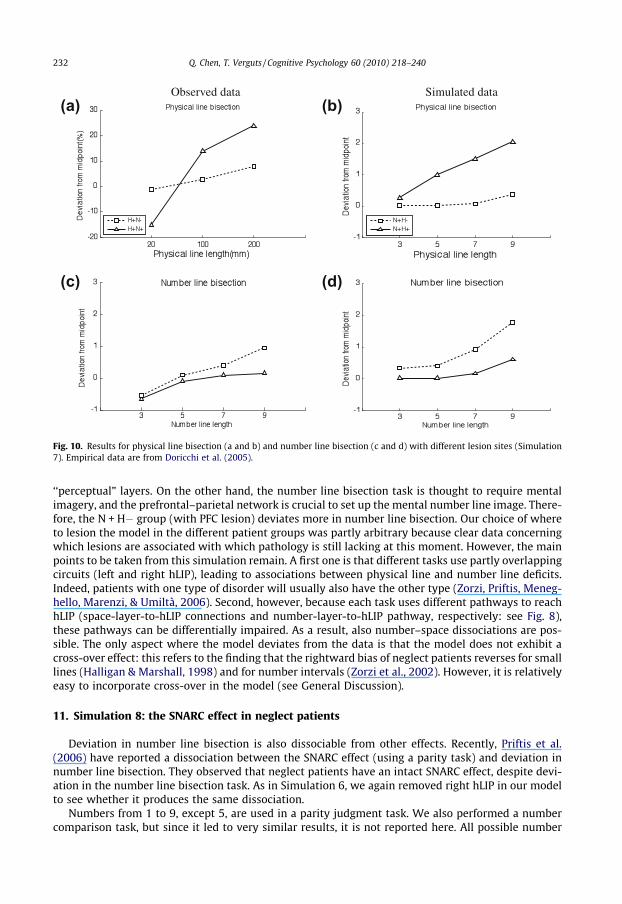
11. Simulation 8: the SNARC effect in neglect patients
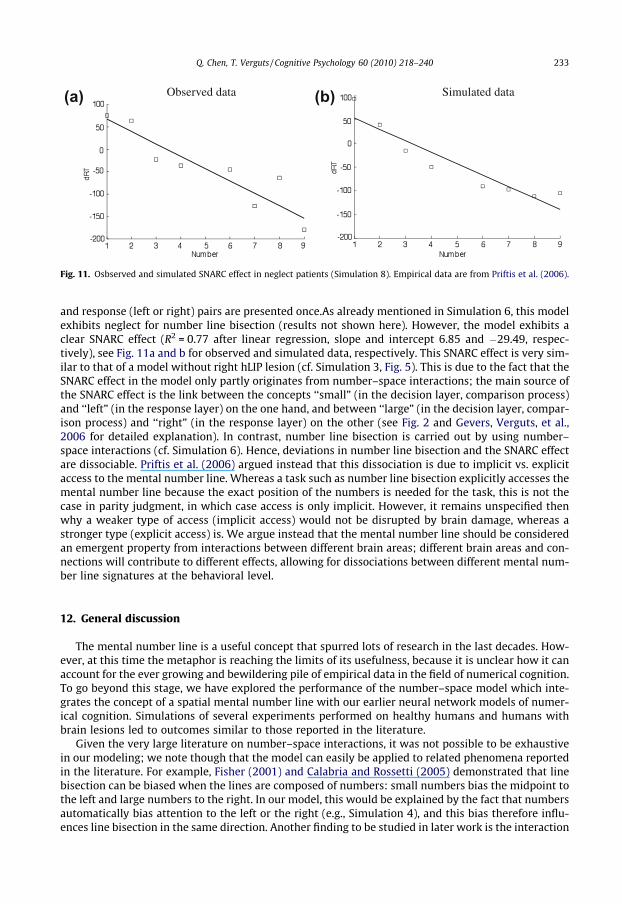
Deviation in number line bisection is also dissociable from other effects. Recently, Priftis et al.(2006) have reported a dissociation between the SNARC effect (using a parity task) and deviation innumber line bisection. They observed that neglect patients have an intact SNARC effect, despite devi-ation in the number line bisection task. As in Simulation 6, we again removed right hLIP in our modelto see whether it produces the same dissociation.
Numbers from 1 to 9, except 5, are used in a parity judgment task. We also performed a numbercomparison task, but since it led to very similar results, it is not reported here. All possible number
Observed data Simulated data(a) (b)
Fig. 11. Osbserved and simulated SNARC effect in neglect patients (Simulation 8). Empirical data are from Priftis et al. (2006).
Q. Chen, T. Verguts / Cognitive Psychology 60 (2010) 218–240 233
and response (left or right) pairs are presented once.As already mentioned in Simulation 6, this modelexhibits neglect for number line bisection (results not shown here). However, the model exhibits aclear SNARC effect (R2 = 0.77 after linear regression, slope and intercept 6.85 and �29.49, respec-tively), see Fig. 11a and b for observed and simulated data, respectively. This SNARC effect is very sim-ilar to that of a model without right hLIP lesion (cf. Simulation 3, Fig. 5). This is due to the fact that theSNARC effect in the model only partly originates from number–space interactions; the main source ofthe SNARC effect is the link between the concepts ‘‘small” (in the decision layer, comparison process)and ‘‘left” (in the response layer) on the one hand, and between ‘‘large” (in the decision layer, compar-ison process) and ‘‘right” (in the response layer) on the other (see Fig. 2 and Gevers, Verguts, et al.,2006 for detailed explanation). In contrast, number line bisection is carried out by using number–space interactions (cf. Simulation 6). Hence, deviations in number line bisection and the SNARC effectare dissociable. Priftis et al. (2006) argued instead that this dissociation is due to implicit vs. explicitaccess to the mental number line. Whereas a task such as number line bisection explicitly accesses themental number line because the exact position of the numbers is needed for the task, this is not thecase in parity judgment, in which case access is only implicit. However, it remains unspecified thenwhy a weaker type of access (implicit access) would not be disrupted by brain damage, whereas astronger type (explicit access) is. We argue instead that the mental number line should be consideredan emergent property from interactions between different brain areas; different brain areas and con-nections will contribute to different effects, allowing for dissociations between different mental num-ber line signatures at the behavioral level.
12. General discussion
The mental number line is a useful concept that spurred lots of research in the last decades. How-ever, at this time the metaphor is reaching the limits of its usefulness, because it is unclear how it canaccount for the ever growing and bewildering pile of empirical data in the field of numerical cognition.To go beyond this stage, we have explored the performance of the number–space model which inte-grates the concept of a spatial mental number line with our earlier neural network models of numer-ical cognition. Simulations of several experiments performed on healthy humans and humans withbrain lesions led to outcomes similar to those reported in the literature.
Given the very large literature on number–space interactions, it was not possible to be exhaustivein our modeling; we note though that the model can easily be applied to related phenomena reportedin the literature. For example, Fisher (2001) and Calabria and Rossetti (2005) demonstrated that linebisection can be biased when the lines are composed of numbers: small numbers bias the midpoint tothe left and large numbers to the right. In our model, this would be explained by the fact that numbersautomatically bias attention to the left or the right (e.g., Simulation 4), and this bias therefore influ-ences line bisection in the same direction. Another finding to be studied in later work is the interaction
234 Q. Chen, T. Verguts / Cognitive Psychology 60 (2010) 218–240
between numerical (SNARC) and spatial (Simon) congruencies reported in Notebaert, Gevers, Verguts,and Fias (2006).
The current version has no noise component and hence there are no error data when modeling thehealthy participant data. Again, future work will be needed to investigate how the model can copewith this. Still, we believe the model provides a step toward a computational theory of number–spaceinteractions, linking the neural and the behavioral level, and stressing an important role for both biol-ogy and culture in mapping number to space. In the remainder of the paper, we discuss related topicsand provide pointers for future research.
12.1. Symbolic and nonsymbolic numbers
Until now, the paper has dealt with numbers in a symbolic (e.g., Arabic) format. In earlier work, wehave also been concerned with nonsymbolic number, that is, number as represented implicitly in acollection of objects (Verguts & Fias, 2004, 2008). We assumed that locations of objects are repre-sented initially on an object location map, where different units code for different locations in space(see also Dehaene & Changeux, 1993). Units in a summation map add all activation from the objectlocation map; in this way, the summation map exhibits an analog code for number (e.g., Gallistel &Gelman, 1992). The Verguts and Fias (2004) model further assumes that this summation map projectsto the place coding layer that was discussed extensively in this paper. As noted above, Nieder and Mill-er (2004) observed place coding neurons in (monkey) area VIP; moreover, an area that projects to areaVIP and that is known to house spatial representations (i.e., LIP) has recently been shown to also ex-hibit summation coding for nonsymbolic number (Roitman, Brannon, & Platt, 2007), further strength-ening the assumptions laid out in this model. We recently also obtained behavioral evidence(Roggeman, Verguts, & Fias, 2007) and fMRI evidence (Santens, Roggeman, Fias, & Verguts, 2010)for the pathways described in this model.
In the current number–space model, there is an additional point of contact between symbolic andnonsymbolic number. In particular, the object location map discussed in earlier work may well be thesame spatial representational system as what we have called hLIP in this paper. This can be tested, andif it turns out to be true, the object location map (or salience map; Gottlieb, 2007) can be seen as animportant hub for different types of representations (spatial, symbolic number, nonsymbolic number).
In the model of Verguts and Fias (2004), the properties of the object location map were responsiblefor generating a ‘‘number line signature” for symbolic numbers also. In particular, the tuning curvesfor symbolic number emerged from being coupled with objects that are represented on the objectlocation map (nonsymbolic numbers; see Verguts & Fias, 2004, for details). Similarly, in the presentpaper, the link from symbolic number to spatial representations generates the different number–spaceinteractions. Hence, according to the model objects located in space form the physical basis on whichunderstanding of number is built. Relatedly, the neural recycling hypothesis holds that evolutionarilyancient structures are reused (‘‘recycled”) in more recent adaptations such as language and symbolicnumber processing (Dehaene & Cohen, 2007). The number–space model relates to this hypothesis inthat the evolutionarily more ancient object location map forms the basis of processing high-levelnumber tasks (e.g., mental number line bisection) and generating different signatures at the behav-ioral level.
12.2. Number form synesthesia
As noted in the introduction, some people report seeing a conscious mental number line, or ‘‘num-ber form”. Based on the mental number line view in which number and space are intimately related oreven overlap, it is difficult to see why not everyone reports this. Individual differences are on the otherhand easily interpretable within the number–space model. In particular, we consider this as a type ofsynesthesia between number and space (hLIP) representations (see also Hubbard et al., 2005), withindividual differences in the extent of cross-wiring across subjects (e.g., similar to grapheme-colorsynesthesia; Hubbard & Ramachandran, 2005).
Consistent with our model, the comparison distance effect (which does not originate from spa-tial processing in our model; see Simulation 1) dissociates from the exact number-form shape.
Q. Chen, T. Verguts / Cognitive Psychology 60 (2010) 218–240 235
In particular, the distance between numbers on a synesthete’s number line does not predict his com-parison distance effect (Piazza, Pinel, & Dehaene, 2006). The hypothesis leads to several other predic-tions. For example, it predicts that people exhibiting this type of ‘‘number line synesthesia” might alsoexhibit other types of synesthesia (due to the overall association across synesthesias, Ramachandran &Hubbard, 2001). This is indeed observed (Sagiv, Simner, Collins, Butterworth, & Ward, 2006). Further,other factors held constant, such synesthetes may also perform better in number line bisection tasksbut not necessarily, in, for example, comparison tasks. There is indeed preliminary evidence thatsynesthetes are at control levels in number comparison (Piazza et al., 2006); the former hypothesisstill needs to be tested. Finally, the hypothesis can also be investigated directly with fMRI where con-nectivity between number and space regions is compared between different populations.
A different interpretation of number form synesthesia was recently proposed by Makioka (2009).This author applied a self-organizing map (Kohonen, 1982) at output to number input that exhibitedsummation coding rather than place coding. He observed that the resulting output map showed struc-tural similarities with mental number forms reported by synesthetes. A crucial difference with ourown approach is that this author started with a summation code for symbolic numbers, and that, aftertraining, the number map respected the number order (close numbers are also physically close). Thelatter is contrary to what was reported in the single-cell data of Nieder, Freedman, and Miller (2002).Furthermore, the link between number and space in his model is very tight, making it unclear whetherthis approach allows accounting for the dissociations reported above. On the other hand, the author’sapproach is promising to account for the different phenomenologies of number form synesthesia. Howthe two approaches can be reconciled, remains to be further determined.
12.3. Multiple codes models
In the 1990s, there were three influential models of numerical cognition. The first is the modularmodel of McCloskey (1992); the second is the triple-code model of Dehaene and Cohen (Dehaene,1992; Dehaene & Cohen, 1995); and the third is the encoding-complex model of Campbell (e.g.,1994). The modular model dates back to clinical neuropsychological work reported in McCloskey,Caramazza, and Basili (1985) and holds that all number processing is performed in the same abstractformat. Dissociations between specific deficits were attributed to deficits in peripheral input/outputstructures. Much evidence collected after publication of this model, however, suggested that differentrepresentational codes exist for different numerical tasks. In response to this, Dehaene and Cohen pre-sented the triple-code model. According to it, there are three systems for representing numbers. Thefirst is a visual Arabic code, in which numbers are encoded as strings of digits in a visuospatial format.The second is a verbal code, in which numbers are encoded as sequences of number words. The last isan analog magnitude code, in which numerical quantities are represented by distributions of activa-tion on an oriented number line. This last code was recently suggested to consist of three separate sub-codes itself (Dehaene et al., 2003). The bilateral horizontal part of the intraparietal cortex is the corequantity system; the left-hemispheric inferior parietal angular gyrus (in collaboration with perisylvianareas) manipulates numbers in verbal form; and a bilateral posterior superior parietal system controlsattentional orientation on the mental number line. Finally, the third model is the encoding-complexmodel of Campbell (1994), which asserted that there are multiple codes operating for number pro-cessing, and different format – input modality – task combinations call for different codes.
Our number–space model has clear similarities to the latter two models. It contains the three cod-ing systems of the triple-code model. The number layer (see Fig. 1b) corresponds to the visual Arabiccode and represents symbolic numbers. The place coding layer, corresponding to the analog magni-tude code, represents numbers with overlap between adjacent numbers. The naming layer verballyrepresents numbers. Finally, the posterior superior parietal system, which contains a spatial atten-tional system according to Dehaene et al. (2003), possibly corresponds to the hLIP cortices in our mod-el. Second, our model also is related to the encoding-complex hypothesis in its emphasis on multiplecodes that interact to produce different empirical findings. A major advance above the encoding-com-plex hypothesis is that the present model is more constrained by empirical data and by being imple-mented in running computer simulations. Because of this, it is also productive in the sense that it leadsto new empirical predictions, some of which were outlined above.
236 Q. Chen, T. Verguts / Cognitive Psychology 60 (2010) 218–240
12.4. Hemispherical gradients in cognition
The existence of spatial hemispheric gradients is now well established (Andersen et al., 1990; Gref-kes & Fink, 2005; Sereno et al., 2001). Many theories, dating back at least to Kinsbourne (1987), haveclaimed that these gradients also have behavioral implications. We have already shortly mentionedhow neglect and its varieties are accounted for in hemispheric models (e.g., Monaghan & Shillcock,1998, 2004; Pouget & Sejnowski, 2001). In addition, such gradients have also been claimed to be influ-ential in language processing (Lavidor, Hayes, Shillcock, & Ellis, 2004; Monaghan & Shillcock, 2004).The idea behind Shillcock and colleagues’ split processing model is that visual presentation of a wordleads to a projection of the left and right part of the word to the right and left hemisphere, respec-tively, and that this initial asymmetry has downstream cognitive consequences for visual word recog-nition. This is clearly related to the numerical–spatial associations formed in our model due to lifetimeexperience with number. More recently, visual gradients have been proposed to be important in objectprocessing also (Hsiao, Shieh, & Cottrell, 2008).
One advantage of proposing similar models across domains is that the different models can produc-tively interact in accounting for similar findings across domains. An example is the cross-over effectalready mentioned in Simulation 8. Different explanations have been put forth to account for the effectin physical neglect (Monaghan & Shillcock, 1998, 2004), the simplest of which is that subjects have asmall bias toward the left visual field. This would then result in a small bias for all line lengths towardthe left in control subjects (e.g., Halligan & Marshall, 1998). At the same time, in neglect patients itwould result in a small bias toward the left for small line lengths only (cross-over), because the left-ward bias in these subjects is compensated by the increasingly larger rightward bias in larger linelengths. Although providing a detailed explanation for the cross-over effect is beyond the scope ofthe present paper, we note here that this hypothesis can easily be implemented in our model for bothphysical line and number line bisection.
In our and other models (e.g., Monaghan & Shillcock, 2004; Pouget & Sejnowski, 2001) a lesion ofright hLIP was introduced to model neglect patients. However, this must not necessarily be taken lit-erally. In fact, as reviewed by Corbetta and Shulman (2002), a lesion of the temporal–parietal junction(TPJ) is often the critical factor for neglect onset, possibly also for the varieties of neglect that werediscussed in the current paper. These authors proposed that a disturbance in this area leads to imbal-ances between the two hemispheres, and in particular between more dorsal (parietal) spatial repre-sentations. Hence, even though the TPJ region itself does not contain spatial representations, at afunctional level a lesion in this area leads to the spatial imbalances typical for neglect. For simplicitywe have here assumed that the spatial representations itself were damaged. Future modeling incor-porating TPJ explicitly is expected to lead to more fine-grained insights into different aspects of ne-glect. Relevant aspects here are its hemispheric asymmetry (right parietal lesions lead to neglectmore often than left parietal lesions), its time course, and distinction between acute and chronic phase(Corbetta & Shulman, 2002).
13. Conclusion
We have presented a model of how number and space interact; this model was able to account for aseries of data in both healthy and patient populations. The model suggests that the mental numberline is an emergent property from interactions between different brain areas. Specifically, this inter-action depends on culturally acquired associations between a non-spatial numerical system and a spa-tial representational system.
Acknowledgments
Author’s addresses: [email protected], [email protected]. QC and TV were supported by aBOF grant from Ghent University awarded to QC. The authors thank Axel Cleeremans, Wim Gevers,Wim Fias, Magda Osman, Bert Reynvoet, Patrick Santens, and Jean-Philippe Van Dijck for useful com-ments on this work.
Q. Chen, T. Verguts / Cognitive Psychology 60 (2010) 218–240 237
Appendix
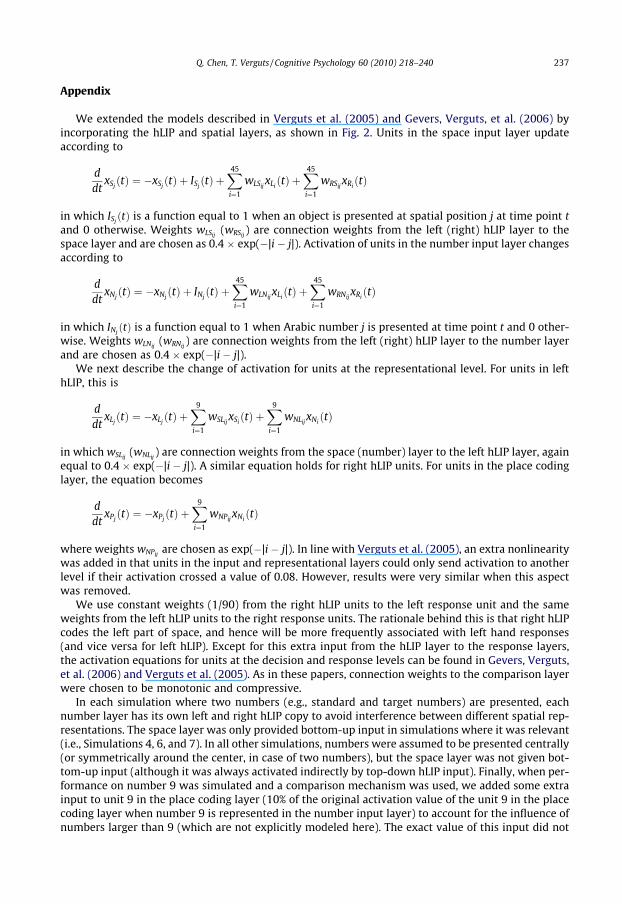
We extended the models described in Verguts et al. (2005) and Gevers, Verguts, et al. (2006) byincorporating the hLIP and spatial layers, as shown in Fig. 2. Units in the space input layer updateaccording to
ddt
xSjðtÞ ¼ �xSj
ðtÞ þ ISjðtÞ þ
X45
i¼1
wLSijxLiðtÞ þ
X45
i¼1
wRSijxRiðtÞ
in which ISjðtÞ is a function equal to 1 when an object is presented at spatial position j at time point t
and 0 otherwise. Weights wLSij(wRSij
) are connection weights from the left (right) hLIP layer to thespace layer and are chosen as 0.4 � exp(�|i � j|). Activation of units in the number input layer changesaccording to
ddt
xNjðtÞ ¼ �xNj
ðtÞ þ INjðtÞ þ
X45
i¼1
wLNijxLiðtÞ þ
X45
i¼1
wRNijxRiðtÞ
in which INjðtÞ is a function equal to 1 when Arabic number j is presented at time point t and 0 other-
wise. Weights wLNij(wRNij
) are connection weights from the left (right) hLIP layer to the number layerand are chosen as 0.4 � exp(�|i � j|).
We next describe the change of activation for units at the representational level. For units in lefthLIP, this is
ddt
xLjðtÞ ¼ �xLj
ðtÞ þX9
i¼1
wSLijxSiðtÞ þ
X9
i¼1
wNLijxNiðtÞ
in which wSLij(wNLij
) are connection weights from the space (number) layer to the left hLIP layer, againequal to 0.4 � exp(�|i � j|). A similar equation holds for right hLIP units. For units in the place codinglayer, the equation becomes
ddt
xPjðtÞ ¼ �xPj
ðtÞ þX9
i¼1
wNPijxNiðtÞ
where weights wNPijare chosen as exp(�|i � j|). In line with Verguts et al. (2005), an extra nonlinearity
was added in that units in the input and representational layers could only send activation to anotherlevel if their activation crossed a value of 0.08. However, results were very similar when this aspectwas removed.
We use constant weights (1/90) from the right hLIP units to the left response unit and the sameweights from the left hLIP units to the right response units. The rationale behind this is that right hLIPcodes the left part of space, and hence will be more frequently associated with left hand responses(and vice versa for left hLIP). Except for this extra input from the hLIP layer to the response layers,the activation equations for units at the decision and response levels can be found in Gevers, Verguts,et al. (2006) and Verguts et al. (2005). As in these papers, connection weights to the comparison layerwere chosen to be monotonic and compressive.
In each simulation where two numbers (e.g., standard and target numbers) are presented, eachnumber layer has its own left and right hLIP copy to avoid interference between different spatial rep-resentations. The space layer was only provided bottom-up input in simulations where it was relevant(i.e., Simulations 4, 6, and 7). In all other simulations, numbers were assumed to be presented centrally(or symmetrically around the center, in case of two numbers), but the space layer was not given bot-tom-up input (although it was always activated indirectly by top-down hLIP input). Finally, when per-formance on number 9 was simulated and a comparison mechanism was used, we added some extrainput to unit 9 in the place coding layer (10% of the original activation value of the unit 9 in the placecoding layer when number 9 is represented in the number input layer) to account for the influence ofnumbers larger than 9 (which are not explicitly modeled here). The exact value of this input did not
238 Q. Chen, T. Verguts / Cognitive Psychology 60 (2010) 218–240
qualitatively change the results. All activation equations are implemented by Euler’s method with atime step of 0.01.
In Simulations 6 and 7, a physical line is represented as a string of 1’s at the space input layer(Monaghan & Shillcock, 1998). For example, a physical line length 3 presented at the center of thespace layer is encoded as 000111000. A numerical interval to be bisected is represented in a similarway in the numerical input layer. The model is trained with all (physical or number) line lengths from1 to 9. The central location of the line can be anywhere on the input layer as long as the line can becompletely represented (e.g., the central location can be at the leftmost input unit only for lines oflength 1). In the Widrow–Hoff training procedure, the target output representation was identical tothe input representation (cf. Monaghan & Shillcock, 2004).
To fit the simulated data on the empirical data, linear regression was used as in Verguts et al.(2005). Specifically, simulated RT was used as an independent variable to predict observed RT (depen-dent variable). The predictions based on this regression are shown in the plots. The same qualitativetrends were obtained when the regression was not performed.
References
Andersen, R. A., Asanuma, C., Essick, G., & Siegel, R. M. (1990). Corticocortical connections of anatomically and physiologicallydefined subdivisions within the inferior parietal lobule. Journal of Comparative Neurology, 296, 65–113.
Banks, W. P. (1977). Encoding and processing of symbolic information in comparative judgments. In G. H. Bower (Ed.). Thepsychology of learning and motivation (Vol. 11, pp. 101–159). New York: Academic Press.
Barsalou, L. W. (1999). Perceptual symbol systems. Behavioral and Brain Sciences, 22, 577–609.Calabria, M., & Rossetti, Y. (2005). Interference between number processing and line bisection: A methodology.
Neuropsychologia, 43, 779–783.Campbell, J. I. D. (1994). Architecture for numerical cognition. Cognition, 53, 1–44.Chafee, M. V., & Goldman-Rakic, P. S. (2002). Inactivation of parietal and prefrontal cortex reveals interdependence of neural
activity during memory-guided saccades. Journal of Neurophysiology, 83(3), 1550–1566.Chiao, J. Y., Bordeaux, A. R., & Ambaby, N. (2004). Mental representations of social status. Cognition, 93, 49–57.Corbetta, M., & Shulman, G. L. (2002). Control of goal-directed and stimulus-driven attention in the brain. Nature Review
Neuroscience, 3, 201–215.Dehaene, S. (1997). The number sense: How the mind creates mathematics. New York: Oxford University Press.Dehaene, S. (2007). Symbols and quantities in parietal cortex: Elements of a mathematical theory of number representation and
manipulation. In P. Haggard & Y. Rossetti (Eds.), Attention and performance XXII. Sensori-motor foundations of higher cognition.Cambridge, Mass: Harvard University Press.
Dehaene, S., Bossini, S., & Giraux, P. (1993). The mental representation of parity and magnitude. Journal of ExperimentalPsychology: General, 122, 371–396.
Dehaene, S., & Changeux, J.-P. (1993). Development of elementary numerical abilities: A neuronal model. Journal of CognitiveNeuroscience, 5, 390–407.
Dehaene, S., & Cohen, L. (1995). Towards an anatomical and functional model of number processing. Mathematical Cognition, 1,83–120.
Dehaene, S., & Cohen, L. (1997). Cerebral pathways for calculation: Double dissociation between rote verbal and quantitativeknowledge of arithmetic. Cortex, 33, 219–250.
Dehaene, S., & Cohen, L. (2007). Cultural recycling of cortical maps. Neuron, 56(2), 384–398.Dehaene, S. (1992). Varieties of numerical abilities. Cognition, 44, 1–42.Dehaene, S., Piazza, M., Pinel, P., & Cohen, L. (2003). Three parietal circuits for number processing. Cognitive Neuropsychology, 20,
487–506.Dehaene, S., Spelke, E., Pinel, P., Stanescu, R., Pinel, P., & Tsivkin, S. (1999). Sources of mathematical thinking: Behavioral and
brain-imaging evidence. Science, 284, 970–974.Den Heyer, K., & Briand, K. (1986). Priming single digit numbers: Automatic spreading activation dissipates as a function of
numerical distance. American Journal of Psychology, 99, 315–340.Doricchi, F., Guariglia, P., Gasparini, M., & Tomaiuolo, F. (2005). Dissociation between physical and mental number line bisection
in right hemisphere brain damage. Nature Neuroscience, 8, 1663–1665.Eger, E., Sterzer, P., Russ, M. O., Giraud, A.-L., & Kleinschmidt, A. (2003). A supramodal number representation in human
intraparietal cortex. Neuron, 37, 719–725.Estes, Z., Verges, M., & Barsalou, L. W. (2008). Head up, foot down: Object words orient attention to the objects’ typical location.
Psychological Science, 19, 93–97.Fias, W., Brysbaert, M., Geypens, F., & d’Ydewalle, G. (1996). The importance of magnitude information in numerical processing:
Evidence from the SNARC effect. Mathematical Cognition, 2, 95–110.Fischer, M. H., Castel, A. D., Dodd, M. D., & Pratt, J. (2003). Perceiving numbers causes spatial shifts of attention. Nature
Neuroscience, 6, 555–556.Fisher, M. H. (2001). Number processing induces spatial performance biased. Neurology, 57, 822–826.Gallistel, C. R., & Gelman, R. (1992). Preverbal and verbal counting and computation. Cognition, 44, 43–74.Galton, F. (1880). Visualised numerals. Nature, 21, 252–256.Gevers, W., Santens, S., D’Hooge, E., Chen, Q., Van den Bossche, L., Fias, W., et al (in press). Verbal-spatial and visuo-spatial
coding of number-space interactions. Journal of Experimental Psychology: General.
Q. Chen, T. Verguts / Cognitive Psychology 60 (2010) 218–240 239
Gevers, W., Ratinckx, E., De Baene, W., & Fias, W. (2006). Further evidence that the SNARC effect is processed along a dual-routearchitecture: Evidence from the lateralized readiness potential. Experimental Psychology, 53(1), 58–68.
Gevers, W., Verguts, T., Reynvoet, B., Caessens, B., & Fias, W. (2006). Numbers and space: A computational model of the SNARCeffect. Journal of Experimental Psychology: Human Perception & Performance, 32, 32–44.
Göbel, S. M., Calabria, M., Farne, A., & Rossetti, Y. (2006). Parietal rTMS distorts the mental number line: Simulating ‘spatial’neglect in healthy subjects. Neuropsychologia, 44, 860–868.
Goldman-Rakic, P. S. (1987). Circuitry of primate prefrontal cortex and regulation of behavior by representational memory. In F.Plum (Ed.), Handbook of physiology, section I: The nervous system (pp. 373–417). Bethesda, MD: American PhysiologicalSociety.
Gottlieb, J. (2007). From thought to action: The parietal cortex as a bridge between perception, action, and cognition. Neuron, 53,9–16.
Grainger, J., & Jacobs, A. M. (1996). Orthographic processing in visual word recognition: A multiple read-out model. PsychologicalReview, 103, 518–565.
Grefkes, C., & Fink, G. R. (2005). The functional organization of the intraparietal sulcus in humans and monkeys. Journal ofAnatomy, 207, 3–17.
Hadamard, J. (1954). The psychology of invention in the mathematical field. New York, NY: Dover Publications.Hagmann, P., Cammoun, L., Gigandet, X., Meuli, R., Honey, C. J., Wedeen, Van J., et al (2008). Mapping the structural core of
human cerebral cortex. PLoS: Biology, 6, 1479–1493.Halligan, P. W., & Marshall, J. C. (1998). Visuospatial neglect: The ultimate deconstruction? Brain and Cognition, 37, 419–438.Hedden, T., Ketay, S., Aron, A., Markus, H., & Gabrieli, J. D. E. (2008). Cultural influences on neural substrates of attentional
control. Psychological Science, 19, 12–17.Hsiao, J. H. W., Shieh, D. X., & Cottrell, G. W. (2008). Convergence of the visual field split: Hemispheric modeling of face and
object perception. Journal of Cognitive Neuroscience, 20, 2298–2307.Hubbard, E. M., Piazza, M., Pinel, P., & Dehaene, S. (2005). Interactions between number and space in parietal cortex. Nature
Reviews Neuroscience, 6, 435–448.Hubbard, E. M., & Ramachandran, V. S. (2005). Neurocognitive mechanisms of synesthesia. Neuron, 48, 509–520.Husain, M., & Nachev, P. (2007). Space and the parietal cortex. Trends in Cognitive Sciences, 11, 30–36.Kinsbourne, M. (1987). Mechanisms of unilateral neglect. In M. Jeannerod (Ed.), Neurophysiological and neuropsychological
aspects of unilateral neglect (pp. 69–86). Amsterdam, Netherlands: Elsevier.Kohonen, T. (1982). Self-organized formation of topologically correct feature maps. Biological Cybernetics, 43, 55–69.LaBerge, D., Auclair, L., & Sieroff, E. (2000). Preparatory attention: Experiment and theory. Consciousness and Cognition, 9,
396–434.Lavidor, M., Hayes, A., Shillcock, R., & Ellis, A. W. (2004). Evaluating a split processing model of visual word recognition: Effects
of orthographic neighborhood size. Brain and Language, 88, 312–320.Longo, M. R., & Lourenco, S. F. (2007). Spatial attention and the mental number line: Evidence for characteristic biases and
compression. Neuropsychologia, 45, 1400–1407.Makioka, S. (2009). A self-organizing learning account of number-form synaesthesia. Cognition, 112, 397–414.Marshall, J. C., & Halligan, P. W. (1990). Line bisection in a case of visual neglect: Psychophysical studies with implications for
theory. Cognitive Neuropsychology, 7, 107–130.McCloskey, M. (1992). Cognitive mechanisms in numerical processing: Evidence from acquired dyscalculia. Cognition, 44,
107–157.McCloskey, M., Caramazza, A., & Basili, A. (1985). Cognitive mechanism in number processing and calculation: Evidence from
dyscalculia. Brain and Cognition, 4, 171–196.Mesulam, M.-M. (1981). A cortical network for directed attention and unilateral neglect. Annals of Neurology, 10, 309–325.Monaghan, P., & Shillcock, R. (1998). The cross-over effect in unilateral neglect modeling detailed data in the line-bisection task.
Brain, 121, 907–921.Monaghan, P., & Shillcock, R. (2004). Hemispheric asymmetries in cognitive modeling: Connectionist modeling of unilateral
visual neglect. Psychological Review, 111, 283–308.Moyer, R. S., & Landauer, T. K. (1967). Time required for judgments of numerical inequality. Nature, 215, 1519–1520.Nieder, A., Freedman, D. J., & Miller, E. K. (2002). Representation of the quantity of visual items in the primate prefrontal cortex.
Science, 297, 1708–1711.Nieder, A., & Miller, E. K. (2004). A parieto-frontal network for visual numerical information in the monkey. Proceedings of the
National Academy of Sciences, 101, 7457–7462.Nisbett, R. E., Peng, K., Choi, I., & Norenzayan, A. (2001). Culture and systems of thought: Holistic vs. analytic cognition.
Psychological Review, 108, 291–310.Notebaert, W., Gevers, W., Verguts, T., & Fias, W. (2006). Shared spatial representations for numbers and space: The reversal of
the SNARC and Simon effects. Journal of Experimental Psychology: Human Perception & Performance, 32, 1197–1207.Oliveri, M., Rausei, V., Torriero, S., Turriziani, P., & Caltagirone, C. (2004). Overestimation of numerical distances in the left side of
space. Neurology, 63, 2139–2141.Piazza, M., Izard, V., Pinel, P., Le Bihan, D., & Dehaene, S. (2004). Tuning curves for approximate numerosity in the human
intraparietal sulcus. Neuron, 44, 547–555.Piazza, M., Pinel, P., & Dehaene, S. (2006). Objective correlates of an unusual subjective experience: A single-case study of
number-form synaesthesia. Cognitive Neuropsychology, 23, 1162–1173.Piazza, M., Pinel, P., Le Bihan, D., & Dehaene, S. (2007). A magnitude code common to numerosities and number symbols. Neuron,
53, 293–305.Pica, P., Lemer, C., Izard, V., & Dehaene, S. (2004). Exact and approximate arithmetic in an Amazonian indigene group. Science,
306(5695), 499–503.Plaut, D. C. (2003). Interpreting double dissociations in connectionist networks. Cortex, 39, 138–141.Plaut, D. C., & Shallice, T. (1993). Deep dyslexia: A case study of connectionist neuropsychology. Cognitive Neuropsychology, 10,
377–500.

240 Q. Chen, T. Verguts / Cognitive Psychology 60 (2010) 218–240
Posner, M. I. (1980). Orienting of attention. The Quarterly Journal of Experimental Psychology, 32, 3–25.Posner, M. I., & Petersen, S. E. (1990). The attention system of the human brain. Annual Review of Neuroscience, 13, 25–42.Pouget, A., & Sejnowski, T. J. (2001). Simulating a lesion in a basis function model of spatial representation: Comparison with
hemineglect. Psychological Review, 108, 653–673.Priftis, K., Zorzi, M., Meneghello, F., Marenzi, R., & Umilta, C. (2006). Explicit versus implicit processing of representational space
in neglect: Dissociations in accessing the mental number line. Journal of Cognitive Neuroscience, 18, 680–688.Ramachandran, V., & Hubbard, E. M. (2001). Synaesthesia – A window into perception, thought, and language. Journal of
Consciousness Studies, 8, 3–34.Ranzini, M., Dehaene, S., Piazza, M., & Hubbard, E. M. (2009). Neural mechanisms of attentional shifts due to irrelevant spatial
and numerical cues. Neuropsychologia, 47, 2615–2624.Reynvoet, B., & Brysbaert, M. (1999). Single-digit and two-digit numerals address the same semantic number line. Cognition, 72,
191–201.Reynvoet, B., & Brysbaert, M. (2004). Cross-notation number priming investigated at different stimulus onset asynchronies in
parity and naming tasks. Experimental Psychology, 51, 81–90.Reynvoet, B., Brysbaert, M., & Fias, W. (2002a). Semantic priming in number naming. Quarterly Journal of Experimental
Psychology, 55, 1127–1139.Reynvoet, B., Caessens, B., & Brysbaert, M. (2002b). Automatic stimulus-response associations may be semantically mediated.
Psychonomic Bulletin & Review, 9, 107–112.Ristic, J., Wright, A., & Kingstone, A. (2006). The number line effect reflects top-down control. Psychonomic Bulletin & Review, 13,
862–868.Roggeman, C., Verguts, T., & Fias, W. (2007). Priming reveals differential coding of symbolic and non-symbolic quantities.
Cognition, 105, 380–394.Roitman, J. D., Brannon, E. M., & Platt, M. L. (2007). Monotonic coding of numerosity in macaque lateral intraparietal area. PLoS
Biology, 5, 1672–1682.Rossetti, Y., Jacquin-Courtois, S., Rode, G., Ota, H., Michel, C., & Boisson, D. (2004). Does action make the link between number
and space representation? Psychological Science, 15, 426–430.Sagiv, N., Simner, J., Collins, J., Butterworth, B., & Ward, J. (2006). What is the relationship between synaesthesia and visuo-
spatial number forms? Cognition, 101, 114–128.Santens, S., Roggeman, C., Fias, W., & Verguts, T. (2010). Number processing pathways in human parietal cortex. Cerebral Cortex,
20, 77–88.Schwarz, W., & Stein, F. (1998). On the temporal dynamics of digit comparison processes. Journal of Experimental Psychology:
Learning, Memory, & Cognition, 24, 1275–1293.Sereno, M. I., Pitzalis, S., & Martinez, A. (2001). Mapping of contralateral space in retinotopic coordinates by a parietal cortical
area in humans. Science, 294, 1350–1354.Shaki, S., & Fischer, M. H. (2008). Reading space into numbers – A cross-linguistic comparison of the SNARC effect. Cognition,
108(2), 590–599.Shaki, S., Fischer, M. H., & Petrusic, W. M. (2009). Reading habits for both words and numbers contribute to the SNARC effect.
Psychonomic Bulletin and Review, 16(2), 328–331.Shillcock, R., Ellison, T. M., & Monaghan, P. (2000). Eye-fixation behaviour, lexical storage and visual word recognition in a split
processing model. Psychological Review, 107, 824–851.Sparks, D. (1991). Sensorimotor integration in the primate superior colliculus. Seminars in the Neurosciences, 3, 39–50.Tang, Y. Y., Zhang, W. T., Chen, K. W., Feng, S. G., Ji, Y., Shen, J. X., et al (2006). Arithmetic processing in the brain shaped by
cultures. Proceedings of the National Academy of Sciences, 103(28), 10775–10780.Van Dijck, J. P., Gevers, W., & Fias, W. (2009). Numbers are associated with different types of spatial information depending on
the task. Cognition, 113, 248–253.Van Opstal, F., Gevers, W., De Moor, W., & Verguts, T. (2008). Dissecting the symbolic distance effect: Comparison and priming
effects in numerical and non-numerical orders. Psychonomic Bulletin & Review, 15, 419–425.Verguts, T., & Fias, W. (2004). Representation of number in animals and humans: A neural model. Journal of Cognitive
Neuroscience, 16, 1493–1504.Verguts, T., & Fias, W. (2008). Symbolic and nonsymbolic pathways of number processing. Philosophical Psychology, 21, 539–554.Verguts, T., Fias, W., & Stevens, M. (2005). A model of exact small-number representation. Psychonomic Bulletin & Review, 12,
66–80.Vinckier, F., Dehaene, S., Jobert, A., Dubus, J., Sigman, M., & Cohen, L. (2007). Hierarchical coding of letter strings in the ventral
stream: Dissecting the inner organization of the visual word-form system. Neuron, 55, 143–156.Vuilleumier, P., Ortigue, S., & Brugger, P. (2004). The number space and neglect. Cortex, 40, 399–410.Walsh, V. (2003). A theory of magnitude: Common cortical metrics of time, space, and quantity. Trends in Cognitive Sciences, 7,
483–488.Weiskrantz, L. (1998). Pupillary responses with and without awareness in blindsight. Consciousness and Cognition, 7(3),
324–326.Zebian, S. (2005). Linkages between Number concepts, spatial thinking, and directionality of writing: The SNARC effect and the
REVERSE SNARC effect in English and Arabic monoliterates, biliterates, and illiterate Arabic speakers. Journal of Cognitionand Culture, 5, 165–190.
Zorzi, M., Priftis, K., Meneghello, F., Marenzi, R., & Umiltà, C. (2006). The spatial representation of numerical and non-numericalsequences: Evidence from neglect. Neuropsychologia, 44, 1061–1067.
Zorzi, M., Priftis, K., & Umiltà, C. (2002). Neglect disrupts the mental number line. Nature, 417, 138–139.