
SPATIAL DISTRIBUTION OF SOIL PHOSPHORUS ACROSS SELECTED NEW YORK DAIRY FARM PASTURES AND HAY FIELDS
14
0038-075X/07/17210-797-8 10 October 2007 Soil Science Vol. 172, No, 10 Copyright © 2007 by Lippincott Williatits & Wilkins, Inc Printed in U.S.A. SPATIAL DISTRIBUTION OF SOIL PHOSPHORUS ACROSS SELECTED NEW YORK DAIRY FARM PASTURES AND HAY FIELDS Chad J. Penn', Ray B. Bryant 2, Brian Needelman 3 , and Peter Kleinman2 Despite concerns that traditional soil sampling strategies are insuffi- cient for assessing risk of surface water P contamination, there is no consensus that changes to these strategies, such as spatially explicit or discrete soil sampling within a field, represent enough of an improve- ment to justify the added cost. We conducted a study on four fields located on two dairy farms in Delaware County, New York, to characterize the spatial variability of P, Ca, Mg, Al, and Fe within two pastures and two hay fields at a 10-ni scale and to interpret soil test P distribution relative to landscape and cultural practices. Pasture P distribution was characterized by various P "hot spots" that may be indicative of manure deposits by grazing animals. Hay fields contained large areas with elevated P relative to the rest of the field, with high-P areas occurring mostly near the gate and road where manure applica- tions would be most accessible. Differences in soil properties associated with different soil map units also appear to partially explain P and Fe distributions in the mixed hay field. Results from a rainfall simulation study suggest that the use of a composite sampling strategy or an average P value for an entire field can potentially mask soil test P patterns such as those in the hay fields and result in an inaccurate estimation of P losses to surface waters. However, a composite sampling strategy may give a better estimation of P losses from pastures with "hot spots" because of the compositing effect whereby soluble P concentrations are affected by sorption processes that are controlled by low-P sediments. (Soil Science 2007;172:797-810) Key words: Water quality, nutrient distribution, phosphorus spatial variability, manure management, phosphorus in pastures. M ANAGING P in soils is of concern to water quality protection, as losses of P in surface runoff can accelerate the eutrophication of surface waters (Carpenter et al., 1998; Correll, 1998). Most agronomic soil tests are well correlated with dissolved and sediment-bound P in surface runoff (Sharpley, 1995; Vadas et al., 2005; Penn et al., 2006), as well as with dis- solved P in leachate (13eauchemin et al., 1998; 'Department Of Plant and Soil Sciences, Oklahoma State Uninersity, Strlhnater, OK 74078. Dr. Penn is cor,esponding author. Email. [email protected] 2USDA-ARS, Pasture Systems and Watershed Management Research Unit, Unruenmity Pa,h, PA 16802. 'Department of Errurrorrmental Science and Technology, Uniners,ty, oF Maryland, College Par5, MD 20742. Received Non. 17, 2006; accepted May 2, 207. 001. 10.10971SS.ObOl3e3l8OdOa3cO 797 Maguire and Sims, 2002). Thus, fate-and- transport models and P site assessment indexes typically include some measure of soil test I' (STP) as an indicator of the potential for a soil to yield P to runoff (Lemunyon and Gilbert, 1993; Vadas and Sims, 2002; Daly et al., 2002; Johnson et al., 2005). Despite the growing use of soil testing information for environmental interpretation, such as P loss potential, most soil sampling recommendations remain geared toward agro- nomic, rather than environmental, applications. For instance, sampling protocols for agricultural soils typically involve collecting and combining multiple samples from a field or a soil map unit within a field to create a single composite sample that represents an average condition for the inference area. This approach is efficient and
Transcript of SPATIAL DISTRIBUTION OF SOIL PHOSPHORUS ACROSS SELECTED NEW YORK DAIRY FARM PASTURES AND HAY FIELDS

0038-075X/07/17210-797-8 10
October 2007
Soil Science Vol. 172, No, 10
Copyright © 2007 by Lippincott Williatits & Wilkins, Inc Printed in U.S.A.
SPATIAL DISTRIBUTION OF SOIL PHOSPHORUS ACROSSSELECTED NEW YORK DAIRY FARM PASTURES AND HAY FIELDS
Chad J. Penn', Ray B. Bryant 2, Brian Needelman 3, and Peter Kleinman2
Despite concerns that traditional soil sampling strategies are insuffi-cient for assessing risk of surface water P contamination, there is noconsensus that changes to these strategies, such as spatially explicit ordiscrete soil sampling within a field, represent enough of an improve-ment to justify the added cost. We conducted a study on four fieldslocated on two dairy farms in Delaware County, New York, tocharacterize the spatial variability of P, Ca, Mg, Al, and Fe within twopastures and two hay fields at a 10-ni scale and to interpret soil test Pdistribution relative to landscape and cultural practices. Pasture Pdistribution was characterized by various P "hot spots" that may beindicative of manure deposits by grazing animals. Hay fields containedlarge areas with elevated P relative to the rest of the field, with high-Pareas occurring mostly near the gate and road where manure applica-tions would be most accessible. Differences in soil properties associatedwith different soil map units also appear to partially explain P and Fedistributions in the mixed hay field. Results from a rainfall simulationstudy suggest that the use of a composite sampling strategy or an averageP value for an entire field can potentially mask soil test P patterns such asthose in the hay fields and result in an inaccurate estimation of P losses tosurface waters. However, a composite sampling strategy may give abetter estimation of P losses from pastures with "hot spots" because ofthe compositing effect whereby soluble P concentrations are affected bysorption processes that are controlled by low-P sediments. (Soil Science2007;172:797-810)
Key words: Water quality, nutrient distribution, phosphorus spatialvariability, manure management, phosphorus in pastures.
MANAGING P in soils is of concern to waterquality protection, as losses of P in surface
runoff can accelerate the eutrophication ofsurface waters (Carpenter et al., 1998; Correll,1998). Most agronomic soil tests are wellcorrelated with dissolved and sediment-boundP in surface runoff (Sharpley, 1995; Vadas et al.,2005; Penn et al., 2006), as well as with dis-solved P in leachate (13eauchemin et al., 1998;
'Department Of Plant and Soil Sciences, Oklahoma State Uninersity, Strlhnater,OK 74078. Dr. Penn is cor,esponding author. Email. [email protected]
2USDA-ARS, Pasture Systems and Watershed Management Research Unit,Unruenmity Pa,h, PA 16802.
'Department of Errurrorrmental Science and Technology, Uniners,ty, oF Maryland,College Par5, MD 20742.
Received Non. 17, 2006; accepted May 2, 207.
001. 10.10971SS.ObOl3e3l8OdOa3cO
797
Maguire and Sims, 2002). Thus, fate-and-transport models and P site assessment indexestypically include some measure of soil test I'(STP) as an indicator of the potential for a soil toyield P to runoff (Lemunyon and Gilbert, 1993;Vadas and Sims, 2002; Daly et al., 2002;Johnson et al., 2005).
Despite the growing use of soil testinginformation for environmental interpretation,such as P loss potential, most soil samplingrecommendations remain geared toward agro-nomic, rather than environmental, applications.For instance, sampling protocols for agriculturalsoils typically involve collecting and combiningmultiple samples from a field or a soil map unitwithin a field to create a single compositesample that represents an average condition forthe inference area. This approach is efficient and

798 PENN, ET AL. SOIL SCIENCE
parsimonious because it accounts for variabilityin soil nutrient content through mixing ofspatially separate soil samples yet generates onlyone sample (as opposed to 10-20 samples) to beprocessed and analyzed for agronomic interpre-tation. However, this type of sampling protocolcan mask differences in nutrient status related tomanagement that may he important for environ-mental interpretation. There is growing concernthat composite sampling may not be adequate todescribe hot spots in agricultural landscapes thatare of critical importance to nonpoint sourcepollution (Larson et al., 1997).
A variety of studies have examined spatialvariability in STP (e.g., Raun et al., 1998; Solieetal., 1999; Daniels et al., 2001; Needelman etal.,2001; Juang et al., 2002). These studies point tolarge variability in STP across agricultural land-scapes and within agricultural fields. For instance,Sauer and Meek (2003) conducted grid samplingof three pastures receiving periodic applicationsOf poultry litter, finding that Mehlich-3 P(M3-P) concentrations were unevenly distrib-uted, with values for individual samples rangingfrom 5 to 117 mg kg 1 in a field consideredrelatively low in STP. Values for individualsamples ranged from 184 to 656 mg kg -1 in afield considered high in STP. However, notonly are these types of spatial studies rare, mosthave focused on conventional row crops, andnone have been designed to compare thedifferences in soil P spatial variability amongpastures and hay fields.
Within-field spatial heterogeneity in STPundoubtedly affects a field's potential for P lossin runoff Sharpley (1981) found that interac-tions in ninoff water between dissolved P andsuspended sediments were highly dynamic,resulting in changing concentrations of solutionand sediment-hound P during single events.Thus, sediments suspended in overland flow thatoriginate from different areas within a field canpotentially adsorb or desorh P as runoff flowsthrough the field. Maguire et al. (2002) foundthat interactions between different sedimentsources can be nonlinear. By incubating flux-tures of soil aggregates having different proper-ties, they found that water-soluble P (WS-P)released by one aggregate fraction could bereadsorbed by another aggregate fraction, poten-tially resulting in lower than expected solution Pconcentrations in surface waters.
Despite general concern that traditional soilsampling strategies may not provide sufficientinsight into environmentally important variation
in STP, there is no consensus that changes tothese strategies, such as spatially explicit ordiscrete soil sampling within a field, representenough of an improvement as to justify theadded cost. Indeed, Sauer and Meek (2003)found that subsampling and composite sampling(simulated by obtaining the mean of thesubsamples) produced average M3-1 1 concen-trations that did not differ substantially fromthose obtained from intensive grid sampling.Similarly, Needelman et al. (2001) concludedthat simple mean STP values for individual fieldswere nearly as accurate as ordinary kriging acrossa watershed (global model) and ordinary krigingwithin fields (within-field model).
This study was conducted to elucidate issuessurrounding the spatial variability of STP inPastures and hay fields. The objectives of thisstudy were to (i) assess and compare the spatialvariability of STP, Ca, Mg, Al, and Fe across twoPastures and two conventionally managed hayfields; (ii) interpret nutrient distribution maps andconsider landscape and cultural practices in aneffort to explain STP distribution; and (in)investigate the potential impact of observedvariability on P concentrations in runoff.
MATERIALS AND METHODS
Site DescriptionThe study was conducted in Delaware
County, New York (42 021'N, 74 052'W), whichis located in the Glaciated Allegheny Plateauand Catskill Mountain Region (Major LandResource Area 140), a subregion of the North-eastern Forage and Forest Region (Soil Con-servation Service, 1981). Farms in the watershedare predominantly dairy operations, averagingroughly 90 ha in area with approximately75 milking cows. Typical crop rotation involves3 years of silage corn followed by 5 years of alfalfaand/or mixed grasses. Many soils in the water-shed possess fragipaiis that seasonally perchshallow water tables, resulting in variable sourcearea hydrology (Needelman, et al., 2004); surfacerunoff occurs most frequently in the spring andfall (Walter et al., 2003).
Soil sampling took place on two dairy farnis.A total of four fields were selected for study:two pastures, one alfalfa hay field, and onemixed hay field. The dominant species in themixed hay field were orchard grass (Dactylis1on7crata), white clover (Tnfoliu;n repens), and
red clover (Trifoliuni pratense). The two pasturescontained the same set of mixed grasses as the .1

VOL. 172 No. 10SPATIAL DISTRIBUTION OF Soii. PHOSPHORUS 799
hay field but were dominated by orchard grass.Before soil samples were taken (2001), the alfalfafield was in corn (7—ca mays) production.
The fields were located on a Lewbeach siltloam soil map unit (coarse-loamy, mixed, semi-active, frigid Typic Fragiudepts), except forapproximately half of the mixed hay field,which included a Willowernoc silt loam mapunit (coarse-loamy, mixed, seniiactive, frigidTypic Fragiudepts). Lewbeach soils are welldrained, whereas Willoweinoc soils are moder-ately well drained.
All four fields were routinely amended withlime (last application was in 2000). Pasture I didnot receive any recent manure applications(other than direct deposits from grazing cattle),whereas Pasture 2 historically received regulariiianure applications before it was convertedfrom a hay field Into a pasture as part of anintensively managed rotationally grazed system.This conversion from hay to pasture took place2 years before sampling. Both hay fields receivedregular dairy manure applications.
Soil Sampling, Preparation, and Chemical Analysis
Each field was sampled by taking duplicatesoil core samples (0-5 cm) at 100 gcoreferencedsites on a 10-ni grid. Soil samples were air-dried,ground, and sieved (2 mm) before analysis.Individual soil samples (200 from each field)were extracted for P with Mehlich-3 and water.Meblich-3 extractions were conducted byshaking 2 g of air dried soil with 20 ml-of Mehlich-3 solution (0.2 M C14 3COOH +0.25 M NH 4 NO3 + 0.015 M NH 4 F + 0.13 MHNO3 + 0.001 M El)TA) end over end for5 rnin followed by filtration with WhatmanNo. I paper (Meblich, 1984). All Mehlich-3extracts were analyzed for P, Al, Fe, Ca, and Mgby inductively coupled plasma atomic emissionspectroscopy (I CP-AES). Water extractionswere conducted by shaking 2 g of air dried soilwith 20 niL of deionized water end over end for1 h, followed by centrifuging 1800g at 5 mm)and filtering with 0.45-tam membranes. Allwater extracts were analyzed for P by theMurphy-Riley colorimetric method (Murphyand Riley, 1962).
Simulated RainJll Stud)'
An indoor rainfall simulation study wasconducted to investigate runoff dissolved reac-tive P (l)RP) concentrations from boxes con-taining different combinations of surface soils(0-20 cm) with similar properties except for
substantially different M3-P concentrations.The two soil materials were collected from theU.S. Department of Agriculture—AgriculturalResearch Services FD-36 watershed, a site ofintensive P investigation located in south centralPennsylvania. The selected soils were both fromBerks channery loam soils (loamy-skeletal,mixed, active, mesic Typic Dystrudepts) withM3-P values of 220 (high P) and 18 (Tow P) mgkg . The surface horizon of the Berks soils areof similar texture (silt loam) to the Lewbeachand Willowemoc soils examined in the fieldstudy. Soils were air-dried and coarsely sieved(1.4 cm) before mixing. To ensure homogeneityof the individual soils, the effectiveness ofmixing was evaluated by conducting M3-13extraction on 6 subsamples from each soil anddetermining the coefficient of variation (CV =S.D. divided by mean M3-11' concentration) foreach soil. For both soils, the CV was less than0.05. After mixing, soils were packed intoshallow runoff boxes (200 cm long, 100 cmwide, and 5 cm deep) to achieve an approximatehulk density of 1.3 to 1.5 g cm3.
Treatments "high" (H) and "low" (L) eachconsisted of pure high- and low-P soils withineach box, respectively. However, treatments"low/high" (L/H) and "high/low" (H/L) con-sisted of both the high- and low-P soils withinthe same box, with one soil occupying theupslope half and the other soil occupying thedownslope half. For convention, the first letter ofa treatment identifies the soil placed in theupslope portion of a runoff box. Thus, the L/Htreatment was prepared by dividing the runoffbox in the middle with a plastic divider andplacing low-P Berks soil on the upslope side andhigh-P Berks soil on the downslope side. Afterboth soils were poured into place, the plasticdivider was removed. Preparation for the H/Ltreatment was the same except that high-P Berkssoil was placed on the upslope side and low-P soilwas placed on the downslope side. All treatmentcombinations were replicated four times.
All rainfall simulations were conductedusing the National Phosphorus Research ProjectRainfall Simulator Protocol (Kleinman andSharpley, 2003). Rainfall was applied with asingle Teejet 2Hl-{-SS50WSQ nozzle (SprayingSystems Co., Wheaton, IL) located at 2.5 mabove the soil to reach terminal velocity. Therainfall simulator itself consists of a 3 x 3 x 3-maluminum frame. Rainfall was applied with auniformity greater than 85% at an averageintensity of 75 mm h -1 until 30 inin of runoff

800 PENN, ET AL. SOIL SCIENCE
was obtained. Local groundwater was used asthe water source for the simulator. Runoff wascollected in metal gutters at the downslope edgeof each runoff box and collected in plasticcontainers. A runoff sample was collected fromeach container after thorough agitation toresuspend and mix sediments. Dissolved reactiveP was determined on filtered samples (0.45 l.tm)and measured using Murphy and Riley's (1962)colorimetric method.
Statistical Analysis
To determine the degree of spatial autocor-relation within each field, isotropic semivario-grams were created (hereafter referred to asvariogra;ns) for all variables using S-Plus S+Spa-tialStats (MathSoft, 1996, 1997). For the Pvariables, the nugget variance (variance at zerodistance) was calculated as half the mean squareddifference between adjacent samples. The nuggetrepresents measurement error plus spatial varia-tion at distances smaller than the shortestsampling interval. For the P variables, the meansemivariance of each small plot was added to thevarlograms.
Partial Mantel tests are widely used in ecologyto correct for spatial autocorrelation effects whendetermining the correlation between variables(Legendre and Fortin, 1989; Urban et al., 2002).The partial Mantel test, an extended form of thesimple Mantel test, estimates partial correlation.This test can be run using three or moredissimilarity matrices in a multiple regressionframework (Smouse et al., 1986). The magnitudeof correlation independent of spatial autocorrcla-tion is estimated using the Mantel r statistic,which is bounded between — 1 and I and iscomparatively small, even for statistically signifi-cant variables. A permutation test is used tocalculate the significance of Mantel r, because theelements of a distance matrix are not indepen-dent. During the permutation test, the rows andcolumns of the distance matrices are rearrangedto recompute the Mantel r.
Routines to run the partial Mantel test in 5-Plus were obtained from Urban et al. (2002).Partial Mantel tests were carried out separatelyfor independent variables M3-P and WS-Pusing dependent variables Ca, Al, Fe, and Mg(in each case including geographic distance).The statistical significance of Mantel r wasestimated using 10,000 permutations. Depen-dent variables were added in a procedureanalogous to forward stepwise multiple regres-sion. The variable with the largest individual
partial Mantel r was added first; additionalvariables to add were chosen by determiningwhich variable most decreased the P value of theoverall partial Mantel test. All means, CVanalysis, and correlation procedures were deter-mined using the standard procedures of SASInstitute (1998). Data were tested for normality(Kolmogorov-Smirnov statistic, n > 50) and"skewness" by the UNIVAR.IATE procedureof SAS. Results of the normality test indicatedthat two fields (Pasture 2 and alfalfa) failed withregard to M3-P soil concentrations. However,based on the "skewness" parameter and visualobservation of the normal probability plots andbox plots, no data transformation for those twofields was conducted.
RESULTS AND DISCUSSION
Mean Soil P Concentrations
All fields possessed elevated soil P levels,despite variable land use and managementhistories (Table 1). Mean M3-P concentrationsof all four fields exceeded the crop requirementthreshold of 50 mg P kg 1 identified by Beegle(2002), and the means from three of the fieldsexceeded the water quality protection thresholdof 150 mg kg -1 proposed by Sims et al. (2002).The elevated M3-P concentrations primarilyreflect historical application of manure on thefields. The lowest M3-P concentrations werefound in the pasture soils, presumably becausethey had not received manure applications(other than deposits from grazing dairy cows)for at least 2 years before sampling. Mehlich-3 Pvalues were significantly correlated to soil WS-Pconcentrations for all fields (Pasture 1, Pasture 2,alfalfa, and hay fields had r values of 0.89, 0.72,0.65, and 0.50, respectively).
Soil P Spatial Autocorrelation and Distribution
Autocorrelation indicates that points closertogether are more similar than points furtherapart (i.e., points are spatially dependent, andthere are real distribution patterns). In general,M3-P for Pasture I and both hay fieldsexhibited strong autocorrelation and Pasture 2exhibited moderate autocorrelation (Fig. 1),indicating that the data for all fields are spatiallydependent and are not random at the 10-rn gridsampling scale. Although Pasture I shows strongspatial dependency, the two hay fields showgreater spatial dependence compared with thepastured fields, as indicated by the smooth slopeapproaching the sill. These results somewhat

20406080100 20406080100
5000
4000
3000
2000
1000
0C.CU0.^0Eii)
(I)
2000
1600
1200
800
400
00
VOL. 172 NO. 10SPATIAl, DIsTRIBuFION OF SOIL PHOSPHORUS 801
TABLE I
Mean, minimum, maximum. CV, and skewness for M3-P and WS-P among 100 samples collected at each site
M3-P WS-P
Site
Mean Minimum Maximum CV Skewness Mean Minimum Maximum CV Skewness----------------------------(nsg kg')
Pasture 113839586434,417.53.4124.6705.61Pasture 21560346260.1211.82.434.5620.98Alfalfa hay192124366210.8616.45.036.1350.59Mixed hay - 18711327921 -0,7116.26,236.2450.92
differ from Sauer and Meek (2003), who noted than did the other fields, whereas the alfalfa hayspatial dependence of M3-P concentrations in had a lower sill than the other fields (Fig. 1).only one of two pastures. However, Sauer and Phosphorus distributions across the two pasturesMeek (2003) may not have identified autocor- in our study indicated "hot spots" at which M3-11'relation because of the larger grid sampling scalewas elevated at several random points (Fig. 2).(30 in) used in their study. This was more evident in Pasture I than Pasture
The nugget values (y axis intercept) were 2 probably because of the more recent history ofgenerally greater for the pastures than for the hay manure applications to Pasture 2. In comparison,fields, indicating greater short-range variability, the higher degree of spatial dependence andThe Pasture I field had a greater sill value lower short- and long-range variability in the(distance at which vanance reaches a maximum) hay fields was evident in observation of M3-P
1600' 2000Alfalfa hay Mixed hay
12001600
' •
1200 •. ••800'800
400'400
0 0020406080100020406080100
Distance (m)
Fig. 1. Variograms for M3-P concentrations among 100 soil samples taken on a 1 0-m grid from four sites: Pasture 1,Pasture 2, alfalfa hay, and mixed hay.
$;ed hay 0 001F,00-o' I
North
Aspect/flowI
802 PENN, ET AL. SOIL SCIENCE
Pasture 10-140
• 141-180' 181-120
• 221-260O 261-486
Pasture 2Alfalfa• 0-140• 0-140• 141-180 • 141-180( 181-120 ' 181-120• 221-260 • 221-260• 241-268261-302
Hay• 0-140o 141-180
181-120• 221-260• 261-286
Pasture 20.
•0••.•• *
•••• o oNorth* .000
* •,. 0 Aspect/flo0 °.ME*
oOW, 0
00 0 0
o w
Alfalfa hay•o 0 • ..•
00 0 000000000 O•0° oo000'
0 0 0 009 •
Pasture 1 -
* * LhD/
Wm
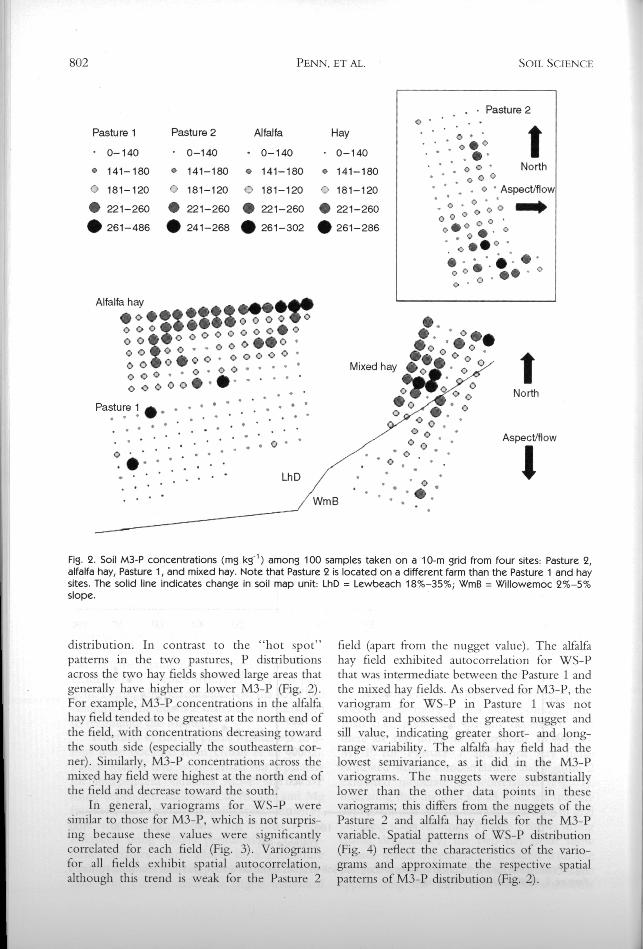
Fig. 2. Soil M3-P concentrations (mg kg- 1 ) among 100 samples taken on a 10-rn grid from four sites: Pasture 2,alfalfa hay, Pasture 1, and mixed hay. Note that Pasture 2 is located on a different farm than the Pasture 1 and haysites. The solid line indicates change in soil map unit: LhD = Lewbeach 18%-35%; WmB = Willowemoc 2%-5%slope.
distribution. In contrast to the "hot spot"patterns in the two pastures, P distributionsacross the two hay fields showed large areas thateneral1y have higher or lower M3-P (Fig. 2).
For example, M3-P concentrations in the alfalfahay field tended to be greatest at the north end ofthe field, with concentrations decreasing towardthe south side (especially the southeastern cor-icr). Similarly, M3-P concentrations across themixed hay field were highest at the north end ofthe field and decrease toward the south.
In general, variograrns for WS-P wereiniilar to those for M3-P, which is not surpns-
lug because these values were significantlycorrelated for each field (Fig. 3). Variogramsfor all fields exhibit spatial autocorrelation,ltliouth tlii trcnd is vc.ik for the P,istiirc 2
field (apart from the nugget value). The alfalfahay field exhibited autocorrelation for WS-Pthat was intermediate between the Pasture 1 andthe mixed hay fields. As observed for M3-P, thevariogram for WS-P in Pasture 1 was notsmooth and possessed the greatest nugget andsill value, indicating greater short- and long-range variability. The alfalfa hay field had thelowest semivariance, as it did in the M3-Pvariograms. The nuggets were substantiallylower than the other data points in thesevariograms; this differs from the nuggets of thePasture 2 and alfalfa hay fields for the M3-Pvariable. Spatial patterns of WS-P distribution(Fig. 4) reflect the characteristics of the vario-grams and approximate the respective spatialp.ittcrii of M3-1) distribution (Fig. 2).

250
200
150
100
50
0C.0cci>
Eci)C')
45
4035
30
25
20
15
105
00
70
60
50
40
30
20
10
0100020
Distance (m)20406080 406080100
60
50
40
30
20
10
0204060801000 20406080100
VOL. 172 No. 10SPATIAL DISTRIBUTION OF SOIL PHOSPHORUS 803
Interpreting Soil P Variability (Figs. 1, 2, 3, and 4) and greater variabilitySpatial trends in soil P were most likely a (Table 1) compared with the hay fields. Areas
function of feces deposition and manure appli- of elevated P concentrations in the pastures arecation history within individual fields. As such, associated with zones of pastured cattle con-"hot spots" in the pastures can be attributed to centration, such as around areas of preferredthe distribution of feces by pastured cattle, pasture grasses, shade, or water (Matthews et al.,whereas the clustering of P in the alfalfa and 1994).hay fields can be attributed to manure appli- In addition to cultural practices, soil differ-cation practices (Figs. 1, 2, 3, and 4). For ences explain some of the trends in the spatialinstance, a reasonable explanation for the distribution of P in the mixed hay field. Assystematic clustering of P at the north end of illustrated in Fig. 2, the M3-P distributionthe alfalfa field is that this area is relatively flat within the mixed hay field is systematicallyand adjacent to the gated entrance to this field higher in the northwestern corner, coincidingfrom the road leading from the dairy barns with the transition from the Lewbeach map unit(Fig. 2). A similar explanation can be applied to (northwest) to Willowemoc map unit (south-the cluster of high M3-P samples located in the east). Notably, WS-P does not exhibit the closenorthwest corner of the mixed hay field (Fig. tie with soil map unit (Fig. 4). There are several3). The distinct split in WS-P concentrations possible explanations for the association betweenevident in Fig. 4 is associated with a former M3-P and soil map unit within the mixed hayfield boundary. Until 1998, the hay field was field. Figure 5D indicates that the distribution ofdivided into two separate fields with different soil Mehlich-3 Fe is the inverse of M3-P (i.e.,manure management histories. Again, the two the well drained northern side has higher P andpastures showed less systematic P distribution less Fe compared with the southern side, which
Fig. 3. Variograms for WS-P concentrations among 100 soil samples taken on a 10-rn grid from four sites: Pasture 1,Pasture 2, alfalfa hay, and mixed hay.

Hay0-10
o 11-15O 16-20• 21-25• 26-28
Pasture 2
.0 .North8 • •• Aspect/flow
¶0
.0*00•
•'0
"7
Mixed ha,*<"1"
WmB 0
1'North
Aspect/flow
I
804 PENN, ET AL. SOIL SCIENCE
Pasture 1Pasture 2Alfalfa• 0-10• 0-10• 0-10o 11-150 11-15C 11-150 16-200 16-200 16-20• 21-25• 21-25• 21-25• 26-100 • 26-35 • 26-28
Alfalfa hay..D
* 80°
84•0•o8•00
.°•,00*0
Pasture 1oko 00
0 0600 000•
0
0
0
* LhD
Fig. 4. Soil WS-P concentrations (mg kg) among 100 samples taken on a 10-rn grid from four sites: Pasture 2,alfalfa hay, Pasture 1, and mixed hay. Note that Pasture 2 is located on a different farm than the Pasture 1 and haysites. The solid line indicates change in soil map unit: LhD = Lewbeach 18%-35%; WmB = Willowernoc 2%-5%slope.
has less P and more Fe). In support of thehypothesis that the "split" in P concentrations isbecause of soil Fe, soils that are not saturatedwith P and that possess a higher concentration ofFe maintain a lower concentration of P insolution compared with soils with less Fe (Toreuet al., 1988; Pautler and Sims, 2000).
In addition to Fe differences between thetwo soils, hydrologic properties may also becontributing to differences in P concentrationsin these soils. Specifically, the Willowemoc soilson the southern side of the hay field were foundto have several seeps and not as well drainedcompared with the Lewbeach on the northerncod; this difference in hydrology may beinfluencing the Mehlich-3 Fe concentrations.In this case, Fe dissolved under reducingconditions could be transported through thesubsoil and reoxidized at the seeps located onthe south emside of the mixed h,iv field,
resulting in an accumulation of Fe. Lookmanet al. (1996) noted a similar condition in a studythat investigated the relations between soilproperties and the variability of soil P sorptioncapacity. The authors found a discontinuity insoil Fe concentrations (ammonium oxalate-extractable) in that Fe concentrations weremuch higher at a ditch compared with soilssampled every 10 in the 539-m transect.The high Fe content near the ditch wasattributed to Fe reduction and leaching duringwet seasons, then reoxidizing when Fe-richwaters reached the ditch. In addition, thesereprecipitated Fe oxides typically have a greaterP sorption capacity, because these minerals arerather amorphous and possess a greater surfacearea than the crystalline counterparts (Patrickand Khalid, 1974; Khalid et al., 1977).
The partial Mantel test is a useful methodf( )F 111 vestlg.l tillpotel] ti,iI iii flu cii ces of soil

0,
C 0
NoahAspect/flow
0 •
I,0 0
0
D''.•
a0
0
0
VOL. 172 No. 10SPATIAL DISTRIBUTION OF SOIL PHOSPHORUS 805
properties and cultural practices (in this case,manure applications). Partial Mantel tests wereconducted on each field data set to determine ifMehlich-3-extractable Ca, Mg, Al, and Fe weredistributed similarly to P. In addition, simplecorrelation analysis between P and the otherelements also proved to be insightful. Results ofthe partial Mantel tests indicated that soil M3-Pwas positively correlated (distributed) with Ca,Mg, or both among Pastures 1 and 2 and the
A0 0 0000
alfalfa hay field (Table 2). Results of the simplecorrelations were similar (Table 3). This may be aneffect of previous manure applications, becausedairy manure will typically increase the Ca andMg content of a soil while simultaneouslyincreasing P content (Kalbasi and Karthikeyan,2004). The close relationship of P with Ca andMg may also indicate the presence of Ca andMg phosphates. The formation of Ca and Mgphosphates are likely under this situation because
B •00
i
1" 0
Zia
oo
Ca Mg• 0-2000• 0-200o 2000-2400 0 200-250o 2400-2800 C 250-300• 2800-3200 • 300-350
3200-3746 • 350-524
Al Fe• 0-550• 0-230O 550-650 0 230-280O 650-750 C 280-300
• 750-850300-340
850-1025340-427
Fig. 5. Soil Mehlich-3 (A) Ca, (B) Mg, (C) Al, and (D) Fe concentrations (mg kg- 1 ) among 100 samples taken on a10-rn grid from the mixed hay field site. The solid line indicates change in soil map unit: soils on the northern sideof the solid line are in a Lewbeach silt loam unit (18%-35% slope), whereas soils on the southern side are in aWillowemoc silt loam unit (2%-5% slope).

806 PENN, El AL,- SOIL SCIENCE
TABLE 2
Mantel t values from spatial correlation of M3-1 1 and WS-I' with Mchlicli-3 Ca, Al, Fe, and Mg
M3-P WS-PElement
Pasture IPasture 2AIfalfis hayMixed hay - Pasture IPasture 2Alfalfa hayMixedhay- , -
Ca0.080.17'0.54'0.080.210.110.13'0.09Al-0.01-0.020.11-0.15'-0.02-0.02-0.070.24'Fe-0.060.000.08-0.03-0.070.29013'0.J7'Mg0.870.000.57'0.00-0.85'-0.120.130.17
Significant r value as P = 0.01.
these fields have a history of consistent (andrecent) dolomitic lime applications. Nair et al.(1995) found that Ca- and Mg-associated P wasthe dominant soil P fraction (-'70% of total P)among active and abandoned dairy systems inSouth Florida's Lake Okeechobee watershed. Intheir study, P forms were estimated using achemical fractionation method. For the soils usedin this study, Penn and Bryant (2006) found that40 of the more P-concentrated soils possessed Caand Mg phosphates, as determined by chemicalspeciation modeling. The authors attributed thisobservation to fact that these soils regularlyreceived dairy manure and/or lime (calciumcarbonate) additions. The partial Mantel test alsoshowed that WS-P was distributed with Mgand/or Ca in Pasture 1 and the alfalfa hay field(Table 2). Among simple correlations, Ca andMg were well correlated with WS-P in all fields(Table 3).
Several fields also had significant correlationsbetween P and Mehlich-3-extractable Fe basedon partial Mantel tests and simple correlationcoefficients (Tables 2 and 3). Most notably,WS-P in Pasture 2 and the alfalfa hay fieldshowed the strongest relationships with Fe.However, caution should be exercised whenmaking interpretations involving Fe, becauseMehlich-3 is considered to be a poor extractorof soil Fe. The alfalfa hay and mixed hay fieldsshowed significant correlations between M3-Pand Al and between WS-P and Al (Tables 2
and 3). For the mixed hay field, soil Al wasnegatively correlated with M3-P (based onMantel) and WS-l' (based on simple correla-tions) (Tables 2 and 3). Soils containing highlevels of Al tended to possess lower concen-trations of extractable P. As previously explainedwith Fe, this is expected because soils with highlevels of Al maintain low concentrations of P insolution until the soils become saturated with P(Pautler and Sims, 2000; Penn et al., 2005).However, according to the Mantel correlations,WS-P was positively correlated with soil Al.The reason for this discrepancy is unknown.
Figures 4 and SA-C illustrate that the WS-Pdistribution at the mixed hay field was verysimilar (i.e., positively correlated) with Ca andMg distribution, yet opposite (negatively corre-lated) of Al distribution. Again, there are likelymany factors contributing to these observations,such as natural variability in soil Al content andmanure and lime application history.
I;flp!i(atiOfl.c of VariabilityThe spatial variability of soil P has significant
implications for the transport of P to surface watersand our ability to model and predict losses of Pfrom agricultural soils. The large variability in soilP within fields can pose a problem to traditionalsoil sampling methods such as composite sampling.For example, although the mean concentration ofsoil in the alfalfa hay field was 192 mg kg-1,individual samples had M3-P concentrations
TABLE 3Simple correlation coefficients of M3-P and WS-l' with Mchlich-3 Ca, Al, Fe, and Mg
M3-1' WS-l'Element
PastureIPasture2AlfalfahayMixed hayPasture 1Pasture 2Alfalfa hayMixed hay
Ca0.160.43'0.75'0.250.29'0.36'0.44'0.39'Al0.06-0.120.36'-0.02--0.22-0.23-0.04-0.55'Fe0.060.240.030.32'0.080.59'0.36'0.04Mg0.87'0.65'0.66'0.150.86'0.50'0.40'0.47'
'Significant r value at P = 0.01.

VOL. 172 No. 10SPATIAL DISTRIBUTION OF SOIL PHOSPHORUS 807
ranging from 141 to 260 mg kg 1 . As P in runoffis correlated with M3-P (Pote et al., 1996; Vadaset al., 2005; Penn et al., 2006), runoff originatingfrom different parts of a field can be expected tovary widely in P concentration. Furthermore,compositing soil samples can produce estimates ofSTP that differ significantly from the arithmeticmean of the individual cores used to create thecomposite sample.
The compositing effect was described byMaguire et al. (2002) as the phenomenon thatwhen two soil fractions are mixed, the measuredWS-P is always less than the average WS-P (i.e.,the average WS-1 1 of the two individual soils),indicating that WS-P released by one aggregatefraction could be rcadsorbed by another. Theauthors concluded that this readsorption of Pmay result in surface water P concentrations lessthan expected and attributed it to the Pbuffering capacity of soil. As runoff containingdissolved P and sediment moves across a field,the dissolved P can readsorb onto soil orsediment, whereas the suspended sediments candesorh or adsorb P, depending on the solutionconcentrations and P buffering capacity of thesediment. Therefore, as runoff flows downhill(from north to south in Fig. 3) from the alfalfahay field to Pasture 1, runoff P concentrationsoriginating from the top of the alfalfa hay fieldwould be elevated (due to higher soil Pconcentrations) but would he potentially read-sorbed as that runoff encounters soils and sedi-ment at lower parts of the field as well asmoving across Pasture 1.
This effect is evident upon observation ofthe simulated runoff experiment results in whichtwo soil materials with very different M3-Pcontents (high = 220 mg kg and low =18 mg kg -J ) were placed together but unmixedin the same runoff boxes (fable 4). Whereasthe arithmetic average DRP concentration inrunoff from the H and the L treatment was0.17 mg L , the observed concentration fromthe H/L treatment was only 0.09 mg L_i.Although the experimental design addressesprocesses that affect P concentration in runoff,the results are consistent with the compositingeffect as described by Maguire et al. (2002).Somewhat unexpectedly, the 1./H treatment, inwhich the high-P soil is in the lower slopeposition, also yielded a lower runoff DRPconcentration than the arithmetic mean, asopposed to a concentration closer to, but lesserthan, the H treatment. Under these experimentalconditions, we postulate that runoff from the
upper half of the box contained low-P sedimentsthat readsorb soluble P originating from thehigh-P soil in the lower half of the box. It isunclear whether this is an important processunder field conditions where sediments derivedfrom upslope positions may be redeposited oversome distance and replaced by newly detachedsediments derived from lower slope positions.The effect may only occur as a boundarycondition when runoff from a low-P soil flowsacross the upper edge of a high-P soil in a lowerslope position. Despite this uncertainty, theseresults do suggest that the use of a composite oraverage field STP value may not accuratelyestimate runoff l)RP concentrations in fieldswith high P variability that have patterns of Pdistribution (strong spatial dependency), espe-cially if the downslope part of a field is lower inSTP compared with the upslope. In addition,these results suggest that the use of stream bufferzone possessing low soil P concentrations couldhe effective in reducing P input to surface waters.
Another factor to consider when evaluatingthe effectiveness of a single composite P value inestimating runoff P losses is variation withrespect to the runoff contributing area. Becausethere may be zones of saturation within thelandscape that are the predominant sources ofsurface runoff generation (Dougherty et al.,2004), runoff P concentrations will be moredependent upon soil P concentrations withinthese source areas. Additionally, source areasfor runoff generation are dynamic and willexpand and contract with changes in soil watercontent, resulting in the variable source areaconcept (Ward, 1984). These variable sourceareas typically represent only a small part ofthe landscape (Gburek and Sharpley, 1998;Srinivasan et al., 2002; Needelman et al.,2004), thus they are very important in thetransfer of P to surface waters. For instance, if
TABLE 4Runoff dissolved reactive P (DRI') concentrations From
runoff boxes containing high (H), low (L), and both high andlow P llerks soils. Mixed soil runoflhoxes (3 and 4) consist oftwo different soils that were linked in the middle of the box
M3-P (rug kg')Runoff DRPTreatment - - I
Upslopesoil Downslope soil(rug I.
I-I 2202200.30L 1818004H/L220 18009L/H18220-013
All runoff l)RP values were significantly different at P0.05.
PENN. ET Al..808
only the lower half of the mixed hay field (Fig. 2)is generating runoff, then the composite P valuefor that field would overestimate potential Pconcentrations in runoff because the bottom(southern) half of the mixed hay field is lower insoil P compared with the upper half (Fig. 3).However, spatial variability in P distribution maynot have the same implications for pastures,because the variability in pastures, as representedby Pasture 1, is more spatially random comparedwith the two hay fields (Figs. 1, 2, 3, and 4). Acomposite sample from Pasture I may he moresuitable for use in estimating P loss in runoff. Thecompositing effect may act similarly to moderateDRY concentrations in runoff as it does in thecomposite sample for STP determination. There-fore, runoff originating from virtually any sectionof Pasture 1 would be similar in P concentrationbecause the P distribution is more spatiallyrandom. However, the results of this studysuggest that there is need for further research onthe topic of adsorption-desorption dynamics inrunoff as it moves across the landscape.
CONCLUSIONS
As expected, fields in which manure P wasapplied either more recently or for a greaterperiod (alfalfa and mixed hay) contained highersoil M3-P and WS-1 1' concentrations than fieldsin which manure applications have ceased (liastures I and 2). In addition, soil M3-P and WS-Pwas spatially autocorrelated for all four fields,indicating that points closer together are moresimilar than points further apart (i.e., there arereal patterns to the P distribution). However,based oil results of the autocorrelation (vario-gram) and simple statistics (CV), P distributionamong the hay fields were less variable, lessspatially random, and more clustered (i.e., stron-ger spatial dependency) compared with thepastured fields where P distribution was morerandom and spatially independent with several P"hot spots." Higher P concentrations wereobserved in areas near the gate and road andwhere manure applications would be the mosteasy and accessible. The high_P area within themixed hay field corresponds with changes inslope, drainage, and soil map unit.
'File most important implication of theobserved spatial variability of P is with respectto the use of single-composite soil test values fbrP-loss prediction indexes and models. Specifi-cally, the field average or composite P value wasvery different from a large percentage of indivi-
SOIL SCIENCE Idually sampled soils. Whcre we observed realpatterns in P distribution, a single compositesample might not have accurately represented theportion of the field that controls P concentrationin runoff unless these patterns were known andsampling strategies were adjusted accordingly.Conversely, where autocorrelations were rela-tively weak and spatial distribution patterns weremore random, as in the pastures, the use of singlecomposite samples for STP would appear to be amore appropriate indication of P concentrationin runoff, because the coinpositing effect thatoccurs during sampling would also affect Pconcentration in runoff. The results of this studyalso suggest that low-P buffer areas may be veryimportant in reducing P loading to surfacewaters. More research is needed to assess Padsorption-desorption from sediments movingin overland flow under field conditions.
REFERENCESBeauchcnimn, S., R. R. Sinard, and D. Cluic. 1998.
Forms and concentration of phosphorus in drain-age water of twenty-seven tile-drained soils.J. Environ. Qual. 27:721-728.
Beegle, I). B. 2002. Soil fertility management. In:The Agronomy Guide. F. Martz (ed.). Publica-tions Distribution Center, College of AgriculturalSciences, The Pennsylvania State University,University Park, PA, pp. 19-42.
Carpenter, S. R., N. F. Caraco, D. L. Correll, R. W.Ilowarth, A. N. Sharpicy, and V. H. Smith. 1998.Nonpoint pollution of surface waters with phos-phorus and nitrogen. Ecol. AppI. 8.559-568.
Correll, 1). L. 1998. The role of phosphorus in theeutrophication of receiving waters: A review.J. Environ. Qual. 27:261-266.
Daly, K., P. M. Mills, 13. Coulter, and M.McGarriglc. 2002. Modeling phosphorus con-centrations in Irish rivers using land use, soiltype, and soil phosphorus data. J . Environ. Qual.32:590-399.
Daniels, M. I)., P. Delaurie, P. A. Moore, Jr., A.Mouromoustakos, S. L. Chapman, and J . M.Langston. 2001 Soil phosphorus variability inpastures: Implications for sanipling and environ-mental mmianagcment strategies. J . Environ. Qual.30:2157-2165.
Dougherty, W. J . , N. K. Fleming, J . W. Cox, andD. J . Chittleborough. 2004. Phosphorus transfer insurface runoff frommi intensive pasture systems atvarious scales: A review. J . Enviromi. Qual. 33:1973-1988.
Ghiirck, W. J .. and A. N. Sharpley. 1998. Hydro-logic controls on phosphorus loss froin uplandagricultural watersheds. J . Environ. Qual. 27:2767-277.

VOL. 172 ' No. 10 SPATIAL DIsTRIBUtIoN OF SOIL PHOSPHORUS 809
Johnson, A. M., D. L. Osmond, and S. C. Hodges.2005. Predicted impact and evaluation of NorthCarolina's phosphorus indexing tool. J . Environ.Qual. 34:1801-1810.
Juang, K., D. Liou, and D. Lee. 2002. Site-specificphosphorus application based on the krigingfertilizer-phosphorus availability index of soils.J . Environ. Qual. 31:1248-1255.
Kalbasi, M., and K. G. Karthikeyan. 2004. Phospho-rus dynamics in soils receiving chemically treateddairy manure. J . Environ. Qua]. 33:2296-2305.
Khalid, R. A., W. H. Patrick, Jr., and R. D.DeLaune. 1977. P sorption characteristics offlooded soils. Soil Sci. Soc. Am, J . 41:303-310.
Kleinman, P. J. A., and A. N. Sharpley. 2003. Effect ofbroadcast manure on runoff phosphorus concen-trations over successive rainfall events. J . Environ.Qual. 32:1072-1081.
Larson, W. E., J . A. Lamb, B. R. Khakural, R. B.Ferguson, and G. W. Rehm. 1997. Potential ofsite-specific management for isonpoint environ-mental protection. In: Proceedings of the SecondInternational Conference of Site-Specific Manage-ment for Agricultural Systems, Minneapolis, MN,March 27-30, 1996. P. C. Robert, R. H. Rust,and W. E. Larson (eds.). ASA-CSSA-SSSA,Madison, WI, pp. 337-367.
Legcndre, P., and M. J . Fortin. 1989. Spatial patternand ecological analysis. Vegetauo 80:107-138.
Lemunyon, J . L., and R. G. Gilbert. 1993. Theconcept and need for a phosphorus assessmenttool. J . Prod. Agric. 6:483-496.
Lookman, R., K. Jansen, R. Merckx, and K. Viassak.1996. Relationship between soil properties andphosphate saturation parameters. A transect studyiii northern Belgium. Geodenna. 69:265-274.
Maguire, R. 0., A. C. Edwards, J . T. Sims, P. J.Kleinman, and A. N. Sharpley. 2002. Effect ofmixing soil aggregates on the phosphorus concentra-tion in surface waters.J. Eisviron. Qual. 31:1294-1299.
Maguire, R. 0., and J . T. Sims. 2002. Measuringagronomic and environmental soil phosphorussaturation and predicting phosphorus leaching withMehlich 3. Soil Sci. Soc. Ain. J. 66:2033-2039.
MathSoft. 1996. S+SpatialStats User's Manual, Ver-sion 1.0. Mathsoft, Seattle, WA.
MathSoft. 1997. S-Plus Programmer's Guide, DataAnalysis Products Division. MathSoft, Seattle, WA.
Matthews, B. W., L. E. Sollenbergerm, V. D. Nair,and C. R. Staples. 1994. Impact of grazing manage-ment on soil nitrogen, phosphorus, potassium andsulfur distribution. J . Environ. Qual. 23:1006-1013.
Mehlich, A. 1984. Mehlich 3 soil test extractant; Amodification of Mehlieh 2 extractant. Commun.Soil Sci. Plant Anal. 15:1409-1416.
Murphy, J . , and J . R. Riley. 1962. A modified singlesolution method for the determination of phosphatein natural waters. Anal. Chem. Acta. 27:31-36.
Nair, V. D., I). A. Graetz, and K. M. Portier. 1995.Forms of phosphorus in soil profiles from
dairies of South Florida. Soil Sci. Soc. Am. J . 59:1244-1249.
Needelman, B. A., W. J . Gburek, G. W. Petersen,A. N. Sharpley, and P. J . A. Kleinman. 2004.Surface runoff along two agricultural hillslopeswith contrasting soils. Soil Sci. Soc. Am. J . 68:914-923.
Needelman, B. A., W. J . Gburek, A. N. Sharpley,and G. W. Petersen. 2001. Environmental man-agement of soil phosphorus: Modeling spatialvariability in small fields. Soil Sci. Soc. Ans. J.65:1516-1522.
Patrick, W. H., Jr., and R. A. Khalid. 1974.Phosphate release and sorption by soils and sedi-ments: Effect of aerobic and anaerobic conditions.Science (Wash. D.C.) 186:53-55.
Pautler, M. C., and J . T. Sims. 2000. Relationshipsbetween soil test phosphorus, soluble phosphorus,and phosphorus saturation in Delaware soils. SoilSci. Soc. Am. J . 64:765-773.
Penn, C. J . , and R. Bryant. 2006. Incubation of driedand sieved soils can induce calcium phosphateprecipitation/adsorption. Commun. Soil Sci. PlantAnal. 37:1437-1449.
Penn, C. J . , C. L. Mullins, and L. W. Zelazny. 2005.Mineralogy in relation to phosphorus sorption anddissolved phosphorus losses in runoff. Soil Sci.Soc. Am. J. 69:1532-1540.
Penn, C. J . , G. L. Mullins, and L. W. Zelazny. 2006.Estimating dissolved phosphorus concentrations inrunoff from three physiographic regions of Vir-ginia. Soil Sci. Soc. Am. J. 70:1967-1974.
Pote, D. H., T. C. Daniel, A. N. Sharpley, P. A.Moore, D. R. Edwards, and D. J . Nichols. 1996.Relating extractable soil phosphorus losses inrunoff. Soil Sci. Soc. Am. J . 60:855-859.
Raun, W. P..., J . B. Solie, G. V. Johnson, M.L. Stone, R. W. Whitney, H. L. Lees, H.Sembiring, and S. B. Philips. 1998. Mierovari-ability in soil test, plant nutrient, and yieldparameters in bemudagrass. Soil Sci. Soc. Am. J.62:683-690.
SAS Institute. 1998. SAS Online, Version 8. SASInstitute, Cary, NC.
Sauer, T. J . , and D. W. Meek. 2003. Spatial variationof plant-available phosphorus in pastures withcontrasting management. Soil Sci. Soc. Am. J.67:826-836.
Sharpley, A. N. 1981. The contribution of phospho-rus leached from cropcrop canopy to losses in surfacerunoff. J . Environ. Qual. 10:160-165.
Sharpley, A. N. 1995. Dependence of runoff phos-phorus on extractable soil phosphorus. J . Environ.Qual. 24:920-926.
Sims, J . T., R. 0. Maguire, A. B. Leytem, K. L.Gartley, and M. C. Pautler. 2002. Evaluation ofMeblich 3 as an agn-environnsental soil phospho-rus test for the Mid-Atlantic United Stares ofAmerica. Soil. Sci. Soc. Am. J . 66:2016-2032.
Smouse, P. E., J . C. Long, and R. R. Sokal. 1986.

1
810
PENN, El' AL. SOIL SCIENCE
Multiple regression and correlation extensions ofthe Mantel test of matrix correspondence. - Syst.Zool. 35:627-632.
Soil Conservation Service. 1981. Land resourceregions and major land resource areas of theUnited States. USDA-SCS Handbook 298. U.S.Government Printing Office, Washington, D.C.
Solie, J . B., W. R. Raun, and M. L. Stone. 1999.Subrncter spatial variability of selected soil andherniudagrass production variables. Soil Sci. Soc.Am. J . 63:1724-1733.
Srinivasan, M. S., W.J. Gburek, andJ. M. Hainlctt. 2002.Dynamics of stormflow generation—A hillslope-scale field study in east-central Pennsylvania, USA.Hydrol. Process. 16:649-665.
Toreu, B. N., F. C. Thomas, and G. P. Gillman.1988. Phosphate-sorption characteristics of soils ofthe North Queensland coastal region. Aust. J . Soili),,i.A(.C_Ar7
Urban, 1)., S. Goslee, K. Pierce, and T. Lookingbill.2002. Extending community ecology to land-scapes. Ecoscience 9:200-212.
Vadas, P. A., P. J . A. Kleinman, A. N. Sharpley, andB. L. Turner, 2005. Relating soil phosphorus todissolved phosphorus in runoff. A single extractioncoefficient for water quality modeling. J . Environ.Qual. 34:572-580.
Vadas, P. A., and J . T. Sims. 2002. Predictingphosphorus desorption from Mid-Atlantic coastalplain soils. Soil Sci. Soc. Ann. J . 66:623-631.
Walter, M. T., V. K. Mehta, A. M. Marrone, J . Boll,P. Gerard-Marchant, 1. S. Steenhuis, and M. F.Walter. 2003. Simple estimation of prevalence ofHortonian flow in New York City watershed.J . Hydrol. Eng. 8:214-218.
Ward, R. C. 1984. On the response to precipitationof headwater streams in humid areas. J . Hydrol.(Amst.) 74:171-189.