Spatial distribution of monaural acoustical descriptors in historical Italian theatres
13
ISRA 2013 Toronto, Canada International Symposium on Room Acoustics 2013 June 9-11 1 Spatial distribution of monaural acoustical descriptors in historical Italian theatres Massimo Garai ([email protected] ) Simona De Cesaris ([email protected] ) Dario D’Orazio ([email protected] ) Department of Industrial Engineering (DIN) University of Bologna Viale Risorgimento 2, 40136 Bologna, Italy ABSTRACT In order to qualify a performance space, ISO 3382 recommends a minimum number of receiver positions as a function of hall size, to be selected according to given rules. Different acoustic criteria and different degrees of accuracy may require a different set of measurement points. The Charta of Ferrara extends these method to historical Italian theatres, characterized by a horseshoe shaped audience, a series of tiers and a gallery. In order to verify the representativity of the number and disposition of the measurements points proposed in the Charta, a measurement campaign has been conducted in three historical medium sized Italian theatres: the Masini Theatre in Faenza, the Rossini Theatre in Lugo and the Bonci Theatre in Cesena. Impulse responses have been measured at each listener position. Monaural descriptors of ISO 3382 have been extracted from the impulse responses and analyzed. The statistical frequency distribution of each parameter has been calculated, according to similar literature for different shaped theatres. Then various reduced sets of receivers, selected from the total ensemble according to the procedure of ISO 3382, Charta of Ferrara, and exploiting symmetries, have been compared. Differences between different receiver sets have been found, and dissimilarity between seats have been related to different acoustical zones of the hall. 1 INTRODUCTION The acoustical quality of an historical theatre may be assessed using the criteria extracted from impulse responses (IRs) measured at listener seats. ISO 3382 1 recommends a minimal set of positions, but also suggests that increasing the receiver number the accuracy of the measurements increases. The Charta of Ferrara 2 suggests different minimum sets of measurement points in different historical type of theatres. The present study evaluates the accuracy of measurements studying the statistics of the monaural criteria extracted from IRs. Measurements of IR have been made in three historic Italian theatres (see table 1): the Masini Theatre in Faenza (MAS), the Rossini Theatre in Lugo (ROS) and the Bonci Theatre in Cesena (BON). Both audience and boxes have been analyzed.
Transcript of Spatial distribution of monaural acoustical descriptors in historical Italian theatres

ISRA2013
Toronto, Canada International Symposium on Room Acoustics
2013 June 9-11
1
Spatial distribution of monaural acoustical descriptors in historical Italian theatres
Massimo Garai ([email protected]) Simona De Cesaris ([email protected]) Dario D’Orazio ([email protected]) Department of Industrial Engineering (DIN) University of Bologna Viale Risorgimento 2, 40136 Bologna, Italy
ABSTRACT
In order to qualify a performance space, ISO 3382 recommends a minimum number of receiver positions as a function of hall size, to be selected according to given rules. Different acoustic criteria and different degrees of accuracy may require a different set of measurement points. The Charta of Ferrara extends these method to historical Italian theatres, characterized by a horseshoe shaped audience, a series of tiers and a gallery. In order to verify the representativity of the number and disposition of the measurements points proposed in the Charta, a measurement campaign has been conducted in three historical medium sized Italian theatres: the Masini Theatre in Faenza, the Rossini Theatre in Lugo and the Bonci Theatre in Cesena. Impulse responses have been measured at each listener position. Monaural descriptors of ISO 3382 have been extracted from the impulse responses and analyzed. The statistical frequency distribution of each parameter has been calculated, according to similar literature for different shaped theatres. Then various reduced sets of receivers, selected from the total ensemble according to the procedure of ISO 3382, Charta of Ferrara, and exploiting symmetries, have been compared. Differences between different receiver sets have been found, and dissimilarity between seats have been related to different acoustical zones of the hall.
1 INTRODUCTION
The acoustical quality of an historical theatre may be assessed using the criteria extracted from impulse responses (IRs) measured at listener seats. ISO 33821 recommends a minimal set of positions, but also suggests that increasing the receiver number the accuracy of the measurements increases. The Charta of Ferrara2 suggests different minimum sets of measurement points in different historical type of theatres. The present study evaluates the accuracy of measurements studying the statistics of the monaural criteria extracted from IRs.
Measurements of IR have been made in three historic Italian theatres (see table 1): the Masini Theatre in Faenza (MAS), the Rossini Theatre in Lugo (ROS) and the Bonci Theatre in Cesena (BON). Both audience and boxes have been analyzed.
2
2 STATISTICS OF THE MONAURAL DESCRIPTORS
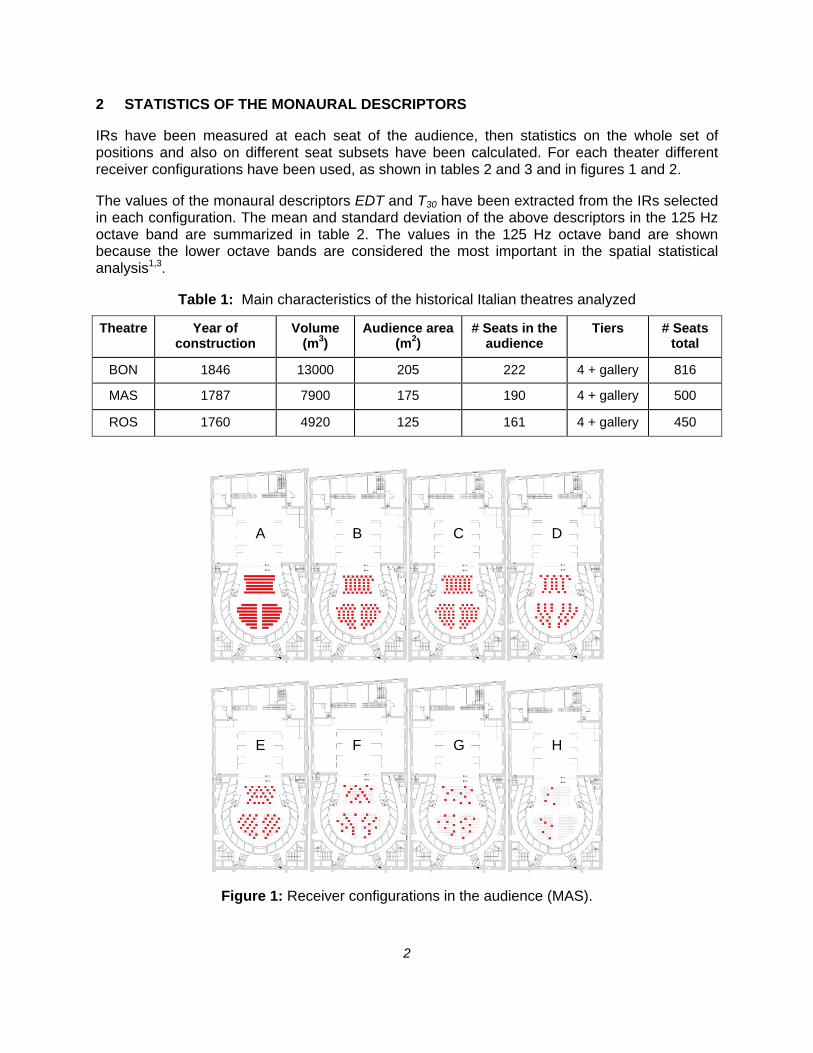
IRs have been measured at each seat of the audience, then statistics on the whole set of positions and also on different seat subsets have been calculated. For each theater different receiver configurations have been used, as shown in tables 2 and 3 and in figures 1 and 2.
The values of the monaural descriptors EDT and T30 have been extracted from the IRs selected in each configuration. The mean and standard deviation of the above descriptors in the 125 Hz octave band are summarized in table 2. The values in the 125 Hz octave band are shown because the lower octave bands are considered the most important in the spatial statistical analysis1,3.
Table 1: Main characteristics of the historical Italian theatres analyzed
Theatre Year of construction
Volume (m3)
Audience area (m2)
# Seats in the audience
Tiers # Seats total
BON 1846 13000 205 222 4 + gallery 816
MAS 1787 7900 175 190 4 + gallery 500
ROS 1760 4920 125 161 4 + gallery 450
Figure 1: Receiver configurations in the audience (MAS).
A B C D
E F G H

3
Table 2: Audience - receiver configurations and average values of EDT and T30
Description
(see figure 1)
BON EDT@125 Hz
BON T30 @125 Hz
MAS EDT@125 Hz
MAS T30 @125 Hz
ROS EDT @125 Hz
ROS T30 @125 Hz
A All the seats 1,97 0,33 2,23 0,15 2,05 0,25 1,78 0,13 0,88 0,26 1,39 0,11
B Even seats 1,96 0,33 2,23 0,15 2,05 0,24 1,79 0,12 0,88 0,26 1,39 0,12
C Odd seats 1,98 0,34 2,23 0,15 2,05 0,25 1,78 0,13 0,87 0,27 1,39 0,11
D One seat out of three 1,98 0,38 2,21 0,14 2,02 0,25 1,77 0,13 0,88 0,29 1,40 0,12
E One seats out of three optimized
1,98 0,33 2,22 0,15 2,04 0,23 1,78 0,12 0,87 0,26 1,41 0,11
F One seat out of five 1,90 0,34 2,26 0,17 2,00 0,26 1,77 0,14 0,87 0,24 1,39 0,11
G One seat out of eight 1,88 0,34 2,25 0,18 1,98 0,26 1,77 0,13 0,85 0,22 1,39 0,12
H Charta of Ferrara procedure
2,04 0,44 2,24 0,14 2,01 0,18 1,82 0,15 0,90 0,22 1,41 0,11
Table 3: Boxes and Gallery - receiver configurations and average values of EDT and T30
Description
(see figure 2)
BON EDT@125 Hz
BON T30 @125 Hz
MAS EDT@125 Hz
MAS T30 @125 Hz
ROS EDT @125 Hz
ROS T30 @125 Hz
I All the boxes (front) 1,72 0,38 2,13 0,18 1,86 0,41 1,90 0,21 1,39 0,29 1,54 0,15
J Even boxes 1,74 0,39 2,13 0,19 1,86 0,44 1,94 0,19 1,41 0,27 1,56 0,17
K Odd boxes 1,71 0,38 2,12 0,17 1,85 0,38 1,87 0,23 1,37 0,30 1,52 0,13
L One column of boxes out of three 1,72 0,38 2,12 0,19 1,83 0,43 1,93 0,23 1,43 0,30 1,53 0,15
M One box out of five optimization 1 1,66 0,36 2,12 0,19 1,80 0,41 1,90 0,23 1,32 0,29 1,58 0,17
N One box out of five optimization 2 1,62 0,38 2,17 0,15 1,91 0,36 1,86 0,25 1,33 0,31 1,48 0,13
O Charta of Ferrara procedure 1,85 0,41 2,06 0,21 1,81 0,20 1,89 0,18 1,28 0,33 1,52 0,15

4
Figure 2: Receiver configurations in the boxes and gallery (MAS).
3 NORMALITY TESTS
Assessing the normality of a set of measurement values may be useful in many ways. It may confirm, for example, the applicability of some theoretical models of reverberation to the parameters which describe the reverberation in historical Italian theatres. In this paper normality tests are applied to measured values relative to different receiver configurations.
Normality tests have been carried out for each criterion with the same procedure used in previous literature4. The measured data xn have been analyzed using both tests based on the empirical Cumulative Distribution Function (eCDF) and based on statistical moments. These tests indicate the probability of rejecting the so called null hypothesis (H0) comparing different statistic indices with a threshold for type I error, assuming a level of significance =0.05 as in previous literature4,5.
The eCDF F(zi) is defined as:
√
(1)
where zn are the ordered and normalized measured values:
(2)
and and are the mean and the standard deviation of the measured values xn.
The normality tests used in this study are:
I J K
L M N
O

5
1. Anderson Darling (AD) test:
∑ 2 1 (3)
where:
1. .
(4)
2. Kolmogorov-Smirnov (KS) test:
max , (5)
where:
max (6)
max (7)
3. Pearson’s Chi-squared (CHI) test:
∑ (10)
where ei are the expected Gaussian values.
4. Jarqe-Bera (JB) test:
3 (11)
where the skewness S is:
∑
∑
(12)
and the kurtosis K is:
1∑
1∑
The results of the normality tests are summarized in tables 4 to 9. The light grey color means that the test has been passed; The dark grey color means that the test has not been passed.

6
Table 4: Audience. Normality tests results (BON)
EDT T30 125 250 500 1000 2000 125 250 500 1000 2000 ADT A 0,276298 0,588845 0,899569 4,473062 2,87819 0,411444 0,632424 0,158896 0,354838 0,425888
B 0,223359 1,352586 0,867769 2,08357 1,92 0,225409 0,832041 0,219358 0,622999 0,244129
C 0,288001 0,174867 0,540369 3,095725 1,508508 0,313096 0,224315 0,163891 0,198893 0,348773
D 0,23438 0,572641 1,171175 1,341034 0,807919 0,58429 0,76728 0,257385 0,247775 0,823792
E 0,271156 0,728825 0,459645 1,921337 0,873968 0,315955 0,414236 0,169143 0,187218 0,32486
F 0,210592 0,379411 0,206366 2,068381 0,828277 0,45961 0,591903 0,216997 0,364853 0,820083
G 0,421054 0,601082 0,480364 1,453539 0,757923 0,785781 0,989053 0,213171 0,558495 1,284516
H 0,437625 0,262488 0,569721 0,852105 0,42358 0,256319 0,290015 0,159222 0,464341 0,288916
KS A false false false true false false false false false false
B false false false false false false false false false false
C false false false false false false false false false false
D false false false false false false false false false false
E false false false false false false false false false false
F false false false false false false false false false false
G false false false false false false false false false false
H false false false false false false false false false false
CHI A 0 0 0 1 1 0 0 0 0 0
B 0 1 0 1 1 0 1 0 0 0
C 0 0 0 0 0 0 0 0 0 0
D 0 0 0 0 0 1 0 0 0 0
E 0 0 0 1 0 0 0 0 0 0
F 0 0 0 0 0 0 0 0 0 1
G 0 0 0 0 0 0 0 0 0 0
H 0 0 0 0 0 0 0 0 0 0
JB A 0 0 1 1 1 0 0 0 0 0
B 0 0 1 1 1 0 0 0 0 0
C 0 0 1 1 1 0 0 0 0 0
D 0 0 1 1 1 0 0 0 0 0
E 0 0 0 1 1 0 0 0 0 0
F 0 0 0 1 0 0 1 0 0 1
G 0 0 0 1 0 0 1 0 1 0
H 0 0 0 1 0 0 0 0 0 0
Table 5: Boxes and gallery. Normality tests results (BON)
EDT T20 125 250 500 1000 2000 125 250 500 1000 2000 ADT I 0,184 0,198 0,587 0,737 0,879 0,476 0,520 0,427 0,398 0,333 J 0,249 0,359 0,545 0,608 0,560 0,618 0,298 0,564 0,357 0,298 K 0,248 0,270 0,256 0,315 0,515 0,274 0,651 0,444 0,479 0,246 L 0,638 0,142 0,313 0,548 0,265 0,199 0,189 0,577 0,363 0,503 M 0,216 0,273 0,221 0,266 0,448 0,943 0,246 0,224 0,520 0,620 N 0,136 0,208 0,670 0,295 0,294 0,488 0,333 0,233 0,363 0,414 O 0,351 0,407 0,407 0,418 0,409 0,381 0,238 0,553 0,273 0,301KS I false false false false false false false false false false J false false false false false false false false false false K false false false false false false false false false false L false false false false false false false false false false M false false false false false false false false false false N false false false false false false false false false false O false false false false false false false false false false CHI I 0 0 0 1 1 0 0 0 0 0 J 0 0 0 0 1 0 0 1 0 0 K 0 0 0 0 0 0 1 0 0 0 L 0 0 0 0 0 0 0 0 0 0 M 0 0 0 0 0 0 0 0 0 0 N 0 0 0 0 0 0 0 0 0 0 O 0 0 0 0 0 0 0 0 0 0 JB I 0 0 0 0 0 0 0 0 0 0 J 0 0 0 0 0 0 0 0 0 1 K 0 0 0 0 0 0 0 0 0 0 L 0 0 0 0 0 0 0 0 0 0 M 0 0 0 0 0 0 0 0 0 1 N 0 0 0 0 0 0 0 0 0 0 O 0 0 0 0 0 0 0 0 0 0

7
Table 6: Audience. Normality tests results (ROS)
EDT T20 125 250 500 1000 2000 125 250 500 1000 2000 ADT A 1,445 7,823 0,737 1,158 1,149 0,736 0,328 0,185 0,246 0,271 B 0,564 4,442 0,531 0,696 0,969 0,374 0,357 0,275 0,212 0,169 C 1,176 3,650 0,472 0,671 0,512 0,646 0,419 0,317 0,216 0,320 D 1,086 3,525 0,436 0,654 0,507 0,336 0,660 0,336 0,208 0,322 E 0,444 3,487 0,516 0,766 0,605 0,499 0,692 0,194 0,214 0,327 F 0,321 2,169 0,343 0,535 0,396 0,274 0,590 0,197 0,368 0,307 G 0,806 1,468 0,156 0,244 0,609 0,654 0,254 0,175 0,885 0,236 H 0,200 0,536 0,234 0,228 0,454 0,428 0,590 0,300 0,383 0,163KS A false true false false false false false false false false B false true false false false false false false false false C false true false false false false false false false false D false true false false false false false false false false E false true false false false false false false false false F false false false false false false false false false false G false false false false false false false false false false H false false false false false false false false false false CHI A 0 1 0 1 0 0 0 0 0 0 B 0 1 0 0 0 0 0 0 0 0 C 1 1 0 1 0 0 0 0 0 0 D 0 1 0 1 1 0 0 0 0 0 E 0 1 0 1 0 0 0 0 0 0 F 0 0 0 0 1 0 0 0 0 0 G 0 0 0 0 0 0 0 0 0 0 H 0 0 0 0 0 0 0 0 0 0 JB A 1 1 0 0 0 1 0 0 0 0 B 1 1 0 0 0 0 0 0 0 0 C 1 1 0 0 0 0 0 0 0 0 D 1 1 0 0 0 0 1 0 0 0 E 1 1 1 0 0 0 1 0 0 0 F 0 1 0 0 0 0 1 0 0 0 G 1 1 0 0 0 1 0 0 0 0 H 0 0 0 0 0 0 0 0 0 0
Table 7: Boxes and gallery. Normality tests results (ROS)
EDT T20 125 250 500 1000 2000 125 250 500 1000 2000 ADT I 0,354 1,328 1,182 2,164 1,910 0,707 0,227 1,326 2,403 2,892 J 0,687 0,397 0,566 1,336 1,780 0,233 0,261 1,033 0,903 2,190 K 0,617 1,276 0,793 1,016 0,632 0,713 0,420 0,634 1,984 1,219 L 0,290 0,381 0,661 1,153 0,846 0,653 0,168 0,716 1,039 1,306 M 0,508 0,770 0,502 1,248 0,529 0,365 0,306 0,801 1,644 0,713 N 0,338 0,551 0,693 0,753 0,636 0,170 0,125 0,324 0,486 0,631 O 0,467 0,419 0,492 0,789 0,456 0,365 0,745 0,586 0,633 0,959KS I false false false false true false false false false false J false false false false true false false false false false K false false false false false false false false false false L false false false false false false false false false false M false false false false false false false false false false N false false false false false false false false false false O false false false false false false false false false false CHI I 0 1 1 1 1 0 0 0 1 1 J 0 0 0 0 1 0 0 0 0 1 K 0 0 0 0 0 0 0 0 1 0 L 0 0 0 0 0 0 0 0 0 0 M 0 0 0 0 0 0 0 0 0 0 N 0 0 0 0 0 0 0 0 0 0 O 0 0 0 0 0 0 0 0 0 0 JB I 0 0 0 1 1 0 0 1 1 1 J 0 0 0 0 0 0 0 0 0 1 K 0 0 0 0 0 0 0 0 0 1 L 0 0 0 0 0 0 0 0 0 0 M 1 0 0 1 0 0 0 1 1 0 N 0 0 0 0 0 0 0 0 0 0 O 0 0 0 0 0 0 0 0 0 1

8
Table 8: Audience. Normality tests results (MAS)
EDT T20 125 250 500 1000 2000 125 250 500 1000 2000 ADT A 0,290 0,453 1,148 0,989 0,798 0,304 0,184 0,662 0,462 0,198 B 0,345 0,488 0,620 0,475 0,387 0,225 0,270 0,495 0,689 0,453 C 0,387 0,321 0,780 0,826 0,929 0,508 0,141 0,504 0,283 0,559 D 0,317 0,471 0,575 0,343 1,350 0,623 0,429 0,191 0,324 0,501 E 0,193 0,412 0,407 0,709 0,666 0,851 0,181 0,779 0,243 0,154 F 0,431 0,950 0,396 0,639 1,211 0,297 0,366 0,571 0,608 0,231 G 0,431 1,273 0,399 0,619 2,058 0,184 0,389 0,603 0,690 0,361 H 0,242 0,332 0,892 0,368 0,316 0,175 0,563 0,322 0,549 0,316KS A false false false false false false false false false false B false false false false false false false false false false C false false false false false false false false false false D false false false false true false false false false false E false false false false false false false false false false F false false false false false false false false false false G false false false false true false false false false false H false false false false false false false false false false CHI A 0 0 1 0 0 0 0 1 0 0 B 0 0 0 0 0 0 0 0 0 0 C 0 0 0 0 1 0 0 0 0 0 D 0 0 0 0 0 0 0 0 0 0 E 0 0 0 0 0 0 0 1 0 0 F 0 1 0 0 1 0 0 0 0 0 G 0 1 0 0 1 0 0 0 0 0 H 0 0 0 0 0 0 0 0 0 0 JB A 0 0 1 0 0 0 0 0 0 0 B 0 0 0 0 0 0 0 0 0 0 C 0 0 0 0 0 0 0 0 0 0 D 0 0 0 0 0 0 0 0 0 0 E 0 0 0 0 0 0 0 0 0 0 F 0 1 0 0 0 0 0 0 0 0 G 0 1 0 0 1 0 0 0 0 0 H 0 0 1 0 0 0 0 0 0 0
Table 9: Boxes and gallery. Normality tests results (MAS)
EDT T20 125 250 500 1000 2000 125 250 500 1000 2000 ADT I 0,640 0,500 0,562 2,661 2,798 1,115 0,437 0,416 0,402 0,216 J 0,172 0,588 0,215 1,286 1,185 0,622 0,321 0,250 0,269 0,322 K 0,808 0,256 0,817 1,676 1,891 0,872 0,357 0,398 0,359 0,233 L 0,352 0,420 0,454 0,701 0,570 0,788 0,726 0,408 0,643 0,304 M 0,525 0,208 0,290 0,563 0,944 0,431 0,630 0,278 0,220 0,337 N 0,321 0,351 0,358 0,439 1,089 0,274 0,428 0,478 0,436 0,331 O 0,372 0,309 0,340 0,552 0,721 0,264 0,288 0,562 0,383 0,194KS I false false false false true false false false false false J false false false false false false false false false false K false false false false false false false false false false L false false false false false false false false false false M false false false false false false false false false false N false false false false false false false false false false O false false false false false false false false false false CHI I 0 0 0 1 1 1 0 0 0 0 J 0 0 0 0 0 0 0 0 0 0 K 0 0 0 1 1 0 0 0 0 0 L 0 0 0 0 0 0 0 0 1 0 M 0 0 0 0 0 0 0 0 0 0 N 0 0 0 0 0 0 0 0 0 0 O 0 0 0 0 0 0 0 0 0 0 JB I 0 1 0 1 1 0 0 0 0 0 J 0 1 0 0 1 0 0 0 0 0 K 1 0 1 1 1 1 0 0 0 0 L 0 0 0 0 0 1 0 0 0 0 M 0 0 0 0 0 0 1 0 0 0 N 0 0 0 0 0 0 0 0 0 0 O 0 0 0 0 0 0 0 0 0 0

9
Figure 3: Distribution of the measured values of T30 @ 500 Hz and EDT @ 500 Hz (MAS).
4 SYMMETRY
Usually measurement procedures in historical theatres assume the symmetry of the acoustic field around the main horizontal axis of the theatre. In order to check this hypothesis, a statistical analysis of the two sides (left and right) of the audience has been done for each studied theatre (figure 4). Also the frontal and the rear parts of the audience and of the boxes have been studied.
Table 10 shows the mean and the standard deviation of the measured EDT values in the left and in the right parts of the theatre. It is worth noting that the difference between “left” and “right” values doesn’t exceed the JND.
Figure 4: Receiver configurations in MAS.
P Q
R S
10
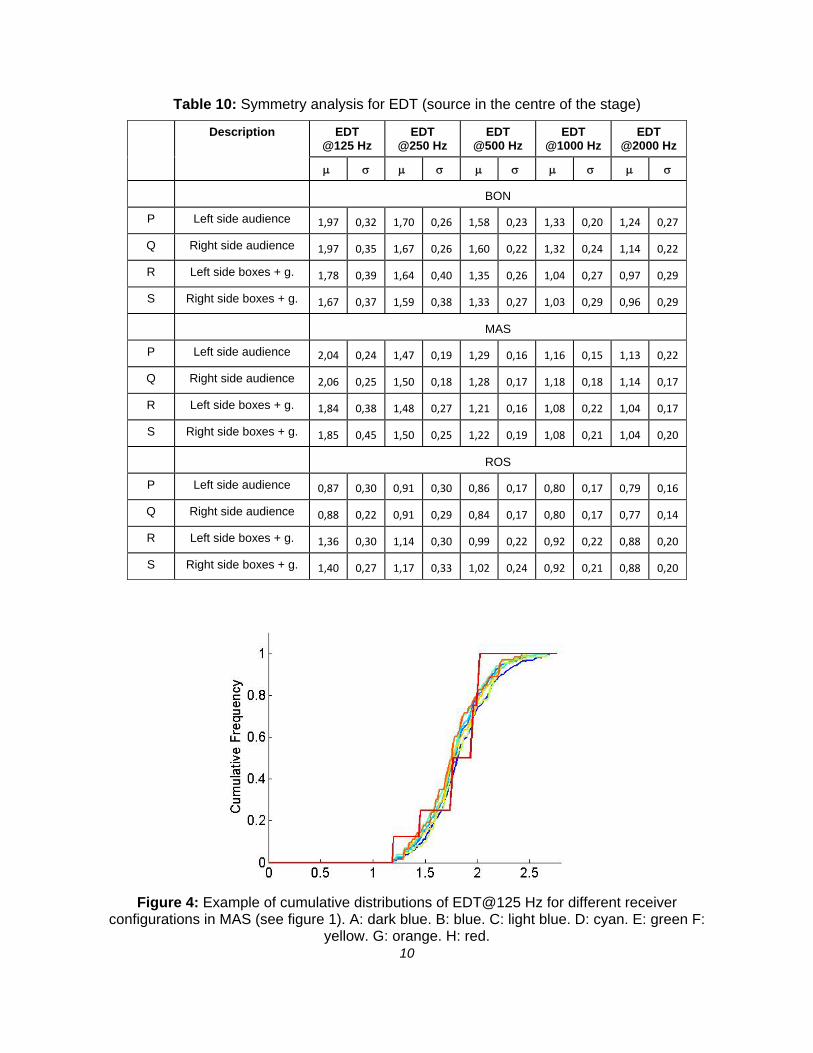
Table 10: Symmetry analysis for EDT (source in the centre of the stage)
Description EDT @125 Hz
EDT @250 Hz
EDT @500 Hz
EDT @1000 Hz
EDT @2000 Hz
BON
P Left side audience 1,97 0,32 1,70 0,26 1,58 0,23 1,33 0,20 1,24 0,27
Q Right side audience 1,97 0,35 1,67 0,26 1,60 0,22 1,32 0,24 1,14 0,22
R Left side boxes + g. 1,78 0,39 1,64 0,40 1,35 0,26 1,04 0,27 0,97 0,29
S Right side boxes + g. 1,67 0,37 1,59 0,38 1,33 0,27 1,03 0,29 0,96 0,29
MAS
P Left side audience 2,04 0,24 1,47 0,19 1,29 0,16 1,16 0,15 1,13 0,22
Q Right side audience 2,06 0,25 1,50 0,18 1,28 0,17 1,18 0,18 1,14 0,17
R Left side boxes + g. 1,84 0,38 1,48 0,27 1,21 0,16 1,08 0,22 1,04 0,17
S Right side boxes + g. 1,85 0,45 1,50 0,25 1,22 0,19 1,08 0,21 1,04 0,20
ROS
P Left side audience 0,87 0,30 0,91 0,30 0,86 0,17 0,80 0,17 0,79 0,16
Q Right side audience 0,88 0,22 0,91 0,29 0,84 0,17 0,80 0,17 0,77 0,14
R Left side boxes + g. 1,36 0,30 1,14 0,30 0,99 0,22 0,92 0,22 0,88 0,20
S Right side boxes + g. 1,40 0,27 1,17 0,33 1,02 0,24 0,92 0,21 0,88 0,20
Figure 4: Example of cumulative distributions of EDT@125 Hz for different receiver
configurations in MAS (see figure 1). A: dark blue. B: blue. C: light blue. D: cyan. E: green F: yellow. G: orange. H: red.

11
Table 5: -JND ratio for different reverberation times. All the receivers in the audience.
Reverberation criterion MAS BON ROS
JND JND JND
T30 @ 125 Hz (s) 0,43 4,07 0,50 3,25 0,76 9,55
T30 @ 250 Hz (s) 0,31 2,95 0,30 1,97 1,10 13,67
T30 @ 500 Hz (s) 0,18 1,68 0,21 1,38 0,51 6,37
T30 @ 1000 Hz (s) 0,13 1,26 0,18 1,18 0,51 6,37
T30 @ 2000 Hz (s) 0,11 0,98 0,13 0,89 0,47 5,81
EDT @ 125 Hz (s) 0,87 7,43 1,16 8,73 0,76 9,55
EDT @ 250 Hz (s) 0,64 5,51 0,90 6,80 1,10 13,76
EDT @ 500 Hz (s) 0,57 4,87 0,72 5,44 0,51 6,37
EDT @ 1000 Hz (s) 0,54 4,61 0,72 5,44 0,51 6,37
EDT @ 2000 Hz (s) 0,64 5,51 0,87 6,57 0,47 5,81
Table 6: -JND ratio for different reverberation times. All the receivers in the boxes.
Reverberation criterion MAS BON ROS
JND JND JND
T30 @ 125 Hz (s) 0,72 6,80 0,6 4,12 0,51 5,06
T30 @ 250 Hz (s) 0,36 3,40 0,41 2,78 0,42 4,16
T30 @ 500 Hz (s) 0,21 1,98 0,22 1,54 0,37 3,72
T30 @ 1000 Hz (s) 0,13 1,28 0,19 1,34 0,28 2,83
T30 @ 2000 Hz (s) 0,11 0,99 0,13 0,93 0,23 2,23
EDT @ 125 Hz (s) 1,53 14,14 1,27 12,19 0,96 10,37
EDT @ 250 Hz (s) 0,75 6,93 1,29 12,33 1,03 11,18
EDT @ 500 Hz (s) 0,57 5,27 0,84 8,03 0,76 8,26
EDT @ 1000 Hz (s) 0,64 5,96 0,88 8,46 0,65 6,97
EDT @ 2000 Hz (s) 0,54f 4,99 0,88 8,46 0,61 6,64
5 OUTLYING VALUES
The above analysis has been performed on reverberation time values whose regression line got a correlation coefficient greater than 0,98. Nevertheless an analysis of the cumulative
12
distribution has been carried out in order to suggest potential criteria to isolate possible anomalous values in the measurements (the so called outliers). The measured values have been ordered and the cumulative distribution in the range 5-95% evaluated, as shown in figure 4. Defining as the range of values, a ratio between and the JND has been calculated (see table 5).
6 DISCUSSION
When evaluating the average values of some acoustic criterion at low frequency, according to previous literature1,4 the strict application of ISO 33821 or the Charta of Ferrara2 may be a limit, because small subsets of receiver positions are hardly representative of the “average” acoustics of the hall. Strictly speaking, average values over the audience or over all the boxes are representative if and only if the statistical distribution of the data is Gaussian. Thus, normality tests should be applied to determine whether this assumption is verified.
While in some previous literature only one normality test is usually applied5, in the present study, different normality tests have been applied to the same data sets, obtaining different results as a function of the different assumptions underlying each test.
The results should be interpreted carefully. For example, it seems that in the boxes the statistical distribution of the acoustic criteria is normal, while in the audience it isn’t. Looking at the individual IRs, one could guess that this is due to the different values of the Peak to noise Ratio (PNR) and Decay Range7 in the boxes and in the audience. In fact, in the audience the first reflections are well isolated and come from the main surfaces of the hall, while in the boxes they are more distributed in time and come from the interior of the boxes. In this regard, it should be remembered that in Italian historical theatres there is a strong contribution of the first reflection on the arcoscenio or some surface around the audience and this may lead to very low EDT values; in the lower octave bands an additional uncertainty component may come from the used filters7.
Measurements indicates that the symmetry along the main axis of the hall is always respected.
The analysis of the cumulative distributions of measured values can give useful information to detect singular values due to anomalies in the measurement equipment or procedure, but with few data this may be very difficult. The /JND ratio may indicate that different “acoustical zones” are present in the same hall.
7 CONCLUSIONS
Following and expanding what is suggested in some previous literature a statistical analysis of measured reverberation values has been carried out. While the few existing literature is focused on modern concert halls, the present study is focused on historical horseshoe shaped theatres. IRs have been measured at each seat of three historical Italian theatres. Then different subsets of receiver configurations have been selected, from the full set of all seats to the minimum set suggested by the Charta of Ferrara2.
Different statistical tests have been applied to these data sets, obtaining useful indications about the normality of the underlying statistical distributions, the symmetry of the left and right halves of the hall, and the number of measurements needed in an Italian historical theatre with regard to aim of the measurement campaign (e.g. the full qualification of the hall or the calibration of a numerical model).

13
ACKNOWLEDGEMENT
This work has been carried out in the frame of the project “Historical theatres of Emilia-Romagna” of CIRI “Edilizia e Costruzioni” of the University of Bologna.
REFERENCES
1 ISO 3382, Acoustics – Measurement of room acoustic parameters – Part 1: Performance spaces, Geneva, 2009.
2 Pompoli, R., Prodi, N. “Guidelines for acoustical measurements inside historical opera houses: procedures and validation”, J. Sound Vibr., 232, 2000, 281-301.
3 Davy, “The variance of decay rates in reverberation rooms”, Acustica, 43, 1979, 12–25.
4 Pelorson, X., Vian, J.P., Polack, J.D., “On the variability of room acoustical parameters: reproducibility and statistical validity”, Appl. Acoust., 37, 1992, 175–98.
5 Akama, T., Suzuki, H., Omoto, A., “Distribution of selected monaural acoustical parameters in concert halls”, Appl. Acoust., 71(6), 2010, 564-577.
6 Cabo et Al., “A Monte-Carlo investigation to the uncertainly of acoustic decay measurement”, Proc. of Euronoise 2012, Prague, 2012, 531–536.
7 Kob et Al., “Band filters and short reverberation times”, Acta Acustica united with Acustica, 86, 2000, 350–357.
8 Hak et Al., “Measuring room impulse responses: impact of the decay range on derived room acoustic parameters”, Acta Acustica united with Acustica, 98, 2012, 907–915.