
Inhibition of phosphorus sorption to goethite, gibbsite ... - PubAg
Upload
independentCategory
view
1download
0
Sm
BDa
b
c
d
a
ARRAA
KDMSAS
1
obeori
beiot
Gf
b(j
0d
Journal of Hazardous Materials 217– 218 (2012) 398– 405
Contents lists available at SciVerse ScienceDirect
Journal of Hazardous Materials
j our na l ho me p age: www.elsev ier .com/ locate / jhazmat
patial distribution of diuron sorption affinity as affected by soil, terrain andanagement practices in an intensively managed apple orchard
eng P. Umalia,b, Danielle P. Olivera,c, Bertram Ostendorfa,∗, Sean Forresterc,avid J. Chittleborougha, John L. Hutsond, Rai S. Kookanac
School of Earth and Environmental Sciences, University of Adelaide, Urrbrae, 5064 South Australia, AustraliaCavite State University, Indang, 4122 Cavite, PhilippinesCSIRO Land and Water, Water for a Healthy Country National Research Flagship, Urrbrae, 5064 South Australia, AustraliaSchool of the Environment, Flinders University, GPO Box 2100, Adelaide 5001, South Australia, Australia
r t i c l e i n f o
rticle history:eceived 18 November 2011eceived in revised form 11 February 2012ccepted 17 March 2012vailable online 26 March 2012
eywords:iuron
a b s t r a c t
We investigated how the sorption affinity of diuron (3′-(3,4-dichlorophenyl)-1,1-dimenthyl-urea), amoderately hydrophobic herbicide, is affected by soil properties, topography and management practicesin an intensively managed orchard system. Soil-landscape analysis was carried out in an apple orchardwhich had a strong texture contrast soil and a landform with relief difference of 50 m. Diuron sorption(Kd) affinity was successfully predicted (R2 = 0.79; p < 0.001) using a mid-infrared – partial least squaresmodel and calibrated against measured data using a conventional batch sorption technique.
Soil and terrain properties explained 75% of the variance of diuron Kd with TOC, pHw, slope and WI as
IR-PLS predictionoil-landscape analysispple orchardpatial variability
key variables. Mean diuron Kd values were also significantly different (p < 0.05) between alley and treeline and between the different management zones. Soil in the tree line generally had lower sorptioncapacity for diuron than soil in the alleys. Younger stands, which were found to have lower TOC than inthe older stands, also had lower diuron Kd values. In intensively managed orchards, sorption affinity ofpesticides to soils was not only affected by soil properties and terrain attributes but also by management
regime.. Introduction
Agricultural pesticides continue to contribute to the emergencef environmental and health risks. Active parent compounds andy-products have contaminated, in some cases, both soil and watercosystems near, or even several kilometers away from, vineyards,rchards and key agricultural production areas [1,2]. Assessing theisk and predicting the impact and movement of pesticides is crit-cal for informing both policy makers and growers.
Soil and topography are among the many factors that affect theehavior of pesticides and likelihood of off-site transport. Oliveirat al. [3] mapped the distribution of imazethapyr (a herbicide used
n soybean production) sorption based on soil pH variability. Latern, Farenhorst et al. [4] demonstrated the association of 2,4-D sorp-ion, soil organic matter and slope position, in which the greatest∗ Corresponding author at: DX650-DP614 Davies Bldg., Waite Campus, PMB 1,len Osmond, South Australia 5064, Australia. Tel.: +61 8 8303 7317;
ax: +61 8 8303 6717.E-mail addresses: [email protected] (D.P. Oliver),
[email protected] (B. Ostendorf), [email protected]. Forrester), [email protected] (D.J. Chittleborough),[email protected] (J.L. Hutson), [email protected] (R.S. Kookana).
304-3894/$ – see front matter © 2012 Elsevier B.V. All rights reserved.oi:10.1016/j.jhazmat.2012.03.050
© 2012 Elsevier B.V. All rights reserved.
sorption was found in lower landscape positions with higher soilorganic matter. More recently, topographic analysis in mappingthe distribution of soil properties and processes (or soil-landscapemodeling) has become increasingly used to assess the movementand behavior of agricultural pesticides at the landscape level. Forinstance, it was found that predicting the spatial distribution of2,4-D sorption using soil properties was enhanced by about 20%after incorporating terrain parameters [4,5]. There is evidence thatspatial estimates of pesticide sorption can be enhanced by reliableand easily accessible digital elevation data in combination with ter-rain attributes derived from these data. There is also an increasedrecognition that spatial factors influence the distribution of pes-ticide sorption. However, little is known about how within-fieldmanagement practices interact with natural biophysical variabilityin order to mitigate pesticide offsite impacts. In a heterogeneouslymanaged hilly orchard, for instance, the effect of topography on soildistribution is masked by the long-term differential managementin the alley and tree line [6]. Thus, management practices affectsoil variability and hence have the potential to influence pesticide
sorption characteristics.However, mapping of the spatial distribution of pesticide sorp-tion relies on a spatially adequate and representative set of soilsamples. This makes it necessary to explore new techniques that

ous M
rdwuscsas
sp(iabebGb
aapR
2
2
w1vmoydrrtPswu
ttT
TS
Td
B.P. Umali et al. / Journal of Hazard
educe soil and pesticide analysis costs without compromising pre-iction accuracy. Recently, a mid-infrared spectroscopy coupledith partial least squares (MIR-PLS) technique was successfullysed to predict not only key soil properties [7] but also pesticideorption affinity [8]. This technique is a robust, multivariate statisti-al tool for quantitative analysis of mid-infrared (400–4000 cm−1)pectral data [9]. Applying these techniques has the potential tossist the process of elucidating the spatial distribution of pesticideorption.
Diuron (3′-(3,4-dichlorophenyl)-1,1-dimenthyl-urea) is a non-elective, systemic herbicide that blocks electron transport athotosystem II [10]. It is non-ionic, moderately soluble in water42 mg L−1) and breaks down to several derivatives. In Australia,t is used in irrigated and horticultural production areas [11]. As
widely used and persistent herbicide (DT50 = 75–100 d), it haseen detected in runoff, tile drain water [12], river systems [13] andnclosed seawater [14]. Diuron is moderately hydrophobic and itsehavior in soil is said to be influenced by soil organic carbon [15].iacomazzi and Cochet [10] wrote a comprehensive review on theehavior and the environmental effects of diuron.
The aim of this study was to investigate how sorption of diuron isffected by soil properties, terrain attributes and within-field man-gement practices (including orchard stand characteristics, age,lanting density, etc.) in a 5.6 ha apple orchard in the Mt. Loftyanges (MLR), South Australia.
. Methodology
.1. Study site, soil sampling and terrain parameterization
The study site is located in the central Mount Lofty Ranges (MLR)hich is 30 km east of Adelaide, South Australia (34◦54.918′′S
38◦48.107′′E). The 5.6 ha orchard is planted to apples of variousarieties and was established in the early 1960s. It is hilly withean elevation of 513 m, maximum slope of 30◦ and mean slope
f 13◦. The area has a Mediterranean climate with long-term (50) average maximum and minimum temperatures of 12 ◦C and 5 ◦Curing winter months and 26 ◦C and 14 ◦C during summer months,espectively, and a xeric soil moisture regime. The mean monthlyainfall from 1970 to 2000 was approximately 150 mm in the win-er and 32 mm in the summer. The soils at the site developed fromroterozoic shales, siltstones and metasandstones [16] and are clas-ified as Petroferric, Melanic-Vertic, Red-Yellow Chromosols [17],hich dominate (about 60%) the entire MLR region. Profiles on thepper slopes are thin, moderately gravelly and silty.
The study site (5.6 ha) was divided into five management zoneshat were unique in at least one of the following characteris-ics: tree age, variety of apples, and tree spacing or density.hese zones were: A – planted in 2006, Pink Lady variety,
able 1ummary statistics of soil properties and diuron Kd determined for soils from alley and tr
Variable Sampling location
TOC, % Alley
Tree line
pHw Alley
Tree line
ECa, �S cm−1 Alley
Tree line
% Clay content (<0.002 mm) Alley
Tree line
Diuron Kd , L kg−1 AlleyTree line
OC, total organic carbon; EC, electrical conductivity (a log-transformed data); pHw, pH
ifferent (p < 0.05).
aterials 217– 218 (2012) 398– 405 399
3.5 m × 1 m spacing (2860 trees per ha); B – planted in 1980,Royal Gala variety, 4.5 m × 2 m spacing (1110 trees per ha); C –planted in 1960, Jonathan and Granny Smith varieties, 4.5 m × 2 mspacing (1110 trees per ha); D – planted in 1960, inter-row ofJonathan-Granny Smith and Pink Lady varieties, 4.5 m × 2 m spac-ing (1110 trees per ha); and E – planted in 1960, Jonathan andGranny Smith varieties, 5 m × 4 m spacing (500 trees per ha). Adja-cent orchards and orchards throughout region are managed in asimilar manner but zones may vary in configuration and size. Astratified random sampling technique was used to collect soil sam-ples. A total of 100 sampling locations were randomly selectedacross the study site, in effect 20 samples were collected in zoneA, 5 in zone B, 32 each in zones C and D and 11 in zone E. Thenumber of samples in each zone was decided based on size andcomplexity of the terrain. Sampling locations were referenced usinga high-sensitivity (∼2 m accuracy) global positioning system (GPS)device. Each sampling location corresponded to a pair of samplingunits that represented the alley and the tree line. This resulted in200 (2 × 100) sampling points. In each sampling point, a 0.25 m2
area was established where 5 soil samples were taken – one atthe center and 4 at each corner, which were composited. The sam-ples were air-dried and sieved to <2 mm. As part of the orchardfloor management, sod strips using a variety of grass species weremaintained in the alley. In contrast, a clear apple tree under-storey was maintained in the tree-line which was mulched onlyat the establishment phase. Relevant soil properties were deter-mined in a previous study and are summarized in Table 1 [6].For the purpose of this study, properties considered to influencethe behavior of diuron sorption were used, namely: total organiccarbon (TOC, %); soil pH in 1:1 H2O suspension (pHw); electricalconductivity (EC, �S cm−1); and clay (<0.002 mm) content (Clay,%).
Key terrain parameters were derived from a 5 m digital elevationmodel (DEM) produced from elevation and drainage datasets [18]obtained in digital format from the Department of Environmentand Natural Resources of South Australia (DENR-SA). The DEM wassmoothed [19] and sampled using the GPS locations of the samplingpoints. The terrain variables used in this study were: elevation (Ele-vation, m), slope (Slope,◦), mean curvature (MeanC,◦ m−1), specificcatchment area (SCA, m2 m−1), and wetness index (WI). Elevation isthe vertical height with reference to mean sea level. Slope is the rateof change of elevation with horizontal distance. Mean curvature(MeanC) describes the flow convergence and relative decelerationof material flow. Specific catchment area (SCA) is the ratio of thearea upslope of a contour segment that contributes flow to that
segment to the length of that segment [20]. Wetness index (WI) isa gauge used to characterize spatial distribution of surfacesaturation [21]. A more detailed explanation and calculation ofthese parameters is given in Wilson and Gallant [20].ee line.
Min Mean Max
2.2 4.5b 7.01.6 3.4a 5.5
6.10 6.9a 7.55.40 7.0a 7.6
5.20 5.96b 6.595.08 5.77a 6.98
16.1 23.3a 33.816.7 23.1a 35.7
12.6 28.3b 46.27.9 23.8a 42.0
1:1 soil:H2O. Means within a variable denoted by same letter are not significantly

4 ous M
2
oilucbdci2wf0tupH2tiio(ses
t0wsporti
ta(nrS1puuAfioT4r(tPerlTcUp
00 B.P. Umali et al. / Journal of Hazard
.2. Diuron sorption determination by mid-infrared spectroscopy
Diuron was used as a test chemical and as a representativef a moderately hydrophobic, neutral pesticide. Due to the costnvolved in determining sorption coefficient (Kd) using traditionalaboratory techniques, diuron Kd for all soil samples was predictedsing a MIR-PLS technique. For this study, the predictions werealibrated by analyzing a sub-set (50 samples) using traditionalatch equilibrium method [22]. The soils selected for traditionaletermination of Kd values (reference analysis) were chosen toover the range of total organic carbon content (1.55–6.97%) foundn our study site. In the batch sorption experiment, 25 mL of
mg L−1 diuron solution was added to 5 g soil (in triplicate). Soilsere shaken for 24 h on an end-over-end shaker then centrifuged
or 10 min at 3500 × g. The supernatant was filtered through a.45 �m polytetraflouroethylene (PTFE) syringe filter. The concen-ration of the remaining diuron in the solution was measuredsing an established protocol for diuron analysis on a high-erformance liquid chromatograph (HPLC) [8,23]. The Agilent 1100PLC was fitted with an Altima HP C18 column (5 �m particle size;50 mm × 4.6 mm internal diameter). The mobile phase was ace-onitrile:water (60:40) with a flow rate of 1 mL min−1 and a samplenjection volume of 20 �L. The amount of diuron sorbed by soils the difference between the initial and the final concentrationf diuron in the solution after equilibration. Sorption coefficientKd) values were calculated as the ratio of diuron sorbed by theoil to that remaining in the solution. Method reproducibility wasnsured by routine analysis of blanks and a series of standard diuronolutions.
Losses of diuron on the polypropylene tubes and PTFE syringe fil-ers were tested. Diuron solution with varying concentrations (0.25,.45 and 0.95 �g mL−1) was prepared. About 20 mL of each solutionas placed in polypropylene tubes (replicated) and shaken along
ide the batch with soil solution. Another 5 mL of each solution wasassed through PTFE syringe filters (replicated). About 6% loss wasbserved in the polypropylene tubes and none in the filters. Cor-ections, due to losses of diuron on the polypropylene tubes, werehen made to the concentration of diuron remaining in the solutionn calculating soil sorption.
To predict diuron Kd values by chemometric analysis, we usedhe spectral data in the frequency range 4000–500 cm−1 scannedt 8 cm−1 resolution using a PerkinElmer Spectrum One FT-IRPerkinElmer, Wellesley, MA) obtained using 0.1 g of soil placedeatly in a stainless steel sample cup. The spectrometer has aestricted frequency range within the desired spectral region.amples were prepared for scanning, without dilution, by crushing0 g of the sample in a vibrating ring mill equipped with a steeluck for 60 s. The MIR data in absorbance units was transformedsing baseline offset and linear baseline correction prior to analysissing The Unscramber X (version 10.1 Camo Software, Norway).
principal component analysis (PCA) of the spectral data wasrst carried out which revealed no potential extreme spectralutliers using Hotelling T2 statistics at 5% level of significance.he MIR data was then used as the independent variable (in46 × 50 matrix form) and the laboratory-derived diuron Kd as theesponse variable (in 1 × 50 matrix) in the partial least squaresPLS) regression [8]. The PLS regression projects the spectral andhe response variable to a small number of “latent” variables calledLS loadings [24]. Both data sets were mean centered and givenqual weights upon implementation of the regression. Initial PLSegression showed four samples had high leverage and deviatedargely from the regression line and were thus removed as outliers.
he PLS regression was recalculated without the outliers and a fullross-validation procedure was made to assess model reliability.sing the constructed cross-validated model, diuron Kd wasredicted for the rest of the samples along with the samples usedaterials 217– 218 (2012) 398– 405
in the PLS regression ensuring all sampling points had diuron Kdvalues from the same data source. The predicted values were thenused in subsequent analysis and spatial interpolation.
2.3. Statistics and modeling spatial distribution of diuron Kdvalues
The distribution of the soils data was analyzed using standardstatistical parameters and the Shapiro–Wilks test of normality.Results indicated that EC data for both sampling locations werepositively skewed and were log transformed. The Pearson productmoment (r) was used to assess the level of correlation betweendiuron Kd and the independent variables (soil properties and ter-rain parameters). Statistical inferences were done simultaneouslyfor all variables, therefore, the adjusted p-value (p) using Holm’smethod [25] was used to infer significant correlation between vari-ables. Significant mean difference between alley and tree-line soilproperties was determined using the Welch modified test. Effectsplots [26] were used to illustrate the effects of zones and sam-pling location on TOC and diuron Kd. Means of TOC and diuronKd were plotted in each management zone and sampling location.Least square difference (LSD) values were calculated at p < 0.05 foreach interaction pair and used to compare mean difference. Soil-landscape modeling of diuron Kd was also done using soil properties(Ksoil alley
d, Ksoil treeline
d), terrain parameters (K terr alley
d, K terr treeline
d),
and the combination of soil and terrain variables (Ksoilterr alleyd
,Ksoilterr treeline
d). Because the independent variables had various
units, scaling to unit variance was done using the equation:
XST = (X − �)�
,
where XST is the standardized value, X is the original value, � isthe mean, and � is the standard deviation. PLS regression modelswere developed using the nonlinear iterative partial least squares(NIPALS) algorithm [24] to model diuron sorption affinity in thealley and in the tree-line.
To create a visual spatial interpolation of the diuron Kd, we usedthe ordinary kriging procedure in ArcMAP 10 (ESRI, Redlands, CA).Semi-variogram analysis performed in Vesper v1.62 [27] showed aspatially autocorrelated diuron Kd. Kriging parameters were set at amaximum lag size of 300 m divided into 15 lag distance classes. Thealley and tree line boundaries were first digitized using an orthorec-tified high-resolution satellite image of the study site. Ordinarykriging of diuron Kd was done on each of the alley and tree linedata set. Then the two interpolated maps were overlaid.
3. Results and discussion
3.1. Prediction of diuron Kd affinity using MIR-PLS model
The PLS regression performed in this study showed that spectraldata were useful in inferring sorption properties of our soil sam-ples for diuron. Two of the seven PLS loadings used to generate theMIR-PLS model to predict diuron Kd for all soil samples are pre-sented in Fig. 1. Positive peaks corresponding to both clay (near3550 cm−1 and 3650 cm−1) and organic matter (near 2900 cm−1)characterized the first PLS loading. The cumulative explained vari-ance of all seven loadings was 90%. Cross validation showed goodagreement between the Kd values for diuron predicted by the MIRtechnique and those determined by conventional batch equilibriummethodology in the laboratory with R2 = 0.79 (p < 0.001) and a stan-dard error of cross-validation (SECV) of 2.84 (Fig. 2). The SECV is a
measure of the size of the probable error occurring in the modelprediction. Forouzangohar et al. [8] reported an R2 and SECV ofaround 0.81 and 2.39, respectively, in recent work on diuron Kdprediction using MIR-PLS. Based on this relationship, the PLS model
B.P. Umali et al. / Journal of Hazardous Materials 217– 218 (2012) 398– 405 401
t of th
ww24b
3p
rao
Fb
Fig. 1. Partial least squares (PLS) loadings weigh
as used to predict diuron Kd values for the rest of the samples,hich was used in subsequent analyses. The mean diuron Kd was
8.3 L kg−1 while the minimum and maximum values were 7.9 and6.2 L kg−1, respectively (Table 1), which followed Gaussian distri-ution at p < 0.05.
.2. Relationship of diuron Kd with soil properties and terrainarameters
Correlation analysis of diuron Kd with soil and terrain variablesevealed that the strength of correlation was different between thelley and the tree-line (Table 2). Generally, stronger correlation wasbserved in the alley than in the tree-line. For instance, the value
ig. 2. Relationship between diuron Kd values predicted using MIR-PLS and those determiatch sorption techniques (dotted line is the 1 is to 1 line; SECV is standard error of the c
e first two factors used in the regression model.
of r for the association of diuron Kd and TOC in the alley was 0.70(p < 0.001) while in the tree-line was 0.55 (p < 0.001). The differencemay be explained by low TOC in the tree-line and, thus, low sorptionaffinities. Also, a stronger negative correlation was observed in thealley (r = −0.56; p < 0.001) than in the tree-line (r = −0.35; p < 0.01)for diuron Kd and slope. We argue that this was due to the fact thatthe negative correlation of TOC and slope was also stronger in thealley (r = −0.53; p < 0.001) than in the tree-line (r = −0.29; ns). Thismeans that for our site, areas with steep slopes have low TOC but
because of the addition of mulch in the tree-line (as a consequenceof management practices), the effect of slope on TOC was masked[6]. These observations necessitated the development of regressionmodel and kriging estimation unique for alley and for tree-line soils.ned on the subset (n = 46; 4 outliers were removed) of samples using the traditionalross-validation). MIR-PLS – mid-infrared partial least squares technique.

402 B.P. Umali et al. / Journal of Hazardous Materials 217– 218 (2012) 398– 405
Table 2Correlation matrix of diuron sorption affinity (Kd), soil properties and terrain parameters for alley (in bold) and tree-line (in bold-italics).
Kd TOC pHw ECa Clay Elevation Slope MeanC SCA WI
Kd 1 0.70*** −0.35* 0.12 −0.2 −0.35** −0.56*** 0.24 0.3 0.47***
TOC 0.55*** 1 0.07 0.55*** 0.14 0.09 −0.53*** −0.04 0.04 0.18pHw −0.56*** −0.08 1 0.27 0.25 0.34* −0.06 −0.25 −0.14 −0.19ECa −0.07 0.44*** 0.03 1 0.23 −0.02 −0.20 −0.10 −0.19 −0.14Clay −0.25 −0.11 0.10 0.01 1 0.22 −0.16 −0.38** −0.34* −0.37**
Elevation −0.04 −0.42*** −0.02 0.50*** 0.09 1 0.12 −0.17 −0.29 −0.42***
Slope −0.35** −0.29 −0.26 0.20 −0.10 0.12 1 0.08 0.72*** −0.32*
MeanC 0.12 −0.10 −0.16 −0.17 −0.38** −0.17 0.08 1 −0.1 0.7SCA 0.20 0.03 −0.12 −0.18 −0.33* −0.29 −0.1 0.72*** 1 0.9***
** 5** *** * *** ***
T transfi etho
fc(rg
rievieKtaatdaattcnb
dsletfttt
T
TS
RS
WI 0.29 0.01 −0.09 −0.35 −0.3
OC, total organic carbon, pHw, pH 1:1 soil:H2O; EC, electrical conductivity (alog-ndex. ***p < 0.001, **p < 0.01, *p < 0.05 where p is the adjusted p-value using Holm’s m
The effect of TOC on the diuron Kd affinity may also be inferredrom the MIR-PLS regression. A positive contribution of organicarbon around 2900 cm−1 was revealed by the first PLS loadingFig. 1). Also, previous work on solid-state 13C nuclear magneticesonance spectroscopy suggested that certain carbon functionalroups influence diuron sorption [15].
Other factors aside from TOC, may affect diuron Kd affinity. In aecent study, Stork et al. [12] detected more than 70% of diuron andts metabolites in the top 15 cm of soil in the field after application,ven at TOC level just less than 1%. It was found that, at low TOCalues, the sorption of non-ionic pesticides such as diuron, may bendirectly affected by other soil properties such as pH and cationxchange capacity [28]. The negative correlation (p < 0.05) of diurond with pHw was noted by Gaillardon et al. [29] who attributed thiso the interaction of diuron molecules with cationic species suchs Fe3+ and Al3+ in humic substances. However, we cannot confirmt this stage whether our samples have high Fe3+ and Al3+ con-ents. Unexpectedly, clay content was negatively correlated withiuron Kd. In most circumstances, even for neutral molecules suchs diuron, Kd is normally positively correlated with clay content [30]s an indirect effect of clay and TOC correlation. We found, however,hat there is no significant correlation between TOC and clay con-ent for our soil samples. In a related study, it was also found thatlay and sorption properties were inversely related [31] for twoon-ionic organic compounds (phenanthrene and dibenzofuran),ut no further explanation was given.
The relationships of diuron Kd with terrain parameters variedepending on sampling location (Table 2). Generally, the relation-hip was stronger in the alleys and weaker or negligible in the treeine. For instance, diuron Kd values were negatively correlated withlevation in the alley (r = −0.35; p < 0.001) but not in the tree line. Inerms of slope, the negative correlation with diuron Kd decreasedrom r = −0.56 (p < 0.001) in the alley to r = −0.35 (p < 0.01) in theree line. The negative correlation of diuron Kd values with eleva-
ion (in the alley) and slope (both alley and tree line) may be dueo loss of organic matter and clay from erosion zones.The result of the soil-landscape modeling is summarized inable 3. Using only either soil properties or terrain variables, the
able 3oil landscape models for diuron Kd using partial least squares (PLS) regression.
Model Model parameter input
Ksoil alleyd TOC, pHw, ECa, Clay
Ksoil treelined
K terr alleyd Elevation, Slope, MeanC, SCA, WI
K terr treelined
Ksoilterr alleyd TOC, pHw, ECa, Clay, Elevation, Slope, MeanC, SCA, WI
Ksoilterr treelined
MSEP, root means square error of the prediction; TOC, total organic carbon, pHw, pH 1:1 soCA, specific catchment area; WI, wetness index.
* All models p < 0.001
−0.42 −0.32 0.7 0.9 1
ormed data); MeanC, mean curvature, SCA, specific catchment area; WI, wetnessd.
R2 and RMSEP values were better in the alley than in the tree-line.Moreover, the tree line PLS regression model for diuron Kd usingonly terrain variables was very poor (R2 0.09). However, when soilproperties and terrain variables were both used as input parame-ters, the regression models improved by as much as 8× (Table 3).PLS loadings indicate that in the first component of the regressionmodels (Ksoilterr alley
dand Ksoilterr treeline
d), the greatest relative con-
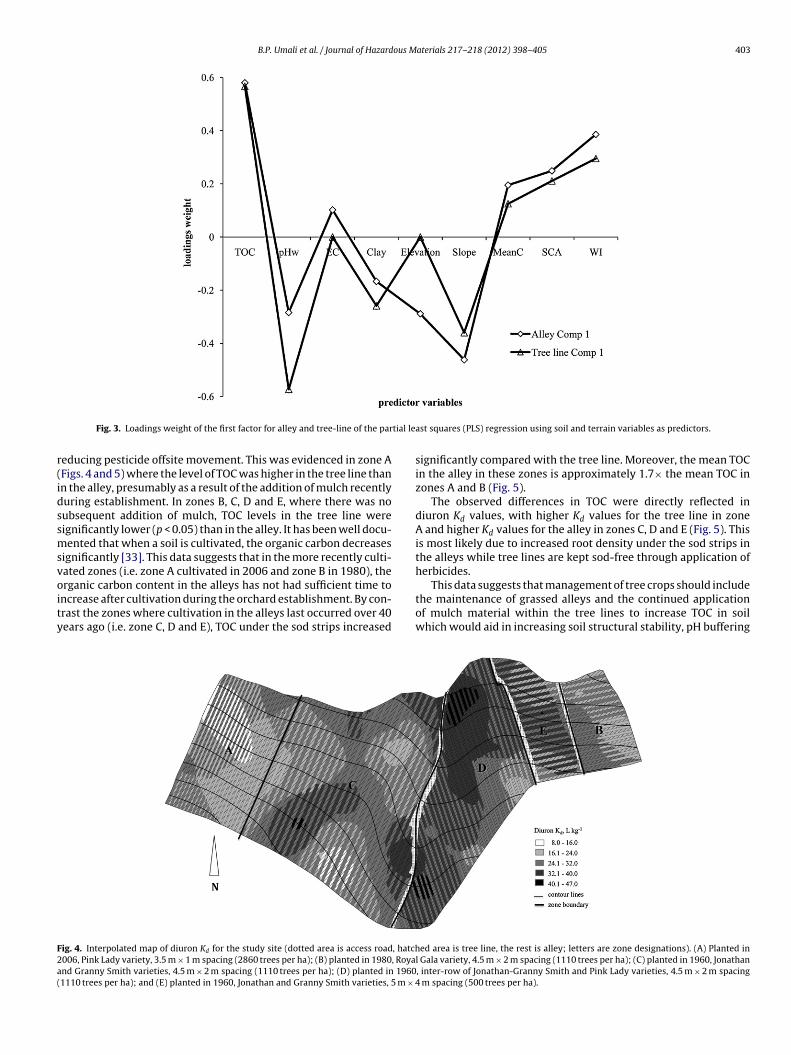
tribution came from TOC, pHw, slope and WI (Fig. 3). The effectof terrain on sorption properties cannot be overemphasized butshould be considered as shown here and in other earlier works[4,5]. The implication of this is that the fate of a non-ionic herbicide,such as diuron, may be determined by hydrological processes, espe-cially events that induce surface runoff. Stork et al. [12] found in astudy conducted in a coastal catchment of southeast Queenslandthat about 0.6% of total diuron loading was detected (including twodiuron metabolites) in runoff and had the potential to accumulatein river sediments.
3.3. Sorption of diuron is affected by differential managementbetween alley and tree line
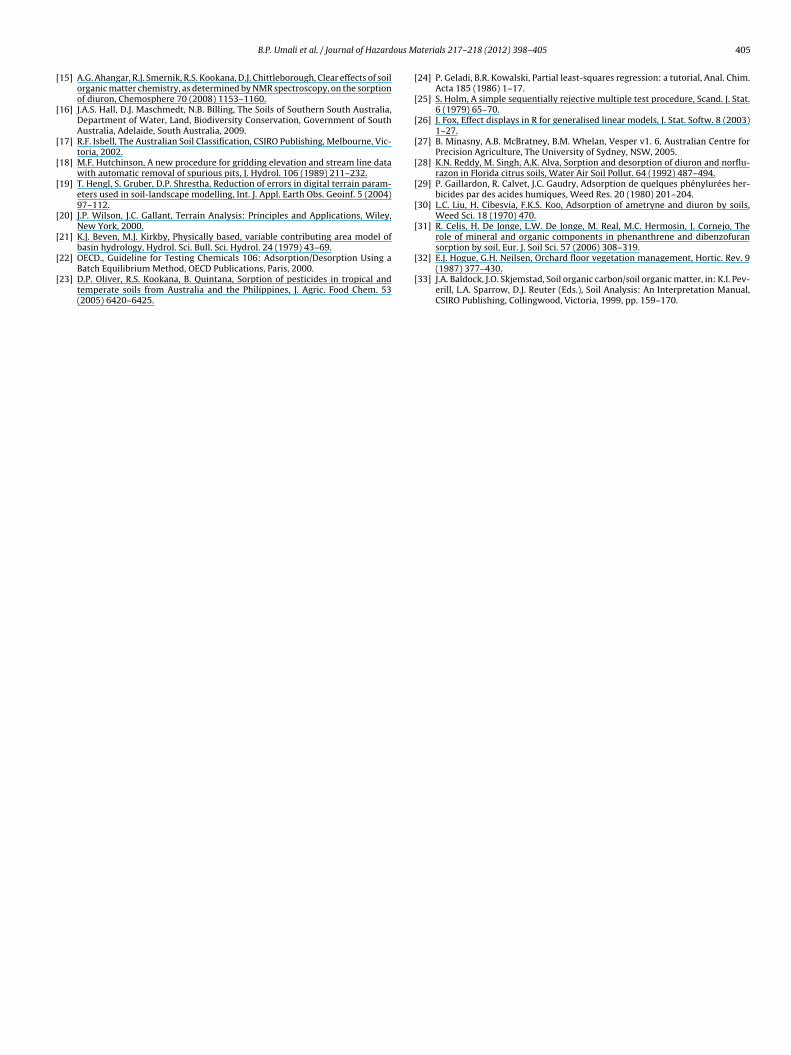
The kriged map of diuron Kd affinity shows the spatial variabil-ity of this property for the study site (Fig. 3). In this map, darkerregion corresponds to higher diuron Kd affinity and lighter regioncorresponds to lower diuron Kd affinity. The mean diuron Kd valuefor soils in the alley (28.3 L kg−1) was significantly greater (p < 0.05)than for soils in the tree line (23.8 L kg−1; hatched area in Fig. 4).The alley, where sod strips were maintained, also had significantlyhigher (p < 0.05) TOC than the tree line, which may explain thegreater sorption of diuron (Table 1).
The establishment of sod strips in the alley and a sod-free treeline in apple orchard management is a common practice in the MLRand other apple growing areas [32] since apple trees do not com-pete well for nutrients and water. However, growers commonly
add straw mulch to reduce erosion risk, minimize evaporationand protect newly established trees, but only in the first year ofestablishment. This can provide soil in the tree line an additionalsource of organic carbon to which diuron may sorb potentiallyNo. of components in the PLS* R2 RMSEP (L kg−1)
2 0.67 0.572 0.61 0.622 0.37 0.782 0.09 0.953 0.75 0.543 0.73 0.54
il:H2O; EC, electrical conductivity (alog-transformed data); MeanC, mean curvature,
B.P. Umali et al. / Journal of Hazardous Materials 217– 218 (2012) 398– 405 403
tial le
r(idssmsvoity
F2a(
Fig. 3. Loadings weight of the first factor for alley and tree-line of the par
educing pesticide offsite movement. This was evidenced in zone AFigs. 4 and 5) where the level of TOC was higher in the tree line thann the alley, presumably as a result of the addition of mulch recentlyuring establishment. In zones B, C, D and E, where there was noubsequent addition of mulch, TOC levels in the tree line wereignificantly lower (p < 0.05) than in the alley. It has been well docu-ented that when a soil is cultivated, the organic carbon decreases
ignificantly [33]. This data suggests that in the more recently culti-ated zones (i.e. zone A cultivated in 2006 and zone B in 1980), the
rganic carbon content in the alleys has not had sufficient time toncrease after cultivation during the orchard establishment. By con-rast the zones where cultivation in the alleys last occurred over 40ears ago (i.e. zone C, D and E), TOC under the sod strips increasedig. 4. Interpolated map of diuron Kd for the study site (dotted area is access road, hatch006, Pink Lady variety, 3.5 m × 1 m spacing (2860 trees per ha); (B) planted in 1980, Royand Granny Smith varieties, 4.5 m × 2 m spacing (1110 trees per ha); (D) planted in 19601110 trees per ha); and (E) planted in 1960, Jonathan and Granny Smith varieties, 5 m ×
ast squares (PLS) regression using soil and terrain variables as predictors.
significantly compared with the tree line. Moreover, the mean TOCin the alley in these zones is approximately 1.7× the mean TOC inzones A and B (Fig. 5).
The observed differences in TOC were directly reflected indiuron Kd values, with higher Kd values for the tree line in zoneA and higher Kd values for the alley in zones C, D and E (Fig. 5). Thisis most likely due to increased root density under the sod strips inthe alleys while tree lines are kept sod-free through application ofherbicides.
This data suggests that management of tree crops should includethe maintenance of grassed alleys and the continued applicationof mulch material within the tree lines to increase TOC in soilwhich would aid in increasing soil structural stability, pH buffering
ed area is tree line, the rest is alley; letters are zone designations). (A) Planted inl Gala variety, 4.5 m × 2 m spacing (1110 trees per ha); (C) planted in 1960, Jonathan, inter-row of Jonathan-Granny Smith and Pink Lady varieties, 4.5 m × 2 m spacing4 m spacing (500 trees per ha).

404 B.P. Umali et al. / Journal of Hazardous Materials 217– 218 (2012) 398– 405
Fig. 5. Means of diuron Kd (lower data, L kg−1) and total organic carbon (upper data, %) in the different management zones and sampling locations. (A) Planted in 2006,Pink Lady variety, 3.5 m × 1 m spacing (2860 trees per ha); (B) planted in 1980, Royal Gala variety, 4.5 m × 2 m spacing (1110 trees per ha); (C) planted in 1960, Jonathan andG , intert 4 m
s
csrpf
4
Pafs
sTdtats
ozeahet
A
tDhcmt
[
[
[
[
ranny Smith varieties, 4.5 m × 2 m spacing (1110 trees per ha); (D) planted in 1960rees per ha); and (E) planted in 1960, Jonathan and Granny Smith varieties, 5 m ×ignificantly different at p < 0.05.
apacity, soil nutrient levels, water holding capacity [33] as well asorbing pesticides. Finally, we suggest that growers ensure that theisk for offsite movement of pesticides is avoided by managementractices that take into account the spatial variability of sorptionor pesticides.
. Conclusion
In this study, we used a recently developed technique (MIR-LS) to predict Kd values for diuron. The technique allows for quicknd less expensive determination of sorption properties therebyacilitating faster assessment of the distribution and potential off-ite migration of herbicides and other agro-chemicals.
Soil properties together with terrain parameters influenced thepatial distribution of diuron sorption affinity at our study site.he level of TOC appears to be the parameter that most influencesiuron sorption. TOC varied with different stand age and betweenhe alleys and the tree lines within each zone. Slope and WI werelso correlated with diuron sorption affinity. Variable soil proper-ies and terrain properties resulted in spatial variability in herbicideorption affinity.
Management practices were also found to affect the distributionf diuron Kd values, mostly through their effects on TOC levels. Theones (differentiated by variable tree age, density and apple vari-ty) influenced the distribution of soil properties and consequentlyffected the sorption of diuron. This implies that a differentialerbicide or pesticide application or management regime such asxtended or continued mulching after establishment might needo be observed to reduce offsite impacts of herbicide applications.
cknowledgements
We thank Jenny Anderson of CSIRO Land and Water for theechnical support in the conduct of the batch sorption experiment,r. Mohsen Forouzangohar of the University of Melbourne for
is advice on MIR-PLS, Dr. Ronald Smernik for providing valuableomments to the manuscript, and the Department of Environ-ent and Natural Resources – South Australia for providing theopographic data. The lead author thanks the Australian Centre for
[
-row of Jonathan-Granny Smith and Pink Lady varieties, 4.5 m × 2 m spacing (1110spacing (500 trees per ha). Means for Kd or TOC denoted with same letter are not
International Agricultural Research (ACIAR) for funding throughthe John Allwright Fellowship.
References
[1] C. Wesseling, R. McConnell, T. Partanen, C. Hogstedt, Agricultural pesticide usein developing countries: health effects and research needs, Int. J. Health Serv.27 (1997) 273–308.
[2] R.J. Gilliom, J.E. Barbash, C.G. Crawford, P.A. Hamilton, J.D. Martin, N. Nakagaki,L.H. Nowell, J.C. Scott, P.E. Stackelberg, G.P. Thelin, D.M. Wolock, The qualityof our nation’s waters-Pesticides in the nation’s streams and ground water,1992–2001, in: U.S. Geological Survey Circular 1291, U.S. Geological Survey,2006, 2006, pp. 172.
[3] R.S. Oliveira, W.C. Koskinen, F.A. Ferreira, B.R. Khakural, D.J. Mulla, P.J. Robert,Spatial variability of imazethapyr sorption in soil, Weed Sci. 47 (1999) 243–248.
[4] A. Farenhorst, S.K. Papiernik, I. Saiyed, P. Messing, K.D. Stephens, J.A. Schu-macher, D.A. Lobb, S. Li, M.J. Lindstrom, T.E. Schumacher, Herbicide sorptioncoefficients in relation to soil properties and terrain attributes on a cultivatedprairie, J. Environ. Qual. 37 (2008) 1201.
[5] A. Farenhorst, I.V. Florinsky, C.M. Monreal, D. Muc, Evaluating the use of digitalterrain modelling for quantifying the spatial variability of 2,4-D sorption by soilwithin agricultural landscapes, Can. J. Soil Sci. 83 (2003) 557–564.
[6] B.P. Umali, D.P. Oliver, S.T. Forrester, D.J. Chittleborough, J.L. Hutson, R.S.Kookana, B.F. Ostendorf, The effect of terrain and management on the spatialvariability of soil properties in an apple orchard, Catena (2012).
[7] L.J. Janik, J.O. Skjemstad, Characterization and analysis of soils using mid-infrared partial least-squares. II. Correlations with some laboratory data, Aust.J. Soil Res. 33 (1995) 637–650.
[8] M. Forouzangohar, R.S. Kookana, S.T. Forrester, R.J. Smernik, D.J. Chittlebor-ough, Midinfrared spectroscopy and chemometrics to predict diuron sorptioncoefficients in soils, Environ. Sci. Technol. 42 (2008) 3283–3288.
[9] D.M. Haaland, E.V. Thomas, Partial least-squares methods for spectral analy-ses. 2. Application to simulated and glass spectral data, Anal. Chem. 60 (1988)1202–1208.
10] S. Giacomazzi, N. Cochet, Environmental impact of diuron transformation: areview, Chemosphere 56 (2004) 1021–1032.
11] K.H. Bowmer, W. Kort, A. Scott, G. McCorkelle, M. Thomas, Pesticide moni-toring in the irrigation areas of South-western New South Wales, Australia1990–1995, in: CSIRO Land and Water, 1998.
12] P.R. Stork, F.R. Bennett, M.J. Bell, The environmental fate of diuron under aconventional production regime in a sugarcane farm during the plant canephase, Pest Manag. Sci. 64 (2008) 954–963.
13] B. Meyer, J.Y. Pailler, C. Guignard, L. Hoffmann, A. Krein, Concentrations of dis-
solved herbicides and pharmaceuticals in a small river in Luxembourg, Environ.Monit. Assess. (2010) 1–20.14] K. Martinez, I. Ferrer, M.D. Hernando, A.R. Fernandez-Alba, R.M. Marce, F.Borrull, D. Barcello, Occurrence of antifouling biocides in the Spanish Mediter-ranean marine environment, Environ. Technol. 22 (2001) 543–552.
ous M
[
[
[
[
[
[
[
[
[
[
[
[
[
[
[
[
[
B.P. Umali et al. / Journal of Hazard
15] A.G. Ahangar, R.J. Smernik, R.S. Kookana, D.J. Chittleborough, Clear effects of soilorganic matter chemistry, as determined by NMR spectroscopy, on the sorptionof diuron, Chemosphere 70 (2008) 1153–1160.
16] J.A.S. Hall, D.J. Maschmedt, N.B. Billing, The Soils of Southern South Australia,Department of Water, Land, Biodiversity Conservation, Government of SouthAustralia, Adelaide, South Australia, 2009.
17] R.F. Isbell, The Australian Soil Classification, CSIRO Publishing, Melbourne, Vic-toria, 2002.
18] M.F. Hutchinson, A new procedure for gridding elevation and stream line datawith automatic removal of spurious pits, J. Hydrol. 106 (1989) 211–232.
19] T. Hengl, S. Gruber, D.P. Shrestha, Reduction of errors in digital terrain param-eters used in soil-landscape modelling, Int. J. Appl. Earth Obs. Geoinf. 5 (2004)97–112.
20] J.P. Wilson, J.C. Gallant, Terrain Analysis: Principles and Applications, Wiley,New York, 2000.
21] K.J. Beven, M.J. Kirkby, Physically based, variable contributing area model ofbasin hydrology, Hydrol. Sci. Bull. Sci. Hydrol. 24 (1979) 43–69.
22] OECD., Guideline for Testing Chemicals 106: Adsorption/Desorption Using aBatch Equilibrium Method, OECD Publications, Paris, 2000.
23] D.P. Oliver, R.S. Kookana, B. Quintana, Sorption of pesticides in tropical andtemperate soils from Australia and the Philippines, J. Agric. Food Chem. 53(2005) 6420–6425.
[
[
aterials 217– 218 (2012) 398– 405 405
24] P. Geladi, B.R. Kowalski, Partial least-squares regression: a tutorial, Anal. Chim.Acta 185 (1986) 1–17.
25] S. Holm, A simple sequentially rejective multiple test procedure, Scand. J. Stat.6 (1979) 65–70.
26] J. Fox, Effect displays in R for generalised linear models, J. Stat. Softw. 8 (2003)1–27.
27] B. Minasny, A.B. McBratney, B.M. Whelan, Vesper v1. 6, Australian Centre forPrecision Agriculture, The University of Sydney, NSW, 2005.
28] K.N. Reddy, M. Singh, A.K. Alva, Sorption and desorption of diuron and norflu-razon in Florida citrus soils, Water Air Soil Pollut. 64 (1992) 487–494.
29] P. Gaillardon, R. Calvet, J.C. Gaudry, Adsorption de quelques phénylurées her-bicides par des acides humiques, Weed Res. 20 (1980) 201–204.
30] L.C. Liu, H. Cibesvia, F.K.S. Koo, Adsorption of ametryne and diuron by soils,Weed Sci. 18 (1970) 470.
31] R. Celis, H. De Jonge, L.W. De Jonge, M. Real, M.C. Hermosin, J. Cornejo, Therole of mineral and organic components in phenanthrene and dibenzofuransorption by soil, Eur. J. Soil Sci. 57 (2006) 308–319.
32] E.J. Hogue, G.H. Neilsen, Orchard floor vegetation management, Hortic. Rev. 9(1987) 377–430.
33] J.A. Baldock, J.O. Skjemstad, Soil organic carbon/soil organic matter, in: K.I. Pev-erill, L.A. Sparrow, D.J. Reuter (Eds.), Soil Analysis: An Interpretation Manual,CSIRO Publishing, Collingwood, Victoria, 1999, pp. 159–170.
Copyright © 2022 FDOKUMEN