ACCUMULATION OF HEAVY METALS IN MANGROVE SEDIMENTS OF CHUMPHON PROVINCE, THAILAND
Upload
independentCategory
view
4download
0
Environ Monit Assess (2012) 184:2763–2773DOI 10.1007/s10661-011-2149-9
Spatial distribution and multiple sources of heavy metalsin the water of Chaohu Lake, Anhui, China
Guolian Li · Guijian Liu · Chuncai Zhou ·Chen-Lin Chou · Liugen Zheng · Jizhong Wang
Received: 23 June 2010 / Accepted: 25 May 2011 / Published online: 24 June 2011© Springer Science+Business Media B.V. 2011
Abstract In this study, a survey for the spatialdistribution of heavy metals in Chaohu Lake ofChina was conducted. Sixty-two surface watersamples were collected from entire lake includingthree of its main river entrances. This is the firstsystematic report concerning the content, distri-bution, and origin of heavy metals (Cu, Cr, Cd,Hg, Zn, and Ni) in the Chaohu Lake water. Theresults showed that heavy metals (Cu, Cr, Zn,and Ni) concentrations in the estuary of NanfeiRiver were relatively higher than those in theother areas, while content of Hg is higher in thesoutheast lake than northwest lake. Moreover, Cdhas locally concentration in the surface water fromthe entire Chaohu Lake. The heavy metal aver-age concentrations, except Hg, were lower thanthe cutoff values for the first-grade water quality
G. Li · G. Liu (B) · C. Zhou · L. Zheng · J. WangCAS Key Laboratory of Crust-Mantle Materials andEnvironment, School of Earth and Space Sciences,University of Science and Technology of China, Hefei,Anhui 230026, Chinae-mail: [email protected]
G. Li · G. LiuState Key Laboratory of Loess and QuaternaryGeology, Institute of Earth Environment, The ChineseAcademy of Sciences, Xi’an, Shaanxi 710075, China
C.-L. ChouIllinois State Geological Survey (emeritus),University of Illinois, Champaign, IL 61820, USA
(China Environment Quality Standard) which wasset as the highest standard to protect the socialnature reserves. The Hg content is between thegrades three and four water quality, and otherheavy metals contents are higher than backgroundvalues. The aquatic environment of Chaohu Lakehas apparently been contaminated. Both the clus-ter analysis (CA) and correlation analysis provideinformation about the origin of heavy metals inthe Lake. Our findings indicated that agriculturalactivities and adjacent plants chimneys may con-tribute the most to Cd and Hg contamination ofChaohu Lake, respectively.
Keywords Chaohu Lake · Heavy metaldistribution · Lake water
Introduction
The Chaohu Lake (N31◦43′28′′–N31◦25′28′′, E117◦16′54′′–E117◦51′46′′) is situated in AnhuiProvince, China. It covers an area of 780 km2 andis the fourth largest freshwater lake in China. It issurrounded by six counties and two cites (locatedon northwest and east coast of the Lake). Thegeology structure of the Lake is influenced by afault. The area has an average annual rainfall of1,120 mm and the average annual temperature of15◦C∼16◦C with a sub-tropical monsoon climate.Chaohu Lake is important to many Anhui

2764 Environ Monit Assess (2012) 184:2763–2773
residents because it is a commercial fishing lakeand provides water supply, irrigation, navigation,tourism, and recreation. It is also natural habitatfor wildlife with wetland.
The Chaohu Lake region has had a traditionalagricultural-based economy and a centuries-oldhistory of cultivation (Qin and Chen 1996). Thecontinuous application of organic and inorganicfertilizers (For example, phosphate fertilizer con-tains heavy metals such as Cd, Cu, Hg, Ni, Pband Zn (Jones and Johnston 1989), and other soilamendments potentially aggravate the accumula-tion of heavy metals in agricultural soils (Huanget al. 2007; Lambert et al. 2007). Researchers(e.g., Bulut and Aksoy 2008) have pointed outthat only 10–15% of applied phosphate fertilizeris absorbed by the crops, while the rest is lost.With the rapid economic development in citiesin recent decades, an increasing amount of un-controlled domestic and industrial effluents havebeen drained into rivers and finally transported
into Chaohu Lake. There are nine major riversdraining into Chaohu Lake (Fig. 1), the pollu-tants are transported into the Lake. The metalcontents are very high at the conjunction of therivers, especially the Nanfei River passing throughthe center of Hefei city. More sampling siteswere increased at the entrances of Nanfei Riverand Yuxi River which are channels connectingChaohu Lake and the Yangtze River. The quan-tities of sewage discharged into the lake fromthe city are about 18,360 tons of total nitrogen(TN) and 1,050 tons of total phosphorus (TP)annually (Xu et al. 2005). Many studies havebeen on the eutrophication of the Lake. Butonly few studies have been conducted on thehazardous heavy metal contamination of ChaohuLake. Cao et al. (2004) studied the Pb contamina-tion in the eastern Chaohu Lake and (Wang et al.2003) analyzed several sediment samples from twostations of the west region of the Lake. Waterwith high metal concentrations is toxic to plants,
L1
L2
L3 L5
L4
L6
L7 L8
L9
L10
L11
L12
L13
L14
L15
L16
L17
L18 L19
L20
L21
L22
L23
L24
L25
L26
L27
L28
L29 L30
L31
L32L33
L34 L35
117o 21
31o 42´
31o 42´
31o 27´
31o 27´
117o 21´ 117o 33´ 117o 48´
117o 33´ 117o 48´
N
Nan Fei River
Yu Xi River
Hang Bu River
Tong Yang River
Ji Yu River
Zhe Gao River
Zhao River
Bai Sji Shan River
Shi Wu Li River
Pai River
He Fei CityFei Dong County
Fei Xi County
Shu Chen County
Hang Shan County
Lu Jiang County
Wu Wei County
Chao Hu City
Yangtze River
China
A15 A13A11 A9
A0A1A3A5A7
A17A19A21
A23
Yu Xi River
Nan Fei River
E17
E19
E21 E16
E14
E12
E0E1
E23
E25
E27
I1-I5
Fig. 1 Map showing the locations where surface water samples were collected at Chaohu Lake, Anhui, China

Environ Monit Assess (2012) 184:2763–2773 2765
animals, and human. This may happen directlythrough our daily use of water as well as indi-rectly by a long-term effect through their gradualbio-accumulation in the food chains (Gochfeld2003). In this study, we conducted systematicsampling of the surface water of Chaohu Lake.Abundances of six metals (Cd, Cr, Cu, Hg, Ni,and Zn) in surface water samples were deter-mined. These results were compared with levelsof metals in other world’s lakes. Correlation andcluster analysis were applied to identify pollutionsources and to pinpoint natural Vs anthropogeniccontribution.
Material and methods
The sampling was carried out in Oct. 2009. Sixty-two sample sites were positioned using the globalpositioning system(GPS). The vertical change ofwater quality in Chaohu Lake is not significantbecause of the wide lake area and its shallowness(average depth of 2.69 m). Samples of surfacewater were collected by hand from a fishing boatby submerging acid washed polyethylene bottlesapproximately 50 cm beneath the water surface.Arm-length gloves were used during sampling.Immediately on board, the water samples wereacidified to pH < 2.0 by the addition of concen-trated nitric acid. The samples were transferred tothe laboratory in an icebox within 12 h, and therefiltered through a 0.45-μm micropore membraneand kept at 4◦C for the analysis of the dissolvedelements (Cd, Cr, Cu, Hg, Ni, and Zn). The pro-cedures for water sample collection, preservation,preparation, and pretreatment followed standardprocedure described by Method of Analyzingand Monitoring the Water and Wastewater (Wei2002).
The concentrations of Cd, Cr, Cu, Ni and Znin samples were determined by inductively cou-pled plasma-optical emission spectrometry (op-tima 7000 ICP-OES spectrometer). The wave-lengths used for Cd, Cr, Cu, Ni, and Zn were228.802, 267.716, 327.393, 231.604, 206.200 nm,respectively. The Hg content in samples was de-termined by atomic fluorescence spectrometry(AFS9230 spectrometer). Recoveries varied butall fell within the range of 92.1–103.4%, and the
precision expressed as relative standard deviation(RSD) was ±1.25%.
The results were analyzed statistically usingSPSS 16.0. Cluster analysis was used to groupsampling stations based on their metal concentra-tions. Relations between the various metals werestudied by correlations. Surfer 8.0 was used tomap the spatial distribution of heavy metals in theChaohu Lake.
Results and discussion
Heavy metal concentrations
The metal pollution levels of Chaohu surfacewater were summarized in Tables 1 and 2 andFig. 2. Boxplots provide a quick, visual summaryabout the distributions of each heavy metal. Theheavy black line inside each box marks the 50thpercentile, or median, of that distribution whilethe lower and upper hinges, or box boundaries,mark the 25th and 75th percentiles of each distri-bution, respectively. Whiskers appear above andbelow the hinges. Whiskers are vertical lines end-ing in horizontal lines at the largest and smallestobserved values that are not statistical outliers.Results showed that the mean content and 75thpercentile of heavy metals (Cr, Cu, Ni, and Zn)are less than grade 1 of China surface waterquality standards which classified water qualityinto five levels, whereas Grade 1 is the higheststandard set to protect national nature reserves(GB3838-2002 2002). However, the median, themean, the 25th and 75th percentiles of Hg arenearly equal, a little higher than Grade 3 ofChinese water quality. Extreme values and out-liers are marked with an asterisk (*) and O, re-spectively. The total heavy metals (Cd, Cr, Cu, Ni,and Zn) had extreme values or outliers at the en-trance of Nanfei River where the pollution shouldbe given special attention, same report couldbe found in the literatures (Zheng et al. 2009b; Liuet al. 2007).
Table 2 is generated by comparing measuredconcentrations of elements with the US-EPA wa-ter quality criteria (EPA 2009) and standard back-ground value (Li et al. 1986). The results showedthat the average concentrations of Cd, Cr, Cu,

2766 Environ Monit Assess (2012) 184:2763–2773
Table 1 Concentrations of six heavy metals in surfacewater of Chaohu Lake, Anhui, China (μg/L)
Sample Cd Cr Cu Hg Ni Znsite
A0 0.876 0.614 0.409 0.248 0.574 2.240A1 0.830 0.750 0.455 0.299 0.613 1.100A3 0.878 1.050 0.629 0.339 0.881 2.560A5 0.871 0.806 0.748 0.324 1.070 0.992A7 BDL 0.709 1.990 0.315 1.490 4.370A9 0.895 0.823 0.317 0.320 0.741 1.080A11 BDL 0.479 0.994 0.363 0.249 2.870A13 0.851 0.838 0.527 0.356 0.370 1.440A17 BDL 0.910 2.110 0.332 1.220 4.810A19 0.898 0.605 0.420 0.351 0.879 1.020A21 0.861 0.735 0.431 0.353 0.845 0.803A23 BDL 0.912 1.680 0.300 0.579 4.170E0 1.190 2.670 3.110 0.303 6.230 59.900E1 BDL 1.560 3.470 0.364 4.110 39.800E12 BDL 0.965 2.900 0.298 1.710 16.100E14 0.856 1.080 1.960 0.242 1.310 11.400E16 0.780 1.180 2.000 0.263 1.210 11.900E17 0.788 0.897 1.830 0.307 1.380 11.600E19 0.982 0.870 1.620 0.254 0.970 11.000E21 BDL 1.000 3.070 0.310 1.950 14.400E23 0.950 0.881 1.630 0.319 1.300 11.400E25 0.955 1.170 1.850 0.272 1.350 11.000I1 0.938 0.085 BDL 0.355 0.102 BDLI2 0.871 0.316 BDL 0.357 BDL BDLI3 0.926 0.293 BDL 0.315 BDL BDLI4 0.839 0.481 0.099 0.338 BDL 0.474I5 0.788 0.696 0.177 0.283 0.223 0.632L1 0.906 1.220 2.350 0.289 3.350 13.700L2 BDL 0.982 2.190 0.289 1.480 8.720L3 0.880 0.556 0.339 0.290 0.442 1.710L4 BDL 0.429 0.871 0.403 BDL 2.250L5 BDL 0.790 1.630 0.282 0.121 6.870L6 BDL 1.720 3.690 0.279 2.610 18.900L7 BDL 2.070 3.370 0.325 1.490 17.500L8 0.958 1.310 3.330 0.301 2.470 17.200L9 BDL 1.370 2.560 0.239 2.070 16.100L10 BDL 0.722 2.180 0.332 1.260 7.920L11 BDL 0.685 1.680 0.386 0.047 4.030L12 0.926 0.678 0.501 0.330 0.717 2.220L13 0.918 0.755 0.934 0.349 1.020 2.730L14 0.873 0.860 1.670 0.309 1.600 5.700L15 1.020 1.400 2.000 0.321 1.100 9.320L16 0.846 0.357 0.886 0.393 0.099 2.010L17 BDL 0.734 1.770 0.346 0.903 4.740L18 BDL 0.600 1.920 0.736 0.309 4.730L19 BDL 0.333 1.580 0.542 0.441 3.810L20 BDL 0.268 1.910 0.339 0.159 5.420L21 0.842 0.459 0.795 0.331 0.735 1.850L22 BDL 0.245 1.370 0.368 0.057 3.620L23 BDL 0.228 1.450 0.348 0.776 3.850L24 BDL 0.305 1.470 0.372 1.090 3.720
Table 1 (continued)
Sample Cd Cr Cu Hg Ni Znsite
L25 BDL 0.194 1.360 0.343 0.187 2.660L26 BDL 0.351 1.510 0.646 BDL 3.570L27 BDL 0.240 1.400 0.541 0.548 4.090L28 BDL 0.463 1.610 0.354 0.519 6.280L29 0.819 0.056 BDL 0.463 BDL BDLL30 BDL 0.309 0.884 0.376 BDL 2.220L31 BDL 0.065 1.070 0.529 0.099 2.120L32 BDL 0.104 1.290 0.626 1.140 4.200L33 0.818 0.009 0.382 0.489 BDL BDLL34 BDL 0.358 1.790 0.317 0.058 3.090L35 BDL 0.558 1.680 0.380 0.336 7.160
BDL below detection limit
and Zn are lower than the criteria maximumconcentrations (CMC) and criterion continuousconcentration values while Cd is a little higherthan criterion continuous concentration. Whencompared with standard background value (dis-solved), Chaohu Lake is obviously polluted withCd, Hg, and Ni, but little contamination with Cr.Chaohu Lake is fairly polluted with heavy met-als. When other streams or lakes are considered,our results are comparable with a fairly pollutedlake. Mean concentrations of partly heavy met-als in Chaohu Lake water are generally lowerthan metal concentrations in other regions includ-ing China and other countries (Shen et al. 2007;Zhang et al. 2009; Lu et al. 2009; Li et al. 2008;Pertsemli and Voutsa 2007; Özmen et al. 2004;Karadede and Ünlü 2000; An and Kampbell 2003;Das et al. 2008; Nguyen et al. 2005).
Spatial distributions of heavy metals in ChaohuLake surface water
Contour maps are used to describe the spatial dis-tribution of heavy metals (Cd, Cr, Cu, Hg, Ni, andZn). These maps for heavy metals illustrate thedistinct zones of lower or higher concentrationsin the Chaohu Lake surface water. A graded greytone scheme legend to the concentration was usedto show the elemental distribution pattern. Thedistinct darker shades was used for the zones ofhigher and lighter shades for lower concentrationzones as the color columns indicated.

Environ Monit Assess (2012) 184:2763–2773 2767
Table 2 Statistical analysis of data about heavy metal concentration of Chaohu Lake and comparison with others lakes(μg/L)
Cd Cr(VI) Cu Ni Zn Hg
Valid numbera 31 62 58 54 57 62Minimum- Maximum, Chaohu Lake BDL–1.19 0.01–2.67 BDL–3.69 BDL–6.23 BDL–59.9 0.24–0.74Mean, Chaohu Lake 0.89 0.73 1.55 1.09 7.56 0.36Std. deviation, Chaohu Lake 1.10 0.49 0.97 1.10 9.56 0.96Skewness, Chaohu Lake 1.764 1.375 0.490 2.603 3.575 2.097Kurtosis, Chaohu Lake 5.431 3.256 −0.180 9.347 16.098 4.836Percentiles, Chaohu Lake
25 0.8420 0.3465 0.8520 0.3615 2.2300 0.300750 0.8760 0.7025 1.6150 0.8800 4.1700 0.332075 0.9260 0.9252 1.9925 1.3575 11.0000 0.3658
Surface water of DongTing Lake, 0.24 1.73 4.56 0.67 12.07 0.01China (Shen et al. 2007)
Hengshuihu Wetland, China (Zhang et al. 2009) BDL BDL 0.54–0.92 – BDL 0.28–0.92Middle and lower reaches of the second 0.13 1.22 3.86 – 25.41 0.007
Songhua River, China (Lu et al. 2009)XuanWu Lake (average) 40 – – 6 7 –
China, (Li et al. 2008)Lake Doirani, Greece, (Pertsemli and Voutsa 2007) 0.1–0.4 1–17 1–13 1–6 6–66 –Lake Megali Prespa, Greece, 0.1–0.2 1–19 2–5 1–22 2–12 –
(Pertsemli and Voutsa 2007)Hazar Lake, Turkey, (Özmen et al. 2004) – – BDL–18 BDL–12 38–71 –Ataturk dam Lake, Turkey (Karadede and Ünlü 2000) BDL – 25–220 11–15.4 64–197 BDLLake Texoma, USA (An and Kampbell 2003) 2–249 2–8 11–104 1–12 12–246 –Zeekoevlei (surface water) BDL BDL–5 BDL–89 3 9–12 –
South Africa, (Das et al. 2008)Lake Balaton, Hungary, (Nguyen et al. 2005) 1–5 ×10⁻³ 0.22–0.59 0.33–0.71 0.22–1.9 –China environmental quality standards for surface water (GB3838-2002 2002)
Limit value 1–5 10–50 10–1000 – 50–1000 0.1–1Grade I–II I–II I–II – I–II III–IV
Water quality criteria, (EPA 2009)CMC, acute 2.0 16 – 470 120 1.4CCC, chronic 0.25 11 – 52 120 0.77
Standard background value (dissolved) 0.07 0.5 1.8 0.3 10 0.01(Li et al. 1986)
aAbove detection limit number (total number is 62), BDL below detection limit, – no data
Zinc is a nutrient at low concentration, butit can become toxic to aquatic life at higherconcentration than the threshold required values(Schuler et al. 2008). The patches of higher Znconcentration were mainly confined in the north-west which is above the background value, de-creasing toward the eastern and southern Lake.However, there is no Zn pollution from the inflowof Yuxi and Zhao Rivers (Fig. 3a).
Similar spatial distributions were observed forCr and Ni, as can be seen from Fig. 3b–c. Thiswas consistent with the results of correlation andcluster analysis that show these elements are sig-
nificantly correlated. The higher concentrationsof Cr and Ni mainly distributed at the entrancesof Nanfei and Shiwuli Rivers, while moderatepollution is detected in the eastern and southerninflows. Previous research has reported that west-ern Chaohu Lake had higher contamination thaneastern and southern parts (Zheng et al. 2009a, b).
Apart from the northwest directions, Cu valuesare generally high in the inflow of Yuxi and ZhaoRivers (Fig. 3d). At other places, their concentra-tions are lower than the background value.
Cd is a highly mobile and toxic element andit can be easily released into the environment
2768 Environ Monit Assess (2012) 184:2763–2773
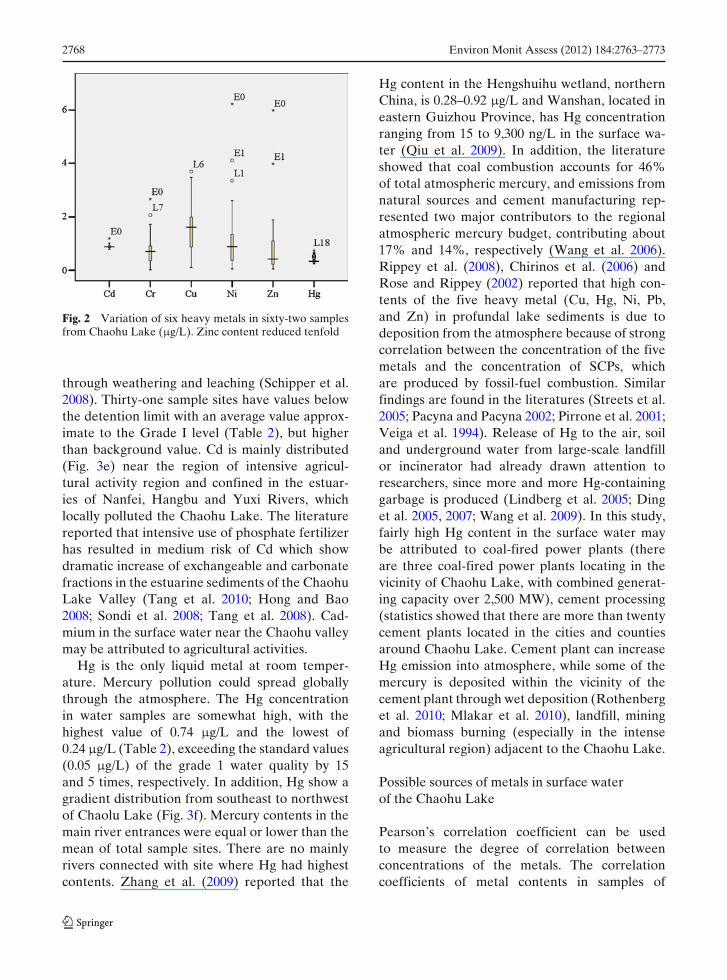
Fig. 2 Variation of six heavy metals in sixty-two samplesfrom Chaohu Lake (μg/L). Zinc content reduced tenfold
through weathering and leaching (Schipper et al.2008). Thirty-one sample sites have values belowthe detention limit with an average value approx-imate to the Grade I level (Table 2), but higherthan background value. Cd is mainly distributed(Fig. 3e) near the region of intensive agricul-tural activity region and confined in the estuar-ies of Nanfei, Hangbu and Yuxi Rivers, whichlocally polluted the Chaohu Lake. The literaturereported that intensive use of phosphate fertilizerhas resulted in medium risk of Cd which showdramatic increase of exchangeable and carbonatefractions in the estuarine sediments of the ChaohuLake Valley (Tang et al. 2010; Hong and Bao2008; Sondi et al. 2008; Tang et al. 2008). Cad-mium in the surface water near the Chaohu valleymay be attributed to agricultural activities.
Hg is the only liquid metal at room temper-ature. Mercury pollution could spread globallythrough the atmosphere. The Hg concentrationin water samples are somewhat high, with thehighest value of 0.74 μg/L and the lowest of0.24 μg/L (Table 2), exceeding the standard values(0.05 μg/L) of the grade 1 water quality by 15and 5 times, respectively. In addition, Hg show agradient distribution from southeast to northwestof Chaolu Lake (Fig. 3f). Mercury contents in themain river entrances were equal or lower than themean of total sample sites. There are no mainlyrivers connected with site where Hg had highestcontents. Zhang et al. (2009) reported that the
Hg content in the Hengshuihu wetland, northernChina, is 0.28–0.92 μg/L and Wanshan, located ineastern Guizhou Province, has Hg concentrationranging from 15 to 9,300 ng/L in the surface wa-ter (Qiu et al. 2009). In addition, the literatureshowed that coal combustion accounts for 46%of total atmospheric mercury, and emissions fromnatural sources and cement manufacturing rep-resented two major contributors to the regionalatmospheric mercury budget, contributing about17% and 14%, respectively (Wang et al. 2006).Rippey et al. (2008), Chirinos et al. (2006) andRose and Rippey (2002) reported that high con-tents of the five heavy metal (Cu, Hg, Ni, Pb,and Zn) in profundal lake sediments is due todeposition from the atmosphere because of strongcorrelation between the concentration of the fivemetals and the concentration of SCPs, whichare produced by fossil-fuel combustion. Similarfindings are found in the literatures (Streets et al.2005; Pacyna and Pacyna 2002; Pirrone et al. 2001;Veiga et al. 1994). Release of Hg to the air, soiland underground water from large-scale landfillor incinerator had already drawn attention toresearchers, since more and more Hg-containinggarbage is produced (Lindberg et al. 2005; Dinget al. 2005, 2007; Wang et al. 2009). In this study,fairly high Hg content in the surface water maybe attributed to coal-fired power plants (thereare three coal-fired power plants locating in thevicinity of Chaohu Lake, with combined generat-ing capacity over 2,500 MW), cement processing(statistics showed that there are more than twentycement plants located in the cities and countiesaround Chaohu Lake. Cement plant can increaseHg emission into atmosphere, while some of themercury is deposited within the vicinity of thecement plant through wet deposition (Rothenberget al. 2010; Mlakar et al. 2010), landfill, miningand biomass burning (especially in the intenseagricultural region) adjacent to the Chaohu Lake.
Possible sources of metals in surface waterof the Chaohu Lake
Pearson’s correlation coefficient can be usedto measure the degree of correlation betweenconcentrations of the metals. The correlationcoefficients of metal contents in samples of

Environ Monit Assess (2012) 184:2763–2773 2769
Fig. 3 a Spatialdistribution of Znconcentration in surfacewater from Chaohu Lake,China. b Spatialdistribution of Niconcentration in surfacewater from Chaohu Lake,China. c Spatialdistribution of Crconcentration in surfacewater from Chaohu Lake,Anhui, China. d Spatialdistribution of Cuconcentration in surfacewater from Chaohu Lake,China. e Spatialdistribution of Cdconcentration in surfacewater from Chaohu Lake,China. f Spatialdistribution of Hgconcentration in surfacewater from Chaohu Lake,China
450000 455000 460000 465000 470000 475000 480000 485000 490000 495000
3485000
3490000
3495000
3500000
3505000
0
4
8
12
16
20
24
28
32
36
40
44
48
52
450000 455000 460000 465000 470000 475000 480000 485000 490000 495000
3485000
3490000
3495000
3500000
3505000
0
0.5
1
1.5
2
2.5
3
3.5
4
4.5
5
5.5
6
450000 455000 460000 465000 470000 475000 480000 485000 490000 495000
3485000
3490000
3495000
3500000
3505000
00.10.20.30.40.50.60.70.80.911.11.21.31.41.51.61.71.81.922.12.22.32.42.52.6
a
b
c
Chaohu Lake are listed in Table 3. High cor-relation coefficients (>0.65) were found amongCr, Ni, Cu, and Zn, indicating that the origin of
metals is related to the polluted rivers which areconnected with the Chaohu Lake. No significantcorrelation was found between Cd and other five

2770 Environ Monit Assess (2012) 184:2763–2773
Fig. 3 (continued)
450000 455000 460000 465000 470000 475000 480000 485000 490000 495000
3485000
3490000
3495000
3500000
3505000
0
0.2
0.4
0.6
0.8
1
1.2
1.4
1.6
1.8
2
2.2
2.4
2.6
2.8
3
3.2
3.4
3.6
3.8
450000 455000 460000 465000 470000 475000 480000 485000 490000 495000
3485000
3490000
3495000
3500000
3505000
0
0.2
0.4
0.6
0.8
1
1.2
1.4
1.6
450000 455000 460000 465000 470000 475000 480000 485000 490000 495000
3485000
3490000
3495000
3500000
3505000
0.240.260.280.30.320.340.360.380.40.420.440.460.480.50.520.540.560.580.60.620.640.660.680.70.720.74
d
e
f
metals, while a negative correlation was foundbetween Hg and any other metals, indicating adifferent source for Hg (Fig. 3f). Cluster analysis
of the sample stations in the inflows is used toquantitatively identify specific areas of contami-nation for Nanfei and Yuxi Rivers respectively. It

Environ Monit Assess (2012) 184:2763–2773 2771
Table 3 Correlation coefficients among the heavy metals
Cd Cr Cu Ni Zn Hg
Cd 1.000Cr 0.160 1.000Cu −0.443 0.675 1.000Ni 0.116 0.818 0.682 1.000Zn −0.021 0.805 0.727 0.903 1.000Hg −0.326 −0.462 −0.146 −0.304 −0.222 1.000
Statistically significant correlations are indicated in boldwhere p < 0.05
is shown in Fig. 4a, sample sites (E14, E17, E23,E16, E19, E25, E12, and E21) could be sorted intoa single group, E1 in another group and E0 thethird group. The selected heavy metal levels inthe E0 sample site are higher than others exceptHg, suggesting that the Nanfei River is the mainsource of heavy metal pollution into Chaohu Lakeexcept Hg. While in Fig. 4b, sample sites (A1, A9,A19, A21, A5, and A13) were sorted into a group,whereas A0 in another group and A3 the thirdgroup. Total selected elements were detected withfairly high contention in the site A0 when com-pared with the other sample sites in the estuaryof Yuxi River. This suggests that heavy metals in
Fig. 4 a Dendrogram indicating relation of sites with heavymetal contamination among the seven sampling stationsfrom the estuary of Yuxi River. b Dendrogram indicatingrelation of sites with heavy metal contamination among theten sampling stations at the estuary of Nanfei River
the inflow of Yuxi River have complex sources,and among them, there is a heavily polluted river(Shuangqiao River, not displaying in Fig. 1 dueto the small size) which is close to Yuxi Riverentrance.
Conclusions
Determination of heavy metal contents (Cr, Ni,Cu, Zn and Hg) in the surface water of the ChaohuLake is conducted. The results showed that thesemetals (Cr, Ni, Cu, Zn, and Cd) had a fairly highcontents in the estuaries than the others sites,especially in the inflow of Nanfei River which is aheavily polluted river running through the centerof Hefei city. While the average content of eachelement except Hg was less than grade 1 of qualitystandards for China surface water (GB3838-20022002) and lower than the CMC of EPA, Hg hada mean content of 0.36 μg/L. High correlationcoefficients (>0.65) were found among Cr, Ni,Cu, Zn, and Cd. Metals Cd and Hg have lowor negative correlations with the others. It showsthat Cd and Hg each have different anthropogenicorigin.
Acknowledgements The work was supported by the Na-tional Natural Science Foundation of China (No.40873070,40903039), Research Foundation for Doctoral Program ofHigher Education of China (no. 20093402110001), Spe-cial projects of major national science and technology(2009ZX05039-003) and National Foundation of AnhuiEducation (no. KJ2008A147). We thank the editor andreviewers for giving us much constructive comments.
References
An, Y. J., & Kampbell, D. H. (2003). Total, dissolved, andbioavailable metals at Lake Texoma marinas. Envi-ronment Pollution, 122, 253–259.
Bulut, E., & Aksoy, A. (2008). Impact of fertilizer usage onphosphorus loads to Lake Uluabat. Desalination, 226,289–297.
Cao, D. J., Yue, Y. D., Huang, X. M., & Wei, M. (2004).Environmental quality assessment of Pb, Cu, Fe pol-lution in Chaohu Lake waters. China EnvironmentalScience, 24(4), 509–512.
Chirinos, L., Rose, N. L., Urrutia, R., Muñoz, P., Torrejón,F., Torres, L., et al. (2006). Environmental evidence offossil fuel pollution in Laguna Chica de San Pedro lake

2772 Environ Monit Assess (2012) 184:2763–2773
sediments (Central Chile). Environmental Pollution,141, 247–256.
Das, S. K., Routh, J., Roychoudhury, A. N., & Klump,J. V. (2008). Major and trace element geochemistryin Zeekoevlei, South Africa: A lacustrine record ofpresent and past processes. Applied Geochemistry, 23,2496–2511.
Ding, Z. H., Liu, C. E., Tang, Q. H., Wang, W. H., &Zhuang, M. (2005). Necessary to study the environ-mental pollution in Estuary of Yangtze River andcoastal water-example of mercury. Resources and En-vironment in the Yangtze Basin, 14, 204–207.
Ding, Z. H., Tang, Q. H., Liu, K. Y., Wang, W. H., Zhuang,M., & Liu, Y. M. (2007). Distribution and ecologicaleffect of mercury in Laogang landfill, Shanghai, China.Journal of Environmental Sciences, 19, 200–204.
Environmental Quality Standard for Surface Water(GB3838-2002) (2002) China. Environmental science,Beijing, China.
EPA (2009). National recommended water quality criteria.http://www.epa.gov/ost/criteria/wqctable.
Gochfeld, M. (2003). Cases of mercury exposure, bioavail-ability and adsorption. Ecotoxicology and Environ-mental Safety, 56, 174–179.
Hong, Z., & Bao, Q. S. (2008). Historical records of heavymetal accumulation in sediments and the relation-ship with agricultural intensification in the Yangtze–Huaihe region, China. Science of the Total Environ-ment, 399, 113–120.
Huang, S. S., Liao, Q. L., Hua, M., Wu, X. M., Bi, K. S.,Yan, C. Y., et al. (2007). Survey of heavy metal pollu-tion and assessment of agricultural soil in Yangzhongdistrict, Jiangsu Province, China. Chemosphere, 67,2148–2155.
Jones, K. C., & Johnston, A. E. (1989). Cadmium in ce-real grain and herbage from long-term experimentalplots at Rothamsted, UK. Environmental Pollution,57, 199–216.
Karadede, H., & Ünlü, E. (2000). Concentrations ofsome heavy metals in water, sediment and fishspecies from Ataturk Dam Lake (Euphrates), Turkey.Chemosphere, 41, 1371–1376.
Lambert, R., Grant, C., & Sauvé, S. (2007). Cadmium andzinc in soil solution extracts following the applicationof phosphate fertilizers. Science of the Total Environ-ment, 378, 293–305.
Li, J., Zeng, B. W., Yao, Y. Y., Zhang, L. C., Qiu,C. Q., & Qian, X. Z. (1986). Studies on environmentalbackground levels in water of Dong Ting Lake sys-tem. Chinese Journal of Environmental Science, 7(4),62–68.
Li, X. C., Zhao, L., & Wang, C. (2008). Trace metal levels inoverlying water, pore water and sediment of XuanwuLake, Nanjing. Chinese Journal of Environmental Sci-ence & Technology, 31(5), 4–6.
Lindberg, S. E., Southworth, G., Prestbo, E. M.,Wallschlager, D., Bogle, M. A., & Price, J. (2005).Gaseous methyl- and inorganic mercury in landfill gasfrom landfills in Florida, Minnesota, Delaware, andCalifornia. Atmospheric Environment, 39, 249–258.
Liu, L., Hong, T. Q., Pan, G. L., & Zheng, W. (2007). Studyon pollutant characters of sediment in the estuary ofShiWuLi River in the Chaohu Lake basin. ChineseJournal of Hefei University Technology, 30(3), 364–366.
Lu, J. L., Hao, L. B., Zhao, Y. Y., Bai, R. J., Sun, S. M., &Fang, C. C. (2009). Contents and potential ecologicalrisk of heavy metals in middle and lower reaches ofSecond Songhua River. Chinese Journal of Environ-mental Science & Technology, 32(5), 168–172.
Mlakar, T. L., Horvat, M., Vuk, T., Stergaršek, A.,Kotnik, J., Tratnik, J., et al. (2010). Mercury species,mass flows and processes in a cement plant. Fuel, 89,1936–1945.
Nguyen, H. L., Leermakers, M., Osán, J., Török, S., &Baeyens, W. (2005). Heavy metals in Lake Balaton:Water column, suspended matter, sediment and biota.Science of the Total Environment, 340, 213–230.
Özmen, H., Külahcl, F., Cukurovall, A., & Dogru, M.(2004). Concentrations of heavy metal and radioac-tivity in surface water and sediment of Hazar Lake(Elazig, Turkey). Chemosphere, 55, 401–408.
Pacyna, E. G., & Pacyna, J. M. (2002). Global emission ofmercury from anthropogenic sources in 1995. Water,Air, & Soil Pollution, 137, 149–165.
Pertsemli, E., & Voutsa, D. (2007). Distribution of heavymetals in Lakes Doirani and Kerkini, NorthernGreece. Journal of Hazardous Materials, 148, 529–537.
Pirrone, N., Costa, P., Pacyna, J. M., & Ferrara, R. (2001).Mercury emissions to the atmosphere from naturaland anthropogenic sources in the Mediterranean re-gion. Atmospheric Environment, 35, 2997–3006.
Qin, D. M., & Chen, X. H. (1996). The agriculture de-velopment of Yangtze–Huaihe region in six dynastiesperiod. Agricultural History of China, 15, 2–9.
Qiu, G. L., Feng, X. B., Wang, S. F., Fu, X. W., & Shang,L. H. (2009). Mercury distribution and speciation inwater and fish from abandoned Hg mines in Wanshan,Guizhou province, China. Science of the Total Envi-ronment, 407, 5162–5168.
Rippey, B., Rose, N., Yang, H. D., Stuart, H., Mat, R.,& Sarah, T. (2008). An assessment of toxicity inprofundal lake sediment due to deposition of heavymetals and persistent organic pollutants from the at-mosphere. Environment International, 34, 345–356.
Rose, N. L., & Rippey, B. (2002). The historical record ofPAH, PCB, trace metal and fly-ash particle depositionat a remote lake in north-west Scotland. Environmen-tal Pollution, 117, 121–132.
Rothenberg, S. E., McKee, L., Gilbreath, A., Yee, D.,Connor, M., & Fu, X. W. (2010). Wet deposition ofmercury within the vicinity of a cement plant beforeand during cement plant maintenance. AtmosphericEnvironment, 44, 1255–1262.
Schipper, P. N. M., Bonten, L. T. C., & Plette, A. C. C.(2008). Measures to diminish leaching of heavy metalsto surface waters from agricultural soils. Desalination,226, 89–96.
Schuler, L. J., Hoang, T. C., & Rand, G. M. (2008). Aquaticrisk assessment of copper in freshwater and saltwater

Environ Monit Assess (2012) 184:2763–2773 2773
ecosystems of South Florida. Ecotoxicology, 17, 642–659.
Shen, R. L., Bao, Z. Y., Zhou, M., & Xie, S. Y. (2007).Geochemical evaluation of heavy metal in the wa-ter body DongTing lake. Chinese Journal of YangtzeRiver, 38(11), 121–123.
Sondi, I., Sonja, L., Juracic, M., & Prohic, E. (2008). Mech-anisms of land-sea interactions—the distribution ofmetals and sedimentary organic matter in sedimentsof a river dominated Mediterranean karstic estuary.Estuarine, Coastal and Shelf Science, 80, 12–20.
Streets, D. G., Hao, J. M., Wu, Y., Jiang, J. K., Chan,M., Tian, H. Z., et al. (2005). Anthropogenic mer-cury emissions in China. Atmospheric Environment,39, 7789–7806.
Tang, C. W. Y., Ip, C. C. M., Zhang, G., Shin, P. K. S., Qian,P. Y., & Li, X. D. (2008). The spatial and temporaldistribution of heavy metals in sediments of VictoriaHarbour, Hong Kong. Marine Pollution Bulletin, 57,816–825.
Tang, W. Z., Shan, B. Q., Zhang, H., & Mao, Z. P. (2010).Heavy metal sources and associated risk in response toagricultural intensification in the estuarine sedimentsof Chaohu Lake Valley, East China. Journal of Haz-ardous Materials, 176, 945–951.
Veiga, M. M., Meech, J. A., & Oñate, N. (1994). Mercurypollution from deforestation. Nature, 368, 816–817.
Wang, D. Y., He, L., Wei, S. Q., & Feng, X. B. (2006). Esti-mation of mercury emission from different sources toatmosphere in Chongqing, China. Science of the TotalEnvironment, 366, 722–728.
Wang, Q. H., Yang, J., Wang, Q., & Wu, T. J. (2009).Effects of water-washing pretreatment on bioleachingof heavy metals from municipal solid waste incineratorfly ash. Journal of Hazardous Materials, 162, 812–818.
Wang, Y. H., Liu, Z. Y., & Liu, W. (2003). Distributionand correlation characteristics between pollutants insediment in Chaohu Lake, China. Acta ScientiarumNaturalium Universitatis Pekinensis, 39(4), 501–506.
Wei, F. S. (2002). Method of analyzing and monitoringthe water and wastewater (4th ed., pp. 38–56). Beijing:China Environmental Science Press (in Chinese).
Xu, M. Q., Cao, H., Xie, P., Deng, D. G., Feng, W. S., & Xu,J. (2005). Use of PFU protozoan community structuraland functional characteristics in assessment of waterquality in a large, highly polluted freshwater lake inChina. Journal of Environmental Monitoring, 7, 670–674.
Zhang, M. Y., Cui, L. J., Sheng, L. X., & Wang, Y. F.(2009). Distribution and enrichment of heavy met-als among sediments, water body and plants inHengshuihu Wetland of Northern China. EcologicalEngineering, 35, 563–569.
Zheng, L. P., Liu, Y. M., Qian, X. W., & Shi, X. Y. (2009a).The characteristics and regional differences of heavymetal contents in the sediments of Taihu Lake andChaohu Lake. Environmental Chemistry, 28, 883–888.
Zheng, L. G., Liu, G. J., Kang, Y., & Yang, R. K. (2009b).Some potential hazardous trace elements contamina-tion and their ecological risk in sediments of westernChaohu Lake, China. Environmental Monitoring andAssessment, 166, 379–386.
Copyright © 2022 FDOKUMEN