Spatial Coverage Cross-Tier Correlation Analysis for Heterogeneous Cellular Networks
10
IEEE TRANSACTIONS ON VEHICULAR TECHNOLOGY, VOL. 63, NO. 8, OCTOBER 2014 3917 Spatial Coverage Cross-Tier Correlation Analysis for Heterogeneous Cellular Networks David M. Gutierrez-Estevez, Student Member, IEEE, Ian F. Akyildiz, Fellow, IEEE, and Etimad A. Fadel Abstract—In the search for improved coverage and capacity, cellular networks are currently undergoing a major transforma- tion. A thoroughly planned architecture comprised of macrocells served by large-coverage expensive base stations (BSs) is evolving toward a much more heterogeneous architecture where the macro- cell network is underlaid by one or several tiers of small cells deployed in an irregular and unplanned fashion using universal frequency reuse. Major challenges of this new scenario are the problems of intercell interference (ICI) and cell association. In this paper, these two problems are tackled in a novel way by analyzing and exploiting the inherent spatial cross-tier coverage correlation due to the cochannel ICI for a two-tier network. A mathematical framework for the representation of the two-tier coverage maps and their correlation is developed based on the spatial statistical properties of the signal quality measurements reported by the users to the base station. Several semivariogram-based estimation models are applied and cross-validated. Furthermore, a closed- form expression for the cross-tier coverage correlation function depending only on the estimator’s parameters is obtained. In addition, a practical application of this framework is proposed. Cross-tier correlation information is exploited in the design of a new cell association policy based on cell-specific biasing for small cells. Numerical results show that the mathematical framework can provide accurate representations of the coverage fields and their correlation. Moreover, the performance of our proposed correlation-aware cell association policy is shown to be promising enough to encourage further research in this direction. Index Terms—Cell association, cross correlation, heterogeneous networks (HetNets), interference, random field, semivariogram. I. I NTRODUCTION T HE challenge of the ever-increasing demands for wireless data is shaping the design and development of fourth- Manuscript received February 25, 2013; revised June 23, 2013 and October 8, 2013; accepted January 12, 2014. Date of publication February 13, 2014; date of current version October 14, 2014. This work was supported in part by the King Abdulaziz City for Science and Technology through the National Policy for Science, Technology, and Innovation Plan under Grant 12-INF2731-03, by the Unit for Science and Technology at King Abdulaziz University, by Fundación Caja Madrid, and by the Georgia Research Alliance. The review of this paper was coordinated by Prof. H.-H. Chen. D. M. Gutierrez-Estevez is with the Broadband Wireless Networking Laboratory, School of Electrical and Computer Engineering, Georgia Insti- tute of Technology, Atlanta, GA 30338 USA (e-mail: david.gutierrez@ece. gatech.edu). I. F. Akyildiz is with the Broadband Wireless Networking Laboratory, School of Electrical and Computer Engineering, Georgia Institute of Technology, Atlanta, GA 30338 USA, and also with the Department of Computer Science, King Abdulaziz University, Jeddah 21589, Saudi Arabia (e-mail: ian@ece. gatech.edu). E. A. Fadel is with the Department of Computer Science, King Abdulaziz University, Jeddah 21589, Saudi Arabia (e-mail: [email protected]). Color versions of one or more of the figures in this paper are available online at http://ieeexplore.ieee.org. Digital Object Identifier 10.1109/TVT.2014.2306260 generation and beyond cellular systems, such as the Third- Generation Partnership Project (3GPP)’s Long-Term Evolution (LTE) Advanced [1], [2]. However, historical data regarding capacity improvements in wireless networks show that the largest gains ever obtained come mainly from the use of smaller cells [3]. This is the major driver for the new network paradigm of heterogeneous networks (HetNets), where cells of different sizes and different radio access technologies must coexist. The main focus now for every operator across the world is the deployment of HetNets comprised of a macrocell network underlaid by one or several tiers of small cells [4]. Femtocells, metrocells, picocells, or microcells are representative technolo- gies of this family. Tremendous activity on small cells has been conducted in recent years by academic institutions, companies, and standardization bodies, including 3GPP, 3GPP2, and the WiMAX forum [5], [6]. One of the major problems in this new network paradigm is intercell interference (ICI). This interference is particularly detrimental for cochannel scenarios where the operator does not carefully plan the small-cell deployment, unavoidably affecting the coverage maps of both tiers. The coverage effects of the interference, as well as the potential solutions for its proper management, have been extensively studied in the literature in the last few years. Analytical expressions for coverage on multitier networks were derived, for example, in [7], and tailored expressions for multiantenna settings can be found in [8]. However, most of the attention is focused on interference management for two-tier femtocell networks using techniques related to power control, spectrum management, or different access modes of operation [9]–[11]. Nevertheless, none of these previous studies investigate properly the fundamental correlation existing in the coverage maps of both tiers due to the inherent interference, which is a fundamental feature that can be exploited in the design of practical interference management approaches. In addition, the problem of cell association is another chal- lenge for HetNets. Deciding which users should be attached to which base station (BS) is a trivial problem in the case of homogeneous networks: The signal-to-interference-plus-noise ratio (SINR) is maximized, and the BS providing the highest SINR is always selected. However, this approach in the case of HetNets leads to high underutilization of the small cells since very few users would be attached to them. To solve this problem and increase the capacity gains of small cells, the currently agreed solution is to expand the range of the small cells by introducing a so-called bias factor [12]. However, this increases the interference on the user, thus coupling the ICI and cell association problems [13]. 0018-9545 © 2014 IEEE. Personal use is permitted, but republication/redistribution requires IEEE permission. See http://www.ieee.org/publications_standards/publications/rights/index.html for more information.
Transcript of Spatial Coverage Cross-Tier Correlation Analysis for Heterogeneous Cellular Networks
IEEE TRANSACTIONS ON VEHICULAR TECHNOLOGY, VOL. 63, NO. 8, OCTOBER 2014 3917
Spatial Coverage Cross-Tier Correlation Analysisfor Heterogeneous Cellular Networks
David M. Gutierrez-Estevez, Student Member, IEEE, Ian F. Akyildiz, Fellow, IEEE, and Etimad A. Fadel
Abstract—In the search for improved coverage and capacity,cellular networks are currently undergoing a major transforma-tion. A thoroughly planned architecture comprised of macrocellsserved by large-coverage expensive base stations (BSs) is evolvingtoward a much more heterogeneous architecture where the macro-cell network is underlaid by one or several tiers of small cellsdeployed in an irregular and unplanned fashion using universalfrequency reuse. Major challenges of this new scenario are theproblems of intercell interference (ICI) and cell association. In thispaper, these two problems are tackled in a novel way by analyzingand exploiting the inherent spatial cross-tier coverage correlationdue to the cochannel ICI for a two-tier network. A mathematicalframework for the representation of the two-tier coverage mapsand their correlation is developed based on the spatial statisticalproperties of the signal quality measurements reported by theusers to the base station. Several semivariogram-based estimationmodels are applied and cross-validated. Furthermore, a closed-form expression for the cross-tier coverage correlation functiondepending only on the estimator’s parameters is obtained. Inaddition, a practical application of this framework is proposed.Cross-tier correlation information is exploited in the design of anew cell association policy based on cell-specific biasing for smallcells. Numerical results show that the mathematical frameworkcan provide accurate representations of the coverage fields andtheir correlation. Moreover, the performance of our proposedcorrelation-aware cell association policy is shown to be promisingenough to encourage further research in this direction.
Index Terms—Cell association, cross correlation, heterogeneousnetworks (HetNets), interference, random field, semivariogram.
I. INTRODUCTION
THE challenge of the ever-increasing demands for wirelessdata is shaping the design and development of fourth-
Manuscript receivedFebruary 25, 2013; revised June 23, 2013 and October 8,2013; accepted January 12, 2014. Date of publication February 13, 2014; dateof current version October 14, 2014. This work was supported in part by theKing Abdulaziz City for Science and Technology through the National Policyfor Science, Technology, and Innovation Plan under Grant 12-INF2731-03,by the Unit for Science and Technology at King Abdulaziz University, byFundación Caja Madrid, and by the Georgia Research Alliance. The reviewof this paper was coordinated by Prof. H.-H. Chen.
D. M. Gutierrez-Estevez is with the Broadband Wireless NetworkingLaboratory, School of Electrical and Computer Engineering, Georgia Insti-tute of Technology, Atlanta, GA 30338 USA (e-mail: [email protected]).
I. F. Akyildiz is with the Broadband Wireless Networking Laboratory, Schoolof Electrical and Computer Engineering, Georgia Institute of Technology,Atlanta, GA 30338 USA, and also with the Department of Computer Science,King Abdulaziz University, Jeddah 21589, Saudi Arabia (e-mail: [email protected]).
E. A. Fadel is with the Department of Computer Science, King AbdulazizUniversity, Jeddah 21589, Saudi Arabia (e-mail: [email protected]).
Color versions of one or more of the figures in this paper are available onlineat http://ieeexplore.ieee.org.
Digital Object Identifier 10.1109/TVT.2014.2306260
generation and beyond cellular systems, such as the Third-Generation Partnership Project (3GPP)’s Long-Term Evolution(LTE) Advanced [1], [2]. However, historical data regardingcapacity improvements in wireless networks show that thelargest gains ever obtained come mainly from the use of smallercells [3]. This is the major driver for the new network paradigmof heterogeneous networks (HetNets), where cells of differentsizes and different radio access technologies must coexist.The main focus now for every operator across the world isthe deployment of HetNets comprised of a macrocell networkunderlaid by one or several tiers of small cells [4]. Femtocells,metrocells, picocells, or microcells are representative technolo-gies of this family. Tremendous activity on small cells has beenconducted in recent years by academic institutions, companies,and standardization bodies, including 3GPP, 3GPP2, and theWiMAX forum [5], [6].
One of the major problems in this new network paradigmis intercell interference (ICI). This interference is particularlydetrimental for cochannel scenarios where the operator does notcarefully plan the small-cell deployment, unavoidably affectingthe coverage maps of both tiers. The coverage effects of theinterference, as well as the potential solutions for its propermanagement, have been extensively studied in the literaturein the last few years. Analytical expressions for coverageon multitier networks were derived, for example, in [7], andtailored expressions for multiantenna settings can be found in[8]. However, most of the attention is focused on interferencemanagement for two-tier femtocell networks using techniquesrelated to power control, spectrum management, or differentaccess modes of operation [9]–[11]. Nevertheless, none ofthese previous studies investigate properly the fundamentalcorrelation existing in the coverage maps of both tiers due to theinherent interference, which is a fundamental feature that canbe exploited in the design of practical interference managementapproaches.
In addition, the problem of cell association is another chal-lenge for HetNets. Deciding which users should be attachedto which base station (BS) is a trivial problem in the case ofhomogeneous networks: The signal-to-interference-plus-noiseratio (SINR) is maximized, and the BS providing the highestSINR is always selected. However, this approach in the case ofHetNets leads to high underutilization of the small cells sincevery few users would be attached to them. To solve this problemand increase the capacity gains of small cells, the currentlyagreed solution is to expand the range of the small cells byintroducing a so-called bias factor [12]. However, this increasesthe interference on the user, thus coupling the ICI and cellassociation problems [13].
0018-9545 © 2014 IEEE. Personal use is permitted, but republication/redistribution requires IEEE permission.See http://www.ieee.org/publications_standards/publications/rights/index.html for more information.
3918 IEEE TRANSACTIONS ON VEHICULAR TECHNOLOGY, VOL. 63, NO. 8, OCTOBER 2014
In this paper, we propose a novel mathematical frameworkto characterize the spatial coverage cross-correlation betweenthe macrocell and the small-cell tiers in the downlink. Fur-thermore, we apply this modeling to develop a solution ofthe cell association problem based on cell-specific bias. Theobservation that coverage in both tiers may have some level ofcorrelation in both the spatial and temporal domains due to theexisting interference is informally assumed in most previousstudies. However, to the best of our knowledge, there existsno previous paper explicitly addressing the spatial coveragecross-tier correlation, and accordingly, there exists no analyticalcharacterization of this correlation. Since we focus on thespatial dimension in this paper, we make use of spatial statistictechniques to derive analytical expressions for the two-tiercoverage maps suitable for a subsequent cross-correlation anal-ysis. In particular, we use random field estimation techniquesto generate coverage fields, formalized in terms of downlinkSINR fields, using the position and SINR values of the usersin the network. A cross-validation is performed across differentestimation models seeking for the best choice. To the best ofour knowledge, only our previous interference managementscheme [14] has applied this framework to the present two-tiercellular scenario. In addition, we derive an explicit formulationof the spatial coverage cross-tier correlation function dependingon the previous model’s parameters. Moreover, we present anovel approach for small-cell association where the range ofthe small cells is expanded following the cell biasing approachas proposed in 3GPP [15]. However, our bias value is specificto each small cell and is set by taking into account coveragecorrelation considerations that can be extracted from our math-ematical framework.
The remainder of this paper is organized as follows. InSection II, we present the two-tier network model based onstochastic geometry utilized for this paper. In Section III, wedevelop the estimation of the two-tier SINR fields using randomfield theory. Section IV shows the derivation of the analyti-cal cross-correlation function, whereas Section V presents thenovel correlation-aware cell-specific bias solution. Both numer-ical and simulation results are shown in Section VI. Finally, theconclusions and future work plans are presented in Section VII.
II. TWO-TIER NETWORK SYSTEM MODEL
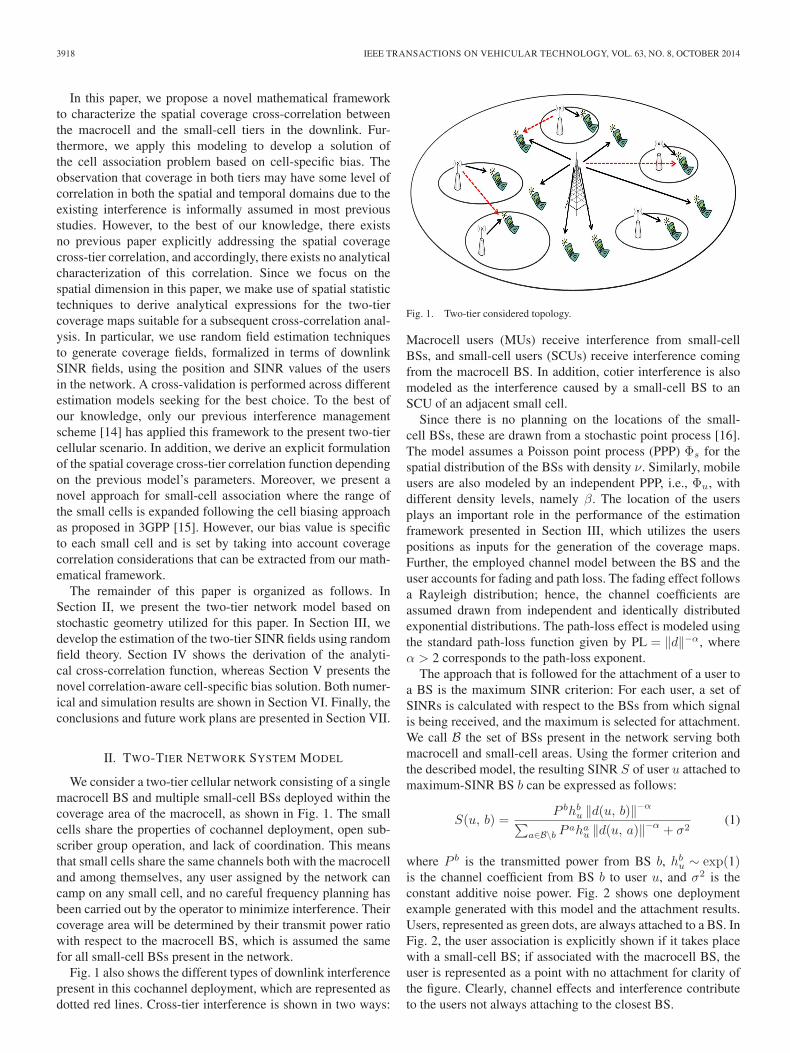
We consider a two-tier cellular network consisting of a singlemacrocell BS and multiple small-cell BSs deployed within thecoverage area of the macrocell, as shown in Fig. 1. The smallcells share the properties of cochannel deployment, open sub-scriber group operation, and lack of coordination. This meansthat small cells share the same channels both with the macrocelland among themselves, any user assigned by the network cancamp on any small cell, and no careful frequency planning hasbeen carried out by the operator to minimize interference. Theircoverage area will be determined by their transmit power ratiowith respect to the macrocell BS, which is assumed the samefor all small-cell BSs present in the network.
Fig. 1 also shows the different types of downlink interferencepresent in this cochannel deployment, which are represented asdotted red lines. Cross-tier interference is shown in two ways:
Fig. 1. Two-tier considered topology.
Macrocell users (MUs) receive interference from small-cellBSs, and small-cell users (SCUs) receive interference comingfrom the macrocell BS. In addition, cotier interference is alsomodeled as the interference caused by a small-cell BS to anSCU of an adjacent small cell.
Since there is no planning on the locations of the small-cell BSs, these are drawn from a stochastic point process [16].The model assumes a Poisson point process (PPP) Φs for thespatial distribution of the BSs with density ν. Similarly, mobileusers are also modeled by an independent PPP, i.e., Φu, withdifferent density levels, namely β. The location of the usersplays an important role in the performance of the estimationframework presented in Section III, which utilizes the userspositions as inputs for the generation of the coverage maps.Further, the employed channel model between the BS and theuser accounts for fading and path loss. The fading effect followsa Rayleigh distribution; hence, the channel coefficients areassumed drawn from independent and identically distributedexponential distributions. The path-loss effect is modeled usingthe standard path-loss function given by PL = ‖d‖−α, whereα > 2 corresponds to the path-loss exponent.
The approach that is followed for the attachment of a user toa BS is the maximum SINR criterion: For each user, a set ofSINRs is calculated with respect to the BSs from which signalis being received, and the maximum is selected for attachment.We call B the set of BSs present in the network serving bothmacrocell and small-cell areas. Using the former criterion andthe described model, the resulting SINR S of user u attached tomaximum-SINR BS b can be expressed as follows:
S(u, b) =P bhb
u ‖d(u, b)‖−α∑a∈B\b P
ahau ‖d(u, a)‖−α + σ2
(1)
where P b is the transmitted power from BS b, hbu ∼ exp(1)
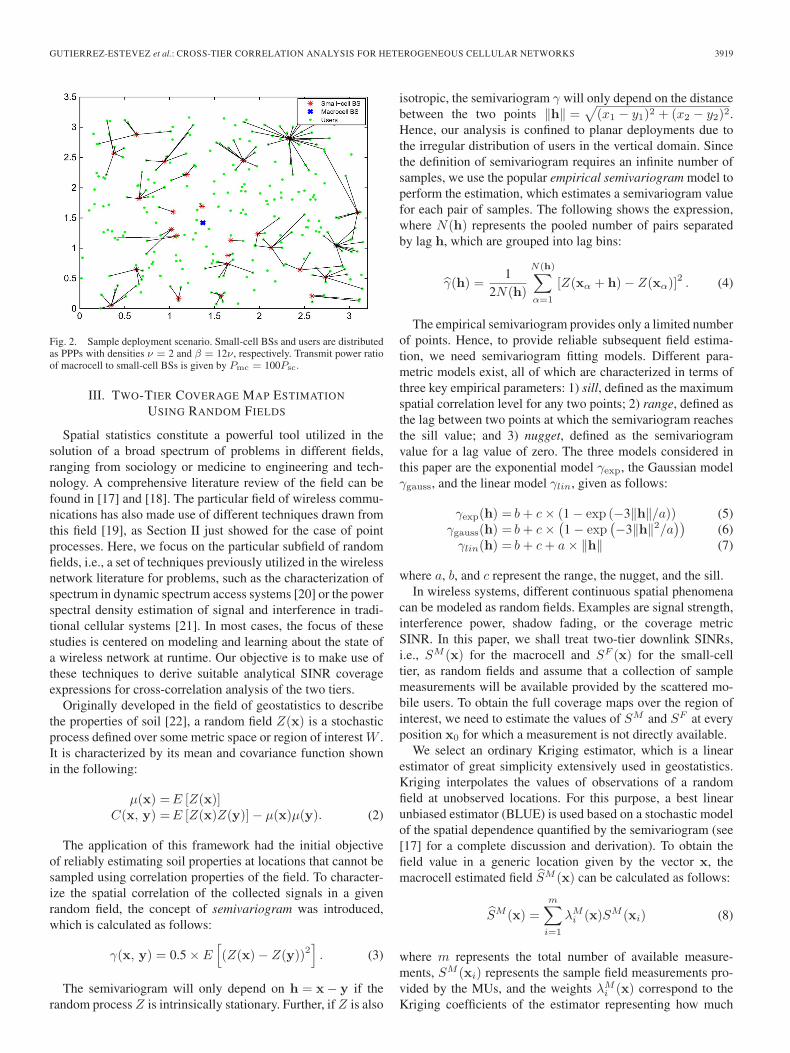
is the channel coefficient from BS b to user u, and σ2 is theconstant additive noise power. Fig. 2 shows one deploymentexample generated with this model and the attachment results.Users, represented as green dots, are always attached to a BS. InFig. 2, the user association is explicitly shown if it takes placewith a small-cell BS; if associated with the macrocell BS, theuser is represented as a point with no attachment for clarity ofthe figure. Clearly, channel effects and interference contributeto the users not always attaching to the closest BS.
GUTIERREZ-ESTEVEZ et al.: CROSS-TIER CORRELATION ANALYSIS FOR HETEROGENEOUS CELLULAR NETWORKS 3919
Fig. 2. Sample deployment scenario. Small-cell BSs and users are distributedas PPPs with densities ν = 2 and β = 12ν, respectively. Transmit power ratioof macrocell to small-cell BSs is given by Pmc = 100Psc.
III. TWO-TIER COVERAGE MAP ESTIMATION
USING RANDOM FIELDS
Spatial statistics constitute a powerful tool utilized in thesolution of a broad spectrum of problems in different fields,ranging from sociology or medicine to engineering and tech-nology. A comprehensive literature review of the field can befound in [17] and [18]. The particular field of wireless commu-nications has also made use of different techniques drawn fromthis field [19], as Section II just showed for the case of pointprocesses. Here, we focus on the particular subfield of randomfields, i.e., a set of techniques previously utilized in the wirelessnetwork literature for problems, such as the characterization ofspectrum in dynamic spectrum access systems [20] or the powerspectral density estimation of signal and interference in tradi-tional cellular systems [21]. In most cases, the focus of thesestudies is centered on modeling and learning about the state ofa wireless network at runtime. Our objective is to make use ofthese techniques to derive suitable analytical SINR coverageexpressions for cross-correlation analysis of the two tiers.
Originally developed in the field of geostatistics to describethe properties of soil [22], a random field Z(x) is a stochasticprocess defined over some metric space or region of interest W .It is characterized by its mean and covariance function shownin the following:
μ(x) =E [Z(x)]C(x, y) =E [Z(x)Z(y)]− μ(x)μ(y). (2)
The application of this framework had the initial objectiveof reliably estimating soil properties at locations that cannot besampled using correlation properties of the field. To character-ize the spatial correlation of the collected signals in a givenrandom field, the concept of semivariogram was introduced,which is calculated as follows:
γ(x, y) = 0.5 × E[(Z(x)− Z(y))2
]. (3)
The semivariogram will only depend on h = x− y if therandom process Z is intrinsically stationary. Further, if Z is also
isotropic, the semivariogram γ will only depend on the distancebetween the two points ‖h‖ =
√(x1 − y1)2 + (x2 − y2)2.
Hence, our analysis is confined to planar deployments due tothe irregular distribution of users in the vertical domain. Sincethe definition of semivariogram requires an infinite number ofsamples, we use the popular empirical semivariogram model toperform the estimation, which estimates a semivariogram valuefor each pair of samples. The following shows the expression,where N(h) represents the pooled number of pairs separatedby lag h, which are grouped into lag bins:
γ(h) =1
2N(h)
N(h)∑α=1
[Z(xα + h)− Z(xα)]2 . (4)
The empirical semivariogram provides only a limited numberof points. Hence, to provide reliable subsequent field estima-tion, we need semivariogram fitting models. Different para-metric models exist, all of which are characterized in terms ofthree key empirical parameters: 1) sill, defined as the maximumspatial correlation level for any two points; 2) range, defined asthe lag between two points at which the semivariogram reachesthe sill value; and 3) nugget, defined as the semivariogramvalue for a lag value of zero. The three models considered inthis paper are the exponential model γexp, the Gaussian modelγgauss, and the linear model γlin, given as follows:
γexp(h) = b+ c× (1 − exp (−3‖h‖/a)) (5)γgauss(h) = b+ c×
(1 − exp
(−3‖h‖2/a
))(6)
γlin(h) = b+ c+ a× ‖h‖ (7)
where a, b, and c represent the range, the nugget, and the sill.In wireless systems, different continuous spatial phenomena
can be modeled as random fields. Examples are signal strength,interference power, shadow fading, or the coverage metricSINR. In this paper, we shall treat two-tier downlink SINRs,i.e., SM (x) for the macrocell and SF (x) for the small-celltier, as random fields and assume that a collection of samplemeasurements will be available provided by the scattered mo-bile users. To obtain the full coverage maps over the region ofinterest, we need to estimate the values of SM and SF at everyposition x0 for which a measurement is not directly available.
We select an ordinary Kriging estimator, which is a linearestimator of great simplicity extensively used in geostatistics.Kriging interpolates the values of observations of a randomfield at unobserved locations. For this purpose, a best linearunbiased estimator (BLUE) is used based on a stochastic modelof the spatial dependence quantified by the semivariogram (see[17] for a complete discussion and derivation). To obtain thefield value in a generic location given by the vector x, themacrocell estimated field SM (x) can be calculated as follows:
SM (x) =m∑i=1
λMi (x)SM (xi) (8)
where m represents the total number of available measure-ments, SM (xi) represents the sample field measurements pro-vided by the MUs, and the weights λM
i (x) correspond to theKriging coefficients of the estimator representing how much
3920 IEEE TRANSACTIONS ON VEHICULAR TECHNOLOGY, VOL. 63, NO. 8, OCTOBER 2014
amount of the measured field in a particular point will becontained in the estimation. The search for a solution to theBLUE optimization problem yields the following system ofequations: (
ΓM 11T 0
)(λM
μM
)=
(γM (x)
1
)(9)
where λM is the desired vector of Kriging weights, and γM (x)is a vector of semivariogram values relating to the positionat which one wishes to estimate (x) to the MU measurementlocations (xM
i ). Therefore, γMi (x) = γ(x− xi). The parame-
ter μ is a Lagrange multiplier used in the minimization of theestimator variance whose value can be obtained from the givenequations. Finally, ΓM is the matrix of macrocell measurementsemivariograms, which is given by the following:
ΓM =
⎛⎜⎜⎜⎝
γ(0) γ(xM1 −xM
2
)· · · γ
(xM1 −xM
m
)γ(xM2 −xM
1
)γ(0) · · · γ
(xM2 −xM
m
)...
.... . .
...γ(xMm −xM
1
)γ(xMm −xM
2
)· · · γ(0)
⎞⎟⎟⎟⎠.
(10)
In the given matrix, vectors xi correspond to the positions ofthe m users providing measurements of the macrocell coveragefield. A remark worth noting is the fact that, in general, thenugget value will be zero (b = 0) since this parameter is used toaccount for the variability at distances smaller than the typicalsample spacing, including the measurement error. Thus, forthe selected semivariogram fitting models in this paper, thediagonal of ΓM will consist of zeros.
Back to (9), a simplified expression containing the weightvector is the following one:
ΓM · λM + μM = γM . (11)
Simple manipulation of the given equation yields
λM = (ΓM )−1 · γMμ (12)
where
γMμ (x) =
⎛⎜⎜⎜⎝
γ(x− xM
1
)γ(x− xM
2
)...
γ(x− xM
m
)
⎞⎟⎟⎟⎠− μM . (13)
Equation (12) shows in a compact matrix form an expression forthe Kriging weight vectors, which will be obtained accordingto the selected semivariogram model. Equation (13) containsthe semivariogram values of the MUs minus the Lagrangemultiplier of the Kriging equations.
Similarly, the derivation of the estimated small-cell tier fieldSF with measurements provided by f mobile users will beperformed in an analogous manner. The small-cell coveragefield SF is defined as the maximum SINR value that a mobileuser could achieve at each point of the region of interest if asmall cell were serving it.
We are now in place to give analytical expressions for thecoverage fields of the two-tier network, which are given by asfollows in compact matrix form:
SM (x) =λM (x) · sM
=[(ΓM )−1 · γM
μ (x)]T · sM
=γMμ (x)T · (ΓM )−1 · sM (14)
SF (x) =λF (x) · sF
=[(ΓF )−1 · γF
μ (x)]T · sF
=γFμ (x)
T · (ΓF )−1 · sF . (15)
Here, T represents the transpose operator, and sF and sM rep-resent the macrocell and small-cell tiers measurement vectors,respectively. The macrocell case is shown as example in
sM =
⎛⎜⎜⎜⎝
S(xM1
)S(xM2
)...
S(xMm
)
⎞⎟⎟⎟⎠ . (16)
As a final remark, it is important to acknowledge the depen-dence of the model on the density of users per cell since thecoverage maps are generated based on users’ measurements.This paper considers a scenario with a realistic proportion ofusers to BSs according to the literature and 3GPP, but coverageestimation with this same model for underutilized cells woulddeserve further study.
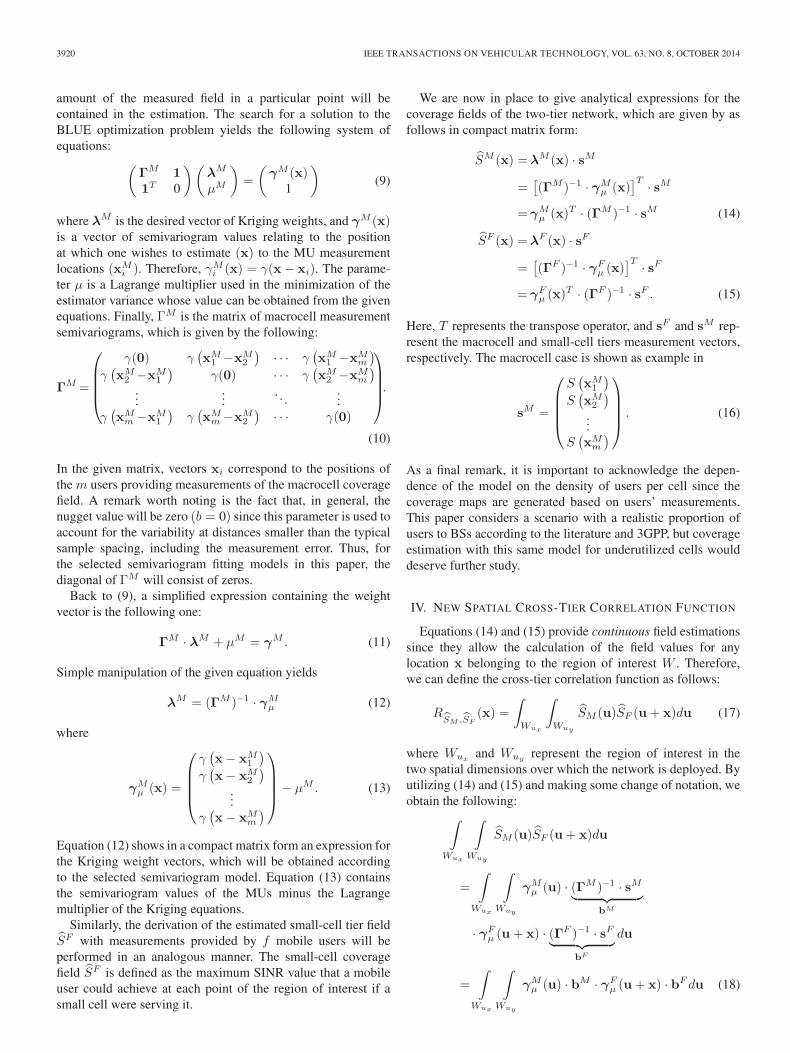
IV. NEW SPATIAL CROSS-TIER CORRELATION FUNCTION
Equations (14) and (15) provide continuous field estimationssince they allow the calculation of the field values for anylocation x belonging to the region of interest W . Therefore,we can define the cross-tier correlation function as follows:
RSM ,SF
(x) =
∫Wux
∫Wuy
SM (u)SF (u+ x)du (17)
where Wuxand Wuy
represent the region of interest in thetwo spatial dimensions over which the network is deployed. Byutilizing (14) and (15) and making some change of notation, weobtain the following:∫
Wux
∫Wuy
SM (u)SF (u+ x)du
=
∫Wux
∫Wuy
γMμ (u) · (ΓM )−1 · sM︸ ︷︷ ︸
bM
· γFμ (u+ x) · (ΓF )−1 · sF︸ ︷︷ ︸
bF
du
=
∫Wux
∫Wuy
γMμ (u) · bM · γF
μ (u+ x) · bF du (18)
GUTIERREZ-ESTEVEZ et al.: CROSS-TIER CORRELATION ANALYSIS FOR HETEROGENEOUS CELLULAR NETWORKS 3921
where vectors bM and bF capturing the information of thesemivariogram matrix and measurements are introduced forease of notation. Further mathematical manipulation yields∫Wux
∫Wuy
γMμ (u) · bM · γF
μ (u+ x) · bF du
=
∫Wux
∫Wuy
(γμ
(u− xM
1
)bM1 + · · ·+ γμ
(u− xM
m
)bMm
)
·(γμ
(u− xF
1
)bF1 + · · ·+ γμ
(u− xF
f
)bFf
)du
=
∫Wux
∫Wuy
mf∑i=1
γμ
(u− xM
f(i)
)bMf(i)γμ
(u− xF
g(i)
)bFg(i)du
(19)
where the subindices f(i) and g(i) have been introduced for de-termining either a specific measurement location or an elementof a vector. Functions f and g are defined as follows:
f(i) =
⌊i
f
⌋g(i) = i mod f. (20)
Switching the order of the sum and the integrals allows us toobtain the final cross-tier correlation expression given by
RSM ,SF (x) =
mf∑i=1
bMf(i)bFg(i)Ki(x) (21)
where the correlation terms Ki(x) are calculated according tothe following:
Ki(x)=
∫Wux
∫Wuy
γMμ
(u−xM
f(i)
)γFμ
(u+x−xF
g(i)
)du. (22)
V. CORRELATION-AWARE CELL-SPECIFIC
BIAS FOR RANGE EXPANSION
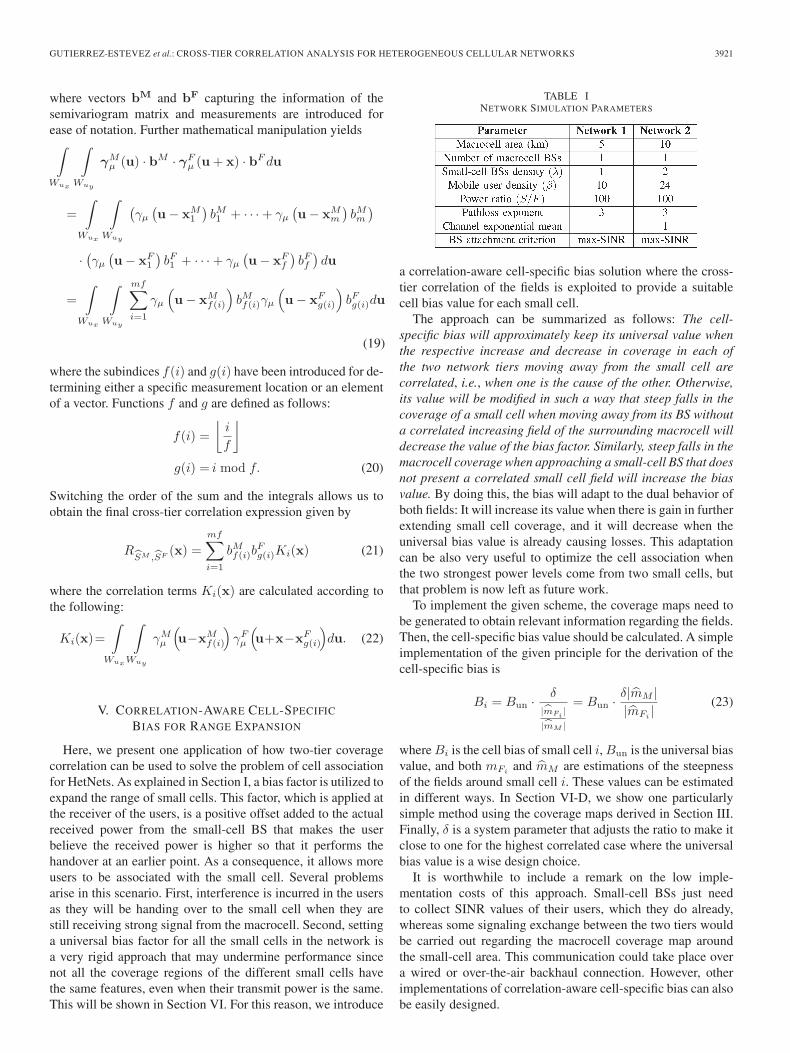
Here, we present one application of how two-tier coveragecorrelation can be used to solve the problem of cell associationfor HetNets. As explained in Section I, a bias factor is utilized toexpand the range of small cells. This factor, which is applied atthe receiver of the users, is a positive offset added to the actualreceived power from the small-cell BS that makes the userbelieve the received power is higher so that it performs thehandover at an earlier point. As a consequence, it allows moreusers to be associated with the small cell. Several problemsarise in this scenario. First, interference is incurred in the usersas they will be handing over to the small cell when they arestill receiving strong signal from the macrocell. Second, settinga universal bias factor for all the small cells in the network isa very rigid approach that may undermine performance sincenot all the coverage regions of the different small cells havethe same features, even when their transmit power is the same.This will be shown in Section VI. For this reason, we introduce
TABLE INETWORK SIMULATION PARAMETERS
a correlation-aware cell-specific bias solution where the cross-tier correlation of the fields is exploited to provide a suitablecell bias value for each small cell.
The approach can be summarized as follows: The cell-specific bias will approximately keep its universal value whenthe respective increase and decrease in coverage in each ofthe two network tiers moving away from the small cell arecorrelated, i.e., when one is the cause of the other. Otherwise,its value will be modified in such a way that steep falls in thecoverage of a small cell when moving away from its BS withouta correlated increasing field of the surrounding macrocell willdecrease the value of the bias factor. Similarly, steep falls in themacrocell coverage when approaching a small-cell BS that doesnot present a correlated small cell field will increase the biasvalue. By doing this, the bias will adapt to the dual behavior ofboth fields: It will increase its value when there is gain in furtherextending small cell coverage, and it will decrease when theuniversal bias value is already causing losses. This adaptationcan be also very useful to optimize the cell association whenthe two strongest power levels come from two small cells, butthat problem is now left as future work.
To implement the given scheme, the coverage maps need tobe generated to obtain relevant information regarding the fields.Then, the cell-specific bias value should be calculated. A simpleimplementation of the given principle for the derivation of thecell-specific bias is
Bi = Bun · δ
|mFi|
|mM |
= Bun · δ|mM ||mFi
| (23)
where Bi is the cell bias of small cell i, Bun is the universal biasvalue, and both mFi
and mM are estimations of the steepnessof the fields around small cell i. These values can be estimatedin different ways. In Section VI-D, we show one particularlysimple method using the coverage maps derived in Section III.Finally, δ is a system parameter that adjusts the ratio to make itclose to one for the highest correlated case where the universalbias value is a wise design choice.
It is worthwhile to include a remark on the low imple-mentation costs of this approach. Small-cell BSs just needto collect SINR values of their users, which they do already,whereas some signaling exchange between the two tiers wouldbe carried out regarding the macrocell coverage map aroundthe small-cell area. This communication could take place overa wired or over-the-air backhaul connection. However, otherimplementations of correlation-aware cell-specific bias can alsobe easily designed.

3922 IEEE TRANSACTIONS ON VEHICULAR TECHNOLOGY, VOL. 63, NO. 8, OCTOBER 2014
Fig. 3. Two-tier coverage field estimation with exponential semivariogram model for network 1. (a) Macrocell SINR field. (b) Small-cell SINR field.
Fig. 4. Two-tier coverage field estimation with exponential semivariogram model for network 2. (a) Macrocell SINR field. (b) Small-cell SINR field.
VI. PERFORMANCE EVALUATION
Here, we show numerical results and performance evalua-tion with the target of illustrating the correlation analysis ofSections IV and V. The objective is to validate the analyticalequations for a two-tier network consisting of a macrocellunderlaid by a tier of open-access small cells that use the sametransmit power. Furthermore, the performance of a cell-specificbias solution will be evaluated. The employed methodologycan be summarized as follows. Following the system modeldescribed in Section II, we simulate two networks with theparameters given in Table I. Network 1 is a simplified case witha reduced number of small-cell BS where the channel effectsare limited to the path loss due to distance. Network 2 is a morerealistic case containing numerous BSs and the channel modelpresented in Section II. The simulated scenario is used to obtainthe SINR values of the mobile users in the network and their BSattachment. With those values at hand, we show and analyze inSection VI-A the complete two-tier SINR field estimations ob-tained according to (14) and (15). In Section VI-B, we performa cross-validation of the three semivariogram models presentedin Section III to determine which of them performs the bestestimation. Section VI-C shows the novel cross-tier correlationfunctions of networks 1 and 2 obtained by evaluating (21) and
(22). Finally, Section VI-D evaluates the performance of ourcorrelation-aware solution for cell association.
A. Coverage Field Generation
The estimations of the macrocell and small-cell coveragefields are shown in Figs. 3 and 4 for networks 1 and 2,respectively. Both of them have used the exponential semivar-iogram model for their generation. In the case of network 1,the structure of the SINR fields is very clean since the onlypresent channel effect is the path loss; hence, no randomnessaffects the estimation. As expected, the macrocell SINR fieldexhibits a maximum at the location of the macrocell BS. Thequality of the field goes down with the distance to the BS dueto the path-loss effect and the interference coming from thethree small cells present in the network. The minima of theSINR field are precisely met at the location of these small-cellBSs. Reciprocally, the small-cell tier exhibits also an expectedstructure, with maxima located at the small-cell BS locationsand a minimum at the location of the macrocell BS. Thus, aclear cross correlation exists between the two fields.
The case of network 2 is shown in Fig. 4. Here, we ob-serve fields of a less smooth structure. The randomness of theRayleigh fading channel and the more complex nature of the
GUTIERREZ-ESTEVEZ et al.: CROSS-TIER CORRELATION ANALYSIS FOR HETEROGENEOUS CELLULAR NETWORKS 3923
network are responsible for it. However, since our final objec-tive is to determine and characterize a possible cross correlationbetween the fields, we do observe reciprocal behavior in thetwo-tier field despite the channel. Maxima and minima are stilllocated at the positions of the BSs, whereas the type of the BSdepends on whether it corresponds to the macrocell tier or to thesmall-cell tier. Thus, a characterization of the cross correlationis still meaningful, as will be shown in Section VI-C.
B. Semivariogram Model Cross-Validation
We now explore the different semivariogram fitting modelsintroduced in Section III. The three cases that will be analyzedcorrespond to the exponential, Gaussian, and linear modelsemployed for the best possible fitting of user measurementsto an analytical semivariogram function. The method that wefollow is a cross-validation of the estimation results for thecase of network 2, where a larger pool of measurements isavailable. An estimation is performed at each location for whicha measurement is available, and the error of the estimation isobtained by subtracting the estimated value from the real value.This method is repeated for the three models. Furthermore, twoerror metrics are shown: the complete cross-validation errordistribution, where all the estimation errors for both fields arecaptured, and the mean square error (MSE) given by
E =
∑Ni
(Z(i)− Z(i)
)2
N(24)
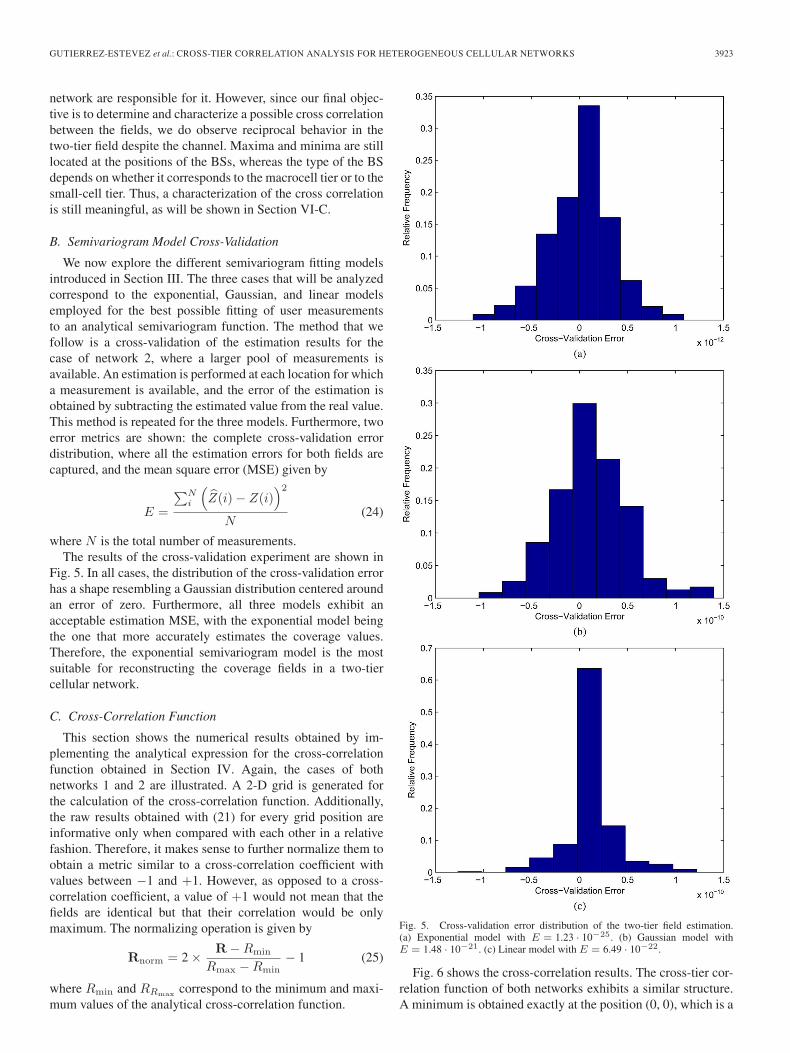
where N is the total number of measurements.The results of the cross-validation experiment are shown in
Fig. 5. In all cases, the distribution of the cross-validation errorhas a shape resembling a Gaussian distribution centered aroundan error of zero. Furthermore, all three models exhibit anacceptable estimation MSE, with the exponential model beingthe one that more accurately estimates the coverage values.Therefore, the exponential semivariogram model is the mostsuitable for reconstructing the coverage fields in a two-tiercellular network.
C. Cross-Correlation Function
This section shows the numerical results obtained by im-plementing the analytical expression for the cross-correlationfunction obtained in Section IV. Again, the cases of bothnetworks 1 and 2 are illustrated. A 2-D grid is generated forthe calculation of the cross-correlation function. Additionally,the raw results obtained with (21) for every grid position areinformative only when compared with each other in a relativefashion. Therefore, it makes sense to further normalize them toobtain a metric similar to a cross-correlation coefficient withvalues between −1 and +1. However, as opposed to a cross-correlation coefficient, a value of +1 would not mean that thefields are identical but that their correlation would be onlymaximum. The normalizing operation is given by
Rnorm = 2 × R−Rmin
Rmax −Rmin− 1 (25)
where Rmin and RRmaxcorrespond to the minimum and maxi-
mum values of the analytical cross-correlation function.
Fig. 5. Cross-validation error distribution of the two-tier field estimation.(a) Exponential model with E = 1.23 · 10−25. (b) Gaussian model withE = 1.48 · 10−21. (c) Linear model with E = 6.49 · 10−22.
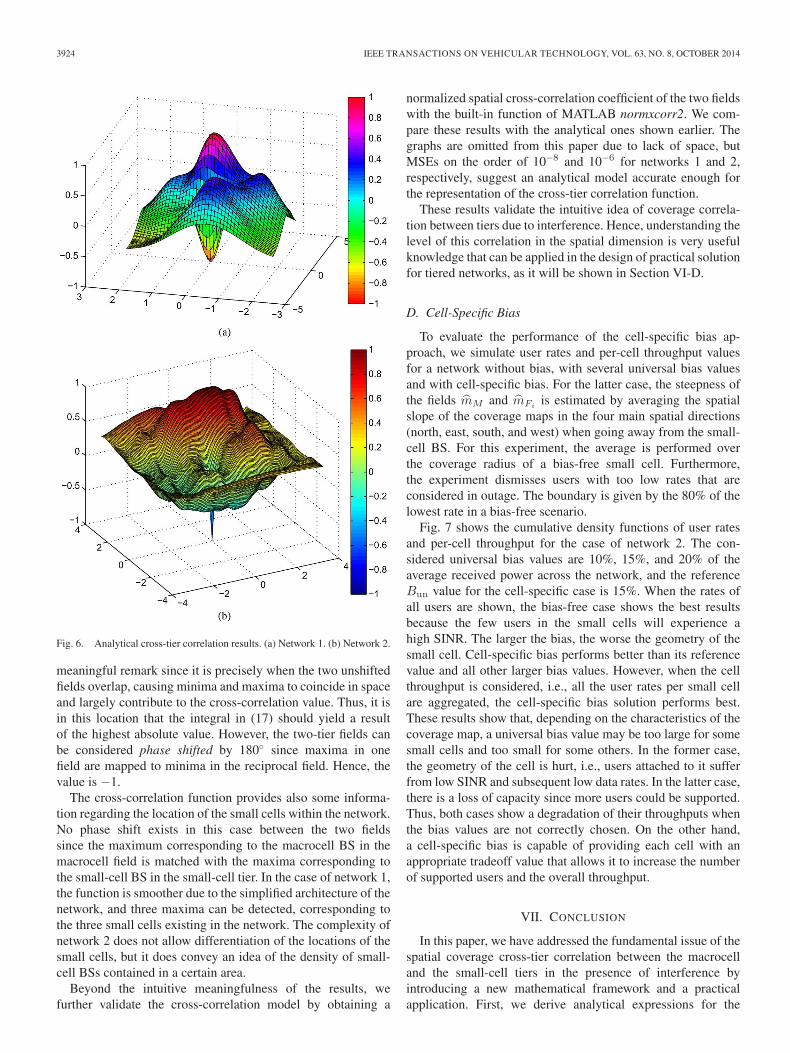
Fig. 6 shows the cross-correlation results. The cross-tier cor-relation function of both networks exhibits a similar structure.A minimum is obtained exactly at the position (0, 0), which is a
3924 IEEE TRANSACTIONS ON VEHICULAR TECHNOLOGY, VOL. 63, NO. 8, OCTOBER 2014
Fig. 6. Analytical cross-tier correlation results. (a) Network 1. (b) Network 2.
meaningful remark since it is precisely when the two unshiftedfields overlap, causing minima and maxima to coincide in spaceand largely contribute to the cross-correlation value. Thus, it isin this location that the integral in (17) should yield a resultof the highest absolute value. However, the two-tier fields canbe considered phase shifted by 180◦ since maxima in onefield are mapped to minima in the reciprocal field. Hence, thevalue is −1.
The cross-correlation function provides also some informa-tion regarding the location of the small cells within the network.No phase shift exists in this case between the two fieldssince the maximum corresponding to the macrocell BS in themacrocell field is matched with the maxima corresponding tothe small-cell BS in the small-cell tier. In the case of network 1,the function is smoother due to the simplified architecture of thenetwork, and three maxima can be detected, corresponding tothe three small cells existing in the network. The complexity ofnetwork 2 does not allow differentiation of the locations of thesmall cells, but it does convey an idea of the density of small-cell BSs contained in a certain area.
Beyond the intuitive meaningfulness of the results, wefurther validate the cross-correlation model by obtaining a
normalized spatial cross-correlation coefficient of the two fieldswith the built-in function of MATLAB normxcorr2. We com-pare these results with the analytical ones shown earlier. Thegraphs are omitted from this paper due to lack of space, butMSEs on the order of 10−8 and 10−6 for networks 1 and 2,respectively, suggest an analytical model accurate enough forthe representation of the cross-tier correlation function.
These results validate the intuitive idea of coverage correla-tion between tiers due to interference. Hence, understanding thelevel of this correlation in the spatial dimension is very usefulknowledge that can be applied in the design of practical solutionfor tiered networks, as it will be shown in Section VI-D.
D. Cell-Specific Bias
To evaluate the performance of the cell-specific bias ap-proach, we simulate user rates and per-cell throughput valuesfor a network without bias, with several universal bias valuesand with cell-specific bias. For the latter case, the steepness ofthe fields mM and mFi
is estimated by averaging the spatialslope of the coverage maps in the four main spatial directions(north, east, south, and west) when going away from the small-cell BS. For this experiment, the average is performed overthe coverage radius of a bias-free small cell. Furthermore,the experiment dismisses users with too low rates that areconsidered in outage. The boundary is given by the 80% of thelowest rate in a bias-free scenario.
Fig. 7 shows the cumulative density functions of user ratesand per-cell throughput for the case of network 2. The con-sidered universal bias values are 10%, 15%, and 20% of theaverage received power across the network, and the referenceBun value for the cell-specific case is 15%. When the rates ofall users are shown, the bias-free case shows the best resultsbecause the few users in the small cells will experience ahigh SINR. The larger the bias, the worse the geometry of thesmall cell. Cell-specific bias performs better than its referencevalue and all other larger bias values. However, when the cellthroughput is considered, i.e., all the user rates per small cellare aggregated, the cell-specific bias solution performs best.These results show that, depending on the characteristics of thecoverage map, a universal bias value may be too large for somesmall cells and too small for some others. In the former case,the geometry of the cell is hurt, i.e., users attached to it sufferfrom low SINR and subsequent low data rates. In the latter case,there is a loss of capacity since more users could be supported.Thus, both cases show a degradation of their throughputs whenthe bias values are not correctly chosen. On the other hand,a cell-specific bias is capable of providing each cell with anappropriate tradeoff value that allows it to increase the numberof supported users and the overall throughput.
VII. CONCLUSION
In this paper, we have addressed the fundamental issue of thespatial coverage cross-tier correlation between the macrocelland the small-cell tiers in the presence of interference byintroducing a new mathematical framework and a practicalapplication. First, we derive analytical expressions for the

GUTIERREZ-ESTEVEZ et al.: CROSS-TIER CORRELATION ANALYSIS FOR HETEROGENEOUS CELLULAR NETWORKS 3925
Fig. 7. Cell-specific bias results. (a) Rates. (b) Throughput.
estimated two-tier coverage fields using techniques from therandom field theory. We utilize different estimation models andcross-validate them for an assessment of their suitability forthe task at hand. Stemming from these expressions, we derivea novel closed-form expression for the cross-tier correlationfunction exclusively dependent on the estimator’s parameters.Then, we propose a novel and simple cell-association schemefor small cells based on cell-specific bias. Results show thesuitability of the model for the estimation of the fields and theircorrelation, as well as the potential of using cross-correlation toefficiently solve practical problems of HetNets. Moreover, thispaper opens the path for further research on cross-tier coveragecorrelation and its applications.
REFERENCES
[1] I. F. Akyildiz, D. M. Gutierrez-Estevez, R. Balakrishnan, andE. Chavarria-Reyes, “LTE-advanced and the evolution to Beyond4G(B4G) systems,” Phys. Commun., vol. 10, pp. 31–60, Mar. 2014.
[2] I. F. Akyildiz, D. M. Gutierrez-Estevez, and E. Chavarria-Reyes, “Theevolution to 4G cellular systems: LTE-advanced,” Phys. Commun., vol. 3,no. 4, pp. 217–244, Dec. 2010.
[3] V. Chandrasekhar, J. G. Andrews, and A. Gatherer, “Femtocell networks:A survey,” IEEE Commun. Mag., vol. 46, no. 9, pp. 59–67, Sep. 2008.
[4] A. Ghosh, N. Mangalvedhe, R. Ratasuk, B. Mondal, M. Cudak,E. Visotsky, T. A. Thomas, J. G. Andrews, P. Xia, H. Jo, H. S. Dhillon,and T. D. Novlan, “Heterogeneous cellular networks: From theory topractice,” IEEE Commun. Mag., vol. 50, no. 6, pp. 54–64, Jun. 2012.
[5] “3GPP TS 25.467: UTRAN architecture for 3G Home Node B(HNB);Stage 2,” Sophia-Antipolis, France, Tech. Rep., Dec. 2013.
[6] “WMF-T33-118-R016v02: Network architecture femtocell core specifi-cation,” Clackamas, OR, USA, Tech. Rep., Nov. 2010.
[7] C. Mun, J. Moon, and J. G. Yook, “Self-optimized coverage coordinationin femtocell networks,” IEEE Trans. Wireless Commun., vol. 9, no. 10,pp. 2977–2982, Oct. 2010.
[8] V. Chandrasekhar, M. Kountouris, and J. G. Andrews, “Coverage in multi-antenna two-tier networks,” IEEE J. Sel. Areas Commun., vol. 8, no. 10,pp. 5314–5327, Oct. 2009.
[9] H.-S. Jo, C. Mun, J. Moon, and J.-G. Yook, “Interference mitigationusing uplink power control for two-tier femtocell networks,” IEEE Trans.Wireless Commun., vol. 8, no. 10, pp. 4906–4910, Oct. 2009.
[10] C. Young-June, K. C. Seung, and B. Saewoong, “Flexible design of fre-quency reuse factor in OFDMA cellular networks,” in Proc. IEEE ICC,Jun. 2006, pp. 1784–1788.
[11] I. F. Akyildiz, E. Chavarria-Reyes, D. M. Gutierrez-Estevez,R. Balakrishnan, and J. R. Krier, “Enabling next generation smallcells through femtorelays,” Phys. Commun., vol. 9, pp. 1–15, Dec. 2013.
[12] D. López-Pérez, X. Chu, and I. Guvenc, “On the expanded region ofpicocells in heterogeneous networks,” IEEE J. Sel. Topics Signal Process.,vol. 6, no. 3, pp. 281–294, Jun. 2012.
[13] H.-S. Jo, Y. J. Sang, P. Xia, and J. Andrews, “Heterogeneous cellularnetworks with flexible cell association: A comprehensive downlink SINRanalysis,” IEEE Trans. Wireless Commun., vol. 11, no. 10, pp. 3484–3495,Oct. 2012.
[14] D. M. Gutierrez-Estevez, B. Canberk, and I. F. Akyildiz, “Spatio-temporalestimation for interference management in femtocell networks,” in Proc.IEEE Int. Symp. PIMRC, Sep. 2012, pp. 1137–1142.
[15] A. Damnjanovic, J. Montojo, Y. Wei, T. Ji, T. Luo, M. Vajapeyam, T. Yoo,O. Song, and D. Malladi, “A survey on 3GPP heterogeneous networks,”IEEE Wireless Commun. Mag., vol. 18, no. 3, pp. 10–21, Jun. 2011.
[16] M. Haenggi, J. G. Andrews, F. Baccelli, O. Dousse, and M. Franceschetti,“Stochastic geometry and random graphs for the analysis and design ofwireless networks,” IEEE J. Sel. Areas Commun., vol. 27, no. 7, pp. 1029–1046, Sep. 2009.
[17] N. Cressie, Statistics for Spatial Data. Hoboken, NJ, USA: Wiley, 1993.[18] B. D. Ripley, Spatial Statistics. Hoboken, NJ, USA: Wiley, 2004.[19] J. Riihijarvi and P. Mahonen, “Spatial statistics for wireless networks
research,” Proc. Environ. Sci., vol. 7, pp. 86–91, 2011.[20] J. Riihijarvi, P. Mahonen, M. Wellens, and M. Gordziel, “Characterization
and modelling of spectrum for dynamic spectrum access with spatialstatistics and random fields,” in Proc. IEEE Int. Symp. Pers., Indoor,Mobile Radio Commun., Sep. 2008, pp. 1–6.
[21] J. Riihijarvi and P. Mahonen, “Estimating wireless network propertieswith spatial statistics and models,” in Proc. Int. Symp. Model. Optim.Mobile, Ad Hoc Wireless Netw. WiOpt, May 2012, pp. 331–336.
[22] G. Bohling, Introduction to geostatistics and variogram analysis, 2005.[Online]. Available: http://gismyanmar.org/geofocus/wp-content/uploads/2013/01/Variograms.pdf
David M. Gutierrez-Estevez (S’13) received theEngineering degree in telecommunications fromUniversidad de Granada, Granada, Spain, in 2009and the M.S. degree in electrical and computerengineering from Georgia Institute of Technology(Georgia Tech), Atlanta, GA, USA, in 2011, with afellowship from Fundación la Caixa. He is currentlyworking toward the Ph.D. degree with the BroadbandWireless Networking Laboratory, Georgia Tech, un-der the supervision of Prof. I. F. Akyildiz on thetopic of heterogeneous networks for future cellular
systems with a fellowship from Fundación Caja Madrid (2011–2013).In 2007, he was an Intern with Fraunhofer Institute for Integrated Circuits,
Erlangen, Germany. From April 2008 to June 2009, he was a Research Assistantwith Fraunhofer Heinrich Hertz Institute, Berlin, Germany. In 2013, he was anIntern with Qualcomm, San Diego, CA, USA.

3926 IEEE TRANSACTIONS ON VEHICULAR TECHNOLOGY, VOL. 63, NO. 8, OCTOBER 2014
Ian F. Akyildiz (F’96) received the B.S., M.S., andPh.D. degrees in computer engineering from the Uni-versity of Erlangen-Nürnberg, Erlangen, Germany,in 1978, 1981, and 1984, respectively.
He is currently the Director of the BroadbandWireless Networking Laboratory, the Chair of theTelecommunication Group, and the Ken Byers ChairProfessor in telecommunications with the Schoolof Electrical and Computer Engineering, GeorgiaInstitute of Technology (Georgia Tech), Atlanta, GA,USA. Since 2011, he has been a Consulting Chair
Professor with the Department of Information Technology, King AbdulazizUniversity, Jeddah, Saudi Arabia. Since January 2013, he has been a FinlandDistinguished Professor (supported by the Academy of Finland) with theDepartment of Communications Engineering, Tampere University of Technol-ogy, Tampere, Finland. He is also an Honorary Professor with the School ofElectrical Engineering, Technical University of Catalonia (UPC), Barcelona,Spain, and with the Department of Electrical, Electronic, and Computer En-gineering, University of Pretoria, Pretoria, South Africa. He is the Founder ofthe NaNoNetworking Center in Catalonia (N3Cat) and the Advanced SensorNetworks Laboratory. His research interests include Long-Term Evolution,advanced cellular systems, and nanoscale communication networks.
Dr. Akyildiz is a Fellow of the Association for Computing Machinery(ACM). He is currently the Editor-in-Chief of Computer Networks (Elsevier).He was the founding Editor-in-Chief of Ad Hoc Networks (Elsevier), PhysicalCommunication (Elsevier), and Nano Communication Networks (Elsevier). Hereceived numerous awards from the IEEE and the ACM.
Etimad A. Fadel received the B.S. degree in computer science from KingAbdul Aziz University (KAU), Jeddah, Saudi Arabia, in 1994 and the M.phil/Ph.D. degree in computer science from De Montfort University, Leicester, U.K.,in 2007.
She is currently an Assistant Professor with the Department of ComputerScience, KAU. Her research interests include wireless networks, Internet ofThings, Internet of Nano-Things, sensor networks, and Long-Term Evolution-Advanced cellular systems.