Spatial Components of Bird Diversity in the Andes of Colombia: Implications for Designing a Regional...
9
Spatial Components of Bird Diversity in the Andes of Colombia: Implications for Designing a Regional Reserve System GUSTAVO H. KATTAN, ∗ PADU FRANCO, CARLOS A. SAAVEDRA-RODR ´ IGUEZ, CARLOS VALDERRAMA, VLADIMIR ROJAS, DANIEL OSORIO, AND JES ´ US MART ´ INEZ Fundaci´ on EcoAndina/ Wildlife Conservation Society Colombia Program, Apartado A´ ereo 25527, Cali, Colombia Abstract: Beta diversity, or the turnover in species composition among sampling sites in a region, is an important criterion for obtaining adequate representation of regional biodiversity in systems of protected areas. Recently, the additive model for partitioning regional (gamma) diversity (in opposition to the multiplicative model) has been proposed because it allows a direct measure of the contribution of beta diversity to gamma diversity. We determined avian beta diversity along latitudinal (among neighboring river drainages) and elevational axes in a 1347-km 2 region on the western slope of the Central Cordillera of the Colombian Andes, where a regional system of protected areas is being designed. We then compared avian beta diversity between sites based on rapid versus long-term (>1 year) inventories and between fragmented sites versus continuous forest. Overall, beta diversity represented 63.1% of gamma diversity among 16 sites. Elevational differences in species composition accounted for 43.3% of regional diversity, whereas differences among drainages accounted for 19.8%. A complementary cluster analysis showed that sites grouped by elevational zones. Rapid inventories overestimated beta diversity because of sampling effects, but the effect was biologically small. Estimators of species richness derived from species accumulation curves provided a useful alternative to compensate for undersampling in short-term surveys. Forest fragmentation increased beta diversity because of differential local extinction of populations. Nevertheless, in our region, forest fragments contributed to gamma diversity because they contained complementary sets of species. More importantly, they contained populations of special- interest species. Although the region is relatively small, our analyses indicate that spatial differentiation of the biota is an important factor for deciding number and location of protected areas in the Andean region. Keywor ds: additive partition of diversity, beta diversity, conservation planning, protected-area design Componentes Espaciales de la Diversidad de Aves en los Andes de Colombia: Implicaciones para el Dise˜ no de un Sistema Regional de Reservas Resumen: La diversidad beta, o recambio en la composici´ on de especies entre sitios de muestreo en una regi´ on, es un criterio importante para alcanzar una adecuada representaci´ on de la biodiversidad regional en sistemas de ´ areas protegidas. Recientemente, el modelo aditivo para la partici´ on de la diversidad gama o diversidad regional (en oposici´ on al modelo multiplicativo) ha sido promocionado pues permite una medida directa de la contribuci´ on de la diversidad beta a la diversidad gama. En este estudio determinamos la di- versidad beta de aves a lo largo de ejes latitudinales (entre cuencas hidrogr´ aficas vecinas) y altitudinales en una regi´ on de 1347 km 2 en la vertiente occidental de la cordillera Central de los Andes de Colombia, donde se est´ a construyendo un sistema regional de ´ areas protegidas. Tambi´ en comparamos la diversidad beta de aves entre sitios caracterizados con muestreos r´ apidos versus inventarios a largo plazo (>1 a˜ no) y entre sitios con bosques fragmentados versus bosques continuos. En total, la diversidad beta represent´ o el 63.1% de la ∗ Address for correspondence: Avenida 2 Oeste No. 10-54, Cali, Colombia, email [email protected] Paper submitted April 27, 2005; revised manuscript accepted August 31, 2005. 1203 Conservation Biology Volume 20, No. 4, 1203–1211 C 2006 Society for Conservation Biology DOI: 10.1111/j.1523-1739.2006.00402.x
-
Upload
independent -
Category
Documents
-
view
3 -
download
0
Transcript of Spatial Components of Bird Diversity in the Andes of Colombia: Implications for Designing a Regional...
Spatial Components of Bird Diversity in the Andes ofColombia: Implications for Designing a RegionalReserve System
GUSTAVO H. KATTAN,∗ PADU FRANCO, CARLOS A. SAAVEDRA-RODRIGUEZ,CARLOS VALDERRAMA, VLADIMIR ROJAS, DANIEL OSORIO, AND JESUS MARTINEZ
Fundacion EcoAndina/Wildlife Conservation Society Colombia Program, Apartado Aereo 25527, Cali, Colombia
Abstract: Beta diversity, or the turnover in species composition among sampling sites in a region, is animportant criterion for obtaining adequate representation of regional biodiversity in systems of protected areas.Recently, the additive model for partitioning regional (gamma) diversity (in opposition to the multiplicativemodel) has been proposed because it allows a direct measure of the contribution of beta diversity to gammadiversity. We determined avian beta diversity along latitudinal (among neighboring river drainages) andelevational axes in a 1347-km2 region on the western slope of the Central Cordillera of the Colombian Andes,where a regional system of protected areas is being designed. We then compared avian beta diversity betweensites based on rapid versus long-term (>1 year) inventories and between fragmented sites versus continuousforest. Overall, beta diversity represented 63.1% of gamma diversity among 16 sites. Elevational differences inspecies composition accounted for 43.3% of regional diversity, whereas differences among drainages accountedfor 19.8%. A complementary cluster analysis showed that sites grouped by elevational zones. Rapid inventoriesoverestimated beta diversity because of sampling effects, but the effect was biologically small. Estimators ofspecies richness derived from species accumulation curves provided a useful alternative to compensate forundersampling in short-term surveys. Forest fragmentation increased beta diversity because of differentiallocal extinction of populations. Nevertheless, in our region, forest fragments contributed to gamma diversitybecause they contained complementary sets of species. More importantly, they contained populations of special-interest species. Although the region is relatively small, our analyses indicate that spatial differentiation of thebiota is an important factor for deciding number and location of protected areas in the Andean region.
Keywor ds: additive partition of diversity, beta diversity, conservation planning, protected-area design
Componentes Espaciales de la Diversidad de Aves en los Andes de Colombia: Implicaciones para el Diseno de un
Sistema Regional de Reservas
Resumen: La diversidad beta, o recambio en la composicion de especies entre sitios de muestreo en unaregion, es un criterio importante para alcanzar una adecuada representacion de la biodiversidad regionalen sistemas de areas protegidas. Recientemente, el modelo aditivo para la particion de la diversidad gama odiversidad regional (en oposicion al modelo multiplicativo) ha sido promocionado pues permite una medidadirecta de la contribucion de la diversidad beta a la diversidad gama. En este estudio determinamos la di-versidad beta de aves a lo largo de ejes latitudinales (entre cuencas hidrograficas vecinas) y altitudinales enuna region de 1347 km2 en la vertiente occidental de la cordillera Central de los Andes de Colombia, dondese esta construyendo un sistema regional de areas protegidas. Tambien comparamos la diversidad beta deaves entre sitios caracterizados con muestreos rapidos versus inventarios a largo plazo (>1 ano) y entre sitioscon bosques fragmentados versus bosques continuos. En total, la diversidad beta represento el 63.1% de la
∗Address for correspondence: Avenida 2 Oeste No. 10-54, Cali, Colombia, email [email protected] submitted April 27, 2005; revised manuscript accepted August 31, 2005.
1203Conservation Biology Volume 20, No. 4, 1203–1211C©2006 Society for Conservation Biology
DOI: 10.1111/j.1523-1739.2006.00402.x

1204 Beta Diversity of Andean Birds Kattan et al.
diversidad gama encontrada entre 16 localidades. Las diferencias altitudinales en composicion de especiesrepresentaron el 43.3% de la diversidad regional, mientras que las diferencias entre cuencas representaron el19.8%. Un analisis de agrupamiento complementario tambien mostro la diferenciacion de especies por eleva-ciones pues las localidades se agruparon por cinturones altitudinales. Los inventarios rapidos sobre-estimaronla diversidad beta debido al efecto de muestreo incompleto, pero el efecto fue biologicamente pequeno. Losestimadores de riqueza de especies derivados de las curvas de acumulacion de especies proveyeron una alter-nativa util para compensar el submuestreo en los inventarios rapidos. La fragmentacion de bosques aumentola diversidad beta debido a extincion local diferencial de poblaciones. Sin embargo, en nuestra region losfragmentos de bosque contribuyen a la diversidad gama porque contienen conjuntos complementarios deespecies. Ademas, estos fragmentos contienen poblaciones de especies de interes especial. Aunque la regiones relativamente pequena, nuestros analisis indican que la diferenciacion espacial de la biota es un factorimportante a la hora de tomar decisiones sobre el numero y la localizacion de areas protegidas en la regionandina.
Palabras Clave: diseno de areas protegidas, diversidad beta, particion aditiva de la diversidad, planificacion de
la conservacion
Introduction
An important parameter in conservation planning is betadiversity (i.e., the turnover in species composition thatoccurs among sampling sites within a region; Gering etal. 2003). One of the main criteria used to design re-gional systems of protected areas is representation of allthe ecosystems, communities, and species found in a re-gion (Groves 2003). If beta diversity is high—that is, thereare large differences in species composition among siteswithin a region—then more reserves are required to rep-resent this diversity in the system. In contrast, in a homo-geneous region, a few reserves may suffice to representbeta diversity.
Beta diversity was originally defined as the turnoverin species composition among samples taken along anenvironmental gradient or in different habitats in a land-scape (Whittaker 1975; Schluter & Ricklefs 1993). Al-pha diversity represents the diversity within each sample,and gamma diversity represents the total diversity foundin the entire gradient or landscape. The concepts of al-pha and beta diversity have also been equated to within-habitat and between-habitat diversities, respectively. Thedifferent components of diversity can be defined at dif-ferent spatial scales. Thus, alpha diversity may be definedas within-habitat diversity in a heterogeneous landscape,beta diversity as between-habitat diversity, and gamma asthe diversity of the entire landscape. At a larger spatialscale, alpha may be the diversity of an entire landscapewithin a region, with gamma representing the diversityof the region and beta representing the differentiation inspecies composition among landscapes.
There are two ways to relate these spatial componentsof diversity. The most commonly used relation in the eco-logical literature is the multiplicative model: α × β = γ.Numerous ways to calculate β have been proposed un-der the multiplicative model (Whittaker 1975; Schluter& Ricklefs 1993; Lande 1996; Veech et al. 2002). In these
models, α and γ are expressed in numbers of species andβ is a dimensionless number (Schluter & Ricklefs 1993).A problem with these measures is that the different com-ponents of diversity are not directly comparable (Lande1996; Veech et al. 2002).
The spatial components of diversity can also be relatedwith an additive model: α + β = γ. Although the additivepartitioning model of diversity was introduced over 30years ago (Veech et al. 2002), it has been used only re-cently to characterize patterns of diversity (Loreau 2000;Veech et al. 2002; Gering et al. 2003). An advantage of theadditive model is that the different components have thesame units. Under this model, α is defined as the meandiversity found in a set of samples and β diversity as themean diversity not found in the samples (i.e., both mea-sures represent averages that added together represent100% of gamma diversity). This allows a direct compar-ison of the contribution of α and β to γ diversity. Theadditive partitioning of beta diversity can be applied to arange of spatial scales in a hierarchical fashion (Veech et al.2002; Gering et al. 2003). Samples can be grouped at dif-ferent spatial levels in a hierarchy (e.g., trees, stands, sites,regions), and beta diversity can be partitioned at differentlevels in the hierarchy (among trees, among stands, andso on). Alternatively, samples can be grouped accordingto different factors to explore the contribution of thesefactors to beta diversity. Samples can also be grouped bytemporal units to explore temporal partitioning of diver-sity (DeVries et al. 1999).
In a conservation context, the additive model providesa simple way to characterize the heterogeneity of a regionin terms of beta diversity (Gering et al. 2003). We charac-terized beta diversity of birds in a region on the westernslope of the Central Cordillera of the Andes of Colombia,in the context of designing a regional system of protectedareas (Kattan 2005). In addition to protecting overall di-versity, an objective of the system is to represent pop-ulations of focal species that are of special conservation
Conservation Biology
Volume 20, No. 4, August 2006

Kattan et al. Beta Diversity of Andean Birds 1205
concern. The region encompasses an elevational gradientfrom 980 m to more than 5000 m over 33 km, and sev-eral river drainages over a latitudinal extent of 0.62◦ (67.5km). Thus, one objective was to determine the differenti-ation of avian faunas (beta diversity) along the latitudinaland elevational axes.
Decision making in this process has been hampered bypoor knowledge of the region. We chose birds as a targetgroup to evaluate beta diversity because they are the best-known taxon (birds may underestimate beta diversity forless vagile groups). Still, gaps in regional knowledge exist,so we conducted a series of rapid biological inventories atseveral sites to gather data on species composition. There-fore, a second objective of our study was to assess the ef-fectiveness of these rapid inventories compared with sitesthat have been sampled for longer periods of time. For thiswe used two approaches. First, we compared beta diver-sity among sites with rapid surveys and with long-termsurveys. Second, we used species-accumulation curvesto estimate true species richness. Our study area is in themiddle of one of the most economically productive re-gions of Colombia, which has resulted in extensive land-scape transformation and forest fragmentation. Thus, ourthird objective was to assess the value of small forest frag-ments for the system of protected areas in terms of theircontribution to beta diversity and content of populationsof focal species.
Study Area and Methods
The central part of the western slope of the Central Cor-dillera of the Andes of Colombia is known as the EjeCafetero (cities of Armenia, Pereira, and Manizales) or themain coffee-growing region of the country. Our study re-gion was part of a larger region for which a system ofprotected areas is being designed (Kattan 2005), and isin itself part of the beta diversity of the Andean region ofColombia (Kattan et al. 2004). The main axis of the Cen-tral Andes runs in a general south-north direction, withrivers on the western slope draining in an east-west direc-tion into the north-flowing Cauca River. These montanerivers form a series of transverse drainages separated byridges, forming rib-like features along the Andean back-bone. Our study region was framed by Rıo Quindıo (Mu-nicipality of Salento) in the south and Rıo Blanco (Mu-nicipality of Manizales) in the north. The 16 study sitesranged latitudinally over six drainages (4.51◦ N to 5.13◦
N; Fig. 1).Elevationally, the region ranges from the Cauca Valley,
900–1000 m, to several snow-capped volcanos, above5000 m (75.32◦ to 75.71◦W). Based on previous work(Kattan & Franco 2004), we defined five elevationalzones: 900–1500 m, 1500–2200 m, 2200–2600 m, 2600–3200 m, and >3200 m. The lower limit of the uppermost
elevational zone represents the tree line, (i.e., the ele-vation at which Andean forest gives way to paramo, ahigh-elevation shrubland and grassland ecosystem). Thisupper zone is open ended because the upper limit of veg-etation is variable; however, vegetation is sparse and fewbird species are resident above 4000 m.
For each of the 16 sites (Fig. 1), we compiled a listof bird species, which we classified into forest-dwellingspecies and species of open habitats (pastures and crop-lands). Eight of these sites were surveyed by ourselves,and for the others we obtained data from publishedworks. Eight of the sites were covered with continuousforest (several thousand hectares), and the other eightwere fragmented landscapes, with forest patches of usu-ally <100 ha. In all cases surveys were conducted in forestand adjacent open habitats (mostly pastures with variablelevels of tree cover). For 10 sites, bird lists were obtainedover a year or longer (long-term sites). Inventories forthese sites have been obtained through a combination ofmethods, including transect sampling, mist nets, and op-portunistic observations. Sampling effort varied amongthese sites, but because data were collected for long timeperiods, we assumed bird inventories were reasonablycomplete. For the other six sites, we conducted rapid,20-day surveys (V.R. et al., unpublished data). In each sur-vey, we operated 20 mist nets between 0500 and 1800hours for 20 days. Simultaneously we made opportunis-tic observations throughout the study area in an attemptto record as many species as possible.
We calculated alpha diversity (species richness) as themean number of species found in all 16 localities. Then wesubtracted the number of species in each locality from thetotal species list (gamma diversity) and calculated beta di-versity as the mean number of species not found in sites(Lande 1996; Veech et al. 2002). We used the programPARTITION to generate expected values of beta diversityaccording to a null model, under the hypothesis that theobserved partition of diversity could be produced by ran-dom allocation of samples (Crist et al. 2003). We useda hierarchical model, with sites grouped by elevationalzones. Thus, we obtained two levels of beta diversity:among sites within elevational zones (beta1) and amongelevational zones (beta2). The p values generated by theprogram PARTITION are the number of null values thatare greater than or equal to the observed value of betadiversity. Thus, with a two-tailed probability of 0.05, theobserved component of diversity is significantly differentfrom the null model if p < 0.025 (observed value is greaterthan expected) or p > 0.975 (observed value is smallerthan the expected value).
We also evaluated differences in composition amonglocalities by means of a dendrogram constructed from apresence–absence matrix based on a hierarchical clusteranalysis. We used the centroid method and Jaccard’s co-efficient of similarity for grouping localities (SPSS statisti-cal package). Because distances between branches in the
Conservation Biology
Volume 20, No. 4, August 2006

1206 Beta Diversity of Andean Birds Kattan et al.
Figure 1. The study region on the western slope of the Central Range of the Colombian Andes, showing the sitesincluded in this study.
dendrogram indicate how different the species composi-tion of the samples is, the cluster analysis is a complemen-tary method of evaluating beta diversity in the region.
To further decompose β along elevational and latitudi-nal axes, we calculated β separately for three drainagesso that each had three or more localities at different eleva-tions (with γ being the total species list for each drainage).Two of these three drainages had long-term species lists,and the other was characterized with rapid surveys. Theseanalyses allowed us to explore the effects of rapid surveyson beta diversity. Because rapid surveys may fail to obtaincomplete species lists for a locality due to a sampling ef-fect, beta diversity may be overestimated (Lande 1996).To evaluate the effectiveness of these surveys, we usedsix localities within the 1500- to 2200-m elevational belt.Three of these localities had long-term lists and three hadrapid surveys. Assuming that long-term assessment siteshad complete species inventories, we tested the hypoth-esis that beta diversity was different between long-term
assessment sites and rapidly assessed sites with a bino-mial comparison of proportions (Zar 1999). For this testwe constructed a 2 × 2 contingency table, with values ofalpha and beta diversity in rows and rapid and long-termsites in columns. We tested forest and nonforest speciesseparately. The hypothesis was that beta diversity of long-term sites is the “true” beta diversity. Beta diversity valueswere derived from different sets of sites, so they are inde-pendent.
Forest fragmentation may increase beta diversity in aregion if there is differential local extinction of speciesamong sites. To test for this effect, we compared beta di-versity between continuous-forest sites and fragmentedsites (irrespective of elevation or drainage) with a bino-mial comparison of proportions (Zar 1999), under the hy-pothesis that continuous-forest sites represent the “true”beta diversity.
To further test for the effectiveness of rapid versus long-term inventories, we used one locality that was surveyed
Conservation Biology
Volume 20, No. 4, August 2006
Kattan et al. Beta Diversity of Andean Birds 1207
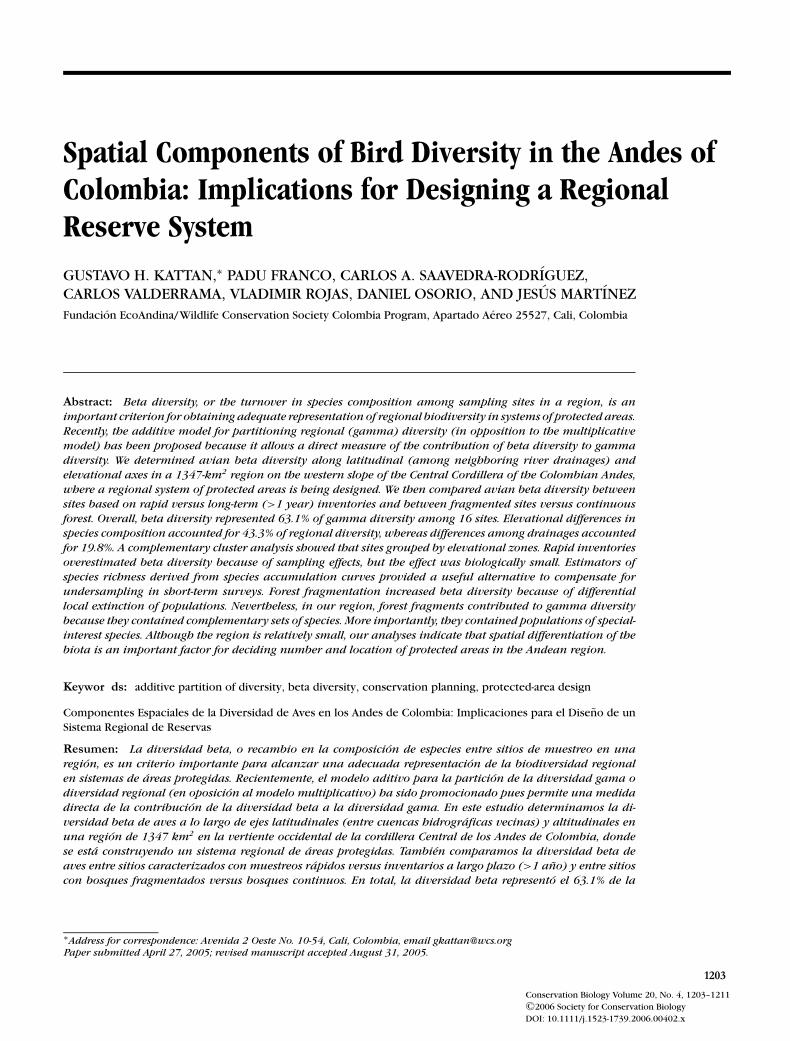
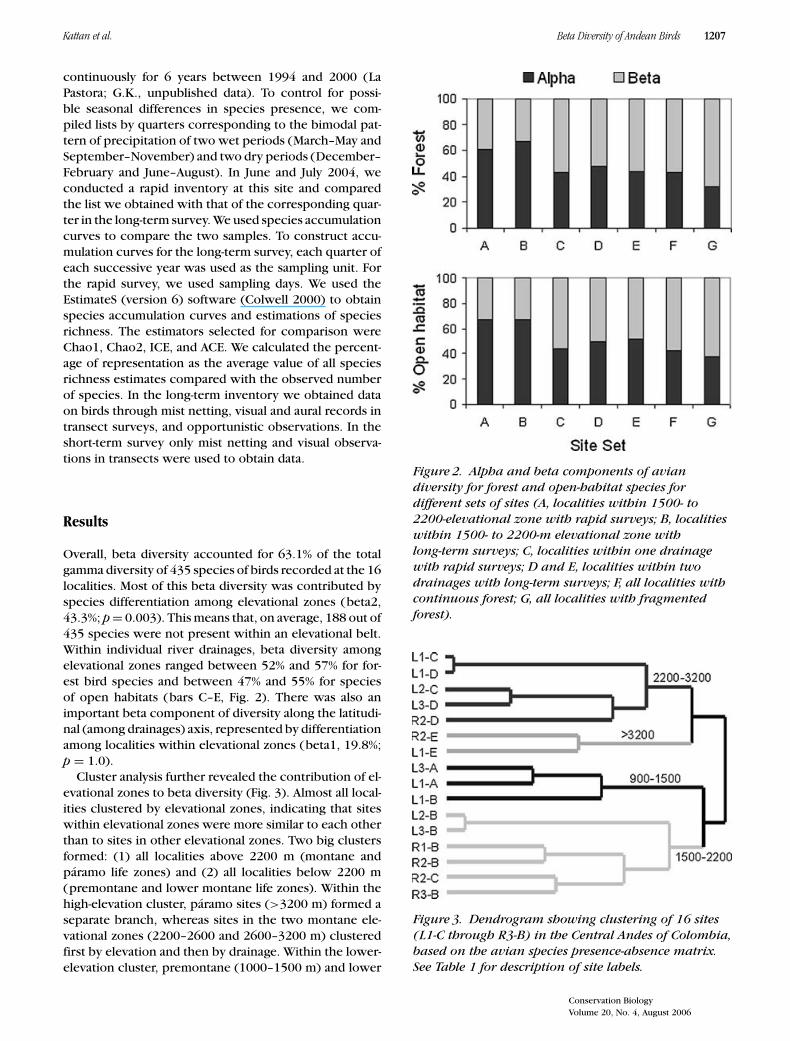
continuously for 6 years between 1994 and 2000 (LaPastora; G.K., unpublished data). To control for possi-ble seasonal differences in species presence, we com-piled lists by quarters corresponding to the bimodal pat-tern of precipitation of two wet periods (March–May andSeptember–November) and two dry periods (December–February and June–August). In June and July 2004, weconducted a rapid inventory at this site and comparedthe list we obtained with that of the corresponding quar-ter in the long-term survey. We used species accumulationcurves to compare the two samples. To construct accu-mulation curves for the long-term survey, each quarter ofeach successive year was used as the sampling unit. Forthe rapid survey, we used sampling days. We used theEstimateS (version 6) software (Colwell 2000) to obtainspecies accumulation curves and estimations of speciesrichness. The estimators selected for comparison wereChao1, Chao2, ICE, and ACE. We calculated the percent-age of representation as the average value of all speciesrichness estimates compared with the observed numberof species. In the long-term inventory we obtained dataon birds through mist netting, visual and aural records intransect surveys, and opportunistic observations. In theshort-term survey only mist netting and visual observa-tions in transects were used to obtain data.
Results
Overall, beta diversity accounted for 63.1% of the totalgamma diversity of 435 species of birds recorded at the 16localities. Most of this beta diversity was contributed byspecies differentiation among elevational zones (beta2,43.3%; p = 0.003). This means that, on average, 188 out of435 species were not present within an elevational belt.Within individual river drainages, beta diversity amongelevational zones ranged between 52% and 57% for for-est bird species and between 47% and 55% for speciesof open habitats (bars C–E, Fig. 2). There was also animportant beta component of diversity along the latitudi-nal (among drainages) axis, represented by differentiationamong localities within elevational zones (beta1, 19.8%;p = 1.0).
Cluster analysis further revealed the contribution of el-evational zones to beta diversity (Fig. 3). Almost all local-ities clustered by elevational zones, indicating that siteswithin elevational zones were more similar to each otherthan to sites in other elevational zones. Two big clustersformed: (1) all localities above 2200 m (montane andparamo life zones) and (2) all localities below 2200 m(premontane and lower montane life zones). Within thehigh-elevation cluster, paramo sites (>3200 m) formed aseparate branch, whereas sites in the two montane ele-vational zones (2200–2600 and 2600–3200 m) clusteredfirst by elevation and then by drainage. Within the lower-elevation cluster, premontane (1000–1500 m) and lower
Figure 2. Alpha and beta components of aviandiversity for forest and open-habitat species fordifferent sets of sites (A, localities within 1500- to2200-elevational zone with rapid surveys; B, localitieswithin 1500- to 2200-m elevational zone withlong-term surveys; C, localities within one drainagewith rapid surveys; D and E, localities within twodrainages with long-term surveys; F, all localities withcontinuous forest; G, all localities with fragmentedforest).
Figure 3. Dendrogram showing clustering of 16 sites(L1-C through R3-B) in the Central Andes of Colombia,based on the avian species presence-absence matrix.See Table 1 for description of site labels.
Conservation Biology
Volume 20, No. 4, August 2006

1208 Beta Diversity of Andean Birds Kattan et al.
montane (1500–2200 m) life zones neatly separated intotwo branches. There were anomalies in these branches:two localities clustered at the “wrong” elevations. Bothcases represent fragmented sites that clustered with otherfragmented sites at adjacent elevations.
To assess the effect of rapid surveys versus long-term in-ventories on beta diversity, we compared six sites locatedin the same elevational belt but in different drainages (Fig.1). For the three localities with long-term inventories,beta diversity was 33.0% for forest species and 33.3% foropen-habitat species (bar B, Fig. 2), whereas the three lo-calities assessed with rapid surveys had beta diversities of39.2% for forest birds and 32.2% for birds from open habi-tats (bar A, Fig. 2). Assuming long-term surveys representthe “true” beta diversity, rapid surveys overestimated betadiversity for forest species (χ2 = 5.86, p < 0.05) but notfor species of open habitats (χ2 = 0.49, p >0.05).
To assess the effects of fragmentation on beta diversity,we compared all localities with fragmented forest (n = 8)to localities with continuous forest (n = 8). Beta diversitywas significantly higher in fragmented sites both for forestspecies (68.4% vs. 54.8%; χ2 = 88.7, p <0.05) and open-habitat species (62.3% vs. 57.6%; χ2 = 14.4, p <0.05)(bars F–G, Fig. 2).
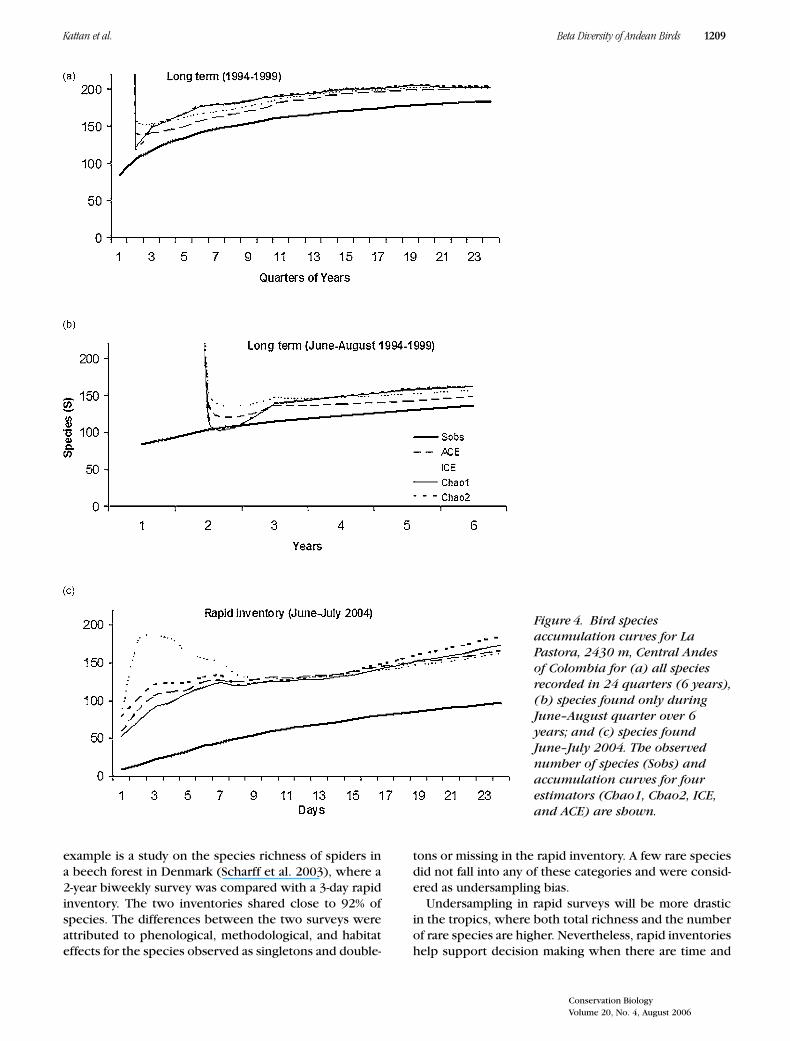
The long-term inventory at La Pastora produced a list of183 species. Estimated species richness was 201 and 203for the ACE and ICE estimators, respectively, with theobserved number of species representing 90.4% of theexpected value (Fig. 4). Adjusting for the June–Augustquarter, the observed number of species was 136. Esti-mated species richness for this quarter was 149 (ACE)to 162 (Chao2) species. Thus, the observed value repre-sented 86.5% of the estimated species richness for thistrimester. In the rapid assessment inventory, 97 specieswere recorded, representing 56.6% of the 166 (ACE) to184 (Chao2) species estimated from the species accumu-lation curve (Fig. 4).
Sixty species recorded in the long-term inventory forthe June–August trimester were not recorded in the rapidinventory. These species were grouped in five categories:(1) 9 species with cryptic habits that are difficult to ob-serve, (2) 34 ecologically rare species (i.e., low densitiesor restricted habitat) or elevational visitors, (3) 6 speciesthat are usually only revealed by their vocalizations, (4)1 species of poorly known habits, and (5) 10 commonlyrecorded species. In contrast, 6 species were observedin the rapid inventory but not in the long-term survey.One was a Neartic migrant, 3 were visitors from lowerelevation forest, and 2 were accidentals to the region.
Discussion
Although covering a small area, the region we studiedhad a high beta diversity of birds. Most of this diver-sity was due to differentiation along the elevational axis.
The cluster analysis also revealed differences in speciescomposition among elevational zones (Fig. 3). Speciesturnover among drainages, however, also was an impor-tant part of regional (γ) diversity. Although only a fewkilometers apart in a straight line, there were differencesin species composition among localities at the same el-evation but different drainages. This reflects patchy dis-tributions of some species. For example, the Red RuffedFruit-Crow (Pyroderus scutatus), although having a widegeographical distribution, is discontinuously distributedin the Colombian Andes, and some local populations havebeen extirpated (Kattan et al. 1994). In our region, thisspecies is found in only a few sites.
Species turnover along elevational gradients is a well-known phenomenon (Kattan & Franco 2004), and frag-mentation of these gradients causes local species extinc-tions (Kattan et al. 1994). On a short time scale, theseextinctions may occur because movement routes are dis-rupted. Although elevational migrations are not as welldocumented in the Andes as they are in other places (e.g.,Costa Rica; Chaves-Campos 2004), there is evidence ofregional movements occurring at many spatial scales (lo-cal to regional) in the Andes and in birds as varied ashummingbirds and parrots (G.K., unpublished data). Ona longer time scale, fragmentation of elevational gradientsalso disrupts the source-sink dynamics that partially gen-erate patterns of elevational diversity (Kattan & Franco2004).
Some of the beta diversity observed among localitiesinventoried in short-term surveys can be attributed to asampling effect because species lists are incomplete. Ourcomparison of a rapid survey versus a long-term inven-tory at the same site (La Pastora), revealed that the short-term survey undersampled species richness (97 speciesin the rapid survey vs. 138 species for the same quar-ter in the long-term survey). The observed number ofspecies in the rapid survey was 56.6% of the expectednumber, calculated from the species accumulation curve.This undersampling may be due to several factors. First,resident but rare species may be recorded only after along, continued sampling effort. Second, species that aremostly recorded by their vocalizations may be seasonallysilent. Third, a short-term survey misses seasonal changesin composition because of regional movements of speciesor changes in activity patterns. Finally, observer expe-rience is a critical factor in short-term surveys. On theother hand, the use of species accumulation curves pro-duced a reasonable estimation of the expected numberof species (166 species estimated by the rapid survey vs.149–162 for the corresponding quarter in the long-termsurvey). However, for conservation planning purposes,species composition, and in particular the presence ofspecial-interest species, is as important as species rich-ness.
Evaluations of the effectiveness of rapid inventories,in comparison with long-term surveys, are scarce. One
Conservation Biology
Volume 20, No. 4, August 2006
Kattan et al. Beta Diversity of Andean Birds 1209
Figure 4. Bird speciesaccumulation curves for LaPastora, 2430 m, Central Andesof Colombia for (a) all speciesrecorded in 24 quarters (6 years),(b) species found only duringJune–August quarter over 6years; and (c) species foundJune–July 2004. The observednumber of species (Sobs) andaccumulation curves for fourestimators (Chao1, Chao2, ICE,and ACE) are shown.
example is a study on the species richness of spiders ina beech forest in Denmark (Scharff et al. 2003), where a2-year biweekly survey was compared with a 3-day rapidinventory. The two inventories shared close to 92% ofspecies. The differences between the two surveys wereattributed to phenological, methodological, and habitateffects for the species observed as singletons and double-
tons or missing in the rapid inventory. A few rare speciesdid not fall into any of these categories and were consid-ered as undersampling bias.
Undersampling in rapid surveys will be more drasticin the tropics, where both total richness and the numberof rare species are higher. Nevertheless, rapid inventorieshelp support decision making when there are time and
Conservation Biology
Volume 20, No. 4, August 2006
1210 Beta Diversity of Andean Birds Kattan et al.
money constraints in a planning process. Overestimationof beta diversity by rapid surveys in this study, althoughstatistically significant, was small compared with beta di-versity observed among localities sampled in long-termstudies. Therefore, although rapid surveys underestimatealpha and gamma diversity, beta diversity (as percentageof gamma) is not influenced as much by rapid survey asit is by ecological factors. As alpha and gamma diversitiesincrease with greater sampling effort, there will be only asmall change in beta diversity. This characteristic makesthe additive model of diversity partitioning a valuable toolfor assessing regional heterogeneity.
It must be stressed, however, that there is no quicksubstitute for long-term and detailed field work. For exam-ple, several surveys conducted in the late 1980s and early1990s failed to find the Brown-banded Antpitta (Grallariamilleri), a species thought to be extinct in our study area.Only after several months of intense and continued effortin 1994 was the species rediscovered, even though it wasthe most abundant of five antpitta species at the site (Kat-tan & Beltran 1997, 1999).
Our results also indicated that fragmentation increasesbeta diversity by creating patchiness in species’ distribu-
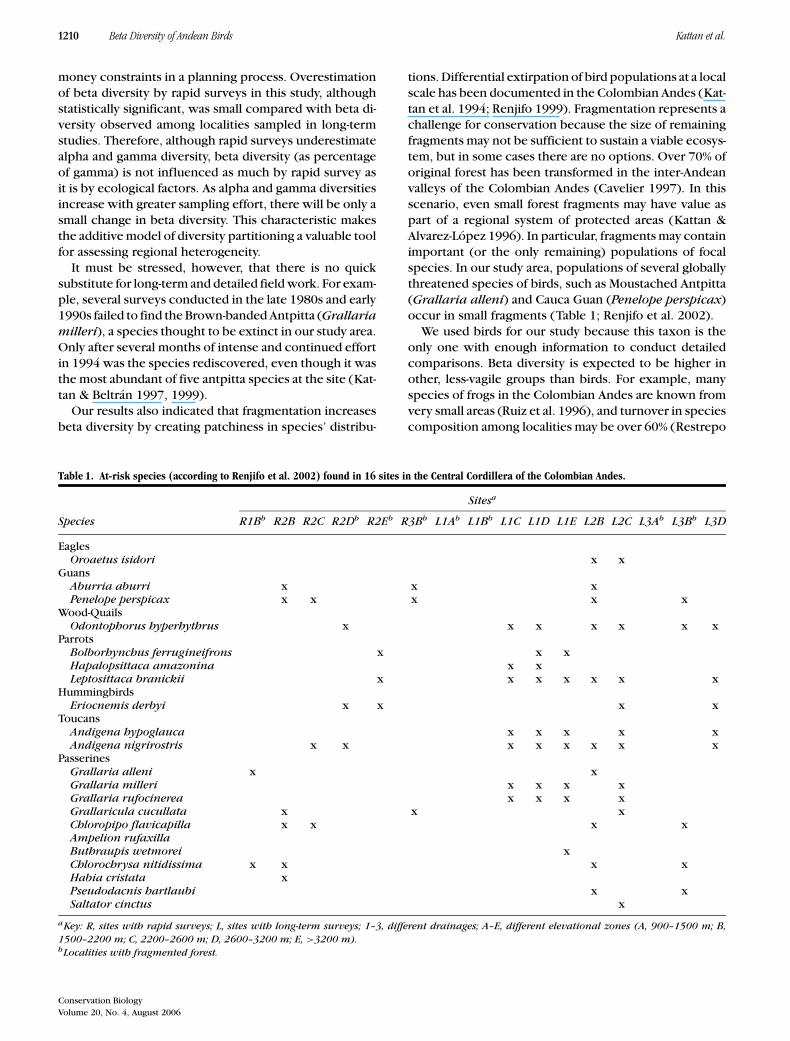
Table 1. At-risk species (according to Renjifo et al. 2002) found in 16 sites in the Central Cordillera of the Colombian Andes.
Sitesa
Species R1Bb R2B R2C R2Db R2Eb R3Bb L1Ab L1Bb L1C L1D L1E L2B L2C L3Ab L3Bb L3D
EaglesOroaetus isidori x x
GuansAburria aburri x x xPenelope perspicax x x x x x
Wood-QuailsOdontophorus hyperhythrus x x x x x x x
ParrotsBolborhynchus ferrugineifrons x x xHapalopsittaca amazonina x xLeptosittaca branickii x x x x x x x
HummingbirdsEriocnemis derbyi x x x x
ToucansAndigena hypoglauca x x x x xAndigena nigrirostris x x x x x x x x
PasserinesGrallaria alleni x xGrallaria milleri x x x xGrallaria rufocinerea x x x xGrallaricula cucullata x x xChloropipo flavicapilla x x x xAmpelion rufaxillaButhraupis wetmorei xChlorochrysa nitidissima x x x xHabia cristata xPseudodacnis hartlaubi x xSaltator cinctus x
aKey: R, sites with rapid surveys; L, sites with long-term surveys; 1–3, different drainages; A–E, different elevational zones (A, 900–1500 m; B,1500–2200 m; C, 2200–2600 m; D, 2600–3200 m; E, >3200 m).bLocalities with fragmented forest.
tions. Differential extirpation of bird populations at a localscale has been documented in the Colombian Andes (Kat-tan et al. 1994; Renjifo 1999). Fragmentation represents achallenge for conservation because the size of remainingfragments may not be sufficient to sustain a viable ecosys-tem, but in some cases there are no options. Over 70% oforiginal forest has been transformed in the inter-Andeanvalleys of the Colombian Andes (Cavelier 1997). In thisscenario, even small forest fragments may have value aspart of a regional system of protected areas (Kattan &Alvarez-Lopez 1996). In particular, fragments may containimportant (or the only remaining) populations of focalspecies. In our study area, populations of several globallythreatened species of birds, such as Moustached Antpitta(Grallaria alleni) and Cauca Guan (Penelope perspicax)occur in small fragments (Table 1; Renjifo et al. 2002).
We used birds for our study because this taxon is theonly one with enough information to conduct detailedcomparisons. Beta diversity is expected to be higher inother, less-vagile groups than birds. For example, manyspecies of frogs in the Colombian Andes are known fromvery small areas (Ruiz et al. 1996), and turnover in speciescomposition among localities may be over 60% (Restrepo
Conservation Biology
Volume 20, No. 4, August 2006
Kattan et al. Beta Diversity of Andean Birds 1211
& Alberico 1994; Kattan et al. 2004). Similar or higherturnover in species composition over short distances hasbeen reported for plants in the family Araceae (Croat1992).
Determining quantitative goals is one of the major chal-lenges in conservation planning. Beta diversity is an im-portant tool to support decisions on the number and loca-tion of protected areas (Gering et al. 2003; Groves 2003).Previous work shows that at the scale of the ColombianAndes, beta diversity among mountain ranges and evenbetween east- and west-facing slopes of the same rangeis an important component of total diversity (Kattan etal. 2004). Our analysis indicated this is also the case evenat very small spatial scales. Representing this diversityin a system of protected areas is a challenge because arelatively large number of reserves will be required. Inparticular, our results indicate that reserves should coverthe entire elevational gradient on Andean slopes. On theother hand, in Andean ecosystems even small reserveswill be valuable, especially if they are integrated in a re-gional system.
Acknowledgments
This study was funded by grants from the John D. andCatherine T. MacArthur Foundation and the Whitley Fundfor Nature. We thank Corporacion Autonoma Regional deRisaralda (CARDER) and Carton Colombia, especially E.Londono, J. Berrıo, and G. J. Lopera, for research permitsand for logistical support. J. Gering provided recent litera-ture. We also thank T. Crist and J. Veech for comments onthe manuscript and for assistance in using PARTITION.
Literature Cited
Cavelier, J. 1997. Selvas y bosques montanos. Pages 38–55 in M. E.
Chaves and N. Arango, editors. Informe nacional sobre el estado
de la biodiversidad, tomo I. Instituto de Investigacion de Recursos
Biologicos A. von Humboldt, Bogota (in Spanish).
Chaves-Campos, J. 2004. Elevational movements of large frugivorous
birds and temporal variation in abundance of fruits along an eleva-
tional gradient. Ornitologia Neotropical 15: 433–445.
Colwell, R. K. 2000. Estimate S: statistical estimation of species richness
and shared species from samples. Version 6b1. Ecology and Evo-
lutionary Biology, University of Connecticut, Storrs. Available from
http://viceroy.eeb.uconn.edu/estimates (accessed February 2005).
Crist, T. O., J. A. Veech, J. C. Gering, and K. S. Summerville. 2003. Parti-
tioning species diversity across landscapes and regions: a hierarchi-
cal analysis of α, β, and γ diversity. The American Naturalist 162:734–743.
Croat, T. B. 1992. Species diversity of Araceae in Colombia: a preliminary
survey. Annals of the Missouri Botanical Garden 79: 17–28.
DeVries, P. J., T. R. Walla, and H. F. Green. 1999. Species diversity in
spatial and temporal dimensions of fruit-feeding butterflies from
two Ecuadorian rainforests. Biological Journal of the Linnean Society
68: 333–353.
Gering, J., T. O. Crist, and J. A. Veech. 2003. Additive partitioning of
species diversity across multiple spatial scales: implications for re-
gional conservation of biodiversity. Conservation Biology 17: 488–
499.
Groves, C. R. 2003. Drafting a conservation blueprint. A practitioner’s
guide to planning for biodiversity. Island Press, Washington, D.C.
Kattan, G. H. 2005. Planificando el eden: principios fundamentales para
el diseno de sistemas regionales de areas protegidas. Pages 53–80
in N. Arango, editor. Bases para el diseno de sistemas regionales de
areas protegidas. Instituto de Investigacion de Recursos Biologicos
A. von Humboldt, Bogota (in Spanish).
Kattan, G. H., and H. Alvarez-Lopez. 1996. Preservation and management
of biodiversity in fragmented landscapes in the Colombian Andes.
Pages 3–18 in J. Schelhas and R. Greenberg, editors. Forest patches
in tropical landscapes. Island Press, Washington, D.C.
Kattan, G. H., H. Alvarez-Lopez, and M. Giraldo. 1994. Forest fragmen-
tation and bird extinctions: San Antonio eighty years later. Conser-
vation Biology 8:138–146.
Kattan, G. H., and J. W. Beltran. 1997. Rediscovery and status of the
brown-banded antpitta Grallaria milleri in the central Andes of
Colombia. Bird Conservation International 7:367–371.
Kattan, G. H., and J. W. Beltran. 1999. Altitudinal distribution, habitat
use and abundance of Grallaria antpittas in the Central Andes of
Colombia. Bird Conservation International 9:271–281.
Kattan, G. H., and P. Franco. 2004. Bird diversity along elevational gradi-
ents in the Andes of Colombia: area and mass effects. Global Ecology
& Biogeography 13: 451–458.
Kattan, G. H., P. Franco, V. Rojas, and G. Morales. 2004. Biological diver-
sification in a complex region: a spatial analysis of faunistic diversity
and biogeography of the Andes of Colombia. Journal of Biogeogra-
phy 31: 1829–1839.
Lande, R. 1996. Statistics and partitioning of species diversity, and sim-
ilarity among multiple communities. Oikos 76: 5–13.
Loreau, M. 2000. Are communities saturated? On the relationship be-
tween α, β and γ diversity. Ecology Letters 3:73–76.
Renjifo, L. M. 1999. Composition changes in a sub-Andean avifauna af-
ter long-term forest fragmentation. Conservation Biology 13: 1124–
1139.
Renjifo, L. M., A. M. Franco, J. D. Amaya, G. H. Kattan, and B. Lopez,
editors. 2002. Libro rojo de aves de Colombia. Instituto de Investi-
gacion de Recursos Biologicos Alexander von Humboldt, Bogota (in
Spanish).
Restrepo, J. H., and M. Alberico. 1994. Primer aporte sobre la herpeto-
fauna del Parque Regional Natural Ucumarı. Pages 293–302 in J. O.
Rangel, editor. Ucumarı: un caso tıpico de la diversidad biotica and-
ina. Corporacion Autonoma Regional de Risaralda, Pereira, Colombia
(in Spanish).
Ruiz, P., M. C. Ardila, and J. D. Lynch. 1996. Lista actualizada de la fauna
de Amphibia de Colombia. Revista de la Academia Colombiana de
Ciencias 20: 365–415.
Scharff, N., J. A. Coddington, C. E. Grilwold, G. Hormiga, and P. Bjørn.
2003. When to quit?: estimating spider species richness in a northern
European deciduous forest. Journal of Arachnology 31: 246–273.
Schluter, D., and R. E. Ricklefs. 1993. Species diversity. An introduc-
tion to the problem. Pages 1–10 in R. E. Ricklefs and D. Schluter,
editors. Species diversity in ecological communities: historical and
geographical perspectives. University of Chicago Press, Chicago.
Veech, J. A., K. S. Summerville, T. O. Crist, and J. Gering. 2002. The
additive partitioning of species diversity: recent revival of an old
idea. Oikos 99: 3–9.
Whittaker, R. H. 1975. Communities and ecosystems. 2nd edition.
MacMillan, New York.
Zar, J. H. 1999. Biostatistical analysis. 4th edition. Prentice-Hall, Upper
Saddle River, New Jersey.
Conservation Biology
Volume 20, No. 4, August 2006