Spatial and temporal dynamics of nematode populations under Zygophyllum dumosum in arid environments
16
Original article Spatial and temporal dynamics of nematode populations under Zygophyllum dumosum in arid environments Stanislav Pen-Mouratov a , Mirza Rakhimbaev b , Ginetta Barness a ,Yosef Steinberger a, * a Faculty of Life Sciences, Bar-Ilan University, Ramat-Gan 52900, Israel b Institute of Botany, Tashkent, Uzbekistan Received 25 August 2003; accepted 12 January 2004 Abstract Soil nematode activity in arid ecosystems is determined by well-known limiting factors such as soil moisture and organic matter. The main aim of our investigation was to determine the composition and distribution of the nematode community in response to soil water and organic content in the rhizosphere of the perennial plant Zygophyllum dumosum. The results demonstrated that soil moisture, organic matter, total nematode population and trophic groups differed under the plants and in the control samples. Significant differences in soil moisture, total nematode population and trophic groups were observed. Bacterial-feeders were found to be the dominant nematode trophic group at the research sites. Bacterial- and fungi-feeders were present in the upper 0–10 cm layer during most of the year. A negative correlation was found between nematodes and soil moisture and a positive correlation was found between nematodes and organic matter. Moreover, trophic structure changes and quantity changes in the nematode community were observed within 1 month after quantitative changes occurred in the organic matter. Generally accepted nematode fauna indices such as Wasilewska index (WI), F/B, T, H′, k, species richness (SR), PPI, maturity index (MI), and modified maturity index (MMI), reflect the temporal changes that occurred in the nematode community during the research period. This study illustrates the integrated effect of soil moisture and organic matter on the activity and structure of the nematode communities existing under plants. © 2004 Elsevier SAS. All rights reserved. Keywords: Free-living nematodes; Trophic groups; Halophytes; Ecological indices; Desert ecosystem 1. Introduction Free-living soil nematode communities represent the most abundant multicellular animal group on earth and are known to be an important component of the soil biota [5,29]. The abundance of nematodes in soil generally reaches sev- eral million individuals per square meter. Nematodes have a remarkable ability to resist environmental stress [23]. Certain community parameters such as density, biomass, and species diversity, therefore, tend to change locally on a temporal and spatial scale along with changes in vegetation type. Because they intervene to a great extent in trophic chains in ecosys- tems, nematodes contribute substantially to soil formation and to the maintenance of soil fertility. The distribution and density of the nematode community has been found to corre- late with plant distribution in different terrestrial ecosystems, including arid ecosystems [33]. Soil temperature, soil mois- ture [41], and organic matter content [38] have been found to be important factors directly or indirectly affecting seasonal population dynamics in the soil by altering the metabolic activity and quality of the food source. An additional impor- tant feature is the nematodes’ daily and seasonal vertical migration, which has been found to be controlled mainly by * Corresponding author. Tel.: +972-3-531-8571; fax: +972-3-535-1824. E-mail address: [email protected] (Y. Steinberger). European Journal of Soil Biology 40 (2004) 31–46 www.elsevier.com/locate/ejsobi © 2004 Elsevier SAS. All rights reserved. doi:10.1016/j.ejsobi.2004.01.002
-
Upload
independent -
Category
Documents
-
view
2 -
download
0
Transcript of Spatial and temporal dynamics of nematode populations under Zygophyllum dumosum in arid environments

Original article
Spatial and temporal dynamics of nematode populations underZygophyllum dumosum in arid environments
Stanislav Pen-Mouratov a, Mirza Rakhimbaev b,Ginetta Barness a, Yosef Steinberger a,*
a Faculty of Life Sciences, Bar-Ilan University, Ramat-Gan 52900, Israelb Institute of Botany, Tashkent, Uzbekistan
Received 25 August 2003; accepted 12 January 2004
Abstract
Soil nematode activity in arid ecosystems is determined by well-known limiting factors such as soil moisture and organicmatter. The main aim of our investigation was to determine the composition and distribution of the nematode community inresponse to soil water and organic content in the rhizosphere of the perennial plant Zygophyllum dumosum. The resultsdemonstrated that soil moisture, organic matter, total nematode population and trophic groups differed under the plants and in thecontrol samples. Significant differences in soil moisture, total nematode population and trophic groups were observed.Bacterial-feeders were found to be the dominant nematode trophic group at the research sites. Bacterial- and fungi-feeders werepresent in the upper 0–10 cm layer during most of the year. A negative correlation was found between nematodes and soilmoisture and a positive correlation was found between nematodes and organic matter. Moreover, trophic structure changes andquantity changes in the nematode community were observed within 1 month after quantitative changes occurred in the organicmatter. Generally accepted nematode fauna indices such as Wasilewska index (WI), F/B, T, H′, k, species richness (SR), PPI,maturity index (MI), and modified maturity index (MMI), reflect the temporal changes that occurred in the nematode communityduring the research period. This study illustrates the integrated effect of soil moisture and organic matter on the activity andstructure of the nematode communities existing under plants.© 2004 Elsevier SAS. All rights reserved.
Keywords: Free-living nematodes; Trophic groups; Halophytes; Ecological indices; Desert ecosystem
1. Introduction
Free-living soil nematode communities represent themost abundant multicellular animal group on earth and areknown to be an important component of the soil biota [5,29].The abundance of nematodes in soil generally reaches sev-eral million individuals per square meter. Nematodes have aremarkable ability to resist environmental stress [23]. Certaincommunity parameters such as density, biomass, and speciesdiversity, therefore, tend to change locally on a temporal and
spatial scale along with changes in vegetation type. Becausethey intervene to a great extent in trophic chains in ecosys-tems, nematodes contribute substantially to soil formationand to the maintenance of soil fertility. The distribution anddensity of the nematode community has been found to corre-late with plant distribution in different terrestrial ecosystems,including arid ecosystems [33]. Soil temperature, soil mois-ture [41], and organic matter content [38] have been found tobe important factors directly or indirectly affecting seasonalpopulation dynamics in the soil by altering the metabolicactivity and quality of the food source. An additional impor-tant feature is the nematodes’ daily and seasonal verticalmigration, which has been found to be controlled mainly by
* Corresponding author. Tel.: +972-3-531-8571;fax: +972-3-535-1824.
E-mail address: [email protected] (Y. Steinberger).
European Journal of Soil Biology 40 (2004) 31–46
www.elsevier.com/locate/ejsobi
© 2004 Elsevier SAS. All rights reserved.doi:10.1016/j.ejsobi.2004.01.002
physical–chemical soil factors such as moisture content,temperature, and texture [1,33,41]. Moreover, the major partof the nematode community can be found in the upper,densely rooted 0–10 cm soil layer [45]. However, somespecies, which are sensitive to dehydration, are often foundin the deeper soil layers [11].
Since the soil nematode population responds to changesin environmental factors, it can be a useful indicator of soilconditions [45]. According to Bongers and Ferris [6], thedevelopment of nematode indices that integrate the re-sponses of different taxa and trophic groups to perturbationprovides a powerful basis for analysis of faunal assemblagesin soil as in situ environmental assessment systems. Ecologi-cal indices of nematode community structure such as rich-ness [44] genus dominance [28], as well as trophic diversity[16] and the Shannon–Weaver [27] indices are useful for thedetection of changes occurring in the habitat. One of thepotential parameters for measuring the impact of distur-bances and monitoring changes in the structure and functionof the below-ground ecosystem is the nematode maturityindex (MI); an index based on the proportion of colonizers(r-strategists s.l.) and persisters (K-strategists s.l.) in the soilsamples [4,42].
The objective of this study was to evaluate the response ofnematode community ecological indices to spatial and tem-poral abiotic perturbations in the Zygophyllum dumosumplant rhizosphere in an arid ecosystem.
2. Materials and methods
2.1. Study site
The fieldwork in this study was conducted at the AvdatResearch Farm in the Negev highland (30°47′N; 34°46′E).This area has a temperate desert climate, i.e. mild, rainywinters (5–14 °C in January) and hot, dry summers (18–32 °C in June). Radiation may reach 3.14 × 10⁴ kJ m–2 d–1.The average annual rainfall is 90 mm. However, rainfallfluctuates between 20 and 180 mm. An additional source ofmoisture comes from approximately 35 mm of dew, whichfalls each night but most heavily during late summer andautumn. The perennial vegetation is dominated by the desertshrub association, in which the most common species isZ. dumosum [25,33]. The soil is a deep, fine-textured loessialsierozem [9].
2.2. Sampling
A total of 352 soil samples from two layers (0–10 and10–20 cm) and two sites [under Z. dumosum and between theshrubs (control)], were collected between November 1999and November 2001. Soil samples were collected in indi-vidual plastic bags, which were placed in an insulated con-tainer and taken to the laboratory. These soil samples were
kept in cold storage at 4 °C until processed. They were sieved(2-mm mesh size) before biological and chemical analysis inorder to remove root particles and other organic debris.
2.3. Laboratory analysis
A minimum of 5 g soil from each sample at each depthwas used for soil moisture and organic matter determination.The weighed soil samples were dried at 105 °C for gravi-metrical determination of soil water content, followed byorganic matter determination by oxidization with dichromatein the presence of H2SO4, without application of externalheat [24].
The nematodes were extracted from 100 g soil samplesusing the Baermann funnel procedure [8]. The recoveredorganisms were counted, preserved in formalin [35], andidentified according to order, family and genus (if possible),using a compound microscope.
2.4. Ecological indices and statistical analysis
The characteristics of the nematode communities weredescribed using the following indices: (1) absolute abun-dance of individuals 100 g–1 dry soil; (2) abundance ofomnivores-predators (OP), plant-parasitic (PP), fungal-feeding (FF) and bacterial-feeding (BF) nematodes (trophicstructure) [20,33,35]; (3) Wasilewska index (WI), WI = (FF +BF)/PP [37]; (4) fungivore/bacterivore ratio (F/B),F/B = FF/BF [36]; (5) trophic diversity (T), T = 1/� Pi
2,where Pi is the proportion of the i-th trophic group [16]; (6)genus dominance (k), k = � Pi
2 [28]; (7) Shannon index (H′),H′ = –� Pi(ln Pi), where P is the proportion of individuals inthe i-th taxon [27]; (8) maturity index (MI), MI = � tiqi,where ti, is the c-p value assigned by Bongers [4] of the i-thgenus in the nematode and qi, the proportion of the genus inthe nematode community. The c-p values describe the nema-tode life strategies, and range from 1 (colonizers, tolerant todisturbance) to 5 (persisters, sensitive to disturbance); (9)modified maturity index (MMI), including plant-feedingnematodes [42]; (10) evenness (J′), J′ = H′/ln(S), where S isthe number of taxa; and (11) species richness, SR = (S –1)/ln(N), where S is the number of taxa and N is the numberof individuals identified [44].
All data were subjected to statistical analysis of varianceusing the SAS model (ANOVA, Duncan’s multiple range testand Pearson correlation coefficient) and were used to evalu-ate differences between separate means. Differences ob-tained at levels of P < 0.05 were considered significant.
3. Results
3.1. Soil moisture and organic matter
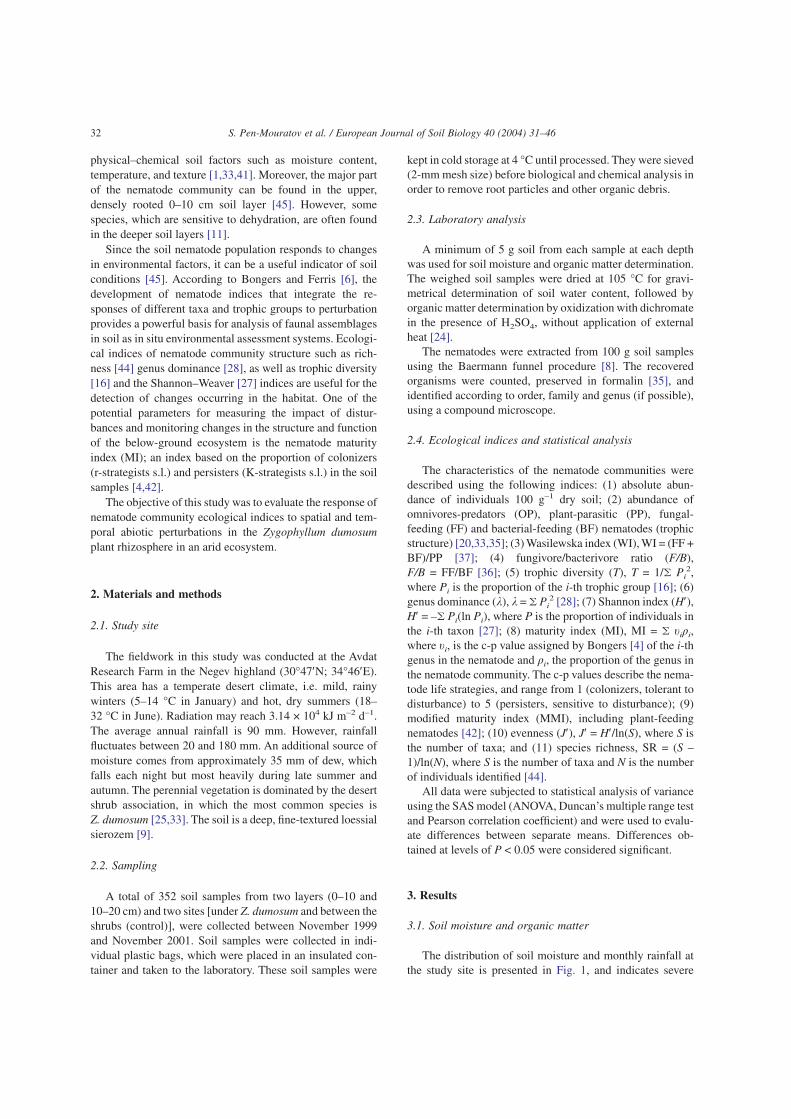
The distribution of soil moisture and monthly rainfall atthe study site is presented in Fig. 1, and indicates severe
32 S. Pen-Mouratov et al. / European Journal of Soil Biology 40 (2004) 31–46

Z. dumosum 0 - 10 cm B
0
3
6
9
12
So
il m
ois
ture
(%
)
0
2
4
6
8
10
Org
an
ic m
att
er
(%)
Z. dumosum 10 - 20 cm C
0
3
6
9
12
So
il m
ois
ture
(%
)
0
2
4
6
8
10
Org
an
ic m
att
er
(%)
Control 0 - 10 cm D
0
3
6
9
12
So
il m
ois
ture
(%
)
0
2
4
6
8
10O
rgan
ic m
att
er
(%)
Control 10 - 20 cm E
0
3
6
9
12
Nov.99 Feb.00 May.00 Aug.00 Nov.00 Feb.01 May.01 Aug.01 Nov.01
Time (months)
So
il m
ois
ture
(%
)
0
2
4
6
8
10
Org
an
ic m
att
er
(%)
A
19.5
0.2
6.2
24.1
0.75
7.7
26.45
7.7
3.1 3.1
0
5
10
15
20
25
30
Nov.
99
Dec
.99
Jan.0
0
Feb.0
0
Mar
.00
Apr.
00
May
.00
Jun.0
0
Jul.0
0
Aug.0
0
Sep
.00
Oct
.00
Nov.
00
Dec
.00
Jan.0
1
Feb.0
1
Mar
.01
Apr.
01
May
.01
Jun.0
1
Jul.0
1
Aug.0
1
Sep
.01
Oct
.01
Nov.
01
Rain
fall (
mm
)
Fig. 1. Rainfall distribution (A), changes in percentage of soil moisture (h) and organic matter (◆ ) at 0–10 and 10–20 cm soil layers beneathZ. dumosum shrubs and control sites during the study period.
33S. Pen-Mouratov et al. / European Journal of Soil Biology 40 (2004) 31–46
periods of drought before the rainy season (winter 1999–2000), between May 2000 and October 2000, and after therainy season—between March 2001and November 2001.The total amount of rainfall at the study site was 26.9 mmduring the winter of 1999–2000 and 72.9 mm during thesecond year, between October 2000 and April 2001. Theseamounts accounted for 29.8% and 81.0% of the multi-annualaverage for the first and second winter, respectively. Duringthe first year, the main shower events were concentrated inJanuary with 20.5 mm, and in March, with one 6.2 mmshower. Six showers occurred during the second rainy sea-son, with the highest amount obtained in October with24.1 mm, the second in January with 26.5 mm. Two events of7.7 mm and two of 3.1 mm occurred between the big eventsand after the rainy season, in April 2001.
Soil moisture at the two sampling locations and the twodepths was found to be low and constant (1.3–2.6% under theshrubs and 1.0–2.5% between the shrubs), except during therainy season.
Significant differences in soil moisture content were ob-served between the two sampling sites (P < 0.05; n = 268),depths (P < 0.05; n = 268) and years (P < 0.05; n = 268)(Fig. 1B–E). Soil moisture content during the study periodreached a maximum of 7.6% in the upper (0–10 cm) layerand 10.3 mm in the 10–20 cm layer under the shrubs. In theopen spaces between the shrubs, the mean maximum soilmoisture measured was 7.9% and 7.3% in the upper andlower layers, respectively. Soil moisture was found to behigher (P < 0.05; n = 352) on a yearly basis in the lower10–20 cm layer at both sampling sites under and between theshrubs than in the upper (0–10 cm) layer. A relatively highermoisture level was maintained for a longer period of timewith mean yearly values of 3.3% and 2.7%, respectively.
Soil organic matter content was found to be significantlydifferent (P < 0.05; n = 268) between 2 years and the twosampling sites. However, no significant differences werefound between the two soil layers (Fig. 1B–E). Higher or-ganic matter levels were obtained in October 2000 towardsthe end of autumn, reaching a mean value of 8.5% in theupper layer under the shrubs. The organic matter content wasfound to be approximately 70–90% higher in autumn thanduring the other three seasons.
During the second year the percentage of organic matterunder and between shrubs as well as in both layers was foundto be 1% and lower, although the total amount of rainfall wassignificantly higher than during the first year.
3.2. Nematode communities
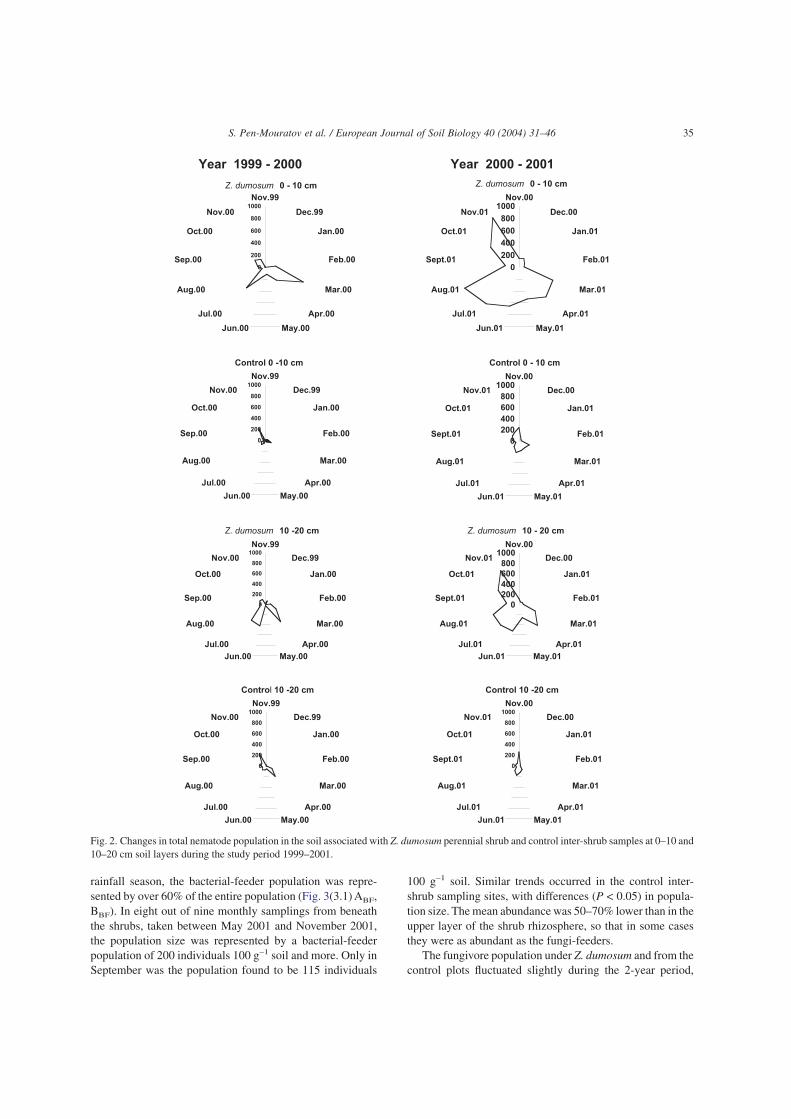
The total number of soil free-living nematodes during thestudy period ranged from 2 to 952 individuals 100 g–1 drysoil (Fig. 2). Significant differences (P < 0.01) were foundbetween the years, locations (P < 0.01), and depths(P < 0.01). Seasonality was an additional variable that exhib-ited (P < 0.05) differences, with spring and summer valuesbeing significantly higher (P < 0.01; f = 10.8; n = 336) thanthe autumn and winter values.
The difference in the total number of nematodes duringthe study period, as presented in Fig. 2, elucidates this differ-ence on a temporal as well as on a spatial scale. The totalnumber of nematodes exhibited different maximum andminimum frequencies during the investigation period. Dur-ing the period between November 1999 and November 2000,the mean total number of nematodes was maximal under theplants in the upper soil layer in March (671 individuals100 g–1 soil) and in the lower layer in April (440 individuals100 g–1 soil). The total number of nematodes reached aminimum density in January and February (2.0 and 79.4 indi-viduals 100 g–1 soil, respectively) in both soil layers. Duringthe second year (from November 2000 to November 2001),the total number of nematodes reached a mean maximum inautumn (August, 952 individuals 100 g–1 soil and November,920 individuals 100 g–1 soil) under the plants in the uppersoil layers. During the same period, the total number ofindividuals decreased to minimal values in February in bothsoil layers under the plants (79 and 81 individuals 100 g–1
soil, respectively).The change in the total nematode population in the con-
trol plot (between the shrub canopies) (Fig. 2) oscillated from3 to 239 during the first year (November 1999–November2000). The nematode population varied from 2 to 264 indi-viduals 100 g–1 soil in the 0–10 cm and in the 10–20 cmlayers, respectively. During the second year (November2000–November 2001), the mean minimum nematode popu-lation in the upper layer was approximately 20-fold higherthan during the previous year in both layers, with a maximumof 210 and 176 individuals 100 g–1 soil in the upper (0–10 cm) and the lower (10–20 cm) layers, respectively.
3.3. Nematode trophic groups
A total of 33 genera were found, including 11 bacteri-vores, four fungivores, 10 plant-parasites and eight OP(Table 1). The BF, FF, plant-parasite and OP trophic groupsexhibited significant temporal as well as spatial fluctuationsthroughout the study period (Fig. 3).
BF groups were found to be the most abundant trophicgroup under the shrubs in both layers throughout the studyperiod (Fig. 3 ABF, BBF), reaching a mean density of 41.9%of the total nematode population (Table 1). Changes in rela-tive abundance were observed on a temporal and spatialbasis. During May 2000 and June 2001the total bacterial-feeders in the upper (0–10 cm) soil layers at both samplingsites reached a maximum level of 432 and 471 individuals100 g–1 soil, respectively, under the shrubs. Two hundred andeighty-one and 466 individuals 100 g–1 soil, respectively,were observed at the control site. The nematode populationdensity was lower (P < 0.05) in the deeper (10–20 cm) layersat both sampling sites, reaching maximal levels of 86 indi-viduals 100 g–1 soil throughout the study period.
The differences in the total amount of rainfall and itsdistribution between the two years had a strong effect on theBF population. During the second year, at the end of the
34 S. Pen-Mouratov et al. / European Journal of Soil Biology 40 (2004) 31–46
rainfall season, the bacterial-feeder population was repre-sented by over 60% of the entire population (Fig. 3(3.1) ABF,BBF). In eight out of nine monthly samplings from beneaththe shrubs, taken between May 2001 and November 2001,the population size was represented by a bacterial-feederpopulation of 200 individuals 100 g–1 soil and more. Only inSeptember was the population found to be 115 individuals
100 g–1 soil. Similar trends occurred in the control inter-shrub sampling sites, with differences (P < 0.05) in popula-tion size. The mean abundance was 50–70% lower than in theupper layer of the shrub rhizosphere, so that in some casesthey were as abundant as the fungi-feeders.
The fungivore population under Z. dumosum and from thecontrol plots fluctuated slightly during the 2-year period,
Year 1999 - 2000 Year 2000 - 2001
Z. dumosum 0 - 10 cm
0
200
400
600
800
1000
Nov.99
Dec.99
Jan.00
Feb.00
Mar.00
Apr.00
May.00Jun.00
Jul.00
Aug.00
Sep.00
Oct.00
Nov.00
Control 0 -10 cm
0
200
400
600
800
1000
Nov.99
Dec.99
Jan.00
Feb.00
Mar.00
Apr.00
May.00Jun.00
Jul.00
Aug.00
Sep.00
Oct.00
Nov.00
Z. dumosum 10 -20 cm
0
200
400
600
800
1000
Nov.99
Dec.99
Jan.00
Feb.00
Mar.00
Apr.00
May.00Jun.00
Jul.00
Aug.00
Sep.00
Oct.00
Nov.00
Z. dumosum 0 - 10 cm
0
200
400
600
800
1000Nov.00
Dec.00
Jan.01
Feb.01
Mar.01
Apr.01
May.01Jun.01
Jul.01
Aug.01
Sept.01
Oct.01
Nov.01
Control 0 - 10 cm
0
200
400
600
800
1000Nov.00
Dec.00
Jan.01
Feb.01
Mar.01
Apr.01
May.01Jun.01
Jul.01
Aug.01
Sept.01
Oct.01
Nov.01
Z. dumosum 10 - 20 cm
0
200
400
600
800
1000Nov.00
Dec.00
Jan.01
Feb.01
Mar.01
Apr.01
May.01Jun.01
Jul.01
Aug.01
Sept.01
Oct.01
Nov.01
Control 10 -20 cm
0
200
400
600
800
1000
Nov.99
Dec.99
Jan.00
Feb.00
Mar.00
Apr.00
May.00Jun.00
Jul.00
Aug.00
Sep.00
Oct.00
Nov.00
Control 10 -20 cm
0
200
400
600
800
1000
Nov.00
Dec.00
Jan.01
Feb.01
Mar.01
Apr.01
May.01Jun.01
Jul.01
Aug.01
Sept.01
Oct.01
Nov.01
Fig. 2. Changes in total nematode population in the soil associated with Z. dumosum perennial shrub and control inter-shrub samples at 0–10 and10–20 cm soil layers during the study period 1999–2001.
35S. Pen-Mouratov et al. / European Journal of Soil Biology 40 (2004) 31–46
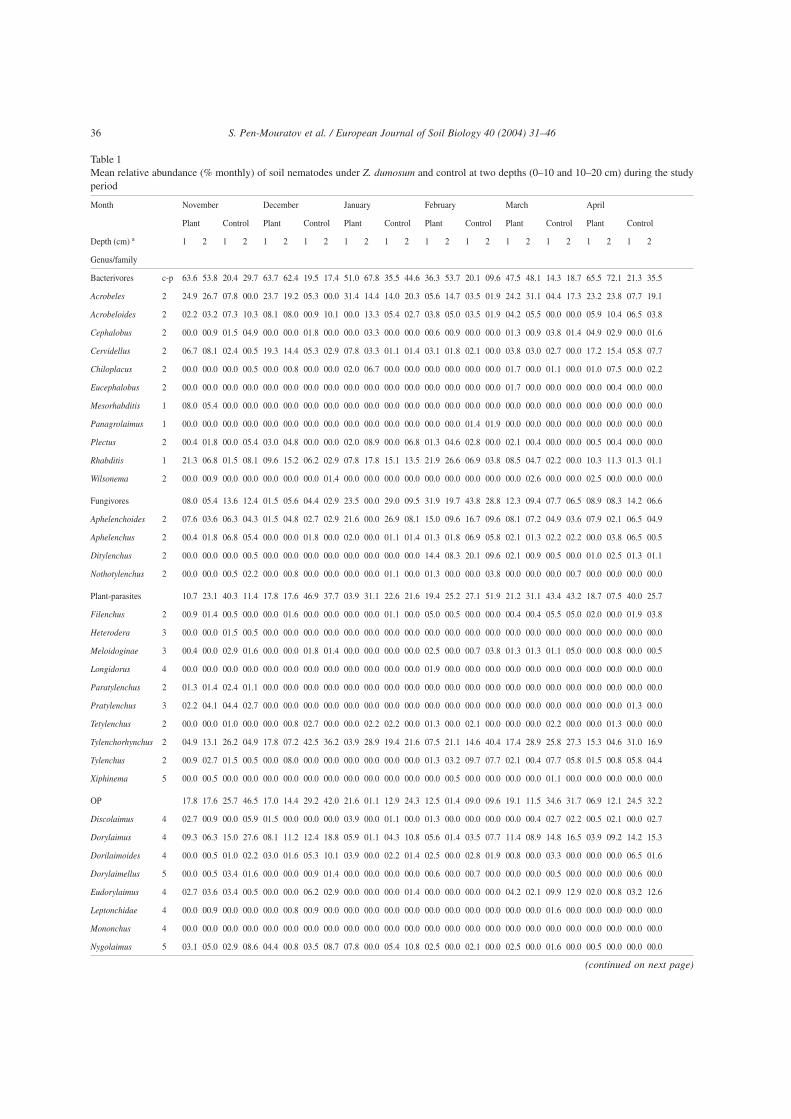
Table 1Mean relative abundance (% monthly) of soil nematodes under Z. dumosum and control at two depths (0–10 and 10–20 cm) during the studyperiod
Month November December January February March April
Plant Control Plant Control Plant Control Plant Control Plant Control Plant Control
Depth (cm) a 1 2 1 2 1 2 1 2 1 2 1 2 1 2 1 2 1 2 1 2 1 2 1 2
Genus/family
Bacterivores c-p 63.6 53.8 20.4 29.7 63.7 62.4 19.5 17.4 51.0 67.8 35.5 44.6 36.3 53.7 20.1 09.6 47.5 48.1 14.3 18.7 65.5 72.1 21.3 35.5
Acrobeles 2 24.9 26.7 07.8 00.0 23.7 19.2 05.3 00.0 31.4 14.4 14.0 20.3 05.6 14.7 03.5 01.9 24.2 31.1 04.4 17.3 23.2 23.8 07.7 19.1
Acrobeloides 2 02.2 03.2 07.3 10.3 08.1 08.0 00.9 10.1 00.0 13.3 05.4 02.7 03.8 05.0 03.5 01.9 04.2 05.5 00.0 00.0 05.9 10.4 06.5 03.8
Cephalobus 2 00.0 00.9 01.5 04.9 00.0 00.0 01.8 00.0 00.0 03.3 00.0 00.0 00.6 00.9 00.0 00.0 01.3 00.9 03.8 01.4 04.9 02.9 00.0 01.6
Cervidellus 2 06.7 08.1 02.4 00.5 19.3 14.4 05.3 02.9 07.8 03.3 01.1 01.4 03.1 01.8 02.1 00.0 03.8 03.0 02.7 00.0 17.2 15.4 05.8 07.7
Chiloplacus 2 00.0 00.0 00.0 00.5 00.0 00.8 00.0 00.0 02.0 06.7 00.0 00.0 00.0 00.0 00.0 00.0 01.7 00.0 01.1 00.0 01.0 07.5 00.0 02.2
Eucephalobus 2 00.0 00.0 00.0 00.0 00.0 00.0 00.0 00.0 00.0 00.0 00.0 00.0 00.0 00.0 00.0 00.0 01.7 00.0 00.0 00.0 00.0 00.4 00.0 00.0
Mesorhabditis 1 08.0 05.4 00.0 00.0 00.0 00.0 00.0 00.0 00.0 00.0 00.0 00.0 00.0 00.0 00.0 00.0 00.0 00.0 00.0 00.0 00.0 00.0 00.0 00.0
Panagrolaimus 1 00.0 00.0 00.0 00.0 00.0 00.0 00.0 00.0 00.0 00.0 00.0 00.0 00.0 00.0 01.4 01.9 00.0 00.0 00.0 00.0 00.0 00.0 00.0 00.0
Plectus 2 00.4 01.8 00.0 05.4 03.0 04.8 00.0 00.0 02.0 08.9 00.0 06.8 01.3 04.6 02.8 00.0 02.1 00.4 00.0 00.0 00.5 00.4 00.0 00.0
Rhabditis 1 21.3 06.8 01.5 08.1 09.6 15.2 06.2 02.9 07.8 17.8 15.1 13.5 21.9 26.6 06.9 03.8 08.5 04.7 02.2 00.0 10.3 11.3 01.3 01.1
Wilsonema 2 00.0 00.9 00.0 00.0 00.0 00.0 00.0 01.4 00.0 00.0 00.0 00.0 00.0 00.0 00.0 00.0 00.0 02.6 00.0 00.0 02.5 00.0 00.0 00.0
Fungivores 08.0 05.4 13.6 12.4 01.5 05.6 04.4 02.9 23.5 00.0 29.0 09.5 31.9 19.7 43.8 28.8 12.3 09.4 07.7 06.5 08.9 08.3 14.2 06.6
Aphelenchoides 2 07.6 03.6 06.3 04.3 01.5 04.8 02.7 02.9 21.6 00.0 26.9 08.1 15.0 09.6 16.7 09.6 08.1 07.2 04.9 03.6 07.9 02.1 06.5 04.9
Aphelenchus 2 00.4 01.8 06.8 05.4 00.0 00.0 01.8 00.0 02.0 00.0 01.1 01.4 01.3 01.8 06.9 05.8 02.1 01.3 02.2 02.2 00.0 03.8 06.5 00.5
Ditylenchus 2 00.0 00.0 00.0 00.5 00.0 00.0 00.0 00.0 00.0 00.0 00.0 00.0 14.4 08.3 20.1 09.6 02.1 00.9 00.5 00.0 01.0 02.5 01.3 01.1
Nothotylenchus 2 00.0 00.0 00.5 02.2 00.0 00.8 00.0 00.0 00.0 00.0 01.1 00.0 01.3 00.0 00.0 03.8 00.0 00.0 00.0 00.7 00.0 00.0 00.0 00.0
Plant-parasites 10.7 23.1 40.3 11.4 17.8 17.6 46.9 37.7 03.9 31.1 22.6 21.6 19.4 25.2 27.1 51.9 21.2 31.1 43.4 43.2 18.7 07.5 40.0 25.7
Filenchus 2 00.9 01.4 00.5 00.0 00.0 01.6 00.0 00.0 00.0 00.0 01.1 00.0 05.0 00.5 00.0 00.0 00.4 00.4 05.5 05.0 02.0 00.0 01.9 03.8
Heterodera 3 00.0 00.0 01.5 00.5 00.0 00.0 00.0 00.0 00.0 00.0 00.0 00.0 00.0 00.0 00.0 00.0 00.0 00.0 00.0 00.0 00.0 00.0 00.0 00.0
Meloidoginae 3 00.4 00.0 02.9 01.6 00.0 00.0 01.8 01.4 00.0 00.0 00.0 00.0 02.5 00.0 00.7 03.8 01.3 01.3 01.1 05.0 00.0 00.8 00.0 00.5
Longidorus 4 00.0 00.0 00.0 00.0 00.0 00.0 00.0 00.0 00.0 00.0 00.0 00.0 01.9 00.0 00.0 00.0 00.0 00.0 00.0 00.0 00.0 00.0 00.0 00.0
Paratylenchus 2 01.3 01.4 02.4 01.1 00.0 00.0 00.0 00.0 00.0 00.0 00.0 00.0 00.0 00.0 00.0 00.0 00.0 00.0 00.0 00.0 00.0 00.0 00.0 00.0
Pratylenchus 3 02.2 04.1 04.4 02.7 00.0 00.0 00.0 00.0 00.0 00.0 00.0 00.0 00.0 00.0 00.0 00.0 00.0 00.0 00.0 00.0 00.0 00.0 01.3 00.0
Tetylenchus 2 00.0 00.0 01.0 00.0 00.0 00.8 02.7 00.0 00.0 02.2 02.2 00.0 01.3 00.0 02.1 00.0 00.0 00.0 02.2 00.0 00.0 01.3 00.0 00.0
Tylenchorhynchus 2 04.9 13.1 26.2 04.9 17.8 07.2 42.5 36.2 03.9 28.9 19.4 21.6 07.5 21.1 14.6 40.4 17.4 28.9 25.8 27.3 15.3 04.6 31.0 16.9
Tylenchus 2 00.9 02.7 01.5 00.5 00.0 08.0 00.0 00.0 00.0 00.0 00.0 00.0 01.3 03.2 09.7 07.7 02.1 00.4 07.7 05.8 01.5 00.8 05.8 04.4
Xiphinema 5 00.0 00.5 00.0 00.0 00.0 00.0 00.0 00.0 00.0 00.0 00.0 00.0 00.0 00.5 00.0 00.0 00.0 00.0 01.1 00.0 00.0 00.0 00.0 00.0
OP 17.8 17.6 25.7 46.5 17.0 14.4 29.2 42.0 21.6 01.1 12.9 24.3 12.5 01.4 09.0 09.6 19.1 11.5 34.6 31.7 06.9 12.1 24.5 32.2
Discolaimus 4 02.7 00.9 00.0 05.9 01.5 00.0 00.0 00.0 03.9 00.0 01.1 00.0 01.3 00.0 00.0 00.0 00.0 00.4 02.7 02.2 00.5 02.1 00.0 02.7
Dorylaimus 4 09.3 06.3 15.0 27.6 08.1 11.2 12.4 18.8 05.9 01.1 04.3 10.8 05.6 01.4 03.5 07.7 11.4 08.9 14.8 16.5 03.9 09.2 14.2 15.3
Dorilaimoides 4 00.0 00.5 01.0 02.2 03.0 01.6 05.3 10.1 03.9 00.0 02.2 01.4 02.5 00.0 02.8 01.9 00.8 00.0 03.3 00.0 00.0 00.0 06.5 01.6
Dorylaimellus 5 00.0 00.5 03.4 01.6 00.0 00.0 00.9 01.4 00.0 00.0 00.0 00.0 00.6 00.0 00.7 00.0 00.0 00.0 00.5 00.0 00.0 00.0 00.6 00.0
Eudorylaimus 4 02.7 03.6 03.4 00.5 00.0 00.0 06.2 02.9 00.0 00.0 00.0 01.4 00.0 00.0 00.0 00.0 04.2 02.1 09.9 12.9 02.0 00.8 03.2 12.6
Leptonchidae 4 00.0 00.9 00.0 00.0 00.0 00.8 00.9 00.0 00.0 00.0 00.0 00.0 00.0 00.0 00.0 00.0 00.0 00.0 01.6 00.0 00.0 00.0 00.0 00.0
Mononchus 4 00.0 00.0 00.0 00.0 00.0 00.0 00.0 00.0 00.0 00.0 00.0 00.0 00.0 00.0 00.0 00.0 00.0 00.0 00.0 00.0 00.0 00.0 00.0 00.0
Nygolaimus 5 03.1 05.0 02.9 08.6 04.4 00.8 03.5 08.7 07.8 00.0 05.4 10.8 02.5 00.0 02.1 00.0 02.5 00.0 01.6 00.0 00.5 00.0 00.0 00.0
(continued on next page)
36 S. Pen-Mouratov et al. / European Journal of Soil Biology 40 (2004) 31–46
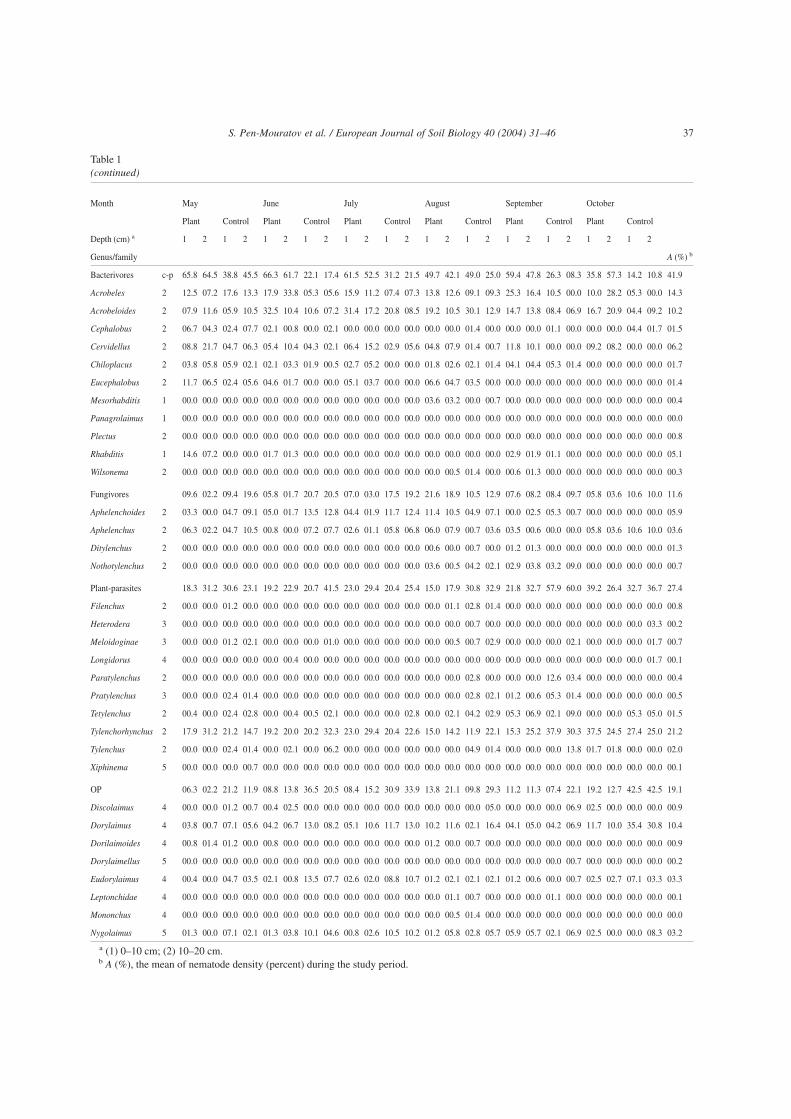
Table 1(continued)
Month May June July August September October
Plant Control Plant Control Plant Control Plant Control Plant Control Plant Control
Depth (cm) a 1 2 1 2 1 2 1 2 1 2 1 2 1 2 1 2 1 2 1 2 1 2 1 2
Genus/family A (%) b
Bacterivores c-p 65.8 64.5 38.8 45.5 66.3 61.7 22.1 17.4 61.5 52.5 31.2 21.5 49.7 42.1 49.0 25.0 59.4 47.8 26.3 08.3 35.8 57.3 14.2 10.8 41.9
Acrobeles 2 12.5 07.2 17.6 13.3 17.9 33.8 05.3 05.6 15.9 11.2 07.4 07.3 13.8 12.6 09.1 09.3 25.3 16.4 10.5 00.0 10.0 28.2 05.3 00.0 14.3
Acrobeloides 2 07.9 11.6 05.9 10.5 32.5 10.4 10.6 07.2 31.4 17.2 20.8 08.5 19.2 10.5 30.1 12.9 14.7 13.8 08.4 06.9 16.7 20.9 04.4 09.2 10.2
Cephalobus 2 06.7 04.3 02.4 07.7 02.1 00.8 00.0 02.1 00.0 00.0 00.0 00.0 00.0 00.0 01.4 00.0 00.0 00.0 01.1 00.0 00.0 00.0 04.4 01.7 01.5
Cervidellus 2 08.8 21.7 04.7 06.3 05.4 10.4 04.3 02.1 06.4 15.2 02.9 05.6 04.8 07.9 01.4 00.7 11.8 10.1 00.0 00.0 09.2 08.2 00.0 00.0 06.2
Chiloplacus 2 03.8 05.8 05.9 02.1 02.1 03.3 01.9 00.5 02.7 05.2 00.0 00.0 01.8 02.6 02.1 01.4 04.1 04.4 05.3 01.4 00.0 00.0 00.0 00.0 01.7
Eucephalobus 2 11.7 06.5 02.4 05.6 04.6 01.7 00.0 00.0 05.1 03.7 00.0 00.0 06.6 04.7 03.5 00.0 00.0 00.0 00.0 00.0 00.0 00.0 00.0 00.0 01.4
Mesorhabditis 1 00.0 00.0 00.0 00.0 00.0 00.0 00.0 00.0 00.0 00.0 00.0 00.0 03.6 03.2 00.0 00.7 00.0 00.0 00.0 00.0 00.0 00.0 00.0 00.0 00.4
Panagrolaimus 1 00.0 00.0 00.0 00.0 00.0 00.0 00.0 00.0 00.0 00.0 00.0 00.0 00.0 00.0 00.0 00.0 00.0 00.0 00.0 00.0 00.0 00.0 00.0 00.0 00.0
Plectus 2 00.0 00.0 00.0 00.0 00.0 00.0 00.0 00.0 00.0 00.0 00.0 00.0 00.0 00.0 00.0 00.0 00.0 00.0 00.0 00.0 00.0 00.0 00.0 00.0 00.8
Rhabditis 1 14.6 07.2 00.0 00.0 01.7 01.3 00.0 00.0 00.0 00.0 00.0 00.0 00.0 00.0 00.0 00.0 02.9 01.9 01.1 00.0 00.0 00.0 00.0 00.0 05.1
Wilsonema 2 00.0 00.0 00.0 00.0 00.0 00.0 00.0 00.0 00.0 00.0 00.0 00.0 00.0 00.5 01.4 00.0 00.6 01.3 00.0 00.0 00.0 00.0 00.0 00.0 00.3
Fungivores 09.6 02.2 09.4 19.6 05.8 01.7 20.7 20.5 07.0 03.0 17.5 19.2 21.6 18.9 10.5 12.9 07.6 08.2 08.4 09.7 05.8 03.6 10.6 10.0 11.6
Aphelenchoides 2 03.3 00.0 04.7 09.1 05.0 01.7 13.5 12.8 04.4 01.9 11.7 12.4 11.4 10.5 04.9 07.1 00.0 02.5 05.3 00.7 00.0 00.0 00.0 00.0 05.9
Aphelenchus 2 06.3 02.2 04.7 10.5 00.8 00.0 07.2 07.7 02.6 01.1 05.8 06.8 06.0 07.9 00.7 03.6 03.5 00.6 00.0 00.0 05.8 03.6 10.6 10.0 03.6
Ditylenchus 2 00.0 00.0 00.0 00.0 00.0 00.0 00.0 00.0 00.0 00.0 00.0 00.0 00.6 00.0 00.7 00.0 01.2 01.3 00.0 00.0 00.0 00.0 00.0 00.0 01.3
Nothotylenchus 2 00.0 00.0 00.0 00.0 00.0 00.0 00.0 00.0 00.0 00.0 00.0 00.0 03.6 00.5 04.2 02.1 02.9 03.8 03.2 09.0 00.0 00.0 00.0 00.0 00.7
Plant-parasites 18.3 31.2 30.6 23.1 19.2 22.9 20.7 41.5 23.0 29.4 20.4 25.4 15.0 17.9 30.8 32.9 21.8 32.7 57.9 60.0 39.2 26.4 32.7 36.7 27.4
Filenchus 2 00.0 00.0 01.2 00.0 00.0 00.0 00.0 00.0 00.0 00.0 00.0 00.0 00.0 01.1 02.8 01.4 00.0 00.0 00.0 00.0 00.0 00.0 00.0 00.0 00.8
Heterodera 3 00.0 00.0 00.0 00.0 00.0 00.0 00.0 00.0 00.0 00.0 00.0 00.0 00.0 00.0 00.7 00.0 00.0 00.0 00.0 00.0 00.0 00.0 00.0 03.3 00.2
Meloidoginae 3 00.0 00.0 01.2 02.1 00.0 00.0 00.0 01.0 00.0 00.0 00.0 00.0 00.0 00.5 00.7 02.9 00.0 00.0 00.0 02.1 00.0 00.0 00.0 01.7 00.7
Longidorus 4 00.0 00.0 00.0 00.0 00.0 00.4 00.0 00.0 00.0 00.0 00.0 00.0 00.0 00.0 00.0 00.0 00.0 00.0 00.0 00.0 00.0 00.0 00.0 01.7 00.1
Paratylenchus 2 00.0 00.0 00.0 00.0 00.0 00.0 00.0 00.0 00.0 00.0 00.0 00.0 00.0 00.0 02.8 00.0 00.0 00.0 12.6 03.4 00.0 00.0 00.0 00.0 00.4
Pratylenchus 3 00.0 00.0 02.4 01.4 00.0 00.0 00.0 00.0 00.0 00.0 00.0 00.0 00.0 00.0 02.8 02.1 01.2 00.6 05.3 01.4 00.0 00.0 00.0 00.0 00.5
Tetylenchus 2 00.4 00.0 02.4 02.8 00.0 00.4 00.5 02.1 00.0 00.0 00.0 02.8 00.0 02.1 04.2 02.9 05.3 06.9 02.1 09.0 00.0 00.0 05.3 05.0 01.5
Tylenchorhynchus 2 17.9 31.2 21.2 14.7 19.2 20.0 20.2 32.3 23.0 29.4 20.4 22.6 15.0 14.2 11.9 22.1 15.3 25.2 37.9 30.3 37.5 24.5 27.4 25.0 21.2
Tylenchus 2 00.0 00.0 02.4 01.4 00.0 02.1 00.0 06.2 00.0 00.0 00.0 00.0 00.0 00.0 04.9 01.4 00.0 00.0 00.0 13.8 01.7 01.8 00.0 00.0 02.0
Xiphinema 5 00.0 00.0 00.0 00.7 00.0 00.0 00.0 00.0 00.0 00.0 00.0 00.0 00.0 00.0 00.0 00.0 00.0 00.0 00.0 00.0 00.0 00.0 00.0 00.0 00.1
OP 06.3 02.2 21.2 11.9 08.8 13.8 36.5 20.5 08.4 15.2 30.9 33.9 13.8 21.1 09.8 29.3 11.2 11.3 07.4 22.1 19.2 12.7 42.5 42.5 19.1
Discolaimus 4 00.0 00.0 01.2 00.7 00.4 02.5 00.0 00.0 00.0 00.0 00.0 00.0 00.0 00.0 00.0 05.0 00.0 00.0 00.0 06.9 02.5 00.0 00.0 00.0 00.9
Dorylaimus 4 03.8 00.7 07.1 05.6 04.2 06.7 13.0 08.2 05.1 10.6 11.7 13.0 10.2 11.6 02.1 16.4 04.1 05.0 04.2 06.9 11.7 10.0 35.4 30.8 10.4
Dorilaimoides 4 00.8 01.4 01.2 00.0 00.8 00.0 00.0 00.0 00.0 00.0 00.0 00.0 01.2 00.0 00.7 00.0 00.0 00.0 00.0 00.0 00.0 00.0 00.0 00.0 00.9
Dorylaimellus 5 00.0 00.0 00.0 00.0 00.0 00.0 00.0 00.0 00.0 00.0 00.0 00.0 00.0 00.0 00.0 00.0 00.0 00.0 00.0 00.7 00.0 00.0 00.0 00.0 00.2
Eudorylaimus 4 00.4 00.0 04.7 03.5 02.1 00.8 13.5 07.7 02.6 02.0 08.8 10.7 01.2 02.1 02.1 02.1 01.2 00.6 00.0 00.7 02.5 02.7 07.1 03.3 03.3
Leptonchidae 4 00.0 00.0 00.0 00.0 00.0 00.0 00.0 00.0 00.0 00.0 00.0 00.0 00.0 01.1 00.7 00.0 00.0 00.0 01.1 00.0 00.0 00.0 00.0 00.0 00.1
Mononchus 4 00.0 00.0 00.0 00.0 00.0 00.0 00.0 00.0 00.0 00.0 00.0 00.0 00.0 00.5 01.4 00.0 00.0 00.0 00.0 00.0 00.0 00.0 00.0 00.0 00.0
Nygolaimus 5 01.3 00.0 07.1 02.1 01.3 03.8 10.1 04.6 00.8 02.6 10.5 10.2 01.2 05.8 02.8 05.7 05.9 05.7 02.1 06.9 02.5 00.0 00.0 08.3 03.2
a (1) 0–10 cm; (2) 10–20 cm.b A (%), the mean of nematode density (percent) during the study period.
37S. Pen-Mouratov et al. / European Journal of Soil Biology 40 (2004) 31–46

with a higher population density toward the summer seasonof the second year (Fig. 3(3.1) AFF, BFF). Maximum valuesof fungivores under and between the shrubs were found inJuly and August (123 and 219 individuals 100 g–1 soil underthe shrubs; 67 and 134 individuals 100 g–1 soil in the controlplots, respectively) of the second year. These values, as wellas those of the first year, contributed to the significant differ-ences (P < 0.01) between the late summer and the autumnmonths. No significant differences were found in thefungivore-feeding group between the samplings (Fig. 3 APP,BPP).
The plant-parasite population (Fig. 3(3.2) APP, BPP) ex-hibited similar trends in both samplings and depths, with asignificantly higher (P < 0.05) population density in thesecond year than in the first, with 47 and 280 individuals100 g–1 soil, respectively, which amounted to 27.4% of thetotal soil free-living nematode population during the studyperiod (Table 1). No significant differences were found be-tween the samples and soil layers (P > 0.05).
The OP population under Z. dumosum exhibited a similartrend to that of the plant parasites, and represented 19% ofthe total population during the study period, with a signifi-
ABF
0
100
200
300
400
500
Ind
ivid
uals
100g
-1 d
ry s
oil
BBF
0
100
200
300
400
500
Ind
ivid
uals
100g
-1 d
ry s
oil
AFF
0
100
200
300
400
500
Ind
ivid
uals
100g
-1 d
ry s
oil
BFF
0
100
200
300
400
500
Nov.99 Feb.00 May.00 Aug.00 Nov.00 Feb.01 May.01 Aug.01 Nov.01
Time (months)
Ind
ivid
uals
100g
-1 d
ry s
oil
Fig. 3. (3.1) Changes in nematode trophic groups in the soil samples taken beneath the Z. dumosum ( ) shrubs and control samples (◆ ) 0–10 and10–20 cm layers, during the study period (November 1999–November 2001). (ABF, bacterial feeding nematodes at the 0–10 cm layer; BBF,bacterial feeding nematodes at the 10–20 cm layer; AFF, fungi feeding nematodes at the 0–10 cm layer; BFF, fungi feeding nematodes at the10–20 cm soil layer).
38 S. Pen-Mouratov et al. / European Journal of Soil Biology 40 (2004) 31–46

cantly higher (P < 0.01) population during the second year inthe upper (0–10 cm) layer (Fig. 3(3.2) AOP, BOP). No signifi-cant (P > 0.05) differences were found in the control samplesbetween the different depths throughout the study period.
3.4. Nematode taxa
Thirty-three nematode taxa were identified in the presentinvestigation. We determined the presence of nematode spe-
cies in the samples throughout the study period with less than1% subresident; 1–2% resident; 2–5% subdominant; 5–10%being considered dominant 10% and higher being consideredeudominant [39]. Table 2 presents changes in the dominantdensity during the study period. According to this table, mostdominant genera are found in the vicinity of Z. dumosum inboth layers, while in the control between-shrub space, a moreirregular presence was found. Acrobeles, a known bacteri-vore, was found to be the dominant genus in the monthly soil
APP
0
100
200
300
Ind
ivid
uals
100g
-1 d
ry s
oil
BPP
0
100
200
300
Ind
ivid
uals
100g
-1 d
ry s
oil
AOP
0
100
200
300
400
500
Ind
ivid
uals
100g
-1 d
ry
so
il
BOP
0
100
200
300
400
500
Nov.99 Feb.00 May.00 Aug.00 Nov.00 Feb.01 May.01 Aug.01 Nov.01
Time (months)
Ind
ivid
uals
100g
-1 d
ry s
oil
Fig. 3. (continued)(3.2) Changes in nematode trophic groups in the soil samples taken beneath the Z. dumosum ( ) shrubs and control samples (◆ ) 0–10 and10–20 cm layers, during the study period (November 1999–November 2001). APP, plant parasite population at 0–10 cm; BPP, plant parasitepopulation at 10–20 cm; AOP, omnivore-predators population at 0–10 cm; BOP, omnivore-predators population at 10–20 cm soil layer).
39S. Pen-Mouratov et al. / European Journal of Soil Biology 40 (2004) 31–46

samples under Z. dumosum. It accounted for the presence ofnine out of a total of 25 months.A 36% presence of Acrobelesleads it to being considered an eudominant genus. However,the Tylenchorhynchus plant-parasite nematode exhibited amore general and widely divergent presence, ranging be-tween 24% and 32% of the total plant-parasite populationduring the study period for all samplings and depths. Thesevalues indicate that these genera are dominant on a monthlybasis and eudominant for the entire study period. Dominatingnematode genera such as Acrobeloides, Rhabditis, Cephalo-
bus Aphelenchoides, Dorylaimus, and Ditylenchus werefound less often (Table 2).
3.5. Ecological indices
The c-p indices, which describe nematode life strategiesand their sensitivity to environmental disturbances [4,7],with values ranging from 1 to 5 (for colonizers, tolerant todisturbance to persisters, sensitive to disturbance), werefound to divide the genus/family belonging to the different
Table 2The mean dominant density (%) of soil nematodes under Z. dumosum and control samples at two depths (0–10 and 0–20 cm) a
Trophic groups/genus/family b c-p Month Plant ControlDepth (cm) 0–10 10–20 0–10 10–20BacterivoresAcrobeles 2 January ++++ ++++
February ++++March ++++ ++++April ++++ ++++May ++++June ++++ ++++September ++++October ++++November ++++December ++++ ++++
Acrobeloides 2 June ++++July ++++ ++++August ++++ ++++October ++++
Cephalobus 2 May ++++December ++++
Rhabditidae 1 January ++++February ++++ +++++May ++++November ++++
FungivoresAphelenchoides 2 January ++++Ditylenchus 2 February ++++Plant-parasitesTylenchorhynchus 2 January ++++ ++++ ++++
February ++++March ++++ ++++ ++++April ++++May ++++ ++++June ++++ ++++ ++++July ++++ ++++ ++++September ++++ ++++ ++++October ++++ ++++ ++++ ++++November ++++December ++++ +++++ ++++
OPDorylaimus 4 October ++++ ++++
November ++++
+++++, eudominant (>10%); ++++, dominant (5–10%).a Trophic groups according to Yeates et al. [45].b By classification Yeates [39].
40 S. Pen-Mouratov et al. / European Journal of Soil Biology 40 (2004) 31–46
trophic groups into three distinct groups. The first groupconsists of all the bacteriovore and fungi-feeders, with c-pvalues of 1 and 2. Since they are more abiotic-dependent,they developed a colonizer strategy. The second group con-sists of the OP, with c-p values of 4 and 5. This group ishigher in the hierarchy, and was found to develop a persistersstrategy, which did not allow them to be food electors. Thethird group was represented by plant-parasites, including50% colonizers, 20% persisters and the remaining 30% hav-ing a c-p value of 3, as intermediators. Following this group-ing, we found that under the shrubs, 78%, 12% and 1% of thenematode population belong to groups 1, 2 and 3, respec-tively. In the control samples a decrease was found in group1 to 69% and an increase of over 100% to values of 28% and3% in groups 2 and 3. This means that unlike under-plant soilsamples, a decrease in nematodes belonging to life-strategies1 and 2 was found in the control soil samples, and an increasein nematodes belonging to life strategies 3–5.
The Wasilewska index [37] (WI-ratio of fungivore + bac-terivores to plant parasites), F/B-index (fungivore/bacterivores ratio), trophic diversity (T), genus dominance(k), MMI, and SR exhibited differences under plants and incontrol samples throughout the study period, with no differ-ences between the two sampling layers (Figs. 4 and 5).
The WI index, ranging from 0 to 30, was found to reach amean maximal value under the plants at both depths(10.3 and 12.9, respectively) in March, whereas mean mini-mal values decreased to 0.5 in late summer. WI values werefound to reach a mean maximal value of 4 and 7.5 in thespring of the first year. During most of the sampling period ofthe second year, they were found to be significantly lower.
The ratio of fungivores to bacterivores (F/B) under Z. du-mosum in both layers was lower (P < 0.05) than in thebetween-shrub control samples. The values obtainedthroughout the study period beneath the shrubs were lessthan one most of the time, with one exception in March,with a value of 1.7 in the upper layer. However, the F/Bratio in the control samples between the shrubs was foundto reach higher values than those obtained under theshrubs, reaching values of 2.5 and 3.4 in the 0–10 and10–20 cm layers, respectively. The lowest values were ob-tained during the winter months (November–December) ofthe first study year, whereas during the second year thisperiod was prolonged until the end of spring for both layers.T ranged from 1.00 to 3.4 (Fig. 4) with no differences(P > 0.05) between the depths and years throughout the studyperiod. In general, the trends were similar, with decreasingvalues in winter (December–January) under plants at bothdepths and more gradual changes in the deeper layercompared to more severe changes in T values in the upper(0–10 cm) layer.
Genus dominance (k) ranged between 0.1 and 1.0, reach-ing maximal values under the plants in January (at bothdepths) and December (at the 10–20 cm depth), and minimalvalues in August (at both depths) (Fig. 4). Mean values ofdominance in the control samples were maximal in February
and March (10–20 cm depth), November (10–20 cm depth)and December (both depths). Minimal dominant index val-ues in the control samples were obtained in May (10–20 cmdepth). The mean dominant index value (0.35) was similar tovalues (0.09–0.70) observed in different parts of the world[19,21,43].
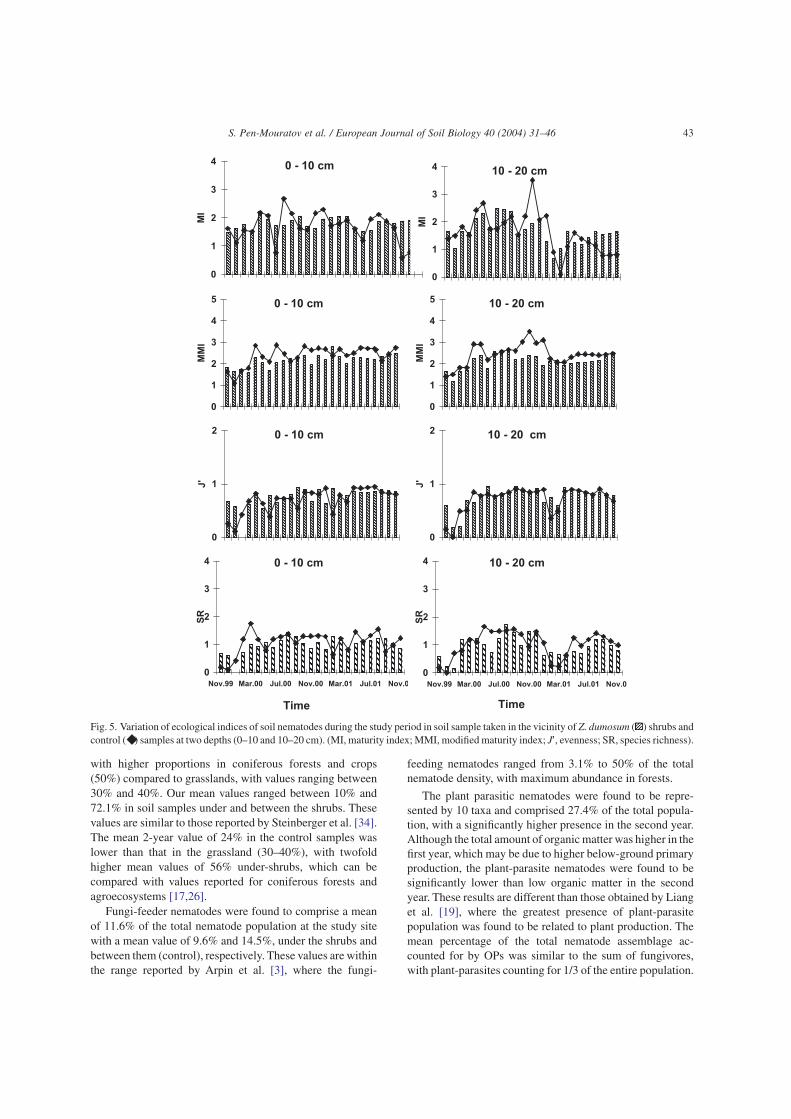
SR changed from 0 to 1.8 and its mean values weremaximal under plants towards the end of the summer periodand the beginning of autumn (August, September) for bothyears and depths (Fig. 5). In control samples, mean values ofSR increased towards spring, reaching maximal values inMarch (0–10 cm depth) and May (10–20 cm depth), with aslight decrease toward summer and autumn. The Shannonindex (H′) was different during the observed years andmonths, but there were no differences in the two observeddepths between under-plant samples and the control (Fig. 4).Mean minimal values of the Shannon index were foundunder the plants in January (both depths) and in the controlsamples in February (10–20 cm depth) and December (bothdepths).
MI behavior exhibited a temporal as well as a spatialdifference throughout the study period (Fig. 5). In thesamples taken from under-plants in the upper layer, morestable values (1.5–2.2) were obtained, with no significancedifferences during the year, while in samples taken from thedeeper layer (10–20 cm), the values in the second yeardropped to 0.6 in January, and failed to reach a value of 2.0 bythe end of the study period. The patterns observed in thecontrol samples were similar to those of under-shrubsamples, with no significant differences between them.
Values of the MMI ranged from 1.1 to 3.5, with highervalues being observed in the control samples than in thesamples taken from under-shrubs (Fig. 5). However, no sig-nificant differences were found between depths and samplinglocation throughout the study period.
4. Discussion
The fluctuation in rainfall during this 2-year study re-flected the unpredictability of this trigger, with an almostthreefold increase in the total amount of rainfall in the secondyear compared to the first. This difference in total rainfall andits distribution was found to significantly influence soil mois-ture levels in all samplings and layers during the winterseason. Moreover, the additional source of moisture fromapproximately 35 mm of dew, which falls each night but mostheavily during late summer and autumn [12], significantlyinfluenced the temporal distribution of nematode communi-ties. However, the relatively high moisture levels during thesecond year did not result in a significant (P > 0.05) correla-tion between soil moisture content and total nematode popu-lation, as reported by Steinberger et al. [32] based on dataobtained from a topoclimatic transect in a rain shadowJudean desert.
An important feature observed throughout the study pe-riod was that although the total amount of rainfall and soil
41S. Pen-Mouratov et al. / European Journal of Soil Biology 40 (2004) 31–46

moisture availability during the second year was higher thanduring the first year, they did not increase soil organic matter.The differences in total organic matter can be attributed to thedifferences in primary production due to the high variabilityin the total amount and distribution of rainfall, as reported bySteinberger and Loboda [33] in their study on the NegevDesert.
The annual abundance of the total number of nematodesduring our study was found to be similar (272 individuals100 g–1 soil) to those reported by Steinberger and Loboda
[33], higher (74 individuals 100 g–1 soil) than those reportedby Liang et al. [19] for the Negev Desert. These values werealso lower than those reported by Freckman and Mankau [14]with 912 individuals 100 g–1 soil in soil samples taken fromthe Mojave Desert.
Trophic group distribution has been evaluated in a varietyof environments without reaching a clear pattern of variationin functional structure for the different ecosystems [17].However, in general, the BF population has been found torange between 12.9% and 72.0% of the total community,
10 - 20 cm
0
2
4
6
8
10
12
14
WI
0 - 10 cm
0
1
2
3
4
F/B
10 - 20 cm
0
1
2
3
4T
'
10 - 20 cm
0
1
2
0 - 10 cm
0
2
4
6
8
10
12
14
WI
0 - 10 cm
0
1
2
3
4
F/B
0 - 10 cm
0
1
2
3
4
T'
y y
0 - 10 cm
0
1
2
0 - 10 cm
0
1
2
3
4
Nov.99 Mar.00 Jul.00 Nov.00 Mar.01 Jul.01 Nov.0
Time
H'
10 - 20 cm
0
1
2
3
4
Nov.99 Mar.00 Jul.00 Nov.00 Mar.01 Jul.01 Nov.0
Time
H'
Fig. 4. Variation of ecological indices of soil nematodes during the study period in soil sample taken in the vicinity of Z. dumosum ( ) shrubs andcontrol (◆ ) samples at two depths (0–10 and 10–20 cm). (WI, Wasilewska indices; F/B, fungi-feeders/bacterial-feeders; T, trophic diversity; k,genus dominance).
42 S. Pen-Mouratov et al. / European Journal of Soil Biology 40 (2004) 31–46
with higher proportions in coniferous forests and crops(50%) compared to grasslands, with values ranging between30% and 40%. Our mean values ranged between 10% and72.1% in soil samples under and between the shrubs. Thesevalues are similar to those reported by Steinberger et al. [34].The mean 2-year value of 24% in the control samples waslower than that in the grassland (30–40%), with twofoldhigher mean values of 56% under-shrubs, which can becompared with values reported for coniferous forests andagroecosystems [17,26].
Fungi-feeder nematodes were found to comprise a meanof 11.6% of the total nematode population at the study sitewith a mean value of 9.6% and 14.5%, under the shrubs andbetween them (control), respectively. These values are withinthe range reported by Arpin et al. [3], where the fungi-
feeding nematodes ranged from 3.1% to 50% of the totalnematode density, with maximum abundance in forests.
The plant parasitic nematodes were found to be repre-sented by 10 taxa and comprised 27.4% of the total popula-tion, with a significantly higher presence in the second year.Although the total amount of organic matter was higher in thefirst year, which may be due to higher below-ground primaryproduction, the plant-parasite nematodes were found to besignificantly lower than low organic matter in the secondyear. These results are different than those obtained by Lianget al. [19], where the greatest presence of plant-parasitepopulation was found to be related to plant production. Themean percentage of the total nematode assemblage ac-counted for by OPs was similar to the sum of fungivores,with plant-parasites counting for 1/3 of the entire population.
0 - 10 cm
0
1
2
3
4
MI
10 - 20 cm
0
1
2
3
4
MI
0 - 10 cm
0
1
2
3
4
5
MM
I
10 - 20 cm
0
1
2
3
4
5
MM
I
0 - 10 cm
0
1
2
J'
10 - 20 cm
0
1
2
J'
0 - 10 cm
0
1
2
3
4
Nov.99 Mar.00 Jul.00 Nov.00 Mar.01 Jul.01 Nov.0
Time
SR
10 - 20 cm
0
1
2
3
4
Nov.99 Mar.00 Jul.00 Nov.00 Mar.01 Jul.01 Nov.0
Time
SR
Fig. 5. Variation of ecological indices of soil nematodes during the study period in soil sample taken in the vicinity of Z. dumosum ( ) shrubs andcontrol (◆ ) samples at two depths (0–10 and 10–20 cm). (MI, maturity index; MMI, modified maturity index; J′, evenness; SR, species richness).
43S. Pen-Mouratov et al. / European Journal of Soil Biology 40 (2004) 31–46
Freckman et al. [15], in their study on the effect of irrigationon the nematode population in the Chihuhuan Desert, foundthat the OP ranged between 17% and 25% of the totalpopulation. The changes in population densities and trophicgroup composition recorded in this study can be character-ized as a wet and dry season response. In the wet season, thenematode population did not peak in response to soil mois-ture and organic matter. It is surprising that there was nocorrelation between nematode densities and precipitation orsoil moisture availability, similar to the finding of Freckmanet al. [15], whereas according to Sohlenius and Wasilewska[31], soil moisture availability is one of the important vari-ables in nematode reproduction.
According to Dash et al. [10], Yeates [40], and Freckmanet al. [15], nematode communities vary on a local and tem-poral scale with changes in vegetation, probably throughtheir effects on available food sources such as bacteria,fungi and some organic matter availability from fine rootproduction, findings that are complementary to our presentstudy.
The mean fungivores and bacterivores to plant parasitesratio (WI) in our investigation amounted to 1.94, which iswithin the range (0.70–9.15) of values reported byWasilewska [37], McSorley and Frederick [21], and Liang etal. [18,19] in various ecosystems. According to Sohleniusand Sandor [30] indicates the status of the decompositionpathway in detritus food webs. The mean F/B ratio in thisstudy (0.41), with significant variations throughout the sam-pling period, emphasizes the nature of the available foodsource. Although the mean value was found within the range(0.15–2.3) of values reported by other investigators fromdifferent parts of world trophic diversity values (TD) in thepresent study (TD = 1.16) were found to be lower than values(2.01–2.94) obtained by investigators studying different sys-tems [21,32,43].
The genus dominance (k) mean value (0.35) was found tobe within the range (0.09–0.70) reported by Yeates and Bird[43] and McSorley and Frederick [21]. However, the meanSR (1.0) was found to be 50% lower than the value reportedby Liang et al. [19] and almost fivefold lower (1.49–5.02)than the values obtained by Yeates and King [44]. The Shan-non index (H′) gives more weight to rare species and a higherindex indicates greater diversity. In the present study wereported a mean value of H′ = 1.26, which is higher that thatobserved by Sohlenius and Sandor [30] in a grass system andthat reported by Wasilewska [37] for meadows.
The MI is a measure based on the composition of thenematode community, and can reflect the degree of distur-bance of the soil ecosystem [4]. The mean value of ourinvestigation was 1.68, which is similar to data reported byFreckman and Ettema [13] for agroecosystems and lowerthan the value reported by Wasilewska [37] for meadows.The MMI value (2.3) was found to be 40% higher than thevalue (1.7) reported by Porazinska and Coleman [22] for anagricultural field in Georgia.
Being one of the most important components of soil biota,nematodes actively interact with both dead and live parts ofthe soil ecosystem, contributing to soil formation and main-taining soil fertility. This study elucidated that nematodepopulation temporal and spatial dispersion is triggered bysoil moisture available for activity and not by the totalamount of rainfall. The density of the soil free-living nema-tode population is concentrated mainly in the upper layerfollowing food source availability by taking advantage andutilizing the above-ground interface (litter–soil surface) or-ganic resources, which have a strong effect on trophic com-position.
Our research showed that there were significant differ-ences in soil moisture and organic matter during the investi-gated period not only under the plants but also in the controlsamples. Moreover, soil moisture and organic matter reachedmaximum peaks during different months of the year. Incontrast to organic matter, there were significant differencesin soil moisture in the different soil layers. During wetperiods the increase in soil moisture was followed by anincrease in the total number of nematodes. During dryperiods a change in the total number of nematodes wasmore dependent on organic matter content than on soil mois-ture.
Altieri [2], in his paper on biodiversity in agroecosystems,suggested that internal functional regulation depends mainlyon the plant and animal biodiversity present in the system. Innatural systems, the regulation of inputs is mediated byunpredictable abiotic inputs, biodiversity and the need tosupply energy for maintaining ecological functions. Thesefunctions are largely biologically mediated, and are depen-dent on their plasticity for responding to and enhancingfunctional biodiversity. Soil nematode adaptation to the fluc-tuating environment may serve as a valuable mediator ofplant-available nutrients, thus aiding in the conservation ofnutrient flow in poor natural systems.
Acknowledgements
This research was supported by the Israel ScienceFoundation (grant no. 506/99-17.3). The authors wishto express their appreciation to the staff at the M.Evenari Avdat Research Farm.
References
[1] A. Alon, Y. Steinberger, Response of the soil microbial biomassand nematode population to a wetting event in nitrogen-amendedNegev desert plots, Biol. Fertil. Soils 30 (1999) 147–152.
[2] M.A. Altieri, The ecological role of biodiversity in agroeco-systems, Agric. Ecosyst. Environ. 74 (1999) 19–31.
44 S. Pen-Mouratov et al. / European Journal of Soil Biology 40 (2004) 31–46
[3] P. Arpin, J.F. David, G.G. Guittonneau, Influence du peuple-ment forestier sur la faune et la microflore du sol et des humus.2. Microbiologie et experiences au laboratoire, Rev. Ecol.Biol. Sol. 23 (1986) 119–153.
[4] T. Bongers, The maturity index: an ecological measure ofenvironmental disturbance based on nematode species compo-sition, Oecologia 83 (1990) 14–19.
[5] T. Bongers, M. Bongers, Functional diversity of nematodes,Appl. Soil Ecol. 10 (1998) 239–251.
[6] T. Bongers, H. Ferris, Nematode community structure as abioindicator in environmental monitoring, Trends Ecol. Evol.14 (1999) 224–228.
[7] T. Bongers, K. Ilieva-Makulec, K. Ekschmitt, Acute sensitiv-ity of nematode taxa to CuSO4 and relationships with feeding-type and life history classification, Environ. Toxicol. Chem. 20(2001) 1511–1516.
[8] E.J. Cairns, Methods in nematology, in: J.N. Sasser, W.R. Jen-kins (Eds.), Nematology, Fundamentals and Recent Advanceswith Emphasis on Plant Parasitic and Soil Forms, Universityof North Carolina Press, Chapel Hill, 1960, pp. 33–84.
[9] J. Dan, D.H. Yaalon, H. Royumdjisky, Z. Raz, The soil asso-ciation map of Israel, Isr. J. Earth Sci. 2 (1972) 29–49.
[10] M.C. Dash, B.K. Senapati, C.C. Mishra, Nematode feeding bytropical earthworms, Oikos 34 (1980) 322–325.
[11] Y. Demeure, D. Freckman, S.D. Van Gundy, Anhydrobioticcoiling of nematodes in soil, J. Nematol. 11 (1979) 189–195.
[12] M. Evenari, The desert environment, in: M. Evenari, I. Noy-Meir, E.W. Goodall (Eds.), Hot Deserts and Shrublands. Ecosys-tems of the World, 12A, Elsevier, Amsterdam, 1985, pp. 1–22.
[13] D.W. Freckman, C.H. Ettema, Assessing nematode communi-ties in agroecosystems of varying human intervention, Agric.Ecosyst. Environ. 45 (1993) 239–261.
[14] D.W. Freckman, R. Mankau, Abundance, distribution, biom-ass and energetics of soil nematodes in a northern MojaveDesert ecosystem, Pedobiologia 29 (1986) 129–142.
[15] D.W. Freckman, W.G. Whitford, Y. Steinberger, Effect ofirrigation on nematode population dynamics and activity indesert soils, Biol. Fertil. Soils 3 (1987) 3–10.
[16] C. Heip, P.M.J. Herman, K. Soetaert, Data processing, evalu-ation and analysis, in: R.P. Higgins, H. Thiel (Eds.), Introduc-tion to the Study of Meiofauna, Smithsonian Institution Press,Washington, DC, 1988, pp. 197–231.
[17] P. Lavelle, A.V. Spain, Soil Ecology, Kluwer Academic Pub-lishers, The Netherlands, 2001.
[18] W. Liang, I. Lavian, Y. Steinberger, Effect of agriculturalmanagement on nematode communities in a Mediterraneanagroecosystem, J. Nematol. 33 (2001) 208–215.
[19] W.J. Liang, S. Mouratov, Y. Pinhasi-Adiv, P. Avigad, Y. Stein-berger, Seasonal variation in the nematode communities asso-ciated with two halophytes in a desert ecosystem, Pedobiolo-gia 46 (2002) 63–74.
[20] W.J. Liang,Y. Pinhasi-Adiv, H. Shtultz,Y. Steinberger, Nema-tode population dynamics under the canopy of desert halo-phytes, Arid Soil Res. Rehabil. 14 (2000) 183–192.
[21] R. McSorley, J.J. Frederick, Nematode community structurein rows and between rows of a soybean field, Fundam. Appl.Nematol. 19 (1996) 251–261.
[22] D.L. Porazinska, D.C. Coleman, Ecology of nematodes underinfluence of Cucurbita spp. and different fertilizer types, J.Nematol. 27 (1995) 617–623.
[23] D.L.C. Procter, Global overview of the functional roles ofsoil-living nematodes in terrestrial communities and ecosys-tems, J. Nematol. 22 (1990) 1–7.
[24] D.L. Rowell, Soil Science: Methods and Applications, Long-mans Group UK Ltd., London, 1994.
[25] S. Sarig, Y. Steinberger, Microbial biomass response to sea-sonal fluctuation in soil salinity under the canopy of deserthalophytes, Soil Biol. Biochem. 26 (1994) 1405–1408.
[26] D.P. Schmitt, D.C. Norton, Relationship of plant parasiticnematodes to sites in native Iowa prairies, J. Nematol. 4 (1972)200–206.
[27] C.E. Shannon, W. Weaver, The Mathematical Theory of Com-munication, University of Illinois Press, Urbana, IL, 1949.
[28] E.H. Simpson, Measurement of diversity, Nature 163 (1949)668.
[29] B. Sohlenius, Abundance, biomass and contribution to energyflow by soil nematodes in terrestrial ecosystems, Oikos 34(1980) 186–194.
[30] B. Sohlenius, A. Sandor, Vertical distribution of nematodes insoil under grass (Festuca pratensis) and barley (Hordeumdistichum), Biol. Fertil. Soils 3 (1987) 19–25.
[31] B. Sohlenius, L. Wasilewska, Influence of irrigation and fer-tilization on the nematode community in a Swedish pine forestsoil, J. Appl. Ecol. 21 (1984) 327–342.
[32] Y. Steinberger, W.J. Liang, E. Savkina, T. Meshi, G. Barness,Nematode community composition and diversity associatedwith a topoclimatic transect in a rain shadow desert, Eur. J.Soil Biol. 37 (2001) 315–320.
[33] Y. Steinberger, I. Loboda, Nematode population dynamics andtrophic structure in a soil profile under the canopy of the desertshrub Zygophyllum dumosum, Pedobiologia 35 (1991) 191–197.
[34] Y. Steinberger, D. Orion, W.G. Whitford, Population dynam-ics of nematodes in the Negev Desert soil, Pedobiologia 31(1988) 223–228.
[35] Y. Steinberger, S. Sarig, Response by soil nematode popula-tions in the soil microbial biomass to a rain episode in the hot,dry Negev Desert, Biol. Fertil. Soils 16 (1993) 188–192.
[36] D.C. Twinn, Nematodes, in: C.H. Dickinson, G.J.F. Pugh(Eds.), Biology of Plant Litter Decomposition, AcademicPress, London, 1974, pp. 421–465.
[37] L. Wasilewska, The effect of age of meadows on successionand diversity in soil nematode communities, Pedobiologia 38(1994) 1–11.
[38] C.J. Wright, D.C. Coleman, Cross-site comparison of soilmicrobial biomass, soil nutrient status, and nematode trophicgroups, Pedobiologia 44 (2000) 2–23.
[39] G.W. Yeates, The diversity of soil nematode faunas, Pedobio-logia 10 (1970) 104–107.
[40] G.W.Yeates, Soil nematode populations depressed in the pres-ence of earthworms, Pedobiologia 22 (1981) 191–195.
45S. Pen-Mouratov et al. / European Journal of Soil Biology 40 (2004) 31–46

[41] G.W. Yeates, Variation in pasture nematode populations overthirty-six months in a summer dry silt loam, Pedobiologia 24(1982) 329–346.
[42] G.W. Yeates, Modification and qualification of the nematodematurity index, Pedobiologia 38 (1994) 97–101.
[43] G.W. Yeates, A.F. Bird, Some observations on the influence ofagricultural practices on the nematode faunae of some SouthAustralian soils, Fundam. Appl. Nematol. 17 (1994)133–145.
[44] G.W. Yeates, K.L. King, Soil nematodes as indicators of theeffect of management on grasslands in the New EnglandTablelands (NSW): comparison of native and improved grass-lands, Pedobiologia 41 (1997) 526–536.
[45] G.W. Yeates, D.A. Wardle, R.N. Watson, Responses of soilnematode populations, community structure, diversity andtemporal variability to agricultural intensification over aseven-year period, Soil Biol. Biochem. 31 (1999)1721–1733.
46 S. Pen-Mouratov et al. / European Journal of Soil Biology 40 (2004) 31–46


![GÉOPOLITIQUE ET POPULATIONS AU TCHAD [Geopolitics and populations in Chad]](https://static.fdokumen.com/doc/165x107/631378e5fc260b71020f1c3f/geopolitique-et-populations-au-tchad-geopolitics-and-populations-in-chad.jpg)