Spatial accessibility to vaccination sites in a campaign against rabies in São Paulo city, Brazil
7
Preventive Veterinary Medicine 111 (2013) 10–16 Contents lists available at SciVerse ScienceDirect Preventive Veterinary Medicine j ourna l ho me pag e: ww w.elsevier.com/locate/prevetmed Spatial accessibility to vaccination sites in a campaign against rabies in São Paulo city, Brazil Gina Polo a,∗ , Carlos Mera Acosta b , Ricardo Augusto Dias a a Laboratory of Epidemiology and Biostatistics, Department of Preventive Veterinary Medicine and Animal Health, School of Veterinary Medicine, University of São Paulo, Av. Prof. Dr. Orlando Marques de Paiva, 87, CEP: 05508270, Cidade Universitária, São Paulo, Brazil b Institute of Physics, University of São Paulo, Rua do Matão Travessa R Nr. 187, CEP: 05508090, Cidade Universitária, São Paulo, Brazil a r t i c l e i n f o Article history: Received 12 December 2012 Received in revised form 9 March 2013 Accepted 24 March 2013 Keywords: Vaccination against rabies Spatial accessibility Gaussian based two-step floating catchment method Dogs and cats a b s t r a c t It is estimated that the city of São Paulo has over 2.5 million dogs and 560 thousand cats. These populations are irregularly distributed throughout the territory, making it difficult to appropriately allocate health services focused on these species. To reasonably allocate vaccination sites, it is necessary to identify social groups and their access to the referred service. Rabies in dogs and cats has been an important zoonotic health issue in São Paulo and the key component of rabies control is vaccination. The present study aims to intro- duce an approach to quantify the potential spatial accessibility to the vaccination sites of the 2009 campaign against rabies in the city of São Paulo and solve the overestimation associ- ated with the classic methodology that applies buffer zones around vaccination sites based on Euclidean (straight-line) distance. To achieve this, a Gaussian-based two-step floating catchment area method with a travel-friction coefficient was adapted in a geographic infor- mation system environment, using distances along a street network based on Dijkstra’s algorithm (short path method). The choice of the distance calculation method affected the results in terms of the population covered. In general, areas with low accessibility for both dogs and cats were observed, especially in densely populated areas. The eastern zone of the city had higher accessibility values compared with peripheral and central zones. The Gaussian-based two-step floating catchment method with a travel-friction coefficient was used to assess the overestimation of the straight-line distance method, which is the most widely used method for coverage analysis. We conclude that this approach has the potential to improve the efficiency of resource use when planning rabies control programs in large urban environments such as São Paulo. The findings emphasize the need for surveillance and intervention in isolated areas. © 2013 Elsevier B.V. All rights reserved. 1. Introduction In Latin America, rabies is transmitted mainly by mam- malian carnivores and vampire bats (Diaz et al., 1994). In the city of São Paulo, Brazil, urban rabies has been effec- tively controlled by annual vaccination campaigns for dogs ∗ Corresponding author. Tel.: +55 11 3091 1393; fax: +55 11 3091 7928. E-mail addresses: [email protected], [email protected] (G. Polo). and cats since 1968. However, following several adverse reactions to a rabies vaccine, officials of the government of São Paulo decided to suspend the rabies vaccination campaign in 2010, making it available again in 2011. Nev- ertheless, outbreaks of rabies transmitted by vampire bats have menaced not only livestock but also humans in rural and urban areas (Sato et al., 2005). In 2011, after 28 years without detected cases of dog or cat rabies, a cat was diag- nosed and confirmed positive for rabies variant AgV3. This probably shows that it was not long for the disease to be re-introduced after the interruption of vaccination that 0167-5877/$ – see front matter © 2013 Elsevier B.V. All rights reserved. http://dx.doi.org/10.1016/j.prevetmed.2013.03.010
-
Upload
independent -
Category
Documents
-
view
4 -
download
0
Transcript of Spatial accessibility to vaccination sites in a campaign against rabies in São Paulo city, Brazil

Sr
Ga
Mb
ARRA
KVSGcD
1
mtt
(
0h
Preventive Veterinary Medicine 111 (2013) 10– 16
Contents lists available at SciVerse ScienceDirect
Preventive Veterinary Medicine
j ourna l ho me pag e: ww w.elsev ier .com/ locate /prevetmed
patial accessibility to vaccination sites in a campaign againstabies in São Paulo city, Brazil
ina Poloa,∗, Carlos Mera Acostab, Ricardo Augusto Diasa
Laboratory of Epidemiology and Biostatistics, Department of Preventive Veterinary Medicine and Animal Health, School of Veterinaryedicine, University of São Paulo, Av. Prof. Dr. Orlando Marques de Paiva, 87, CEP: 05508270, Cidade Universitária, São Paulo, BrazilInstitute of Physics, University of São Paulo, Rua do Matão Travessa R Nr. 187, CEP: 05508090, Cidade Universitária, São Paulo, Brazil
a r t i c l e i n f o
rticle history:eceived 12 December 2012eceived in revised form 9 March 2013ccepted 24 March 2013
eywords:accination against rabiespatial accessibilityaussian based two-step floatingatchment methodogs and cats
a b s t r a c t
It is estimated that the city of São Paulo has over 2.5 million dogs and 560 thousand cats.These populations are irregularly distributed throughout the territory, making it difficultto appropriately allocate health services focused on these species. To reasonably allocatevaccination sites, it is necessary to identify social groups and their access to the referredservice. Rabies in dogs and cats has been an important zoonotic health issue in São Pauloand the key component of rabies control is vaccination. The present study aims to intro-duce an approach to quantify the potential spatial accessibility to the vaccination sites of the2009 campaign against rabies in the city of São Paulo and solve the overestimation associ-ated with the classic methodology that applies buffer zones around vaccination sites basedon Euclidean (straight-line) distance. To achieve this, a Gaussian-based two-step floatingcatchment area method with a travel-friction coefficient was adapted in a geographic infor-mation system environment, using distances along a street network based on Dijkstra’salgorithm (short path method). The choice of the distance calculation method affected theresults in terms of the population covered. In general, areas with low accessibility for bothdogs and cats were observed, especially in densely populated areas. The eastern zone ofthe city had higher accessibility values compared with peripheral and central zones. TheGaussian-based two-step floating catchment method with a travel-friction coefficient was
used to assess the overestimation of the straight-line distance method, which is the mostwidely used method for coverage analysis. We conclude that this approach has the potentialto improve the efficiency of resource use when planning rabies control programs in largeurban environments such as São Paulo. The findings emphasize the need for surveillanceand intervention in isolated areas.. Introduction
In Latin America, rabies is transmitted mainly by mam-
alian carnivores and vampire bats (Diaz et al., 1994). Inhe city of São Paulo, Brazil, urban rabies has been effec-ively controlled by annual vaccination campaigns for dogs
∗ Corresponding author. Tel.: +55 11 3091 1393; fax: +55 11 3091 7928.E-mail addresses: [email protected], [email protected]
G. Polo).
167-5877/$ – see front matter © 2013 Elsevier B.V. All rights reserved.ttp://dx.doi.org/10.1016/j.prevetmed.2013.03.010
© 2013 Elsevier B.V. All rights reserved.
and cats since 1968. However, following several adversereactions to a rabies vaccine, officials of the governmentof São Paulo decided to suspend the rabies vaccinationcampaign in 2010, making it available again in 2011. Nev-ertheless, outbreaks of rabies transmitted by vampire batshave menaced not only livestock but also humans in ruraland urban areas (Sato et al., 2005). In 2011, after 28 years
without detected cases of dog or cat rabies, a cat was diag-nosed and confirmed positive for rabies variant AgV3. Thisprobably shows that it was not long for the disease tobe re-introduced after the interruption of vaccination that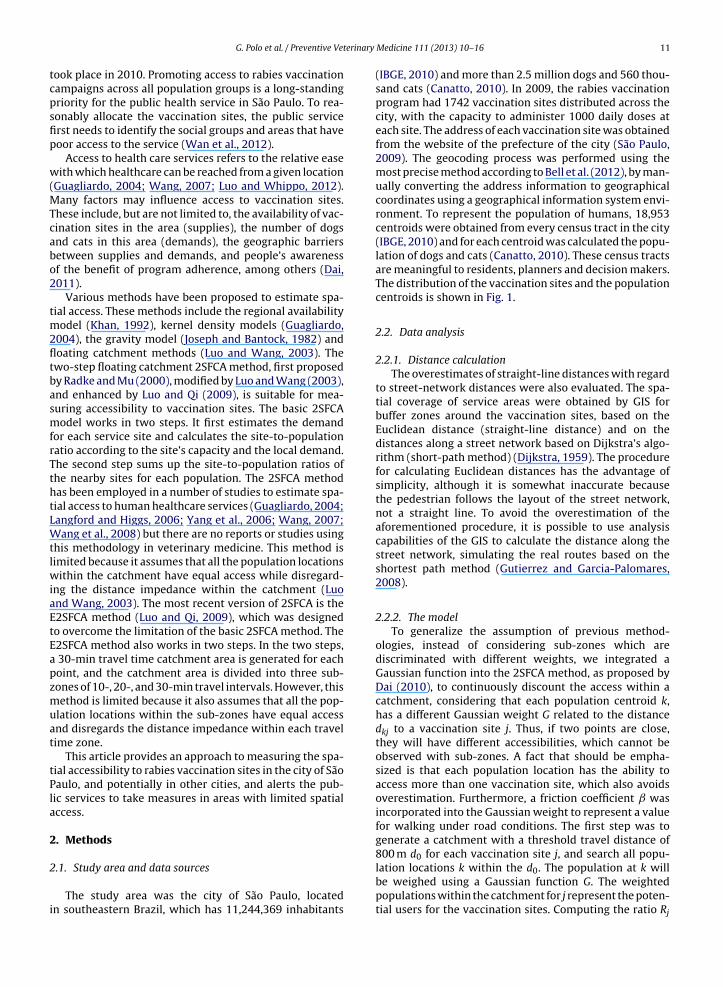
erinary
G. Polo et al. / Preventive Vettook place in 2010. Promoting access to rabies vaccinationcampaigns across all population groups is a long-standingpriority for the public health service in São Paulo. To rea-sonably allocate the vaccination sites, the public servicefirst needs to identify the social groups and areas that havepoor access to the service (Wan et al., 2012).
Access to health care services refers to the relative easewith which healthcare can be reached from a given location(Guagliardo, 2004; Wang, 2007; Luo and Whippo, 2012).Many factors may influence access to vaccination sites.These include, but are not limited to, the availability of vac-cination sites in the area (supplies), the number of dogsand cats in this area (demands), the geographic barriersbetween supplies and demands, and people’s awarenessof the benefit of program adherence, among others (Dai,2011).
Various methods have been proposed to estimate spa-tial access. These methods include the regional availabilitymodel (Khan, 1992), kernel density models (Guagliardo,2004), the gravity model (Joseph and Bantock, 1982) andfloating catchment methods (Luo and Wang, 2003). Thetwo-step floating catchment 2SFCA method, first proposedby Radke and Mu (2000), modified by Luo and Wang (2003),and enhanced by Luo and Qi (2009), is suitable for mea-suring accessibility to vaccination sites. The basic 2SFCAmodel works in two steps. It first estimates the demandfor each service site and calculates the site-to-populationratio according to the site’s capacity and the local demand.The second step sums up the site-to-population ratios ofthe nearby sites for each population. The 2SFCA methodhas been employed in a number of studies to estimate spa-tial access to human healthcare services (Guagliardo, 2004;Langford and Higgs, 2006; Yang et al., 2006; Wang, 2007;Wang et al., 2008) but there are no reports or studies usingthis methodology in veterinary medicine. This method islimited because it assumes that all the population locationswithin the catchment have equal access while disregard-ing the distance impedance within the catchment (Luoand Wang, 2003). The most recent version of 2SFCA is theE2SFCA method (Luo and Qi, 2009), which was designedto overcome the limitation of the basic 2SFCA method. TheE2SFCA method also works in two steps. In the two steps,a 30-min travel time catchment area is generated for eachpoint, and the catchment area is divided into three sub-zones of 10-, 20-, and 30-min travel intervals. However, thismethod is limited because it also assumes that all the pop-ulation locations within the sub-zones have equal accessand disregards the distance impedance within each traveltime zone.
This article provides an approach to measuring the spa-tial accessibility to rabies vaccination sites in the city of SãoPaulo, and potentially in other cities, and alerts the pub-lic services to take measures in areas with limited spatialaccess.
2. Methods
2.1. Study area and data sources
The study area was the city of São Paulo, locatedin southeastern Brazil, which has 11,244,369 inhabitants
Medicine 111 (2013) 10– 16 11
(IBGE, 2010) and more than 2.5 million dogs and 560 thou-sand cats (Canatto, 2010). In 2009, the rabies vaccinationprogram had 1742 vaccination sites distributed across thecity, with the capacity to administer 1000 daily doses ateach site. The address of each vaccination site was obtainedfrom the website of the prefecture of the city (São Paulo,2009). The geocoding process was performed using themost precise method according to Bell et al. (2012), by man-ually converting the address information to geographicalcoordinates using a geographical information system envi-ronment. To represent the population of humans, 18,953centroids were obtained from every census tract in the city(IBGE, 2010) and for each centroid was calculated the popu-lation of dogs and cats (Canatto, 2010). These census tractsare meaningful to residents, planners and decision makers.The distribution of the vaccination sites and the populationcentroids is shown in Fig. 1.
2.2. Data analysis
2.2.1. Distance calculationThe overestimates of straight-line distances with regard
to street-network distances were also evaluated. The spa-tial coverage of service areas were obtained by GIS forbuffer zones around the vaccination sites, based on theEuclidean distance (straight-line distance) and on thedistances along a street network based on Dijkstra’s algo-rithm (short-path method) (Dijkstra, 1959). The procedurefor calculating Euclidean distances has the advantage ofsimplicity, although it is somewhat inaccurate becausethe pedestrian follows the layout of the street network,not a straight line. To avoid the overestimation of theaforementioned procedure, it is possible to use analysiscapabilities of the GIS to calculate the distance along thestreet network, simulating the real routes based on theshortest path method (Gutierrez and Garcia-Palomares,2008).
2.2.2. The modelTo generalize the assumption of previous method-
ologies, instead of considering sub-zones which arediscriminated with different weights, we integrated aGaussian function into the 2SFCA method, as proposed byDai (2010), to continuously discount the access within acatchment, considering that each population centroid k,has a different Gaussian weight G related to the distancedkj to a vaccination site j. Thus, if two points are close,they will have different accessibilities, which cannot beobserved with sub-zones. A fact that should be empha-sized is that each population location has the ability toaccess more than one vaccination site, which also avoidsoverestimation. Furthermore, a friction coefficient wasincorporated into the Gaussian weight to represent a valuefor walking under road conditions. The first step was togenerate a catchment with a threshold travel distance of800 m d0 for each vaccination site j, and search all popu-
lation locations k within the d0. The population at k willbe weighed using a Gaussian function G. The weightedpopulations within the catchment for j represent the poten-tial users for the vaccination sites. Computing the ratio Rj
12 G. Polo et al. / Preventive Veterinary Medicine 111 (2013) 10– 16
sites an
ob
R
wmv
Fig. 1. Spatial distribution of vaccination
f the vaccination site to a population location is giveny:
j = Sj∑k∈(dkj≤d0)PkG(dkj, d0)
(1)
here Pk is the population at location k within the catch-ent d0; Sj is the capacity (i.e., vaccination doses) of the
accination site j; dkj is the travel distance between a
d population centroids. São Paulo, 2012.
population location k and a vaccination site j and G is theGaussian weight:
G(dkj, d0) =
⎧⎨⎩
e−ˇ(dkj/d0)2 − e−ˇ
1 − e−ˇ, if dkj ≤ 0
0, if dkj > 0
(2)
where is the friction coefficient. The impedance functionfor the model used in this paper, with three different valuesof friction coefficient (0.75, 0.5 and 0.25), is presented inFig. 2. The coefficient of friction during walking represents
G. Polo et al. / Preventive Veterinary Medicine 111 (2013) 10– 16 13
hment area method with different values for the travel-friction coefficient ˇ. São
Fig. 2. Impedance function for the Gaussian-based two-step floating catcPaulo, 2012.a value between the foot and the road surface and deter-mines a measure of the ease with which a person can moveon a certain surface (Marpet, 1996). The coefficient of fric-tion of 0.5 is usually used as a safe value for a pedestrianwalking on different types of soil (Bell et al., 2012).
The second step was to search all vaccination sites lwithin the threshold distance d0 for each population loca-tion i, thus formulating the catchment for the populationat i. After subtracting each Rl using the Gaussian functionG, the vaccination-to-population ratios were summed toobtain the spatial accessibility at population location i:
Ai =∑
k∈(dkj≤d0)
RlG(dil, d0) (3)
where l denotes all vaccination sites within the catchmentof population location i, and all other annotations are thesame as in Eq. (1). It should be emphasized that each pop-ulation location has access to more than one vaccinationsite, which avoids the overestimation problem.
This study uses the Network Analyst Tool in ArcGis 10.1(Environmental System Research Institute, Inc., Redlands,CA). Using the road network of São Paulo, the calculation ofthe distances between census tract centroids and the vac-cination sites were computed using the origin–destinationcost matrix function.
3. Results
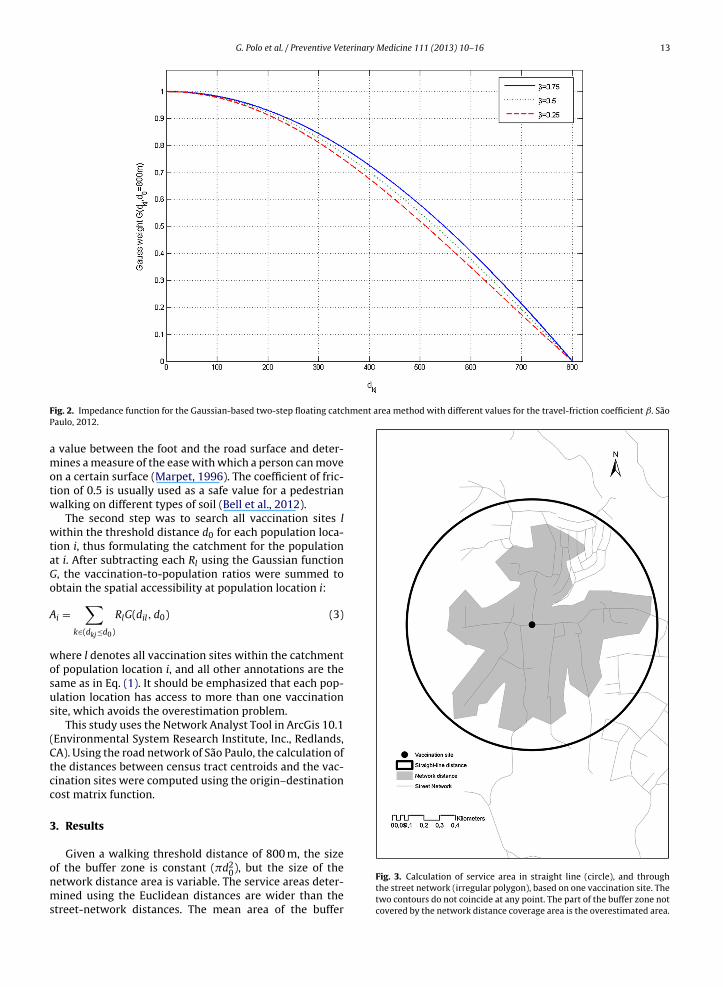
Given a walking threshold distance of 800 m, the size
of the buffer zone is constant (�d20), but the size of thenetwork distance area is variable. The service areas deter-mined using the Euclidean distances are wider than thestreet-network distances. The mean area of the buffer
Fig. 3. Calculation of service area in straight line (circle), and throughthe street network (irregular polygon), based on one vaccination site. Thetwo contours do not coincide at any point. The part of the buffer zone notcovered by the network distance coverage area is the overestimated area.
14 G. Polo et al. / Preventive Veterinary Medicine 111 (2013) 10– 16
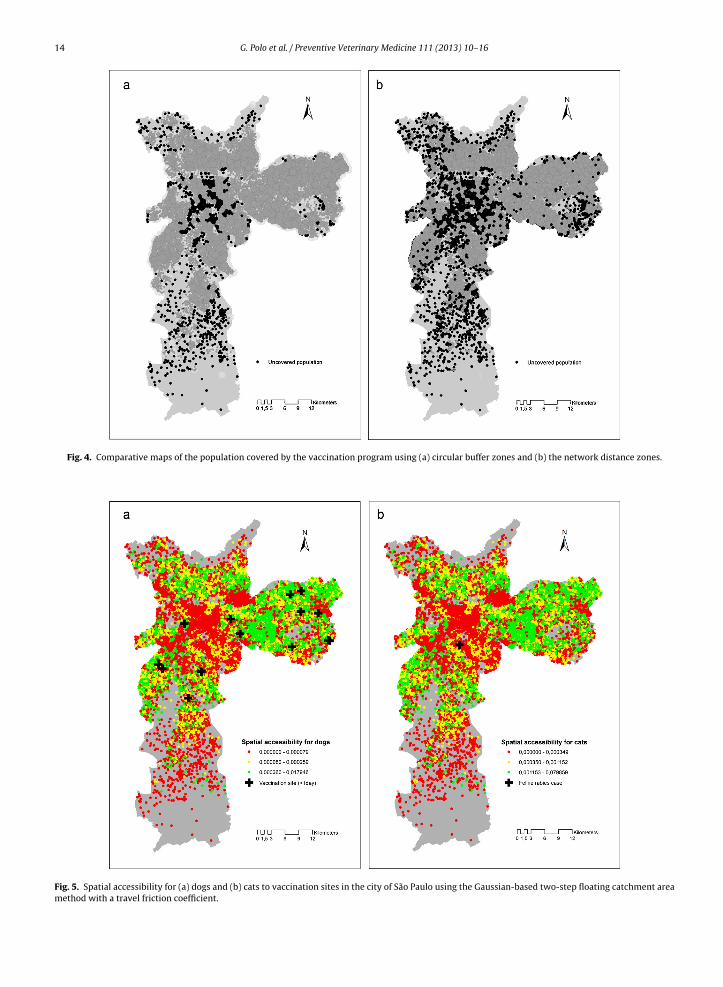
Fig. 4. Comparative maps of the population covered by the vaccination program using (a) circular buffer zones and (b) the network distance zones.
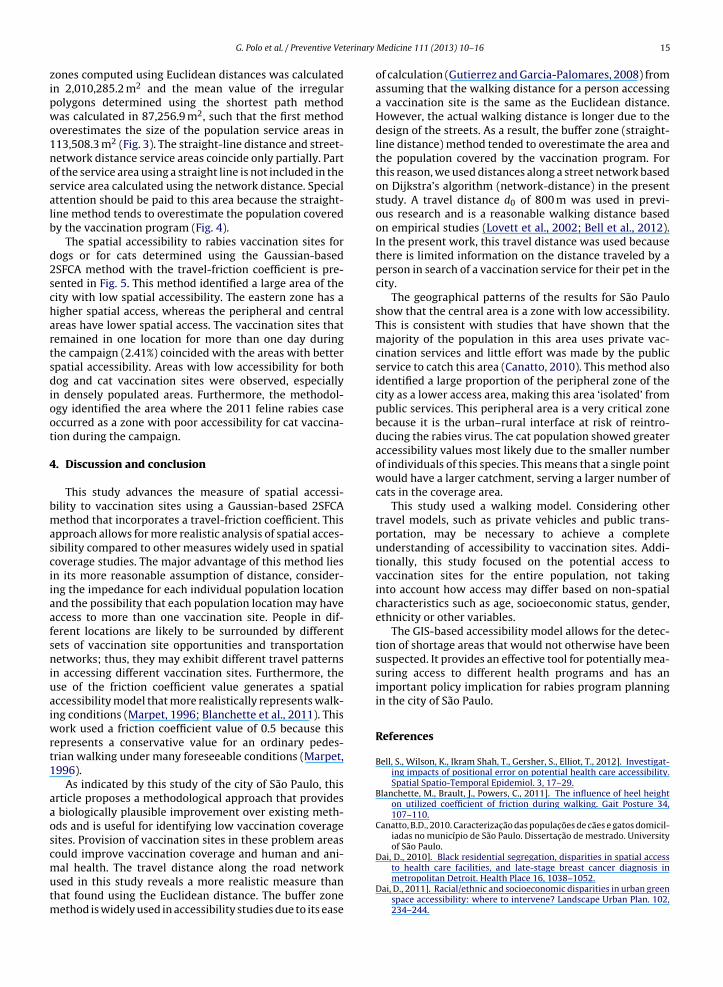
Fig. 5. Spatial accessibility for (a) dogs and (b) cats to vaccination sites in the city of São Paulo using the Gaussian-based two-step floating catchment areamethod with a travel friction coefficient.
erinary
G. Polo et al. / Preventive Vetzones computed using Euclidean distances was calculatedin 2,010,285.2 m2 and the mean value of the irregularpolygons determined using the shortest path methodwas calculated in 87,256.9 m2, such that the first methodoverestimates the size of the population service areas in113,508.3 m2 (Fig. 3). The straight-line distance and street-network distance service areas coincide only partially. Partof the service area using a straight line is not included in theservice area calculated using the network distance. Specialattention should be paid to this area because the straight-line method tends to overestimate the population coveredby the vaccination program (Fig. 4).
The spatial accessibility to rabies vaccination sites fordogs or for cats determined using the Gaussian-based2SFCA method with the travel-friction coefficient is pre-sented in Fig. 5. This method identified a large area of thecity with low spatial accessibility. The eastern zone has ahigher spatial access, whereas the peripheral and centralareas have lower spatial access. The vaccination sites thatremained in one location for more than one day duringthe campaign (2.41%) coincided with the areas with betterspatial accessibility. Areas with low accessibility for bothdog and cat vaccination sites were observed, especiallyin densely populated areas. Furthermore, the methodol-ogy identified the area where the 2011 feline rabies caseoccurred as a zone with poor accessibility for cat vaccina-tion during the campaign.
4. Discussion and conclusion
This study advances the measure of spatial accessi-bility to vaccination sites using a Gaussian-based 2SFCAmethod that incorporates a travel-friction coefficient. Thisapproach allows for more realistic analysis of spatial acces-sibility compared to other measures widely used in spatialcoverage studies. The major advantage of this method liesin its more reasonable assumption of distance, consider-ing the impedance for each individual population locationand the possibility that each population location may haveaccess to more than one vaccination site. People in dif-ferent locations are likely to be surrounded by differentsets of vaccination site opportunities and transportationnetworks; thus, they may exhibit different travel patternsin accessing different vaccination sites. Furthermore, theuse of the friction coefficient value generates a spatialaccessibility model that more realistically represents walk-ing conditions (Marpet, 1996; Blanchette et al., 2011). Thiswork used a friction coefficient value of 0.5 because thisrepresents a conservative value for an ordinary pedes-trian walking under many foreseeable conditions (Marpet,1996).
As indicated by this study of the city of São Paulo, thisarticle proposes a methodological approach that providesa biologically plausible improvement over existing meth-ods and is useful for identifying low vaccination coveragesites. Provision of vaccination sites in these problem areascould improve vaccination coverage and human and ani-
mal health. The travel distance along the road networkused in this study reveals a more realistic measure thanthat found using the Euclidean distance. The buffer zonemethod is widely used in accessibility studies due to its easeMedicine 111 (2013) 10– 16 15
of calculation (Gutierrez and Garcia-Palomares, 2008) fromassuming that the walking distance for a person accessinga vaccination site is the same as the Euclidean distance.However, the actual walking distance is longer due to thedesign of the streets. As a result, the buffer zone (straight-line distance) method tended to overestimate the area andthe population covered by the vaccination program. Forthis reason, we used distances along a street network basedon Dijkstra’s algorithm (network-distance) in the presentstudy. A travel distance d0 of 800 m was used in previ-ous research and is a reasonable walking distance basedon empirical studies (Lovett et al., 2002; Bell et al., 2012).In the present work, this travel distance was used becausethere is limited information on the distance traveled by aperson in search of a vaccination service for their pet in thecity.
The geographical patterns of the results for São Pauloshow that the central area is a zone with low accessibility.This is consistent with studies that have shown that themajority of the population in this area uses private vac-cination services and little effort was made by the publicservice to catch this area (Canatto, 2010). This method alsoidentified a large proportion of the peripheral zone of thecity as a lower access area, making this area ‘isolated’ frompublic services. This peripheral area is a very critical zonebecause it is the urban–rural interface at risk of reintro-ducing the rabies virus. The cat population showed greateraccessibility values most likely due to the smaller numberof individuals of this species. This means that a single pointwould have a larger catchment, serving a larger number ofcats in the coverage area.
This study used a walking model. Considering othertravel models, such as private vehicles and public trans-portation, may be necessary to achieve a completeunderstanding of accessibility to vaccination sites. Addi-tionally, this study focused on the potential access tovaccination sites for the entire population, not takinginto account how access may differ based on non-spatialcharacteristics such as age, socioeconomic status, gender,ethnicity or other variables.
The GIS-based accessibility model allows for the detec-tion of shortage areas that would not otherwise have beensuspected. It provides an effective tool for potentially mea-suring access to different health programs and has animportant policy implication for rabies program planningin the city of São Paulo.
References
Bell, S., Wilson, K., Ikram Shah, T., Gersher, S., Elliot, T., 2012]. Investigat-ing impacts of positional error on potential health care accessibility.Spatial Spatio-Temporal Epidemiol. 3, 17–29.
Blanchette, M., Brault, J., Powers, C., 2011]. The influence of heel heighton utilized coefficient of friction during walking. Gait Posture 34,107–110.
Canatto, B.D., 2010. Caracterizac ão das populac ões de cães e gatos domicil-iadas no município de São Paulo. Dissertac ão de mestrado. Universityof São Paulo.
Dai, D., 2010]. Black residential segregation, disparities in spatial access
to health care facilities, and late-stage breast cancer diagnosis inmetropolitan Detroit. Health Place 16, 1038–1052.Dai, D., 2011]. Racial/ethnic and socioeconomic disparities in urban greenspace accessibility: where to intervene? Landscape Urban Plan. 102,234–244.
1 erinary
D
D
G
G
I
J
K
L
L
L
6 G. Polo et al. / Preventive Vet
iaz, A., Papo, S., Rodriguez, A., Smith, J.S., 1994]. Antigenic analysis ofrabies-virus isolates from Latin America and the Caribbean. Zbl. Vet.41, 153–160.
ijkstra, E., 1959]. A note on two problems in connection with graphs.Numer. Math. l, 269–27I.
uagliardo, M.F., 2004]. Spatial accessibility of primary care: concept,methods and challenges. Int. J. Health Geogr. 3, 3.
utierrez, J., Garcia-Palomares, 2008]. Distance measure impacts on thecalculation of transport service areas using GIS. Environ. Plan. B: Plan.Des. 35, 480–503.
BGE. Instituto Brasileiro de Geografia e Estatística, 2010. Censo popula-cional. São Paulo.
oseph, A., Bantock, R., 1982]. Measuring potential physical accessibilityto general practitioners in rural areas: a method and case study. Soc.Sci. Med. 16 (1), 85e90.
han, A., 1992]. An integrated approach to measuring potential spa-tial access to health care services. Socio-Econ. Plan. Sci. 26 (4),275e287.
angford, M., Higgs, G., 2006]. Measuring potential access to primaryhealth care services: the influence of alternative spatial representa-tions of population. Prof. Geogr. 58, 294–306.
ovett, A., Haynes, R., Sunnenberg, G., Gale, S., 2002]. Car travel time
and accessibility by bus to general practitioner services: a study usingpatient registers and GIS. Soc. Sci. Med. 55, 97–111.uo, W., Qi, Y., 2009]. An enhanced two-step floating catchment area(E2SFCA) method for measuring spatial accessibility to primary carephysicians. Health Place 15, 1100–1107.
Medicine 111 (2013) 10– 16
Luo, W., Wang, F., 2003]. Measures of spatial accessibility to health care ina GIS environment: synthesis and a case study in the Chicago region.Environ. Plan. B: Plan. Des. 30, 865–884.
Luo, W., Whippo, T., 2012]. Variable catchment sizes for the two-stepfloating catchment area (2SFCA) method. Health Place 18, 189–795.
Marpet, M., 1996]. On threshold values that separate pedestrian walkwaysthat are slip resistant form those that are not. J. Foren. Sci. 5, 747–755.
Radke, J., Mu, L., 2000]. Spatial decomposition, modeling and mappingservice regions to predict access to social programs. Geogr. Inform.Sci. 6, 105–112.
São Paulo, 2009. http://www.prefeitura.sp.gov.br/cidade/secretarias/saude/vigilanciaemsaude/controledezoonoses/raivaanimal/index.php?p=5435
Sato, G., Tanabe, H., Shoji, Y., Itou, T., Ito, F., Sato, T., Sakai, T., 2005]. Rapiddiscrimination of rabies viruses isolated from various host species inBrazil by multiplex reverse transcription polymerase chain reaction.J. Clin. Virol. 33, 267–273.
Wan, N., Benjamin Zhan, F., Zou, B., Chow, E., 2012]. A relative spatialaccess assessment approach for analyzing potential spatial access tocolorectal cancer services in Texas. Appl. Geogr. 32, 191–299.
Wang, L., 2007]. Immigration, ethnicity, and accessibility to culturallydiverse family physicians. Health Place 13, 656–671.
Wang, F., McLafferty, S., Escamilla, V., Luo, L., 2008]. Late-stage breast
cancer diagnosis and health care access in Illionois. Prof. Geogr. 60,54–69.Yang, D., George, R., Mullner, R., 2006]. Comparing GIS-based methodsof measuring spatial accessibility to health services. J. Med. Syst. 30,23–32.