Southern California's Nonprofit Sector - CalNonprofits
154
Southern California’s Nonprot Sector Kathleen Costello Gianneschi Center for Nonprot Research California State University, Fullerton Peter B. Manzo Center for Nonprot Management
-
Upload
khangminh22 -
Category
Documents
-
view
0 -
download
0
Transcript of Southern California's Nonprofit Sector - CalNonprofits

Southern California’sNonprofi t SectorKathleen CostelloGianneschi Center for Nonprofi t ResearchCalifornia State University, Fullerton
Peter B. ManzoCenter for Nonprofi t Management
Southern California’sNonprofit Sector
Kathleen Costello
Peter B. Manzo
Roger Morton, Ph.D., AICP
John Gregory Valenzuela, CPA
Acknowledgments
Advisors
Research Associates
Research Collaborators
Graphic Design
Production Assistants

vCenter for Nonprofit Management
Southern California’s Nonprofit Sector
Contents
Foreword xvExecutive Summary 1
The Numbers ..............................................................................................................1Place ...........................................................................................................................2Large Organizations Dominate ...................................................................................3Economic and Payroll Impact .....................................................................................3
Southern California and Its Nonprofit Sector 5The Southern California Region ....................................................................................... 5
Southern California’s Nonprofit Sector: A Glass Half-Full ...........................................7The Nonprofit Sector in California and the U.S. ............................................................... 7The Nonprofit Sector in Southern California ..................................................................... 8
Service Categories: Types of Nonprofits .................................................................................11Revenues, Assets and Expenses ...........................................................................................13Size: Most Nonprofits Small, but Very Large Nonprofits Dominate .........................................17Economic and Employment Impact ........................................................................................19
So What? Implications for Future Action ...................................................................22Prospects for Coordinating Efforts: “It’s a Small World” ................................................. 23The Possibility and Necessity of Segmenting the Sector by Size and Service Field ..... 23Mapping the Fit Between Needs and Resources ........................................................... 24A Note About Methods .................................................................................................... 26
Characteristics by County 29Los Angeles County ..................................................................................................29
Service Categories ......................................................................................................... 29Resources ...................................................................................................................... 30
Revenues and Assets .............................................................................................................30Contributions ...........................................................................................................................31
Expenses ........................................................................................................................ 32Employment ............................................................................................................................32
Size ................................................................................................................................ 32Orange County .........................................................................................................34
Service Categories ......................................................................................................... 34Resources ...................................................................................................................... 35
Revenues and Assets .............................................................................................................35Employment ............................................................................................................................35Expenses ................................................................................................................................36Contributions ...........................................................................................................................36
Size ................................................................................................................................ 37Comparison with Previous Results ................................................................................. 39
Riverside County ......................................................................................................40Service Categories ......................................................................................................... 40Resources ...................................................................................................................... 41
Revenues and Assets .............................................................................................................41Contributions ...........................................................................................................................42
vi Gianneschi Center for Nonprofit Research at CSU Fullerton
Southern California’s Nonprofit Sector
Contents, continued
Expenses ........................................................................................................................ 43Employment ............................................................................................................................43
Size ................................................................................................................................ 43San Bernardino County ............................................................................................45
Service Categories ......................................................................................................... 45Resources ...................................................................................................................... 46
Revenues and Assets .............................................................................................................46Contributions ...........................................................................................................................47
Expenses ........................................................................................................................ 48Employment ............................................................................................................................48
Size ................................................................................................................................ 48San Diego County .....................................................................................................50
Service Categories ......................................................................................................... 50Resources ...................................................................................................................... 51
Revenues and Assets .............................................................................................................51Contributions ...........................................................................................................................52
Expenses ........................................................................................................................ 53Employment ............................................................................................................................53
Size ................................................................................................................................ 53Santa Barbara County ..............................................................................................55
Service Categories ......................................................................................................... 55Resources ...................................................................................................................... 56
Revenues and Assets .............................................................................................................56Contributions ...........................................................................................................................57
Expenses ........................................................................................................................ 58Employment ............................................................................................................................58
Size ................................................................................................................................ 58Ventura County .........................................................................................................60
Service Categories ......................................................................................................... 60Resources ...................................................................................................................... 61
Revenues and Assets .............................................................................................................61Contributions ...........................................................................................................................62
Expenses ........................................................................................................................ 63Employment ............................................................................................................................63
Size ................................................................................................................................ 63Characteristics by Service Category 65
Arts, Culture & Humanities .......................................................................................65Characteristics by County .............................................................................................. 66Revenue ......................................................................................................................... 67
Revenue by Size .....................................................................................................................67Revenue by County ................................................................................................................69Revenue Types .......................................................................................................................69
Expenses ........................................................................................................................ 71Expenses by County ...............................................................................................................71Expenses of Itemizers .............................................................................................................72Expenses by Size ...................................................................................................................73
viiCenter for Nonprofit Management
Southern California’s Nonprofit Sector
Assets ............................................................................................................................. 74Education ..................................................................................................................76
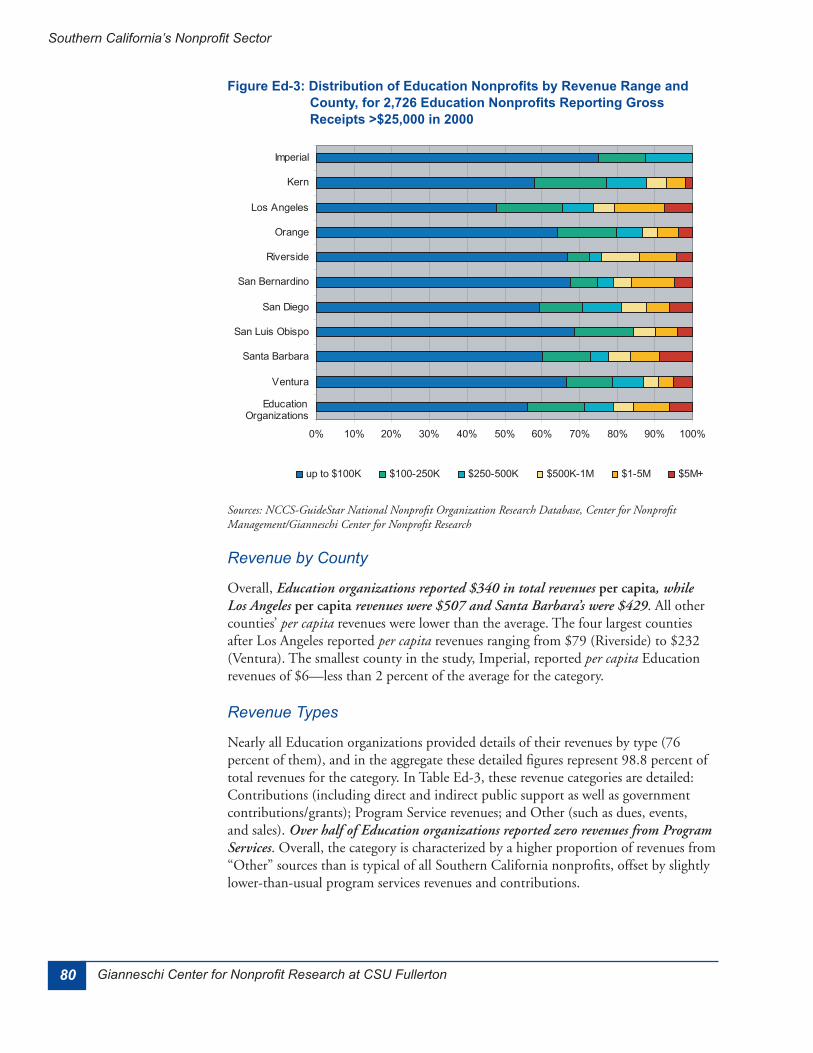
Characteristics by County .............................................................................................. 77Revenue ......................................................................................................................... 78
Revenue by Size .....................................................................................................................78Revenue by County ................................................................................................................80Revenue Types .......................................................................................................................80
Expenses ........................................................................................................................ 82Expenses by County ...............................................................................................................83Expenses of Itemizers .............................................................................................................83Expenses by Size ...................................................................................................................84
Assets ............................................................................................................................. 86Environment & Animals .............................................................................................88
Characteristics by County .............................................................................................. 89Revenue ......................................................................................................................... 90
Revenue by Size .....................................................................................................................90Revenue by County ................................................................................................................92Revenue Types .......................................................................................................................92
Expenses ........................................................................................................................ 94Expenses by County ...............................................................................................................95Expenses of Itemizers .............................................................................................................95Expenses by Size ...................................................................................................................96
Assets ............................................................................................................................. 97Health .......................................................................................................................99
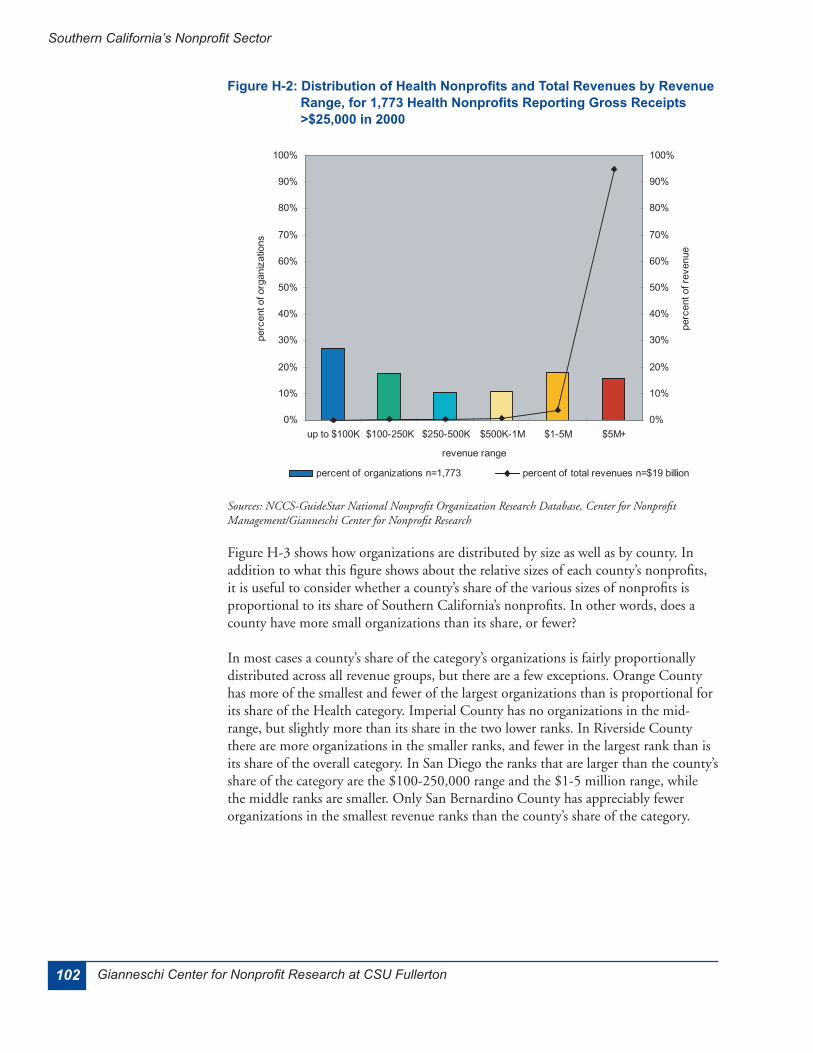
Characteristics by County ............................................................................................ 100Revenue ....................................................................................................................... 101
Revenue by Size ...................................................................................................................101Revenue by County ..............................................................................................................103Revenue Types .....................................................................................................................103
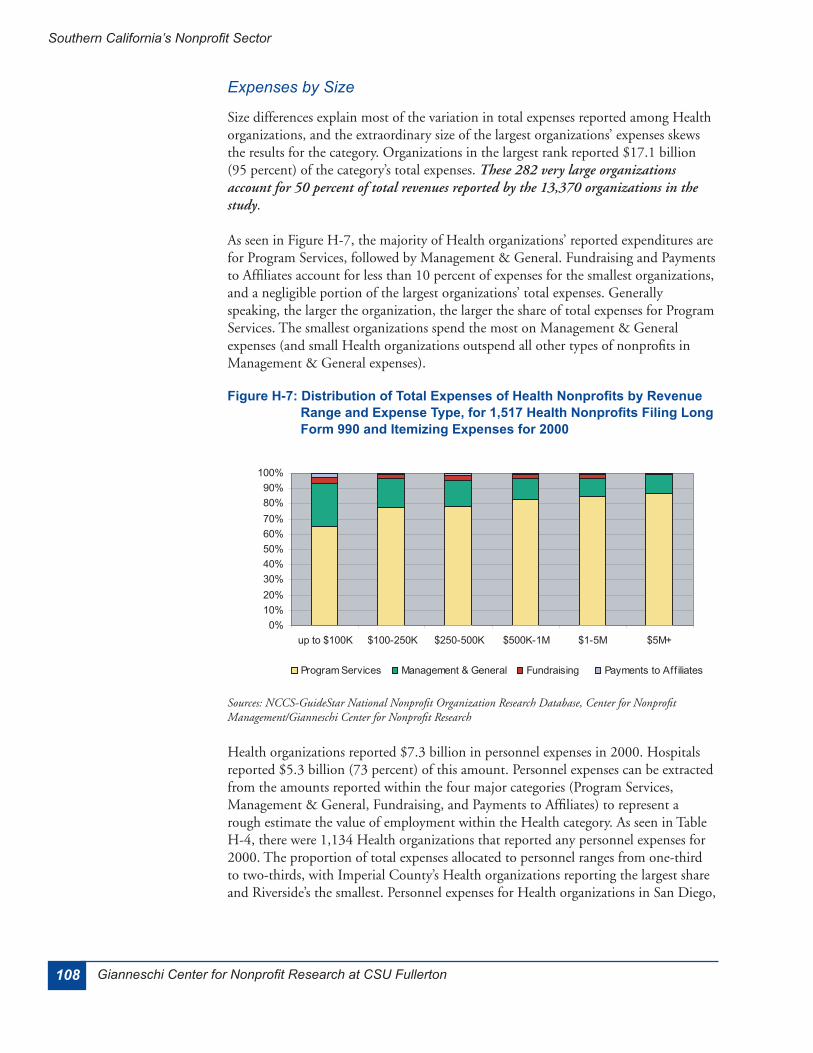
Expenses ...................................................................................................................... 106Expenses by County .............................................................................................................106Expenses of Itemizers ...........................................................................................................107Expenses by Size .................................................................................................................108
Assets ........................................................................................................................... 109Human Services ..................................................................................................... 111
Characteristics by County .............................................................................................112Revenue ........................................................................................................................113
Revenue by Size ...................................................................................................................113Revenue by County ..............................................................................................................115Revenue Types .....................................................................................................................115
Expenses .......................................................................................................................117Expenses by County .............................................................................................................118Expenses of Itemizers ...........................................................................................................118Expenses by Size .................................................................................................................119
Assets ........................................................................................................................... 121
Contents, continued
viii Gianneschi Center for Nonprofit Research at CSU Fullerton
Southern California’s Nonprofit Sector
Religious .................................................................................................................123Characteristics by County ............................................................................................ 124Revenue ....................................................................................................................... 125
Revenue by Size ...................................................................................................................125Revenue by County ..............................................................................................................127Revenue Types .....................................................................................................................127
Expenses ...................................................................................................................... 129Expenses by County .............................................................................................................130Expenses of Itemizers ...........................................................................................................130Expenses by Size .................................................................................................................131
Assets ........................................................................................................................... 132Appendix: National Taxonomy of Exempt Entities 135
Contents, continued
ixCenter for Nonprofit Management
Southern California’s Nonprofit Sector
FiguresFigure 1: Reporting Nonprofits per 10,000 Residents in 1998 ...........................................................8Figure 2: Nonprofits and Resources by County .................................................................................9Figure 3: Distribution of Nonprofits and Total Revenues per 10,000 Residents ................................9Figure 4: Median Total Revenues and Total Assets by County ........................................................10Figure 5: Distribution of Nonprofits by County Revenue Range ......................................................11Figure 6: Distribution of Nonprofits by Service Category .................................................................11Figure 7: Southern California and U.S. Nonprofits by Service Category .........................................12Figure 8: Distribution of Nonprofits by County and Service Category .............................................12Figure 9: Distribution of Nonprofits and Resources by Service Category ........................................13Figure 10: Median Revenues and Assets by Service Category .........................................................14Figure 11: Total Revenues, with Hospitals & Universities Detailed, in $M (Total $38 billion) ............14Figure 12: Revenue Comparison: Hospitals & Universities v. All Other Charities .............................15Figure 13: Nonprofit Revenue Mix by Revenue Range .....................................................................15Figure 14: Nonprofit Revenue Mix by Service Category ....................................................................16Figure 15: Distribution of Itemizers’ Expenses by Service Categories ..............................................17Figure 16: Distribution of Nonprofits by Revenue Range and Total Revenues ..................................18Figure 17: Nonprofit Share of GDP ....................................................................................................19Figure 18: Share of Personnel Expenses by Service Category and Revenue Range .......................20Figure 19: Personnel Expenses by Service Category (Total $13.6 billion) ........................................21Figure 20: Distribution of Personnel Expenses by County (Total $13.6 billion) .................................21Figure 21: Per Capita Nonprofit Revenue by County ........................................................................24Figure 22: Health and Human Services Revenues per Resident Below Poverty Level .....................25Figure 23: Example: After-School Programs/Income in Council District ............................................25Figure LA-1: Los Angeles County Religious, Educational and Charitable Nonprofits Reporting
over $25,000 in Gross Receipts in 2000 by NTEE Major Category;; Total: 6,398 .............30Figure LA-2: Distribution of Los Angeles County Nonprofit Resources by Service Category ...............31Figure LA-3: Revenue Mix by Service Category for Los Angeles County Nonprofits ............................31Figure LA-4: Distribution of Los Angeles County Nonprofits by Revenue Range and Service
Category;; Total: 6,398 ......................................................................................................33Figure OC-1: Orange County Religious, Educational and Charitable Nonprofits Reporting over
$25,000 in Gross Receipts in 2000 by NTEE Major Category;; Total: 1,899 .....................35Figure OC-2: Distribution of Orange County Nonprofit Resources by Service Category .......................36Figure OC-3: Revenue Mix by Service Category for Orange County Nonprofits ...................................37Figure OC-4: Distribution of Orange County Nonprofits by Revenue Range and Service
Category;; Total: 1,899 ......................................................................................................38Figure R-1: Riverside County Religious, Educational and Charitable Nonprofits Reporting over
$25,000 in Gross Receipts in 2000 by NTEE Major Category;; Total: 689 ........................41Figure R-2: Distribution of Riverside County Nonprofit Resources by Service Category ....................42Figure R-3: Revenue Mix by Service Category for Riverside County Nonprofits ................................42Figure R-4: Distribution of Riverside County Nonprofits by Revenue Range and Service
Category;; Total: 689 .........................................................................................................44Figure SBe-1: San Bernardino County Religious, Educational and Charitable Nonprofits Reporting
over $25,000 in Gross Receipts in 2000 by NTEE Major Category;; Total: 760 ................46Figure SBe-2: Distribution of San Bernardino County Nonprofit Resources by Service Category ..........47Figure SBe-3: Revenue Mix by Service Category for San Bernardino County Nonprofits ......................48Figure SBe-4: Distribution of San Bernardino County Nonprofits by Revenue Range and Service
Category;; Total: 760 .........................................................................................................49
x Gianneschi Center for Nonprofit Research at CSU Fullerton
Southern California’s Nonprofit Sector
Figures, continued
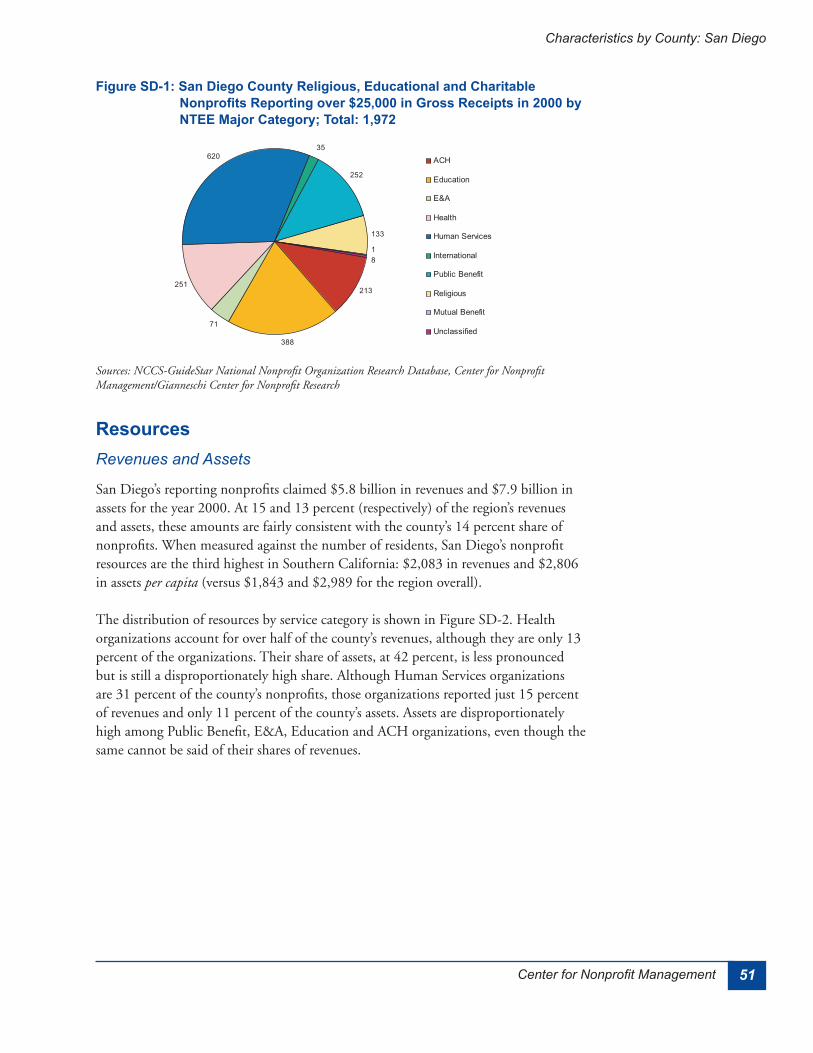
Figure SD-1: San Diego County Religious, Educational and Charitable Nonprofits Reporting over $25,000 in Gross Receipts in 2000 by NTEE Major Category;; Total: 1,972 .....................51
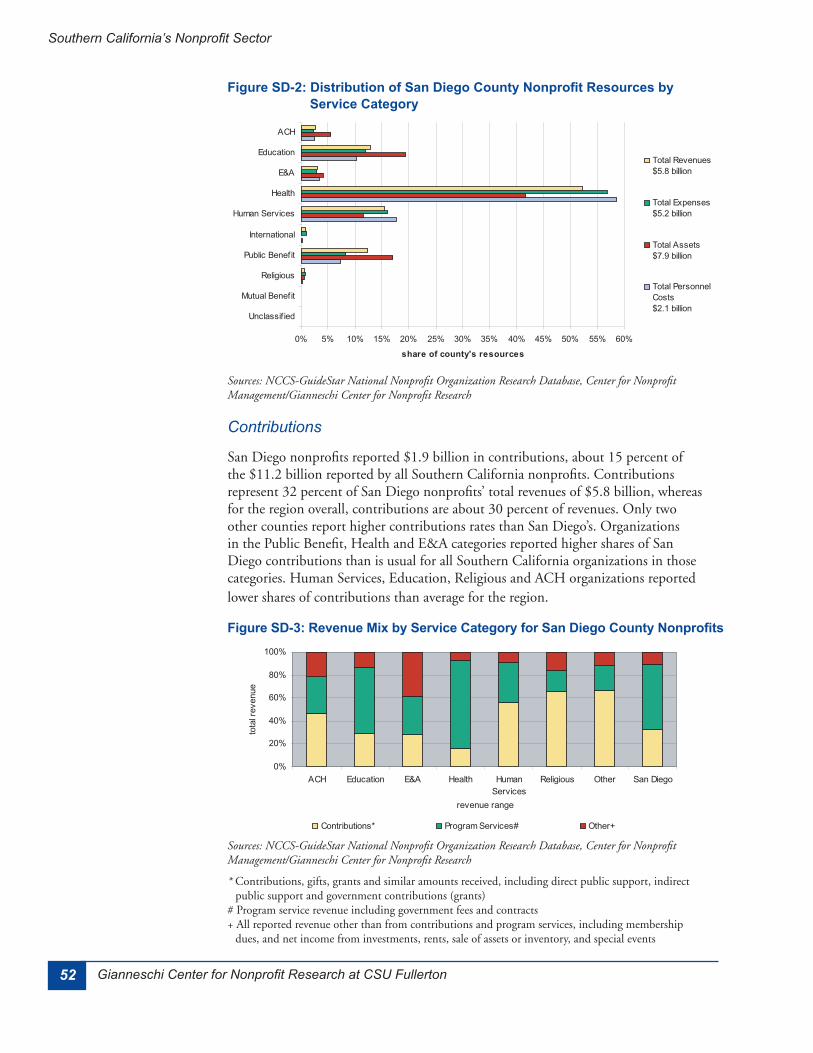
Figure SD-2: Distribution of San Diego County Nonprofit Resources by Service Category ..................52Figure SD-3: Revenue Mix by Service Category for San Diego County Nonprofits ..............................52Figure SD-4: Distribution of San Diego County Nonprofits by Revenue Range and Service
Category;; Total: 1,972 ......................................................................................................54Figure SBa-1: Santa Barbara County Religious, Educational and Charitable Nonprofits Reporting
over $25,000 in Gross Receipts in 2000 by NTEE Major Category;; Total: 561 ................56Figure SBa-2: Distribution of Santa Barbara County Nonprofit Resources by Service Category ............57Figure SBa-3: Revenue Mix by Service Category for Santa Barbara County Nonprofits ........................57Figure SBa-4: Distribution of Santa Barbara County Nonprofits by Revenue Range and Service
Category;; Total: 561 .........................................................................................................59Figure V-1: Ventura County Religious, Educational and Charitable Nonprofits Reporting over
$25,000 in Gross Receipts in 2000 by NTEE Major Category;; Total: 457 ........................61Figure V-2: Distribution of Ventura County Nonprofit Resources by Service Category .......................62Figure V-3: Revenue Mix by Service Category for Ventura County Nonprofits ...................................62Figure V-4: Distribution of Ventura County Nonprofits by Revenue Range and Service
Category;; Total: 457 .........................................................................................................64Figure ACH-1: Types of Nonprofits in the ACH Category, for 1,451 ACH Nonprofits Reporting Gross
Receipts >$25,000 in 2000 ...............................................................................................66Figure ACH-2: Distribution of ACH Nonprofits and Total Revenues by Revenue Range, for 1,451
ACH Nonprofits Reporting Gross Receipts >$25,000 in 2000 .........................................68Figure ACH-3: Distribution of ACH Nonprofits by Revenue Range and County, for 1,451 ACH
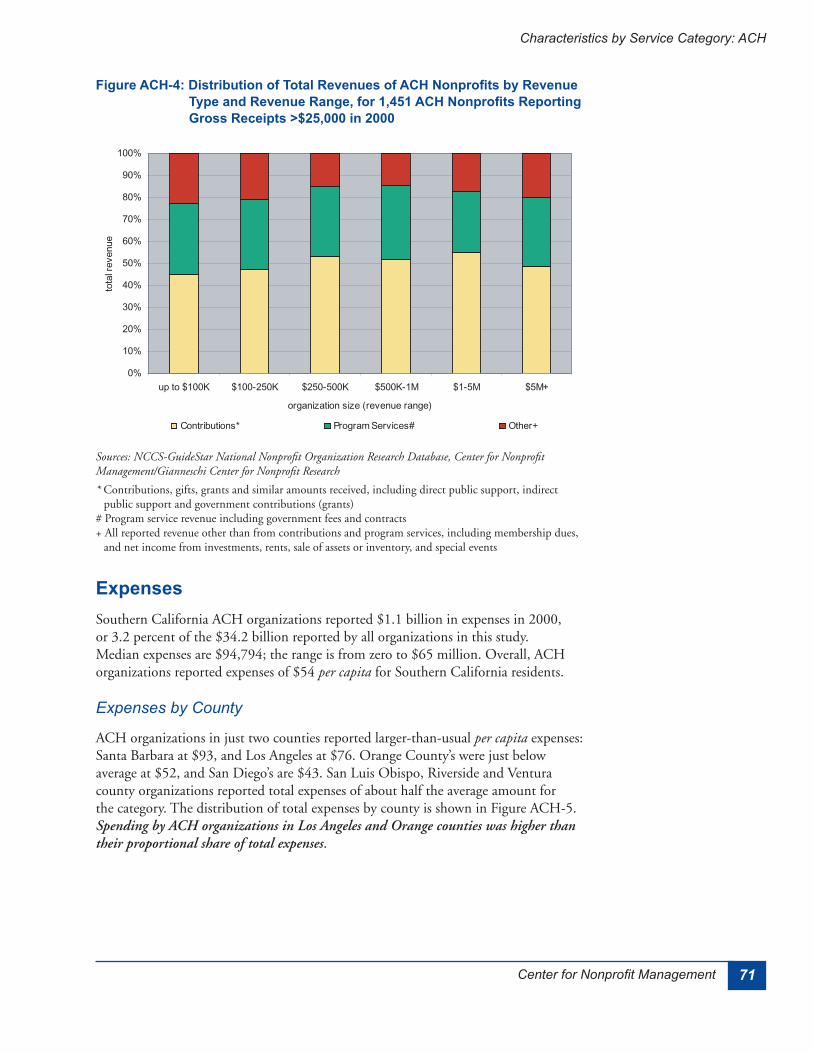
Nonprofits Reporting Gross Receipts >$25,000 in 2000 ..................................................69Figure ACH-4: Distribution of Total Revenues of ACH Nonprofits by Revenue Type and Revenue
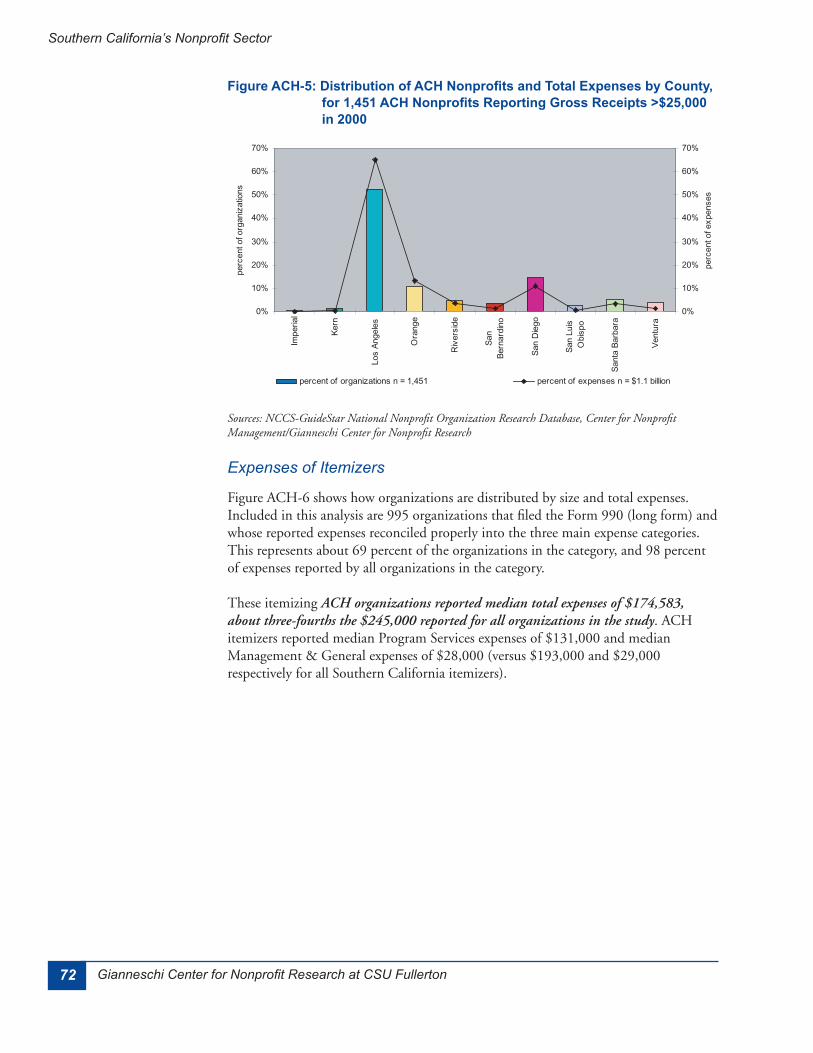
Range, for 1,451 ACH Nonprofits Reporting Gross Receipts >$25,000 in 2000 ..............71Figure ACH-5: Distribution of ACH Nonprofits and Total Expenses by County, for 1,451 ACH
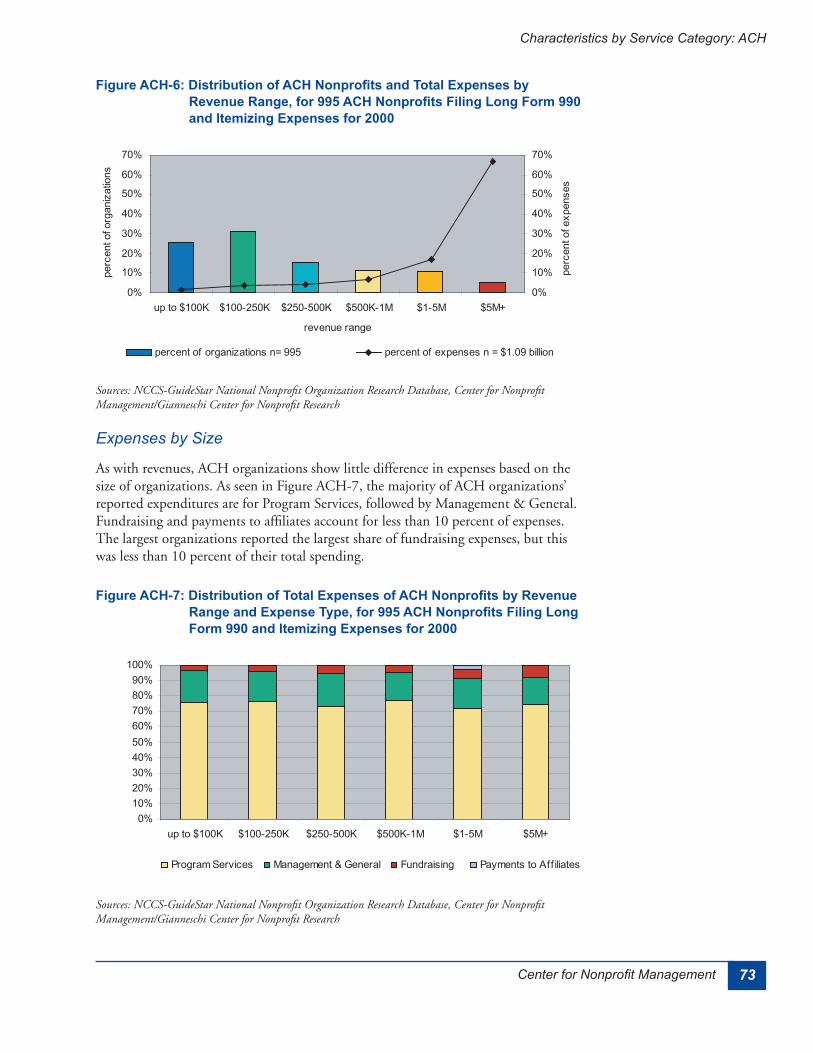
Nonprofits Reporting Gross Receipts >$25,000 in 2000 ..................................................72Figure ACH-6: Distribution of ACH Nonprofits and Total Expenses by Revenue Range, for 995
ACH Nonprofits Filing Long Form 990 and Itemizing Expenses for 2000 ........................73Figure ACH-7: Distribution of Total Expenses of ACH Nonprofits by Revenue Range and Expense
Type, for 995 ACH Nonprofits Filing Long Form 990 and Itemizing Expenses for 2000 ..................................................................................................................................73
Figure ACH-8: Comparison of Total Assets Relative to Total Revenues and Total Expenses, for 1,451 ACH Nonprofits Reporting Gross Receipts >$25,000 in 2000 ................................75
Figure Ed-1: Types of Nonprofits in the Education Category for 2,726 Education Nonprofits Reporting Gross Receipts >$25,000 in 2000 ...................................................................76
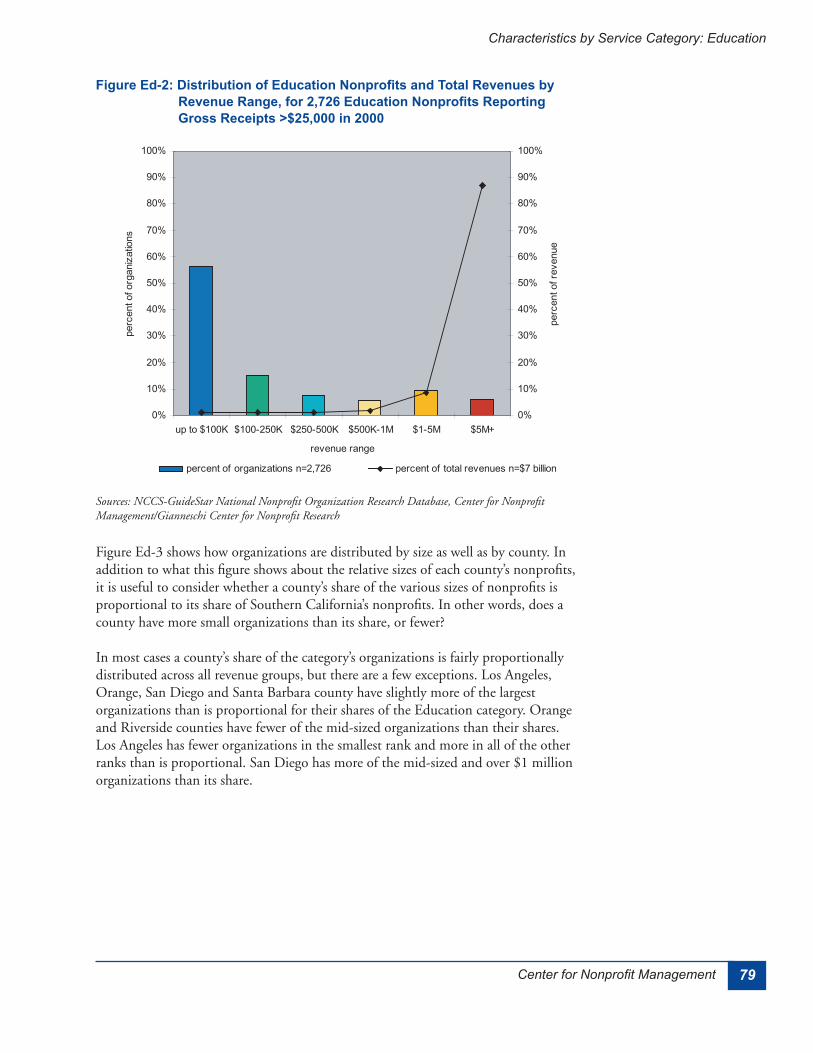
Figure Ed-2: Distribution of Education Nonprofits and Total Revenues by Revenue Range, for 2,726 Education Nonprofits Reporting Gross Receipts >$25,000 in 2000 .......................79
Figure Ed-3: Distribution of Education Nonprofits by Revenue Range and County, for 2,726 Education Nonprofits Reporting Gross Receipts >$25,000 in 2000 .................................80
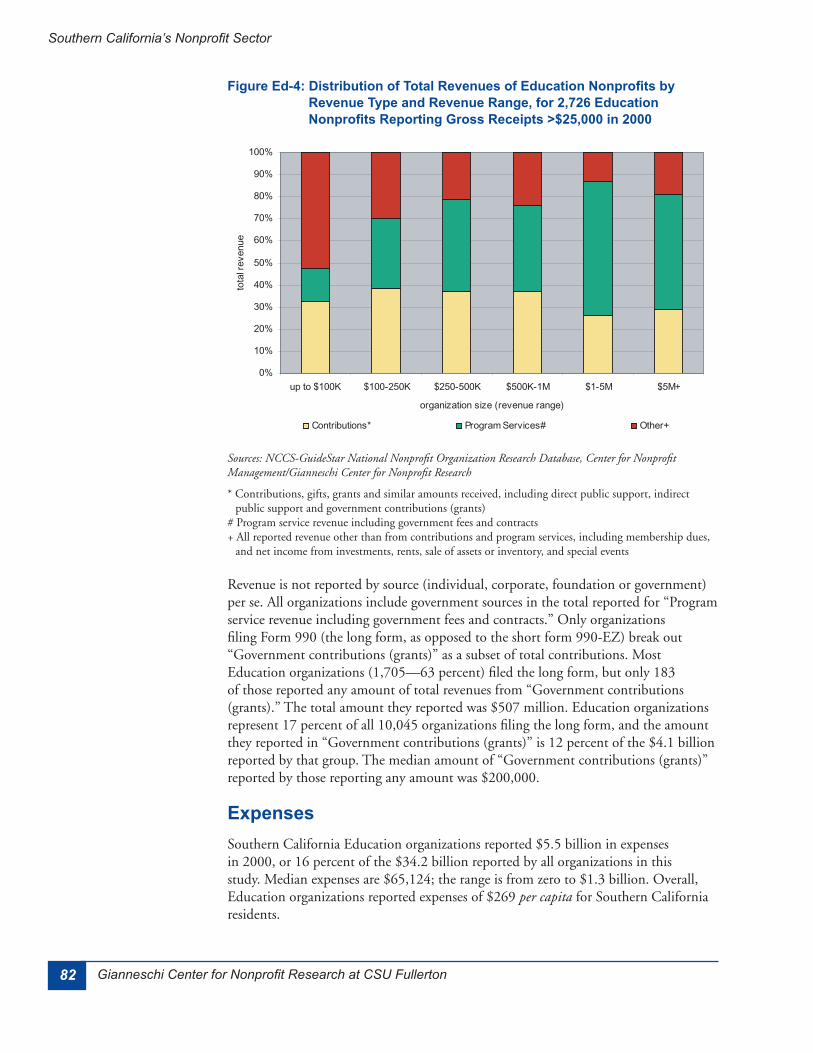
Figure Ed-4: Distribution of Total Revenues of Education Nonprofits by Revenue Type and Revenue Range, for 2,726 Education Nonprofits Reporting Gross Receipts >$25,000 in 2000 ..............................................................................................................82
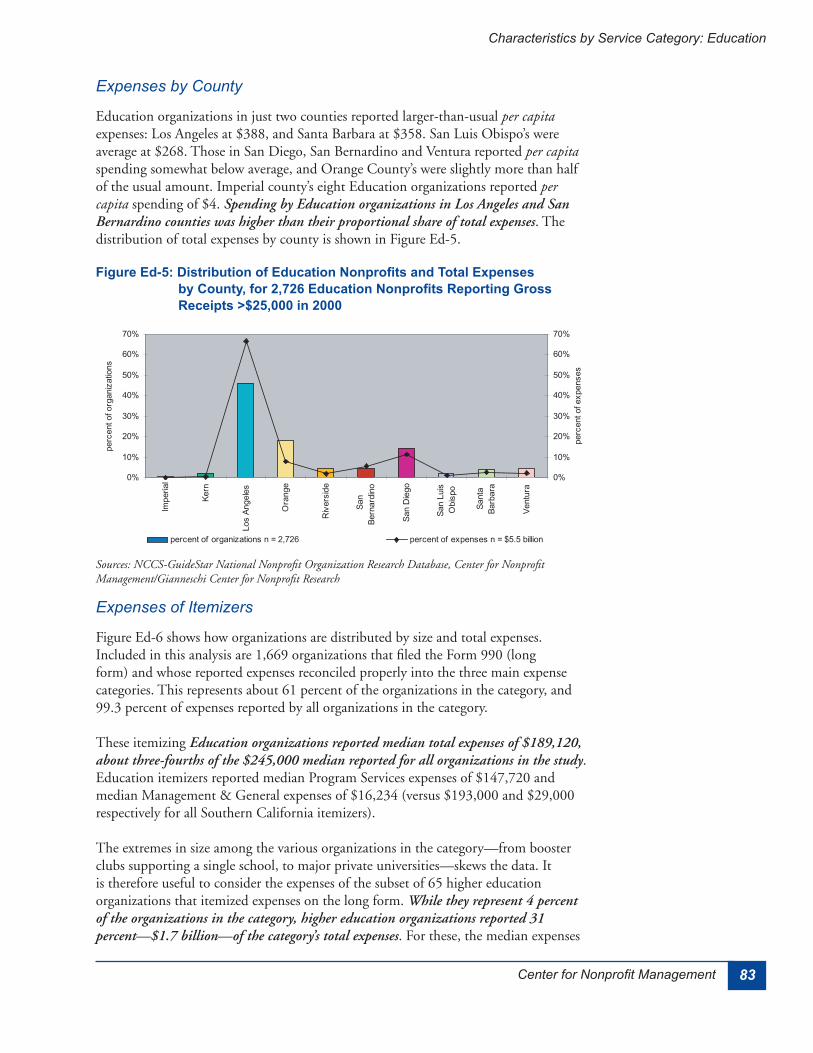
Figure Ed-5: Distribution of Education Nonprofits and Total Expenses by County, for 2,726 Education Nonprofits Reporting Gross Receipts >$25,000 in 2000 .................................83
xiCenter for Nonprofit Management
Southern California’s Nonprofit Sector
Figures, continued
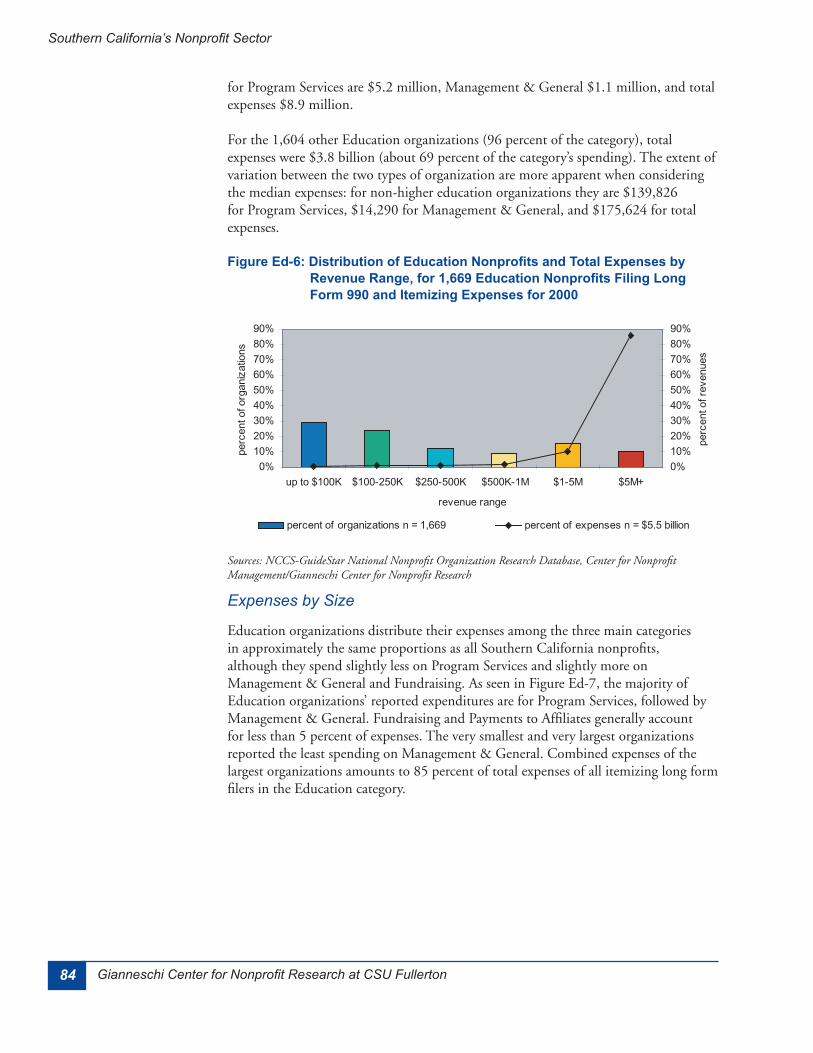
Figure Ed-6: Distribution of Education Nonprofits and Total Expenses by Revenue Range, for 1,669 Education Nonprofits Filing Long Form 990 and Itemizing Expenses for 2000 ..................................................................................................................................84
Figure Ed-7: Distribution of Total Expenses of Education Nonprofits by Revenue Range and Expense Type for 1,669 Education Nonprofits Filing Long Form 990 and Itemizing Expenses for 2000 ................................................................................................................85
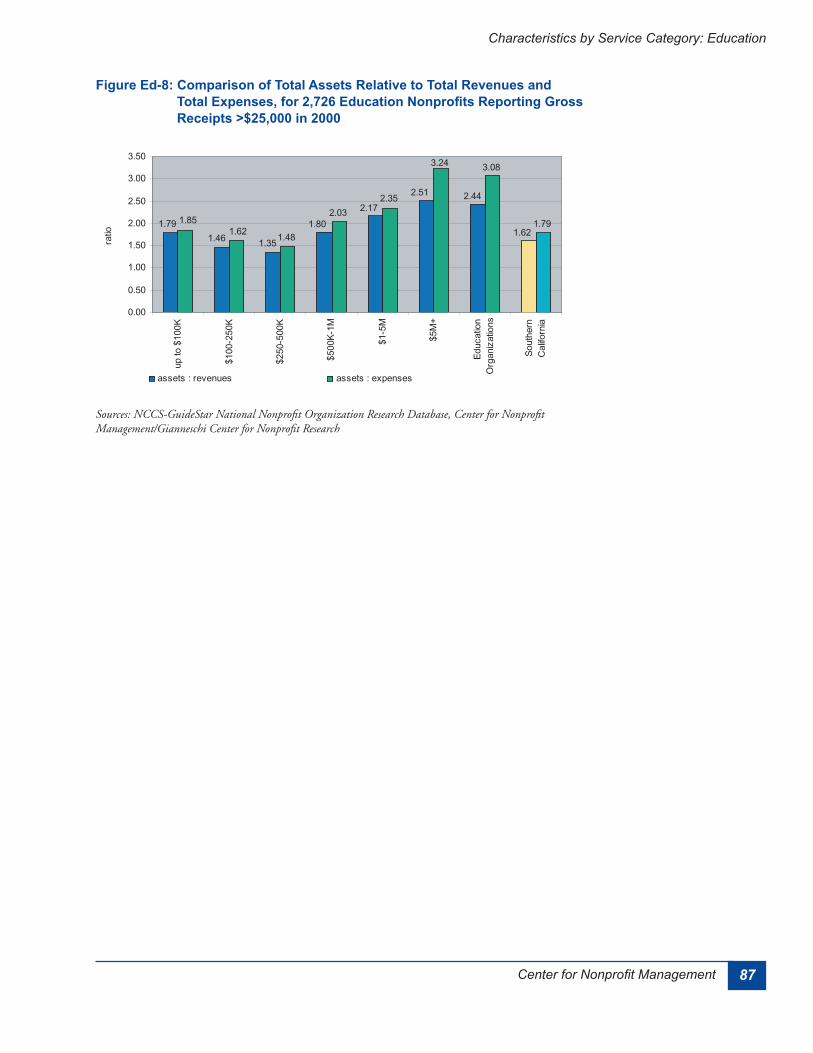
Figure Ed-8: Comparison of Total Assets Relative to Total Revenues and Total Expenses, for 2,726 Education Nonprofits Reporting Gross Receipts >$25,000 in 2000 .......................87
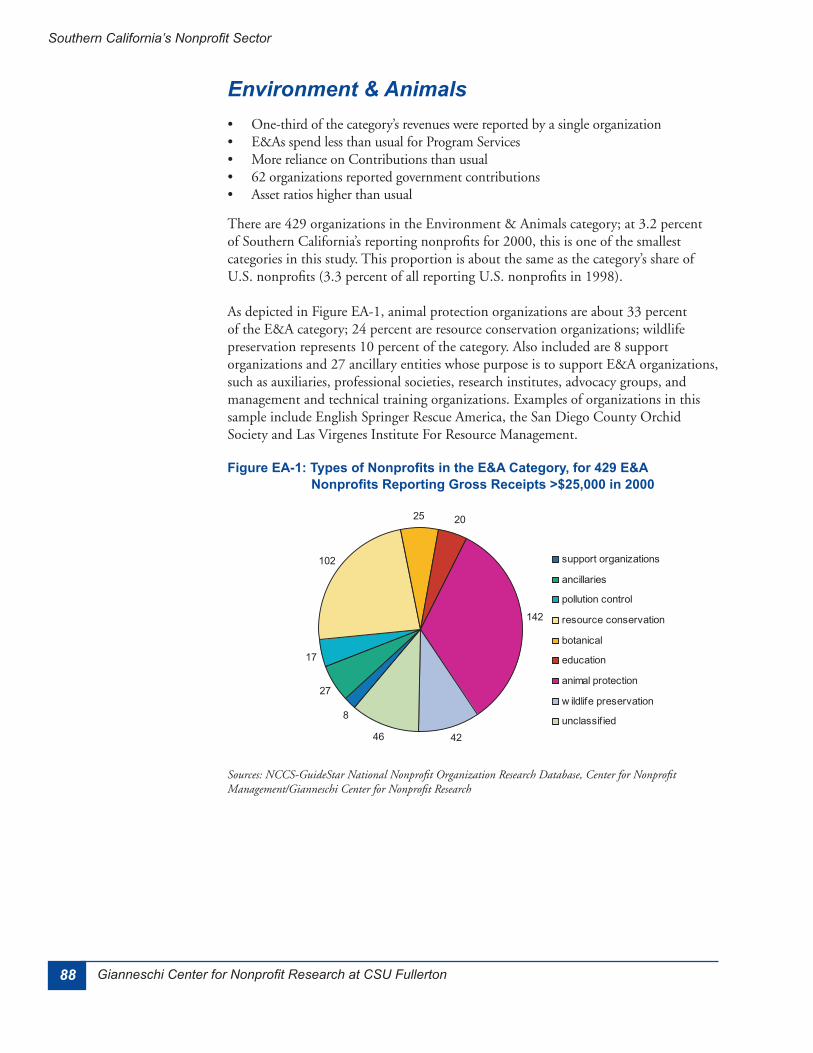
Figure EA-1: Types of Nonprofits in the E&A Category, for 429 E&A Nonprofits Reporting Gross Receipts >$25,000 in 2000 ....................................................................................88
Figure EA-2: Distribution of E&A Nonprofits and Total Revenues by Revenue Range, for 429 E&A Nonprofits Reporting Gross Receipts >$25,000 in 2000 ..........................................91
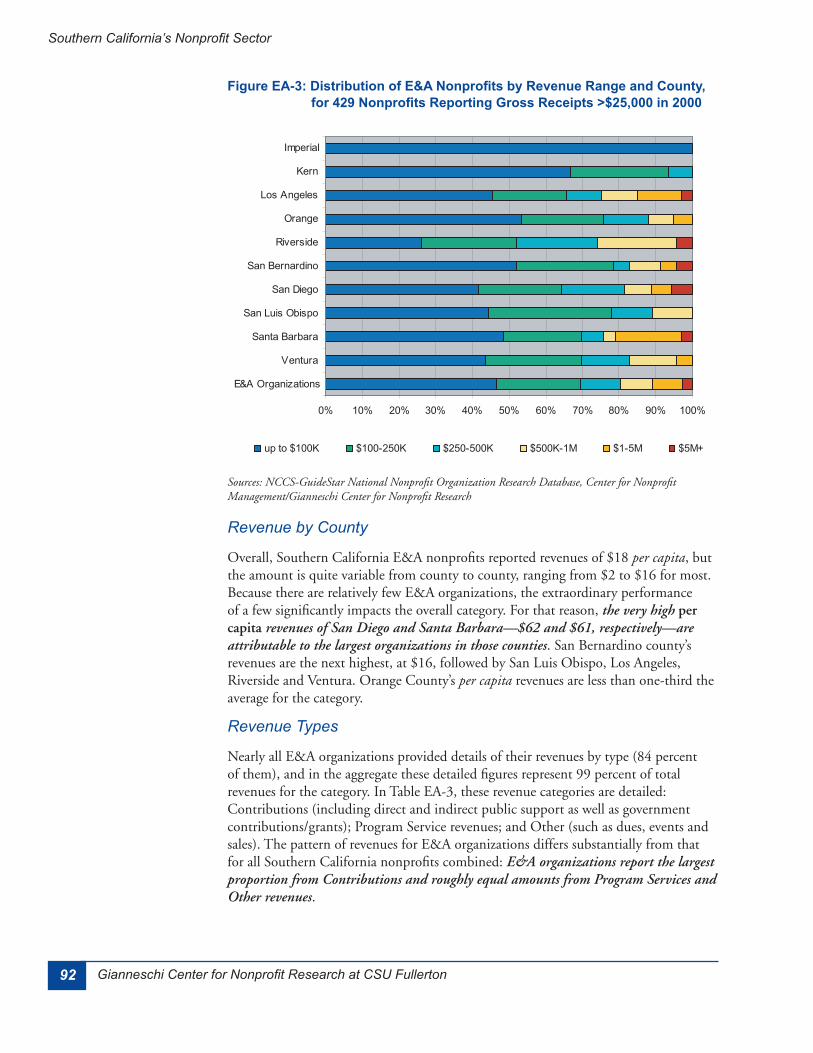
Figure EA-3: Distribution of E&A Nonprofits by Revenue Range and County, for 429 Nonprofits Reporting Gross Receipts >$25,000 in 2000 ...................................................................92
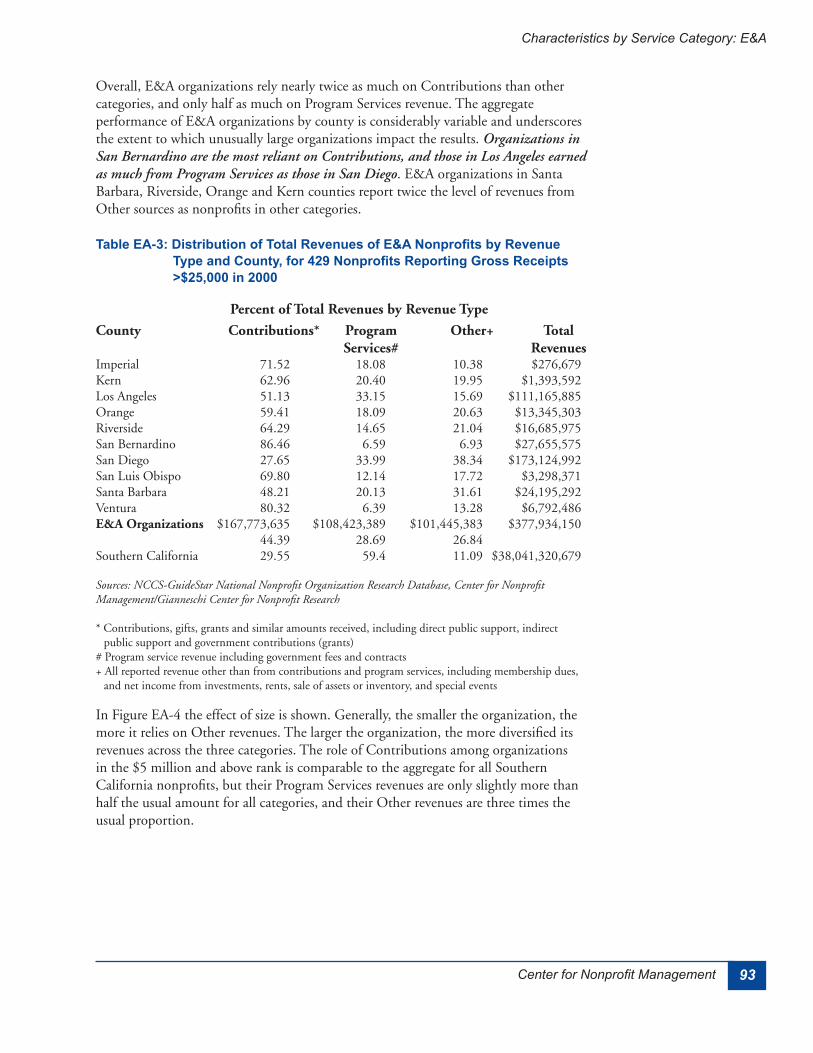
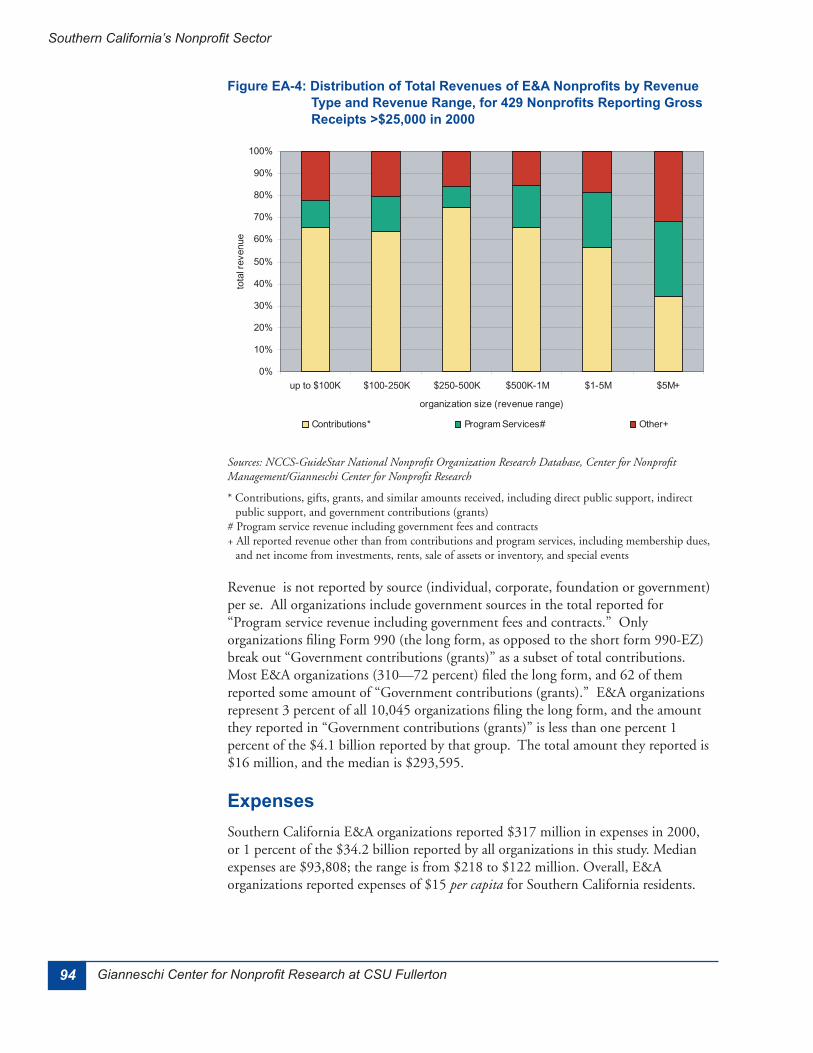
Figure EA-4: Distribution of Total Revenues of E&A Nonprofits by Revenue Type and Revenue Range, for 429 Nonprofits Reporting Gross Receipts >$25,000 in 2000 .........................94
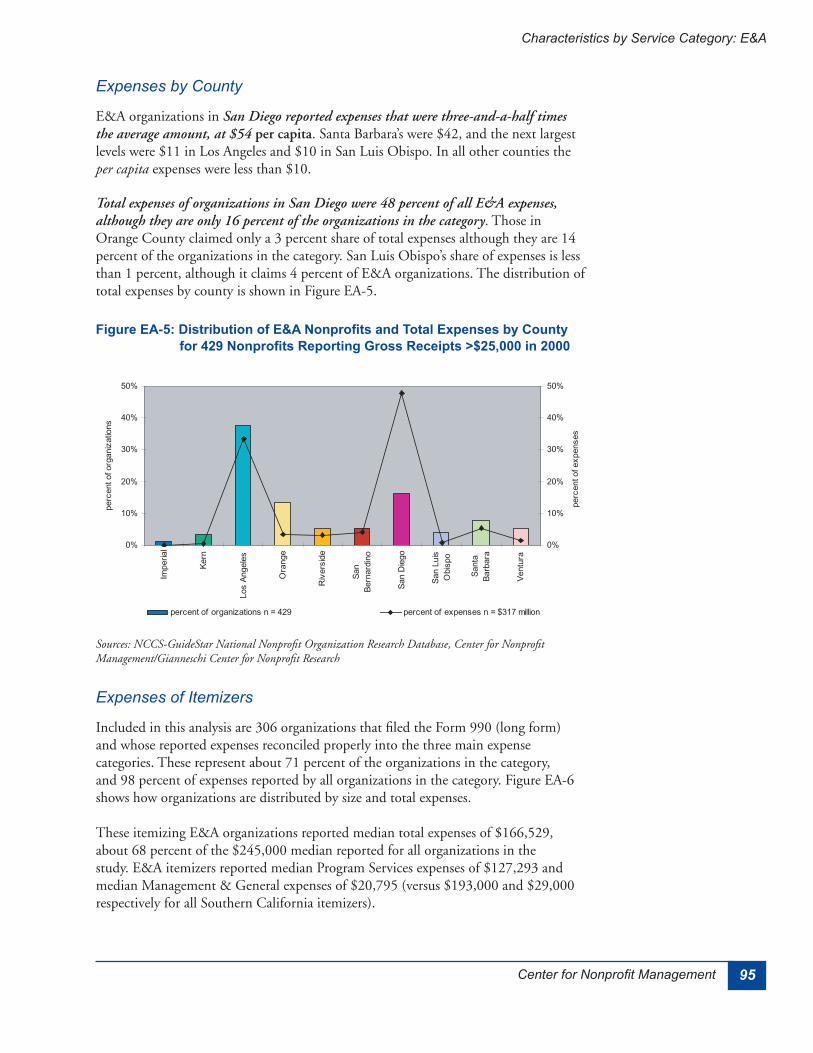
Figure EA-5: Distribution of E&A Nonprofits and Total Expenses by County for 429 Nonprofits Reporting Gross Receipts >$25,000 in 2000 ...................................................................95
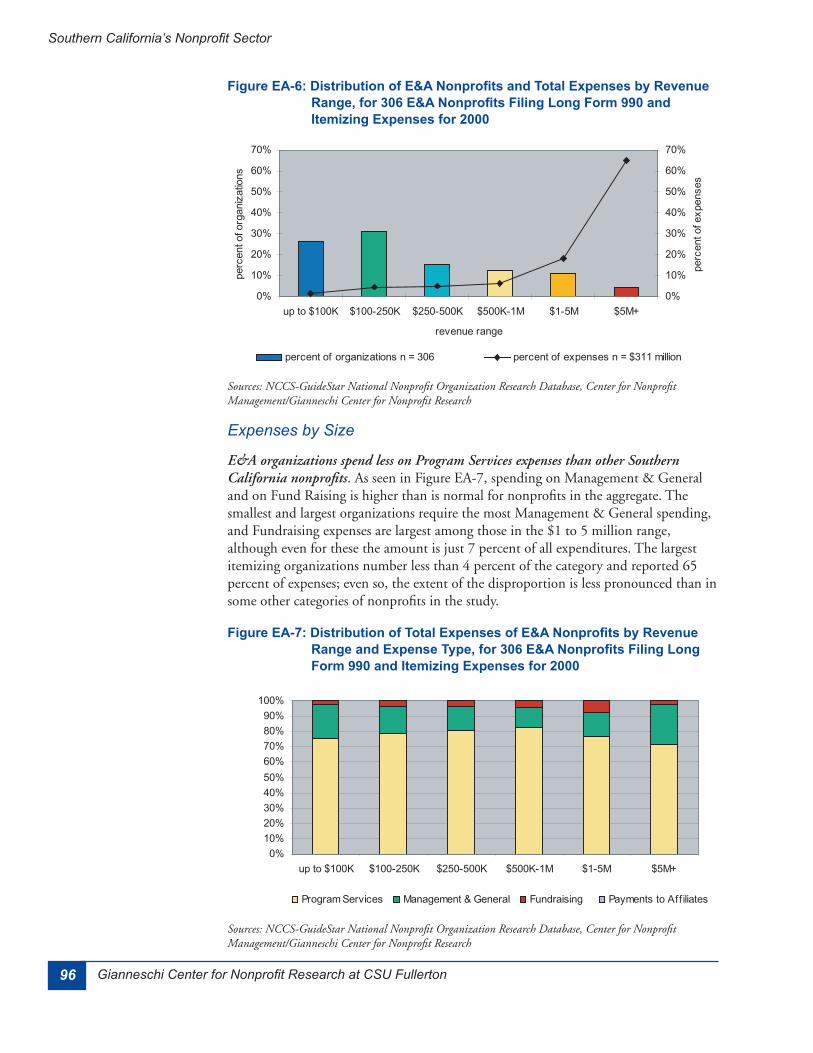
Figure EA-6: Distribution of E&A Nonprofits and Total Expenses by Revenue Range, for 306 E&A Nonprofits Filing Long Form 990 and Itemizing Expenses for 2000 .................................96
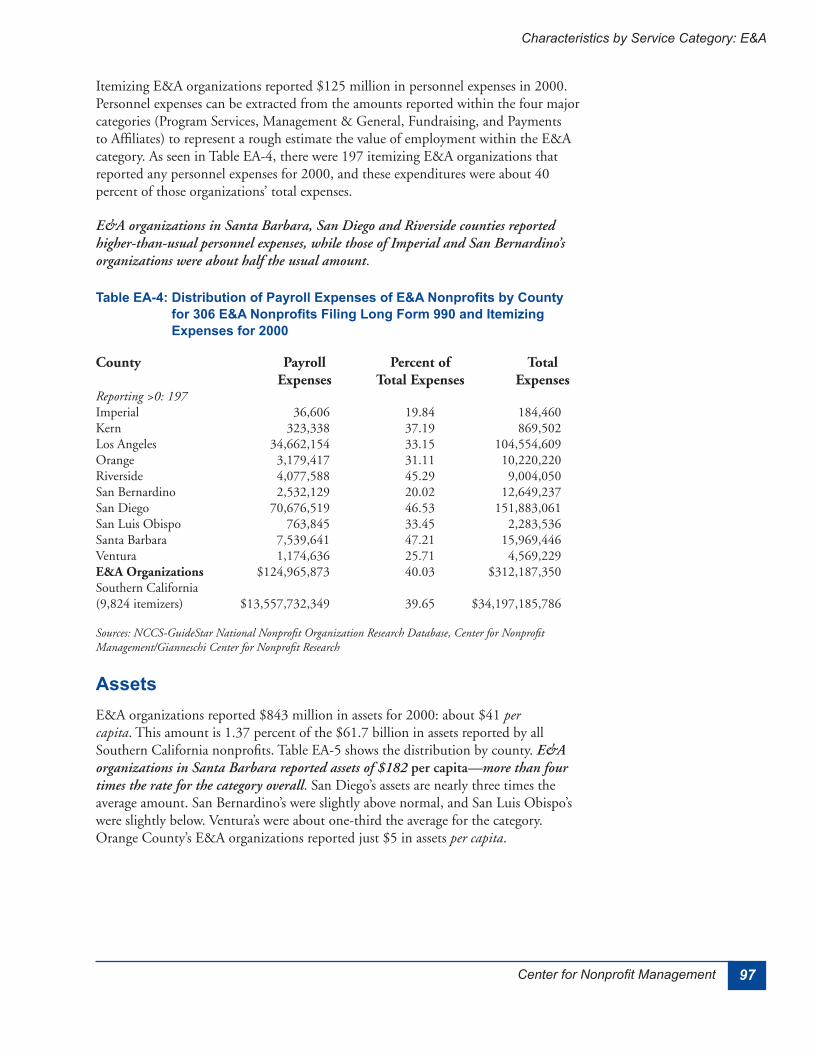
Figure EA-7: Distribution of Total Expenses of E&A Nonprofits by Revenue Range and Expense Type, for 306 E&A Nonprofits Filing Long Form 990 and Itemizing Expenses for 2000 ...96
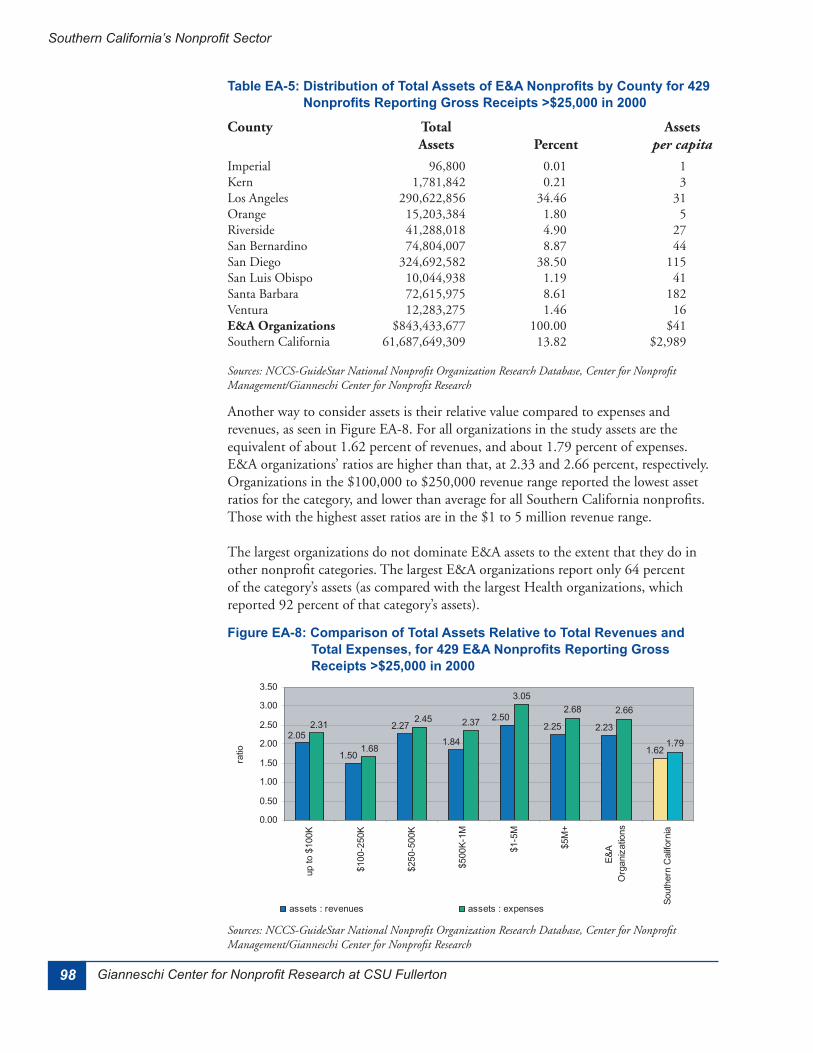
Figure EA-8: Comparison of Total Assets Relative to Total Revenues and Total Expenses, for 429 E&A Nonprofits Reporting Gross Receipts >$25,000 in 2000 ..........................................98
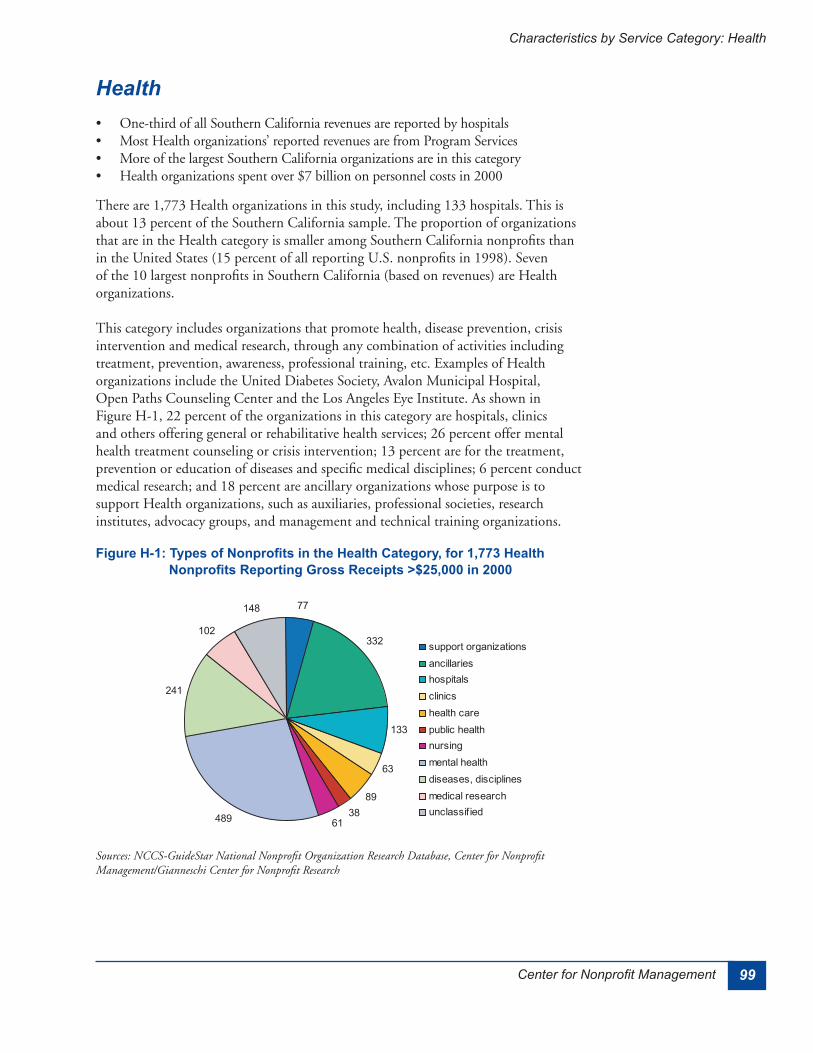
Figure H-1: Types of Nonprofits in the Health Category, for 1,773 Health Nonprofits Reporting Gross Receipts >$25,000 in 2000 ....................................................................................99
Figure H-2: Distribution of Health Nonprofits and Total Revenues by Revenue Range, for 1,773 Health Nonprofits Reporting Gross Receipts >$25,000 in 2000 .....................................102
Figure H-3: Distribution of Health Nonprofits by Revenue Range and County, for 1,773 Health Nonprofits Reporting Gross Receipts >$25,000 in 2000 ................................................103
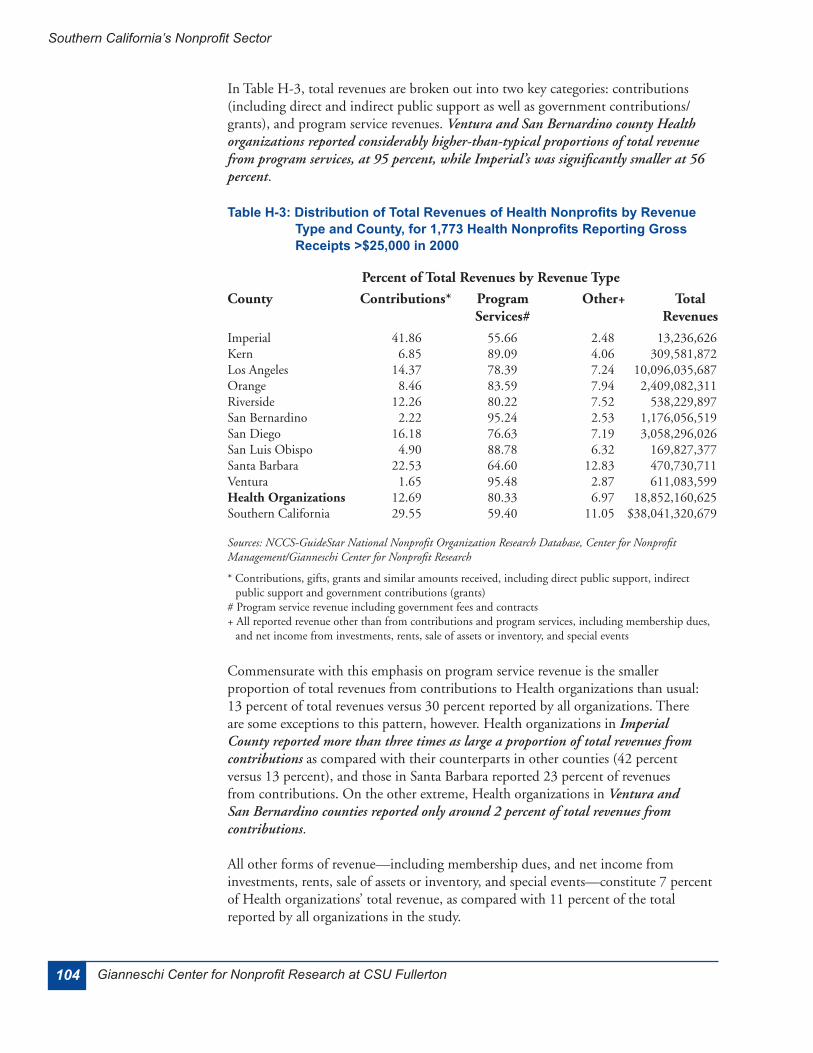
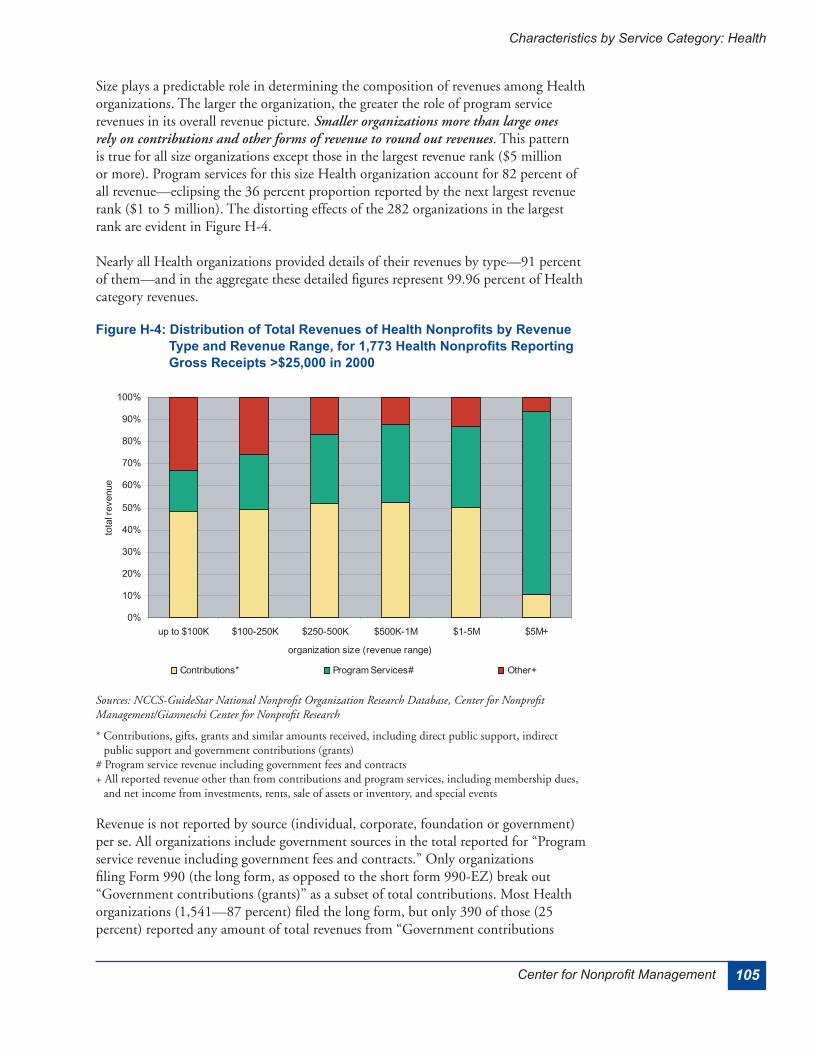
Figure H-4: Distribution of Total Revenues of Health Nonprofits by Revenue Type and Revenue Range, for 1,773 Health Nonprofits Reporting Gross Receipts >$25,000 in 2000 ............................................................................................................................105
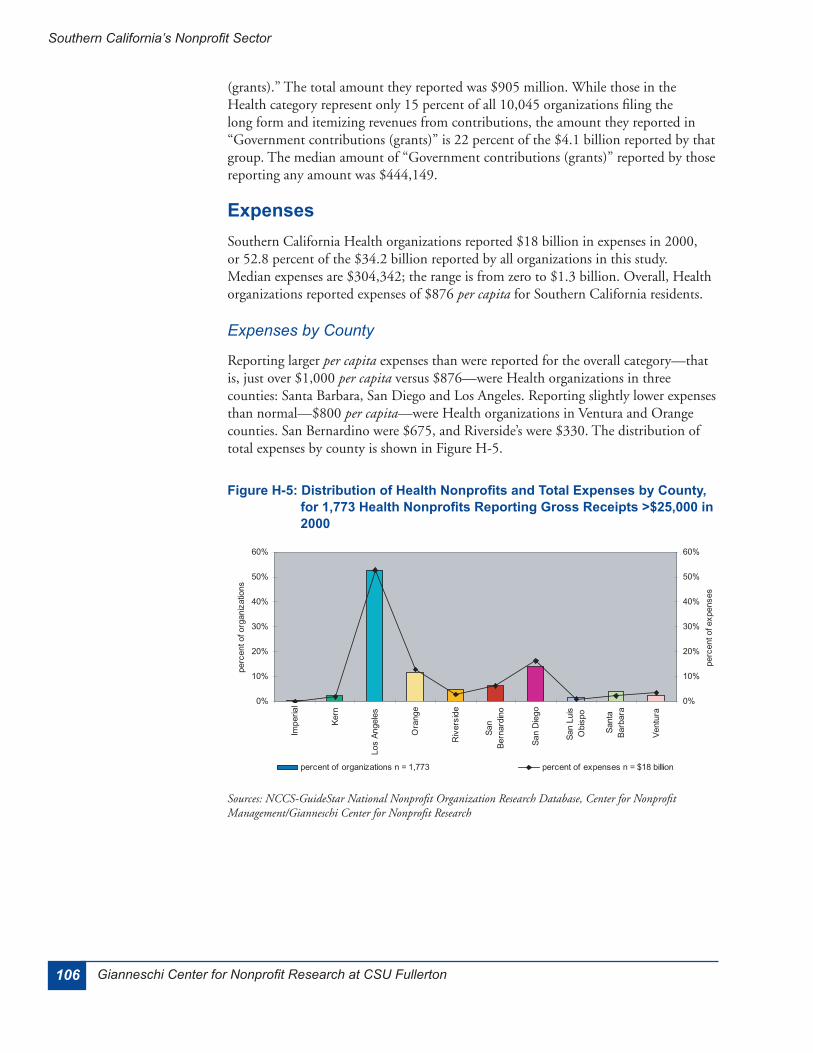
Figure H-5: Distribution of Health Nonprofits and Total Expenses by County, for 1,773 Health Nonprofits Reporting Gross Receipts >$25,000 in 2000 ................................................106
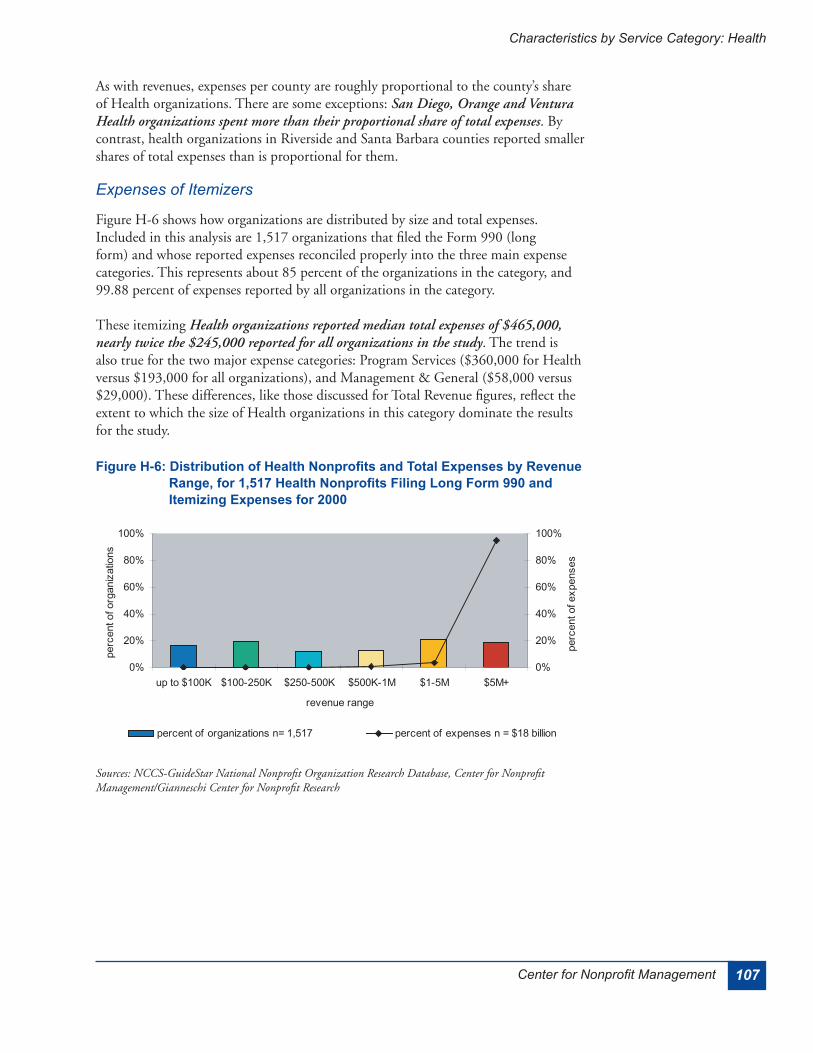
Figure H-6: Distribution of Health Nonprofits and Total Expenses by Revenue Range, for 1,517 Health Nonprofits Filing Long Form 990 and Itemizing Expenses for 2000 ...................107
Figure H-7: Distribution of Total Expenses of Health Nonprofits by Revenue Range and Expense Type, for 1,517 Health Nonprofits Filing Long Form 990 and Itemizing Expenses for 2000 ..........................................................................................................108
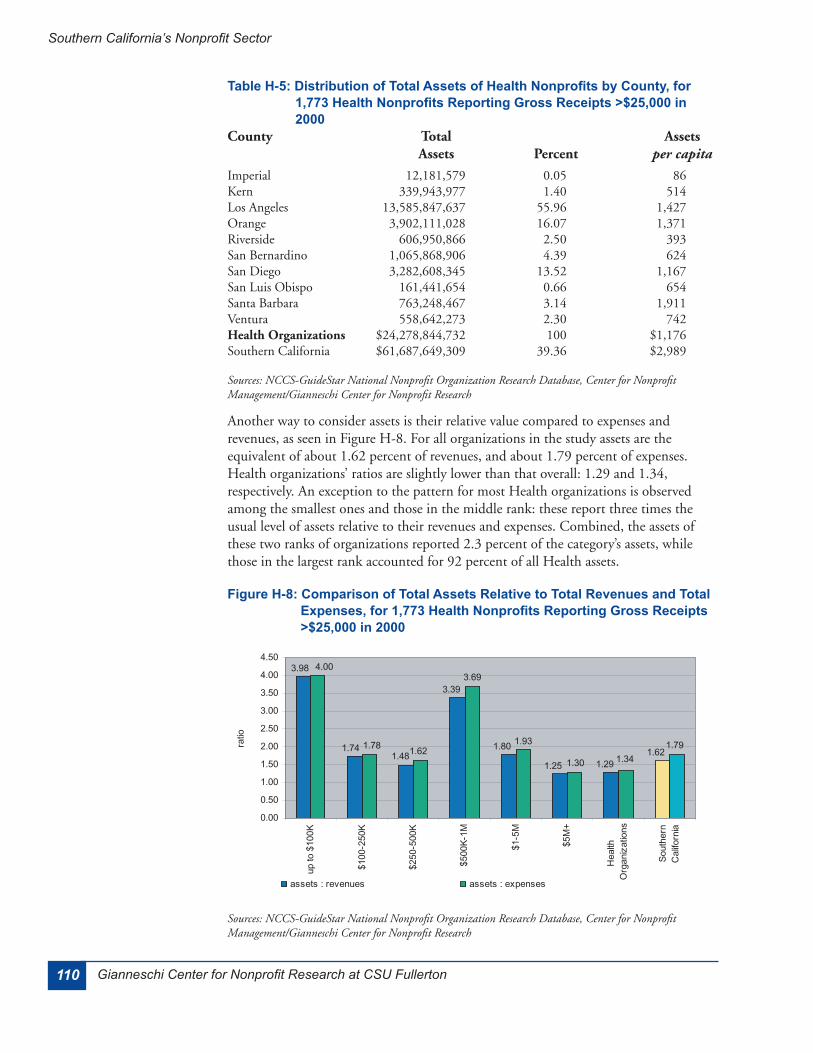
Figure H-8: Comparison of Total Assets Relative to Total Revenues and Total Expenses, for 1,773 Health Nonprofits Reporting Gross Receipts >$25,000 in 2000 ...........................110
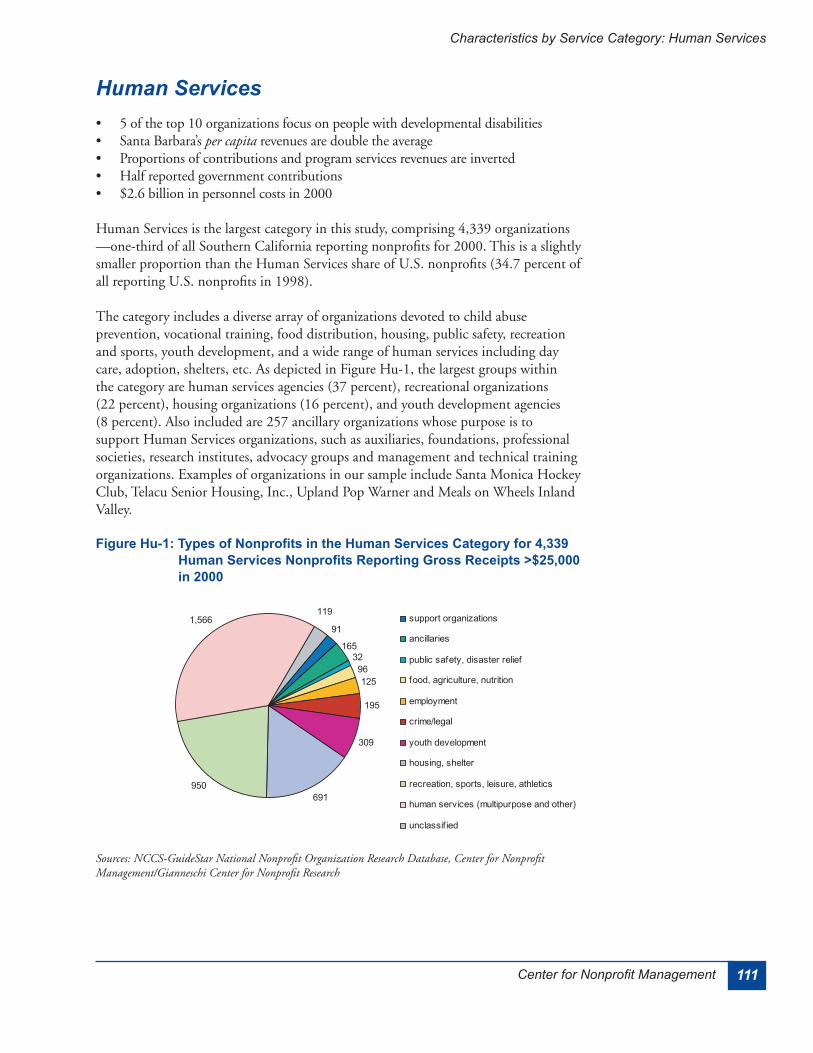
Figure Hu-1: Types of Nonprofits in the Human Services Category for 4,339 Human Services Nonprofits Reporting Gross Receipts >$25,000 in 2000 ................................................ 111
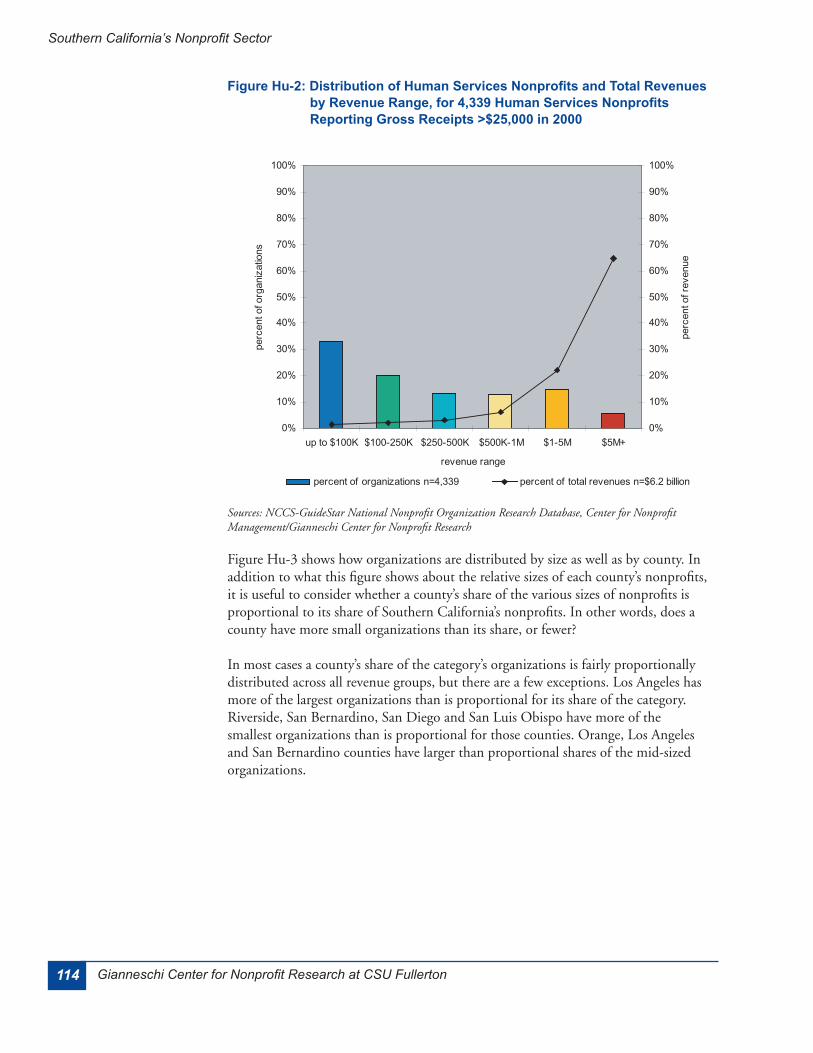
Figure Hu-2: Distribution of Human Services Nonprofits and Total Revenues by Revenue Range, for 4,339 Human Services Nonprofits Reporting Gross Receipts >$25,000 in 2000 .....114
xii Gianneschi Center for Nonprofit Research at CSU Fullerton
Southern California’s Nonprofit Sector
Figures, continued
Figure Hu-3: Distribution of Human Services Nonprofits by Revenue Range and County, for 4,339 Nonprofits Reporting Gross Receipts >$25,000 in 2000 ......................................115
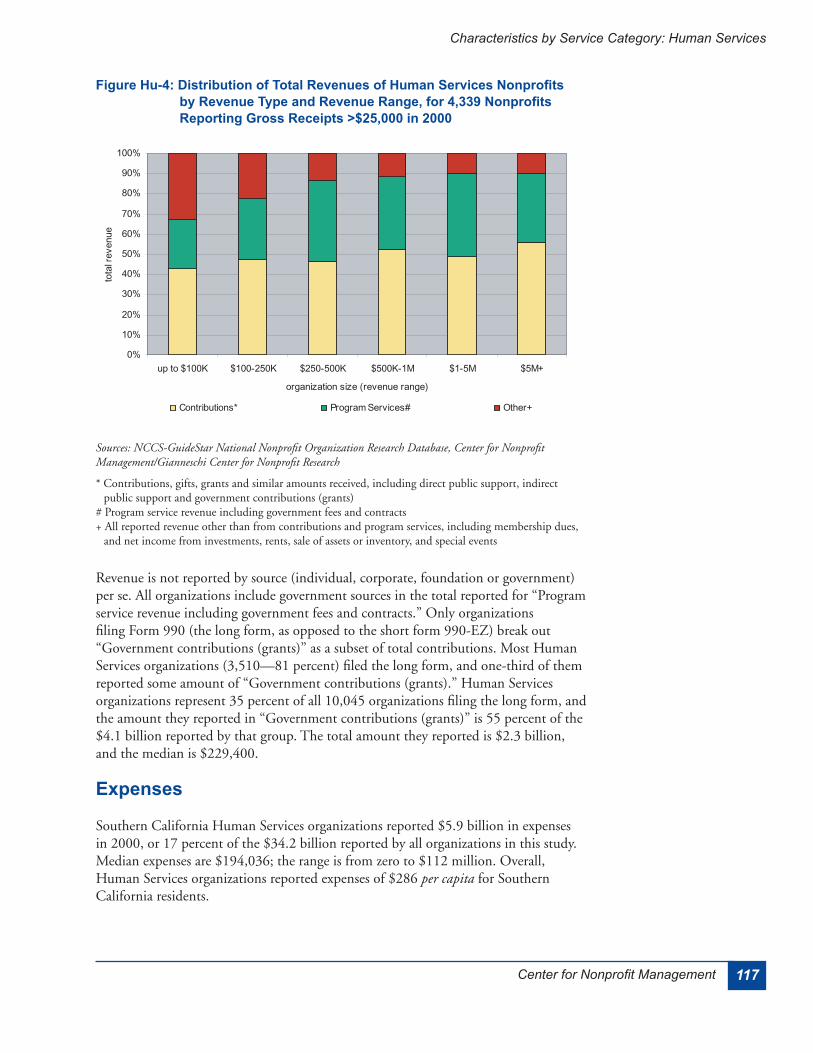
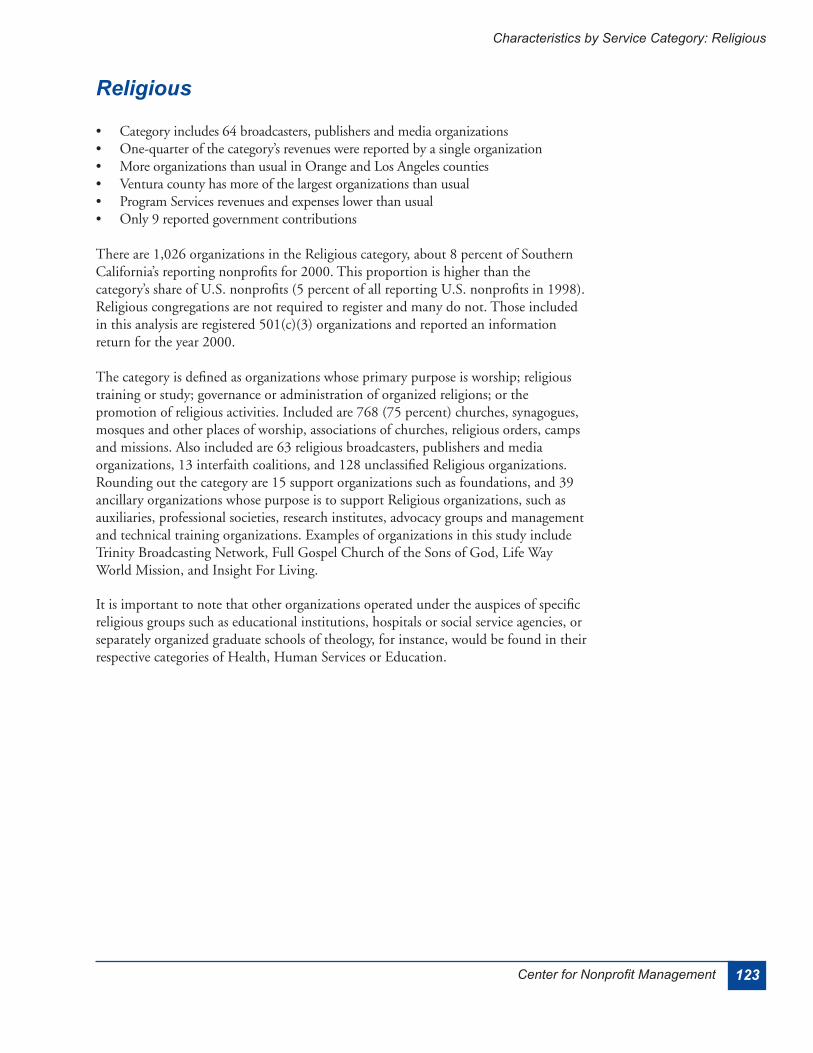
Figure Hu-4: Distribution of Total Revenues of Human Services Nonprofits by Revenue Type and Revenue Range, for 4,339 Nonprofits Reporting Gross Receipts >$25,000 in 2000 ............................................................................................................................117
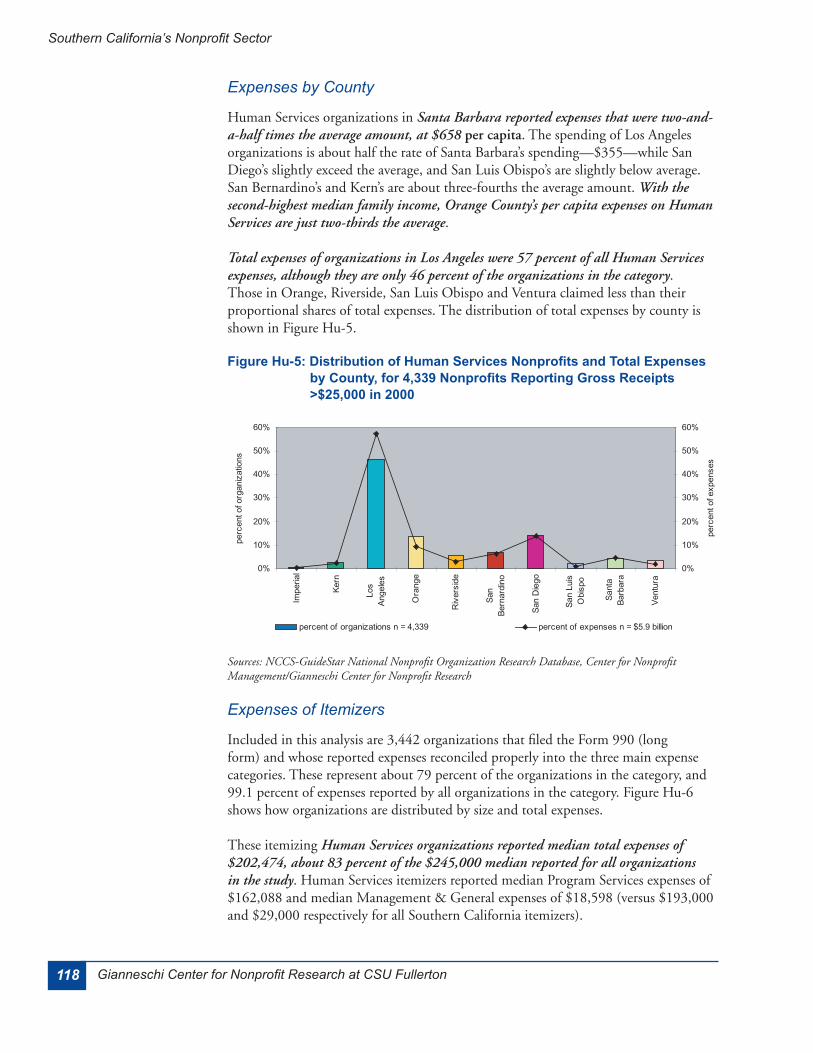
Figure Hu-5: Distribution of Human Services Nonprofits and Total Expenses by County, for 4,339 Nonprofits Reporting Gross Receipts >$25,000 in 2000 ................................................118
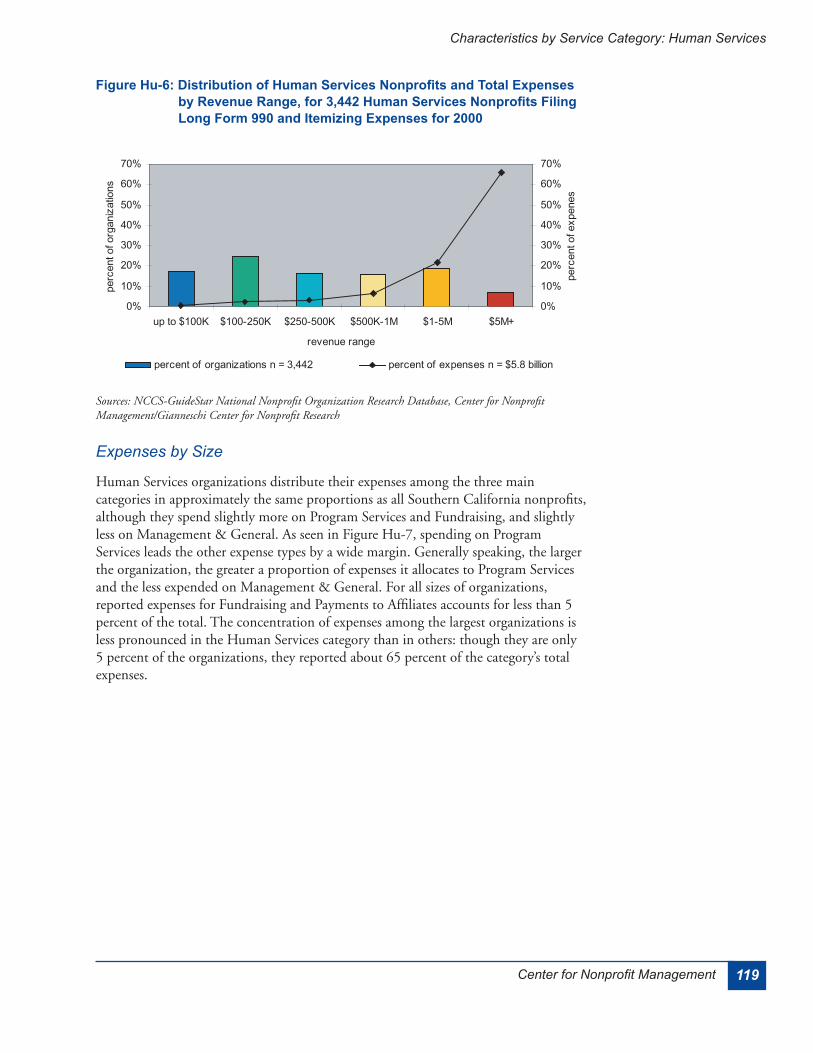
Figure Hu-6: Distribution of Human Services Nonprofits and Total Expenses by Revenue Range, for 3,442 Human Services Nonprofits Filing Long Form 990 and Itemizing Expenses for 2000 ..........................................................................................................119
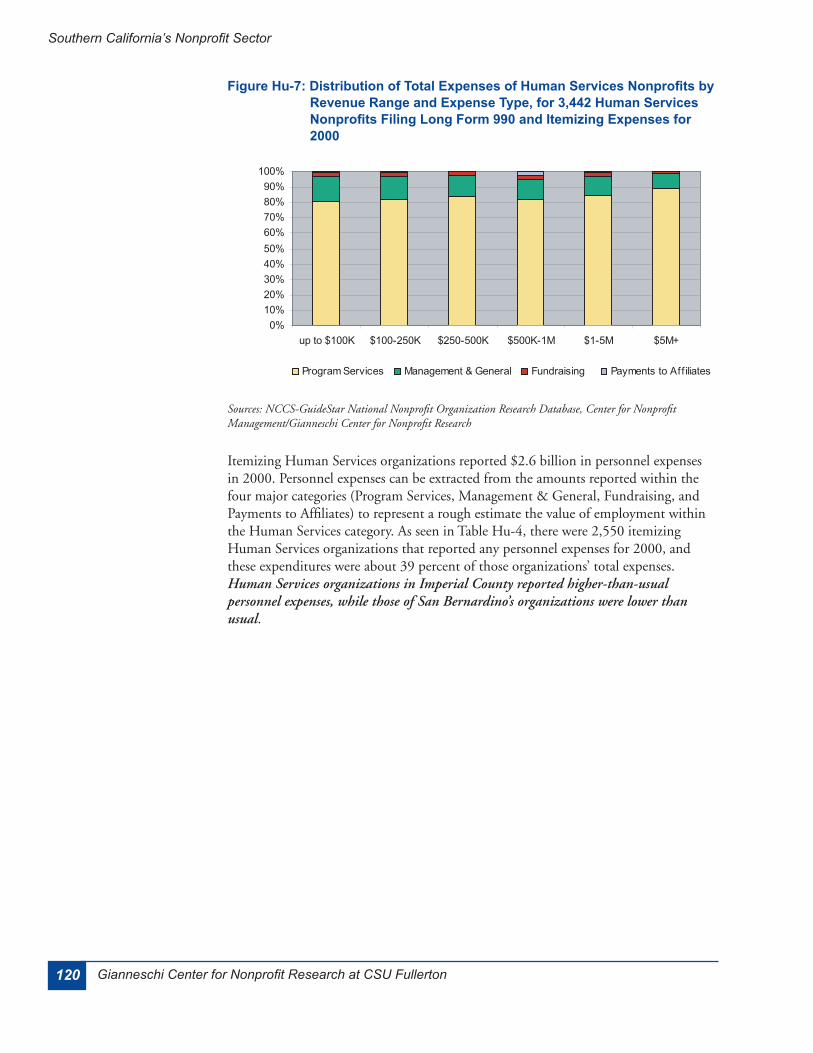
Figure Hu-7: Distribution of Total Expenses of Human Services Nonprofits by Revenue Range and Expense Type, for 3,442 Human Services Nonprofits Filing Long Form 990 and Itemizing Expenses for 2000 ..........................................................................................120
Figure Hu-8: Comparison of Total Assets Relative to Total Revenues and Total Expenses, for 4,339 Human Services Nonprofits Reporting Gross Receipts >$25,000 in 2000 ...........122
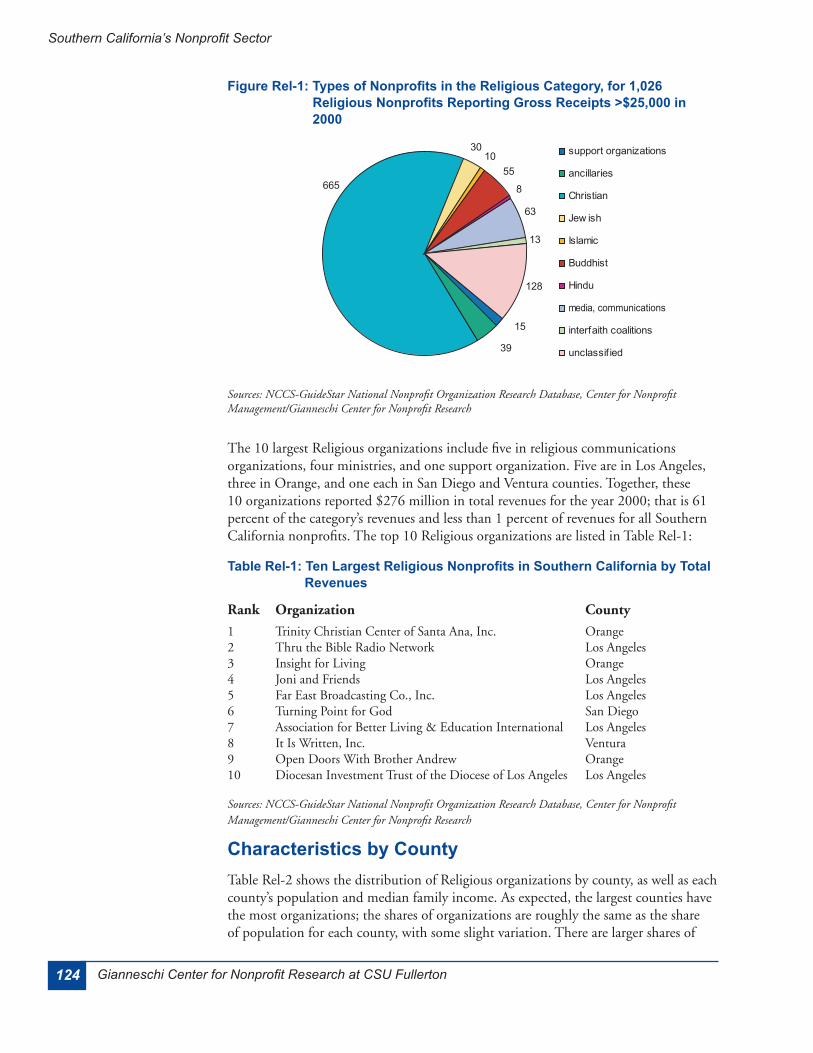
Figure Rel-1: Types of Nonprofits in the Religious Category, for 1,026 Religious Nonprofits Reporting Gross Receipts >$25,000 in 2000 .................................................................124
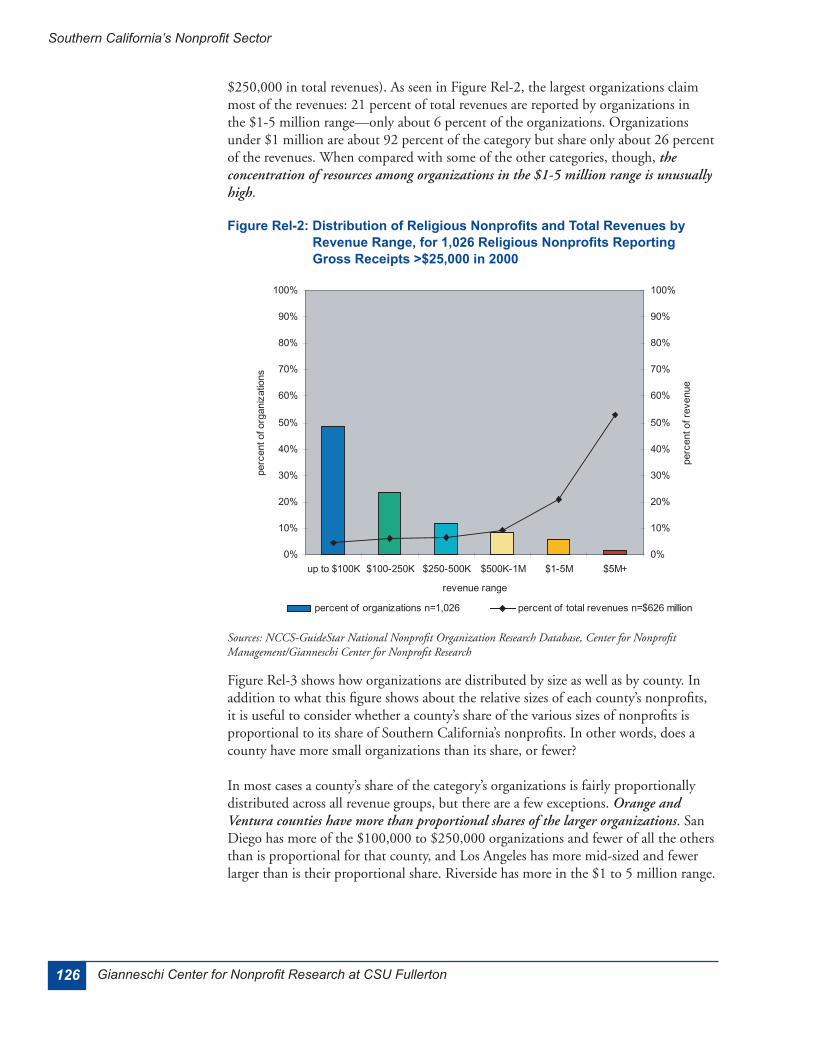
Figure Rel-2: Distribution of Religious Nonprofits and Total Revenues by Revenue Range, for 1,026 Religious Nonprofits Reporting Gross Receipts >$25,000 in 2000 ......................126
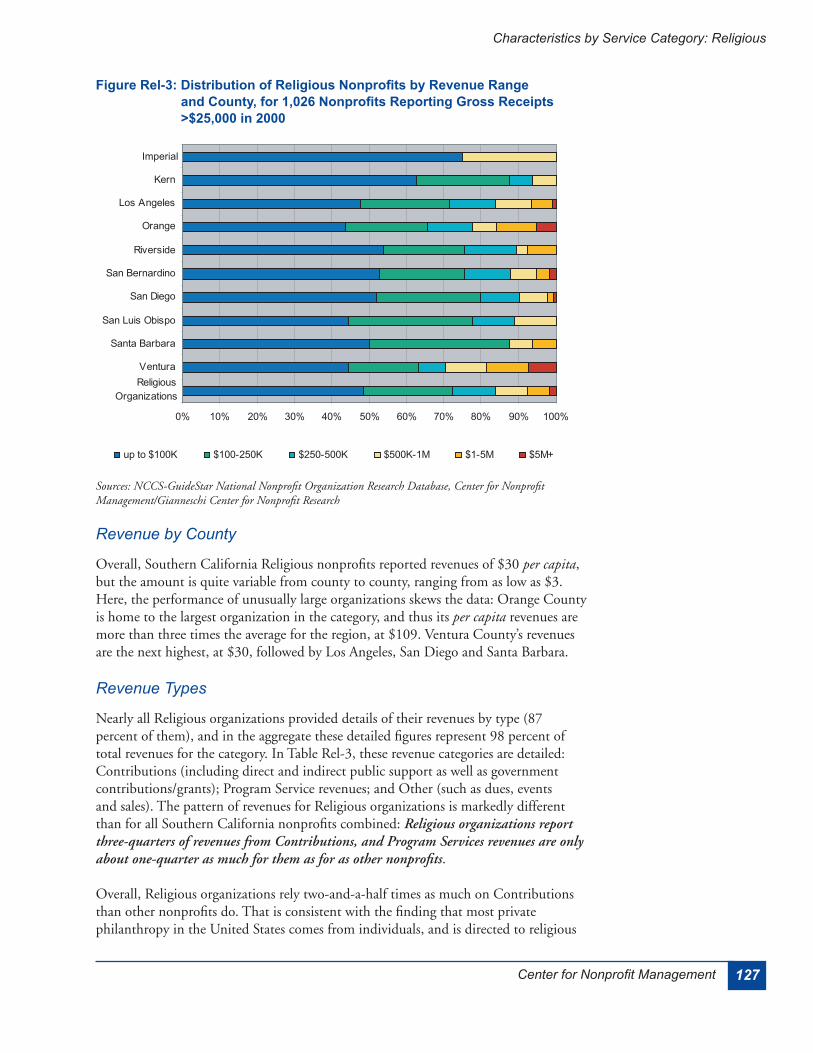
Figure Rel-3: Distribution of Religious Nonprofits by Revenue Range and County, for 1,026 Nonprofits Reporting Gross Receipts >$25,000 in 2000 ................................................127
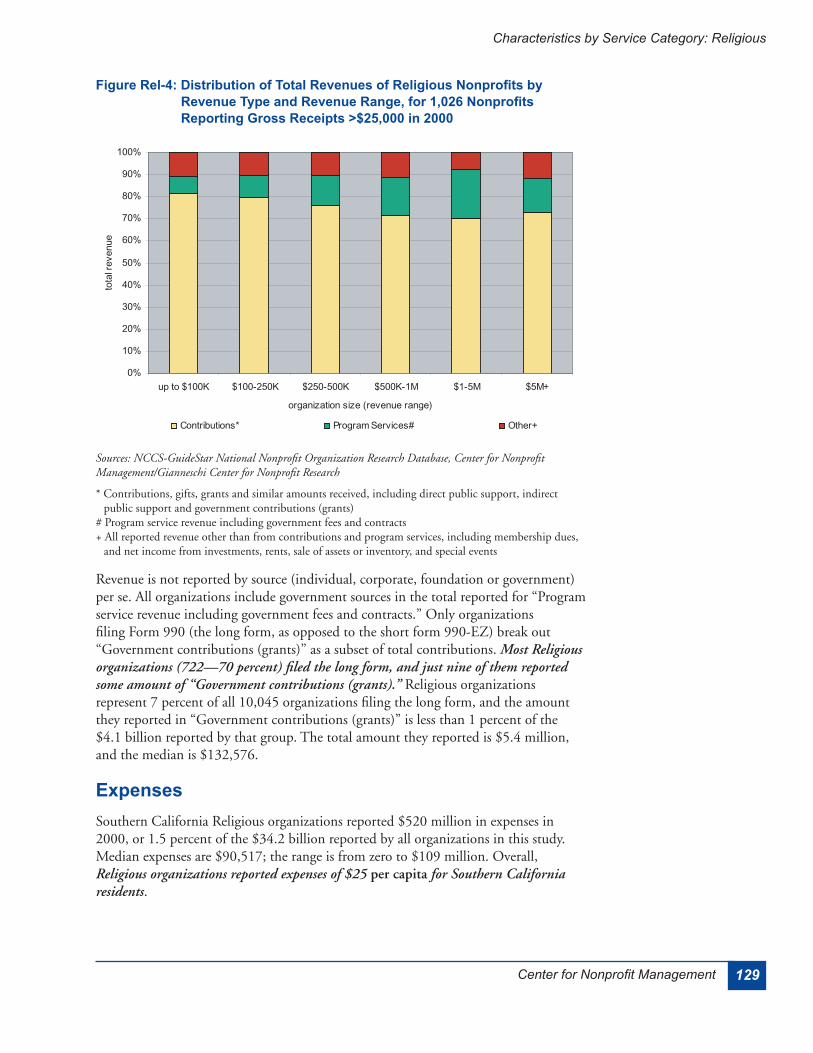
Figure Rel-4: Distribution of Total Revenues of Religious Nonprofits by Revenue Type and Revenue Range, for 1,026 Nonprofits Reporting Gross Receipts >$25,000 in 2000 .....129
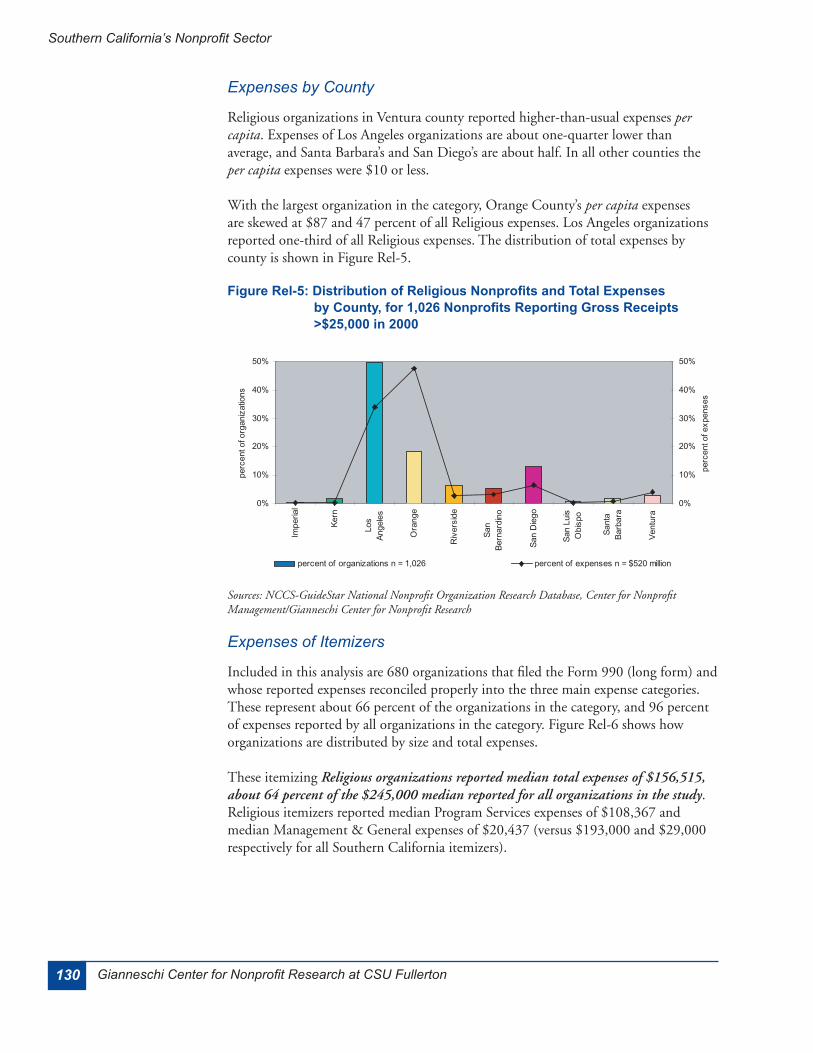
Figure Rel-5: Distribution of Religious Nonprofits and Total Expenses by County, for 1,026 Nonprofits Reporting Gross Receipts >$25,000 in 2000 ................................................130
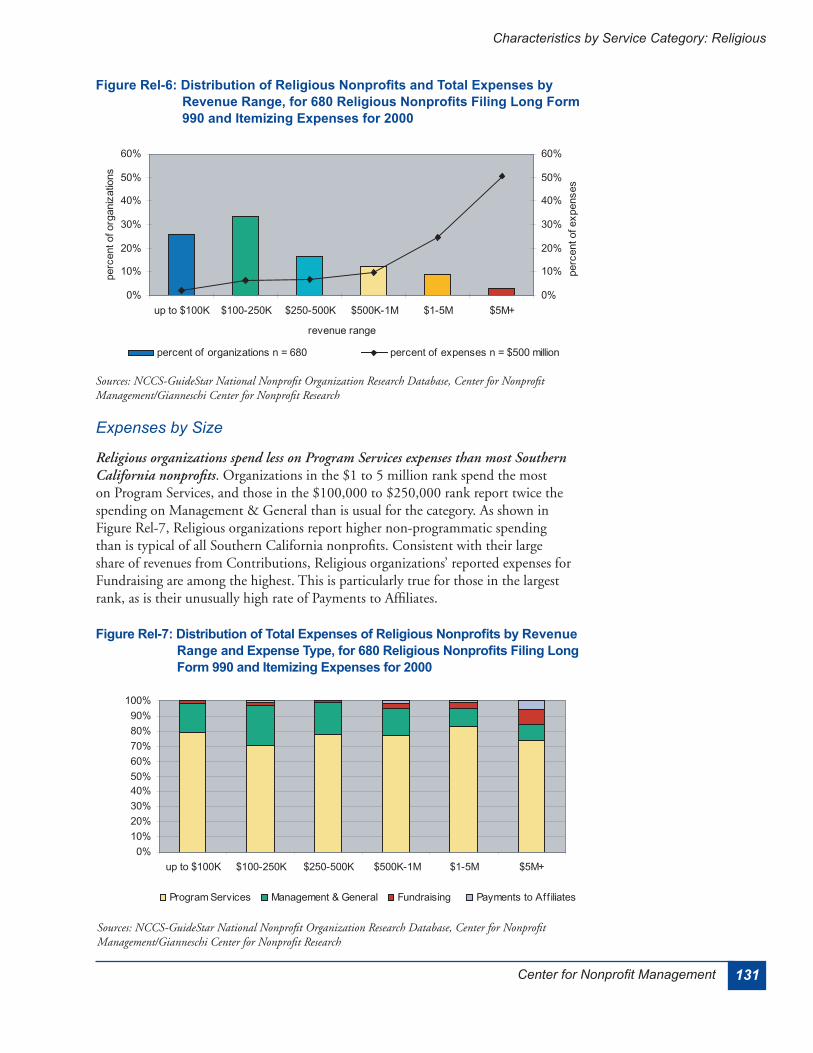
Figure Rel-6: Distribution of Religious Nonprofits and Total Expenses by Revenue Range, for 680 Religious Nonprofits Filing Long Form 990 and Itemizing Expenses for 2000 ........131
Figure Rel-7: Distribution of Total Expenses of Religious Nonprofits by Revenue Range and Expense Type, for 680 Religious Nonprofits Filing Long Form 990 and Itemizing Expenses for 2000 .......................................................................................................................................131
Figure Rel-8: Comparison of Total Assets Relative to Total Revenues and Total Expenses, for 1,026 Religious Nonprofits Reporting Gross Receipts >$25,000 in 2000 ......................133
xiiiCenter for Nonprofit Management
Southern California’s Nonprofit Sector
TablesTable 1: California Share of U.S. Population and Nonprofit Sector ..................................................7Table 2: Population, Nonprofits and Resources by County ..............................................................8Table 3: Ten Largest Nonprofits in Southern California by Total Revenues ...................................18Table LA-1: Ten Largest Los Angeles County Nonprofits by Total Revenues ......................................32Table OC-1: Ten Largest Orange County Nonprofits by Total Revenues .............................................37Table R-1: Ten Largest Riverside County Nonprofits by Total Revenues ..........................................43Table SBe-1: Ten Largest San Bernardino County Nonprofits by Total Revenues ................................49Table SD-1: Ten Largest San Diego County Nonprofits by Total Revenues .........................................53Table SBa-1: Ten Largest Santa Barbara County Nonprofits by Total Revenues ..................................58Table V-1: Ten Largest Ventura County Nonprofits by Total Revenues .............................................63Table ACH-1: Ten Largest ACH Nonprofits in Southern California by Total Revenues ...........................66Table ACH-2: Distribution of ACH Nonprofits by County with Population and Income, for 1,451
ACH Nonprofits Reporting Gross Receipts >$25,000 in 2000 .........................................67Table ACH-3: Distribution of Total Revenues of ACH Nonprofits by Revenue Type and County,
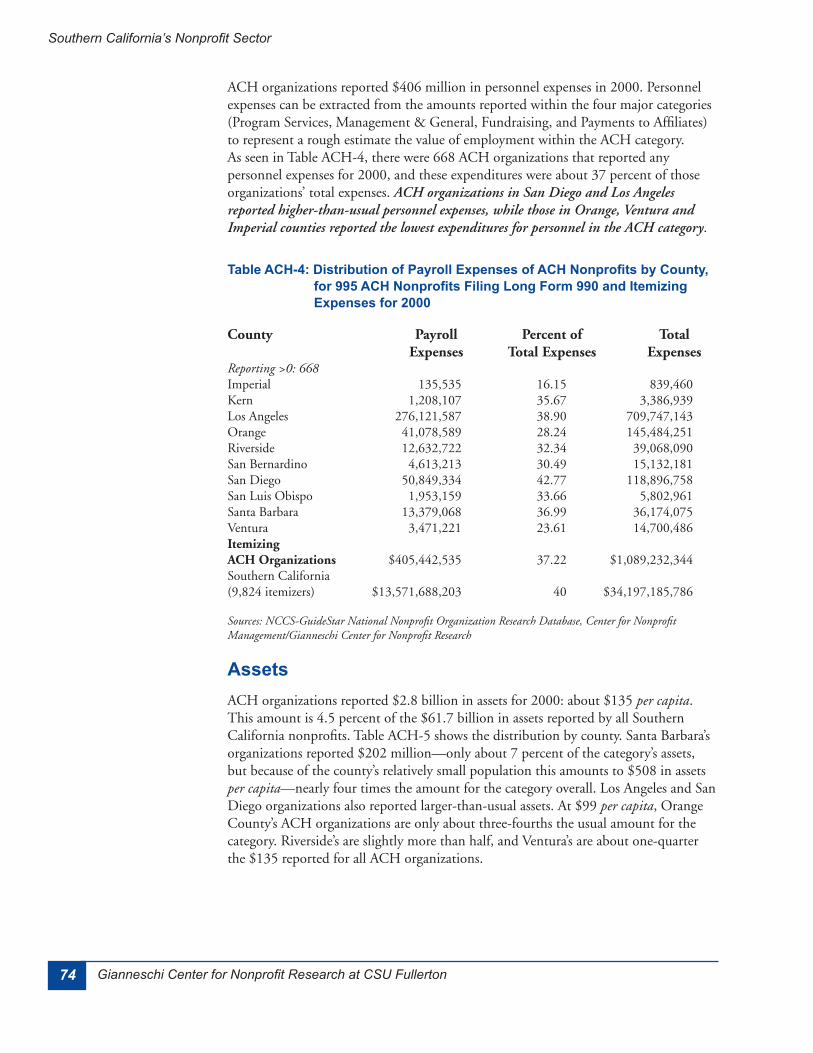
for 1,451 ACH Nonprofits Reporting Gross Receipts >$25,000 in 2000 ..........................70Table ACH-4: Distribution of Payroll Expenses of ACH Nonprofits by County, for 995 ACH
Nonprofits Filing Long Form 990 and Itemizing Expenses for 2000 .................................74Table ACH-5: Distribution of Total Assets of ACH Nonprofits by County, for 1,451 ACH Nonprofits
Reporting Gross Receipts >$25,000 in 2000 ...................................................................75Table Ed-1: Ten Largest Education Nonprofits in Southern California by Total Revenues .................77Table Ed-2: Distribution of Education Nonprofits by County with Population and Income, for
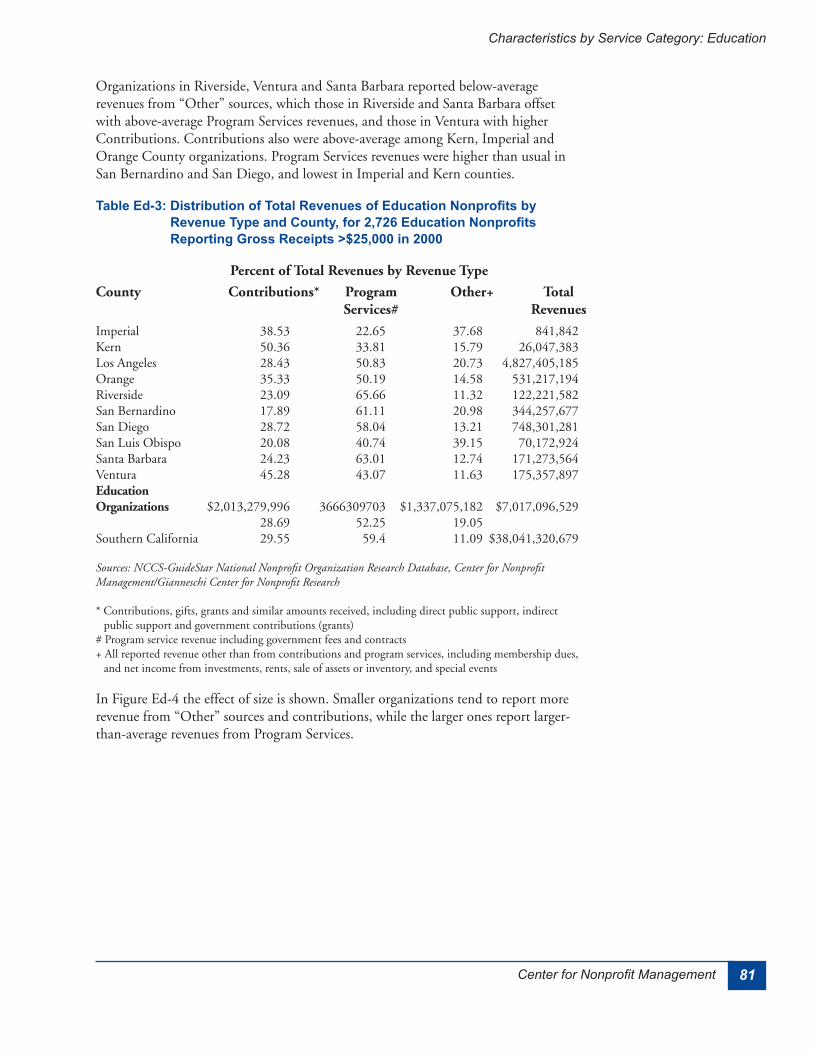
2,726 Education Nonprofits Reporting Gross Receipts >$25,000 in 2000 .......................78Table Ed-3: Distribution of Total Revenues of Education Nonprofits by Revenue Type and
County, for 2,726 Education Nonprofits Reporting Gross Receipts >$25,000 in 2000 .....81Table Ed-4: Distribution of Payroll Expenses of Education Nonprofits by County for 1,669
Education Nonprofits Filing Long Form 990 and Itemizing Expenses for 2000 ................85Table Ed-5: Distribution of Total Assets of Education Nonprofits by County, for 2,726 Education
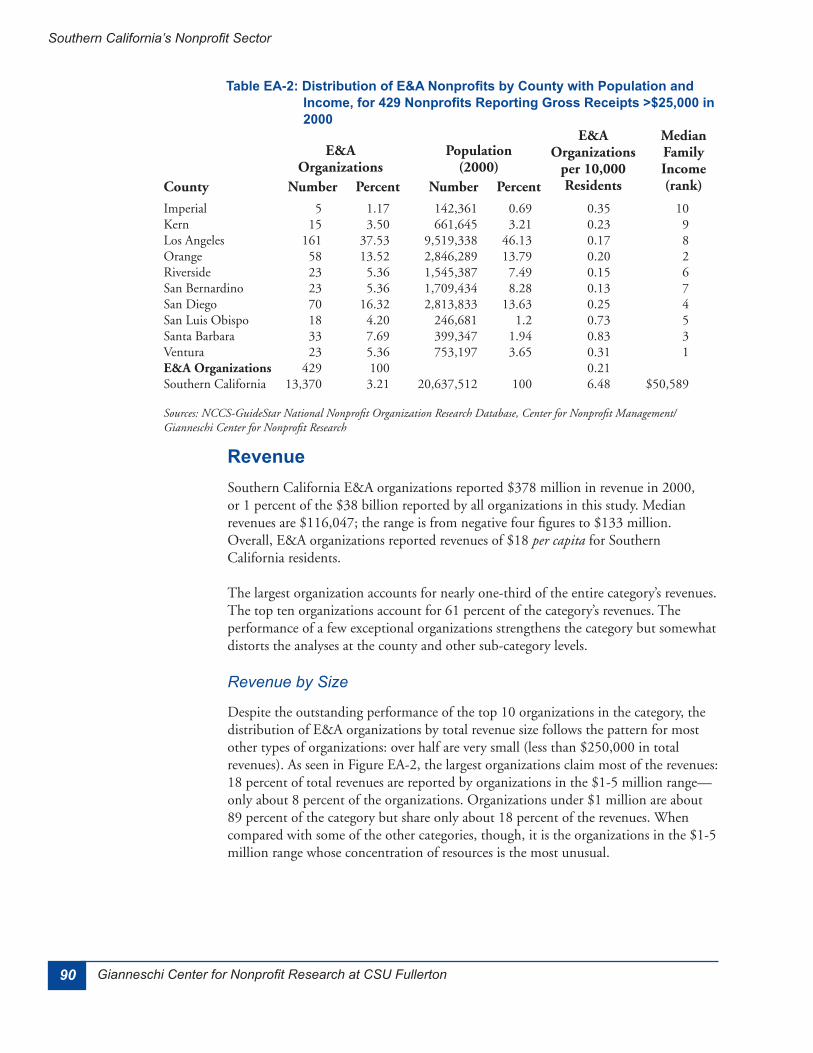
Nonprofits Reporting Gross Receipts >$25,000 in 2000 ..................................................86Table EA-1: Ten Largest E&A Nonprofits in Southern California by Total Revenues ...........................89Table EA-2: Distribution of E&A Nonprofits by County with Population and Income, for 429
Nonprofits Reporting Gross Receipts >$25,000 in 2000 ..................................................90Table EA-3: Distribution of Total Revenues of E&A Nonprofits by Revenue Type and County,
for 429 Nonprofits Reporting Gross Receipts >$25,000 in 2000 ......................................93Table EA-4: Distribution of Payroll Expenses of E&A Nonprofits by County for 306 E&A
Nonprofits Filing Long Form 990 and Itemizing Expenses for 2000 .................................97Table EA-5: Distribution of Total Assets of E&A Nonprofits by County for 429 Nonprofits
Reporting Gross Receipts >$25,000 in 2000 ...................................................................98Table H-1: Ten Largest Health Nonprofits in Southern California by Total Revenues .....................100Table H-2: Distribution of Health Nonprofits by County with Population and Income, for 1,773
Health Nonprofits Reporting Gross Receipts >$25,000 in 2000 .....................................101Table H-3: Distribution of Total Revenues of Health Nonprofits by Revenue Type and County,
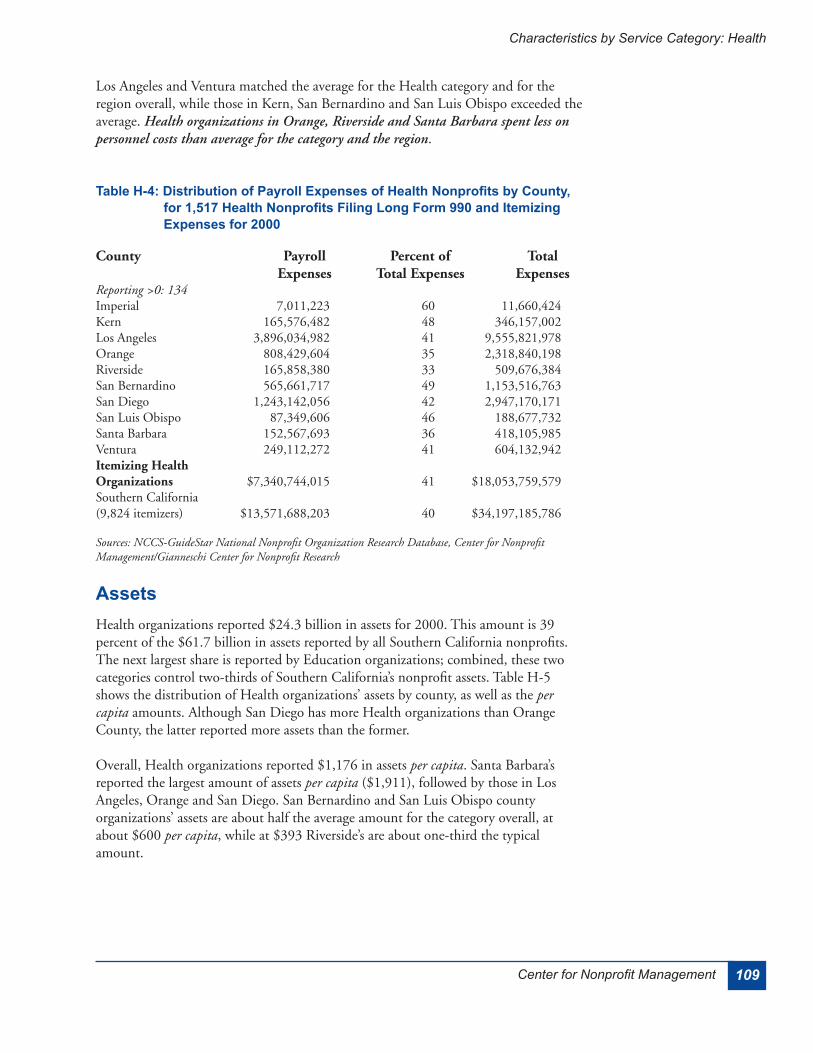
for 1,773 Health Nonprofits Reporting Gross Receipts >$25,000 in 2000 .....................104Table H-4: Distribution of Payroll Expenses of Health Nonprofits by County, for 1,517 Health
Nonprofits Filing Long Form 990 and Itemizing Expenses for 2000 ...............................109Table H-5: Distribution of Total Assets of Health Nonprofits by County, for 1,773 Health
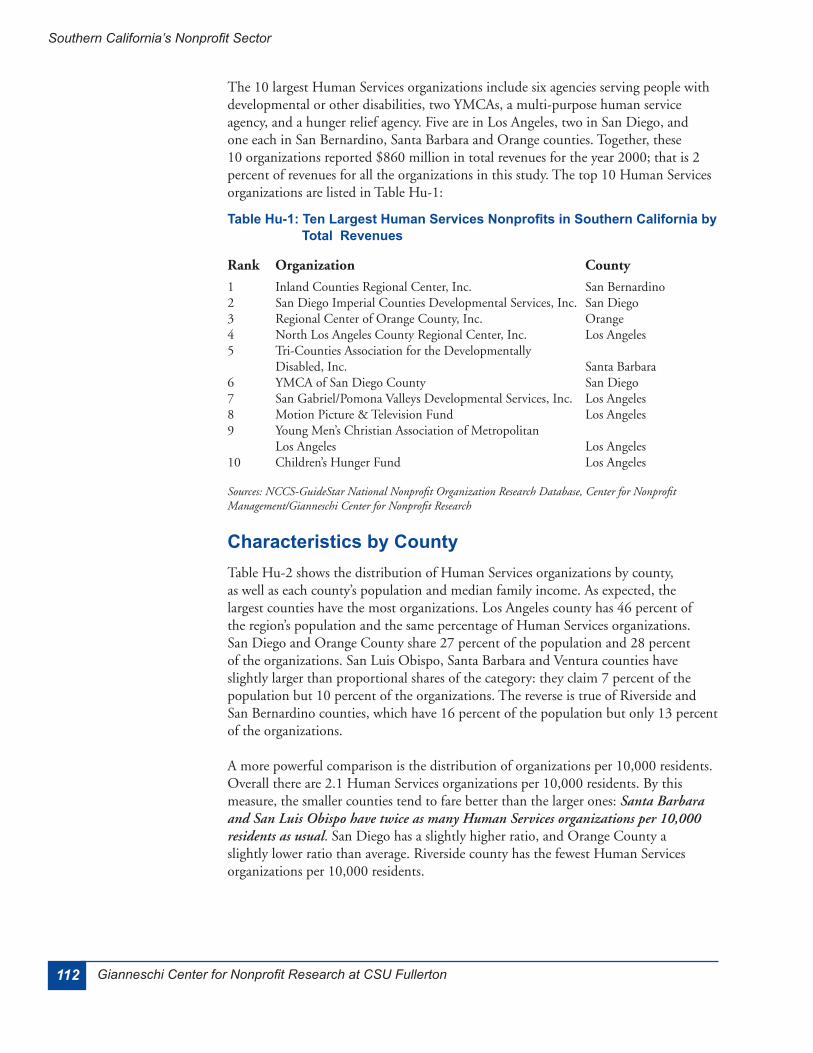
Nonprofits Reporting Gross Receipts >$25,000 in 2000 ................................................110Table Hu-1: Ten Largest Human Services Nonprofits in Southern California by Total Revenues .....112
xiv Gianneschi Center for Nonprofit Research at CSU Fullerton
Southern California’s Nonprofit Sector
Tables, continuedTable Hu-2: Distribution of Human Services Nonprofits by County with Population and Income,
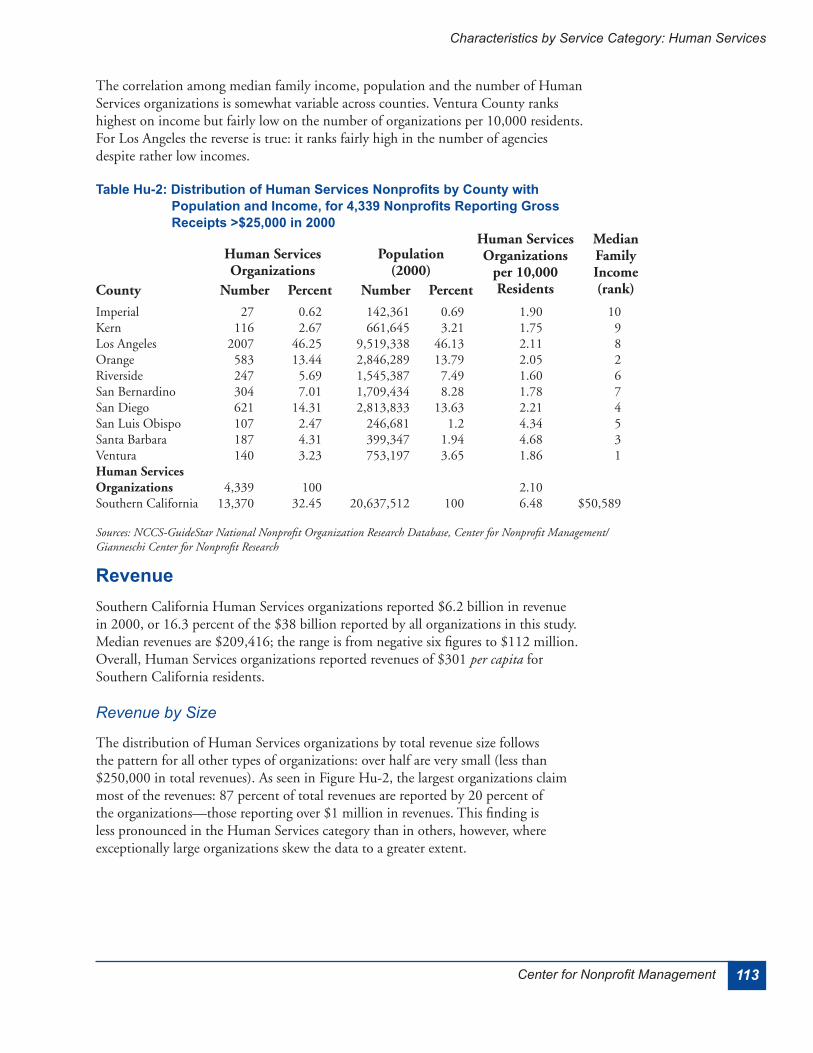
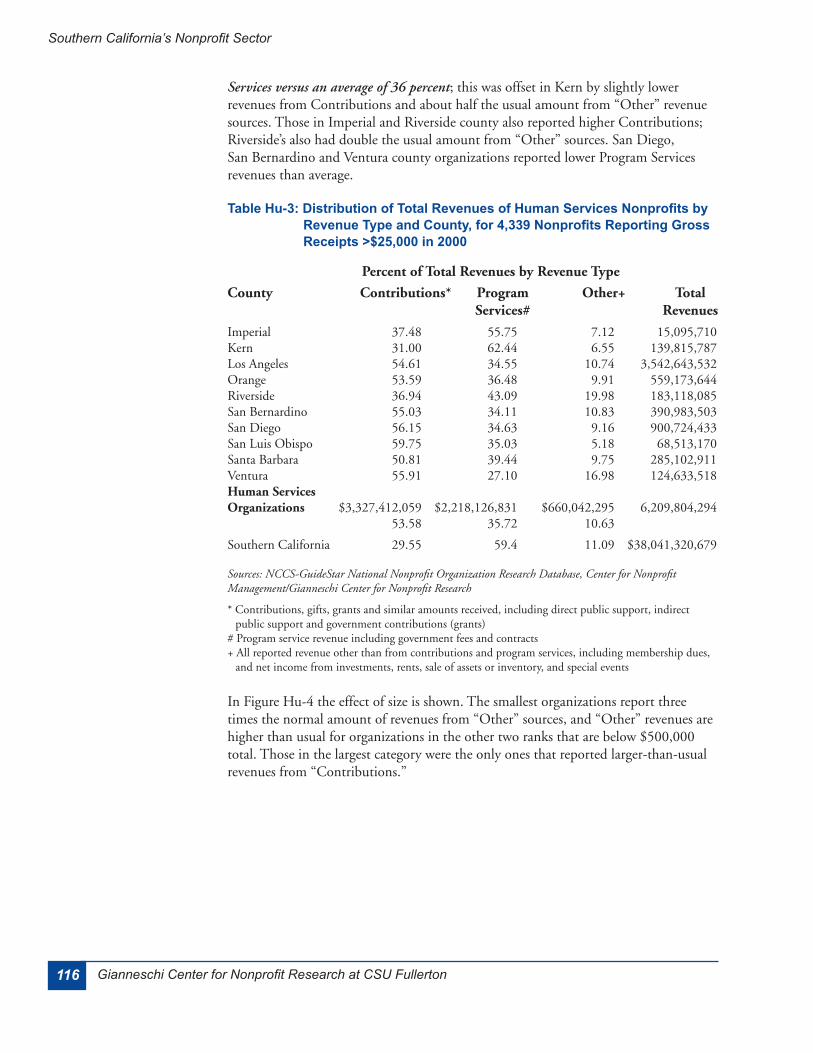
for 4,339 Nonprofits Reporting Gross Receipts >$25,000 in 2000 .................................113Table Hu-3: Distribution of Total Revenues of Human Services Nonprofits by Revenue Type and
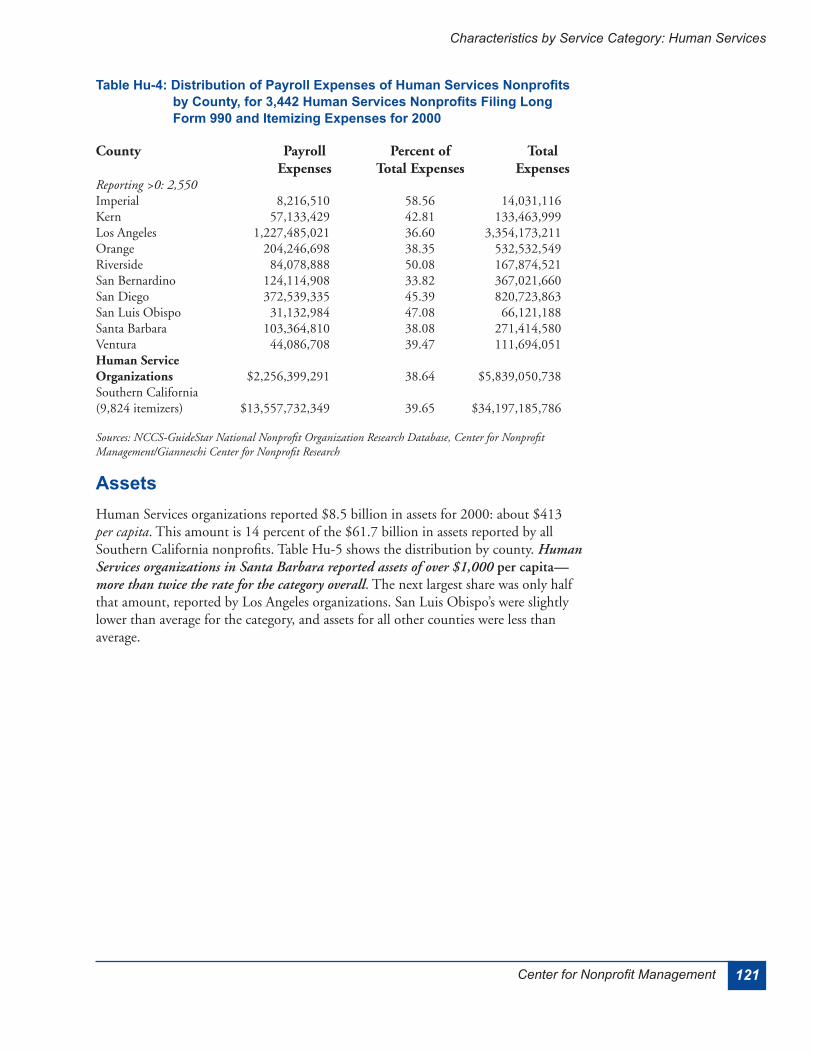
County, for 4,339 Nonprofits Reporting Gross Receipts >$25,000 in 2000 ....................116Table Hu-4: Distribution of Payroll Expenses of Human Services Nonprofits by County, for 3,442
Human Services Nonprofits Filing Long Form 990 and Itemizing Expenses for 2000 ................................................................................................................................121
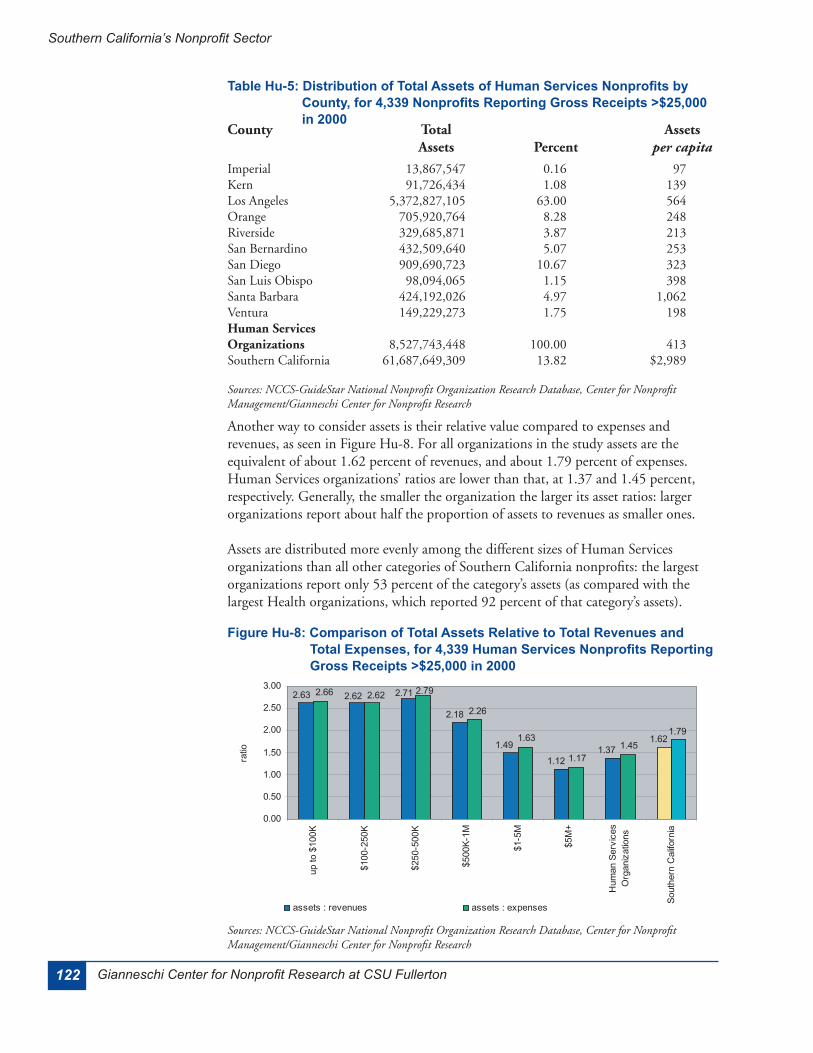
Table Hu-5: Distribution of Total Assets of Human Services Nonprofits by County, for 4,339 Nonprofits Reporting Gross Receipts >$25,000 in 2000 ................................................122
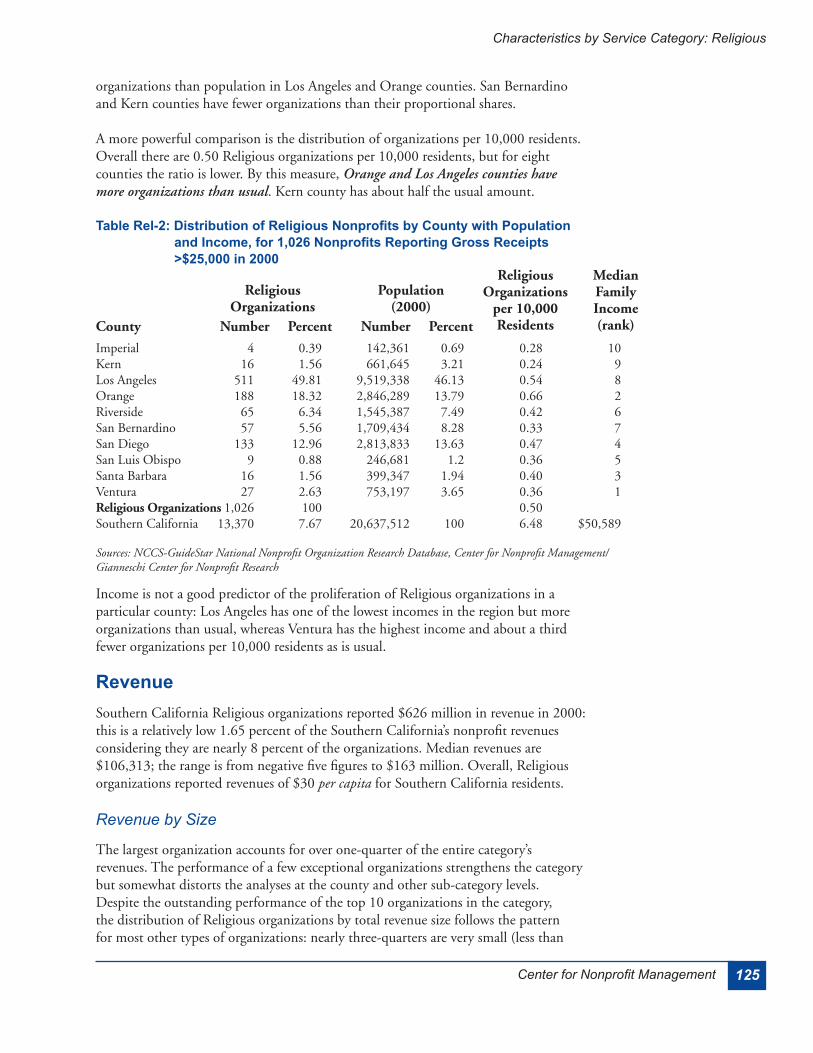
Table Rel-1: Ten Largest Religious Nonprofits in Southern California by Total Revenues ................124Table Rel-2: Distribution of Religious Nonprofits by County with Population and Income, for
1,026 Nonprofits Reporting Gross Receipts >$25,000 in 2000 ......................................125Table Rel-3: Distribution of Total Revenues of Religious Nonprofits by Revenue Type and
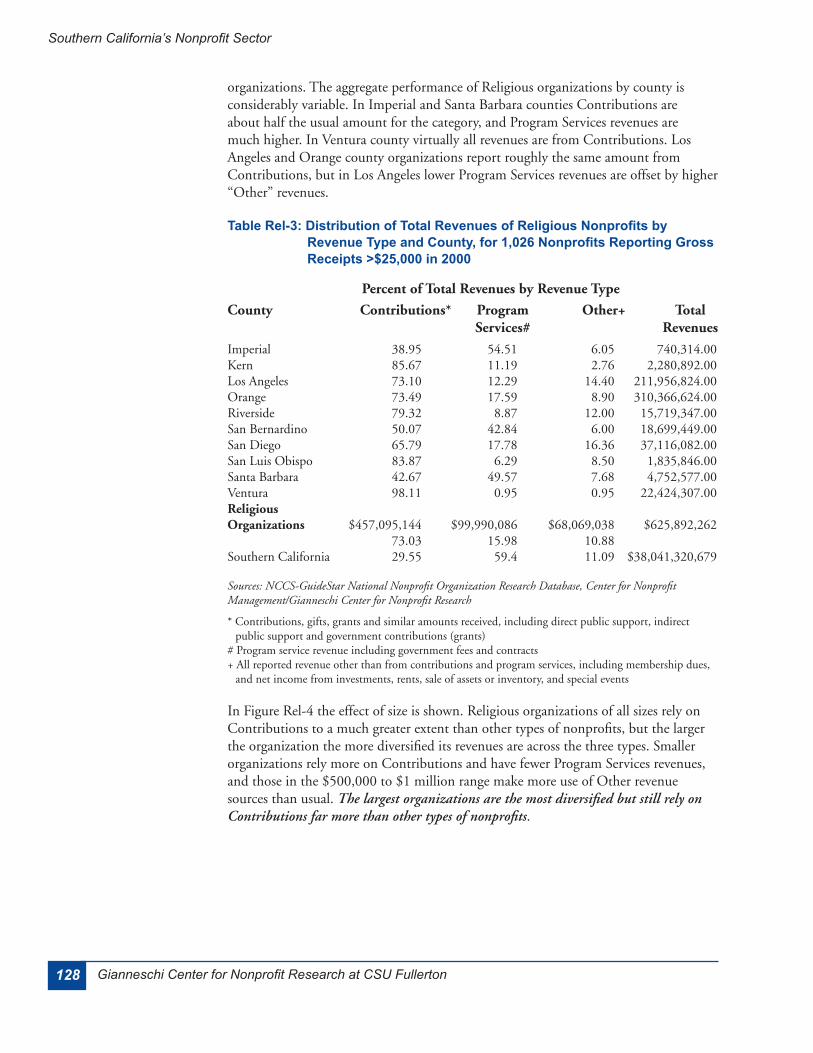
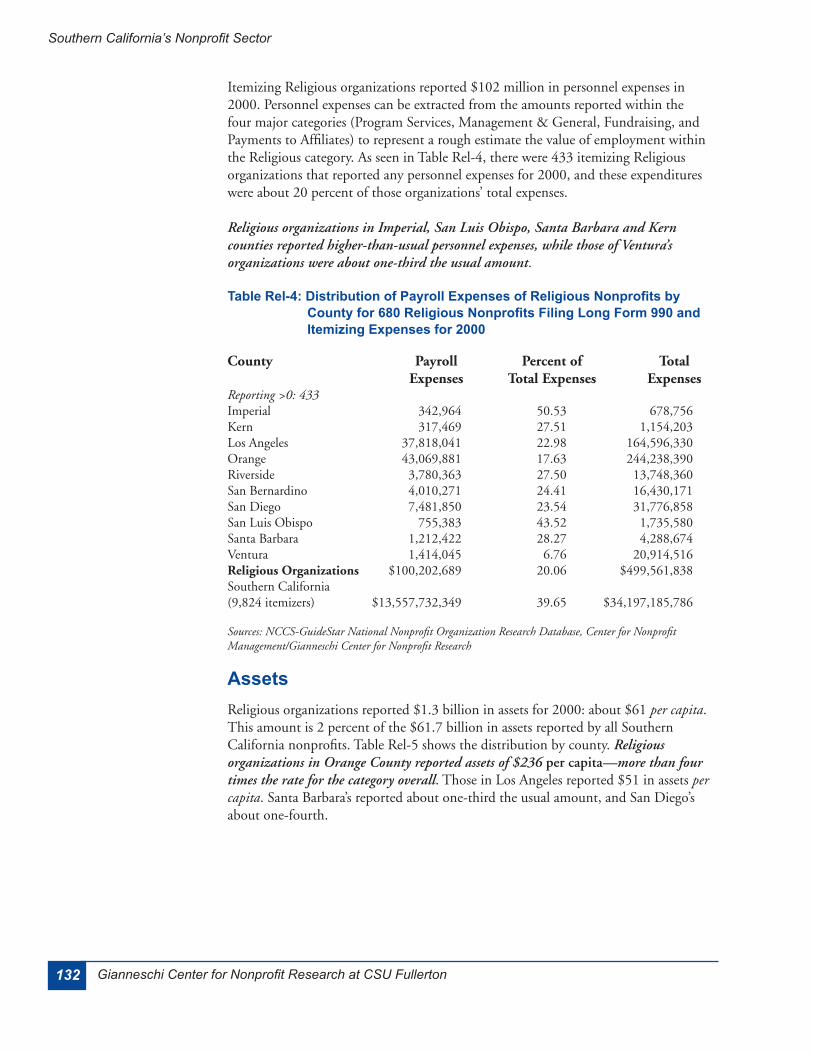
County, for 1,026 Nonprofits Reporting Gross Receipts >$25,000 in 2000 ....................128Table Rel-4: Distribution of Payroll Expenses of Religious Nonprofits by County for 680
Religious Nonprofits Filing Long Form 990 and Itemizing Expenses for 2000 ...............132Table Rel-5: Distribution of Total Assets of Religious Nonprofits by County, for 1,026 Nonprofits
Reporting Gross Receipts >$25,000 in 2000 .................................................................133
xvCenter for Nonprofit Management
Foreword
Foreword

xvi Gianneschi Center for Nonprofit Research at CSU Fullerton
Southern California’s Nonprofit Sector
1Center for Nonprofit Management
Executive Summary
The Numbers
Executive Summary
2 Gianneschi Center for Nonprofit Research at CSU Fullerton
Southern California’s Nonprofit Sector
Place
3Center for Nonprofit Management
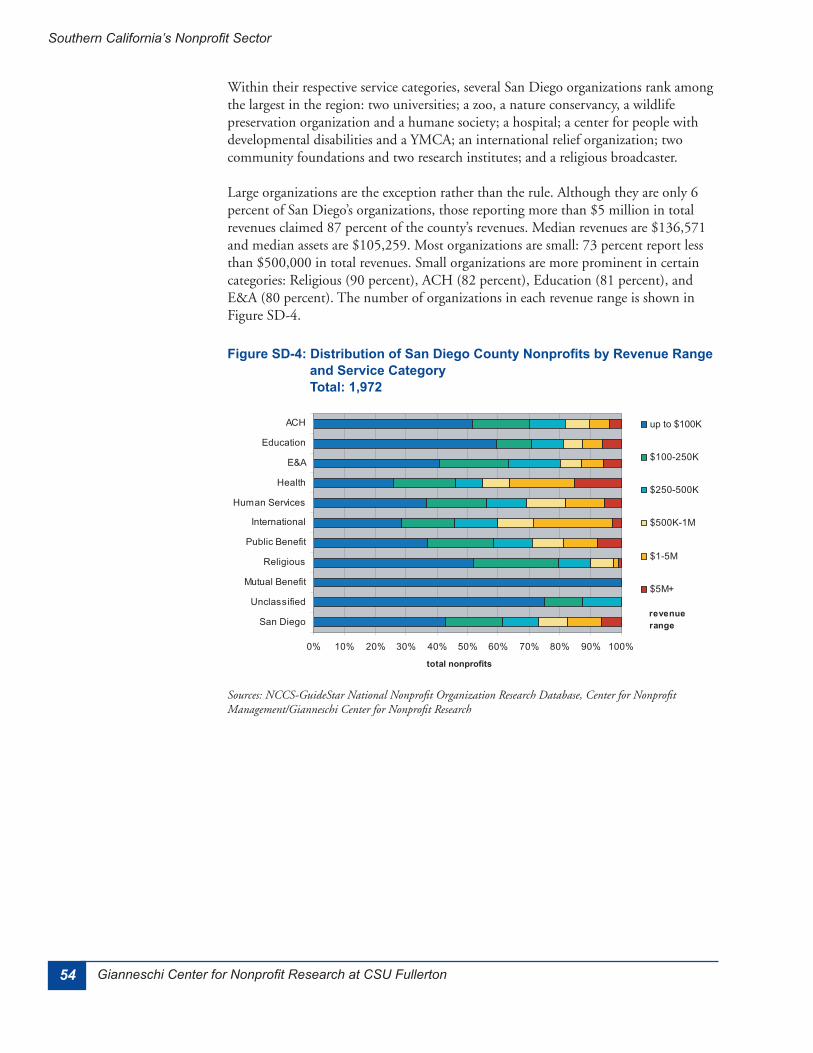
Large Organizations Dominate
Economic and Payroll Impact
Executive Summary
4 Gianneschi Center for Nonprofit Research at CSU Fullerton
Southern California’s Nonprofit Sector
5Center for Nonprofit Management
Southern California and Its Nonprofit Sector
The Southern California Region
Southern California and Its Nonprofit Sector
6 Gianneschi Center for Nonprofit Research at CSU Fullerton
Southern California’s Nonprofit Sector
7Center for Nonprofit Management
Southern California and Its Nonprofit Sector
Southern California’s Nonprofit Sector: A Glass Half-Full
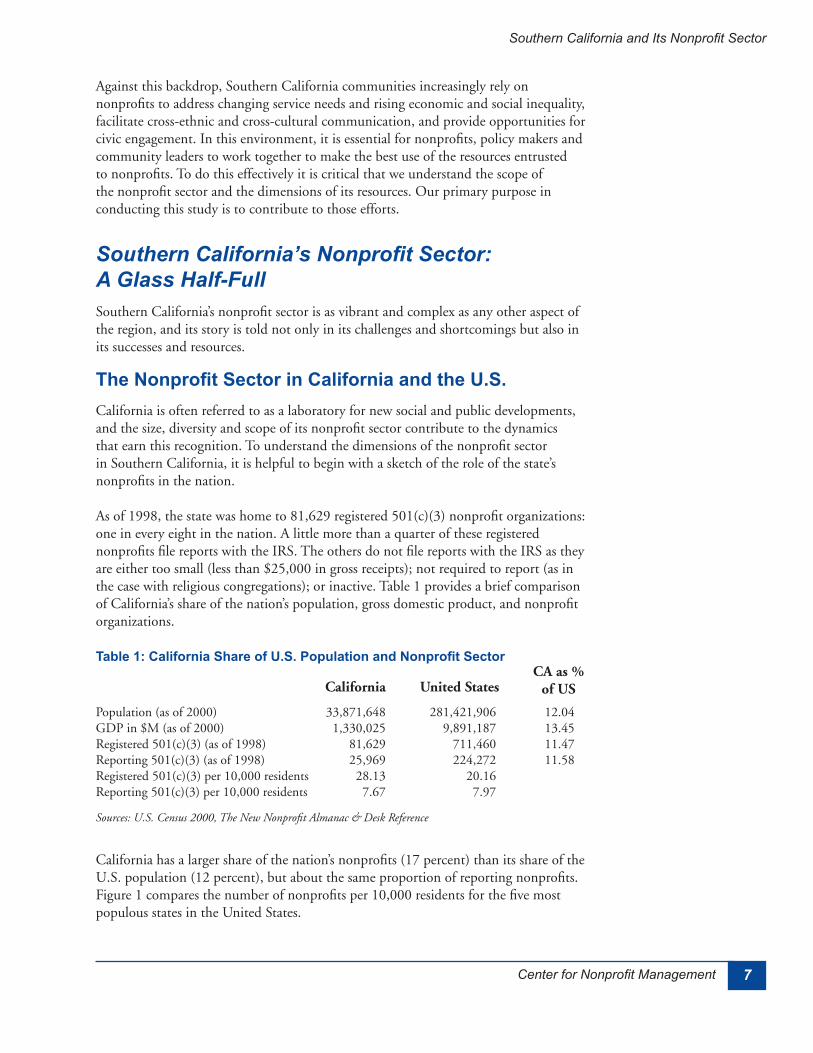
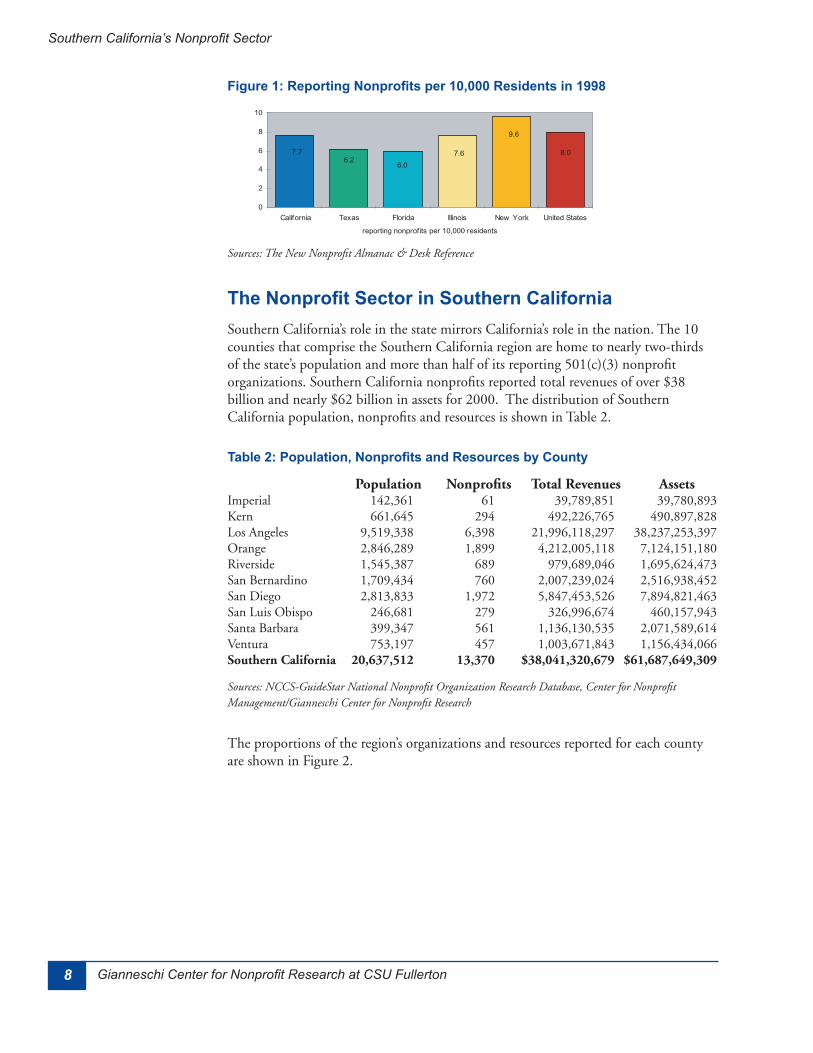
The Nonprofit Sector in California and the U.S.
Table 1: California Share of U.S. Population and Nonprofit Sector
8 Gianneschi Center for Nonprofit Research at CSU Fullerton
Southern California’s Nonprofit Sector
Figure 1: Reporting Nonprofits per 10,000 Residents in 1998
The Nonprofit Sector in Southern California
Table 2: Population, Nonprofits and Resources by County
9Center for Nonprofit Management
Southern California and Its Nonprofit Sector
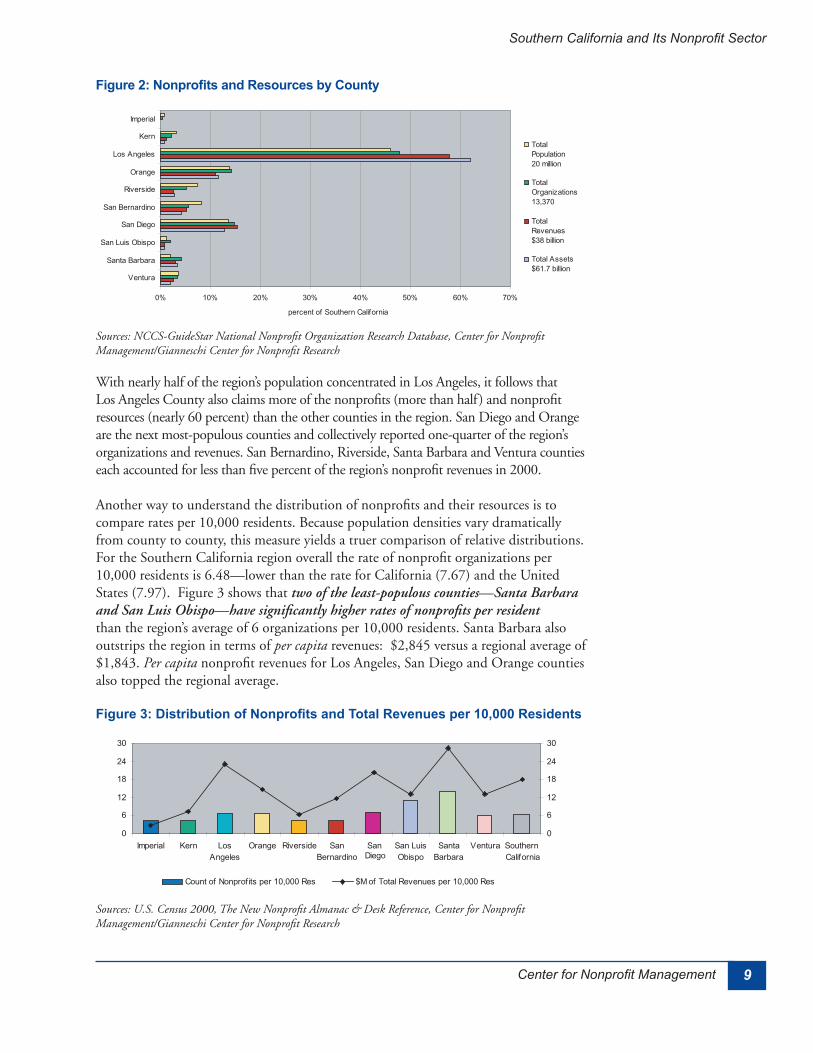
Figure 2: Nonprofits and Resources by County
Figure 3: Distribution of Nonprofits and Total Revenues per 10,000 Residents
10 Gianneschi Center for Nonprofit Research at CSU Fullerton
Southern California’s Nonprofit Sector
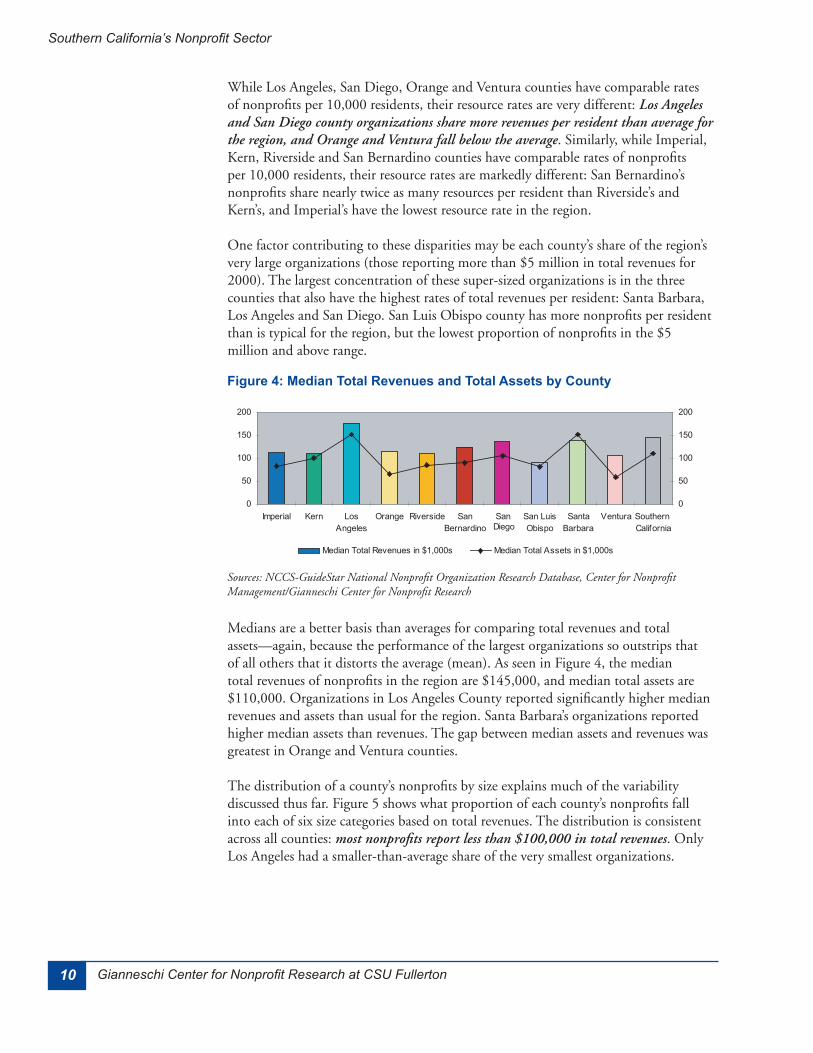
Figure 4: Median Total Revenues and Total Assets by County
11Center for Nonprofit Management
Southern California and Its Nonprofit Sector
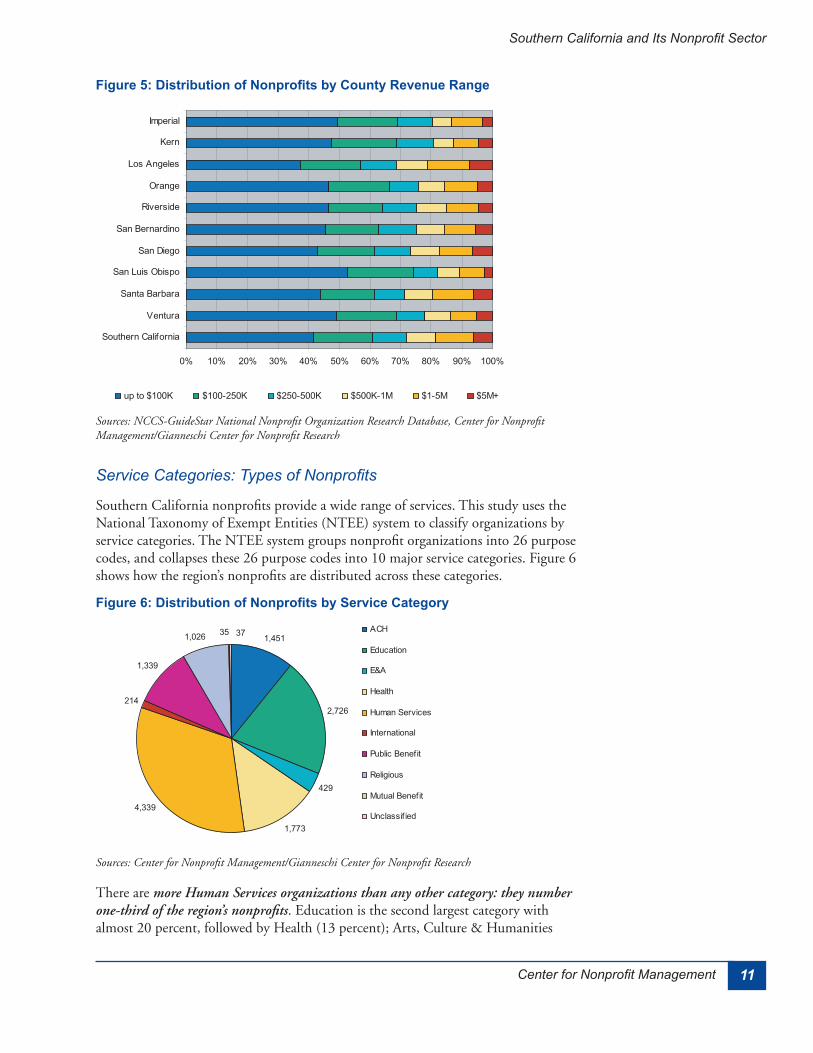
Figure 5: Distribution of Nonprofits by County Revenue Range
Service Categories: Types of Nonprofits
Figure 6: Distribution of Nonprofits by Service Category
12 Gianneschi Center for Nonprofit Research at CSU Fullerton
Southern California’s Nonprofit Sector
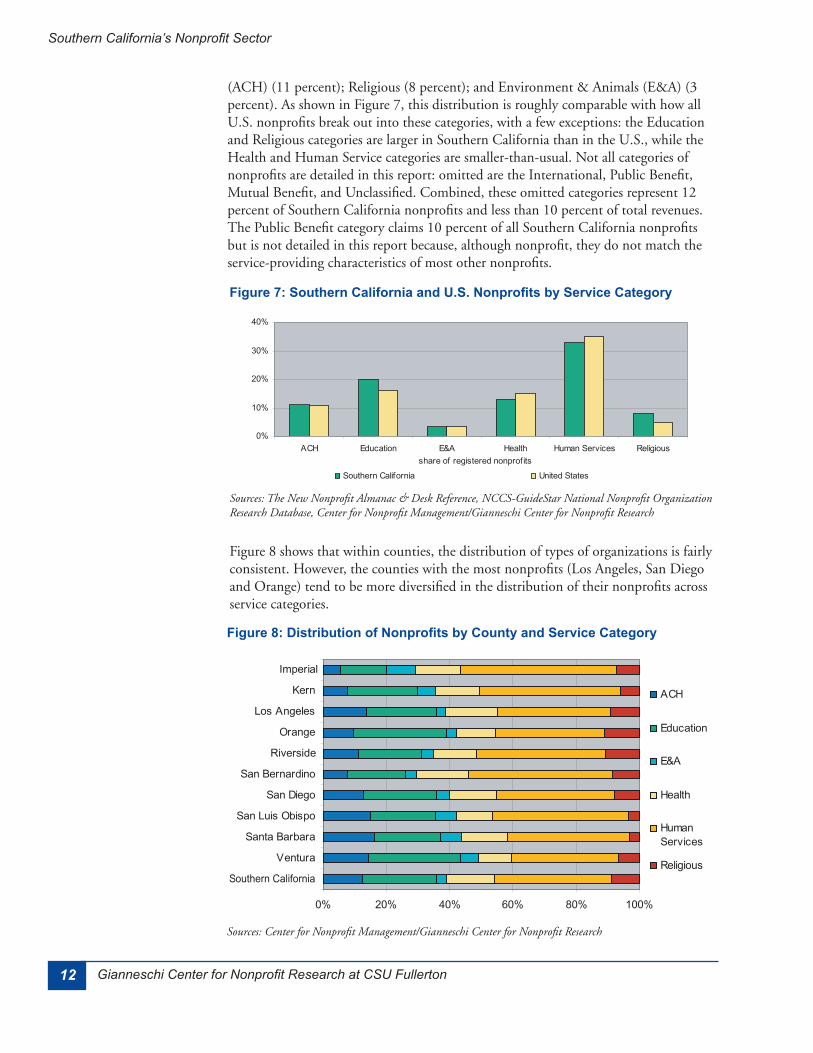
Figure 7: Southern California and U.S. Nonprofits by Service Category
Figure 8: Distribution of Nonprofits by County and Service Category
13Center for Nonprofit Management
Southern California and Its Nonprofit Sector
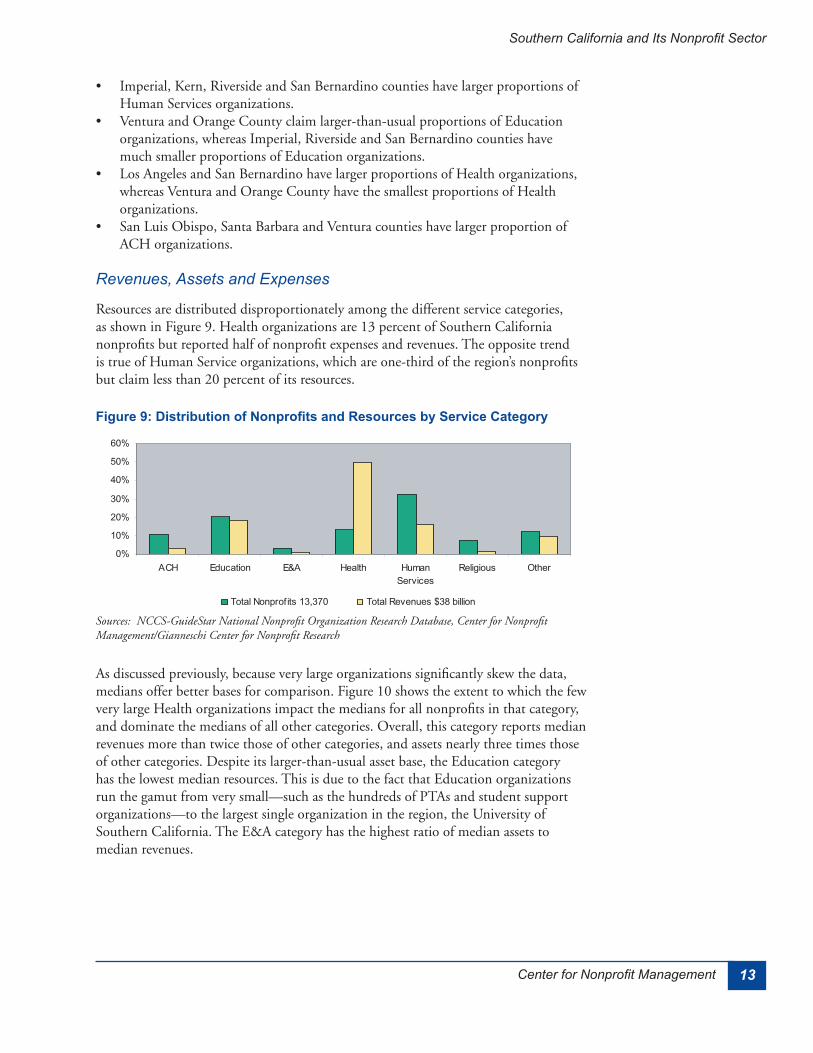
Revenues, Assets and Expenses
Figure 9: Distribution of Nonprofits and Resources by Service Category
14 Gianneschi Center for Nonprofit Research at CSU Fullerton
Southern California’s Nonprofit Sector
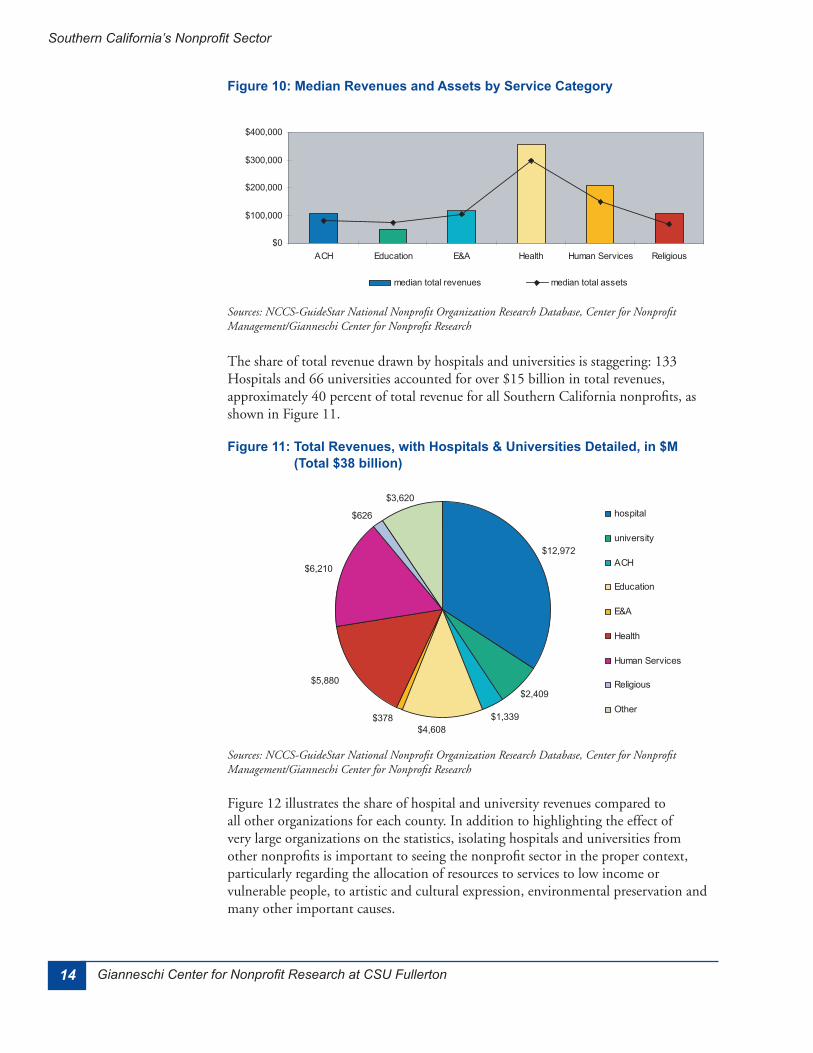
Figure 10: Median Revenues and Assets by Service Category
Figure 11: Total Revenues, with Hospitals & Universities Detailed, in $M (Total $38 billion)
15Center for Nonprofit Management
Southern California and Its Nonprofit Sector
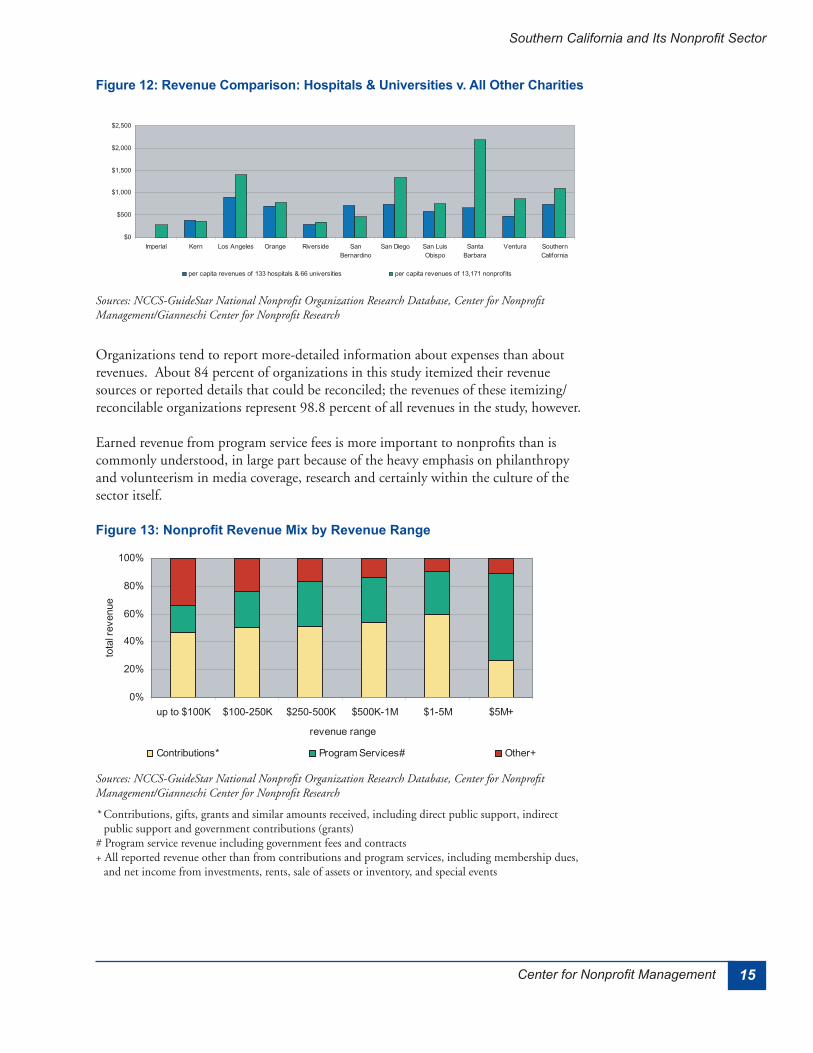
Figure 12: Revenue Comparison: Hospitals & Universities v. All Other Charities
Figure 13: Nonprofit Revenue Mix by Revenue Range
16 Gianneschi Center for Nonprofit Research at CSU Fullerton
Southern California’s Nonprofit Sector
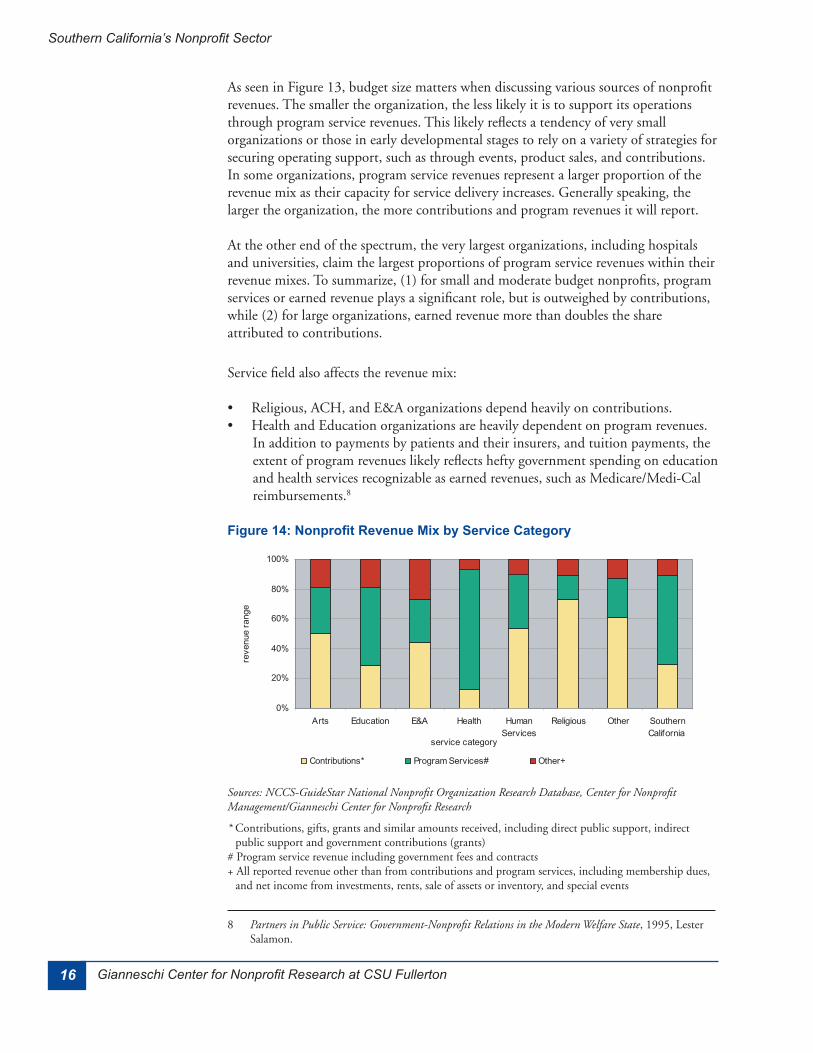
Figure 14: Nonprofit Revenue Mix by Service Category
17Center for Nonprofit Management
Southern California and Its Nonprofit Sector
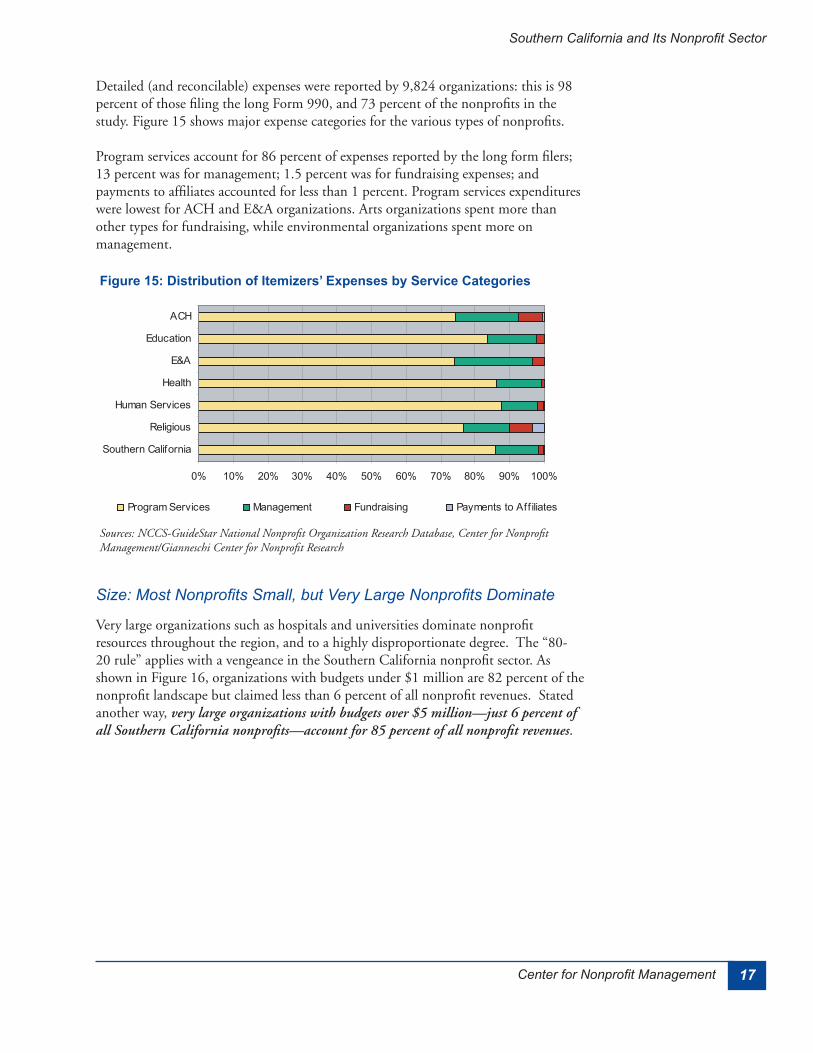
Figure 15: Distribution of Itemizers’ Expenses by Service Categories
Size: Most Nonprofits Small, but Very Large Nonprofits Dominate
18 Gianneschi Center for Nonprofit Research at CSU Fullerton
Southern California’s Nonprofit Sector
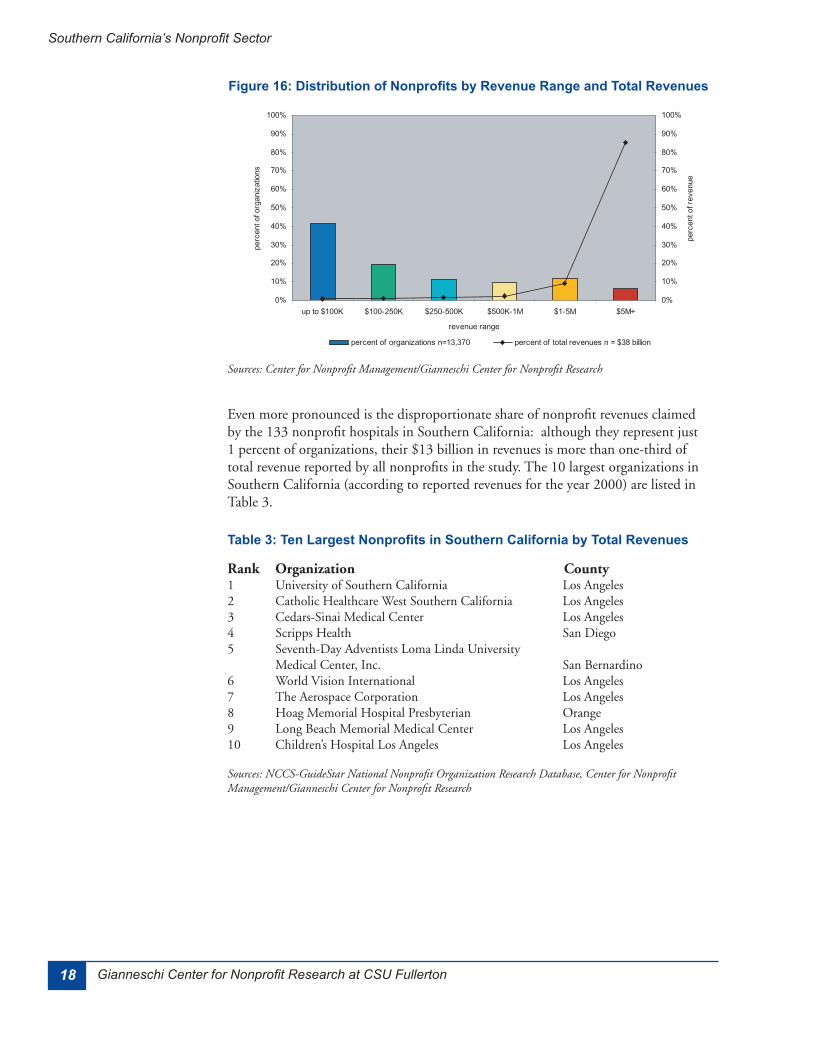
Figure 16: Distribution of Nonprofits by Revenue Range and Total Revenues
Table 3: Ten Largest Nonprofits in Southern California by Total Revenues
19Center for Nonprofit Management
Southern California and Its Nonprofit Sector
Economic and Employment Impact
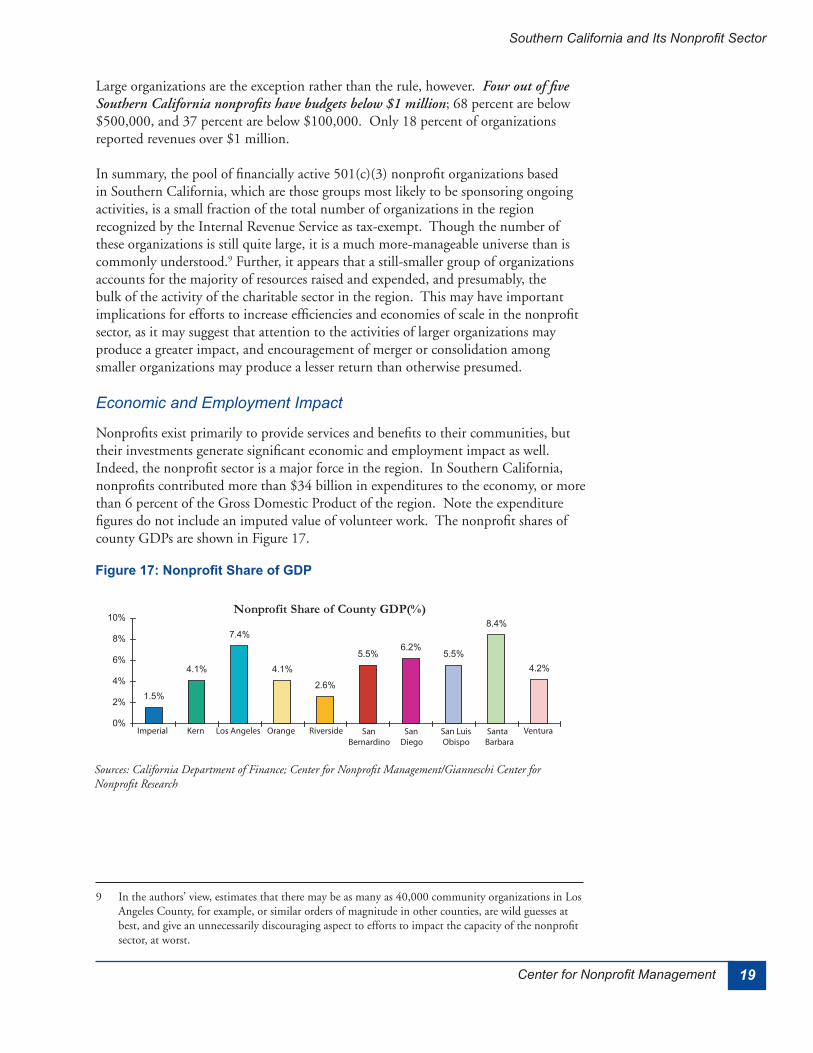
Figure 17: Nonprofit Share of GDP
Nonprofit Share of County GDP(%)
20 Gianneschi Center for Nonprofit Research at CSU Fullerton
Southern California’s Nonprofit Sector
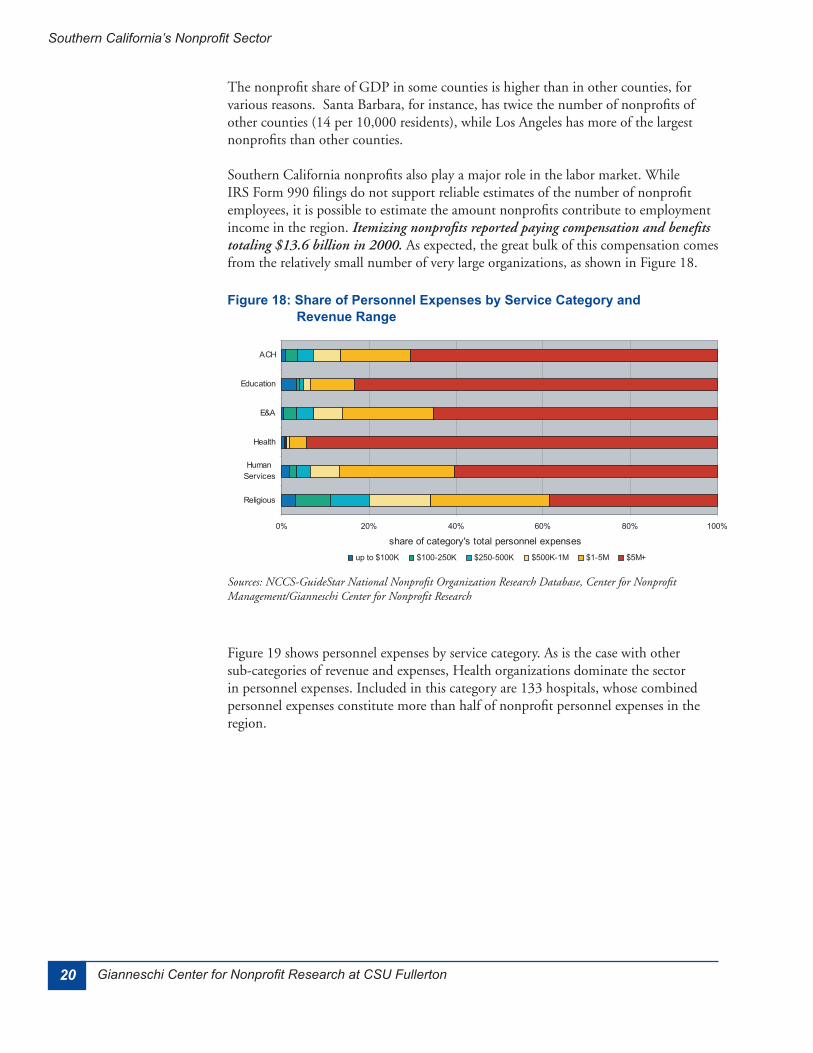
Figure 18: Share of Personnel Expenses by Service Category and Revenue Range
21Center for Nonprofit Management
Southern California and Its Nonprofit Sector
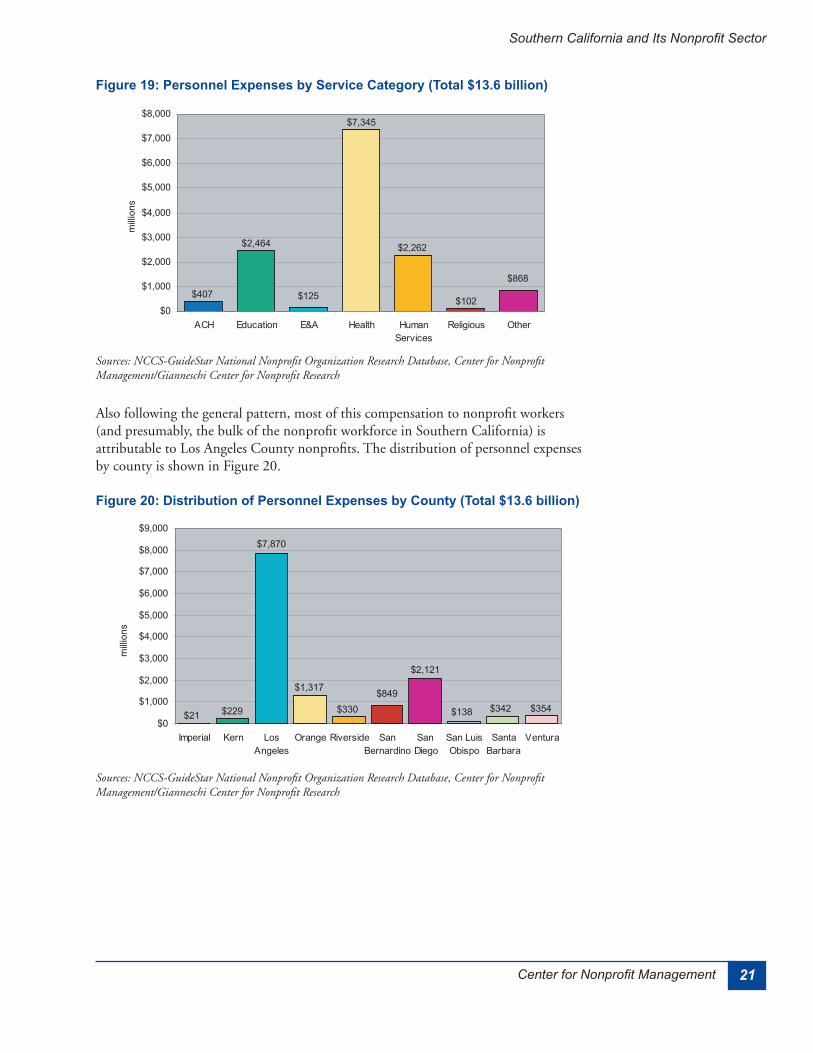
Figure 19: Personnel Expenses by Service Category (Total $13.6 billion)
Figure 20: Distribution of Personnel Expenses by County (Total $13.6 billion)
22 Gianneschi Center for Nonprofit Research at CSU Fullerton
Southern California’s Nonprofit Sector
So What? Implications for Future Action
23Center for Nonprofit Management
Southern California and Its Nonprofit Sector
Prospects for Coordinating Efforts: “It’s a Small World”
The Possibility and Necessity of Segmenting the Sector by Size and Service Field
24 Gianneschi Center for Nonprofit Research at CSU Fullerton
Southern California’s Nonprofit Sector
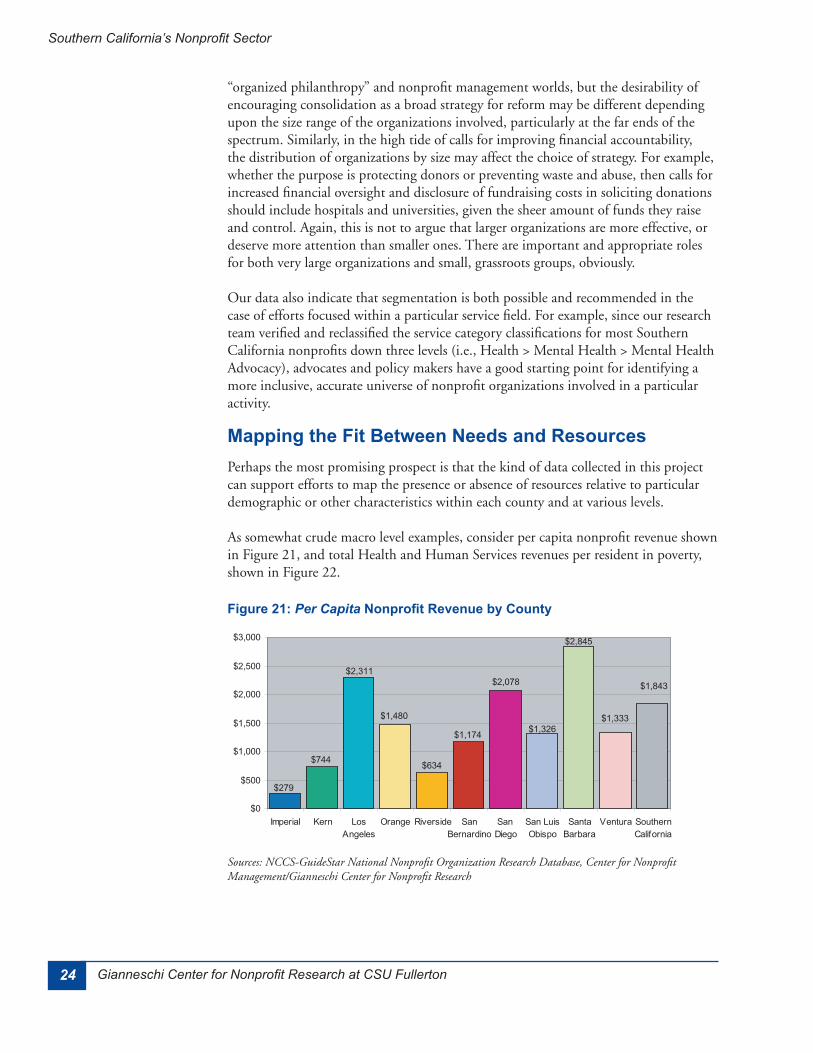
Mapping the Fit Between Needs and Resources
Figure 21: Per Capita Nonprofit Revenue by County
25Center for Nonprofi t Management
Southern California and Its Nonprofi t Sector
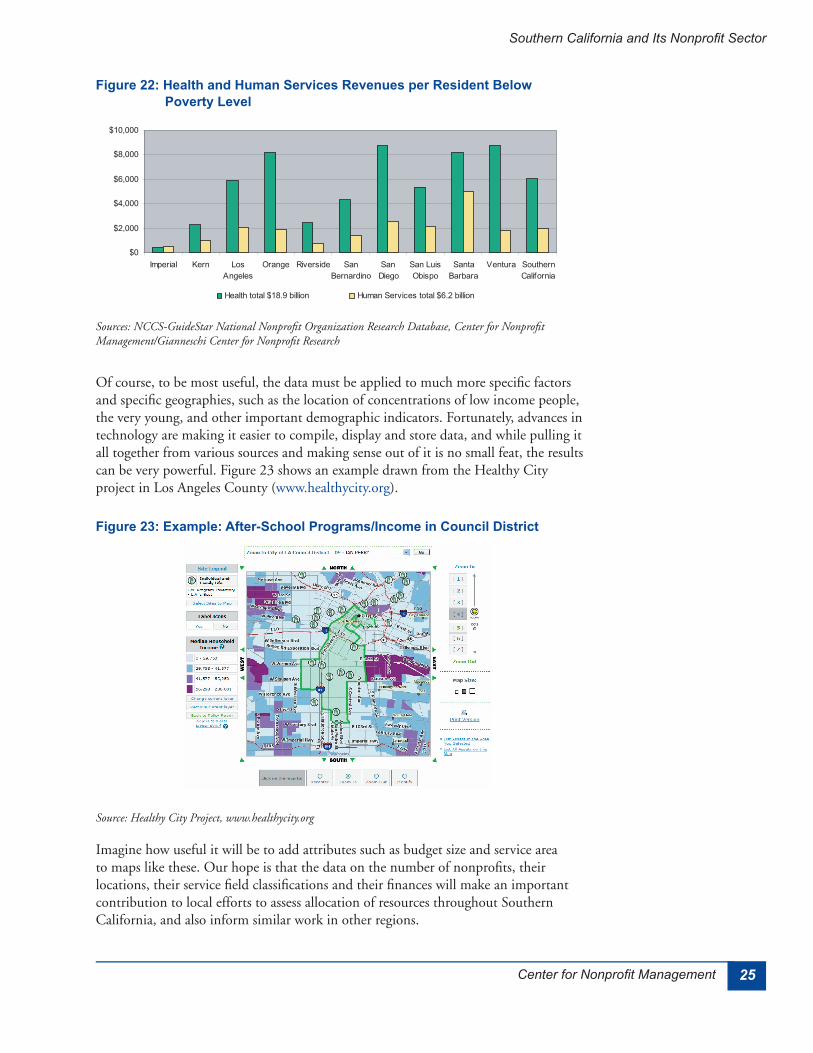
Figure 22: Health and Human Services Revenues per Resident Below Poverty Level
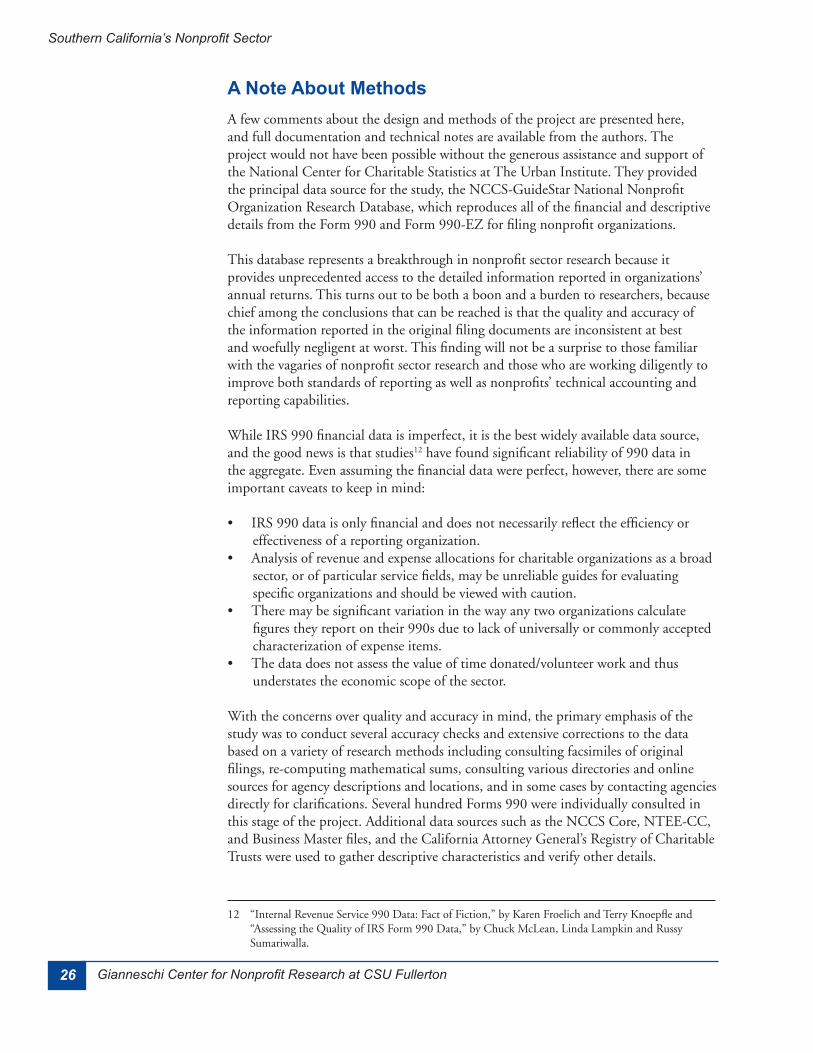
Figure 23: Example: After-School Programs/Income in Council District
26 Gianneschi Center for Nonprofit Research at CSU Fullerton
Southern California’s Nonprofit Sector
A Note About Methods
27Center for Nonprofit Management
Southern California and Its Nonprofit Sector

28 Gianneschi Center for Nonprofit Research at CSU Fullerton
Southern California’s Nonprofit Sector
29Center for Nonprofit Management
Service Categories
Los Angeles County
Characteristics by County
Characteristics by County: Los Angeles
30 Gianneschi Center for Nonprofit Research at CSU Fullerton
Southern California’s Nonprofit Sector
ResourcesRevenues and Assets
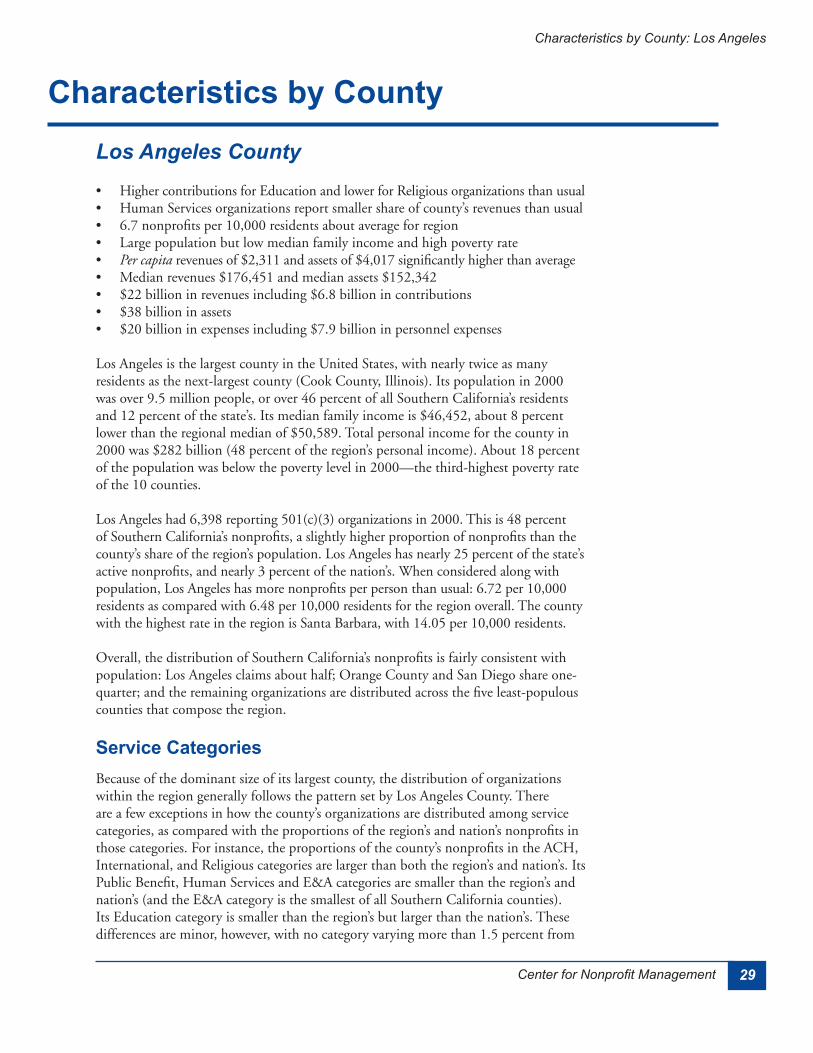
Figure LA-1: Los Angeles County Religious, Educational and Charitable Nonprofits Reporting over $25,000 in Gross Receipts in 2000 by NTEE Major Category;; Total: 6,398
31Center for Nonprofit Management
Characteristics by County: Los Angeles
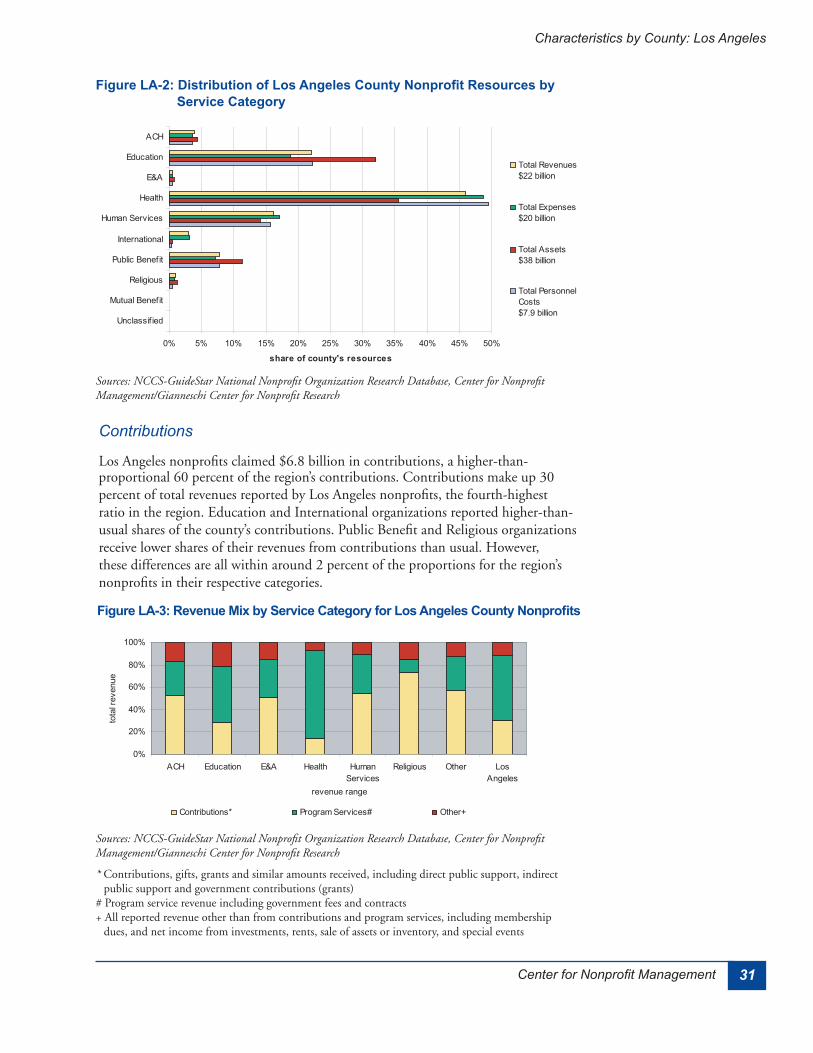
Contributions
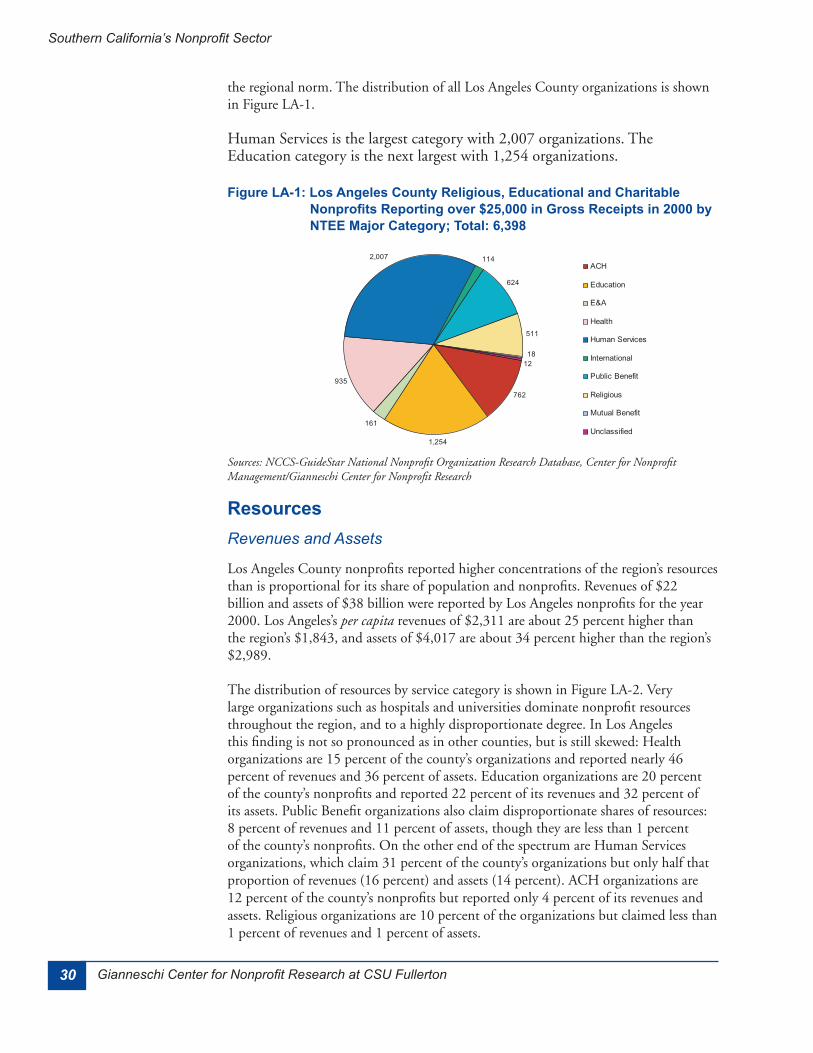
Figure LA-2: Distribution of Los Angeles County Nonprofit Resources by Service Category
Figure LA-3: Revenue Mix by Service Category for Los Angeles County Nonprofits
32 Gianneschi Center for Nonprofit Research at CSU Fullerton
Southern California’s Nonprofit Sector
Expenses
Employment
Size
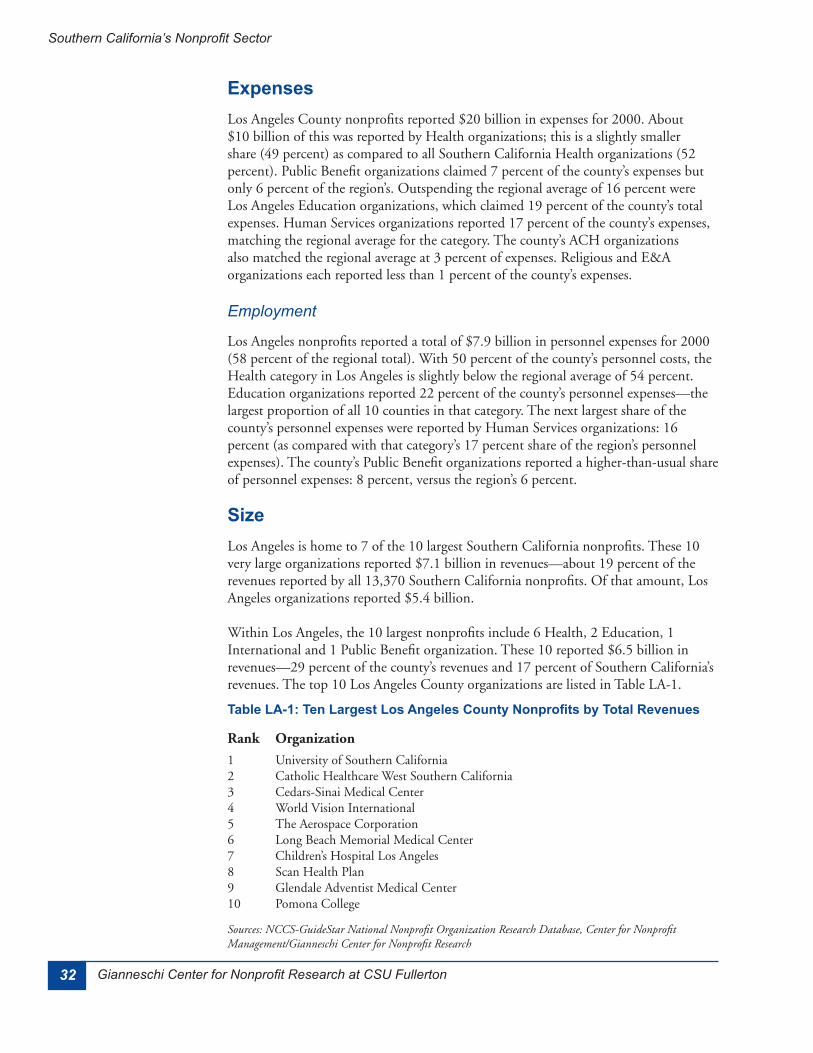
Table LA-1: Ten Largest Los Angeles County Nonprofits by Total Revenues
33Center for Nonprofit Management
Characteristics by County: Los Angeles
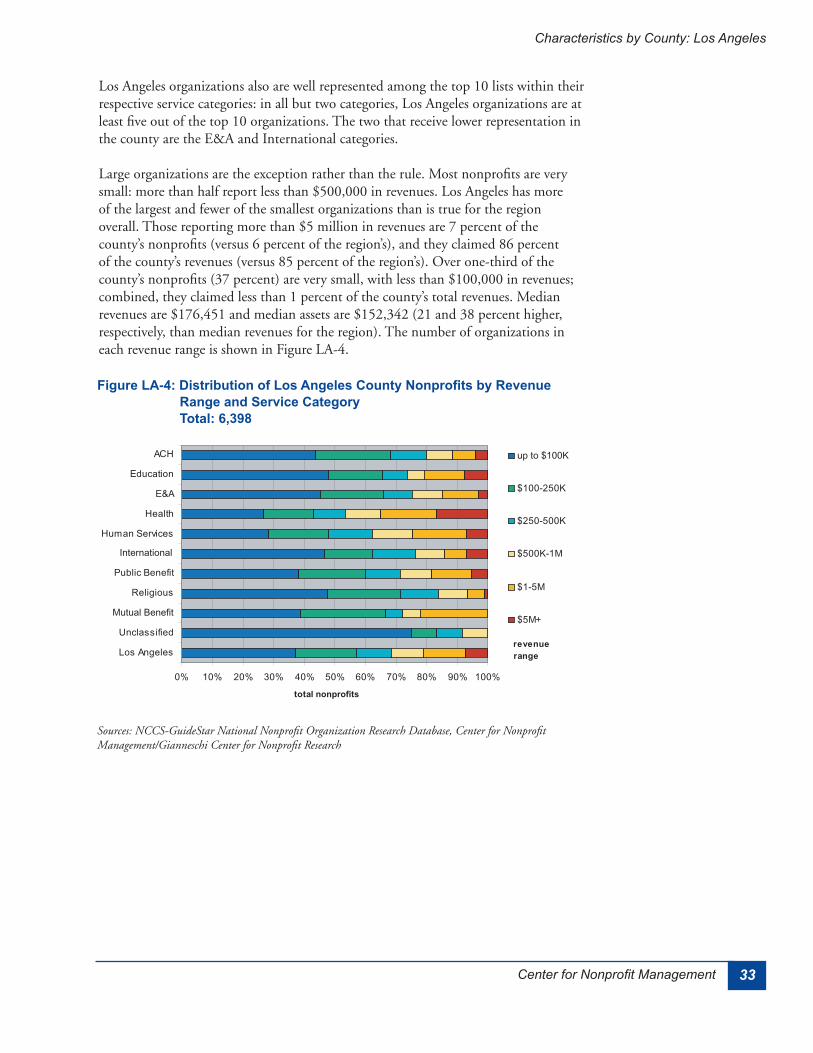
Figure LA-4: Distribution of Los Angeles County Nonprofits by Revenue Range and Service Category Total: 6,398
34 Gianneschi Center for Nonprofit Research at CSU Fullerton
Southern California’s Nonprofit Sector
Orange County
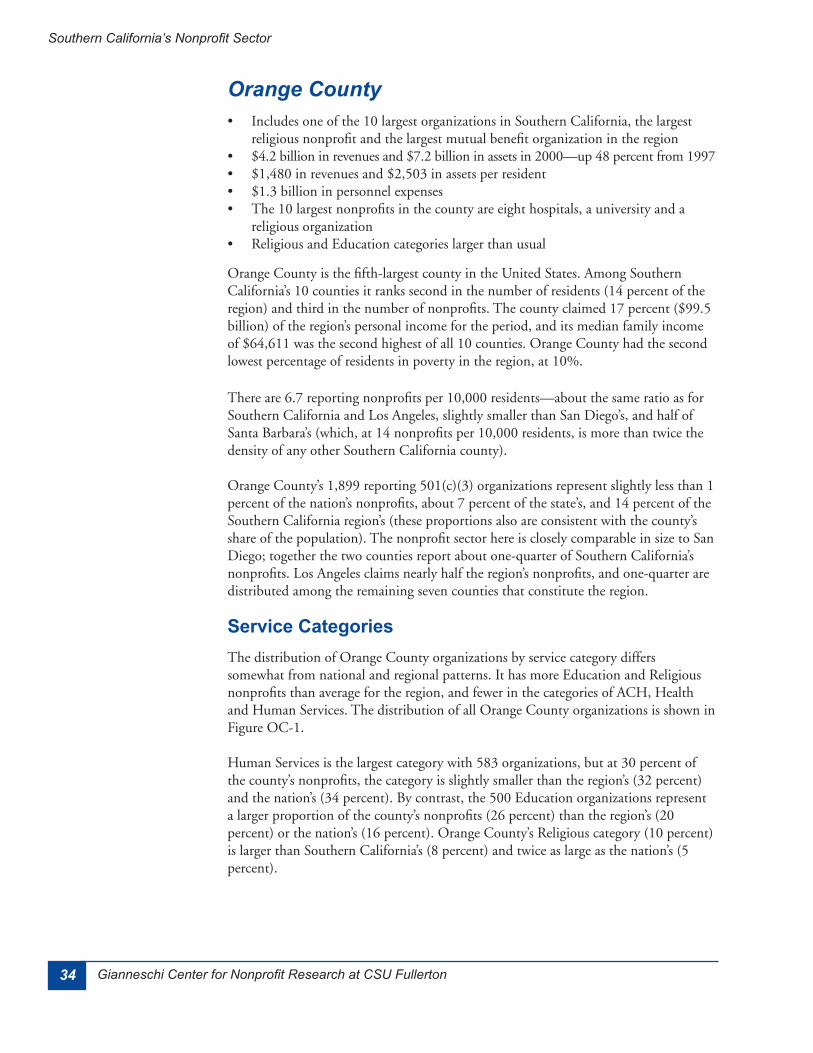
Service Categories
35Center for Nonprofit Management
Characteristics by County: Orange
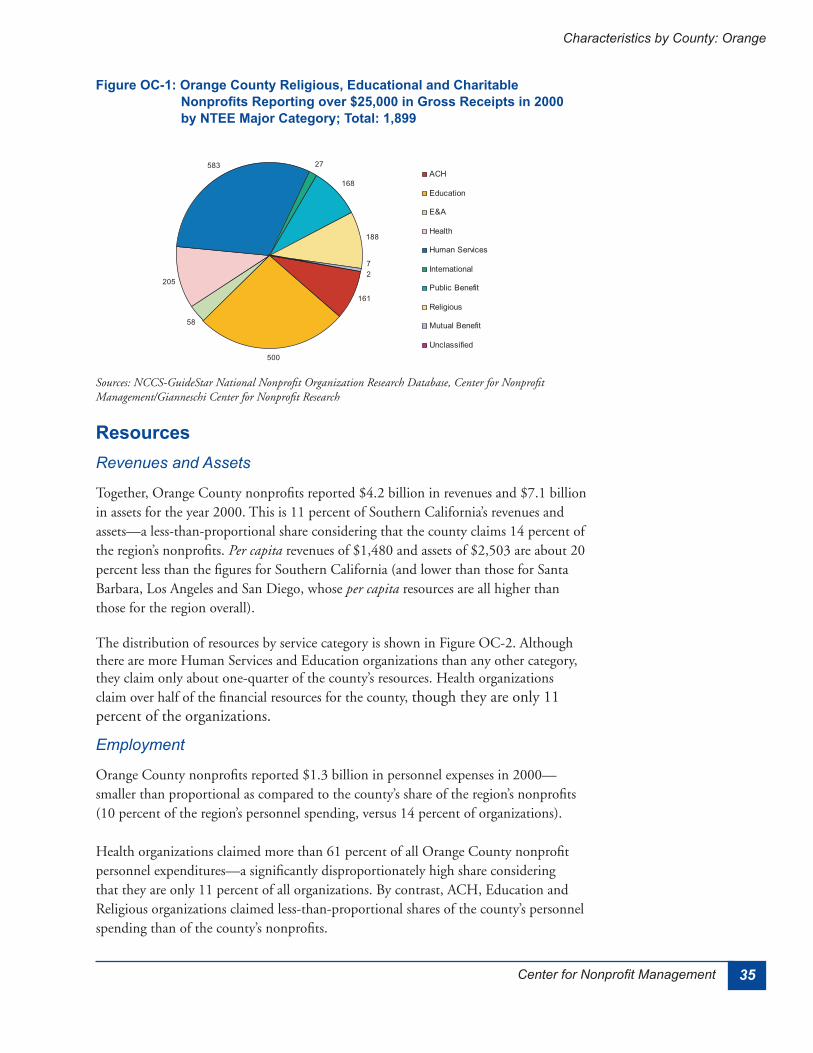
ResourcesRevenues and Assets
Employment
Figure OC-1: Orange County Religious, Educational and Charitable Nonprofits Reporting over $25,000 in Gross Receipts in 2000 by NTEE Major Category;; Total: 1,899
36 Gianneschi Center for Nonprofit Research at CSU Fullerton
Southern California’s Nonprofit Sector
Expenses
Contributions
Figure OC-2: Distribution of Orange County Nonprofit Resources by Service Category
37Center for Nonprofit Management
Characteristics by County: Orange
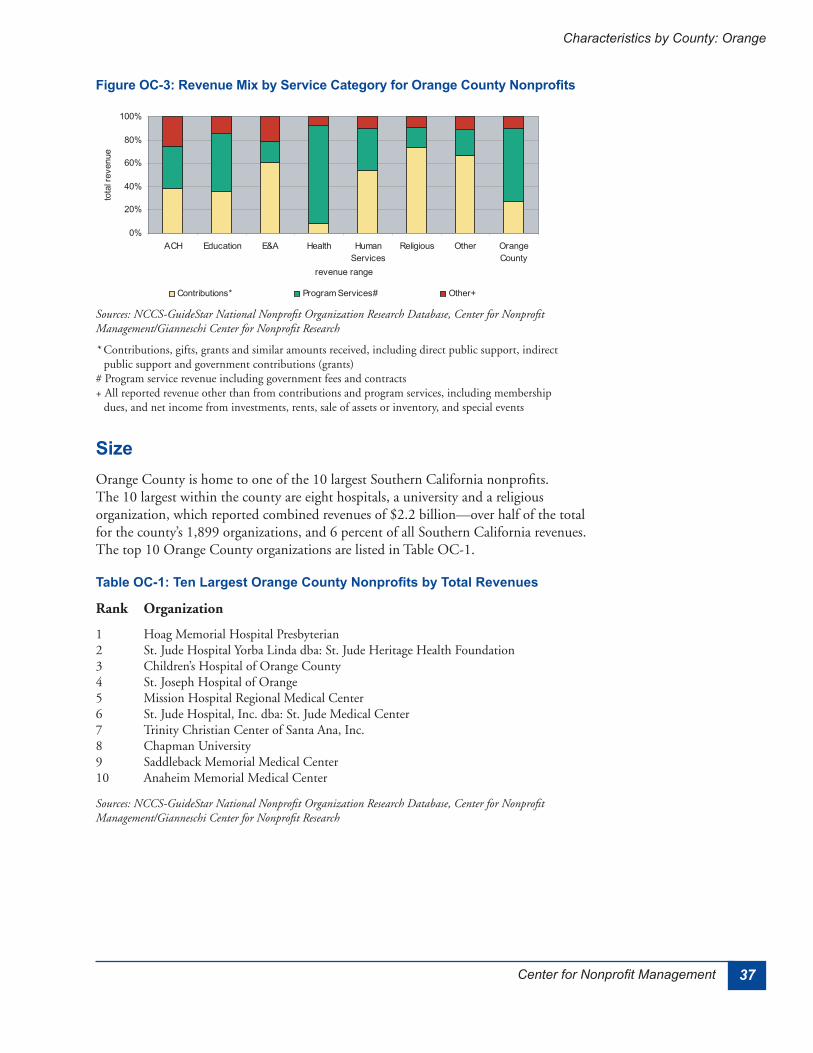
Figure OC-3: Revenue Mix by Service Category for Orange County Nonprofits
Size
Table OC-1: Ten Largest Orange County Nonprofits by Total Revenues
38 Gianneschi Center for Nonprofit Research at CSU Fullerton
Southern California’s Nonprofit Sector
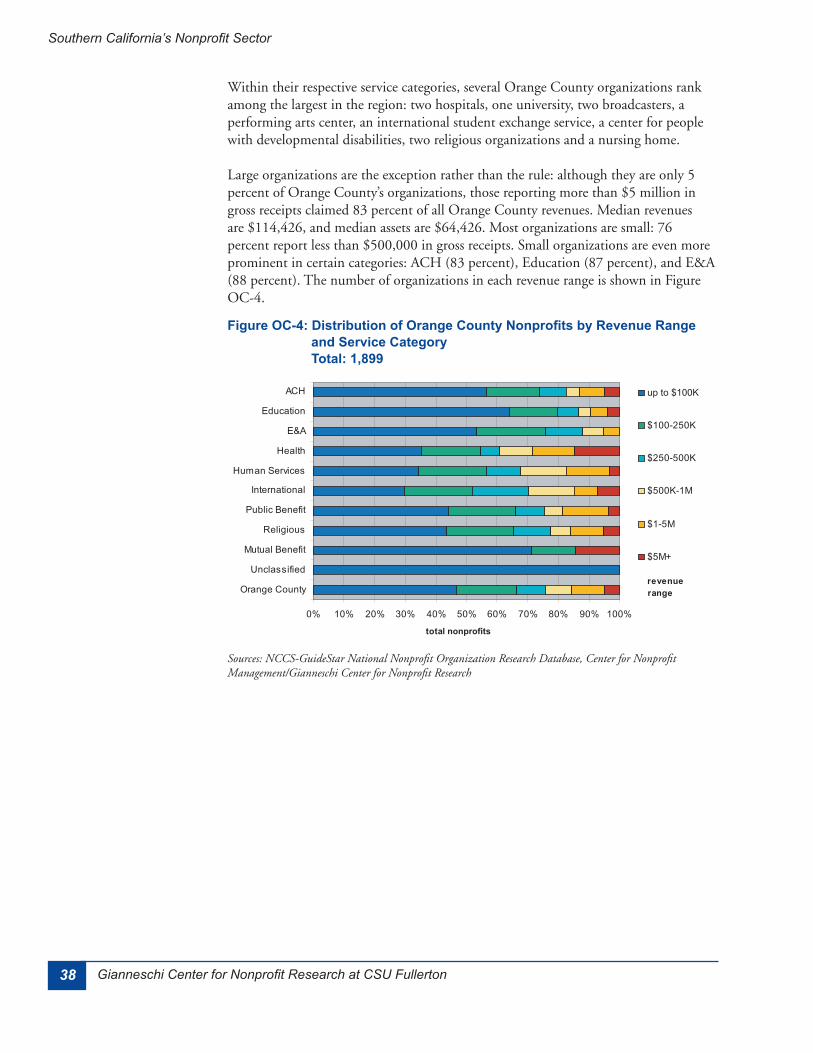
Figure OC-4: Distribution of Orange County Nonprofits by Revenue Range and Service Category Total: 1,899

39Center for Nonprofit Management
Comparison with Previous Results
14
15
16
Characteristics by County: Orange
40 Gianneschi Center for Nonprofit Research at CSU Fullerton
Southern California’s Nonprofit Sector
Riverside County
Service Categories
41Center for Nonprofit Management
Characteristics by County: Riverside
ResourcesRevenues and Assets
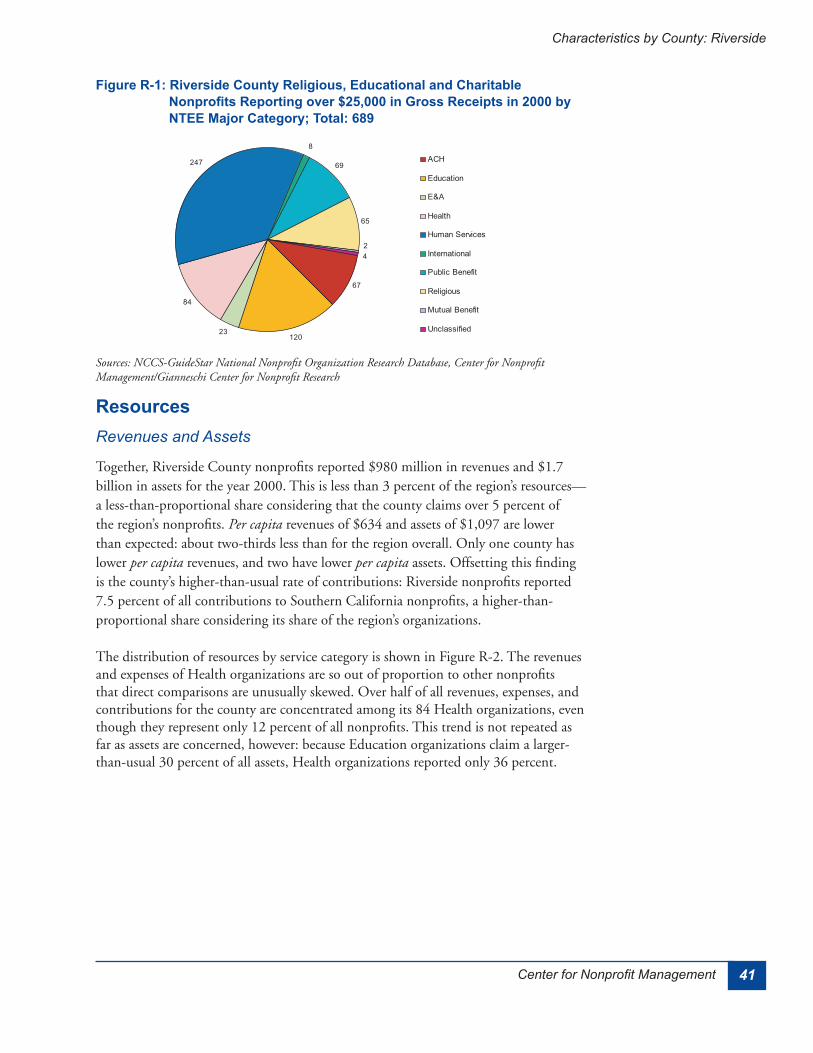
Figure R-1: Riverside County Religious, Educational and Charitable Nonprofits Reporting over $25,000 in Gross Receipts in 2000 by NTEE Major Category;; Total: 689
42 Gianneschi Center for Nonprofit Research at CSU Fullerton
Southern California’s Nonprofit Sector
Contributions
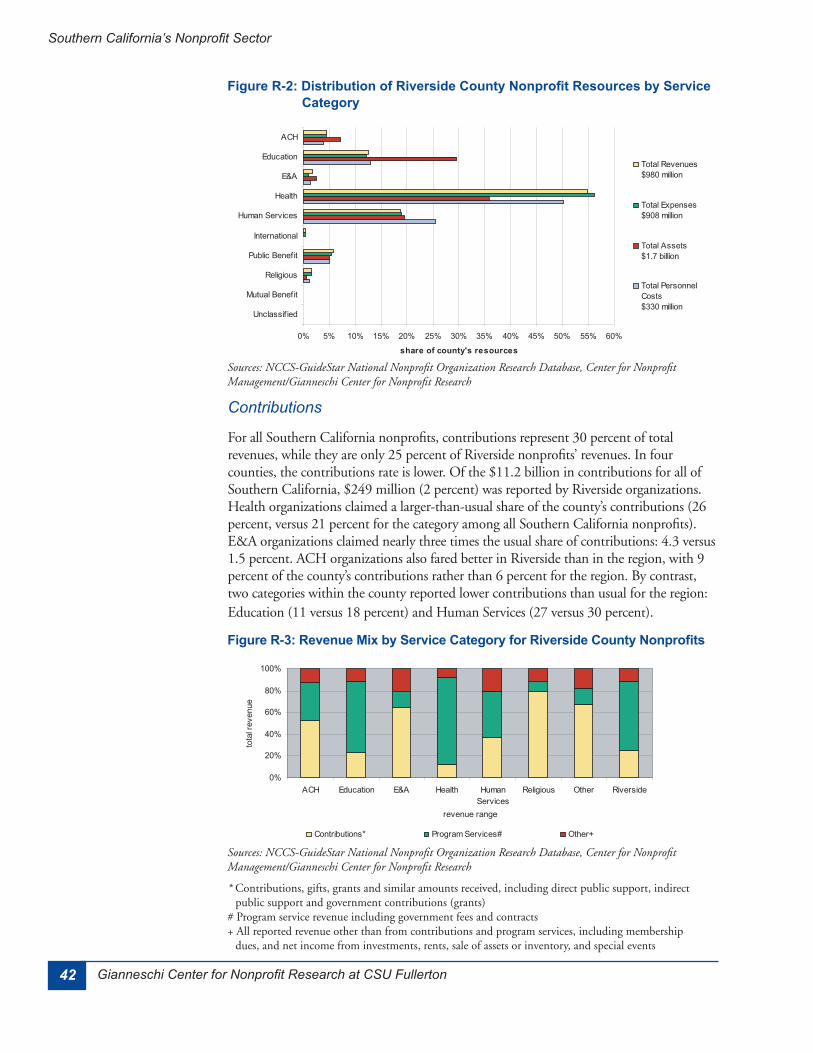
Figure R-2: Distribution of Riverside County Nonprofit Resources by Service Category
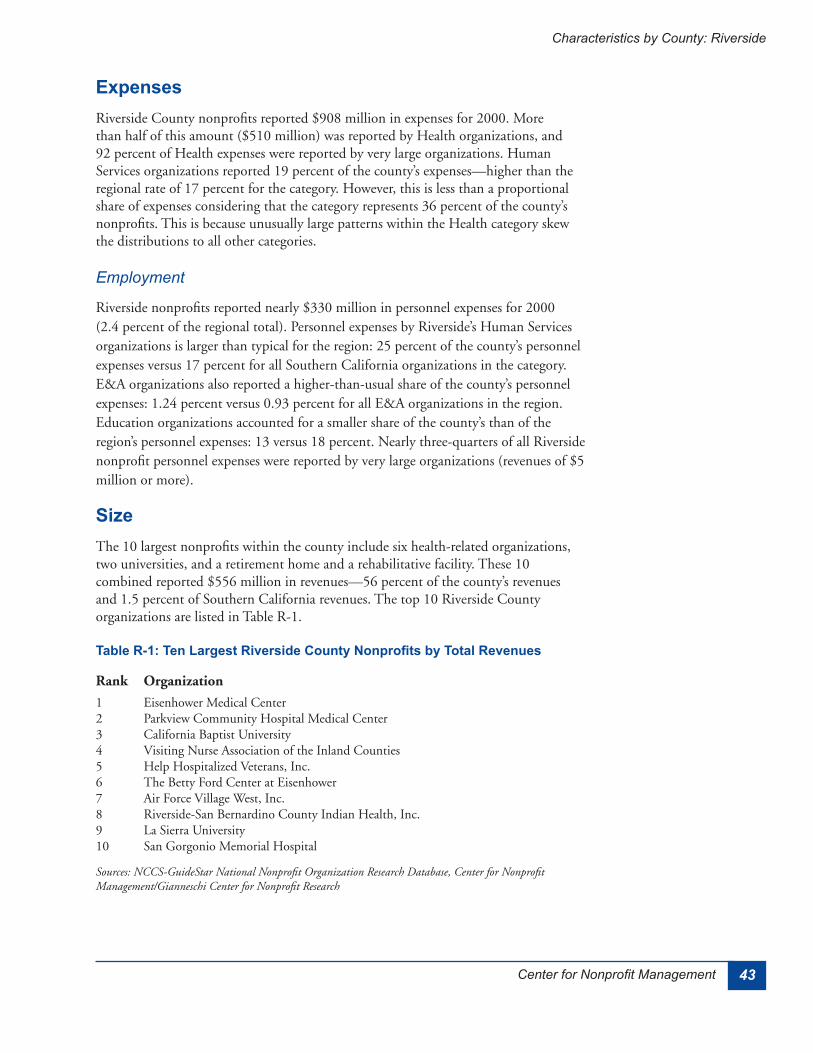
Figure R-3: Revenue Mix by Service Category for Riverside County Nonprofits
43Center for Nonprofit Management
Characteristics by County: Riverside
Expenses
Employment
Size
Table R-1: Ten Largest Riverside County Nonprofits by Total Revenues
44 Gianneschi Center for Nonprofit Research at CSU Fullerton
Southern California’s Nonprofit Sector
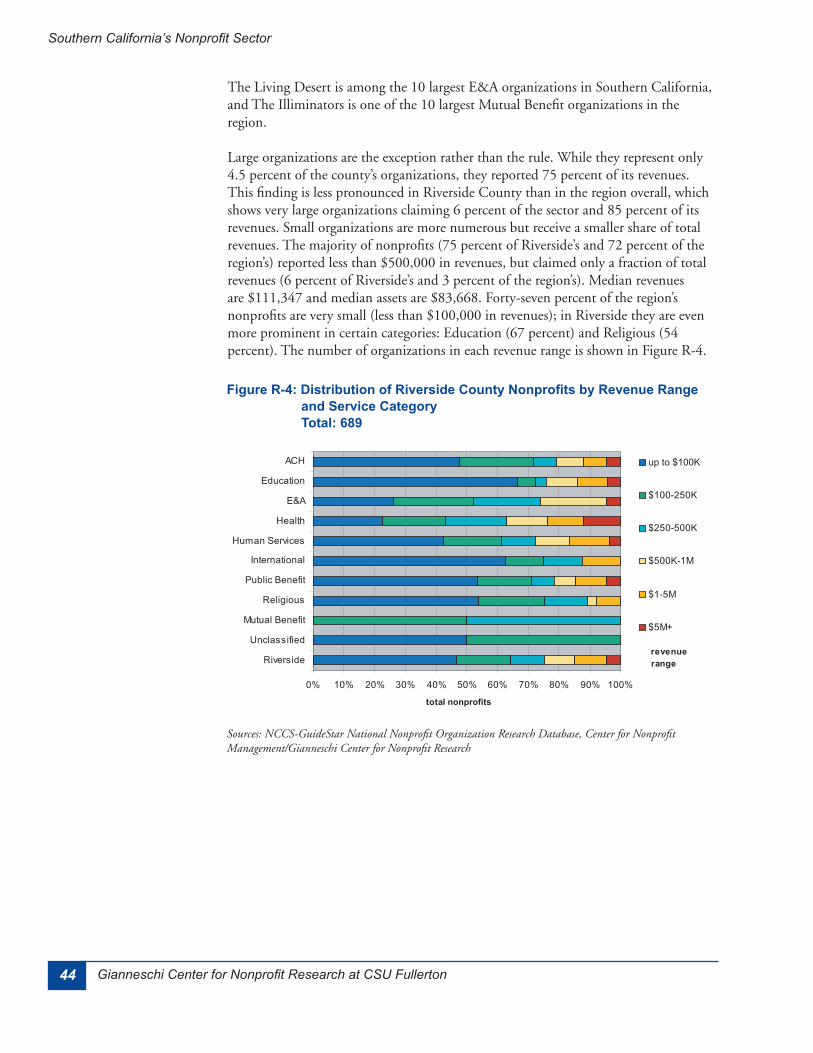
Figure R-4: Distribution of Riverside County Nonprofits by Revenue Range and Service Category Total: 689
45Center for Nonprofit Management
Characteristics by County: San Bernardino
San Bernardino County
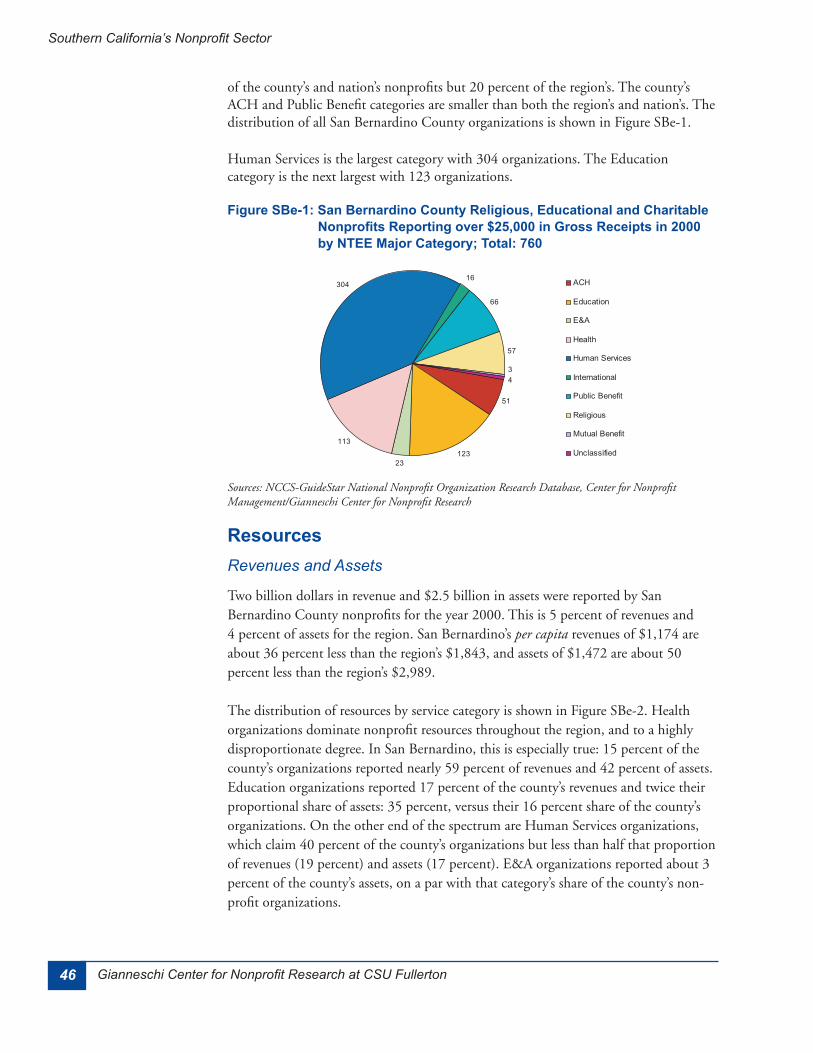
Service Categories
46 Gianneschi Center for Nonprofit Research at CSU Fullerton
Southern California’s Nonprofit Sector
Figure SBe-1: San Bernardino County Religious, Educational and Charitable Nonprofits Reporting over $25,000 in Gross Receipts in 2000 by NTEE Major Category;; Total: 760
ResourcesRevenues and Assets
47Center for Nonprofit Management
Characteristics by County: San Bernardino
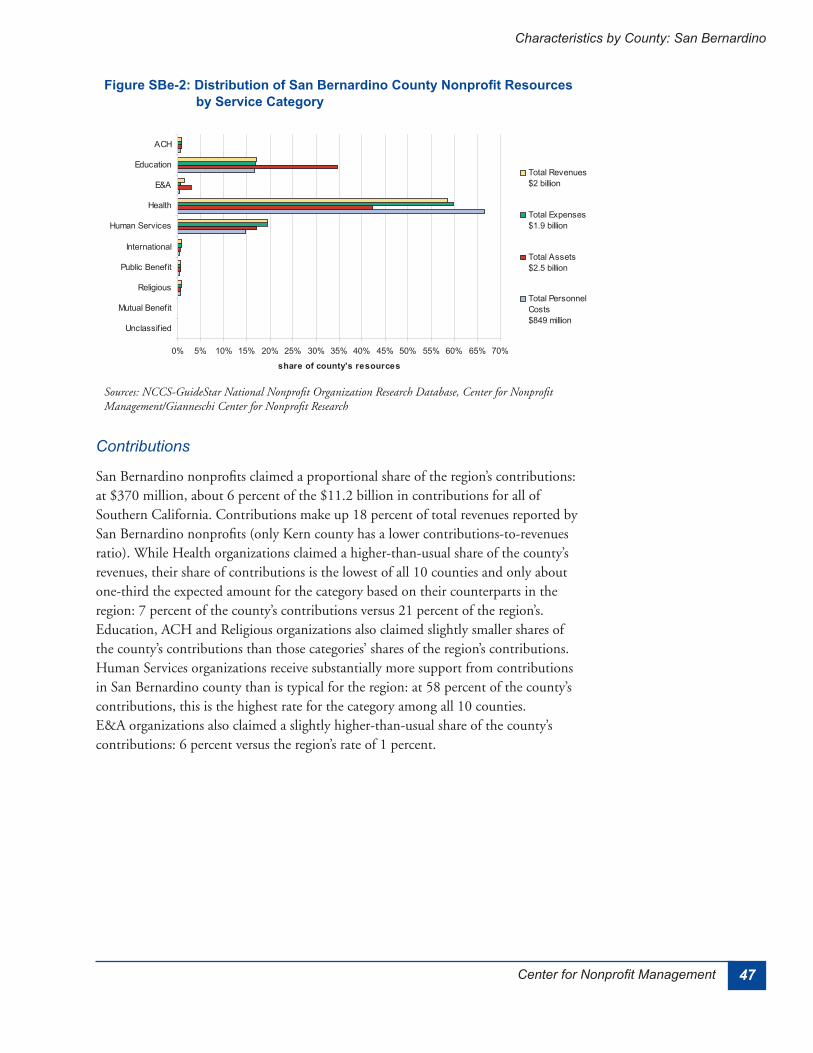
Figure SBe-2: Distribution of San Bernardino County Nonprofit Resources by Service Category
Contributions
48 Gianneschi Center for Nonprofit Research at CSU Fullerton
Southern California’s Nonprofit Sector
Expenses
Employment
Size
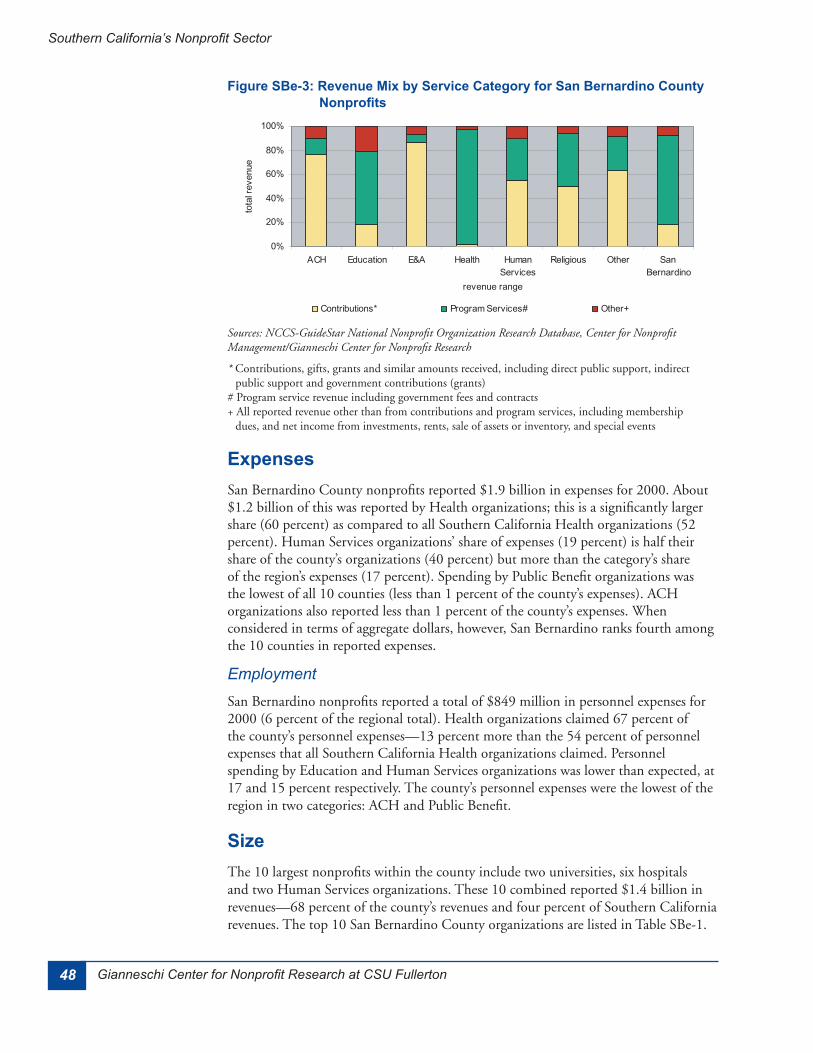
Figure SBe-3: Revenue Mix by Service Category for San Bernardino County Nonprofits
49Center for Nonprofit Management
Characteristics by County: San Bernardino
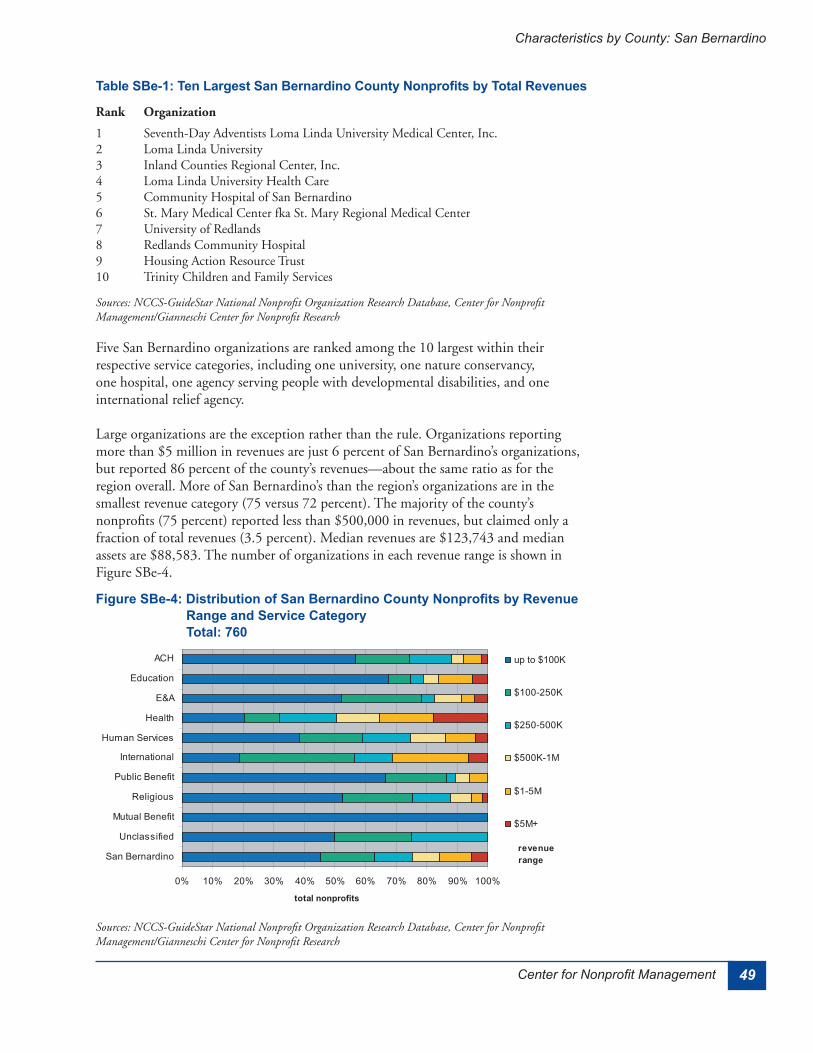
Figure SBe-4: Distribution of San Bernardino County Nonprofits by Revenue Range and Service Category Total: 760
Table SBe-1: Ten Largest San Bernardino County Nonprofits by Total Revenues
50 Gianneschi Center for Nonprofit Research at CSU Fullerton
Southern California’s Nonprofit Sector
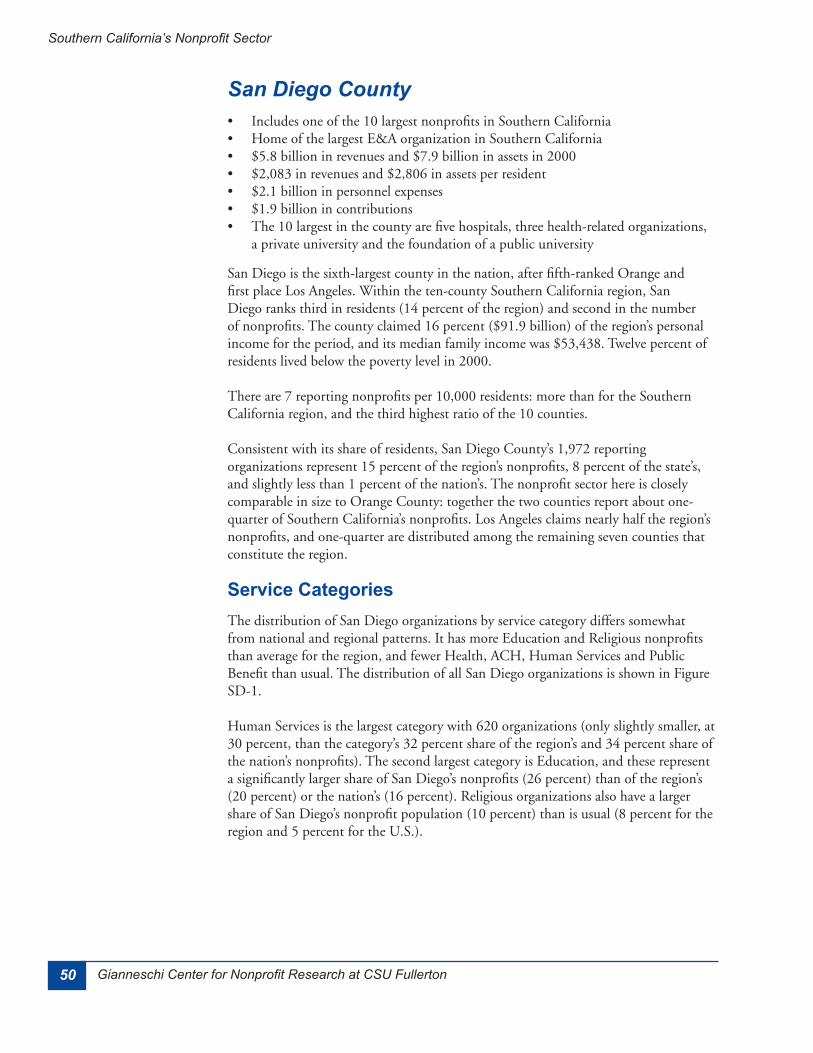
San Diego County
Service Categories
51Center for Nonprofit Management
Characteristics by County: San Diego
ResourcesRevenues and Assets
Figure SD-1: San Diego County Religious, Educational and Charitable Nonprofits Reporting over $25,000 in Gross Receipts in 2000 by NTEE Major Category;; Total: 1,972
52 Gianneschi Center for Nonprofit Research at CSU Fullerton
Southern California’s Nonprofit Sector
Contributions
Figure SD-2: Distribution of San Diego County Nonprofit Resources by Service Category
Figure SD-3: Revenue Mix by Service Category for San Diego County Nonprofits
53Center for Nonprofit Management
Characteristics by County: San Diego
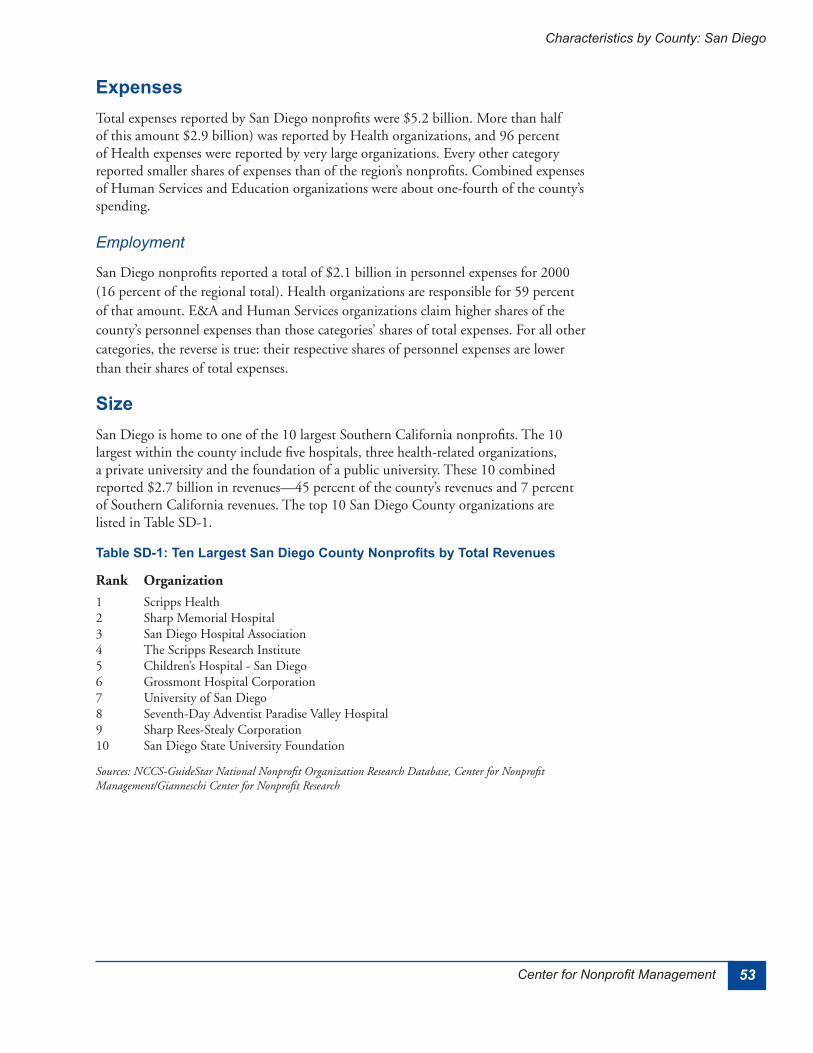
Expenses
Employment
Size
Table SD-1: Ten Largest San Diego County Nonprofits by Total Revenues
54 Gianneschi Center for Nonprofit Research at CSU Fullerton
Southern California’s Nonprofit Sector
Figure SD-4: Distribution of San Diego County Nonprofits by Revenue Range and Service Category Total: 1,972

55Center for Nonprofit Management
Characteristics by County: Santa Barbara
Santa Barbara County
Service Categories
56 Gianneschi Center for Nonprofit Research at CSU Fullerton
Southern California’s Nonprofit Sector
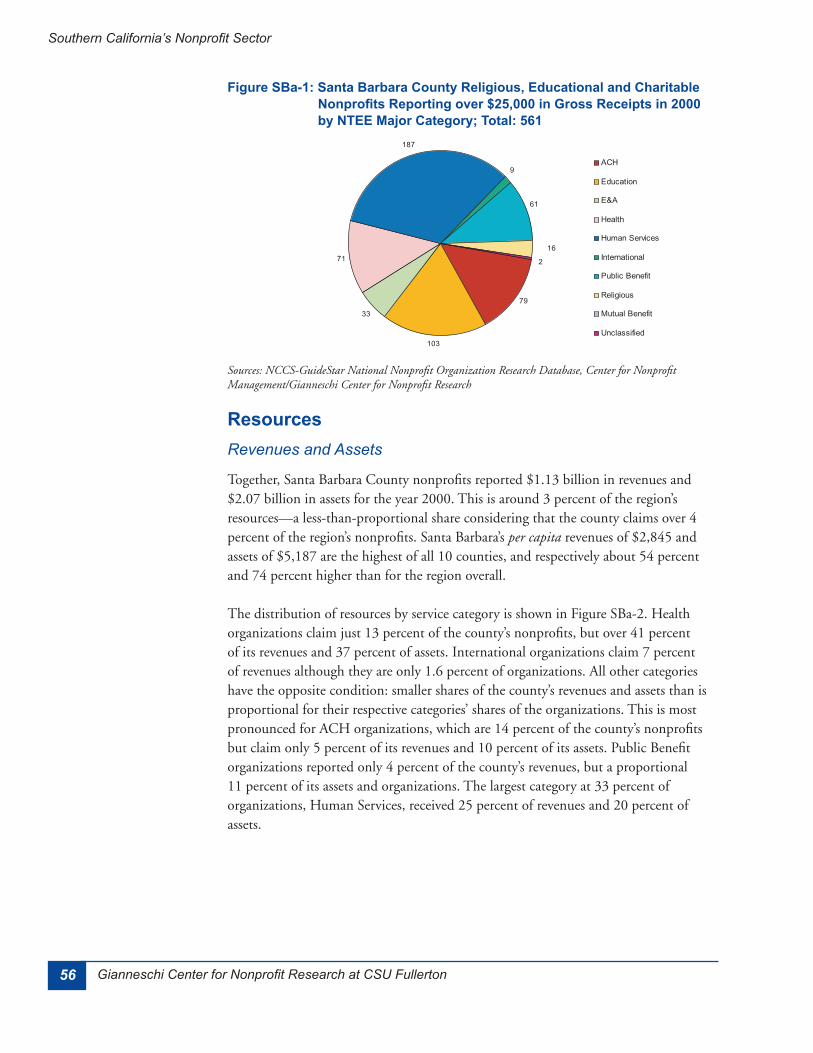
ResourcesRevenues and Assets
Figure SBa-1: Santa Barbara County Religious, Educational and Charitable Nonprofits Reporting over $25,000 in Gross Receipts in 2000 by NTEE Major Category;; Total: 561
57Center for Nonprofit Management
Characteristics by County: Santa Barbara
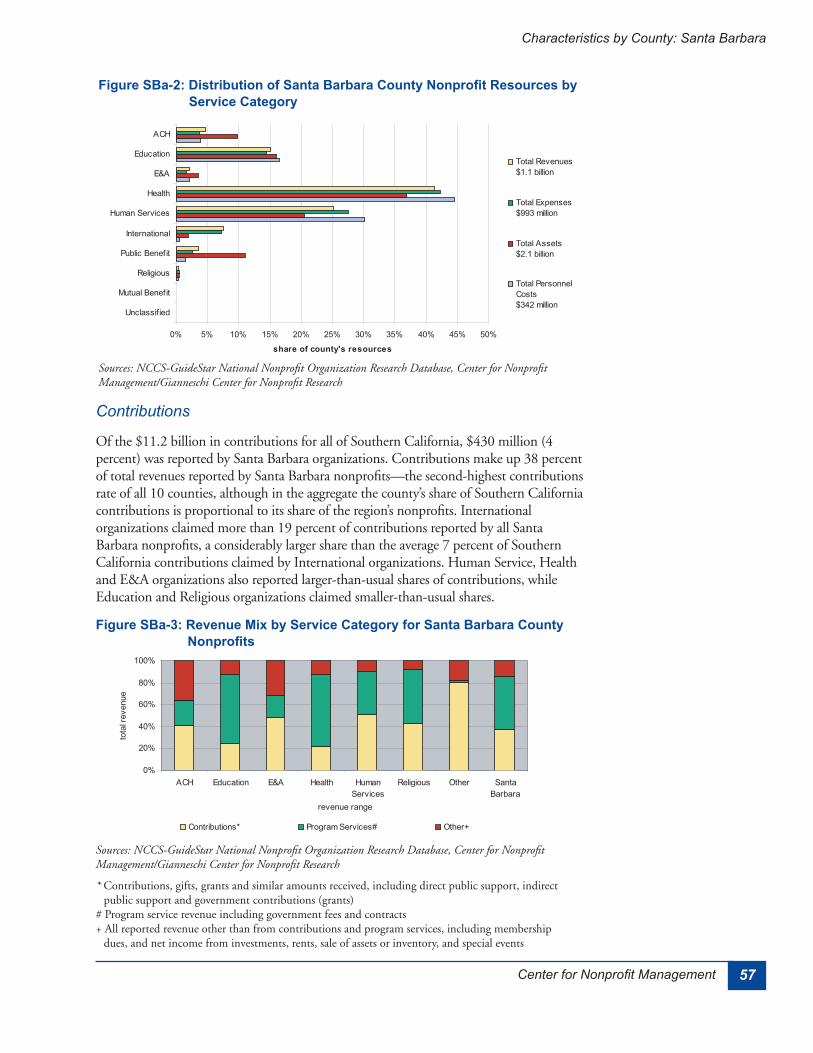
Figure SBa-2: Distribution of Santa Barbara County Nonprofit Resources by Service Category
Contributions
Figure SBa-3: Revenue Mix by Service Category for Santa Barbara County Nonprofits
58 Gianneschi Center for Nonprofit Research at CSU Fullerton
Southern California’s Nonprofit Sector
Table SBa-1: Ten Largest Santa Barbara County Nonprofits by Total Revenues
Expenses
Employment
Size
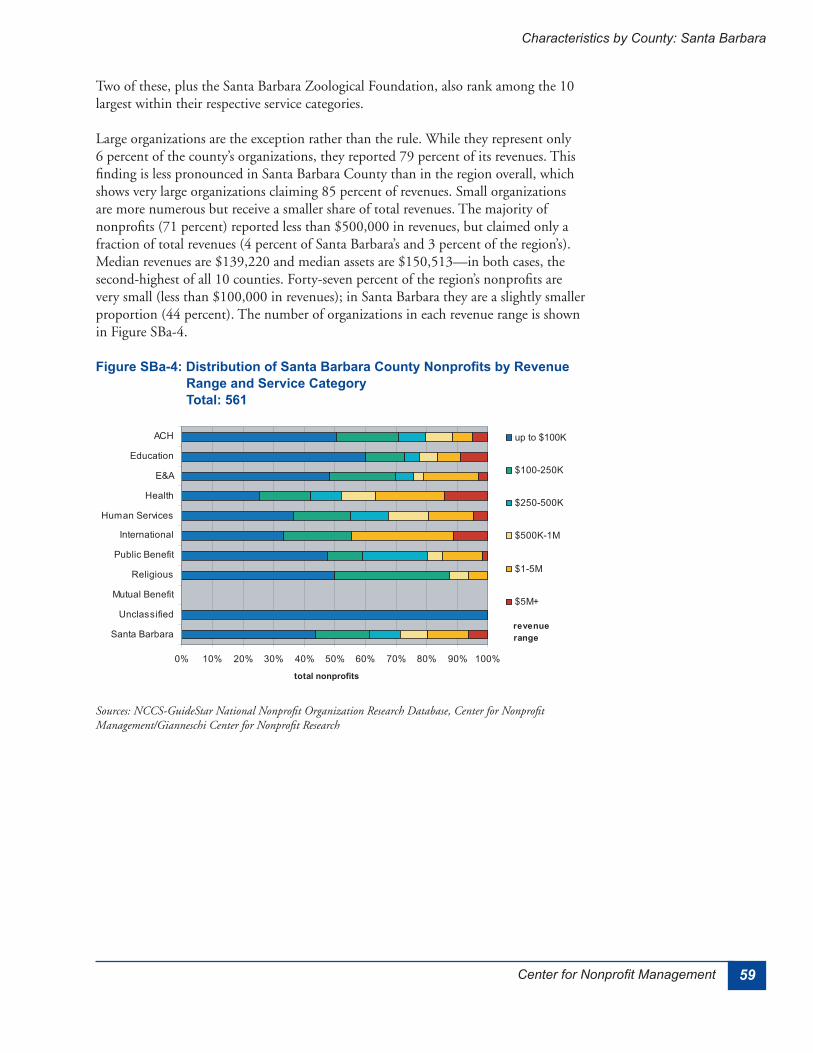
59Center for Nonprofit Management
Characteristics by County: Santa Barbara
Figure SBa-4: Distribution of Santa Barbara County Nonprofits by Revenue Range and Service Category Total: 561
60 Gianneschi Center for Nonprofit Research at CSU Fullerton
Southern California’s Nonprofit Sector
Ventura County
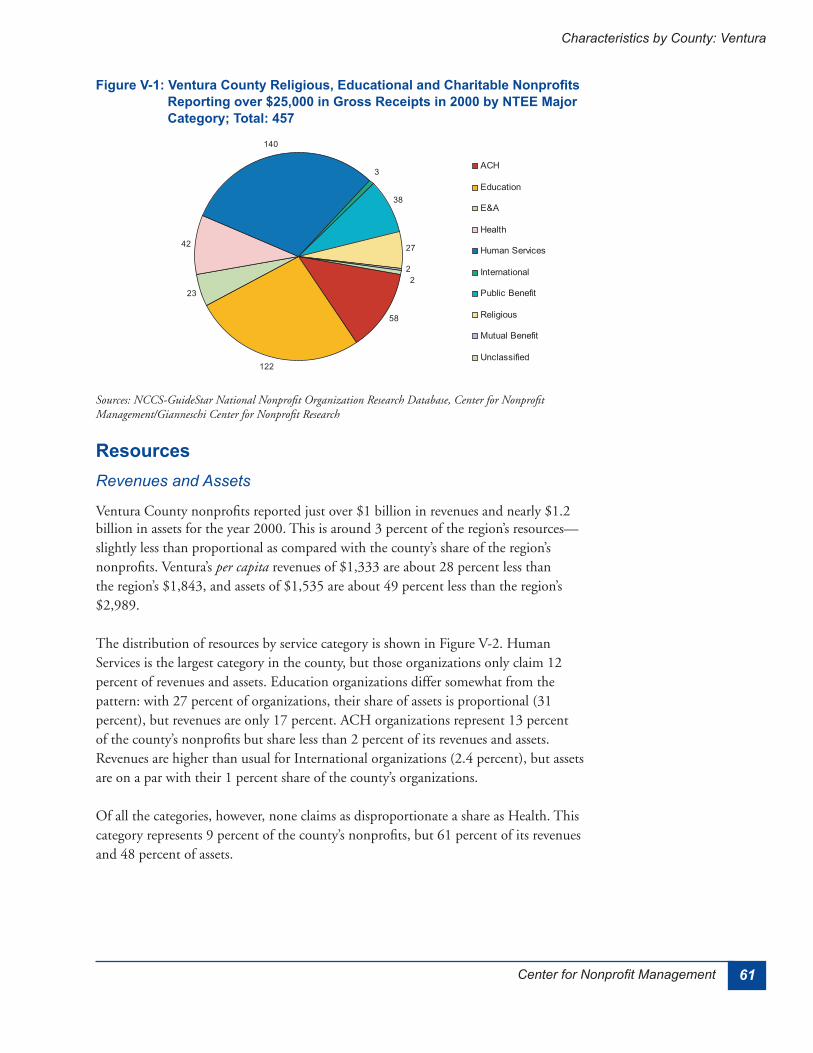
Service Categories
61Center for Nonprofit Management
Characteristics by County: Ventura
ResourcesRevenues and Assets
Figure V-1: Ventura County Religious, Educational and Charitable Nonprofits Reporting over $25,000 in Gross Receipts in 2000 by NTEE Major Category;; Total: 457
62 Gianneschi Center for Nonprofit Research at CSU Fullerton
Southern California’s Nonprofit Sector
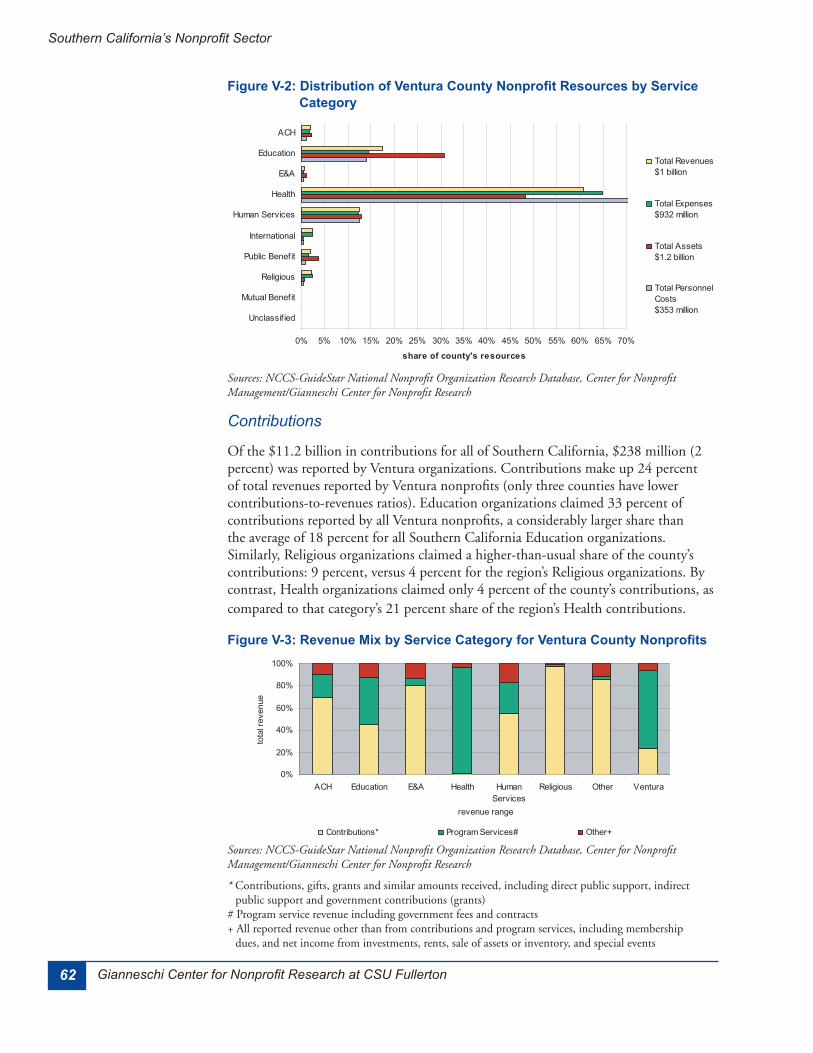
Contributions
Figure V-2: Distribution of Ventura County Nonprofit Resources by Service Category
Figure V-3: Revenue Mix by Service Category for Ventura County Nonprofits
63Center for Nonprofit Management
Characteristics by County: Ventura
Expenses
Employment
Size
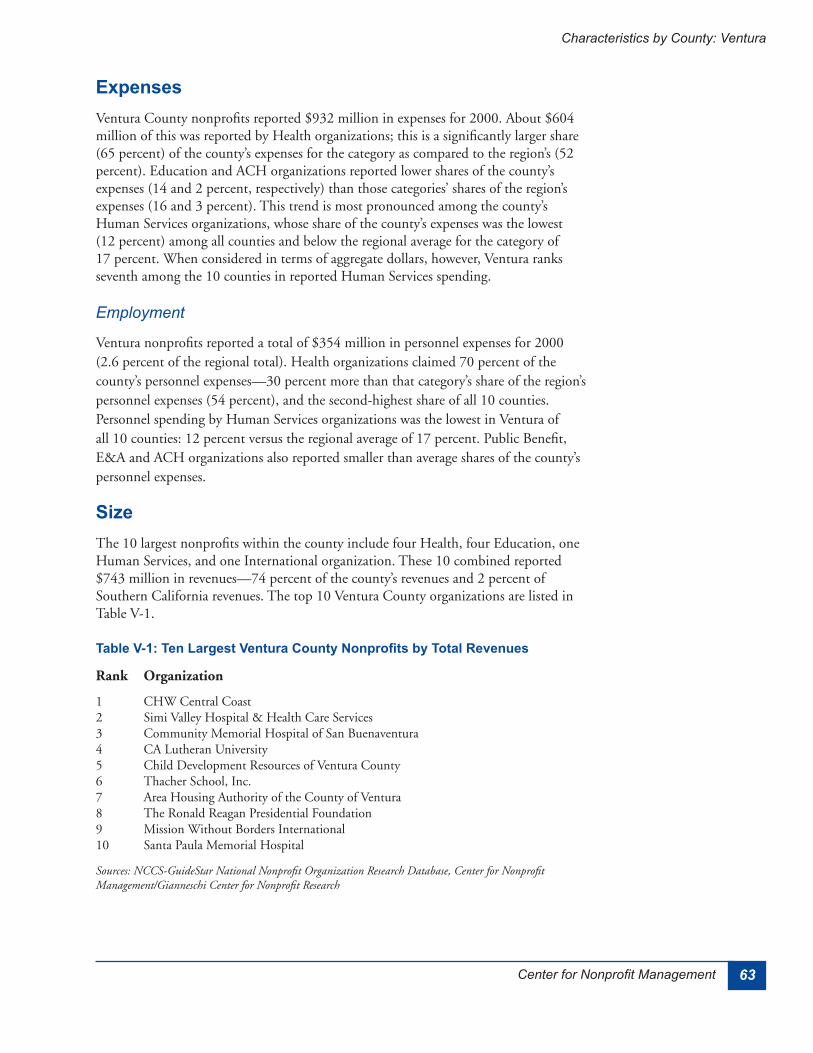
Table V-1: Ten Largest Ventura County Nonprofits by Total Revenues
64 Gianneschi Center for Nonprofit Research at CSU Fullerton
Southern California’s Nonprofit Sector
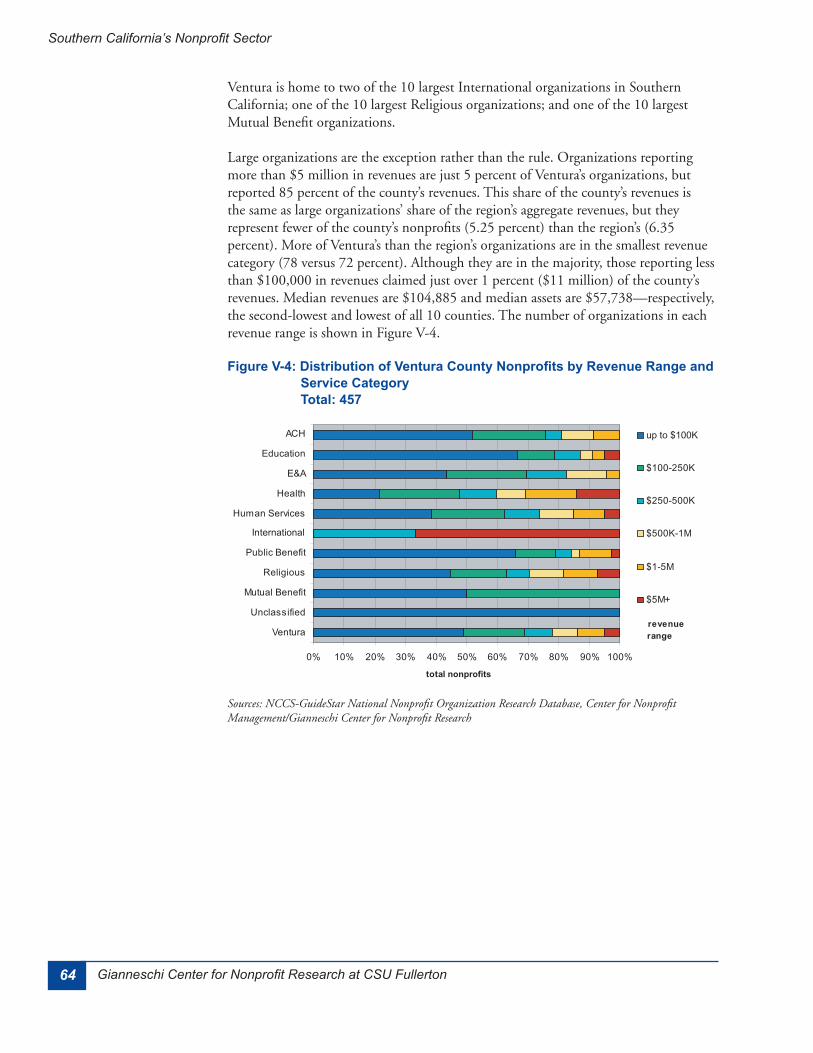
Figure V-4: Distribution of Ventura County Nonprofits by Revenue Range and Service Category Total: 457
65Center for Nonprofit Management
Characteristics by Service Category
Arts, Culture & Humanities
Characteristics by Service Category: ACH
66 Gianneschi Center for Nonprofit Research at CSU Fullerton
Southern California’s Nonprofit Sector
Museum Associates Los Angeles
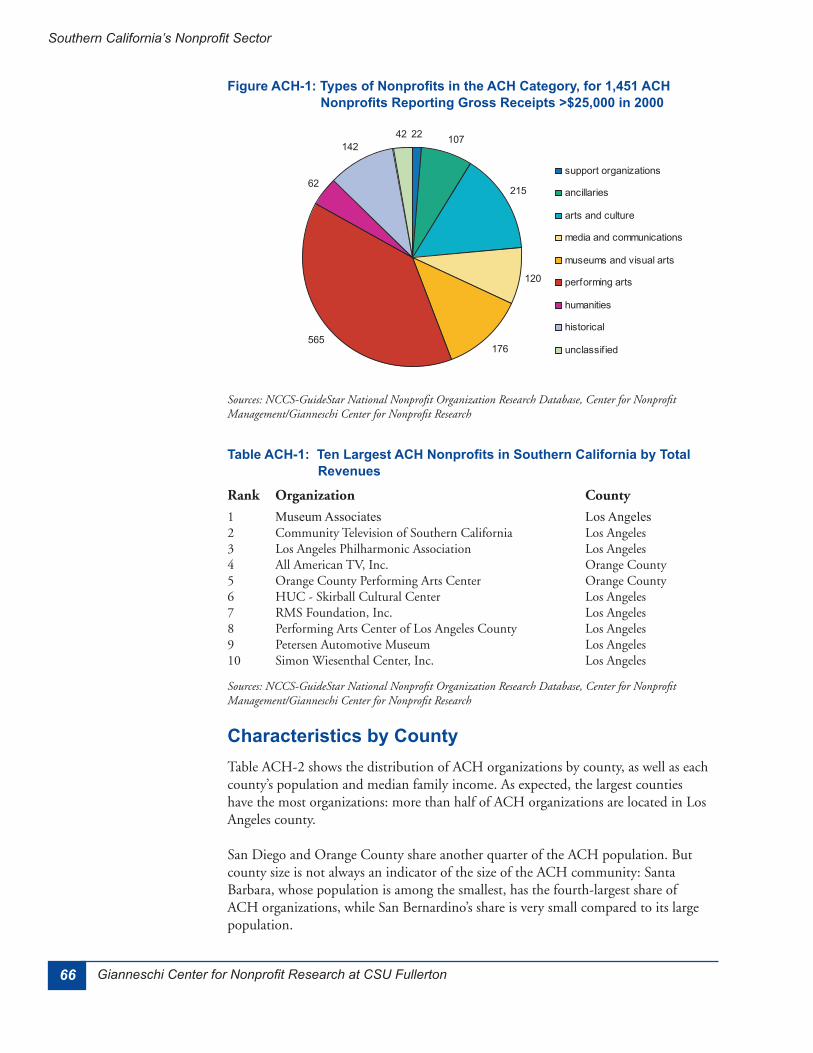
Table ACH-1: Ten Largest ACH Nonprofits in Southern California by Total Revenues
Characteristics by County
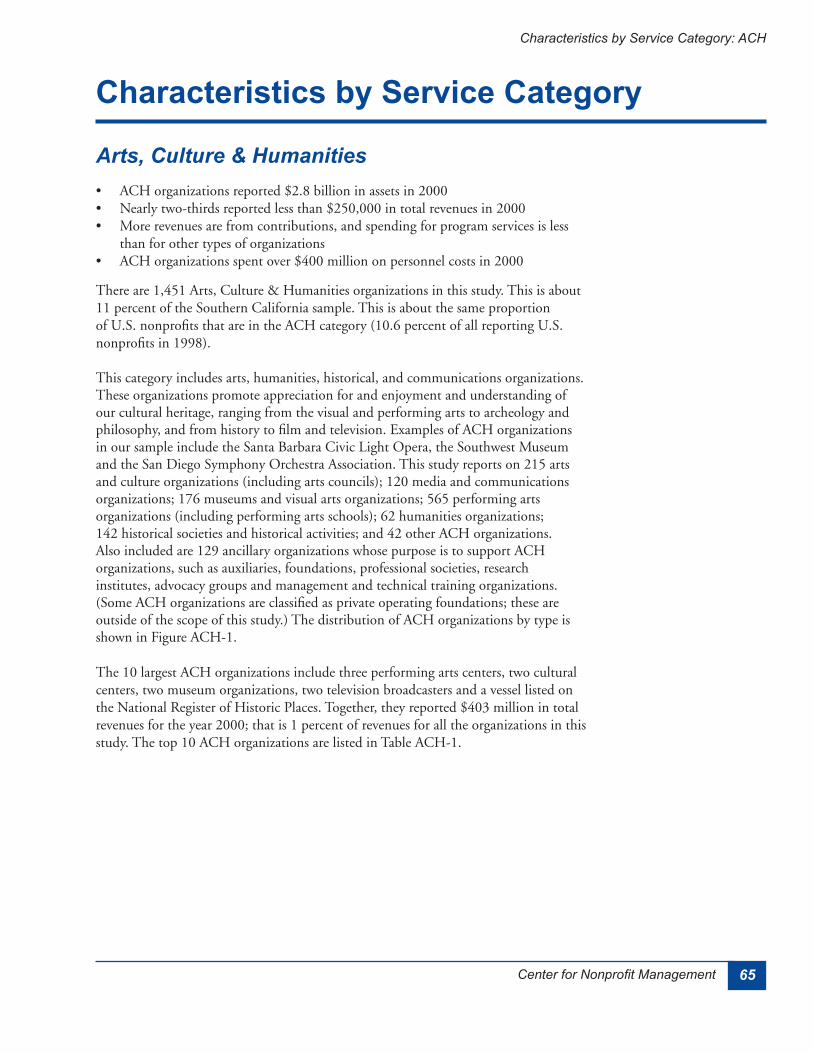
Figure ACH-1: Types of Nonprofits in the ACH Category, for 1,451 ACH Nonprofits Reporting Gross Receipts >$25,000 in 2000
67Center for Nonprofit Management
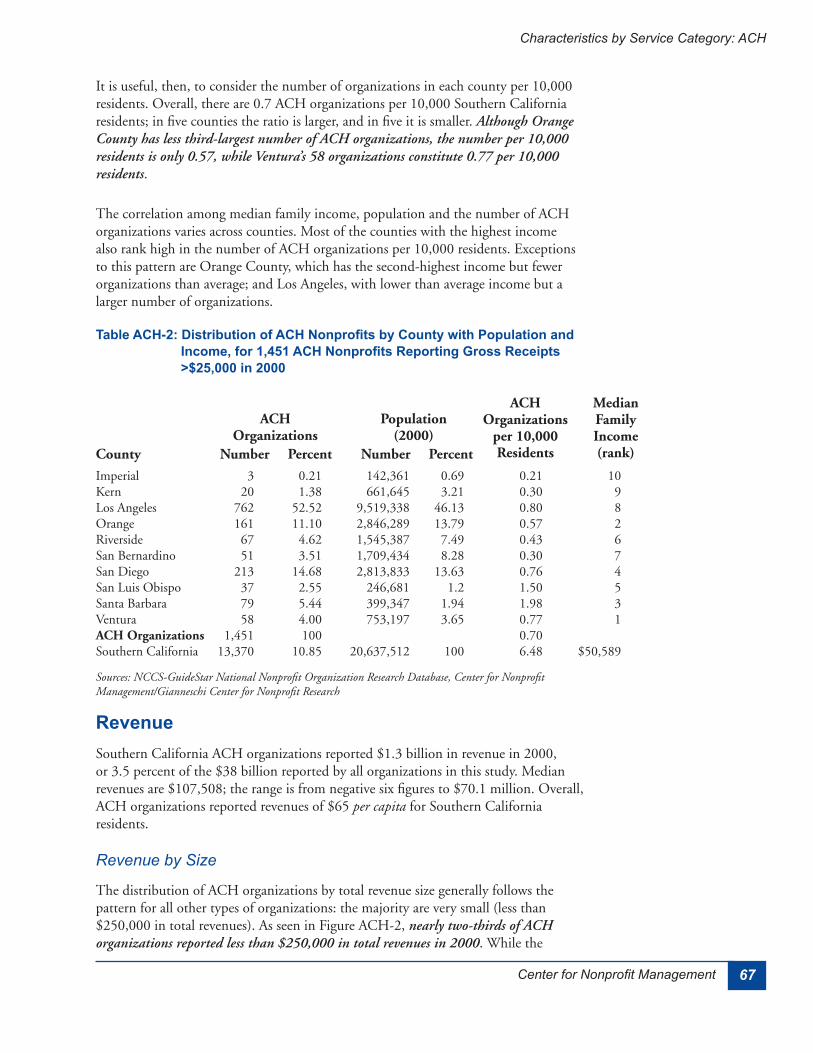
Revenue
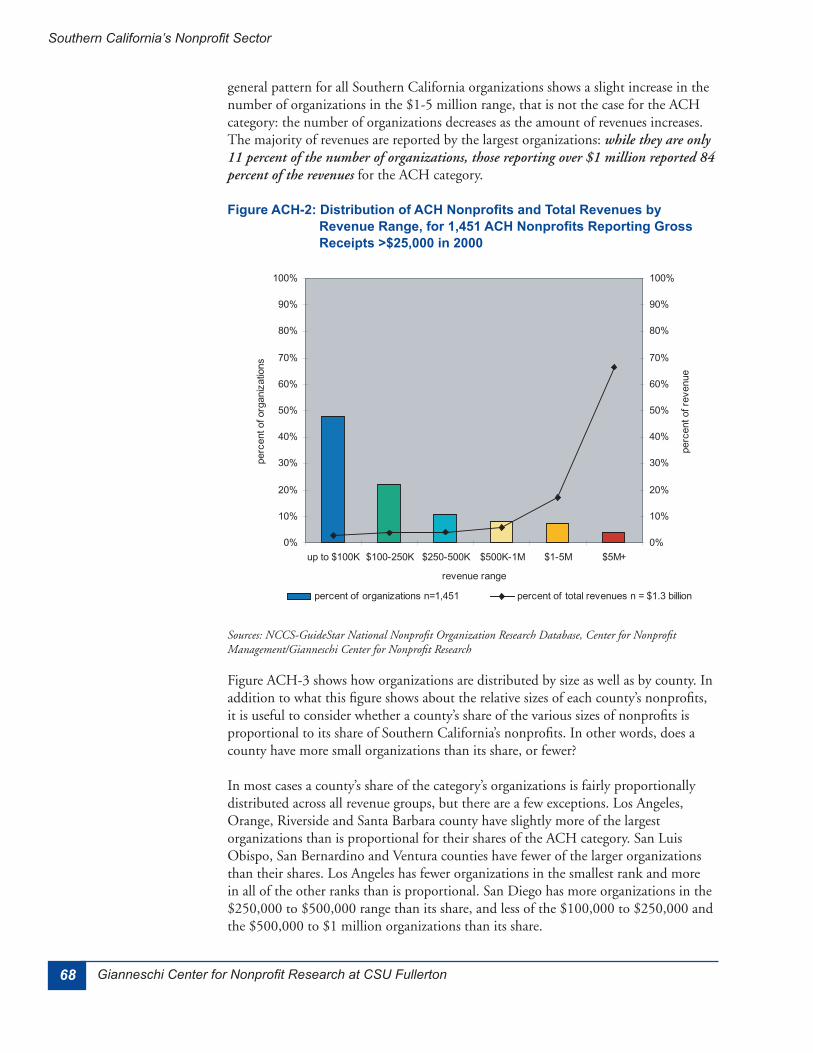
Revenue by Size
Characteristics by Service Category: ACH
Table ACH-2: Distribution of ACH Nonprofits by County with Population and Income, for 1,451 ACH Nonprofits Reporting Gross Receipts >$25,000 in 2000
68 Gianneschi Center for Nonprofit Research at CSU Fullerton
Southern California’s Nonprofit Sector
Figure ACH-2: Distribution of ACH Nonprofits and Total Revenues by Revenue Range, for 1,451 ACH Nonprofits Reporting Gross Receipts >$25,000 in 2000
69Center for Nonprofit Management
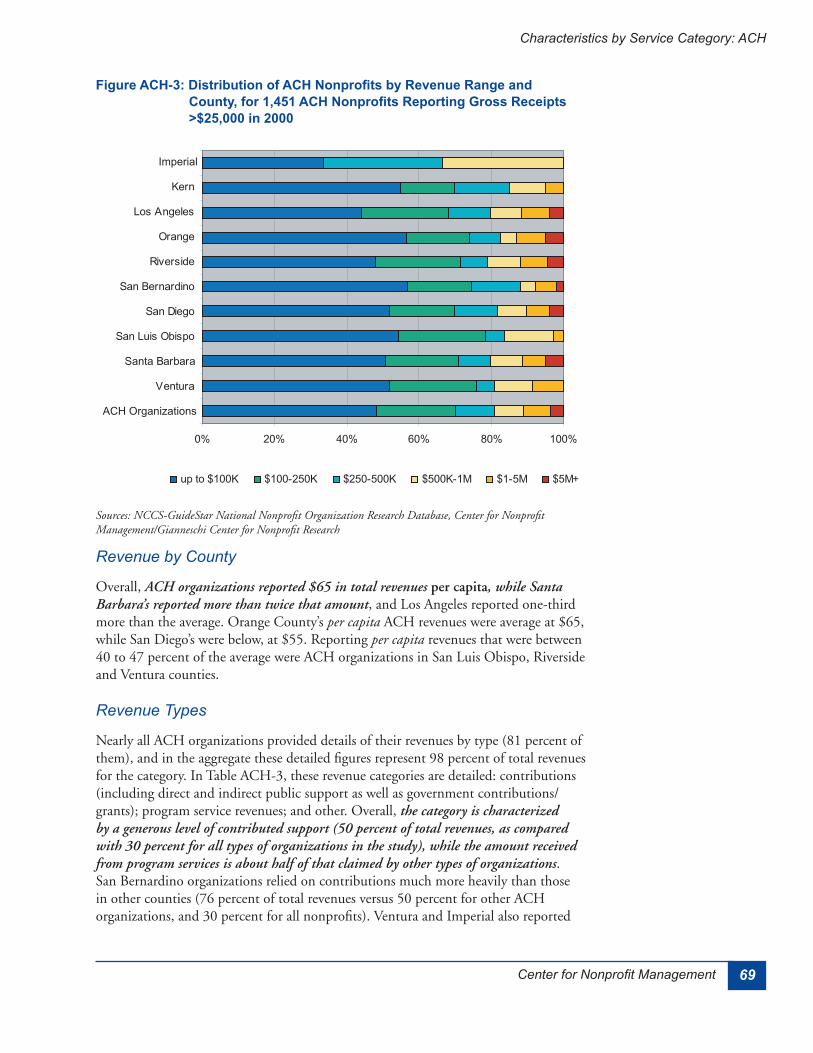
Revenue by County
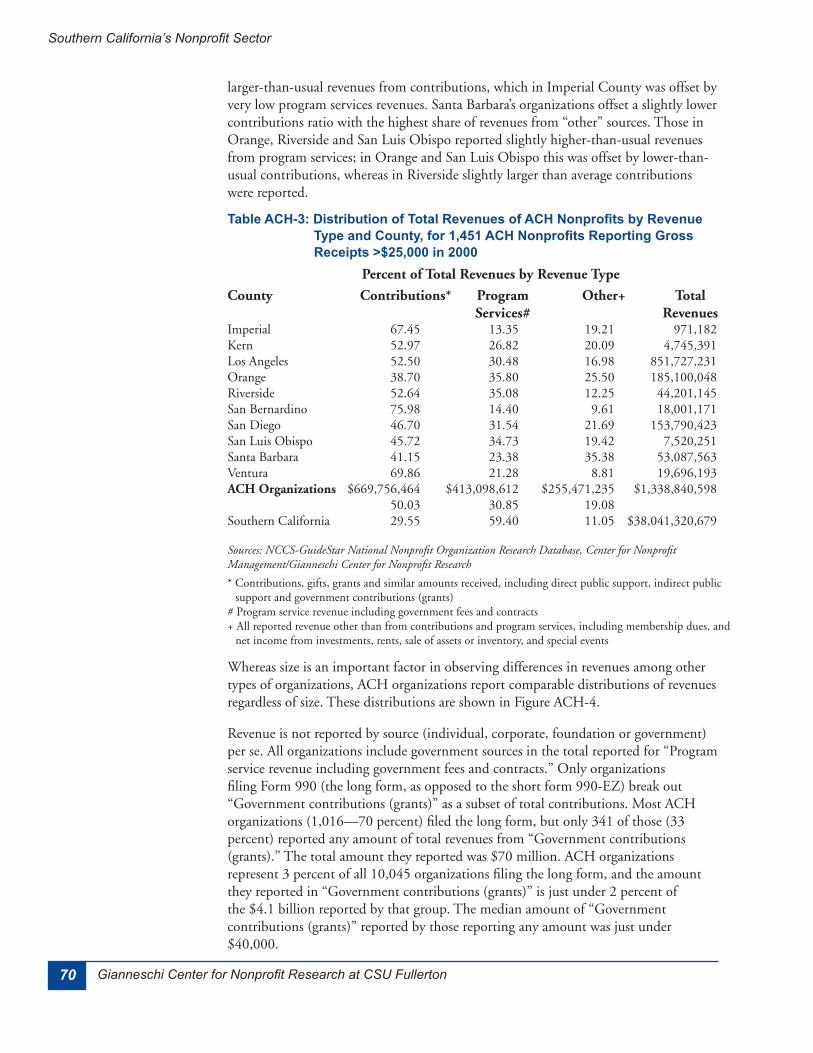
Revenue Types
Figure ACH-3: Distribution of ACH Nonprofits by Revenue Range and County, for 1,451 ACH Nonprofits Reporting Gross Receipts >$25,000 in 2000
Characteristics by Service Category: ACH
70 Gianneschi Center for Nonprofit Research at CSU Fullerton
Southern California’s Nonprofit Sector
Table ACH-3: Distribution of Total Revenues of ACH Nonprofits by Revenue Type and County, for 1,451 ACH Nonprofits Reporting Gross Receipts >$25,000 in 2000
71Center for Nonprofit Management
Expenses
Expenses by County
Figure ACH-4: Distribution of Total Revenues of ACH Nonprofits by Revenue Type and Revenue Range, for 1,451 ACH Nonprofits Reporting Gross Receipts >$25,000 in 2000
Characteristics by Service Category: ACH
72 Gianneschi Center for Nonprofit Research at CSU Fullerton
Southern California’s Nonprofit Sector
Expenses of Itemizers
Figure ACH-5: Distribution of ACH Nonprofits and Total Expenses by County, for 1,451 ACH Nonprofits Reporting Gross Receipts >$25,000 in 2000
73Center for Nonprofit Management
Expenses by Size
Figure ACH-6: Distribution of ACH Nonprofits and Total Expenses by Revenue Range, for 995 ACH Nonprofits Filing Long Form 990 and Itemizing Expenses for 2000
Figure ACH-7: Distribution of Total Expenses of ACH Nonprofits by Revenue Range and Expense Type, for 995 ACH Nonprofits Filing Long Form 990 and Itemizing Expenses for 2000
Characteristics by Service Category: ACH
74 Gianneschi Center for Nonprofit Research at CSU Fullerton
Southern California’s Nonprofit Sector
Table ACH-4: Distribution of Payroll Expenses of ACH Nonprofits by County, for 995 ACH Nonprofits Filing Long Form 990 and Itemizing Expenses for 2000
Assets
75Center for Nonprofit Management
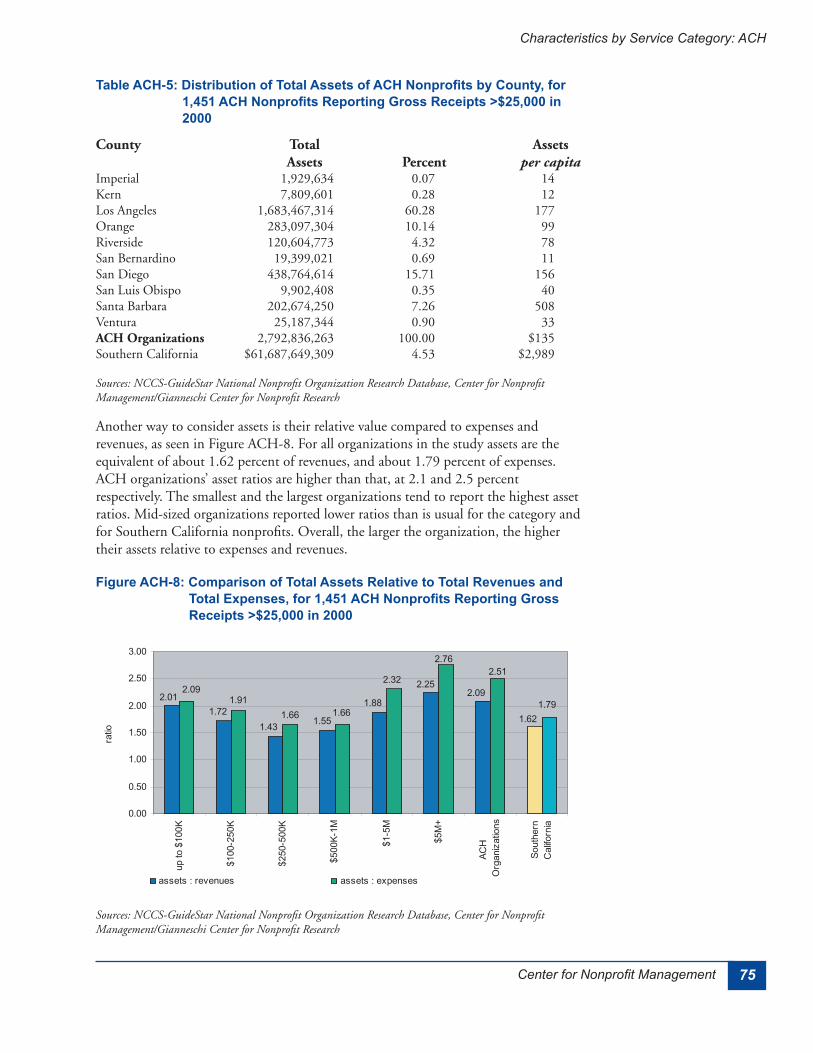
Table ACH-5: Distribution of Total Assets of ACH Nonprofits by County, for 1,451 ACH Nonprofits Reporting Gross Receipts >$25,000 in 2000
Figure ACH-8: Comparison of Total Assets Relative to Total Revenues and Total Expenses, for 1,451 ACH Nonprofits Reporting Gross Receipts >$25,000 in 2000
Characteristics by Service Category: ACH
76 Gianneschi Center for Nonprofit Research at CSU Fullerton
Southern California’s Nonprofit Sector
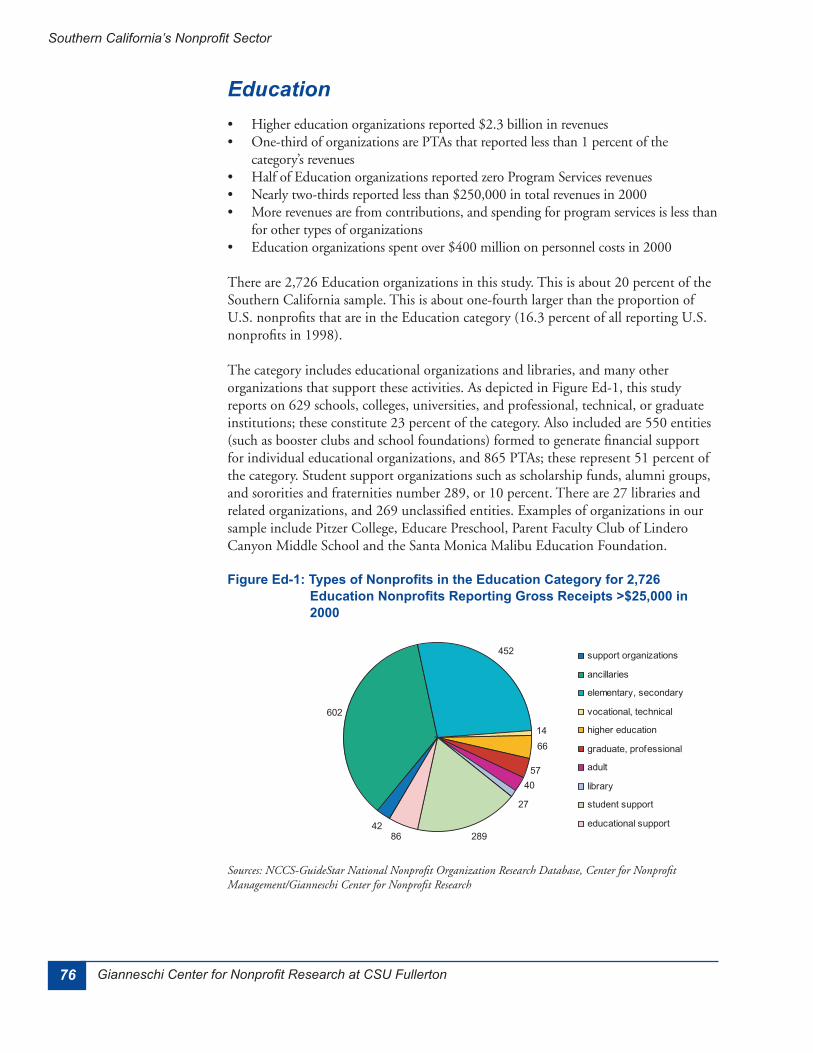
Education
Figure Ed-1: Types of Nonprofits in the Education Category for 2,726 Education Nonprofits Reporting Gross Receipts >$25,000 in 2000
77Center for Nonprofit Management
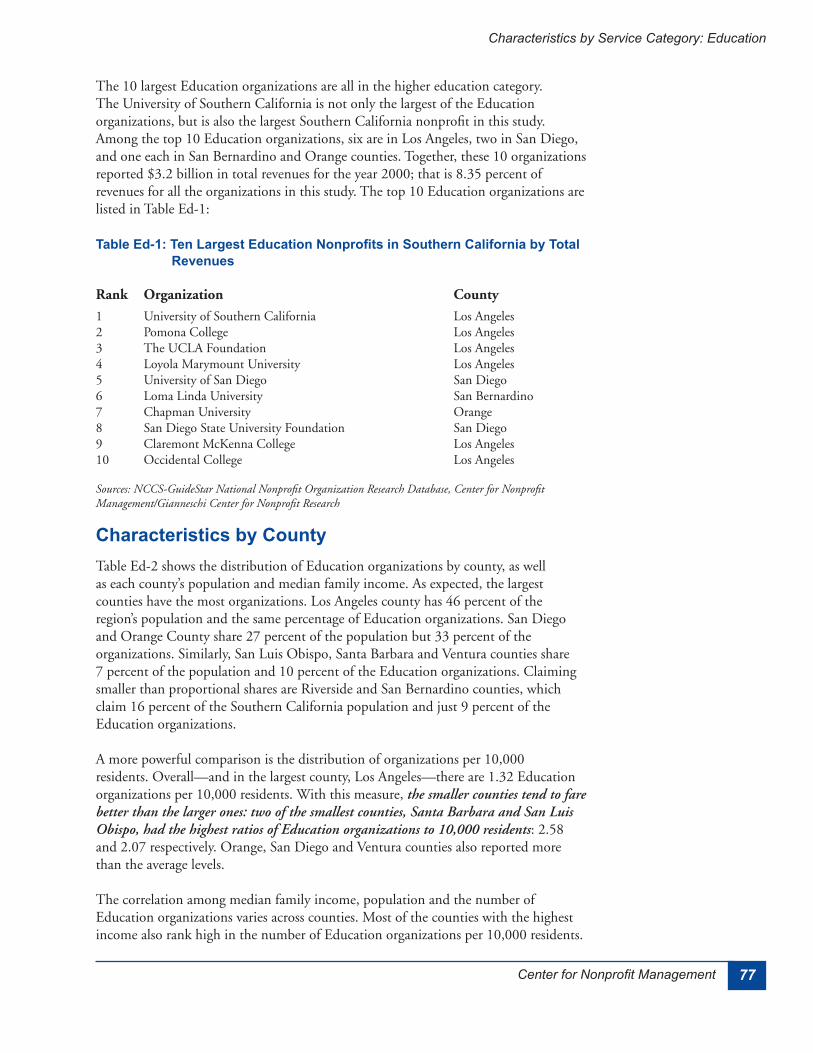
Table Ed-1: Ten Largest Education Nonprofits in Southern California by Total Revenues
Characteristics by County
Characteristics by Service Category: Education
78 Gianneschi Center for Nonprofit Research at CSU Fullerton
Southern California’s Nonprofit Sector
Revenue
Revenue by Size
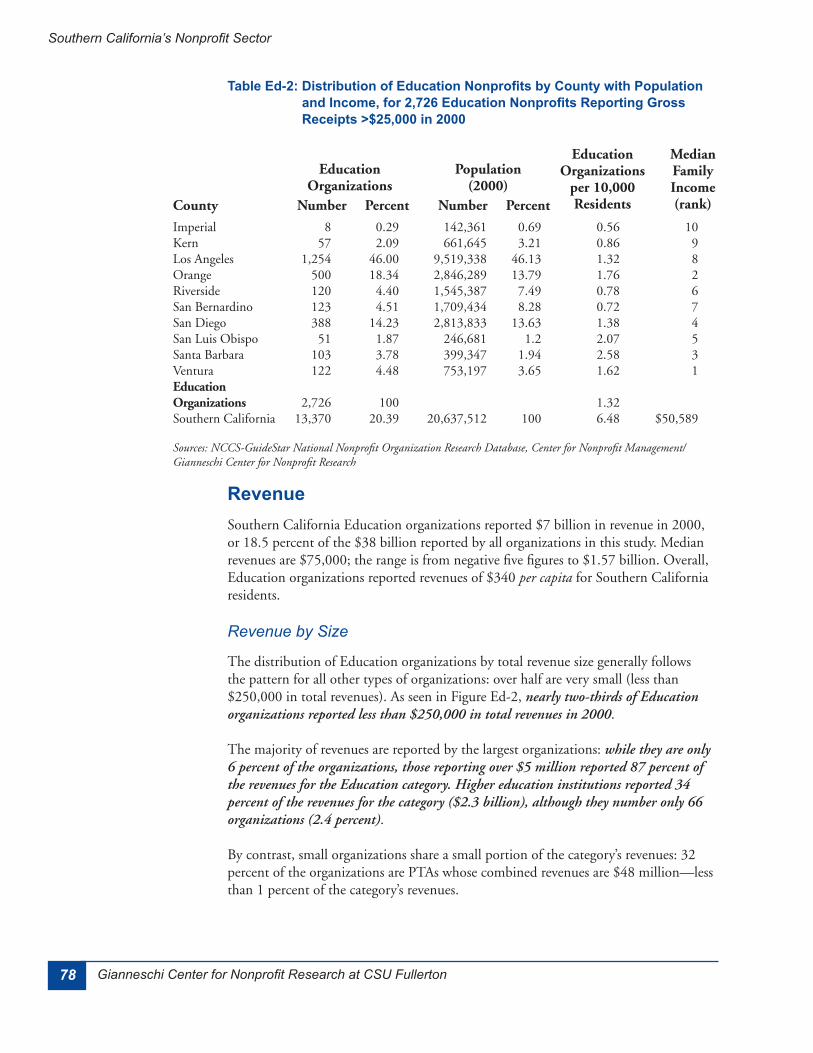
Table Ed-2: Distribution of Education Nonprofits by County with Population and Income, for 2,726 Education Nonprofits Reporting Gross Receipts >$25,000 in 2000
79Center for Nonprofit Management
Figure Ed-2: Distribution of Education Nonprofits and Total Revenues by Revenue Range, for 2,726 Education Nonprofits Reporting Gross Receipts >$25,000 in 2000
Characteristics by Service Category: Education
80 Gianneschi Center for Nonprofit Research at CSU Fullerton
Southern California’s Nonprofit Sector
Revenue by County
Revenue Types
Figure Ed-3: Distribution of Education Nonprofits by Revenue Range and County, for 2,726 Education Nonprofits Reporting Gross Receipts >$25,000 in 2000
81Center for Nonprofit Management
Table Ed-3: Distribution of Total Revenues of Education Nonprofits by Revenue Type and County, for 2,726 Education Nonprofits Reporting Gross Receipts >$25,000 in 2000
Characteristics by Service Category: Education
82 Gianneschi Center for Nonprofit Research at CSU Fullerton
Southern California’s Nonprofit Sector
Expenses
Figure Ed-4: Distribution of Total Revenues of Education Nonprofits by Revenue Type and Revenue Range, for 2,726 Education Nonprofits Reporting Gross Receipts >$25,000 in 2000
83Center for Nonprofit Management
Expenses by County
Figure Ed-5: Distribution of Education Nonprofits and Total Expenses by County, for 2,726 Education Nonprofits Reporting Gross Receipts >$25,000 in 2000
Expenses of Itemizers
Characteristics by Service Category: Education
84 Gianneschi Center for Nonprofit Research at CSU Fullerton
Southern California’s Nonprofit Sector
Expenses by Size
Figure Ed-6: Distribution of Education Nonprofits and Total Expenses by Revenue Range, for 1,669 Education Nonprofits Filing Long Form 990 and Itemizing Expenses for 2000
85Center for Nonprofit Management
Table Ed-4: Distribution of Payroll Expenses of Education Nonprofits by County for 1,669 Education Nonprofits Filing Long Form 990 and Itemizing Expenses for 2000
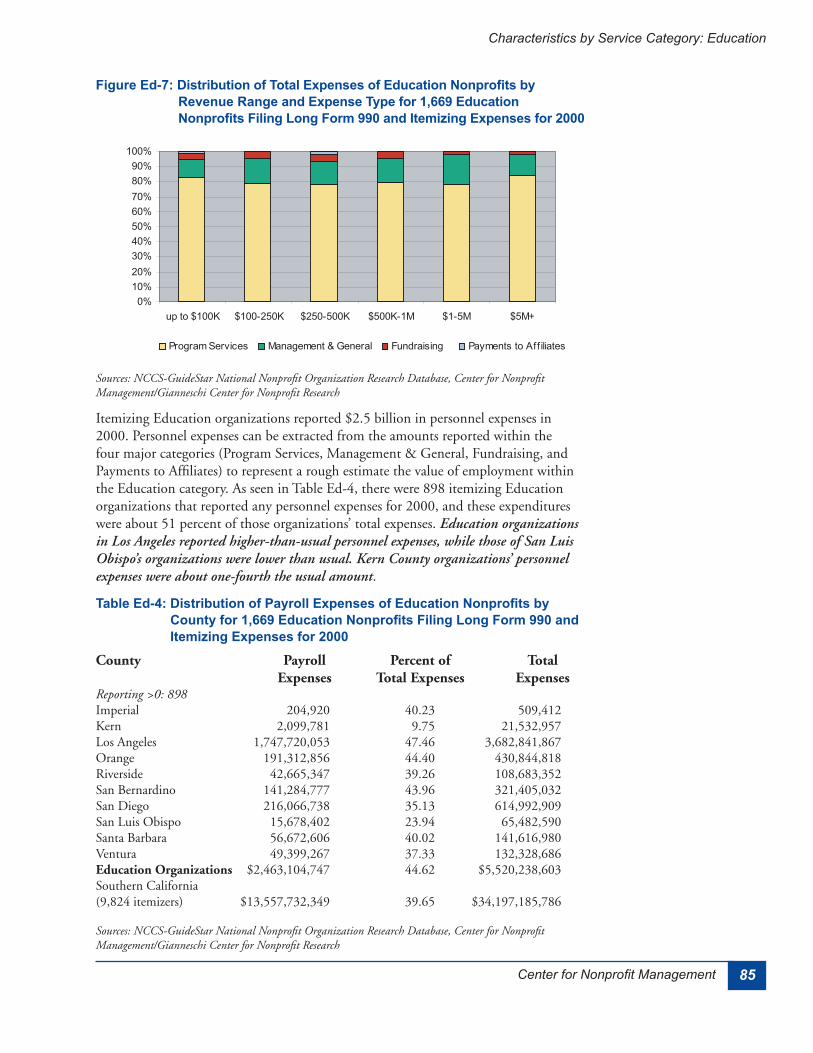
Figure Ed-7: Distribution of Total Expenses of Education Nonprofits by Revenue Range and Expense Type for 1,669 Education Nonprofits Filing Long Form 990 and Itemizing Expenses for 2000
Characteristics by Service Category: Education
86 Gianneschi Center for Nonprofit Research at CSU Fullerton
Southern California’s Nonprofit Sector
Assets
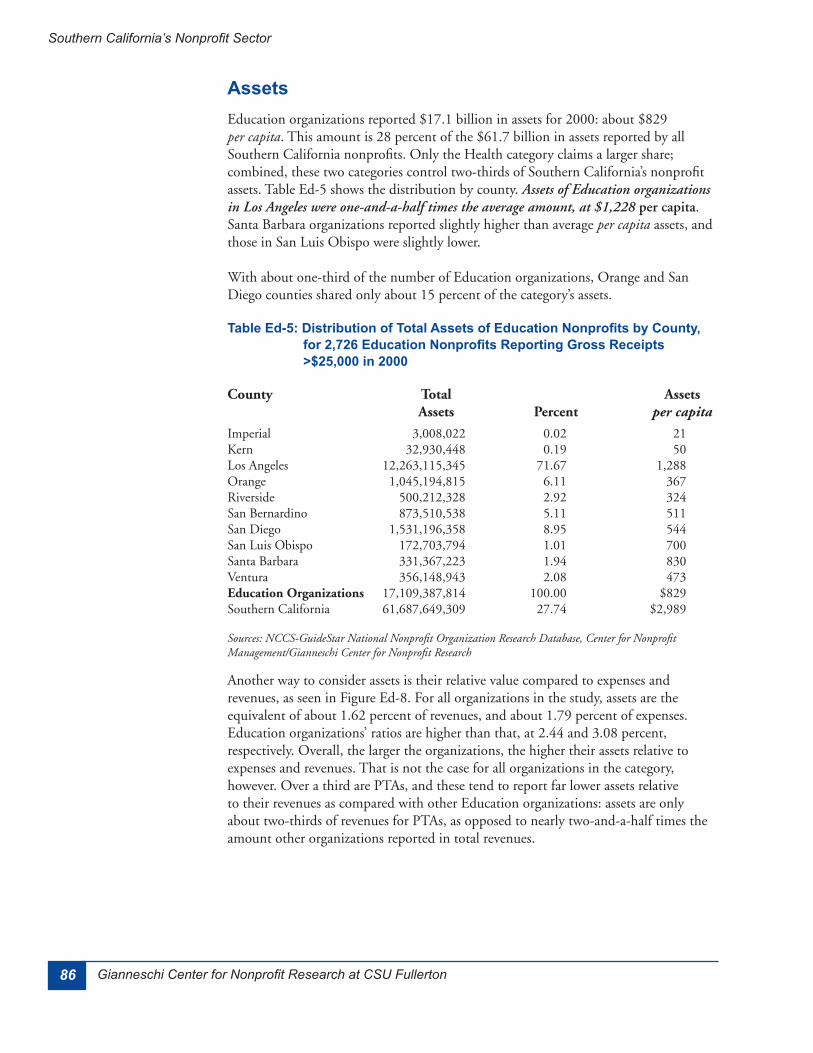
Table Ed-5: Distribution of Total Assets of Education Nonprofits by County, for 2,726 Education Nonprofits Reporting Gross Receipts >$25,000 in 2000
87Center for Nonprofit Management
Figure Ed-8: Comparison of Total Assets Relative to Total Revenues and Total Expenses, for 2,726 Education Nonprofits Reporting Gross Receipts >$25,000 in 2000
Characteristics by Service Category: Education
88 Gianneschi Center for Nonprofit Research at CSU Fullerton
Southern California’s Nonprofit Sector
Environment & Animals
Figure EA-1: Types of Nonprofits in the E&A Category, for 429 E&A Nonprofits Reporting Gross Receipts >$25,000 in 2000
89Center for Nonprofit Management
Table EA-1: Ten Largest E&A Nonprofits in Southern California by Total Revenues
Characteristics by County
Characteristics by Service Category: E&A
90 Gianneschi Center for Nonprofit Research at CSU Fullerton
Southern California’s Nonprofit Sector
Revenue
Revenue by Size
Table EA-2: Distribution of E&A Nonprofits by County with Population and Income, for 429 Nonprofits Reporting Gross Receipts >$25,000 in 2000

91Center for Nonprofit Management
Figure EA-2: Distribution of E&A Nonprofits and Total Revenues by Revenue Range, for 429 E&A Nonprofits Reporting Gross Receipts >$25,000 in 2000
Characteristics by Service Category: E&A
92 Gianneschi Center for Nonprofit Research at CSU Fullerton
Southern California’s Nonprofit Sector
Revenue by County
Revenue Types
Figure EA-3: Distribution of E&A Nonprofits by Revenue Range and County, for 429 Nonprofits Reporting Gross Receipts >$25,000 in 2000
93Center for Nonprofit Management
Table EA-3: Distribution of Total Revenues of E&A Nonprofits by Revenue Type and County, for 429 Nonprofits Reporting Gross Receipts >$25,000 in 2000
Characteristics by Service Category: E&A
94 Gianneschi Center for Nonprofit Research at CSU Fullerton
Southern California’s Nonprofit Sector
Expenses
Figure EA-4: Distribution of Total Revenues of E&A Nonprofits by Revenue Type and Revenue Range, for 429 Nonprofits Reporting Gross Receipts >$25,000 in 2000
95Center for Nonprofit Management
Figure EA-5: Distribution of E&A Nonprofits and Total Expenses by County for 429 Nonprofits Reporting Gross Receipts >$25,000 in 2000
Expenses of Itemizers
Expenses by County
Characteristics by Service Category: E&A
96 Gianneschi Center for Nonprofit Research at CSU Fullerton
Southern California’s Nonprofit Sector
Expenses by Size
Figure EA-6: Distribution of E&A Nonprofits and Total Expenses by Revenue Range, for 306 E&A Nonprofits Filing Long Form 990 and Itemizing Expenses for 2000
Figure EA-7: Distribution of Total Expenses of E&A Nonprofits by Revenue Range and Expense Type, for 306 E&A Nonprofits Filing Long Form 990 and Itemizing Expenses for 2000
97Center for Nonprofit Management
Table EA-4: Distribution of Payroll Expenses of E&A Nonprofits by County for 306 E&A Nonprofits Filing Long Form 990 and Itemizing Expenses for 2000
Assets
Characteristics by Service Category: E&A
98 Gianneschi Center for Nonprofit Research at CSU Fullerton
Southern California’s Nonprofit Sector
Table EA-5: Distribution of Total Assets of E&A Nonprofits by County for 429 Nonprofits Reporting Gross Receipts >$25,000 in 2000
Figure EA-8: Comparison of Total Assets Relative to Total Revenues and Total Expenses, for 429 E&A Nonprofits Reporting Gross Receipts >$25,000 in 2000
99Center for Nonprofit Management
Health
Figure H-1: Types of Nonprofits in the Health Category, for 1,773 Health Nonprofits Reporting Gross Receipts >$25,000 in 2000
Characteristics by Service Category: Health
100 Gianneschi Center for Nonprofit Research at CSU Fullerton
Southern California’s Nonprofit Sector
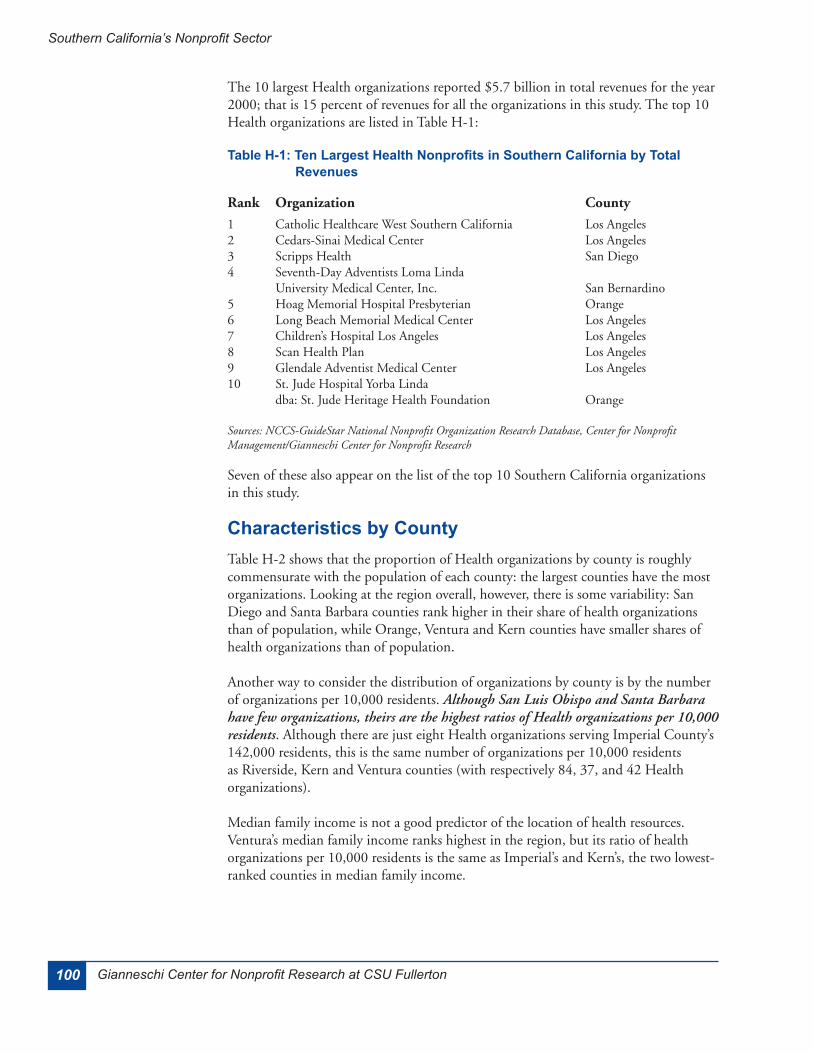
Table H-1: Ten Largest Health Nonprofits in Southern California by Total Revenues
Characteristics by County
101Center for Nonprofit Management
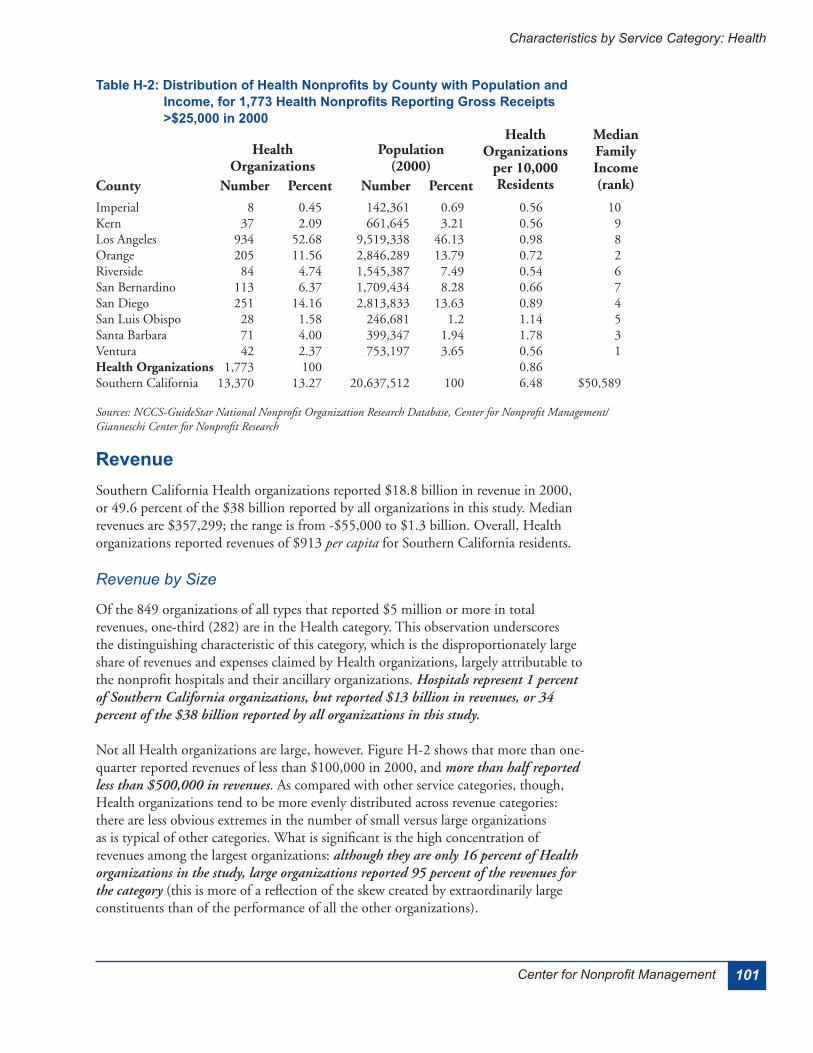
Table H-2: Distribution of Health Nonprofits by County with Population and Income, for 1,773 Health Nonprofits Reporting Gross Receipts >$25,000 in 2000
Revenue
Revenue by Size
Characteristics by Service Category: Health
102 Gianneschi Center for Nonprofit Research at CSU Fullerton
Southern California’s Nonprofit Sector
Figure H-2: Distribution of Health Nonprofits and Total Revenues by Revenue Range, for 1,773 Health Nonprofits Reporting Gross Receipts >$25,000 in 2000
103Center for Nonprofit Management
Revenue by County
Revenue Types
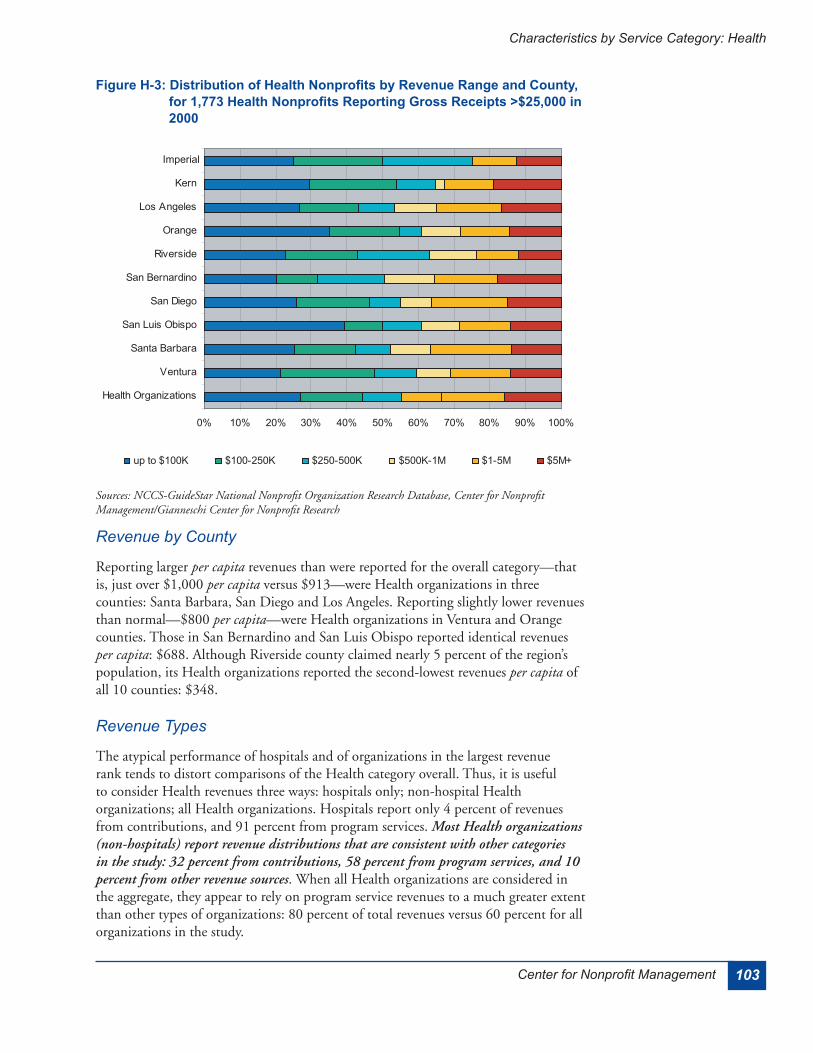
Figure H-3: Distribution of Health Nonprofits by Revenue Range and County, for 1,773 Health Nonprofits Reporting Gross Receipts >$25,000 in 2000
Characteristics by Service Category: Health
104 Gianneschi Center for Nonprofit Research at CSU Fullerton
Southern California’s Nonprofit Sector
Table H-3: Distribution of Total Revenues of Health Nonprofits by Revenue Type and County, for 1,773 Health Nonprofits Reporting Gross Receipts >$25,000 in 2000
105Center for Nonprofit Management
Figure H-4: Distribution of Total Revenues of Health Nonprofits by Revenue Type and Revenue Range, for 1,773 Health Nonprofits Reporting Gross Receipts >$25,000 in 2000
Characteristics by Service Category: Health
106 Gianneschi Center for Nonprofit Research at CSU Fullerton
Southern California’s Nonprofit Sector
Expenses
Expenses by County
Figure H-5: Distribution of Health Nonprofits and Total Expenses by County, for 1,773 Health Nonprofits Reporting Gross Receipts >$25,000 in 2000
107Center for Nonprofit Management
Expenses of Itemizers
Figure H-6: Distribution of Health Nonprofits and Total Expenses by Revenue Range, for 1,517 Health Nonprofits Filing Long Form 990 and Itemizing Expenses for 2000
Characteristics by Service Category: Health
108 Gianneschi Center for Nonprofit Research at CSU Fullerton
Southern California’s Nonprofit Sector
Expenses by Size
Figure H-7: Distribution of Total Expenses of Health Nonprofits by Revenue Range and Expense Type, for 1,517 Health Nonprofits Filing Long Form 990 and Itemizing Expenses for 2000
109Center for Nonprofit Management
Table H-4: Distribution of Payroll Expenses of Health Nonprofits by County, for 1,517 Health Nonprofits Filing Long Form 990 and Itemizing Expenses for 2000
Assets
Characteristics by Service Category: Health
110 Gianneschi Center for Nonprofit Research at CSU Fullerton
Southern California’s Nonprofit Sector
Table H-5: Distribution of Total Assets of Health Nonprofits by County, for 1,773 Health Nonprofits Reporting Gross Receipts >$25,000 in 2000
Figure H-8: Comparison of Total Assets Relative to Total Revenues and Total Expenses, for 1,773 Health Nonprofits Reporting Gross Receipts >$25,000 in 2000
111Center for Nonprofit Management
Human Services
Figure Hu-1: Types of Nonprofits in the Human Services Category for 4,339 Human Services Nonprofits Reporting Gross Receipts >$25,000 in 2000
Characteristics by Service Category: Human Services
112 Gianneschi Center for Nonprofit Research at CSU Fullerton
Southern California’s Nonprofit Sector
Table Hu-1: Ten Largest Human Services Nonprofits in Southern California by Total Revenues
Characteristics by County
113Center for Nonprofit Management
Table Hu-2: Distribution of Human Services Nonprofits by County with Population and Income, for 4,339 Nonprofits Reporting Gross Receipts >$25,000 in 2000
Revenue
Revenue by Size
Characteristics by Service Category: Human Services
114 Gianneschi Center for Nonprofit Research at CSU Fullerton
Southern California’s Nonprofit Sector
Figure Hu-2: Distribution of Human Services Nonprofits and Total Revenues by Revenue Range, for 4,339 Human Services Nonprofits Reporting Gross Receipts >$25,000 in 2000

115Center for Nonprofit Management
Revenue by County
Revenue Types
Figure Hu-3: Distribution of Human Services Nonprofits by Revenue Range and County, for 4,339 Nonprofits Reporting Gross Receipts >$25,000 in 2000
Characteristics by Service Category: Human Services
116 Gianneschi Center for Nonprofit Research at CSU Fullerton
Southern California’s Nonprofit Sector
Table Hu-3: Distribution of Total Revenues of Human Services Nonprofits by Revenue Type and County, for 4,339 Nonprofits Reporting Gross Receipts >$25,000 in 2000
117Center for Nonprofit Management
Expenses
Figure Hu-4: Distribution of Total Revenues of Human Services Nonprofits by Revenue Type and Revenue Range, for 4,339 Nonprofits Reporting Gross Receipts >$25,000 in 2000
Characteristics by Service Category: Human Services
118 Gianneschi Center for Nonprofit Research at CSU Fullerton
Southern California’s Nonprofit Sector
Expenses by County
Expenses of Itemizers
Figure Hu-5: Distribution of Human Services Nonprofits and Total Expenses by County, for 4,339 Nonprofits Reporting Gross Receipts >$25,000 in 2000
119Center for Nonprofit Management
Expenses by Size
Figure Hu-6: Distribution of Human Services Nonprofits and Total Expenses by Revenue Range, for 3,442 Human Services Nonprofits Filing Long Form 990 and Itemizing Expenses for 2000
Characteristics by Service Category: Human Services
120 Gianneschi Center for Nonprofit Research at CSU Fullerton
Southern California’s Nonprofit Sector
Figure Hu-7: Distribution of Total Expenses of Human Services Nonprofits by Revenue Range and Expense Type, for 3,442 Human Services Nonprofits Filing Long Form 990 and Itemizing Expenses for 2000
121Center for Nonprofit Management
Table Hu-4: Distribution of Payroll Expenses of Human Services Nonprofits by County, for 3,442 Human Services Nonprofits Filing Long Form 990 and Itemizing Expenses for 2000
Assets
Characteristics by Service Category: Human Services
122 Gianneschi Center for Nonprofit Research at CSU Fullerton
Southern California’s Nonprofit Sector
Table Hu-5: Distribution of Total Assets of Human Services Nonprofits by County, for 4,339 Nonprofits Reporting Gross Receipts >$25,000 in 2000
Figure Hu-8: Comparison of Total Assets Relative to Total Revenues and Total Expenses, for 4,339 Human Services Nonprofits Reporting Gross Receipts >$25,000 in 2000
123Center for Nonprofit Management
Religious
Characteristics by Service Category: Religious
124 Gianneschi Center for Nonprofit Research at CSU Fullerton
Southern California’s Nonprofit Sector
Table Rel-1: Ten Largest Religious Nonprofits in Southern California by Total Revenues
Characteristics by County
Figure Rel-1: Types of Nonprofits in the Religious Category, for 1,026 Religious Nonprofits Reporting Gross Receipts >$25,000 in 2000
125Center for Nonprofit Management
Table Rel-2: Distribution of Religious Nonprofits by County with Population and Income, for 1,026 Nonprofits Reporting Gross Receipts >$25,000 in 2000
Revenue
Revenue by Size
Characteristics by Service Category: Religious
126 Gianneschi Center for Nonprofit Research at CSU Fullerton
Southern California’s Nonprofit Sector
Figure Rel-2: Distribution of Religious Nonprofits and Total Revenues by Revenue Range, for 1,026 Religious Nonprofits Reporting Gross Receipts >$25,000 in 2000
127Center for Nonprofit Management
Revenue by County
Revenue Types
Figure Rel-3: Distribution of Religious Nonprofits by Revenue Range and County, for 1,026 Nonprofits Reporting Gross Receipts >$25,000 in 2000
Characteristics by Service Category: Religious
128 Gianneschi Center for Nonprofit Research at CSU Fullerton
Southern California’s Nonprofit Sector
Table Rel-3: Distribution of Total Revenues of Religious Nonprofits by Revenue Type and County, for 1,026 Nonprofits Reporting Gross Receipts >$25,000 in 2000
129Center for Nonprofit Management
Expenses
Figure Rel-4: Distribution of Total Revenues of Religious Nonprofits by Revenue Type and Revenue Range, for 1,026 Nonprofits Reporting Gross Receipts >$25,000 in 2000
Characteristics by Service Category: Religious
130 Gianneschi Center for Nonprofit Research at CSU Fullerton
Southern California’s Nonprofit Sector
Expenses by County
Expenses of Itemizers
Figure Rel-5: Distribution of Religious Nonprofits and Total Expenses by County, for 1,026 Nonprofits Reporting Gross Receipts >$25,000 in 2000
131Center for Nonprofit Management
Expenses by Size
Figure Rel-6: Distribution of Religious Nonprofits and Total Expenses by Revenue Range, for 680 Religious Nonprofits Filing Long Form 990 and Itemizing Expenses for 2000
Figure Rel-7: Distribution of Total Expenses of Religious Nonprofits by Revenue Range and Expense Type, for 680 Religious Nonprofits Filing Long Form 990 and Itemizing Expenses for 2000
Characteristics by Service Category: Religious
132 Gianneschi Center for Nonprofit Research at CSU Fullerton
Southern California’s Nonprofit Sector
Table Rel-4: Distribution of Payroll Expenses of Religious Nonprofits by County for 680 Religious Nonprofits Filing Long Form 990 and Itemizing Expenses for 2000
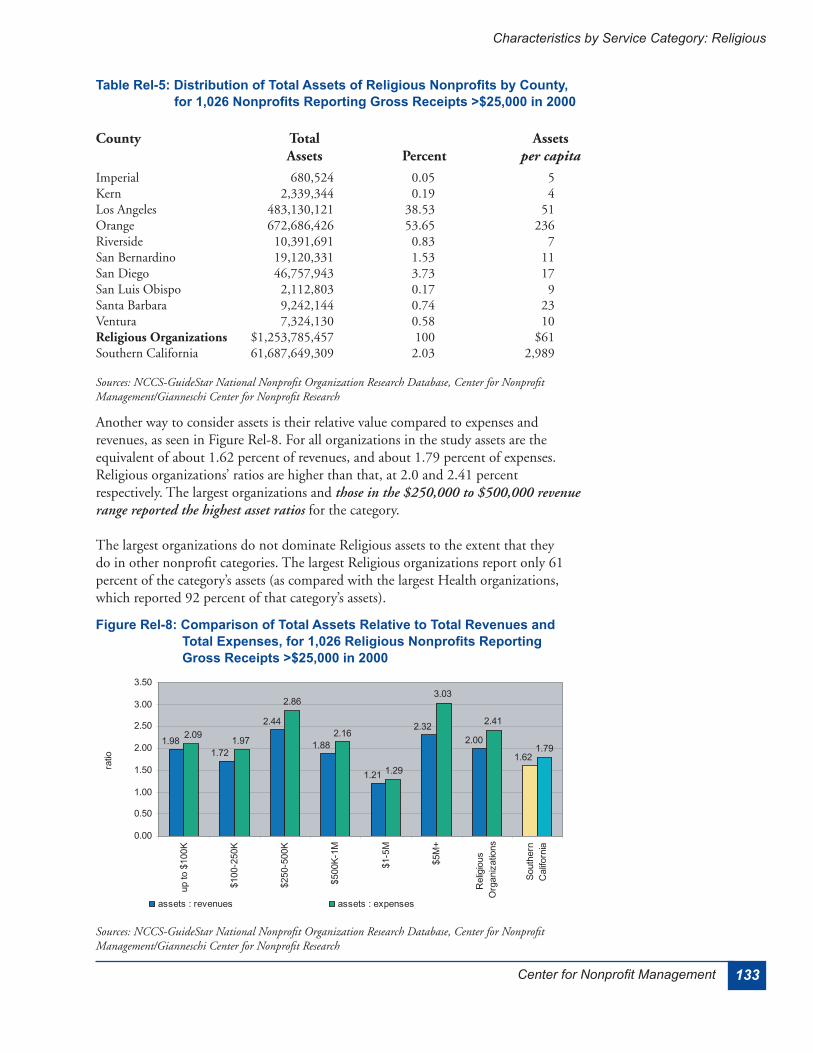
Assets
133Center for Nonprofit Management
Table Rel-5: Distribution of Total Assets of Religious Nonprofits by County, for 1,026 Nonprofits Reporting Gross Receipts >$25,000 in 2000
Figure Rel-8: Comparison of Total Assets Relative to Total Revenues and Total Expenses, for 1,026 Religious Nonprofits Reporting Gross Receipts >$25,000 in 2000
Characteristics by Service Category: Religious
134 Gianneschi Center for Nonprofit Research at CSU Fullerton
Southern California’s Nonprofit Sector

135Center for Nonprofit Management
Appendix: National Taxonomy of Exempt EntitiesI. Arts, Culture, & Humanities (ACH)
II. Education
III. Environment & Animals (E&A)
IV. Health
V. Human Services
VI. International & Foreign Affairs
VII. Public Benefit
Appendix
136 Gianneschi Center for Nonprofit Research at CSU Fullerton
Southern California’s Nonprofit Sector
VIII. Religious
IX. Mutual Benefit
X. Unclassified