Revenue volatility in German nonprofit sports clubs
20
Nonprofit and Voluntary Sector Quarterly 2015, Vol. 44(1) 5–24 © The Author(s) 2013 Reprints and permissions: sagepub.com/journalsPermissions.nav DOI: 10.1177/0899764013499072 nvsq.sagepub.com Article Revenue Volatility in German Nonprofit Sports Clubs Pamela Wicker 1 , Neil Longley 2 , and Christoph Breuer 1 Abstract Revenue volatility hinders the planning within nonprofit organizations, and as a consequence, it can influence the organization’s contribution to public welfare. To analyze the extent of revenue volatility and its determinants, this paper uses a comprehensive, longitudinal, data set of German nonprofit sports clubs (n = 724). It distinguishes between systematic volatility and club-specific volatility, and argues that a complete understanding of the sources and impacts of volatility requires one to clearly distinguish between the two components. Empirical results indicate that revenue diversification can significantly reduce club-specific volatility, but has more minimal benefits for lowering systematic volatility. It also reveals that clubs that rely more heavily on membership fees, and less on subsidies, appear to have reduced levels of systematic and club-specific volatility, with the impact being much greater for the latter. Keywords nonprofit sports organization, revenue volatility, sports club, financial risk, financial resources Introduction For all nonprofit organizations, financial viability is critical for success, and is an important prerequisite if the organization is to fulfill its broader mission (Young, 2007). A key aspect of financial viability relates to revenue flows—in the most basic sense, an organization’s revenues must meet or exceed its expenses in order for it to survive in the long run. In this context, several studies examined the nature of revenue 1 German Sport University Cologne, Germany 2 University of Massachusetts Amherst, USA Corresponding Author: Pamela Wicker, Department of Sport Economics and Sport Management, German Sport University Cologne, Am Sportpark Muengersdorf 6, Cologne 50933, Germany. Email: [email protected] 499072NVS 44 1 10.1177/0899764013499072Nonprofit and Voluntary Sector QuarterlyWicker et al. research-article 2013
-
Upload
dshs-koeln -
Category
Documents
-
view
3 -
download
0
Transcript of Revenue volatility in German nonprofit sports clubs
Nonprofit and Voluntary Sector Quarterly2015, Vol. 44(1) 5 –24
© The Author(s) 2013Reprints and permissions:
sagepub.com/journalsPermissions.nav DOI: 10.1177/0899764013499072
nvsq.sagepub.com
Article
Revenue Volatility in German Nonprofit Sports Clubs
Pamela Wicker1, Neil Longley2, and Christoph Breuer1
AbstractRevenue volatility hinders the planning within nonprofit organizations, and as a consequence, it can influence the organization’s contribution to public welfare. To analyze the extent of revenue volatility and its determinants, this paper uses a comprehensive, longitudinal, data set of German nonprofit sports clubs (n = 724). It distinguishes between systematic volatility and club-specific volatility, and argues that a complete understanding of the sources and impacts of volatility requires one to clearly distinguish between the two components. Empirical results indicate that revenue diversification can significantly reduce club-specific volatility, but has more minimal benefits for lowering systematic volatility. It also reveals that clubs that rely more heavily on membership fees, and less on subsidies, appear to have reduced levels of systematic and club-specific volatility, with the impact being much greater for the latter.
Keywordsnonprofit sports organization, revenue volatility, sports club, financial risk, financial resources
Introduction
For all nonprofit organizations, financial viability is critical for success, and is an important prerequisite if the organization is to fulfill its broader mission (Young, 2007). A key aspect of financial viability relates to revenue flows—in the most basic sense, an organization’s revenues must meet or exceed its expenses in order for it to survive in the long run. In this context, several studies examined the nature of revenue
1German Sport University Cologne, Germany2University of Massachusetts Amherst, USA
Corresponding Author:Pamela Wicker, Department of Sport Economics and Sport Management, German Sport University Cologne, Am Sportpark Muengersdorf 6, Cologne 50933, Germany. Email: [email protected]
499072 NVS44110.1177/0899764013499072Nonprofit and Voluntary Sector QuarterlyWicker et al.research-article2013

6 Nonprofit and Voluntary Sector Quarterly 44(1)
flows in nonprofit organizations (e.g., Fischer, Wilsker, & Young, 2011). There are two key dimensions to describing a club’s revenues over time: their average level over that time, and their fluctuation, or volatility, from period-to-period. The former dimension has gained most of the attention in the literature (e.g., Wicker, Breuer, & Hennigs, 2012), but the latter dimension is equally important. Clubs that experience high year-to-year fluctuations in revenue, particularly if those fluctuations are not able to be anticipated, not only incur more difficulties in the planning process, but also increase the likelihood that they will not be able to meet their expenses at some point in the future (Kearns, 2007), and thus increasing their risk of insolvency. Therefore, even if a club has relatively high average revenues over a given time period, large year-to-year fluctuations in these revenues can still pose considerable financial threat to the club.
Our paper extends the relatively small literature on volatility by arguing that a more complete understanding of the issue can only be gained by recognizing that an organi-zation’s revenue volatility has two different and distinct sources—club-specific and systematic sources. Club-specific sources relate to factors internal to the club, while systematic sources result from changes in the broader economy that affect all clubs, to some degree or another, simultaneously. Past studies examining revenue volatility in nonprofit organizations have not distinguished between systematic and club-specific sources of volatility (e.g., Carroll & Stater, 2008). We argue that such a distinction is crucial if we are to understand more precisely how nonprofits can better shield them-selves from volatility—in particular, clubs will tend to have a greater ability to protect themselves from club-specific risk than they do from systematic risk.
The specific context within which we examine this issue is the nonprofit sports sec-tor in Europe, specifically Germany. Many national sport systems in the European Union are organized as third-sector systems, with nonprofit sports clubs as the organi-zational base. These clubs are supported by governments, because they fulfill other social (nonsport) functions such as getting youths off the street and integrating immi-grants, in addition to the provision of sport programs (Breuer & Wicker, 2011). A key challenge that these clubs face in almost all Western European countries relates to financial viability (Lamprecht, Fischer, & Stamm, 2011; Taylor, Barrett, & Nichols, 2009). The underlying sources of large financial problems like weak governance (Dietl & Franck, 2007) have been analyzed for professional football clubs, but the financial viability of amateur sports clubs has been largely neglected in previous research, with a few exceptions (Wicker et al., 2012).
In this context, our empirical work attempts to answer three basic questions: (a) What is the magnitude of revenue volatility in nonprofit sports clubs? (b) What por-tion of this volatility is attributable to systematic factors, as opposed to club-specific (unsystematic) factors? and (c) Do some clubs have certain characteristics that make them less susceptible to systematic and/or club-specific volatility than other clubs? The primary contribution to the literature comes in examining questions (b) and (c). Although the differentiation between systematic and unsystematic risk has been mentioned in the literature (Kearns, 2007), no empirical evidence has been provided to date.

Wicker et al. 7
Literature Review
The literature on nonprofit financing has often focused on the revenue mix of non-profit organizations, and has taken various approaches to the issue (e.g., C. F. Chang & Tuckman, 1996; Tinkelman & Neely, 2011). For example, revenue sources were related to the types of services provided by the organization (Fischer et al., 2011), and an increasing commercialization of nonprofits was demonstrated (Guo, 2006). Previous research also examined the interactions among revenue sources, and showed mixed findings regarding crowd-in or crowd-out effects (Tinkelman & Neely, 2011). Although revenue diversification was considered a useful tool to improve the financial stability of organizations (Carroll & Stater, 2008; Kingma, 1993), the level of revenue diversification seems relatively low among nonprofits across various areas, suggesting that they rely heavily on only one or a few revenue sources (Carroll & Stater, 2008; C. F. Chang & Tuckman, 1996).
Turning to research specifically on the sport sector, several studies have examined the revenue structure of sports clubs in Western Europe (e.g., Allison, 2001; Vos et al., 2011). Revenues from membership fees were found to be the most important revenue source of sports clubs across countries (Wicker et al., 2012). Of secondary importance were revenues from fundraising in Belgium (Vos et al., 2011) and Scotland (Allison, 2001), from sponsorship deals in Switzerland (Lamprecht et al., 2011), from bar, cater-ing, and hospitality in the United Kingdom (Taylor et al., 2009), and from public subsidies in Germany (Breuer & Wicker, 2011).
Sports clubs in Western Europe were found to have similar financial structures, despite different policy systems (Vos, Wicker, Breuer, & Scheerder, 2013). This revenue structure is different from sports organizations in Canada, where revenues from fees for goods or services were found to be the most important income source (Gumulka, Barr, Lasby, & Brownlee, 2005). Research in other parts of the world examined the financial vulnerability of nonprofit sports clubs. A study from New Zealand documented that—depending on the conceptualization of financial vulnerability—between 31.6% and 55.8% of sports clubs are financially vulnerable (Cordery, Sim, & Baskerville, 2013). The revenue volatility of sports clubs was only examined for listed clubs (i.e., for-profit organizations; Benkraiem, Le Roy, & Louhichi, 2011), not in the nonprofit sector.
When comparing the finances of the general nonprofit sector with the sports sector, similarities and differences can be found. Similar to nonprofits in other sectors, an increasing commercialization was documented in the sports sector (Enjolras, 2002; Wicker et al., 2012). An analysis of the interactions among revenue categories sup-ports a crowd-in effect between commercial resources like sponsorship income, and public and voluntary resources like subsidies and donations (Enjolras, 2002; Wicker et al., 2012). With regard to the revenue structure, it seems that sports clubs rely on a greater number of revenue sources than other nonprofit organizations (Breuer & Wicker, 2011; Lamprecht et al., 2011). Moreover, a higher level of revenue diversifi-cation can be observed for sports clubs (Wicker & Breuer, 2013). Yet, it seems that the share of organizations being financially vulnerable is higher in the sports sector than in other sectors (Cordery et al., 2013; Tuckman & Chang, 1991).

8 Nonprofit and Voluntary Sector Quarterly 44(1)
Despite these many studies pertaining to financing nonprofits—sport and nonsport—most of the studies have given little attention to volatility issues, and for those have, none have empirically evaluated the possible impacts of broader economic changes on reve-nues. Only intraorganizational characteristics have been part of these past analyses. In this regard, the present study focuses on the fact that broader changes in national eco-nomic conditions have the potential to affect many clubs and various revenue streams, hence making this systematic source of revenue volatility much more difficult for clubs to simply diversify-away. This is not to suggest that all clubs are affected equally by changes in the economy. As discussed later in the paper, it is very likely that some clubs experience much greater revenue impacts when economic conditions change than do other clubs.
The Nature of Volatility
The Concept of Risk
The concept of risk underlies much of the literature in financial economics. While there is no singular definition of the concept, the risk of a financial asset (like a com-mon stock) is generally measured by the volatility of its returns—those stocks whose returns tend to fluctuate significantly across time, rather than remain relatively stable, provide greater uncertainty to investors, and increase the probability of the investor suffering capital losses. One of the most prominent theories pertaining to risk within the financial economics literature is the Capital Asset Pricing Model (CAPM), which has its foundation in the work of Markowitz (1952). Under the CAPM, a financial asset’s total volatility can be partitioned into two parts—a systematic and unsystematic component. The former is that portion of the total volatility that is driven by factors external to the company—that is, by movements in the broader markets—while the latter is that portion of the total volatility that is driven by company-specific factors. By definition, these company-specific fluctuations are isolated to an individual com-pany, and do not vary in any systematic way across firms in the economy. Thus, the effects on the investor of these company-specific fluctuations can be largely elimi-nated by the investor simply by increasing the size of his or her portfolio—negative fluctuations in one stock are likely to be offset by positive fluctuations in another stock. Because of the ability of investors to diversify-away company-specific risk, the CAPM then views systematic risk as the only type of risk that investors cannot avoid, and hence the only type of risk for which investors will be compensated. Thus, the risk of a company (and its stock) is fully determined by its degree of systematic risk. Some companies (e.g., airlines) are more sensitive than others (e.g., electric utilities) when economic conditions fluctuate, and hence possess greater degrees of market/system-atic risk.
While the purpose of this paper is not to analyze stock returns, but rather to analyze the determinants of revenue volatility among nonprofit sports clubs, the CAPM’s dis-tinction between systematic and unsystematic risk is a useful paradigm to guide the analysis. First, one can start with the premise that clubs are risk averse—regardless of

Wicker et al. 9
a club’s average level of revenues over a time period, all clubs prefer less, rather than more, year-to-year volatility in that revenue stream. A lower degree of revenue volatil-ity allows clubs to better plan for the future, whether those plans are related to capital investments, program offerings, or personnel decisions. Thus, to the extent that clubs better understand potential sources of this volatility, they may be able to take manage-rial action to reduce some of this volatility. For example, just as with investors in financial securities who face a risk/return trade-off, this concept could also be true for nonprofit revenues, where, say, a government grant increases revenues (i.e., returns), but also increases risk because its continuation into the future may be very uncertain.
The Effects of Diversifying Revenue
Kingma (1993) argues that “the problem of choosing a risk/revenue package for a nonprofit organization is identical to the classic finance problem of choosing a risk/return package”—in finance, the portfolio manager is choosing the optimal combina-tion of two assets (stocks), while the board of a nonprofit organization chooses the optimal combination of revenue streams (p. 109).
To more precisely examine the nature of revenue volatility, assume a club has two revenue sources, A (say, membership fees) and B (say, sponsorship revenues). The variance of the club’s total revenues, σ2
TR, is given by
σ2TR = xA
2 σA2 + xB
2 σB2 + 2xAxB(CovAB), (1)
Where xA is the percentage of the club’s revenues coming from stream A, xB is the percentage of the club’s revenues coming from stream B, σA is the standard deviation of A’s revenues, σB is the standard deviation of B’s revenues, and (CovAB) is the covari-ance between the revenues of A and B.
Equation 1 yields an important observation. The variance of the club’s total reve-nues depends on not only the weighted average of the individual variances in A and B, but also on the comovement in A and B. This covariance between A and B is a function of the correlation coefficient between A and B; in particular, CovAB = (σA) (σB) (CorrAB).
In Equation 1, it can be shown that, providing CorrAB < 1, the standard deviation in total revenues, σTR, is less than the weighted average of the standard deviations of the two individual revenue streams—in other words, there are benefits to diversification. To illustrate with a numerical example, assume a club derives equal amounts of reve-nue from sources A and B (i.e., xA = xB = 0.50), and that σA = 10 and σB = 20. In the extreme, if CorrAB = 1, then σTR = 15, which is just the weighted average of the two individual standard deviations. However, as long as CorrAB < 1, then σTR < 15; for example, with CorrAB = +0.50, σTR = 13.23; with CorrAB = 0, σTR = 11.18; with CorrAB = −0.50, σTR = 8.66, and so on. Ideally, then, when a club adds a second revenue stream to an existing revenue source, it would prefer this new revenue stream not to be per-fectly correlated with the original revenue stream.
Following Ross, Westerfield, and Jaffe (2008), the analysis can be generalized to the case of N revenue sources. For ease of exposition, assume that each revenue source

10 Nonprofit and Voluntary Sector Quarterly 44(1)
has equal variance, all covariances are the same for every pair of revenue streams, and that all N revenue sources contribute equally to total club revenues. Then, the variance of the club’s total revenues can be expressed as
σ2TR = N (1/N2) (Average Variance)
+ N (N-1) (1/N2) (Average Covariance) = (1/N) (Average Variance)
+ (1-(1/N)) (Average Covariance) (2)
From Equation 2, it can be seen that as N goes to infinity, the weighting on the vari-ance term goes to zero, while the weighting on the covariance term goes to one (Ross et al., 2008)—thus, the variance terms disappear, but the covariance terms remain. Thus, while the variance of any particular revenue stream can ultimately be diversi-fied-away by adding more revenue streams, the covariances of that stream with other revenue streams cannot be diversified-away.
This latter (i.e., covariance) effect implies that there will be a portion of any club’s total revenues that are driven by broader economic conditions—conditions that affect all revenue streams simultaneously, hence causing these streams to covary with each other, and making it impossible to diversify-away these effects. This risk could be termed systematic risk. One method to capture this common source of variation is to regress the total revenues of club i at time t (denoted TRit) on a measure of economy-wide output, such as Gross Domestic Product (GDP), during the same time period (denoted by GDPt):
TRit = αi + βi GDPt + εit. (3)
The coefficient βi measures the extent to which club revenues move together with GDP changes, while the error term, εit, captures the variability in club revenues which are independent of GDP. Following Ross et al. (2008), βi is defined statistically as
βi = Cov(TRi,GDP) / σGDP2,
and therefore a club’s total risk, σ2TR, can, after rearranging, be decomposed into two
components, as follows:
σ2TR = βi
2 σGDP2 + σε2, (4)
where the first term captures the club’s systematic risk, and the second term covers the unsystematic, or club-specific, risk.
The result in Equation 4 has a directly parallel situation in the CAPM. Under the CAPM, the return on an individual stock (the dependent variable) is regressed on a single variable—the market return—with β then measuring that stock’s sensitivity to fluctuations in the market return. The essence of the CAPM is that it then goes on to assert that when investors hold the market portfolio, the risk of any given stock, and
Wicker et al. 11
hence its expected return, is solely a function of β, and not of any firm-specific risk. The CAPM has been frequently criticized in the finance literature for its many restric-tive theoretical assumptions (perfect information, zero transactions costs, etc.) and, perhaps relatedly, its sometimes lack of empirical effectiveness in adequately explain-ing differences in returns across stocks. Methodologically, the CAPM has sometimes been criticized as being underspecified (J. Chang & Hung, 2000), in that the returns on a stock may systematically vary with more than just the market portfolio—they may, for example, vary with other macro measures, like the inflation rate, or interest rates (see Ross et al., 2008, within the context of the arbitrage pricing model). If this is the case, then the calculation of β will be distorted, and will not provide a true measure of market risk. In addition, the market portfolio itself is an abstract concept, and must be operationalized. The choice of the operational variable—that is, some type of a market index that is intended to proxy the market portfolio—then becomes crucial. However, despite these criticisms, Damodaran (1997) notes that the CAPM “is the standard against which other risk and return models are measured,” and is widely used on Wall Street and in corporate policy marking (p. 93).
Some of these concerns with CAPM are potentially relevant to our application. For example, if Equation 4 in our model is underspecified, then β will be distorted. Relatedly, there arises a question as to whether GDP is the most effective measure of systematic risk in our situation. It is our view that GDP is, in fact, the most reasonable aggregate measure of systematic fluctuations in the sports club context, although pre-vious research has shown that other measures are more adequate to capture economic welfare in other contexts (Stockhammer, Hochreiter, Obermayr, & Steiner, 1997). In our analysis, we need a measure that not only affects every club, but is measured con-sistently across federal states in Germany. Using GDP allows us to do that. As well, GDP captures private spending and government spending in the economy, both impor-tant drivers of the revenues of sports clubs. In addition, adding other systematic vari-ables that are themselves correlated with GDP—like, for example, unemployment rates—present econometric difficulties of their own. It also should be noted that using GDP is not without a foundation in the literature—studies like Krauss and Walter (2009) use GDP as a suitable proxy for domestic market size.
Determinants of Volatility
The literature suggests that the specific revenue mix (i.e., membership fees, govern-ment subsidies), and the level of revenue diversification can influence a club’s revenue volatility. With the revenue mix, the relative contribution of various revenue streams to the club’s total revenues should influence revenue volatility. Previous studies have shown that the funding source was correlated with financial vulnerability (Hodge & Piccolo, 2005), and that income streams from various stakeholders differ in their sen-sitivity to fluctuations in the economy (Lindqvist, 2012). Revenues from membership fees can be considered relatively stable because the club members pay membership fees on a regular basis (i.e., usually annually). Research has also indicated that the relative importance of membership fees in the revenue mix has increased significantly
12 Nonprofit and Voluntary Sector Quarterly 44(1)
over time (Breuer & Wicker, 2011). In addition, privately funded organizations were found to be less financially vulnerable than government or commercially funded ones (Hodge & Piccolo, 2005). This leads to our first hypothesis:
Hypothesis 1 (H1): Sports clubs with a high share of revenues from membership fees experience lower revenue volatility.
Government funding is an important source of funding for nonprofit sports clubs (Breuer & Wicker, 2011), and is typically considered a stable income source. However, it depends on the financial situation of local and national governments. Nevertheless, government subsidies are usually considered a predictable revenue source and conse-quently, a high concentration of government funding was associated with lower finan-cial risk in previous research (Kingma, 1993). This funding source is considered less volatile than other funding sources (e.g., donations) and therefore, it is more appreci-ated by organizations, despite the work efforts and control issues that are associated with it (Gronbjerg, 1991). Thus, our second hypothesis is as follows:
Hypothesis 2 (H2): Sports clubs with a high share of revenues from government subsidies experience lower revenue volatility.
Moving beyond specific revenue sources, the overall level of revenue diversifica-tion should impact a club’s revenue volatility. Organizations with more diversified revenues have a stronger financial position (C. F. Chang & Tuckman, 1996). In previ-ous research, organizations with more diversified revenues were also less financially vulnerable (Greenlee & Trussel, 2000; Tuckman & Chang, 1991) and experienced lower levels of revenue volatility (Carroll & Stater, 2008). With regard to the distinc-tion between club-specific and systematic volatility, Kearns (2007) suggests that rev-enue “diversification is a way to minimize unsystematic risk” (Kearns, 2007, p. 297). Thus, our third and fourth hypotheses are as follows:
Hypothesis 3 (H3): Sports clubs with higher levels of revenue diversification expe-rience lower revenue volatility.
Hypothesis 4 (H4): Revenue diversification reduces club-specific volatility more than it does systematic volatility.
Method
Research Context: Nonprofit Sports Clubs in Germany
According to the German Olympic Sports Confederation (Deutscher Olympischer Sportbund [DOSB], 2011), there are more than 91,000 sports clubs comprising more than 27 million memberships. Given the total number of approximately 82 million citizens in Germany, one in three Germans is a member of a sports club. German sports clubs offer a wide range of more than 60 different sports (DOSB, 2011); more

Wicker et al. 13
than half of the clubs are multisports clubs that offer four sports on average. Most clubs (about 64%) have up to 300 members, whereas there are also bigger clubs with more than 800 members (about 13%). Sports clubs in other European countries have fewer members on average and are mainly single sports clubs (Allison, 2001; Lamprecht et al., 2011; Taylor et al., 2009).
Data Collection
The data are drawn from the Sports Development Report (Breuer & Wicker, 2011), a panel study where sports clubs are questioned about their situation (members, sports programs, problems, finances, etc.) every 2 years. The data were collected with the help of an online survey. The email addresses of the clubs were provided by the federal state sports confederations. All clubs with a correct email address were invited via email to take part in the survey. They received a personalized link allowing login/logout. In most cases the questionnaire was completed by a voluntary board member (e.g., president, secretary). At this point, three waves of the Sports Development Report had been completed (2005, 2007, and 2009). From the first to the third wave, the number of provided email addresses and the sample sizes have increased: from about 18,000 email addresses in 2005 (n = 3,371 clubs, 20.1% response rate), to 44,000 email addresses in 2007 (n = 13,068 clubs, 35.1% response rate), to more than 63,000 email addresses in 2009 (n = 19,345 clubs, 33.3% response rate). From this, our data set contains those sports clubs which participated in all three waves (n = 724) and provided financial data for those years (n = 240). The financial data of the clubs cor-respond to the year before the survey (2004, 2006, and 2008). Sports clubs from all 16 federal states in Germany are part of this subsample.
Given the discrepancy between the total population of sports clubs in Germany (roughly 91,000 clubs), the number of clubs that has been invited to the survey (roughly 63,000 clubs), and the present subsample (n = 240), there is a potential for survey nonresponse bias and sample bias which should be addressed. However, a comparison with the total population of clubs was not possible because their characteristics are not known. In fact, the Sports Development Report is authorized to find out the character-istics of German sports clubs and the overall sample of the third wave (n = 19,345) is the biggest sports club sample in Germany. Therefore, tests for sample bias had to be made with this sample. By construction, the 240 clubs are part of this sample and they were compared with the larger sample (n = 19,105) using t tests.
The results (Table 1) showed no significant differences regarding the number of members (416.1 vs. 366.2; p > .1), but did show a difference regarding the number of provided sports (5.0 vs. 3.4; p < .01). Also tested for were differences in perceived organizational problems, because it could be that the clubs in the subsample experi-ence fewer problems. No significant differences could be found for 14 of 16 organiza-tional problems (p > .1). The number of laws, orders, and directives was perceived as more severe by the clubs in the subsample (2.77 vs. 2.62; p < .1), while the financial situation of the club was perceived as less severe (2.14 vs. 2.32; p < .1). However, the comparison of an objective measure of financial performance revealed the opposite.

14 Nonprofit and Voluntary Sector Quarterly 44(1)
Table 1. Comparison Between Clubs in This Subsample and the Larger Sample 2009.
Variable Larger sample (n = 19,105) Subsample (n = 240) t
Number of members (mean)
366.2 416.1 −0.517
Number of sports (mean) 3.4 5.0 −5.972***Proportion of clubs that
could break even (in %)75.3 64.0 3.961***
Perceived severity of organizational problems (from 1 = no problem to 5 = a very big problem)
Recruitment/retention of members
2.69 2.69 0.054
Recruitment/retention of adolescent competitive athletes
3.05 2.92 1.482
Recruitment/retention of volunteers
3.11 3.13 −0.308
Recruitment/retention of coaches
2.89 2.87 0.294
Recruitment/retention of referees/officials
2.83 2.78 0.483
Financial situation of the club
2.32 2.14 2.236**
Expenses for competitive sports
2.63 2.51 1.435
Availability of sports facilities
2.18 2.32 −1.504
Condition of sports facilities
2.16 2.26 −1.297
Adequacy of the sports facilities for the sports programs
1.82 1.84 −0.232
Local competition from nonprofit sports clubs
1.91 1.86 0.691
Local competition from commercial sports providers
1.65 1.69 −0.625
Number of laws, orders, directives
2.62 2.77 −1.689*
Ambiguity of the club’s overall perspective
2.03 2.00 0.531
Demographic change in the region
2.48 2.54 −0.780
Effects of all-day schools on the available time for training/sports practice
2.36 2.42 −0.700
*p < .1. **p < .05. ***p < .01.

Wicker et al. 15
Clubs in the subsample were less likely to break even (64.0% vs. 75.3%; p < .01) and were therefore not more financially healthy than the clubs in the larger sample. Thus, it is conceivable that the subsample may be skewed in some way; however, given the contradictory findings for financial indicators, along with the insignificance of most other characteristics, no adjustments were made.
Data Analysis
The data analysis consists of several steps. First, each club’s volatility in total (nomi-nal) revenues over the sample period is measured. Total revenues were first normal-ized, such that club revenues in 2004 (the first observation period) were given a value of 1.00, with 2006 and 2008 club revenues then stated as a proportion of these 2004 revenues. This normalization gives all clubs the same 2004 starting point, and allows comparisons across clubs even where the magnitude of club revenues may be quite different. A club’s revenue volatility is then measured as the variance of these normal-ized returns, denoted as σ2
TR. We then partition the total volatility into systematic and club-specific components, as shown in Equation 4. In partitioning this volatility, we calculated the correlation between club i’s revenues in a given year and (nominal) GDP in that same year. (As a robustness check, we also measured the correlation between club i’s revenue in a given year, and the lagged—1 year, and then 2 years—value of German GDP, but our results did not materially change.) As acknowledged earlier in the paper, this partitioning is potentially imperfect, as Equation 4 may be subject to an omitted variable criticism, as is the CAPM itself. However, our data set’s limited number of longitudinal observations on sports club revenues prevents us from adding any further independent variables to Equation 4. GDP is normalized in the same manner as revenues to ensure consistency. The longitudinal data with the three observations are used to calculate volatility; however, the data set is collapsed into a cross-sectional data set for the analysis of the determinants of volatility.
Various regressions are then carried out to analyze the determinants of volatility, total volatility and the partitioned volatility. Our base-case regression is as follows:
σTRi = α0 + α1 Membershipi + α2 Subsidiesi +
α3 Donationsi + α4 ClubActivi + α5 Commerciali + α6 Sponsorsi + α7 1 − Herfi + α8 LN TRi + α9 Agei. (5)
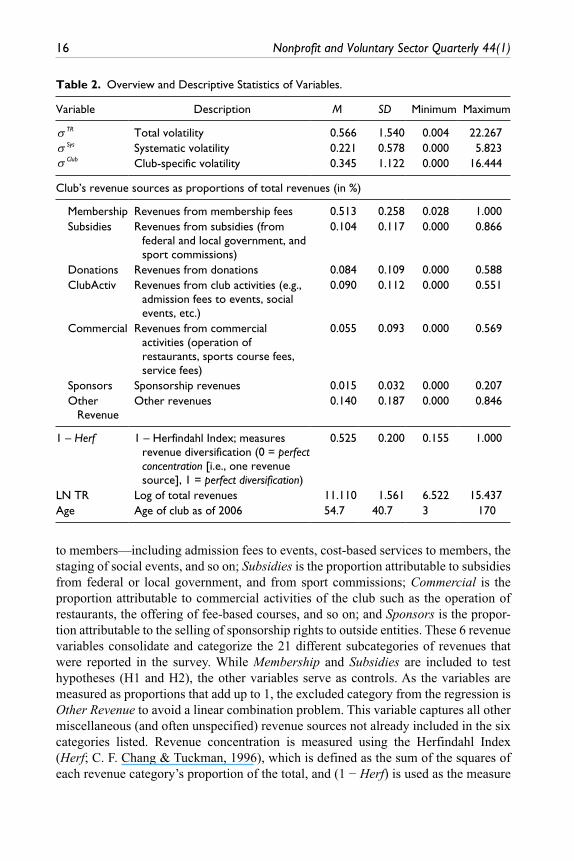
In Equation 5, the dependent variable σTR is constructed using the three biannual surveys over the 2004 to 2008 time period. In subsequent regressions, σTR is replaced with the partitioned volatilities. The independent variables represent the average val-ues over these three periods for each club. Thus, the data set for the regression is cross-sectional, with one observation for each club. The variables are summarized in Table 2. All revenue types are measured as a percentage of total revenues: Membership is the proportion of a club’s total revenue that is attributable to membership fees; Donations is the proportion attributable to voluntary donations to the club; ClubActiv is the pro-portion attributable to a variety of activities relating to the provision of sport services
16 Nonprofit and Voluntary Sector Quarterly 44(1)
Table 2. Overview and Descriptive Statistics of Variables.
Variable Description M SD Minimum Maximum
σ TR Total volatility 0.566 1.540 0.004 22.267σ Sys Systematic volatility 0.221 0.578 0.000 5.823σ Club Club-specific volatility 0.345 1.122 0.000 16.444
Club’s revenue sources as proportions of total revenues (in %)
Membership Revenues from membership fees 0.513 0.258 0.028 1.000 Subsidies Revenues from subsidies (from
federal and local government, and sport commissions)
0.104 0.117 0.000 0.866
Donations Revenues from donations 0.084 0.109 0.000 0.588 ClubActiv Revenues from club activities (e.g.,
admission fees to events, social events, etc.)
0.090 0.112 0.000 0.551
Commercial Revenues from commercial activities (operation of restaurants, sports course fees, service fees)
0.055 0.093 0.000 0.569
Sponsors Sponsorship revenues 0.015 0.032 0.000 0.207 Other
RevenueOther revenues 0.140 0.187 0.000 0.846
1 – Herf 1 – Herfindahl Index; measures revenue diversification (0 = perfect concentration [i.e., one revenue source], 1 = perfect diversification)
0.525 0.200 0.155 1.000
LN TR Log of total revenues 11.110 1.561 6.522 15.437Age Age of club as of 2006 54.7 40.7 3 170
to members—including admission fees to events, cost-based services to members, the staging of social events, and so on; Subsidies is the proportion attributable to subsidies from federal or local government, and from sport commissions; Commercial is the proportion attributable to commercial activities of the club such as the operation of restaurants, the offering of fee-based courses, and so on; and Sponsors is the propor-tion attributable to the selling of sponsorship rights to outside entities. These 6 revenue variables consolidate and categorize the 21 different subcategories of revenues that were reported in the survey. While Membership and Subsidies are included to test hypotheses (H1 and H2), the other variables serve as controls. As the variables are measured as proportions that add up to 1, the excluded category from the regression is Other Revenue to avoid a linear combination problem. This variable captures all other miscellaneous (and often unspecified) revenue sources not already included in the six categories listed. Revenue concentration is measured using the Herfindahl Index (Herf; C. F. Chang & Tuckman, 1996), which is defined as the sum of the squares of each revenue category’s proportion of the total, and (1 − Herf) is used as the measure

Wicker et al. 17
of a club’s revenue diversification. In constructing Herf, the more-detailed 21 subcat-egories of revenues are used, rather than the consolidated revenue categories shown in Equation 5. LN TR represents the log of total revenues and proxies club size. Age indicates the number of years the club has been established.
The models are OLS regressions. Further regression specifications such as log-linear models were tried; however, they did not improve the quality of the models. Model 1 includes all variables except revenue diversification (1 − Herf), while diver-sification was included in Model 2 to see its explanatory power. Correlation analyses were conducted to check the independent variables for multicollinearity (Table 3). Due to the high correlation between Membership and (1 − Herf) (r = −.717), Model 3 was estimated without Membership. The equality of coefficients across regression models was checked using t tests.
Results and Discussion
The descriptive statistics (Table 2) show that, on average, membership fees are the most important revenue source for clubs, followed by subsidies, revenue from club activities, donations, commercial activities, and sponsorships. Across all clubs, the average standard deviation in their total revenues during the sample period was 0.57, or about 57% of normalized 1st-year (2004) revenues. The average σTR of 0.566 was comprised of σSys of 0.221 and σClub of 0.345. Thus, for a typical club, about 61% (0.345/0.566) of its total volatility was club-specific, while the other 39% was system-atic. Looking further at systematic volatility, the average beta coefficient for clubs was 3.23, indicating sensitivity in club revenues that was more than 3 times greater than the underlying change in GDP.
Total volatility (Table 4) is determined significantly by Membership and Subsidies (Models 1a and 1b). The negative sign on Membership indicates that clubs that rely more heavily on membership fees have lower volatility, thus supporting the first hypothesis (H1). Conversely, the positive sign on Subsidies indicates higher levels of overall volatility for clubs that rely more heavily on subsides. This effect is not
Table 3. Correlation Matrix.
(1) (2) (3) (4) (5) (6) (7) (8) (9) (10)
(1) Membership 1 (2) Subsidies −.339*** 1 (3) Donations −.382*** .035 1 (4) ClubActiv −.371*** −.114 .099 1 (5) Commercial −.340*** −.061 −.051 .178*** 1 (6) Sponsors −.194*** −.012 .069 .064 .146** 1 (7) Other Revenue −.523*** −.080 −.122* −.170*** −.091 −.049 1 (8) 1 – Herf −.717*** .285*** .334*** .444*** .371*** .348*** .107* 1 (9) LN TR −3.65*** .163** −.044 .101 .230*** .180*** .222*** .446*** 1 (10) Age −.107* .052 −.077 .084 .160 .118 .011 .279*** .503*** 1
*p < .1. **p < .05. ***p < .01.

18 Nonprofit and Voluntary Sector Quarterly 44(1)
consistent with the second hypothesis (H2). One explanation could be that subsidies often come from a single source, and are often all-or-nothing in nature, thus having a tendency to exhibit large and abrupt year-to-year changes. When (1 − Herf) is added in Model 2a, it has a significant negative impact on total volatility. This means the higher the level of revenue diversification, the lower the volatility, thus confirming the third hypothesis (H3). Model 3a supports the robustness of effects; Subsidies and (1 − Herf) are still significant when Membership is excluded. The other independent variables have no significant effect on total volatility. It is possible that these other types of revenue remain insignificant because they are much less prevalent among sports nonprofits.
Systematic volatility (Table 5) is influenced significantly by Membership, Subsidies, and Commercial (Model 1b), indicating that not all clubs experience the same level of systematic risk. (1 − Herf) also has a significant influence when added in Model 2b. The negative coefficient on (1 − Herf) indicates that, despite the amount of any spe-cific revenue source a club collects, revenue diversification reduces systematic volatil-ity. This may initially be somewhat counterintuitive, in that diversification cannot eliminate systematic risk, due to the fact that various club revenue sources are all correlated with the economy as a whole, and, hence, are all correlated with each other. However, as a club’s total systematic volatility is simply the weighted average of the systematic volatility of its individual revenue streams (βs are additive), some less-diversified clubs may have their revenue streams focused on high-volatility revenue streams. In other words, more-diversified clubs are better able to average-out their
Table 4. Summary of Regression Results for Total Volatility.
Model 1a Model 2a Model 3a
Coefficient t Coefficient t Coefficient t
Constant 1.136 1.174 1.790 1.864* −0.512 −0.716Membership −1.202 −2.264** −1.948 −3.496*** — —Subsidies 4.267 4.765*** 5.130 5.670*** 6.078 6.874***Donations −0.852 −0.886 0.120 0.123 1.180 1.243ClubActiv −0.562 −0.607 0.772 0.792 1.474 1.509Commercial −1.330 −1.198 −0.389 −0.350 0.522 0.472Sponsors −1.367 −0.468 2.096 0.697 1.903 0.6181 – Herf — — −2.905 −3.615*** −1.864 −2.438**LN TR 0.004 0.055 0.062 0.835 0.115 1.549Age −0.004 −1.571 −0.003 −1.047 −0.004 −1.614
R2 .189 .233 .192 R adj
2 .161 .202 .163
F 6.690 7.711 6.814
P <.001*** <.001*** <.001***
Note. Displayed are the unstandardized coefficients.*p < .1. **p < .05. ***p < .01.

Wicker et al. 19
betas from various revenue sources, thus dampening (but not eliminating) their poten-tial exposure to market changes, relative to clubs whose revenues are more concen-trated on high-beta sources (like subsidies).
Club-specific volatility (Table 6) is—like total and systematic volatility—deter-mined significantly by Subsidies (Model 1c). When (1 − Herf) is added in Model 2c, Membership and (1 − Herf) are also significant. It seems that membership fees are desirable, because they exhibit low year-to-year volatility, in part because the category has low marginal rates—total membership fees are the result of a relatively large num-ber of people contributing a relatively small amount each, thus acting as a smoothing device. In aggregate, then, membership fees are desirable for two reasons—first, they have relatively low correlation with economic conditions (lowering systematic volatil-ity), and, second, they exhibit low year-to-year standard deviations (lowering system-atic volatility and club-specific volatility). Conversely, subsidies are undesirable for the exact opposite reasons—they are highly correlated with the broader economy (increasing systematic volatility), and they exhibit large year-to-year standard devia-tions; these effects, however, are much more pronounced for club-specific volatility than for systematic volatility.
The coefficient of (1 − Herf) is lower (t = −1.60; p < .2) in the club-specific volatility model (2c) than in the systematic volatility model (2b), indicating that revenue diversi-fication reduces club-specific volatility more than it does systematic volatility. In the models without Membership (3b and 3c), the difference in the magnitude of (1 − Herf) between the club-specific and systematic regressions is even slightly greater (t = 1.62;
Table 5. Summary of Regression Results for Systematic Volatility.
Model 1b Model 2b Model 3b
Coefficient t Coefficient t Coefficient t
Constant 0.466 1.237 0.673 1.784* −0.423 −1.488Membership −0.691 −3.345*** −0.927 −4.236*** — —Subsidies 0.500 1.435 0.774 2.176** 1.225 3.485***Donations −0.521 −1.391 −0.213 −0.556 0.292 0.773ClubActiv −0.413 −1.147 0.009 0.024 0.344 0.885Commercial −1.122 −2.600*** −.825 −1.887* −.391 −0.888Sponsors −0.253 −0.222 0.844 0.715 0.752 0.6151 – Herf — — −0.920 −2.914*** −0.424 −1.397LN TR 0.028 0.962 0.046 1.583 0.072 2.418**Age −0.002 −1.879* −0.001 −1.447 −0.002 −2.107**
R2 .128 .159 .093 R adj
2 .097 .126 .061
F 4.205 4.803 2.943
P <.001*** <.001*** <.001***
Note. Displayed are the unstandardized coefficients.*p < .1. **p < .05. ***p < .01.

20 Nonprofit and Voluntary Sector Quarterly 44(1)
p < .2). In fact, in these models, (1 − Herf) is no longer significant for systematic volatil-ity, but remains highly significant for club-specific volatility. This finding supports the fourth hypothesis (H4). Decreasing (1 − Herf) by 10 percentage points (from, say, 0.60 to 0.50) decreases club-specific volatility (measured by the normalized standard devia-tion of revenue, with normalized 1st-year revenue set equal to 1.00) by 0.199, but reduces systematic volatility by only 0.092. Thus, the reduction in club-specific risk from a decrease in (1 − Herf) is about 2.2 times greater than the commensurate reduc-tion in systematic risk. Given that, for the average club, about 39% of its total volatility is systematic in nature, this illustrates that revenue diversification alone is not the pana-cea for clubs that it has sometimes been made out to be; while it is effective in reducing club-specific volatility, its impact on systematic volatility is relatively minimal.
Table 7 shows the correlations of revenue sources (cumulative, across all clubs for a given year) with German GDP. Clubs that rely more heavily on the lower correlation (and hence lower β, as β is defined earlier in the paper) revenue sources such as mem-bership fees, have lower volatility, while those clubs that rely on higher correlation/higher beta revenue sources like subsides tend to experience greater levels of system-atic volatility. The low correlation for membership fees is likely due to the fact that many members have long-term loyalty to the club, and while membership may not increase dramatically when GDP increases, neither will membership decline substan-tially if economic conditions worsen. The high positive correlation between subsidies and GDP is likely rooted in the budgetary realities of most governments: When eco-nomic conditions are good, government revenues are higher, and more funds are
Table 6. Summary of Regression Results for Club-Specific Volatility.
Model 1c Model 2c Model 3c
Coefficient t Coefficient t Coefficient t
Constant 0.670 0.955 1.117 1.599 −0.089 −0.174Membership −0.511 −1.328 −1.021 −2.519** — —Subsidies 3.767 5.801*** 4.357 6.619*** 4.854 7.640***Donations −0.331 −0.475 0.333 0.470 0.888 1.303ClubActiv −0.149 −0.222 0.762 1.075 1.130 1.611Commercial −0.207 −0.258 0.435 0.538 0.913 1.147Sponsors −1.114 −0.526 1.252 0.573 1.151 0.5211 – Herf — — −1.985 −3.395*** −1.440 −2.621***LN TR −0.024 −0.441 0.016 0.293 0.044 0.818Age −0.002 −1.159 −0.001 −0.658 −0.002 −1.081
R2 .197 .235 .214 R adj
2 .169 .205 .187
F 7.044 7.829 7.833
P <.001*** <.001*** <.001***
Note. Displayed are the unstandardized coefficients.*p < .1. **p < .05. ***p < .01.

Wicker et al. 21
available for expenditures. In other words, subsidies, at least as they relate to nonprofit sports clubs, seem to be procyclical—that is, they parallel the direction of the eco-nomic change—rather than being any type of countercyclical fiscal policy tool (in a Keynesian sense) of governments. In contrast, revenues from donations and commer-cial activities have a slight countercyclical element, hence their negative sign in the results.
Conclusion
This paper examined the revenue volatility of German sports clubs, and distinguished between systematic and club-specific volatility. The findings have implications for sports clubs, sports confederations, and policy makers. While past research has seen revenue diversification as a means to reduce revenue volatility (Carroll & Stater, 2008), our results suggest that sports clubs should not focus solely on revenue diversi-fication—Diversification alone will not eliminate total volatility, as the benefits of revenue diversification are much higher for club-specific volatility than for systematic volatility. Another, related finding is that sports clubs should focus on stable and inter-nal revenue sources, such as membership fees, if they want to decrease their revenue volatility.
The role of subsidies is ambivalent. On one hand, subsidies are a driver of volatility, club-specific and systematic. However, to the extent that most clubs will always want to increase their absolute revenue flow, it may be still be rational for clubs to rely on subsidies, which increase total revenues and help clubs provide and maintain services, and, in the extreme, perhaps even survive. Thus, the findings should not be interpreted as suggesting clubs not to seek subsidies. Instead, the primary caution is that such subsides also have a downside, in that they significantly increase volatility, which may, in itself, present additional problems for clubs. However, on the other hand, if policy makers and sports confederations were to provide subsidies on a more consis-tent and predictable basis, clubs could benefit greatly from the additional revenues, and potentially better secure their future financial health.
This study has some limitations that represent avenues for future research. One limitation is that only 3 years of longitudinal data are used, so, by necessity, standard
Table 7. Correlations of Aggregated Revenues With German GDP.
Revenues from . . . GDP
Membership fees .052Subsidies .577Donations −.379Club activities .985Commercial activities −.088Sponsorship .699
Note. GDP = gross domestic product.

22 Nonprofit and Voluntary Sector Quarterly 44(1)
deviations must be calculated with this relatively short sequence. A second limitation is that the data set does not cover the most recent worldwide fiscal crisis. Although Germany seems to be less affected than other Western European countries, it is sug-gested that some clubs with specific revenue portfolios (i.e., high proportion of reve-nues from subsidies and low level of revenue diversification) experience greater volatility and financial problems. Another limitation relates to the broader applicabil-ity of findings. The findings should be generalizable to sports clubs in Western Europe due to similarities in the financial structure (Vos et al., 2013). However, the economy of various Western European countries was affected differently by the recent financial crisis which might have different consequences for the revenue volatility of sports clubs. Given the different income portfolios of sports clubs and other nonprofits in other countries such as Canada (Gumulka et al., 2005), generalizations should only be made with caution. Future research should use samples covering more years that also allow estimating the effects of the recent financial crisis.
Acknowledgments
The authors would like to thank the German Olympic Sports Confederation (DOSB), the Federal Institute of Sports Sciences (BISp), and the federal state sports confederations (LSBs) for sup-porting the Sports Development Report.
Declaration of Conflicting Interests
The author(s) declared no potential conflicts of interest with respect to the research, authorship, and/or publication of this article.
Funding
The author(s) received no financial support for the research, authorship, and/or publication of this article.
References
Allison, M. (2001). Sports clubs in Scotland. Edinburgh, UK: SportScotland.Benkraiem, R., Le Roy, F., & Louhichi, W. (2011). Sporting performances and the volatility of
listed English football clubs. International Journal of Sport Finance, 6, 283-297.Breuer, C., & Wicker, P. (2011). Sports Development Report 2009/2010-Analysis of the sports
clubs’ situation in Germany (Abbreviated Version). Cologne, Germany: Sportverlag Strauß.Carroll, D. A., & Stater, K. J. (2008). Revenue diversification in non-profit organizations: Does
it lead to financial stability? Journal of Public Administration Research, 19, 947-966.Chang, C. F., & Tuckman, H. P. (1996). Revenue diversification among non-profits. Voluntas,
5, 273-290.Chang, J., & Hung, M. (2000). An international asset pricing model with time-varying hedging
risk. Review of Quantitative Finance and Accounting, 15, 235-257.Cordery, C. J., Sim, D., & Baskerville, R. F. (2013). Three models, one goal: Assessing finan-
cial vulnerability in New Zealand amateur sports clubs. Sport Management Review, 16, 186-199.
Damodaran, A. (1997). Corporate finance. New York, NY: John Wiley.

Wicker et al. 23
Deutscher Olympischer Sportbund. (2011). Bestandserhebung 2011. Retrieved from http://www.dosb.de/fileadmin/sharepoint/Materialien%20%7B82A97D74-2687-4A29-9C16-4232BAC7DC73%7D/Bestandserhebung_2011.pdf
Dietl, H., & Franck, E. (2007). Governance failure and financial crisis in German football. Journal of Sports Economics, 8, 662-669.
Enjolras, B. (2002). The commercialization of voluntary sport organizations in Norway. Nonprofit and Voluntary Sector Quarterly, 31, 352-376.
Fischer, R. L., Wilsker, A., & Young, D. R. (2011). Exploring the revenue mix of non-profit organizations: Does it relate to publicness? Nonprofit and Voluntary Sector Quarterly, 40, 662-681.
Greenlee, J., & Trussel, J. (2000). Estimating the financial vulnerability of charitable organiza-tions. Nonprofit Management and Leadership, 11, 199-210.
Gronbjerg, K. A. (1991). How nonprofit human service organizations manage their funding sources: Key findings and policy implications. Nonprofit Management and Leadership, 2, 159-175.
Gumulka, G., Barr, C., Lasby, D., & Brownlee, B. (2005). Understanding the capacity of sports and recreation organizations. Toronto, Ontario: Imagine Canada.
Guo, B. (2006). Charity for profit? Exploring factors associated with the commercialization of human service nonprofits. Nonprofit and Voluntary Sector Quarterly, 35, 123-138.
Hodge, M. M., & Piccolo, R. F. (2005). Funding source, board involvement techniques, and financial vulnerability in nonprofit organizations. Nonprofit Management and Leadership, 16, 171-190.
Kearns, K. (2007). Income portfolios. In D. R. Young (Ed.), Financing nonprofits (pp. 291-314). Lanham, MD: AltaMira Press.
Kingma, B. R. (1993). Portfolio theory and nonprofit financial stability. Nonprofit and Voluntary Sector Quarterly, 22, 105-119.
Krauss, N. A., & Walter, I. (2009). Can microfinance reduce portfolio volatility? Economic Development and Cultural Change, 58, 85-110.
Lamprecht, M., Fischer, A., & Stamm, H.-P. (2011). Sportvereine in der Schweiz [Sports clubs in Switzerland]. Magglingen, Switzerland: Bundesamt für Sport BASPO.
Lindqvist, K. (2012). Museum finances: Challenges beyond economic crises. Museum Management and Curatorship, 27, 1-15.
Markowitz, H. M. (1952). Portfolio selection. Journal of Finance, 7, 77-91.Ross, S., Westerfield, R., & Jaffe, J. (2008). Corporate finance. New York, NY: McGraw-Hill
Irwin.Stockhammer, E., Hochreiter, H., Obermayr, B., & Steiner, K. (1997). The index of sustainable eco-
nomic welfare (ISEW) as an alternative to GDP in measuring economic welfare. The results of the Austrian (revised) ISEW calculation 1955-1992. Ecological Economics, 21, 19-34.
Taylor, P., Barrett, D., & Nichols, G. (2009). Survey of sports clubs 2009. London, England: CCPR.
Tinkelman, D., & Neely, D. G. (2011). Some econometric issues in studying nonprofit revenue interactions using NCSS data. Nonprofit and Voluntary Sector Quarterly, 40, 751-761.
Tuckman, H. P., & Chang, C. F. (1991). A methodology for measuring the financial vulner-ability of charitable non-profit organizations. Nonprofit and Voluntary Sector Quarterly, 20, 445-460.
Vos, S., Breesch, D., Késenne, S., Van Hoecke, J., Vanreusel, B., & Scheerder, J. (2011). Governmental subsidies and coercive isomorphism. Evidence from sports clubs and their resource dependencies. European Journal for Sport and Society, 8, 257-280.

24 Nonprofit and Voluntary Sector Quarterly 44(1)
Vos, S., Wicker, P., Breuer, C., & Scheerder, J. (2013). Sports policy systems in regulated Rhineland welfare states: Similarities and differences in financial structures of sports clubs? International Journal of Sport Policy and Politics, 5, 55-71.
Wicker, P., & Breuer, C. (2013). Understanding the importance of organizational resources to explain organizational problems: Evidence from non-profit sport clubs in Germany. Voluntas, 24, 461-484.
Wicker, P., Breuer, C., & Hennigs, B. (2012). Understanding the interactions among revenue categories using elasticity measures: Evidence from a longitudinal sample of non-profit sport clubs in Germany. Sport Management Review, 15, 318-329.
Young, D. R. (2007). Why study nonprofit finance? In D. R. Young (Ed.), Financing nonprofits (pp. 3-20). Lanham, MD: AltaMira Press.
Author Biographies
Pamela Wicker is a senior lecturer at the German Sport University Cologne, Germany. Her primary research interests are in the areas of development of nonprofit sports clubs, financing sport, and economics of sport consumer behavior.
Neil Longley is a full professor in the Isenberg School of Management at the University of Massachusetts Amherst. His primary research interests are in the areas of sport economics and sport finance.
Christoph Breuer is a full professor at the German Sport University Cologne, where he holds the Chair of Sport Management. His main research interests are development of nonprofit sports clubs, sport development planning, and measuring the effectiveness of sponsorships.