South East and East of England Regional Air Services Study ...
529
South East and East of England Regional Air Services Study Stage Two: Appraisal Findings Report April 2002
-
Upload
khangminh22 -
Category
Documents
-
view
0 -
download
0
Transcript of South East and East of England Regional Air Services Study ...

South East and East of England Regional Air Services Study Stage Two: Appraisal Findings Report April 2002

Halcrow Group Ltd Vineyard House 44 Brook Green London W6 7BY Tel +44 (0)207 602 7282 Fax +44 (0)207 603 0095 www.halcrow.com Halcrow has prepared this report in accordance with the instructions of their client, for their sole and specific use. Any other persons who use any information contained herein do so at their own risk. © Halcrow Group Limited 2001
South East and East of England Regional Air Services Study Stage Two: Appraisal Findings Report April 2002

Department for Transport, Local Government and the RegionsEland HouseBressenden PlaceLondon SW1E 5DUTelephone 020 7944 3000Web site www.dtlr.gov.uk
The Queen�s Printer and Controller of Her Majesty�s Stationery Office, 2002
Copyright in the typographical arrangement rests with the Queen�s Printer and Controller of Her Majesty�s Stationery Office.
This publication, excluding logos, may be reproduced free of charge in any format or medium for research, private study or for internal circulation within an organisation. This is subject to it being reproduced accurately and not used in a misleading context. The material must be acknowledged as copyright of the Queen�s Printer and Controller of Her Majesty�s Stationery Office and the title and authorship of the publication specified.
For any other use of this material, please write to HMSO, The Copyright Unit, St Clements House, 2-16 Colegate, Norwich NR3 1BQ Fax: 01603 723000 or e-mail: [email protected] , or visit www.clickanduse.hmso.gov.uk.
Further copies of this publication are available from:
Department for Transport, Local Government and the RegionsPublications Sales CentreCambertown HouseGoldthorpe Industrial EstateGoldthorpeRotherham S63 9BLTel: 01709 891318Fax: 01709 881673
or online via the Department�s web site.
ISBN 1 85112 530 2
Set of 2 documents1) SERAS � Stage Two: Appraisal Findings Report 2) SERAS � Stage Three Report
Printed in Great Britain on material containing a minimum of 75% post-consumer waste and 25% ECF pulp.
April 2002

SERAS Stage One: Appraisal Findings Report
Contents Amendment Record This report has been issued and amended as follows:
Issue Revision Description Date Signed
J 0 SERAS Stage Two
Appraisal Findings Report
2/11/01
J 1 SERAS Stage Two
Appraisal Findings Report
16/11/01
J 2 SERAS Stage Two
Appraisal Findings Report
23/11/01
J 3 SERAS Stage Two
Appraisal Findings Report
31/01/02
J 4 SERAS Stage Two
Appraisal Findings Report
24/05/02
FL1124000.RCE.RP.J03.020131 Appraisal Findings
SERAS Stage Two: Appraisal Findings Report
iFL1124000.RCE.RP.J03.020131 Appraisal Findings
SERAS - Stage Two: Appraisal Findings Report
Contents
1 Introduction 21.1 Introduction to SERAS 21.2 Introduction to the Report 3
2 Background to SERAS 52.1 Introduction 52.2 Policy Background 52.3 RUCATSE 62.4 Delay Standards 122.5 Comparison with Continental Airports 132.6 September 11th 2001 14
3 SERAS 153.1 SERAS Terms of Reference 153.2 Management of SERAS 173.3 Structure of SERAS 203.4 Supporting Studies 223.5 SERAS Documentation 27
4 Stage One of SERAS 284.1 Introduction to Stage One Options 284.2 Heathrow Options 294.3 Gatwick Options 374.4 Stansted Options 444.5 Luton Options 494.6 Cliffe Marshes Options 524.7 Other Options 564.8 Small Sites 61
5 Stage Two: Options and Packages 695.1 Options at Each Airport 695.2 Packages of Airport Options 725.3 Other Airports 73
SERAS Stage Two: Appraisal Findings Report
iiFL1124000.RCE.RP.J03.020131 Appraisal Findings
6 Stage Two: Appraisal Process 816.1 Introduction 816.2 Appraisal of Options and Packages 826.3 Capital Costs 836.4 Demand Forecasts 866.5 Safety Risk 946.6 Surface Access 956.7 Environment: Land Take 976.8 Environment: Water 1086.9 Environment: Noise Impacts 1096.10 Environment: Local Air Quality Impacts 1146.11 Employment 1176.12 Land Use & Urbanisation 1186.13 Social Impact 1216.14 Regional Impacts 1226.15 Integration Impacts 1236.16 Financial 1246.17 Economic Appraisal 1266.18 Air Freight 132
6.19 CO2 134
7 Appraisal of Options at Main Sites: Heathrow 1377.1 Options Appraised in Stage Two 1377.2 Capital Costs 1397.3 Demand Forecasts 1437.4 Safety Risk 1527.5 Surface Access 1557.6 Environment: Land Take 1717.7 Environment: Water 1787.8 Environment: Noise Impacts 1817.9 Environment: Local Air Quality Impacts 1937.10 Employment 1977.11 Land Use/Urbanisation 1997.12 Integration Impacts 204
8 Appraisal of Options at Main Sites: Gatwick 2088.1 Options Appraised in Stage Two 2088.2 Capital Costs 2098.3 Demand Forecasts 2128.4 Safety Risk 2198.5 Surface Access 2218.6 Environment: Land Take 234
SERAS Stage Two: Appraisal Findings Report
iiiFL1124000.RCE.RP.J03.020131 Appraisal Findings
8.7 Environment: Water 2418.8 Environment: Noise Impacts 2438.9 Environment: Local Air Quality Impacts 2528.10 Employment 2568.11 Land Use/Urbanisation 2578.12 Integration Impacts 261
9 Appraisal of Options at Main Sites: Stansted 2649.1 Options Appraised in Stage Two 2649.2 Capital Costs 2659.3 Demand Forecasts 2699.4 Safety Risk 2779.5 Surface Access 2799.6 Environment: Land Take 2929.7 Environment: Water 3009.8 Environment: Noise Impacts 3019.9 Environment: Local Air Quality Impacts 3139.10 Employment 3169.11 Land Use/Urbanisation 3179.12 Integration Impacts 320
10 Appraisal of Options at Main Sites: Luton 32410.1 Options Appraised in Stage Two 32410.2 Capital Costs 32510.3 Demand Forecasts 32910.4 Safety Risk 33210.5 Surface Access 33410.6 Environment: Land Take 34410.7 Environment: Water 35010.8 Environment: Noise Impacts 35310.9 Environment: Local Air Quality Impacts 35910.10 Employment 36010.11 Land Use/Urbanisation 36210.12 Integration Impacts 364
11 Appraisal of Options at Main Sites: Cliffe 36711.1 Options Appraised in Stage Two 36711.2 Capital Costs 36811.3 Demand Forecasts 37311.4 Safety Risk 37811.5 Surface Access 38011.6 Environment: Land Take 39211.7 Environment: Water 406

SERAS Stage Two: Appraisal Findings Report
ivFL1124000.RCE.RP.J03.020131 Appraisal Findings
11.8 Environment: Noise Impacts 41011.9 Environment: Local Air5 Quality Impacts 41511.10 Employment 41811.11 Land Use/Urbanisation 41911.12 Integration Impacts 42311.13 Attracting Airlines to a New Site 426
12 Appraisal of Options at Main Sites: Alconbury 43112.1 Options Appraised in Stage Two 43112.2 Capital Costs 43212.3 Demand Forecasts 43412.4 Safety Risk 43612.5 Surface Access 43612.6 Environment: Land Take 43812.7 Environment: Water Resources 43812.8 Environment: Noise Impacts 43812.9 Environment: Local Air Quality Impacts 44012.10 Employment, Land Use and Urbanisation and Integration 441
13 Small Sites Summary 44313.1 Introduction 44313.2 Development Potential 44313.3 Likely Demand 44413.4 Air Freight 44913.5 Impacts and Constraints 44913.6 Airspace 450
14 Appraisal of Packages 45814.1 Introduction 45814.2 Core Package Demand Forecasts 46014.3 Economic Appraisal of Core Packages 47214.4 Financial Appraisal of Core Packages 47814.5 Wider Economic Impacts 48114.6 CO2 Impacts 48614.7 Runway Size Sensitivity Tests 48714.8 Opening Year Sensitivity Tests 49114.9 Additional Runway Sensitivity Tests 49514.10 Seeding Sensitivity Tests 49714.11 Environmental Policy Sensitivity Tests 498
15 Air Freight 52715.1 Introduction 52715.2 Heathrow 529
SERAS Stage Two: Appraisal Findings Report
vFL1124000.RCE.RP.J03.020131 Appraisal Findings
15.3 Gatwick 53015.4 Stansted 53215.5 Luton 53415.6 Cliffe Marshes 53515.7 Alconbury 53515.8 Interpretation of Forecasts 536
16 Airspace 54116.1 Airspace Modelling in SERAS 54116.2 Principal Findings 544
Figures in this VolumeChapter 4: Figures 4.1 � 4.7 68Chapter 11: Figure 11.1 430Chapter 14: Figures 14.1 � 14.13 502
Figures in Other VolumesChapter 7: Heathrow AirportChapter 8: Gatwick AirportChapter 9: Stansted AirportChapter 10: Luton AirportChapter 11: Cliffe Marshes AirportChapter 12: Alconbury Airport
Appraisal Summary Tables

SERAS Stage Two: Appraisal Findings Report
2FL1124000.RCE.RP.J03.020131 Appraisal Findings
1 Introduction
1.1 Introduction to SERAS
1.1.1 SERAS is the South East and East of England Regional Air Services Study, commissioned by
Government. It complements equivalent studies into airports and air services in the other UK
regions, which are being co-ordinated in RASCO, the Regional Air Services Co-ordination
Study. SERAS and RASCO provide an appraisal of the physical dimension of future airports
policy. Government’s consideration of future policy relating to airports and air services was set
out in the consultation document The Future of Aviation. The Future of Aviation and the
SERAS and RASCO Study Reports, and the results of consultation on their findings, will
provide major inputs into the development of a forthcoming Air Transport White Paper.
1.1.2 A future Air Transport White Paper was first referred to in The Government’s White Paper on
the Future of Transport ‘A New Deal for Transport: Better for Everyone’, July 1998. This stated:
As recommended by the Transport Select Committee in May 1996, we will prepare a UKairports policy looking some 30 years ahead. This will develop the application to UK airports
of the policies set out in this White Paper – of sustainable development, integration with surface transport and contribution to regional growth.
1.1.3 SERAS had the following objectives:
• To develop a better understanding of the demand for, and constraints on, airports
and air service development in the South East and East of England, consider how
these might be addressed, and evaluate how any future proposals might impact
on the aviation strategies being developed for other parts of the UK.
• To examine options for the sustainable development of airports and air services
in the area over the next 30 years as a key input to the preparation of a new
national airports policy statement.
• To ensure that full consideration is given in the development of airports and air
service provision to the environmental, economic, employment, housing and
transport implications, in the light of regional economic and spatial planning
objectives for London, the South East and the East of England; and to inform
future reviews of Regional Planning Guidance and the Regional Development
Agencies’ regional strategies for the three regions.

SERAS Stage Two: Appraisal Findings Report
3FL1124000.RCE.RP.J03.020131 Appraisal Findings
1.1.4 From its outset, for a number of reasons, SERAS was seen to be larger and more complex than
comparable studies in the other regions: the size of the region, the scale of the demand it
generates, the diversity and status of the airports it contains, and the range of air services which
are available. Also, given the capacity constraints which already exist at some of the region’s
airports, SERAS had to look in greater detail at options for runway and terminal capacity
enhancement, together with options for new airports and for no further development and the
management of demand. The scale and complexity of SERAS required the study to be taken
forward as a series of work streams, described in Chapter 3, and brought together in a
comprehensive appraisal of a wide range of options.
1.1.5 SERAS also had to take advantage, where appropriate, of past work, eg RUCATSE, and had to
co-ordinate its work with the on-going Multi-Modal studies and with emerging regional and local
strategies. SERAS had to consider options against a range of capacity scenarios, including:
• No development beyond that already envisaged in the land-use planning system.
• Development of terminal capacity to make full use of existing runway capacity.
• Development of additional runway and terminal capacity.
1.2 Introduction to the Report
1.2.1 There have been two main appraisal stages in SERAS. In Stage One a number of
development options at different airport sites in the South East and East of England were
appraised. On the basis of this appraisal, Ministers identified a number of options to be taken
forward for further appraisal in Stage Two. In Stage Two selected options have been combined
into packages, which combine different development options at a number of airports. This
report presents the main findings of this Stage Two appraisal.
1.2.2 This report, together with the Stage Two Methodology Report and their annexes, comprises the
principal SERAS Stage Two Report. It is structured as follows.
1.2.3 Chapters 2 to 4 set the background to Stage Two of SERAS. Chapter 2 introduces relevant
parts of the most recent plans for airport development in the South East and East and describes
the current situation at South East airports. Chapter 3 introduces the other investigations and
analyses that have been made in support of SERAS. Chapter 4 introduces Stage One of
SERAS: the basis on which it was undertaken, the options appraised at existing and new main
sites and at smaller sites, and the selection of options for further appraisal in Stage Two.
1.2.4 Chapters 5 and 6 introduce Stage Two of SERAS. Chapter 5 describes the main options and
packages appraised in Stage Two of SERAS. It also describes how smaller airport sites have
been treated in Stage Two of SERAS. Chapter 6 introduces the appraisal methodology applied
SERAS Stage Two: Appraisal Findings Report
4FL1124000.RCE.RP.J03.020131 Appraisal Findings
in Stage Two of SERAS. (This is described more fully in the Stage Two Methodology Report
and its Annexes.) It describes the appraisal of Representative Cases of options and the
appraisal of packages, and sets out the principal techniques and assumptions underlying the
appraisal process.
1.2.5 Chapters 7 to 11 describe the appraisal of options at the principal airport sites in Stage Two,
one chapter each for Heathrow (chapter 7), Gatwick (chapter 8), Stansted (chapter 9), Luton
(chapter 10) and the proposed new site at Cliffe Marshes (chapter 11). These chapters are
essentially structured in the same way, describing the options appraised at each airport, their
safety risks, their forecast usage, surface access implications, environmental impacts,
employment impacts, land use and urbanisation impacts, and their impacts in relation to
integration. Appraisal Summary Tables (ASTs), summarising the principal impacts of options at
each airport, are presented in a supplementary volume.
1.2.6 Chapter 12 summarises the less detailed appraisal undertaken of a potential airport at
Alconbury and Chapter 13 summarises the appraisal of the potential contribution that other
small airport sites in the East and South East of England might make to commercial aviation
activity.
1.2.7 Chapter 14 describes the appraisal of the agreed packages of options, supplementing the ASTs
presented in preceding chapters with those impacts that can only be addressed on a package-
wide basis, notably economic and financial impacts. In this chapter, packages are grouped into
three categories according to the scale of development and the timescales by which they might
be in place: those that do not involve new runways and are regarded as all that are likely to be
in place by, say, 2010; those that essentially include one new runway and could be in place
soon after 2010 – these are appraised in 2015; and larger packages with two or more new
runways which are unlikely to be completed before the second half of the appraisal period to
2030. These are appraised in 2030.
1.2.8 Chapter 15 summarises the appraisal of the implications for accommodating air freight with
different packages and chapter 16 describes the appraisal of the implications for the airspace
system of the forecast movements to 2030 with different packages.

SERAS Stage Two: Appraisal Findings Report
5FL1124000.RCE.RP.J03.020131 Appraisal Findings
2 Background to SERAS
2.1 Introduction
2.1.1 Principal elements of the background to the SERAS study are set out in this chapter: the policy
background; the current usage of airports in the South East and East of England and major
airports on the near continent; forecast growth in demand; and past studies of airport
development in the South East. (Note: in this document, the phrase ‘South East’ may be used
to denote London, the South East and East of England Regions collectively.
2.2 Policy Background
2.2.1 The 1998 Transport White Paper ‘A New Deal for Transport: Better for Everyone’ is the most
recent expression of Government policy in relation to transport generally and to airports and air
travel. The principal statements of relevance to SERAS were:
• A UK airports policy to be prepared based on sustainable development,
integration with surface transport and ind contribution to regional growth.
• The strategy for sustainable development means aviation should meet the
external costs, including environmental costs, that it imposes.
• The new airports policy will take account of the demand for airport capacity for
scheduled, charter, business and freight aviation and the related environmental,
development, social and economic factors.
• The airports policy will be taken forward in conjunction with airspace capacity
issuess and with consideration of surface access provision, particularly better
public transport access.
• The new policy will reflect the different roles and competitive strengths of the
nation’s airports, recognising that each airport cannot be viewed in isolation from
other airports.
• Taking account of the emerging findings of studies of regional airports, the growth
of regional airports to meet local demand for air travel would be encouraged
where consistent with sustainable development principles.

SERAS Stage Two: Appraisal Findings Report
6FL1124000.RCE.RP.J03.020131 Appraisal Findings
2.2.2 Prior to the 1998 White Paper, the most recent major statement of the Government’s airportspolicy was contained in the 1985 White Paper ‘Airports Policy’. The principal conclusions of
that Paper in relation to South East airports were:
• Heathrow: The Government turned down the application for development of a
fifth terminal at Heathrow. This would need planning permission.
• Gatwick: The Government reaffirmed its policy that a second runway should not
be constructed at Gatwick, because of its environmental consequences and
because, on air traffic control and other grounds, it was not certain that a second
runway could be fully utilised.
• Stansted: The Government granted permission to develop Stansted up to a
capacity of 15 million passengers per annum (mppa), with development of the
airport controlled by means of a progressively increasing limit on air transport
movements (ATMs). Increases in the limit would require the consent of
Parliament, so as to give an assurance to the local population that an appropriate
balance would be struck between aviation and local interests in the use of the
airport.
• Luton: It was thought that airspace interactions with Stansted would limit
movements at Luton, so the strategy for Luton envisaged that traffic would grow
only to about 5 mppa with the development of any necessary facilities subject to
normal planning procedures.
2.2.3 The 1985 White Paper set out a policy of encouraging the maximum use of airports outside the
London system, to meet the demand arising in the regions.
2.2.4 It was envisaged that the decision relating to expansion at Stansted, together with already
approved plans for developing Gatwick (Gatwick North Terminal opened in 1988) and Heathrow
(Terminal Four opened in 1986), would lead to the provision of enough capacity within the
London airports system to the mid 1990s, and the necessary flexibility to enable decisions to be
taken at the appropriate time for any development needed thereafter.
2.3 RUCATSE
2.3.1 The last major long-term airport planning exercise for the South East was RUCATSE (Runway
Capacity to Serve the South East), carried out by a Working Group led by the Department of
Transport. RUCATSE started in 1990 when the CAA advised that another runway’s worth of
capacity would be needed to serve South East demand by around 2005. RUCATSE looked for
SERAS Stage Two: Appraisal Findings Report
7FL1124000.RCE.RP.J03.020131 Appraisal Findings
a full runway’s worth of capacity. It did not seek to optimize a trade-off between variants offering
less capacity but with reduced environmental impact.
2.3.2 The Terms of Reference for RUCATSE required the CAA’s work to be reviewed from a wider
perspective than the need for capacity and the air traffic control implications that had previously
been the CAA’s focus. Greenfield sites for a new airport were excluded from consideration.
2.3.3 RUCATSE was not asked to recommend a particular site for development, but was asked to
have regard to the environmental conditions that had led the Government to its earlier views
that second runways should not be built at Gatwick or Stansted.
2.3.4 RUCATSE forecast that even without a new runway, the number of passengers using South
East airports might increase to 170 mppa by 2015. If a new runway was provided at Heathrow
or Gatwick, where demand would build up most quickly, total mppa at South East airports might
be 195 mppa by 2015.
2.3.5 Passenger throughput at airports in the regions and at smaller airports in the South East was
expected to increase from 38 mppa in 1992 to 150 mppa by 2020, in the absence of major
runway expansion in the South East. With a new runway at Heathrow or Gatwick, the demand
at regional and smaller South East airports might be limited to 125 mppa by 2020.
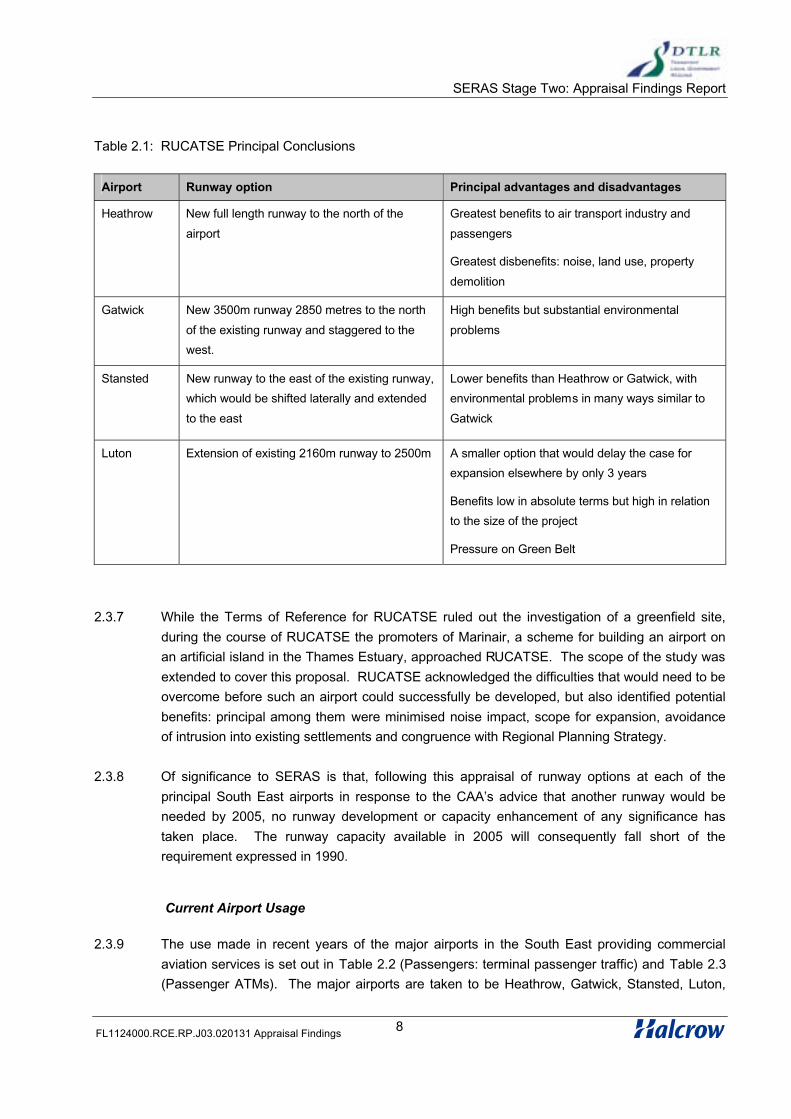
2.3.6 RUCATSE concluded that the capacity of a new runway at Heathrow or Gatwick would be taken
up by passenger demand by 2010 and that the benefits to passengers could provide a case for
a further runway at Heathrow or Gatwick by 2010, or at Stansted by 2015. The principal
impacts of new runways would be as indicated in Table 2.1.
SERAS Stage Two: Appraisal Findings Report
8FL1124000.RCE.RP.J03.020131 Appraisal Findings
Table 2.1: RUCATSE Principal Conclusions
Airport Runway option Principal advantages and disadvantages
Heathrow New full length runway to the north of the
airport
Greatest benefits to air transport industry and
passengers
Greatest disbenefits: noise, land use, property
demolition
Gatwick New 3500m runway 2850 metres to the north
of the existing runway and staggered to the
west.
High benefits but substantial environmental
problems
Stansted New runway to the east of the existing runway,
which would be shifted laterally and extended
to the east
Lower benefits than Heathrow or Gatwick, with
environmental problems in many ways similar to
Gatwick
Luton Extension of existing 2160m runway to 2500m A smaller option that would delay the case for
expansion elsewhere by only 3 years
Benefits low in absolute terms but high in relation
to the size of the project
Pressure on Green Belt
2.3.7 While the Terms of Reference for RUCATSE ruled out the investigation of a greenfield site,
during the course of RUCATSE the promoters of Marinair, a scheme for building an airport on
an artificial island in the Thames Estuary, approached RUCATSE. The scope of the study was
extended to cover this proposal. RUCATSE acknowledged the difficulties that would need to be
overcome before such an airport could successfully be developed, but also identified potential
benefits: principal among them were minimised noise impact, scope for expansion, avoidance
of intrusion into existing settlements and congruence with Regional Planning Strategy.
2.3.8 Of significance to SERAS is that, following this appraisal of runway options at each of the
principal South East airports in response to the CAA’s advice that another runway would be
needed by 2005, no runway development or capacity enhancement of any significance has
taken place. The runway capacity available in 2005 will consequently fall short of the
requirement expressed in 1990.
Current Airport Usage
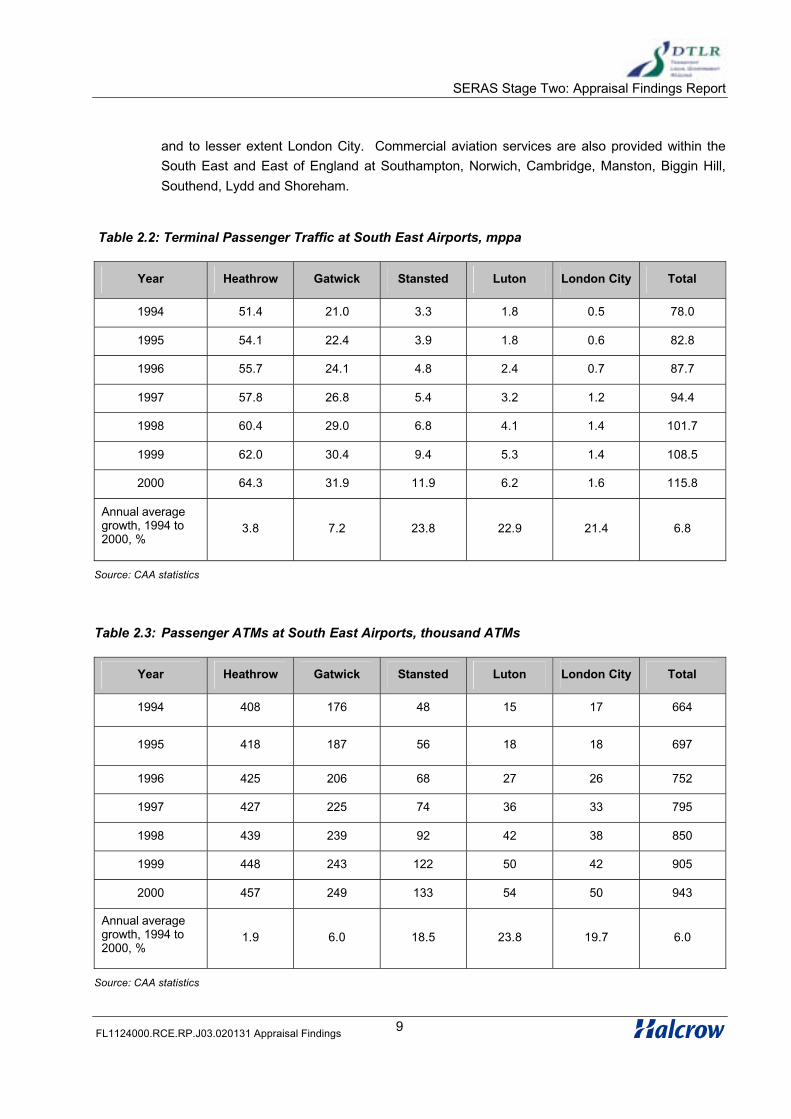
2.3.9 The use made in recent years of the major airports in the South East providing commercial
aviation services is set out in Table 2.2 (Passengers: terminal passenger traffic) and Table 2.3
(Passenger ATMs). The major airports are taken to be Heathrow, Gatwick, Stansted, Luton,
SERAS Stage Two: Appraisal Findings Report
9FL1124000.RCE.RP.J03.020131 Appraisal Findings
and to lesser extent London City. Commercial aviation services are also provided within the
South East and East of England at Southampton, Norwich, Cambridge, Manston, Biggin Hill,
Southend, Lydd and Shoreham.
Table 2.2: Terminal Passenger Traffic at South East Airports, mppa
Year Heathrow Gatwick Stansted Luton London City Total
1994 51.4 21.0 3.3 1.8 0.5 78.0
1995 54.1 22.4 3.9 1.8 0.6 82.8
1996 55.7 24.1 4.8 2.4 0.7 87.7
1997 57.8 26.8 5.4 3.2 1.2 94.4
1998 60.4 29.0 6.8 4.1 1.4 101.7
1999 62.0 30.4 9.4 5.3 1.4 108.5
2000 64.3 31.9 11.9 6.2 1.6 115.8
Annual average growth, 1994 to 2000, %
3.8 7.2 23.8 22.9 21.4 6.8
Source: CAA statistics
Table 2.3: Passenger ATMs at South East Airports, thousand ATMs
Year Heathrow Gatwick Stansted Luton London City Total
1994 408 176 48 15 17 664
1995 418 187 56 18 18 697
1996 425 206 68 27 26 752
1997 427 225 74 36 33 795
1998 439 239 92 42 38 850
1999 448 243 122 50 42 905
2000 457 249 133 54 50 943
Annual average growth, 1994 to 2000, %
1.9 6.0 18.5 23.8 19.7 6.0
Source: CAA statistics
SERAS Stage Two: Appraisal Findings Report
10FL1124000.RCE.RP.J03.020131 Appraisal Findings
2.3.10 In 2000, these five airports accounted for 64% of all passenger movements at UK airports.
Passenger traffic has grown across these airports at an annual average rate of 6.8% over this
period, ATMs at an annual average rate of 6.0%. Growth rates at Heathrow particularly and at
Gatwick, where capacity is heavily constrained, have been relatively low: growth rates at Luton
and Stansted have been very much higher, reflecting the availability of capacity and the rapid
growth of ‘no frills’ or low cost services over this period. The constrained capacity at Heathrow
and Gatwick has led to an increase in the number of passengers per passenger ATM (P/PATM)
over this period, by 12% at Heathrow and 7% at Gatwick.
2.3.11 The runway capacity at both Heathrow and Gatwick is very intensively used. Passenger ATMs
at Heathrow in 2000 accounted for 95% of all of the 480,000 runway slots estimated to be
available, and at Gatwick 96% of the 260,000 slots are used. At both Stansted and Luton, the
passenger ATMs in 2000 accounted for around half of the estimated runway capacity, and at
London City for around 70% of the maximum capacity of the present runway.
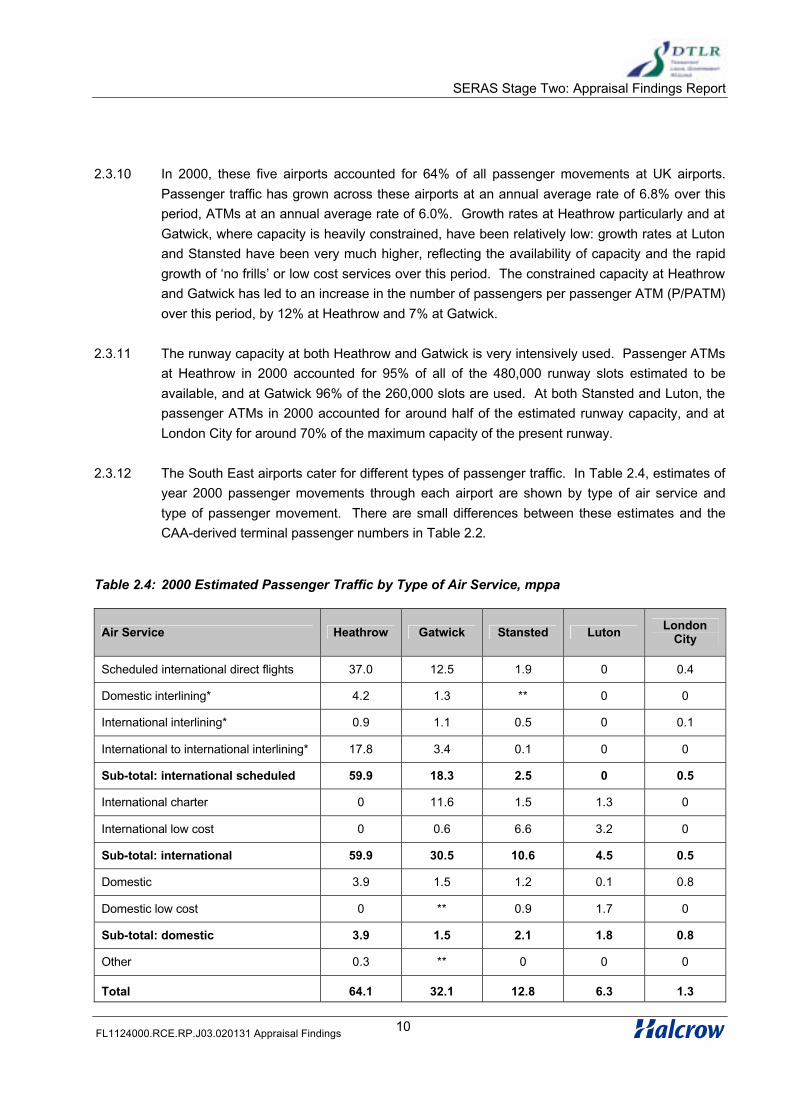
2.3.12 The South East airports cater for different types of passenger traffic. In Table 2.4, estimates of
year 2000 passenger movements through each airport are shown by type of air service and
type of passenger movement. There are small differences between these estimates and the
CAA-derived terminal passenger numbers in Table 2.2.
Table 2.4: 2000 Estimated Passenger Traffic by Type of Air Service, mppa
Air Service Heathrow Gatwick Stansted Luton LondonCity
Scheduled international direct flights 37.0 12.5 1.9 0 0.4
Domestic interlining* 4.2 1.3 ** 0 0
International interlining* 0.9 1.1 0.5 0 0.1
International to international interlining* 17.8 3.4 0.1 0 0
Sub-total: international scheduled 59.9 18.3 2.5 0 0.5
International charter 0 11.6 1.5 1.3 0
International low cost 0 0.6 6.6 3.2 0
Sub-total: international 59.9 30.5 10.6 4.5 0.5
Domestic 3.9 1.5 1.2 0.1 0.8
Domestic low cost 0 ** 0.9 1.7 0
Sub-total: domestic 3.9 1.5 2.1 1.8 0.8
Other 0.3 ** 0 0 0
Total 64.1 32.1 12.8 6.3 1.3

SERAS Stage Two: Appraisal Findings Report
11FL1124000.RCE.RP.J03.020131 Appraisal Findings
Source: CAA Statistics and Consultants’ Estimates
* Domestic interlining refers to a trip between the UK and an overseas destination with interlining at a UK airport. International interlining refers to a trip between the UK and an overseas destination with interlining at an overseasairport International to international (I to I) interlining refers to a trip between two overseas points with interlining taking place at a UK airport.
** means less than 50,000
2.3.13 All of Heathrow’s passenger traffic is on scheduled services, most of it international. There is
no charter or low cost traffic. The wide range of passenger services available generates a large
volume of interlining traffic. Around 28% of Heathrow’s traffic in 2000 consisted of I to I
interliners, passengers whose only reason to be at Heathrow was to change aircraft. Some 8.4
million passenger movements were domestic, within UK, trips. 3.9 million of these were direct
trips, beginning or ending at Heathrow, and 4.5 million were associated with transfers to or from
an overseas flight.
2.3.14 36% of Gatwick’s passenger movements were charter trips and there were a small number of
low cost trips, but most passenger movements were on scheduled services. 11% of trips were I
to I interliners. There were some 3 million domestic trips, half ending at Gatwick and half
connecting to or from an overseas flight.
2.3.15 Low cost passenger movements accounted for around 70% of Stansted’s traffic in 2000 and
charter for approximately 12%. Approximately 83% of Stansted’s traffic is international, with 2.1
million domestic trips.
2.3.16 Luton is even more dominated by low cost traffic, which accounts for 77% of all passenger
movements, with charter accounting for almost all the remainder. Approximately 72% of
Luton’s traffic is international. There are some 1.8 million domestic trips.
2.3.17 London City’s traffic is wholly on scheduled services, with business passengers rather than
leisure passengers being the major part of the airport’s demand. Just under 40% of traffic is
estimated to be international. The airport handled 0.8 million domestic passenger movements
in 2000.
Air Cargo
2.3.18 The five airports handled 79% of the 2.3 million tonnes of air cargo handled at UK airports in
2000. Heathrow handled 1.3 million tonnes, of which 1.2 million tonnes were carried in the
bellyholds of passenger aircraft. Gatwick handled 0.3 million tonnes, again almost all bellyhold.
Stansted handled 0.2 million tonnes, almost all in dedicated cargo aircraft. In 2000, Stansted
was second only to East Midlands among UK airports in terms of the volume of freight carried in
cargo aircraft. In 2000 there were 14,000 cargo ATMs at Stansted, 6,000 at Luton and around
3,000 at each of Heathrow and Gatwick. The growth in the demand for passenger ATMs at the

SERAS Stage Two: Appraisal Findings Report
12FL1124000.RCE.RP.J03.020131 Appraisal Findings
major airports in recent years has led to air cargo movements being displaced from the busier
airports, to Stansted and Luton and further afield.
Current Airport Plans
2.3.19 The principal plans for expansion at South East airports relate to terminal capacity rather than
runway capacity. At Heathrow, as this report was being finalised, a decision in favour of T5 was
taken following the Public Inquiry and the Inspector’s report. It has been assumed in this study
that this will increase the airport’s passenger capacity to 86 mppa.
2.3.20 Gatwick is envisaged within the land-use planning system as a single runway, two terminal
airport with a capacity of 40 mppa. Further planning applications within this framework will be
made following the S106 agreement with the local planning authority in November 2000.
2.3.21 A planning application to increase capacity at Stansted to 25 mppa, from the currently approved
15 mppa, was submitted in August 2001. A parallel review of the passenger ATM limit to
around 210,000 ATMs will be sought, to enable full use to be made of the proposed terminal
capacity.
2.3.22 Ownership of Luton Airport has recently changed hands. The previous owners produced a
Development Brief to take capacity up to 10 mppa. The Bedfordshire Structure Plan states that,
subject to agreement of the Development Brief, a passenger throughput of 10 mppa may be
acceptable.
2.4 Delay Standards
2.4.1 In response to increasing demand for ATM capacity at Heathrow and Gatwick, the number of
slots has been increased at the expense of delay criteria and service standards. The twice-
yearly process by which the number of slots made available at these two airports is determined
has accepted, over time, a relaxation of the delay standard. In order to increase throughput, the
runway-related delay standard has been relaxed from the internationally-accepted standard of 5
minutes average delay per movement (arrival or departure) in all half hours in the operating
day, to 10 minutes. The operation of airports at ATM levels ever closer to maximum runway
capacities increases the variability and unpredictability of delays. The 10 minute average delay
standard is associated with peak delay standards of 20 minutes for arrivals and 25 minutes for
departures.

SERAS Stage Two: Appraisal Findings Report
13FL1124000.RCE.RP.J03.020131 Appraisal Findings
2.5 Comparison with Continental Airports
2.5.1 Table 2.5 provides a 1999 comparison of the principal operational statistics at Heathrow and
Gatwick with the major near-continent airports of Paris Charles de Gaulle, Frankfurt and
Amsterdam. At Heathrow and Gatwick, there were over 220,000 ATMs per runway in 1999,
while the highest number of ATMs at any of the three continental airports was 159,000 per
runway, at Paris CDG. It may also be noted that average passenger loads are substantially
higher at Heathrow and Gatwick than those at any of their continental counterparts.
2.5.2 The three continental airports all have new runways planned or recently operational: a 4th
runway at Paris CDG opened in 2001 and new runways are planned at Frankfurt and
Amsterdam later in the decade.
Table 2.5: Use of Major South East and European Airports
AirportExisting
runwaysPlanned runways
1999 ATMs
‘000
1999 Passengers
mppa
Passengers
per ATM
Heathrow 2 448 62.0 138
Gatwick 1 243 30.4 125
Paris CDG 4 4th runway opened in 2001 476 43.6 92
Frankfurt 3 4th runway to open by 2006 439 45.9 104
Amsterdam 4 5th runway to open by 2003 410 36.8 90
Demand Forecasts
2.5.3 DTLR’s most recent air traffic forecasts were published in May 2000 in “Air Traffic Forecasts for the United Kingdom 2000”. Forecasts were made of terminal passenger numbers at UK airports
to 2020 by type of journey (international, by UK and foreign residents, leisure and business;
domestic; low cost). Low, mid-range and high forecasts were made. The mid-range totals,
extended to 2030, are shown in Table 2.6. The forecasts are of unconstrained demand. They
incorporate a reduction through time in the rate of growth in demand, as the air travel market
matures. Total UK passenger numbers are forecast to increase from around 160 mppa in 1998
to 400 mppa in 2020 and 500 mppa in 2030. Unconstrained demand at the four major South
East airports (Heathrow, Gatwick, Stansted and Luton) is forecast to increase from 117 mppa in
2000 to 301 mppa in 2030.

SERAS Stage Two: Appraisal Findings Report
14FL1124000.RCE.RP.J03.020131 Appraisal Findings
Table 2.6: Forecast Growth in Terminal Passenger Numbers at UK Airports
Terminal passengers mppa % growth from 2000Unconstrained demand for
South East airports mppa
2000 181 - 117
2005 230 27 146
2010 277 53 173
2015 335 85 202
2020 402 122 242
2025 454 151 273
2030 501 177 301
Source: DETR and Consultants’ Estimates
2.6 September 11th 2001
2.6.1 The events of 11 September clearly had an immediate and major impact on air transport
demand, because of the temporary ban on flights to the United States, and reluctance by some
people to travel by air soon after the event. They accelerated many of the trends that were
previously apparent in the air transport industry, such as reduction in capacity, consolidation,
increasing alliances, and the growth of the low cost sector.
2.6.2 BAA’s 3rd Quarter performance was substantially affected by the events but passenger traffic
has slowly recovered. Traffic on North Atlantic routes was dowm by 31% in October 2001
compared with the previous year, but by March 2002 was down by only 5%. At BAA airports in
total, overall demand in October 2001 was 12% below the previous year: in March 2002, the
underlying growth in demand, excluding Easter, was 1% higher than March 2001.
2.6.3 The recovery in passenger numbers at UK airports has been helped by a strong leisure market
and the rapid growth of low cost carriers, which has helped airports such as Stansted. In March
2002, terminal passenger traffic at Stansted grew by 17% over the previous month.
2.6.4 In the long-term, demand is likely to recover previous growth trends, although it is difficult to be
precise on the timing of the recovery. Long-term forecasts already take account of fluctuations
in demand, for example those caused by the usual cycles in the global economy. The forecasts
also assume slower growth than in recent years, and slightly slower growth in the South East
than in other parts of the UK, to reflect the maturing air transport market in the South East.
SERAS Stage Two: Appraisal Findings Report
15FL1124000.RCE.RP.J03.020131 Appraisal Findings
3 SERAS
3.1 SERAS Terms of Reference
3.1.1 SERAS had the following objectives:
• To develop a better understanding of the demand for, and constraints on, airports
and air service development in the South East and East of England, consider how
these might be addressed, and evaluate how any future proposals might impact
on the aviation strategies being developed for other parts of the UK.
• To examine options for the sustainable development of airports and air services
in the area over the next 30 years as a key input to the preparation of a new
national airports policy statement.
• To ensure that full consideration is given in the development of airports and air
service provision to the environmental, economic, employment, housing and
transport implications, in the light of regional economic and spatial planning
objectives for London, the South East and the East of England; and to inform
future reviews of Regional Planning Guidance and the Regional Development
Agencies’ regional strategies for the three regions.
3.1.2 From its outset, for a number of reasons, SERAS was seen to be larger and more complex than
comparable studies in the other regions: the size of the region, the scale of the demand it
generates, the diversity and status of the airports it contains, and the range of air services which
are available. Given the capacity constraints which already exist at some of the region’s
airports, SERAS had to look in greater detail at options for runway and terminal capacity
enhancement, together with options for new airports and for no further development and the
management of demand. The scale and complexity of SERAS required the study to be taken
forward as a series of work streams brought together in a comprehensive appraisal of a wide
range of options. These work streams had to:
• Develop profiles of future demand for scheduled and chartered air services, air
freight and business aviation in the South East and East of England (SE and EE),
under a range of scenarios (including those that both meet and manage demand)
covering a 30 year planning period.

SERAS Stage Two: Appraisal Findings Report
16FL1124000.RCE.RP.J03.020131 Appraisal Findings
• Analyse the role of the SE and EE Airports in meeting demand originating from
within the study area, from elsewhere in the UK and from international
passengers interlining over SE and EE airports.
• Evaluate current and future airspace and air traffic control capacity issues,
airspace integration and possible environmental improvements through design
changes in airspace over the South East and East of England.
• Evaluate current, prospective and potential capacity at existing SE and EE
airports and their ability to meet a range of demand from different market sectors.
• Assess potential fiscal and regulatory tools for ensuring optimum use of existing
runway and terminal capacity serving demand arising at SE and EE airports and
their role in managing demand to reflect environmental capacity constraints.
• Identify the potential for both existing and new sites, within or accessible from the
SE and EE, to provide additional capacity to meet alternative levels of aircraft and
passenger transport movement demand. This requires careful consideration of
the environmental, health, engineering, operational, safety, legal, commercial,
economic, land-use planning and surface access impacts associated with each.
• Develop a South East Airports Appraisal Framework (SEAFF) based on the
approved New Approach to Transport Appraisal (NATA) and sustainability
criteria, to facilitate the evaluation of both demand management and enhanced
capacity options. This requires consultation on the criteria and indicators to be
used, the development of a suite of appraisal tools and the establishment of
clearly defined sifting procedures for use at different stages of the study.
• Derive a range of alternative ‘packages’ of runway, terminal and surface access
options to provide different levels of capacity over and above that which could be
available from existing, or prospective, airport infrastructure.
• Evaluate these ‘packages’ using the agreed appraisal methodology and the
presentation of those results for public consultation, to identify the implications in
economic, environmental, development and social terms of both meeting, and not
meeting, demand.
• Consider what environmental conditions and controls might be a desirable
component of the packages.

SERAS Stage Two: Appraisal Findings Report
17FL1124000.RCE.RP.J03.020131 Appraisal Findings
3.1.3 SERAS was also required to:
• Have regard to emerging land use planning, transport, environmental and
economic strategies, and regional sustainable development frameworks, for
regions within and adjacent to the study area.
• Take advantage, where appropriate, of the work done in RUCATSE.
• Co-ordinate, so far as practicable, its work with concurrent multi modal corridor
studies impacting on the study area.
• Have regard to any relevant Local Authorities’ air quality strategies and air quality
management area action plans.
• Look for opportunities to facilitate public transport links to airports and to take
account of the findings of two studies commissioned by OPRAF and DETR: the
Regions to London Airports Study and the inter-London Airports Rail Study.
• Consider options against a range of capacity scenarios, including:
• No development beyond that already envisaged in the land-use planning system.
• Development of terminal capacity to make full use of existing runway capacity.
• Development of additional runway and terminal capacity.
3.1.4 The Government was committed to an approach to SERAS that was as inclusive as possible,
but which recognised that considerations of blight and commercial sensitivities imposed strict
constraints on the conduct of the study. It was important that location-specific details of the
development options being appraised did not become public. The study team had to ensure
that potential blight was minimised by making maximum use of data already in the public
domain, by taking care in dealing with local authorities and other providers of data, and by
dealing with the press/media in a way that minimised media attention.
3.2 Management of SERAS
3.2.1 The technical work of SERAS was undertaken by a team of consultants reporting on a day by
day basis to Airports Policy Division of DTLR. A Government Steering Group and a Reference
Group met at approximately quarterly intervals during the study.
3.2.2 The Steering Group consisted of representatives of:

SERAS Stage Two: Appraisal Findings Report
18FL1124000.RCE.RP.J03.020131 Appraisal Findings
• DTLR – Department of Transport, Local Government and the Regions
• DEFRA – Department of the Environment, Food and Rural Affairs
• Government Office for the South East
• Government Office for the Eastern Region
• Government Office for London
• Highways Agency
• Strategic Rail Authority
• CAA, Directorate of Airspace Policy
3.2.3 The composition of the Reference Group was wide-ranging, as set out in Table 3.1. The
Reference Group was required to:
• ensure that the SERAS study meets the final approved terms of Reference,
• act as the focus of high level consultation between DTLR and the many
interested parties,
• provide external oversight and validation of the approach adopted by the study
team, and
• provide a source of external advice and expertise on a wide range of issues
relating to the SERAS study.
3.2.4 The Reference Group was restricted in its ability to oversee and validate the study’s approach
in that location-specific information could not be provided to the Group. Terms of Reference
and statements of the methodology to be applied were provided to the Reference Group but no
results of the application of the methodology could be provided.
Table 3.1: Reference Group Composition
Area of Interest Reference Group Members
Airports BAA, London Luton, London City, AoA
Airport Consultative Committees Heathrow Airport Consultative Committee, GATCOM,
Stansted Airport Consultative Committee, Luton Airport
Consultative Committee

SERAS Stage Two: Appraisal Findings Report
19FL1124000.RCE.RP.J03.020131 Appraisal Findings
Area of Interest Reference Group Members
Airlines British Airways, British Air Transport Association, BAR
UK, International Air Carrier Association, IATA
Surface Access Bodies Railtrack, Transport for London, Strategic Rail Authority,
Confederation of Passenger Transport Operators
Consumer Interests Air Transport Users Council, CAA
Local Authority Interests SASIG (LGA Special Interest Group), SERPLAN, LPAC
Business Interests TUC, CBI, SEEDA (South East of England Development
Agency), EEDA (East of England Development Agency),
LCCI, BTA
Environmental Interests FoE, CPRE, National Society for Clean Air and
Environmental Protection, Aviation Environment
Federation
3.2.5 The main part of the consultant team involved in SERAS was as shown in Table 3.2.
Table 3.2: SERAS Consultancy Team
Study Area Consultants
Managing Consultant Halcrow
Airport Optioneering BAA
Arup
Scott Wilson
Gibb
Sir Frederick Snow & Partners
Halcrow
Airspace Planning CAA Directorate of Airspace Policy
NATS
Surface Access Halcrow
Booz Allen
Employment and Labour Market Impacts Halcrow
Londonomics

SERAS Stage Two: Appraisal Findings Report
20FL1124000.RCE.RP.J03.020131 Appraisal Findings
Study Area Consultants
Land Use and Urbanisation Arup Economics & Planning
Regional and Social Impacts Arup Economics & Planning
Environmental Impacts Scott Wilson
CAA Environmental Research and Consultancy
Department (ERCD)
AEA Technology Environment
Halcrow
Economic and Financial Impacts Halcrow
3.3 Structure of SERAS
3.3.1 SERAS has had two main phases of technical work: Stage One which began early in 2000 and
was reported to Ministers in July 2001 and Stage Two, the findings of which constitute the main
part of this report.
3.3.2 Stage One of SERAS is described in full detail in the Stage One reports and its findings are
summarised in Chapter 4 of this report. In Stage One an appraisal of a number of development
options at individual airports in the South East was undertaken, with the aim of identifying
preferred options at each airport to be taken forward to Stage Two. In Stage Two the options
taken forward would be combined into packages of options at one or more sites. In Stage One,
with the modelling tools then available, little account could be taken of any interaction between
airports in the South East airports system. In Stage Two, with enhanced modelling tools
available, notably a new passenger allocation model, the definition and appraisal of packages of
options allowed more consideration of these interactions.
3.3.3 The airports at which a number of options were appraised in Stage One were:
• the existing, main airports of Heathrow, Gatwick, Stansted, Luton, London City
and Southampton,
• a potential new airport at Cliffe Marshes in North Kent, which might be used for a
full range of passenger and freight services, and;
• the use of existing military airfields at Alconbury and Hullavington, predominantly
for air freight and low cost passenger services.

SERAS Stage Two: Appraisal Findings Report
21FL1124000.RCE.RP.J03.020131 Appraisal Findings
3.3.4 The potential new sites for commercial air services of Cliffe Marshes, Alconbury and
Hullavington emerged from the Site Search Study, summarised later in this chapter.
3.3.5 In addition to the appraisal of a number of options at these sites, the potential contribution that
other airfields in the East and South East could make to serving the needs of commercial
aviation was assessed in a Small Sites Study, the findings of which are summarised in Chapter
4. The airfields covered are: Biggin Hill, Cambridge, Farnborough, Lydd, Manston, Norwich,
Shoreham and Southend.
3.3.6 The appraisal of options at the main sites (those listed in para 3.3.3) in Stage One of SERAS
broadly followed the appraisal methodology set out in the published appraisal framework, ‘TheAppraisal Framework for Airports in the South East and Eastern Regions of England’ DETR,
November 2000. In Stage One, some areas of appraisal were necessarily covered only at a
coarser level of detail or were omitted. There were two principal reasons for this: either detailed
modelling and appraisal tools were not available, or the appraisal of options at individual sites
did not allow the effects of interactions between airports, for example in passenger allocation
and the assessment of user benefits, to be assessed.
3.3.7 The principal areas of the Stage One appraisal affected in this way were as follows:
• The absence of a suitable passenger allocation model at Stage One did not allow
forecasts to be made of the likely use of any development option as an addition to
existing capacity, either on its own or in combination with other options. In the
absence of forecasts of usage, the appraisal of options was based on the
additional capacity, in runway movements and terminal space, provided by the
option. The underlying assumption in Stage One was that any option would
represent the only addition to capacity and it would be fully used. In Stage Two a
passenger allocation model (SPASM) has been developed to give forecasts of
the use likely to be made of any option or package of options.
• No detailed noise modelling was undertaken in Stage One but has been in Stage
Two. Potential noise impacts in Stage One were identified by the application of
the Air Space Design Footprint from the November 2000 Appraisal Framework
and judgement based on other known and modelled noise contours. In Stage
Two detailed noise modelling has been undertaken.
• No detailed air quality modelling was undertaken in Stage One. The air quality
assessment in Stage One was a comparative assessment of four aspects of the
air quality impact of each option at an airport leading to a ranking of the options at
each airport in terms of their air quality impact, but not permitting any inter-airport
comparison. In Stage Two detailed emission and dispersion modelling has been
undertaken.
SERAS Stage Two: Appraisal Findings Report
22FL1124000.RCE.RP.J03.020131 Appraisal Findings
• The surface access models available in Stage One were less detailed and less
well validated than those used in Stage Two.
• No airspace modelling was available in Stage One. An understanding of the
future airspace capacity in relation to the extra runway capacity and the additional
movements associated with some of the development options has been obtained
in Stage Two through the initial simulation modelling of selected packages.
• The absence of passenger forecasts and a passenger allocation model in Stage
One did not allow economic or financial impacts to be assessed, but they have
been in Stage Two.
3.3.8 Stage One of SERAS is summarised in the next chapter of this report.
3.4 Supporting Studies
3.4.1 A number of other studies have been undertaken to inform SERAS or to supplement the
technical analysis undertaken in SERAS. Principal among these are the following studies which
are summarised below:
• Site Search Study, Scott Wilson
• New Technology Study, Arthur D Little
3.4.2 In addition, studies were made of a number of the issues associated with the potential new site
at Cliffe Marshes. These are summarised in Chapter 11 which presents the appraisal findings
at Cliffe Marshes. The studies include:
• Airline Development Strategy Study, Booz Allen
• North Kent Marshes Ecological Study, Scott Wilson
• Implications for the Thames Gateway, Arup Economics & Planning
Site Search Study
3.4.3 Prior to the commencement of SERAS, DTLR commissioned a Site Search Study from ScottWilson: Preliminary Site Search of Options for New Airport Capacity to Serve the South East
and East of England, Final Report and Appendices, June 2001. The main objectives of the
study were to identify options for siting new airport capacity to serve London, the East and

SERAS Stage Two: Appraisal Findings Report
23FL1124000.RCE.RP.J03.020131 Appraisal Findings
South Eastern regions, to highlight the most suitable areas for sustaining major development
and to recommend a short list of potential sites.
3.4.4 The study evaluated the full range of potential sites, including greenfield, brownfield and
offshore possibilities, both new and a number that have been examined by previous studies. In
addition, over 400 existing operational and inactive sites, including civil, private and military
airfields were reviewed. An Ordnance Survey-based Geographical Information System was
used to identify and progressively select potential sites against sets of constraint criteria.
3.4.5 The study was carried out in five stages:
• In Stage One, Areas of Opportunity, that is areas of least constraint, were
identified by means of spatial analysis of the whole study region. Constraint
criteria included core issues under the following headings: physical, operational
and safety; catchment and accessibility; the environment; regional planning; and
commercial. Sites were scored against the criteria and the output from Stage
One was a mapping of combined constraints and a ranked list of all existing,
previously proposed and potential new sites.
• Stage Two tested the robustness of the Stage One rankings by weighting
different groups of criteria in turn: construction costs, access, the environment,
socio-economic factors and commercial factors. From the Stage Two analysis,
Areas of Opportunity, with minimum constraint on airport development, were
identified as those in which all weighted analyses produced high opportunity
values.
• Stage Three discarded those Areas of Opportunity too small for siting an airport.
The remainder were grouped into 19 Zones of Opportunity and investigated in
more detail to assess the following: potential demand (including interaction with
the existing major airports); compatibility with Regional Planning Guidance
criteria; possible noise and safety impacts affecting urban areas; and airspace
issues, including interaction with the existing airport system. Eight Zones of
Opportunity were selected for further investigation.
• In Stage Four, new sites with maximum potential and least constraint within or
close to the eight Zones of Opportunity were identified. The analysis at this stage
also extended to offshore areas and existing civil and military airfields in areas
with high rankings from Stage One. Fourteen potential new, two-runway airport
sites, as listed in Table 3.3, and 16 existing airfields (Table 3.4) were identified.

SERAS Stage Two: Appraisal Findings Report
24FL1124000.RCE.RP.J03.020131 Appraisal Findings
Table 3.3: Potential New Airport Sites at Stage Four of the Site Search
Study
Site County
Hamilton Kent
Shadoxhurst Kent
Hook Hampshire
Cliffe Marshes Kent
Sheppey Kent
The Cant Offshore (Thames estuary)
Hayes Knoll Wiltshire
Highworth Wilshire
Rettendon Essex
Thurrock Essex
Epping Essex
Harlow Essex
Bedford Bedfordshire
UK1 South Gloucestershire
Table 3.4: Existing Airfield Sites at Stage Four of the Site Search Study
Airfield County
Abingdon Oxfordshire
Alconbury Cambridgeshire
Boreham Essex
Boscombe Down Wiltshire
Bournemouth Dorset
Cranfield Bedfordshire
Fairford Gloucestershire
Hullavington Wiltshire
Lyneham Wiltshire
North Weald Essex

SERAS Stage Two: Appraisal Findings Report
25FL1124000.RCE.RP.J03.020131 Appraisal Findings
Airfield County
Oakley Buckinghamshire
Odiham Hampshire
Manston Kent
Thurleigh Bedfordshire
Waterbeach Cambridgeshire
Wormingford Essex
• In Stage Five, all existing and new sites from Stage Four were evaluated
against a further, more detailed series of criteria which included: obstacle
limitation surfaces; environmental factors; commercial demand; travel times
and quality of surface access. The highest ranked sites were:
Harlow
Thurrock (South Ockenden)
Cliffe Marshes
UK1 (near Bristol)
Hullavington
Alconbury
Rettendon
Shadoxhurst
Hayes Knoll
3.4.6 The Site Search study concluded that all of these sites had the capability of major airport
development and might be taken forward into SERAS. SERAS was asked to appraise Cliffe
Marshes as a possible new airport capable of providing the full range of passenger services –
scheduled, charter, low cost – and freight services, including its potential for 24 hour operation.
Alconbury and Hullavington were also to be appraised in SERAS as existing airfields capable of
being developed to serve air freight and some passenger services, given the likelihood that air
freight services would continue to be squeezed out of existing South East airports.
New Technology Study
3.4.7 To inform its air transport policy, particularly in relation to the London Terminal Area with its five
airports and busy airspace, DTLR commissioned a study to inform judgements as to the scale
SERAS Stage Two: Appraisal Findings Report
26FL1124000.RCE.RP.J03.020131 Appraisal Findings
and timing of the impact of new aviation technology. The study had two prioncipal objectives.
First, to investigate the likely impact of new technology on the demand for, development and
operation of air services to, from and within the UK, and, secondly, to inform and increase the
Department’s understanding of the contribution these technologies can make to enhancing
airport capacity and mitigating environmental impact.
3.4.8 Arthur D Little (ADL) were appointed to undertake the study, reported in ‘Study into the Potential Impact of Changes in Technology on the Development of Air Transport in the UK, Final Report
to DTLR’, November 2000.
3.4.9 The scope of the study was confined to technologies predicted to enter service by 2030, with
the emphasis on technology developments likely to be introduced in the period from 2005 to
2010. Technologies already deployed, in the UK, USA or in Europe, or in the process of being
deployed were not considered.
3.4.10 In defining the benefits from future capacity enhancement and environmental mitigation
technologies, attention was concentrated on those that address the most significant capacity
and environmental constraints facing the industry. Within the study’s overall scope, broad
commercial realities were addressed and an understanding provided of the implications of
future technology take-up for prospective Government policy. The study processes included a
thorough desktop review and interviews and workshop exercises with key industry
stakeholders.
3.4.11 The study found that in the short-term, incremental improvements in capacity at UK airports are
expected, with new technologies being important but not key to these improvements. In the
medium- to long-term, technological advances will be fundamental to introducing substantial
capacity improvements, especially wake vortex technologies, sophisticated management
systems and datalink technologies. The main capacity constraints are the runway and en route
airspace. While there are a number of promising capacity enhancement strategies, building
additional runway capacity has the greatest potential to add to capacity.
3.4.12 Technology developments to 2030 are predicted to continue to make material improvement to
global and local noise and air quality impacts per passenger. Development of new technologies
for improved aerodynamics, materials, engine efficiencies and combustors can reduce global
emissions, NOx and noise. Future development in CNS (Communications, Navigation and
Surveillance) per ATM and operational procedures such as CDA (Continuous Descent
Approaches) offer global and local mitigation. ADL concluded that future technologies offer fuel
efficiency gains of 2% per year to 2030, while NOx reduction technology was forecast to deliver
80% reduction from current LTO (landing and take off) emissions by 2030.
3.4.13 The take-up of future technologies was thought to be capable of acceleration through the
setting of international standards, European level agreements and by ensuring that the positive
cost advantages of efficiency projects are explicit and transparent to the key stakeholders. This

SERAS Stage Two: Appraisal Findings Report
27FL1124000.RCE.RP.J03.020131 Appraisal Findings
was thought to be particularly important given the emphasis currently placed on maximising
airport throughput, at the expense of increased delay and cost, as opposed to efficiency
improvements, which are likely to benefit airlines much more through reduced costs.
3.4.14 The take-up of technologies that address global emissions was thought to be essentially driven
by financial incentives that ensure operators aim to cut their fuel costs. A combined market-
based approach, encompassing emission trading, environmental charges and voluntary
agreements to incentive schemes, could offer a means of accelerating fuel-efficient
technologies.
3.4.15 Adoption of technologies that aim to mitigate local noise and air quality impacts can be driven
through ambitious standards for NOx and noise, together with incentives that reward best
practice.
3.4.16 A number of implications for Government policy were identified. Capacity and efficiency of
airports and airspace can be improved by Government introducing mechanisms promoting
benchmarking of ATC providers to raise the standard of all to that of the best; investment in
long-term as well as short-term ATC solutions; and the promotion of technologies with both
capacity and environmental benefits.
3.4.17 Global and local environmental effects can be mitigated through Government working with
international bodies to: agree medium- and long-term objectives for the sector; contribute to the
development of market-based approaches to encourage fuel efficiency; press for tighter
international standards on aircraft noise and engine emissions; and introduce noise and
emission-based charges at UK airports as appropriate. Such mechanisms are largely
consistent with Government’s current programmes, but can be further focussed to accelerate
the take-up of technology.
3.4.18 It was concluded that while a reduction in per passenger environmental costs was likely,
unconstrained growth in air travel demand would mean that, in absolute terms, the net effect of
the aviation industry on the environment is likely to increase. The implications of this are either
that growth is managed to what technology will deliver in order to mitigate any deterioration in
environmental impacts, or that it is accepted that aviation is a high value added component of
the UK’s transport system.
3.5 SERAS Documentation
3.5.1 This Stage Two Appraisal Findings Report is supplemented by the Stage Two Methodology
Report and a number of supporting documents.
SERAS Stage Two: Appraisal Findings Report
28FL1124000.RCE.RP.J03.020131 Appraisal Findings
4 Stage One of SERAS
4.1 Introduction to Stage One Options
4.1.1 The principal objective of Stage One of SERAS was to establish the feasible options for the
development of airport capacity in the South East, and to appraise those options in order to
determine which options should be carried forward to Stage Two. The Terms of Reference
issued to the sub-consultants who undertook the optioneering work included a minimum list of
development options to be considered. These lists were provided for guidance and were not to
be taken as constraining the development possibilities to be explored.
4.1.2 Minimum options were specified in a generic way, defining the number and relationship of
runways and other features, without fixing their locations. Options generated were expected to
reflect both alternative physical layouts of facilities and different modes of operation. The initial
list of development options to be considered typically included:
• Full length runways and Short Take-off and Landing (STOL) runways,
• Dependent, close-parallel runways and independent, wide-spaced runways,
• Runways to be operated in segregated mode or in mixed mode, and
• In some cases, the introduction of taxiways or the realignment of runways.
4.1.3 Following the initial review of the options developed, it was decided to extend the work to
include a number of additional options at each of the airports. These were intended either to fill
gaps in the spectrum of option capacities provided by the original options or to reduce impacts
revealed by them, particularly aircraft noise exposure over residential areas and the
displacement of residential properties. Since the options in this second tranche often had an
environmental aim, they are labelled with an ‘E’ prefix.
4.1.4 The options appraised in Stage One and the appraisal findings are fully described in the
SERAS Stage One Reports. In this chapter the appraisal of the Stage One options at
Heathrow, Gatwick, Stansted, Luton and Cliffe Marshes is briefly described. The chapter
concludes with a summary of the options developed at London City, Southampton, Alconbury,
Hullavington and other small airport sites.
SERAS Stage Two: Appraisal Findings Report
29FL1124000.RCE.RP.J03.020131 Appraisal Findings
4.2 Heathrow Options
Initial Options
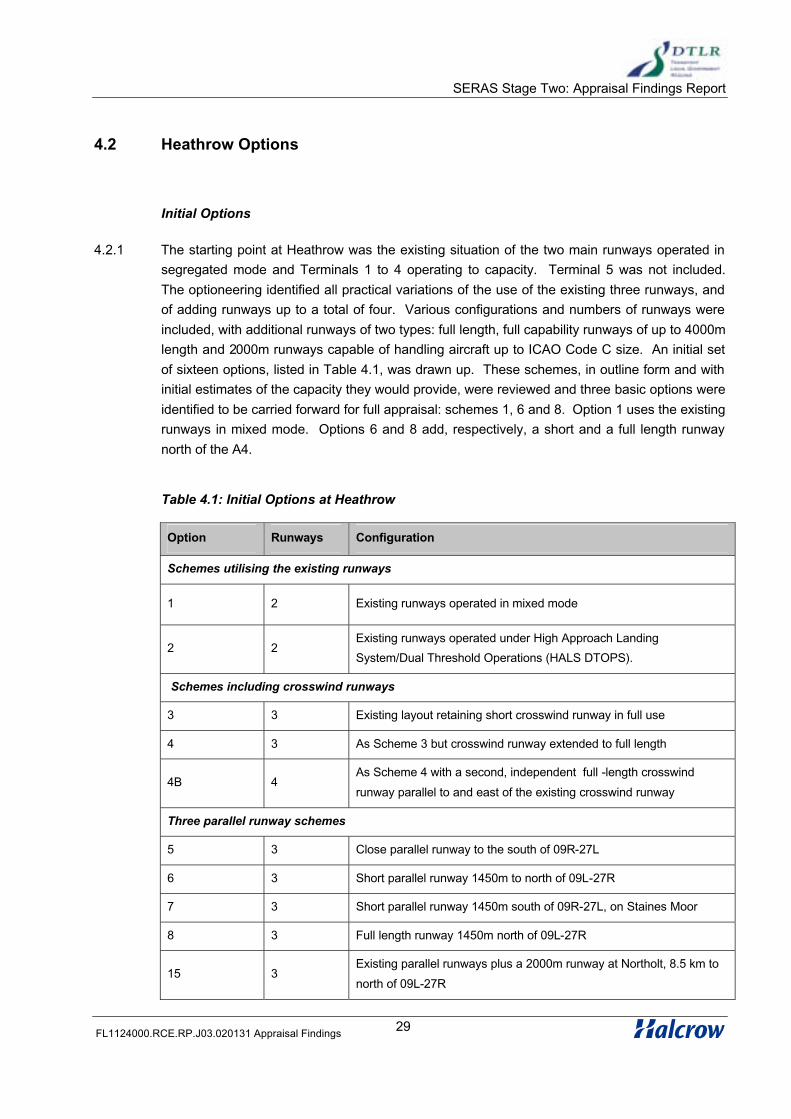
4.2.1 The starting point at Heathrow was the existing situation of the two main runways operated in
segregated mode and Terminals 1 to 4 operating to capacity. Terminal 5 was not included.
The optioneering identified all practical variations of the use of the existing three runways, and
of adding runways up to a total of four. Various configurations and numbers of runways were
included, with additional runways of two types: full length, full capability runways of up to 4000m
length and 2000m runways capable of handling aircraft up to ICAO Code C size. An initial set
of sixteen options, listed in Table 4.1, was drawn up. These schemes, in outline form and with
initial estimates of the capacity they would provide, were reviewed and three basic options were
identified to be carried forward for full appraisal: schemes 1, 6 and 8. Option 1 uses the existing
runways in mixed mode. Options 6 and 8 add, respectively, a short and a full length runway
north of the A4.
Table 4.1: Initial Options at Heathrow
Option Runways Configuration
Schemes utilising the existing runways
1 2 Existing runways operated in mixed mode
2 2Existing runways operated under High Approach Landing
System/Dual Threshold Operations (HALS DTOPS).
Schemes including crosswind runways
3 3 Existing layout retaining short crosswind runway in full use
4 3 As Scheme 3 but crosswind runway extended to full length
4B 4As Scheme 4 with a second, independent full -length crosswind
runway parallel to and east of the existing crosswind runway
Three parallel runway schemes
5 3 Close parallel runway to the south of 09R-27L
6 3 Short parallel runway 1450m to north of 09L-27R
7 3 Short parallel runway 1450m south of 09R-27L, on Staines Moor
8 3 Full length runway 1450m north of 09L-27R
15 3Existing parallel runways plus a 2000m runway at Northolt, 8.5 km to
north of 09L-27R

SERAS Stage Two: Appraisal Findings Report
30FL1124000.RCE.RP.J03.020131 Appraisal Findings
Option Runways Configuration
9 4 Two pairs of close-parallel runways, 385m separation
10 4 Two pairs of close-parallel runways, 760m separation
11 4Two pairs, at 760 and 1035m separation, operated independently;
arrivals on wider pair, departures on narrower pair
12 4 One pair independent 1450m separation, one pair close 385m
13 4Three independent runways, plus one short runway 1450m south of
09R-27L, on Staines Moor
14 4 Four independent runways, two 1450m N and S of 09R-27L
Retained Options
4.2.2 For the retained options 1, 6 and 8, outline layouts of terminal/apron and support areas to fit
these runway configurations were developed, capacities re-estimated and the surface access
infrastructure likely to be necessary to serve them examined in some detail. In the cases of
Options 6 and 8, this work led to three sub-options offering different solutions to terminal
location and airside and landside access. The retained options are described below.
Option 1 (Figure 4.1a)
4.2.3 Option 1 retains the existing parallel runways and assumes their operation in full, permanent
mixed mode, giving an estimated capacity of about 105 mppa. The development of Terminal 5
is assumed, to handle the higher throughput generated by the additional runway movements,
and the Central Terminal Area (CTA) is largely redeveloped to form a core terminal area. (The
assumption that the CTA at Heathrow would be substantially rebuilt during the period to 2030
has been carried forward to all of the options appraised.) In addition to the T5 satellites, the
remainder of the area between the runways is occupied by satellites served from this new
central area. This requires the displacement of some aircraft maintenance and other support
facilities from the east end of the site to a new area developed between the T5 site and the
M25. Terminal 4 is retained. The crosswind runway strip is used as a cross taxiway route, but
its use as a runway could be retained for severe adverse wind conditions and emergencies.
4.2.4 Option 1 would represent a substantial increase in capacity at relatively low cost, and with
modest additional land take. Permanent mixed mode operations would negate the Cranford
Agreement, as there would be no opportunity for noise respite periods and aircraft noise
exposure would grow in line with increased throughput. Option 1 was seen as an obvious first
step in any capacity enhancement scheme for Heathrow.

SERAS Stage Two: Appraisal Findings Report
31FL1124000.RCE.RP.J03.020131 Appraisal Findings
Options 6A, B and C (Figure 4.1b)
4.2.5 In all versions of Option 6, a new runway is located north of 09L-27R, sufficiently separated for
independent operation and with terminal capacity between it and the existing runway. All three
runways can operate in mixed mode. The additional runway is 2000m in length and intended for
use by aircraft of up to Code C size. It could accept one third of total movements, which is likely
to be less than the total proportion of Code C or smaller aircraft in a future Heathrow mix. It
was assumed therefore there would be sufficient movements to keep the new runway fully
utilised. By freeing this proportion of slots on the existing two runways, which can then be used
by larger aircraft, and assuming mixed mode on all three, this option promises a substantial
capacity gain in movement and passenger throughput terms. Crossing movements of the centre
runway would be limited to a very low level by dedicating the new, northern terminal to the
short-haul services using the new runway. The resulting estimated capacity was 132 mppa.
4.2.6 The airport’s noise envelope would be expanded over new areas to the north, but traffic here
would be made up of relatively quiet types, with the potential for steeper approaches and high
manoeuvrability, facilitating early separation of departure routes. The runway and associated
terminal/apron areas would cause property displacement north of the A4. If the current
provision of aircraft maintenance and support facilities were increased in line with the higher
passenger throughput, further land north of the A4 would also be needed to accommodate
these uses.
Options 8A, B and C (Figure 4.1b)
4.2.7 Option 8 is similar in all respects to Option 6, except that the third runway is of full length. It is
similar in principle to the RUCATSE scheme of 1993. The capacity gain over Option 6 is
relatively small, as Option 6 is a good match to the mix of aircraft sizes envisaged.
Improvement in Option 8 is largely due to the increased flexibility of assignment of any traffic to
any runway, smoothing out imbalances between terminal and runway location and minimising
crossings. This scheme could be a further development from Option 6, provided it was planned
from the outset. For the capacity gained, the increased property and noise impacts would be
substantial.
4.2.8 Sub-options A, B and C are alternative arrangements for the location of terminal capacity to
serve the third runway, and are essentially the same in both Options 6 and 8.
4.2.9 The A sub-options focus new terminal capacity on the existing terminal sites, i.e. the CTA and
the Terminal 4 area. A major module of terminal capacity is added alongside the existing T4.
This location of a high proportion of capacity on the south side of the airport is intended to
facilitate a new surface access corridor from the direction of the M3, so spreading demand
across three axes; the present M4, the M25 to T5, and the M3 to the T4 area. The major
disadvantage of this arrangement is that core terminal processing capacity at the T4 site must

SERAS Stage Two: Appraisal Findings Report
32FL1124000.RCE.RP.J03.020131 Appraisal Findings
serve satellites in the CTA and north of the A4. A very long, high-volume transit link would be
required to link these elements, entailing long airside journey times.
4.2.10 Option B seeks to solve this problem by locating terminal core capacity with the satellites
between the two north runways. This would improve operations substantially over the
alternative. A surface access route from the M3 axis can still be achieved, but that traffic would
converge with traffic from the M4/M25 direction. Careful design of internal roads and regulation
of flows would be needed to ensure efficient spreading of traffic over the available access
routes.
4.2.11 The C options offer a third solution to the access issue. Terminal core capacity to serve the
northern satellites is located remotely to the south west, on the Staines Reservoir site. This
avoids significant property displacement and facilitates surface access links to the M3, with an
additional connection to the M25. Road and rail corridors can also largely avoid developed
areas. The disadvantage of a long connection to the satellites, as in option A, remains but high
car parking capacity is relatively easy to accommodate and connection to rail at Staines is
shortened.
4.2.12 Together with the base case, the Heathrow options taken forward for appraisal were Option 1,
Options 6A, 6B and 6C, and Options 8A, 8B and 8C.
Heathrow Additional Options
4.2.13 In the light of the initial optioneering findings, a number of additional options were identified for
investigation. All were aimed at ameliorating one aspect or another of the main impacts found
in the initial work. These further options are described below.
Options 6D and 8D
4.2.14 The first additional option relates to the siting of terminal capacity in Options 6C and 8C. It was
perceived that location on the Staines Reservoir, requiring a large part of it to be filled in, could
be problematic in view of the site’s wildlife protection status. Options 6D and 8D were therefore
developed, relocating the terminal westwards onto Staines Moor. This has no significant impact
on capacity or on providing adequate connections to motorway and rail links.
Option E1
4.2.15 This is a variant of Option 1 entailing operation of the existing runways in mixed mode for only a
part of the day. The hours from 0700 to 1200 were selected as this would still allow periods of
relief from overflights to be afforded to the built-up areas beneath the flight tracks. Overall noise
exposure would increase, however, with the resulting rise in throughput. Capacity with this
partial mixed mode operation was estimated at 91 mppa. This is approximately 5 mppa greater
SERAS Stage Two: Appraisal Findings Report
33FL1124000.RCE.RP.J03.020131 Appraisal Findings
than the figure for maximum use of the runways in segregated mode, and 14 mppa less than
that of Option 1, permanent mixed mode.
Variants of Options 6 and 8
4.2.16 The original Options 6 and 8, with a third runway north of the A4, offer substantial increases in
capacity but would have a major impact on the villages lying between the A4 and the M4. Initial
estimates of the number of properties that would have to be demolished to accommodate these
schemes extend to up to around 2,000 houses and 200ha of commercial properties. The
villages of Harmondsworth, Sipson, Langford and Harlington would be affected to varying
degrees, but the first two would be largely eliminated in most of the cases. Alternative ways
were sought of fitting a third runway into this area while minimising the property impact. It was
recognised that, while it might be possible to spare properties from demolition, they would still
be exposed to high noise levels due to their proximity to the runway and any taxiways or apron
areas associated with it.
4.2.17 The options examined varied in two respects; the length of the third runway and the inclusion or
not, adjacent to it, of terminal and stand capacity. The original options located aircraft
maintenance and support functions north of the A4. The alternative schemes also relocate this
to other parts of the airport site to reduce its property impact. These additional options are
described below.
Options E2 and E3 (Figure 4.1a)
4.2.18 These two options provide a 1,200m long third runway. E2 has no stands, satellites or terminal
capacity between the current north runway (09L-27R) and the new strip. These are instead
located at the west and east extremities of the area between the existing runways. This means
that all traffic using the new runway must cross 09L-27R on departure and arrival. A parallel
taxiway is therefore provided north of this runway, with multiple crossing points to minimise
impact on its capacity. On the basis that the objective of these options is to minimise local
impacts, it is assumed that the two existing runways continue to operate in segregated mode.
The new runway would carry both arrivals and departures.
4.2.19 The capacity of option E2 was estimated at 102 mppa, allowing for the effect of runway
crossings. The number of aircraft types that could use this short runway while carrying an
economic payload would, in practice, be limited. The runway would therefore cater for domestic
and near European services, the spectrum of routes probably being similar to that seen at
London City Airport. It is anticipated that this traffic would derive from:
• Existing services transferred unchanged from the main runways
SERAS Stage Two: Appraisal Findings Report
34FL1124000.RCE.RP.J03.020131 Appraisal Findings
• Existing services on ‘thin’ routes, converted to smaller aircraft at higher
frequencies and transferred to the short runway
• Existing domestic and European services attracted from other airports, such as
London City
• New services to, for example, secondary European cities or regional hubs
4.2.20 The major contribution to increasing the capacity of the airport as a whole, however, would
come from the ‘back-filling’ of the main runway slots freed by transfers to the third runway.
Given the high demand for access to Heathrow, it is probable that these would be taken up by
long-haul, high-capacity services.
4.2.21 The impact on property north of the A4 is much reduced. Noise impacts would also be reduced
from airborne aircraft because of the smaller types able to use the runway and the possibility of
steeper than normal approach and climb-out, and from ground activity due to the absence of
stands.
4.2.22 Option E3 includes adequate aircraft stands adjacent to the third runway to support the traffic
using it. A taxiway crossing of the runway is provided for aircraft access to the rest of the
airport, but the number of operational runway crossings would be minimal. This allows an
increase in capacity over E2 to approximately 108 mppa.
4.2.23 The inclusion of aircraft stands north of the A4 increases the land required there but has little
impact on property, relative to E2. The apron capacity is largely accommodated on
undeveloped land between villages. More of the remaining properties would, however, be
exposed to aircraft ground noise from the apron areas.
Options E4 and E5 (Figure 4.1a)
4.2.24 Options E4 and E5 are similar to E2 and E3 but provide a 2000m runway, allowing larger
aircraft and/or longer route distances to be served. As with option E2, Option E4 has no aircraft
stands north of 09L-27R but provision is made for efficient runway crossings. Option E5 has
sufficient stands north of 09L-27R to serve the third runway. The longer runway in these
options extends the area affected, increasing residential property demolitions and commercial
property take.
4.2.25 Capacity estimates based on service transfer and back-filling take account of the wider range
of aircraft that could use the longer runway. The overall capacity was assessedat 112 and 115
mppa for E4 and E5.
SERAS Stage Two: Appraisal Findings Report
35FL1124000.RCE.RP.J03.020131 Appraisal Findings
Option E6 (Figure 4.1a)
4.2.26 This option is in all ways similar to E5 except that it assumes the existing runways to be
operated in permanent mixed mode. On the basis of service transfer and back-filling, capacity
would be 128 mppa.
Options E7 and E8 (Figure 4.1b)
4.2.27 These two options are based on Option 8, with a full length third runway north of 09L-27R, but
seek to reduce aircraft noise impact from that generated by three runways all operating in
permanent mixed mode. Option E7 assumes that only one runway would be permanently in
mixed mode, with the other two operating in segregated mode. Selection of the mixed mode
runway would be based on finding an ‘optimum’ distribution of noise exposure relative to
number of properties exposed, existing exposure patterns and current agreements. Selection
of the third runway would limit the capacity to be gained, as there would be an imbalance
between its capacity and the capacity of the adjacent terminal facilities. All the possible
combinations of use either make less than optimum use of the available runway capacity.
Estimated capacity was therefore significantly lower than the otherwise similar Option 8, at a
maximum of 127 mppa.
4.2.28 Option E8 provides more flexibility in distributing aircraft noise exposure, and the opportunity to
allow respite periods, by rotating the use of one runway in mixed mode. Again, the selection of
rotation pattern would take account of exposure distribution and standing agreements. As well
as the efficiency losses arising from distribution of traffic across three runways, there would be
losses during changes from one configuration to another. The estimated capacity of E8 was
therefore lower than E7, at 121 mppa.
Summary of Heathrow Options
4.2.29 Table 4.2 summarises the initial and additional options appraised at Heathrow. Proposed
runway locations are indicated on Figures 4.1a and 4.1b.
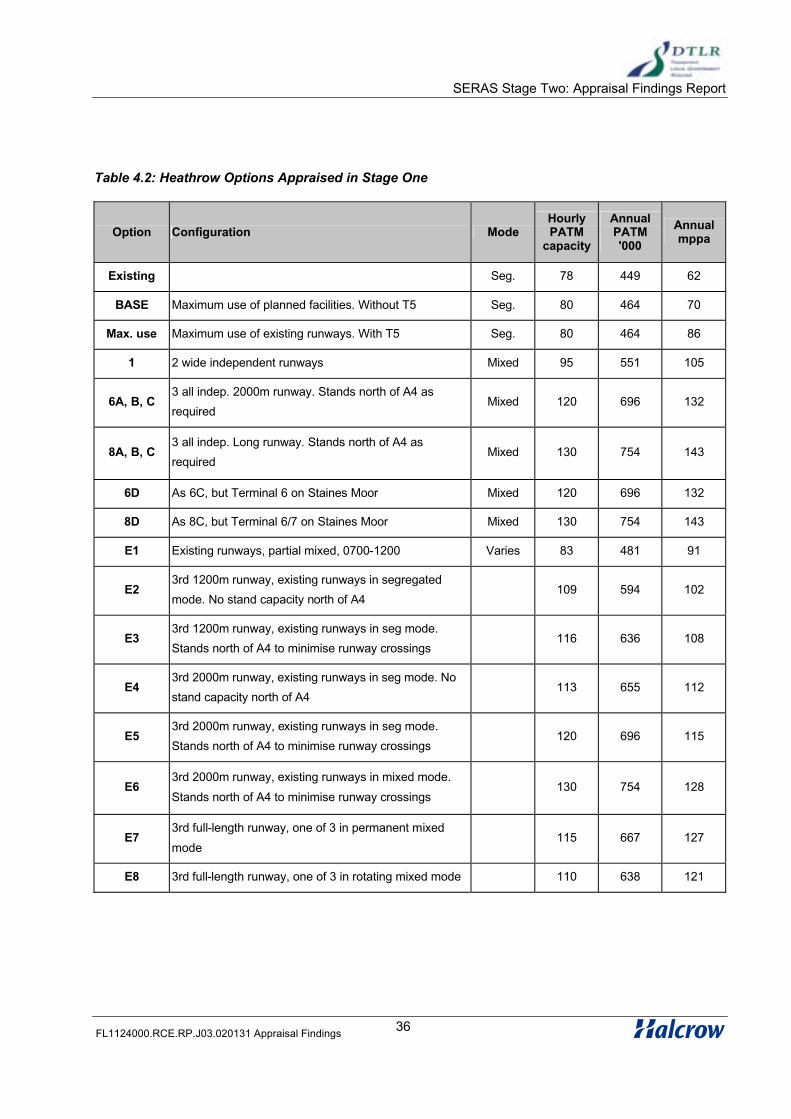
SERAS Stage Two: Appraisal Findings Report
36FL1124000.RCE.RP.J03.020131 Appraisal Findings
Table 4.2: Heathrow Options Appraised in Stage One
Option Configuration ModeHourlyPATM
capacity
AnnualPATM'000
Annualmppa
Existing Seg. 78 449 62
BASE Maximum use of planned facilities. Without T5 Seg. 80 464 70
Max. use Maximum use of existing runways. With T5 Seg. 80 464 86
1 2 wide independent runways Mixed 95 551 105
6A, B, C3 all indep. 2000m runway. Stands north of A4 as
requiredMixed 120 696 132
8A, B, C3 all indep. Long runway. Stands north of A4 as
requiredMixed 130 754 143
6D As 6C, but Terminal 6 on Staines Moor Mixed 120 696 132
8D As 8C, but Terminal 6/7 on Staines Moor Mixed 130 754 143
E1 Existing runways, partial mixed, 0700-1200 Varies 83 481 91
E23rd 1200m runway, existing runways in segregated
mode. No stand capacity north of A4109 594 102
E33rd 1200m runway, existing runways in seg mode.
Stands north of A4 to minimise runway crossings116 636 108
E43rd 2000m runway, existing runways in seg mode. No
stand capacity north of A4 113 655 112
E53rd 2000m runway, existing runways in seg mode.
Stands north of A4 to minimise runway crossings120 696 115
E63rd 2000m runway, existing runways in mixed mode.
Stands north of A4 to minimise runway crossings130 754 128
E73rd full-length runway, one of 3 in permanent mixed
mode115 667 127
E8 3rd full-length runway, one of 3 in rotating mixed mode 110 638 121
SERAS Stage Two: Appraisal Findings Report
37FL1124000.RCE.RP.J03.020131 Appraisal Findings
4.3 Gatwick Options
4.3.1 The starting point for the optioneering at Gatwick was the earlier work done for the RUCATSE
study, together with the minimum list of options specified in the optioneering Terms of
Reference. Within those terms, a broad range of practical capacity development options was
developed. A number of further options or variants were added following assessment of the
initial work. Two options previously examined as part of the RUCATSE studies were specifically
excluded. Both of these were very close parallel runway schemes, with the runways only 200m
apart; one utilising the existing parallel taxiway/emergency runway, and the other a new runway
to the south. The original studies found that these were likely to generate only a small amount
of additional capacity, less than 5 mppa and they were not pursued.
4.3.2 Seven options at Gatwick, six with two runways in parallel configuration and one with three
runways, were developed and taken forward to appraisal. Development options at the nearby
Redhill Aerodrome, operating as a satellite of Gatwick, were also appraised. The options
appraised at Gatwick and Redhill are listed in Table 4.3 and the runway locations are shown on
Figure 4.2.
Table 4.3: Gatwick and Redhill Options Appraised in Stage One
Option Runways Configuration
Close-spaced parallel runway options
1 2 New full length runway 385m to south of existing, no stagger
2 2 New runway 485m to south of existing, staggered 1300m east
3 2 New runway 940m to south of existing, no stagger
5 2 New 1800m long runway, 760m south of existing
6 2 As 5, but with stand capacity between runways
Wide-spaced parallel runway options
4 2 New runway 2900m north, staggered 2000m west, mixed mode
Three-runway options
7 3New runway 485m to south of existing, staggered 1300m east,
plus new runway 2900m north, staggered 2000m west
Redhill options
R1 1 + 1 1200m runway at Redhill, various terminal sub-options
R2 1 + 1 1800m runway at Redhill, various terminal sub-options
SERAS Stage Two: Appraisal Findings Report
38FL1124000.RCE.RP.J03.020131 Appraisal Findings
4.3.3 In 2001, a Section 106 legal agreement between Gatwick Airport Limited and the two planning
authorities for the airport, West Sussex County Council and Crawley Borough Council, came
into force. This agreement comprises a package of more than 40 obligations, including the
reduction of aircraft and ground noise, and emissions, improving landscaping, and
implementing community and environmental projects, and transport initiatives. It will remain in
force until 2009, but will be reviewed in 2006, with a view to its extension beyond 2009.
4.3.4 At the centre of this agreement is Gatwick’s development strategy as a one runway, two
terminal airport within its current boundary. New facilities will be built and brought into use as
and when justified by demand. Development could take one of two alternative forms: either a
pier-based expansion of stand capacity served from the North Terminal, or a mixture of pier and
satellite development. Both schemes would occupy essentially the same area of the existing
airport site. This development stage constitutes the base case for Gatwick optioneering, but it
has been assumed that its capacity could be raised to around 46.5 mppa under pressure of
long term demand growth. In the main SERAS work, therefore, the capacity at Gatwick
currently envisaged in the land-use planning system was taken to be 40 mppa, while the
capacity implied by maximum use of the existing runway was taken to be 46.5 mppa.
Option 1
4.3.5 This option has a close parallel runway pair without stagger, dictating dependent operations,
probably with landings on the southern runway. The 385m runway spacing minimises the
impact on airport support facilities along the south boundary and commercial and residential
property beyond it. It was assumed that independent operations would be feasible in good
visibility conditions, increasing the potential capacity gain. As all stand capacity is north of the
two runways, capacity losses would arise from the large number of crossings required. The
inclusion of a full-length parallel taxiway between the runways, capable of safely holding a
number of aircraft, plus multiple crossing points, would substantially ameliorate this effect. The
estimated capacity of this configuration was 62 mppa.
4.3.6 Additional terminal capacity is provided in two new satellites connected to an expanded North
Terminal core by a transit system. These are connected to the runways by two new taxiway
routes. The taxi distances involved are substantial but not much greater than from the most
northerly North Terminal stands at present.
Option 2
4.3.7 This close-parallel option has a wider spacing, accommodating a dual parallel taxiway between
the strips, and an eastward stagger of the south runway to facilitate independent, segregated
mode operations. ICAO regulations require aircraft to land on the nearest of two staggered
runways, so landings would be on the south runway during westerly operations and on the north
runway during easterlies. A similar number of crossing movements would be required as in

SERAS Stage Two: Appraisal Findings Report
39FL1124000.RCE.RP.J03.020131 Appraisal Findings
Option 1, but the basic movement rate would be higher with independent operations. Capacity
was estimated at 67 mppa.
4.3.8 New terminal space is concentrated in an expanded South Terminal and a single long finger
pier running east from it. This location allows access between the new stand areas and the
south runway, so reducing the number of crossings of the north runway. A dual taxiway is
provided between the runways to accommodate both this direct-access traffic and movements
crossing to and from the main terminal areas to the north.
Option 3
4.3.9 Option 3 is based on another close pair without stagger, but with a greatly increased separation.
This is to accommodate all the additional stands required, plus a linear satellite, between the
runways. This is fed from a core terminal located to the east, between the extended centrelines
of the runways. The runway separation makes independent segregated operations permissible,
and either runway could be used for arrivals or departures. As there is still a large proportion of
stand capacity north of the runways, crossing traffic will again reduce achievable movement
capacity, resulting in estimated capacity of 67 mppa, as for Option 2.
Option 5
4.3.10 This option has a 760m separation between runways, allowing independent segregated
operations, but the new runway is limited to 1800m length. Its use would therefore be restricted
to domestic and short-haul European services. This would constrain the balanced distribution
of demand across the runways and dictate operation in partial dependent mixed mode. This
factor, and the need for all small aircraft to cross the main runway arriving or departing, would
significantly reduce the capacity gain from the second runway. Capacity is estimated as 56
mppa, which is a less than 10 mppa gain over the assumed base case capacity.
Option 6
4.3.11 This option replicates the close parallel runway layout of Option 5, but provides satellite and
stand capacity between the two runways. The satellite is served from an expanded South
Terminal by a track transit system. The need for runway crossings with this configuration would
be somewhat reduced relative to Option 5, giving an estimated capacity of 59 mppa.
Option 4
4.3.12 This is the first wide-spaced parallel runway solution examined in the initial work. The new
runway is separated by 2900 m to the north and is staggered by 2000 m, permitting fully
independent segregated or mixed mode operations. This is in effect a development of one of

SERAS Stage Two: Appraisal Findings Report
40FL1124000.RCE.RP.J03.020131 Appraisal Findings
the schemes in the RUCATSE study. All terminal capacity lies between the runways,
configured in two new terminals serving four large, linear satellites. Mixed mode operations
would have a substantial noise impact on the town of Horley, to the east of the northern runway,
a factor that RUCATSE took as practically ruling out this operating mode. With mixed mode,
however, this option offers the highest capacity of all the two-runway options considered at
Gatwick; at 87 mppa almost a 90% gain over the base case, and 30% over the best of the close
parallel schemes.
Option 7
4.3.13 This three-runway scheme combines the wide spaced runway of Option 4 with a close spaced
pair as in Option 2. The objective here is to achieve a high capacity while using the north
runway in one direction only, so avoiding overflight of Horley. As the close spaced pair must
operate in segregated mode, with the north runway one way, an imbalance of capacity is
created in favour of either arrivals or departures, depending on wind conditions and runway
selection. This may be advantageous at certain times but overall capacity has to be assessed
on a balanced situation. On that basis the capacity of Option 7 was estimated as 87 mppa,
equal to that of the wide spaced, mixed mode configuration of Option 4.
Redhill/Gatwick
4.3.14 Redhill Aerodrome was considered for the development of commercial passenger operations
only as an adjunct to the nearby Gatwick Airport. In this scenario, Redhill would act as a
satellite of Gatwick, not as a separate airport, and there would be a fixed track transit link to
carry users between the two sites. Two main options for runway capacity development
emerged from the optioneering study carried out on Redhill;
• Option R1: a 1200m long runway at Redhill
• Option R2: an 1800m long runway at Redhill.
4.3.15 These runway lengths would limit the aircraft types that could use Redhill to those typically used
on domestic and short to medium haul European routes. Both cases assume that Gatwick is
not developed beyond the capacity of the facilities currently planned there. The use of a new
runway at Redhill would be made up of a number of elements;
• Existing services transferred unchanged from Gatwick,
• Existing Gatwick services on ‘thin’ routes, converted to smaller aircraft at higher
frequencies and transferred to Redhill,

SERAS Stage Two: Appraisal Findings Report
41FL1124000.RCE.RP.J03.020131 Appraisal Findings
• Existing domestic and European services attracted from other airports, such as
London City or Southampton, and
• New services to, e.g. secondary European cities or regional hubs.
4.3.16 The transfer of services out of Gatwick would leave vacant slots there that could be taken up by
other services, with the most likely substitutions being longer haul, higher seat capacity
services. The capacity gained by development at Redhill should, therefore, be assessed on the
joint capacities of the two airports. The estimated capacities yielded by the two options were
estimated as:
• Option R1: Redhill 9 mppa, Gatwick 54 mppa, joint capacity 63 mppa
• Option R2: Redhill 15 mppa, Gatwick 54 mppa, joint capacity 69 mppa
4.3.17 The base case for Redhill is the existing undeveloped aerodrome site (there is currently little
infrastructure and only a grass runway), taken in conjunction with the base case at Gatwick,
having an overall capacity of 46.5 mppa.
4.3.18 The difference in capacities is mainly due to the larger aircraft and longer routes that can be
served from the longer runway, allowing more services to transfer from Gatwick and so freeing
more slots there for higher-capacity services. Annual aircraft movements would be in the order
of 450,000, divided approximately 260,000/190,000 between the Gatwick and Redhill runways.
It is anticipated that about 40% of passengers using Redhill would be interlining between short
haul services at Redhill and long haul at Gatwick.
4.3.19 In the consideration of development of a runway at Redhill, particular attention was paid to: its
acceptability in environmental terms; surface access implications including the impact of road
traffic; and the need for a transit link between Redhill and Gatwick. The nature of the transit
link, airside or landside or both, would be influenced by possible locations for the departure and
arrival processing of passengers and their baggage.
4.3.20 The study concluded that the most favourable operational arrangement under the scenario of
no direct access to Redhill would be to concentrate passenger processing at Gatwick, with only
the minimum departure and arrival gate facilities (plus retail space) at Redhill. The transit link in
this case would be wholly airside, with baggage carried in separate secure cars. In the scenario
allowing partial access to Redhill, the optimum arrangement was considered to be to provide
processing at Redhill only for those passengers accessing the site direct, with those accessing
via Gatwick processed there. Again, facility requirements at Redhill would be kept to the
necessary minimum, and the transit system would be an airside link.

SERAS Stage Two: Appraisal Findings Report
42FL1124000.RCE.RP.J03.020131 Appraisal Findings
4.3.21 Development would be required at Gatwick, to provide the necessary passenger processing
capacity in each case, and access to it from surface connections. This would indicate
development close to the South Terminal rail station.
Additional Gatwick Options
4.3.22 In the light of the initial optioneering findings, two additional options were identified for
investigation.
4.3.23 Option 4A: Option 4A uses the runways of Option 4 in segregated mode to avoid overflying
Horley, thereby reducing noise impact. The northern runway would be used for westerly take-
offs and easterly landings, and the southern runway for easterly take-offs and westerly landings.
The capacity of this option was estimated at 71 mppa.
4.3.24 Option E1: Option E1 can be seen as a development of Option 4A. It adds another runway to
the south of the existing runway and separated from it by 1035m. This separation would allow
the existing and new southern runways to be used in independent operation. In practice, the
southern runway would be used in segregated mode, as a pair with the northern runway which
would be used as in Option 4A to avoid overflying Horley. The existing runway would be
operated in mixed mode.
4.3.25 Satellite and stand capacity would be provided between the two southern runways to minimise
crossing movements of the existing runway. The capacity of this option is estimated at 115
mppa.
Summary of Gatwick Options
4.3.26 The principal characteristics of the options appraised at Gatwick and Redhill are summarised in
Table 4.4 and runway locations are shown on Figure 4.2.

SERAS Stage Two: Appraisal Findings Report
43FL1124000.RCE.RP.J03.020131 Appraisal Findings
Table 4.4: Gatwick Options Appraised in Stage One
Option Configuration ModeHourlyPATM
capacity
AnnualPATM '000
Annualmppa
Existing Mixed 45 30
Base Maximum use of planned facilities Mixed 48 260 46.5
1 2 close dependent, 385m separation Seg. 70 378 62
2 2 close independent, 485m separation and
staggeredSeg. 75 405 67
3 2 close independent, 940m separation Seg. 75 405 67
4 Wide independent Mixed 95 513 87
5 2 close dependent 1800m runway, 760m
separation
Dependent arrivals.
Mixed 65 351 56
6 As 5 but terminal capacity between runway Mixed 68 367 59
7 2 close, 1 wide. Northern runway avoiding
HorleySeg. 95 513 87
4A Wide independent, avoiding Horley Seg. 80 432 71
E1 1 wide segregated mode and south two at
1035m spacingMixed 125 675 115
R1 +Redhill 1200m runway (LGW as is) LGW 48 260 54
RHL 48 180 9
R2 +Redhill 1800m runway (LGW as is) LGW 48 260 54
RHL 48 201 15

SERAS Stage Two: Appraisal Findings Report
44FL1124000.RCE.RP.J03.020131 Appraisal Findings
4.4 Stansted Options
4.4.1 A total of eleven options were defined for Stansted, with up to four runways in various parallel
configurations, and four options with the main runways realigned onto an east-west axis. The
locations of the runways appraised at Stansted are shown on Figures 4.3a to 4.3e. All the
options presented were carried forward for appraisal. In outline terms the options were as
follows:
Table 4.5: Stansted Options
Option Runways Configuration
Close-spaced parallel runway options
1 2 New runway 385m to NW, standby runway replaces existing runway
2 2 New runway 385m to NW, staggered to NE by 2500m
Wide-spaced parallel runway options
3 2 New runway 1800m to SW, staggered to NE by 3500m
4 2 New runway 2450m to SW, staggered to NE by 3500m
5 2 2nd runway 2450m to SE, staggered 3500m NE, three terminals
Three runway options, existing alignment
11 3 New runway 485m to NW, new runway 2900m south of terminal area
Four runway options, existing alignment
6 4Two pairs north and south of terminal area, each one full length and
one 1800m runway
7 4 Two pairs of full length runways to north and south of terminals
Options realigned E-W
8 3Two new main runways aligned E-W, 2450m separation, existing
runway retained as crosswind
9 5Two new pairs of full length runways aligned E-W, 2450m separation,
existing runway retained as crosswind
10 5Two pairs north and south of terminal area aligned E-W, each one full
length and one 1800m runway, existing runway retained as crosswind
SERAS Stage Two: Appraisal Findings Report
45FL1124000.RCE.RP.J03.020131 Appraisal Findings
4.4.2 The base case for optioneering at Stansted is the scale of development for a capacity of 15
mppa for which the airport was granted consent in 1999. Stansted Airport Ltd has, in August
2001, submitted a planning application to increase capacity to 25 mppa.
4.4.3 It should be noted that current plans for Stansted include the conversion of the existing ‘outer’
taxiway (that running nearest the runway on the south east side) into a standby runway for use
when the main runway is undergoing maintenance.
Option 1 (Figure 4.3b)
4.4.4 This option would utilise the standby runway as a 2500m main runway and add a new 3500m
runway on the north west side in close-parallel configuration. The present runway would
become a parallel taxiway between the two. The close spacing dictates dependent segregated
operation, and crossing movements would reduce potential capacity, although multiple
simultaneous crossing would be facilitated by the intervening taxiway. Runway length difference
would not affect the balanced distribution of traffic as the shorter runway would be used for
arrivals in either operating direction. Estimated capacity is 57 mppa. Additional terminal
capacity is in a core and satellite configuration, replicating the existing facility.
Option 2 (Figure 4.3a)
4.4.5 This option has the same runway separation as Option 1, but retains the existing full-length
runway and staggers the new runway 2500m to the north east. This large stagger permits
independent segregated mode; landings would be on the nearest threshold in either direction of
operations. Crossing traffic could largely be eliminated as the pronounced stagger opens both
runways to direct access from the terminal zones. Capacity would be a significant improvement
over Option 1 at 67 mppa. As in Option 1, terminal capacity is in two core and satellite modules.
Option 3 (Figure 4.3a)
4.4.6 Option 3 places the new runway on the other side of the terminal area, giving a wide separation
and an even greater stagger than Option 2. Operation in independent segregated or mixed
mode would be feasible, but there is not enough land area between the runways to
accommodate stand and terminal capacity to support potential mixed mode throughputs. This
option is therefore assumed to operate in segregated mode, and its capacity would thus be the
same as Option 2.
Option 4 (Figure 4.3a)
4.4.7 The separation between the parallel runways is increased to 2450m, with the same large
stagger as in Option 3. As in that case, segregated or mixed mode operation is possible. While

SERAS Stage Two: Appraisal Findings Report
46FL1124000.RCE.RP.J03.020131 Appraisal Findings
in Option 4 there is a greater depth of land available to accommodate terminal and stand
capacity between the runways, this would still require large areas of land acquisition. This
option was therefore limited to segregated operations, restricting it to a similar capacity to
Options 2 and 3. The additional site depth is used, however, to fit in an efficient back-to-back
two-terminal layout.
Option 5 (Figure 4.3a)
4.4.8 This option is essentially the same as Option 4 in runway layout terms but is operated in mixed
mode. This enables full advantage to be taken of the land area enclosed between the runways
for terminal/apron development. There are three terminal units, which would each have to be
capable of handling up to 35 mppa. Estimated capacity of the runway layout in mixed mode is
82 mppa.
Option 11 (Figure 4.3b)
4.4.9 This option adopts a similar layout to Option 2, but adds a third full length runway to the south of
the terminal area. As in that option, the large stagger of the northern pair allows runway
crossings to be minimised. This pair operates in dependent segregated mode and the south
runway in mixed mode. Capacity of this configuration is estimated at 102 mppa.
Option 6 (Figure 4.3c)
4.4.10 This is a four-runway layout in two close parallel pairs, one runway in each full length and the
other 1800m, at a 400m separation. The layout allows most runway crossings to be avoided.
The short runways dictate that each pair operates in independent segregated mode to balance
arrival and departure capacity for all aircraft sizes. Capacity would be approximately 116 mppa.
Option 7 (Figure 4.3c)
4.4.11 This again is a four-runway layout in two close parallel pairs, but with all runways full length.
This allows more effective distribution of traffic across the runways, giving a higher estimated
capacity of 129 mppa.
Option 8 (Figure 4.3d)
4.4.12 In this option, and Options 9 and 10 described below, the main runways are aligned on an East-
West axis. This is intended to reduce the airspace interaction between Stansted traffic and that
passing to and from other South East airports, notably Luton and London City. Option 8 is the
simplest of the three, with a pair of wide spaced runways oriented E-W and the existing runway
retained for use in adverse wind conditions. The capacity of this arrangement is effectively that

SERAS Stage Two: Appraisal Findings Report
47FL1124000.RCE.RP.J03.020131 Appraisal Findings
of the main runway pair and is estimated at 82 mppa, assuming they operate in mixed mode (as
in Option 5).
4.4.13 The effect of the runway realignment on local aircraft noise exposure would be significant. The
substantial settlements of Stansted Mountfitchet and Great Dunmow, which are not currently
exposed to high noise levels, lie to the west and east respectively. With this layout Stansted
Mountfitchet would lie on the extended centreline of the northern new runway, and Great
Dunmow on that of the southern new runway.
Option 9 (Figure 4.3e)
4.4.14 This replicates Option 8 but with two pairs of full length runways on the E-W alignment. Each
operates as an independent segregated pair. Traffic would have to cross the inner runways to
reach the outer, resulting in crossing losses. Capacity is again determined by the main runway
pairs and is estimated at 129 mppa.
Option 10 (Figure 4.3e)
4.4.15 This layout has similarities to Option 6 but on an E-W alignment. Operationally it is the same,
with the maximum capacity being generated with each pair in independent segregated mode.
As Option 6 that capacity is assessed as 116 mppa.
Options E8A and E8B
4.4.16 These two variants of Option 8 are designed to preserve the potential advantages of the E-W
alignment while reducing its impact on Stansted Mountfitchet, Great Dunmow and other, smaller
settlements. If operations are limited to segregated mode, this can be done in two ways; by
permanently fixing runway use to minimise overflight of the settlements, or by alternating arrival
and departure runways to afford them respite periods. Option E8A does the former and E8B
the latter. In easterly winds, the crosswind, existing runway can be used for arrivals, reducing
taxi distances to the terminal area.
4.4.17 Alternation of runways in E8B is assumed to be on a daily cycle, so no losses are assumed due
to change-overs. The capacity of both options is therefore estimated at 67 mppa.
4.4.18 The options appraised at Stansted are summarised in Table 4.6. Runway locations are shown
on Figures 4.3a to 4.3e.

SERAS Stage Two: Appraisal Findings Report
48FL1124000.RCE.RP.J03.020131 Appraisal Findings
Table 4.6: Stansted Options Appraised in Stage One
Option Configuration Mode
Hourly
PATM
capacity
Annual
PATM '000
Annual
mppa
Existing Mixed 30 97.5 9.5
BASE Maximum use of planned facilities Mixed 38 185 15
Max. use Maximum use of existing runway Mixed 48 259 35
1 2 close dependent, 385m separation Seg. 70 378 57
2 2 close independent, 385m + staggered Seg. 80 432 67
3 2 wide independent, 1800m separation Seg. 80 432 67
4 2 wide independent, 2450m Fixed seg. Seg. 80 432 67
5 2 wide independent Mixed 95 513 82
6 2 x 1 long/1 short, 400m separation 130 702 116
7 2 x 2 dependent Full length 140 756 129
8 2 x wide aligned E-W, + crosswind Mixed 95 513 82
9 As Option7 aligned E-W, + crosswind 140 756 129
10 As Option6 aligned E-W, + crosswind 130 702 116
11 2 close, 1 wide 118 637 102
E4 2 wide independent, 2450m Alternating seg. Seg. 80 432 67
E8A As Option8 Fixed seg. Seg 80 432 67
E8B As Option8 Alternating seg. Seg 80 432 67

SERAS Stage Two: Appraisal Findings Report
49FL1124000.RCE.RP.J03.020131 Appraisal Findings
4.5 Luton Options
4.5.1 The dominant feature constraining development at Luton Airport is the topography of the site. It
lies within an area of steep ridges and valleys at an elevation of about 150m and there are
severe down gradients at both ends of the 2,160m long single runway. The development of
more than one runway, or the terminal/apron capacity to match, was considered impractical
because of the airport’s plateau situation and the consequent severe limitations on development
space. Options focus on raising the capability of the existing runway to handle larger aircraft
and enable new markets to be served. A runway of 3,000m is envisaged for this, but an
additional option looks at a shorter alternative.
Options Identified
4.5.2 The three options and two sub-options identified in the initial work are outlined in Table 4.7. All
of the runway locations appraised are shown on Figure 4.4.
Table 4.7: Initial Luton Options
Option Runways Configuration
3,000m runway options
1A 1 Existing runway extended to 3000m, redeveloped terminal area
1B 1 Runway as in 1A, all processing at remote rail-based terminal
2 1 Replacement runway 200m south of existing
3 1 New runway aligned approximately SSW-NNE
4.5.3 The base case for Luton is taken as a capacity of 10 mppa. This is estimated to be achievable
within available facilities (including use of existing new terminal space not yet fitted out), and
with the completion of a full parallel taxiway and high-speed runway exits to reduce runway
occupancy times.
Options 1A and 1B
4.5.4 Both these options entail extension of the existing runway eastwards to 3,000m on its present
alignment. Extension to the west was not considered feasible due to the very steep terrain and
the presence of major roads and development. A full parallel taxiway and high-speed exits are

SERAS Stage Two: Appraisal Findings Report
50FL1124000.RCE.RP.J03.020131 Appraisal Findings
included in both cases. Additional terminal development is assumed, increasing the estimated
capacity of both these options to 31 mppa.
4.5.5 The two options are differentiated by their treatment of the terminal facilities. Option 1A has a
conventional arrangement of a core terminal and satellite concourses, based on the present
terminal site and utilising essentially the same surface access infrastructure. All passenger
processing would be done in these terminal buildings. Option 1B makes use of the Parkway rail
station located on the main line running about 2 km to the west of the airport. All primary
passenger and baggage processing would be carried out in a new facility built over the station.
A light rail or other form of rapid transit system would connect the station terminal to satellite
concourses on the present terminal site. This scheme would reduce pressure on land in the
centre of the airport site, by removing processing space off site and eliminating the need for
passenger-related vehicle access to the central area. Both schemes were considered entirely
feasible and were taken forward to appraisal.
Option 2
4.5.6 In this option, a new 3,000m runway would be built 200m south of and parallel to the present
one, which would be retained as part of a parallel taxiway and could be retained for use as a
runway in emergencies. The advantage of this option, in addition to the longer runway
provided, is the resulting release of land area in the centre of the airport site. The additional site
depth would allow a significantly greater number of aircraft stands or a more efficient layout of
the same number, with more effective access between terminal area and runway. Capacity is
the same as Option 1 at 31 mppa. This option was also carried forward for appraisal.
Option 3 and E3
4.5.7 These schemes would create a new 3,000m runway on an alignment similar to that of Stansted,
while also taking advantage of terrain to the north east more favourable to extension. These
options have an advantage similar to, but greater than Option 2, in that they open up large
areas of developable land around the present centre of the airport. In this case, the available
area between the centre and the main road and rail corridors to the west is greatly expanded,
giving the opportunity to overcome the site depth and gradient problems that currently constrain
the airport’s surface access arrangements. Capacity is the same as Option 1 at 31 mppa.
These options were carried forward to appraisal. Options 3 and E3 are small alignment variants
of this basic runway option.
Option E4
4.5.8 Options 1 to 3 reflect the ultimate potential of Luton airport in terms of traffic throughput and
aircraft size capability, assuming a feasible runway length of 3,000m and a 31 mppa
throughput. The impacts of these options, including land required, cost and the extent of the

SERAS Stage Two: Appraisal Findings Report
51FL1124000.RCE.RP.J03.020131 Appraisal Findings
development required in the terminal area, are substantial. There are, also, obstacles to the
unconstrained expansion of the airport, particularly the difficult topography, land ownership and
land availability. These issues could well constrain implementation of a full parallel taxiway at
the north east end of an extended runway, so restricting its hourly capacity. The present land
use and topography of the terminal area also make large-scale development of new capacity
problematic in layout terms and costly in construction.
4.5.9 A further option, Option E4, was therefore considered, that seeks a closer balance between the
capacity achieved and the natural constraints of the airport site. This option is based on two
parameters; a runway of less than 3,000m and an annual throughput in the order of 20-25
mppa. The required runway length was assessed as 2,500m, and this is achieved by eastward
extension of the existing runway.
Summary of Options
4.5.10 The capacities of the Luton options are summarised in Table 4.8. Runway locations are shown
on Figure 4.4.
Table 4.8: Luton Options Appraised in Stage One
Option Configuration Mode
Hourly
PATM
capacity
Annual
PATM
'000
Annual
mppa
Existing Mixed 27 44 4.4
Base Maximum use of planned facilities Mixed 27 100 10
1A, B Existing runway extended to 3000m Mixed 48 240 31
2 New 3000m runway south of existing Mixed 48 240 31
3, E3 New 3000m runway realigned NE-SW Mixed 48 240 31
E4 Runway extension to yield 20-25 mppa Mixed 48 228 29

SERAS Stage Two: Appraisal Findings Report
52FL1124000.RCE.RP.J03.020131 Appraisal Findings
4.6 Cliffe Marshes Options
Location and Constraints
4.6.1 Options for the location of a major development at Cliffe Marshes are constrained by a number
of factors:
• topography - the site slopes upwards from the Thames shoreline to high ground
along the centre of the peninsula, requiring large volumes of cut and fill to level
an airport platform;
• land use - a number of small to medium-sized settlements along the central high
ground, at the base of the peninsula and shorelines, plus major port and power
station facilities at the Isle of Grain;
• protected areas - the whole of the coastal flats around the peninsula, and marsh
areas at the west and east ends, are designated as RAMSAR and/or SPA areas.
4.6.2 The latter areas effectively halve the potential site area for airport development. The shape of
the remaining area, together with the prevailing winds, indicate an optimum runway orientation
aligned approximately east-west.
4.6.3 The Stage One options at Cliffe Marshes are shown on Figures 4.5a to 4.5c. In Stage Two of
SERAS, these options have been further refined, in terms of their layouts, their locations and
runway alignments in order to reduce land take and noise impacts. In addition, further
consideration has been given to the potential role of a new airport, how it might be operated,
and its resulting capacity. The Stage Two options at Cliffe Marshes are described in Chapter
11. In this chapter, the Stage One options and assumptions are summarised.
Base Case (Figure 4.5a)
4.6.4 The initial assumption relating to development of a new airport site was that, to justify the
investment necessary in site preparation and facilities such as new surface access links, the
potential capacity of the site should be maximised. This was judged likely to be best achieved
by the development of a four-runway layout, with the runways in two close parallel pairs, each
operating in dependent segregated mode. As, at a new site, a ‘do nothing’ or minimum
development scenario would be meaningless, this option was developed as the base case.

SERAS Stage Two: Appraisal Findings Report
53FL1124000.RCE.RP.J03.020131 Appraisal Findings
4.6.5 The runway pairs are separated by 2000m, leaving space for a high-capacity terminal area
between them, and the runways in each pair are 400m apart. When operating in westerly
winds, the arrival tracks (which would be to the two outer runways) pass mostly over the open
waters of the estuary. Departure paths, to the west, cannot continue straight ahead as they
would soon conflict with Heathrow traffic. They would therefore have to diverge to the north and
south and, in doing so, can be designed to avoid the most populous parts of the towns to the
west of the site.
4.6.6 In easterly winds, departures would be largely over open water but arrivals, which must follow a
straight track, would pass over the towns to the west. With the base case layout, the southern
of the two arrival routes would largely be over the meandering line of the Thames, but the
northern track would pass directly over Grays and other populated areas.
4.6.7 The optioneering study examined a number of terminal layout sub-options for the base case.
All placed aircraft stand capacity in the most efficient location, between the runway pairs,
usually served from linear satellites running at right angles to them.
4.6.8 The choice of terminal layout would not affect the basic operation of the runway system: all the
layouts require that aircraft cross the inboard runways to gain access to or from the outer
runways. Capacity of the base case option was estimated at 140 ATM/hr and passenger
capacity at 146 mppa.
Option 1A (Figure 4.5b)
4.6.9 If constructed, it offers a lower capacity with correspondingly reduced land take, costs and other
impacts. The two widely spaced runways offer a capacity of 95 ATM/hr in independent mixed
mode, with no runway crossings, an efficient terminal layout and making full use of the available
runways. Passenger capacity was estimated at 105 mppa. Easterly operations would
necessitate arrivals overflying populated areas to the west of the site.
Option 2 (Figure 4.5a)
4.6.10 This option replicates the base case but includes an additional pair of parallel runways, laid out
to the west of the central airport area and oriented in a SW-NE direction. In westerly winds, the
airport would operate exactly as does Option 1. In easterlies, departures would use the main
runway pairs but arrivals the two additional runways, in independent simultaneous parallel
mode. The orientation of these runways allows the arrival tracks largely to avoid passing over
densely populated areas, by utilising the ‘gap’ between Rochester and Gravesend.
4.6.11 Capacity in the easterly mode could be somewhat higher than in westerlies, as arrivals and
departures are independent of each other and no runway crossings are necessary. It would, of
course, be possible to use this runway configuration in a similar fashion in westerly conditions,

SERAS Stage Two: Appraisal Findings Report
54FL1124000.RCE.RP.J03.020131 Appraisal Findings
with arrivals on the main runways and departures on the additional west pair. This would make
two of the main four runways redundant, however, and traffic bound for the north would have to
be turned from the runway heading immediately after departure. This would be likely to
increase noise exposure over built-up areas and would give rise to conflict between the turning
traffic and the missed approach routes of the main runways.
4.6.12 Estimated hourly movement capacity of this option is based on operations in westerly mode, as
the dominant situation. It therefore equates to that of the base case at 140 ATM/hr and 146
mppa.
4.6.13 Additional Options 1B and 3 were investigated with a view to further reducing impacts,
particularly the exposure of the towns to the west to arrival aircraft noise. Another variant on
the base case, Option 4, was examined as means of avoiding displacement of some of the
settlements in the centre of the peninsula.
Option 1B (Figure 4.5b)
4.6.14 This option offers a further reduction in capacity and impacts, relative to the base case, by
limiting operations on a two runway layout to segregated mode. Its significant feature in noise
impact terms is the use of only one arrival stream. This gives more flexibility in the choice of
arrival runway, to locate the track over the least populous areas or to alternate runway use and
so provide respite periods.
4.6.15 The capacity of this option is estimated at 80 ATM/hr and 86 mppa. The advantages of reduced
impacts are at the expense of less than full use of the available runway infrastructure and the
land enclosed by the runways.
Option 3 (Figure 4.5c)
4.6.16 The concept of this option is similar to that of Option 2, in that additional runway capacity is
added to allow arrivals in easterly conditions to follow a track over less built-up areas. In this
case, however, the main runways are limited to a single wide-spaced pair and only a single
angled runway is provided. The overall effect is to reduce capacity and impacts, relative to
Option 2, and substantially reduce land take.
4.6.17 In westerly mode, capacity is the same as that of Option 1A, with the two main runways in
mixed mode, at 95 ATM/hr. In easterly conditions, however, an imbalance is introduced as
there are two departure runways available but only one arrival runway. This cannot be
redressed by operating the north main runway in mixed mode, because arrivals on it and those
on the angled runway would become dependent. The overall effect of this imbalance would
depend on the proportion of easterly winds and the pattern of arrival/departure ratios over the
day.
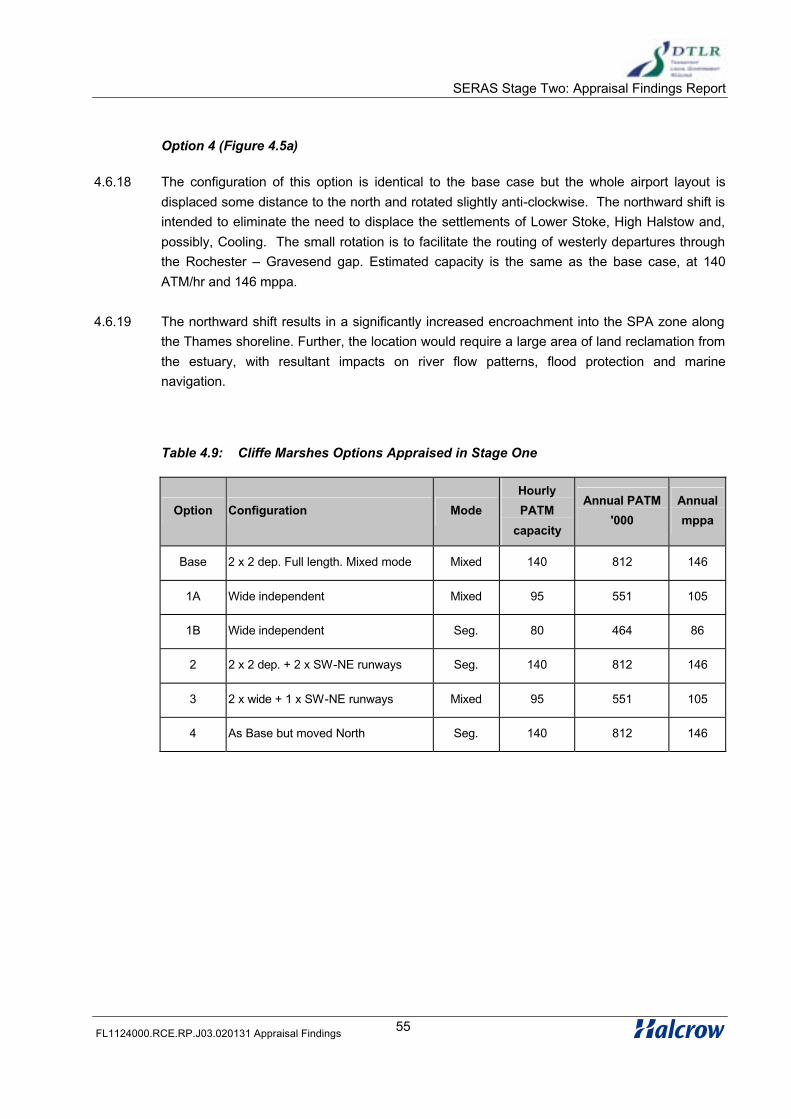
SERAS Stage Two: Appraisal Findings Report
55FL1124000.RCE.RP.J03.020131 Appraisal Findings
Option 4 (Figure 4.5a)
4.6.18 The configuration of this option is identical to the base case but the whole airport layout is
displaced some distance to the north and rotated slightly anti-clockwise. The northward shift is
intended to eliminate the need to displace the settlements of Lower Stoke, High Halstow and,
possibly, Cooling. The small rotation is to facilitate the routing of westerly departures through
the Rochester – Gravesend gap. Estimated capacity is the same as the base case, at 140
ATM/hr and 146 mppa.
4.6.19 The northward shift results in a significantly increased encroachment into the SPA zone along
the Thames shoreline. Further, the location would require a large area of land reclamation from
the estuary, with resultant impacts on river flow patterns, flood protection and marine
navigation.
Table 4.9: Cliffe Marshes Options Appraised in Stage One
Option Configuration Mode
Hourly
PATM
capacity
Annual PATM
'000
Annual
mppa
Base 2 x 2 dep. Full length. Mixed mode Mixed 140 812 146
1A Wide independent Mixed 95 551 105
1B Wide independent Seg. 80 464 86
2 2 x 2 dep. + 2 x SW-NE runways Seg. 140 812 146
3 2 x wide + 1 x SW-NE runways Mixed 95 551 105
4 As Base but moved North Seg. 140 812 146
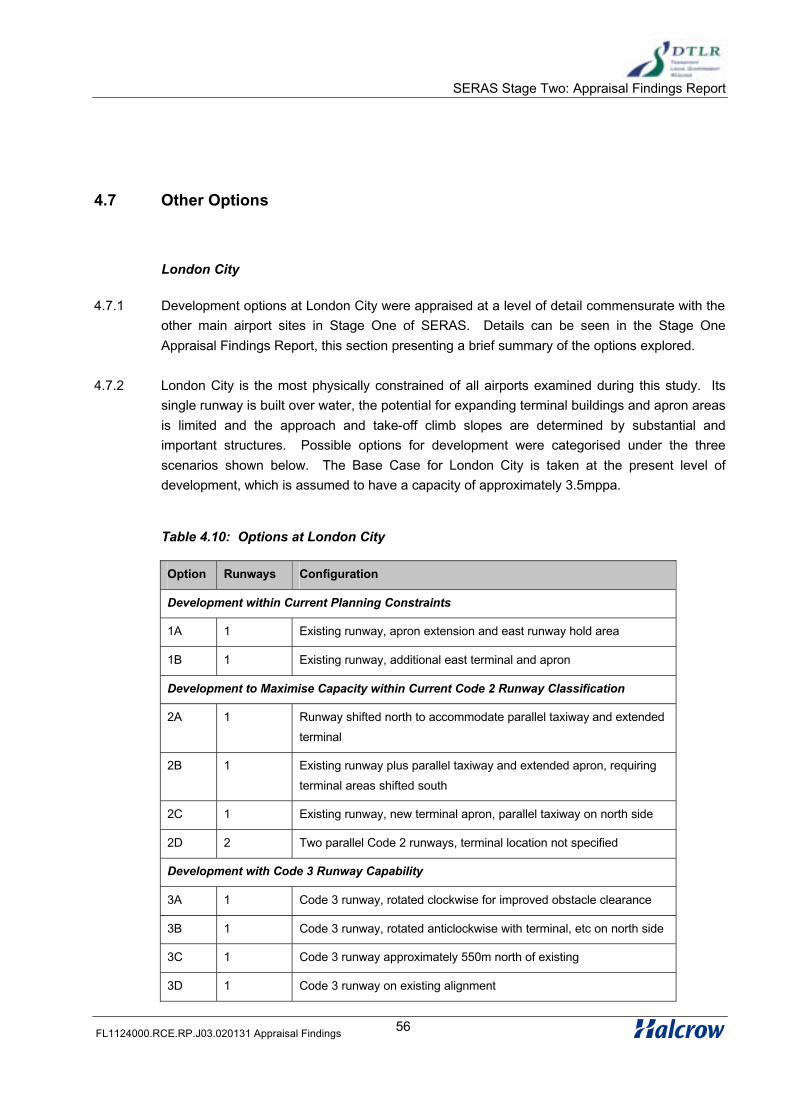
SERAS Stage Two: Appraisal Findings Report
56FL1124000.RCE.RP.J03.020131 Appraisal Findings
4.7 Other Options
London City
4.7.1 Development options at London City were appraised at a level of detail commensurate with the
other main airport sites in Stage One of SERAS. Details can be seen in the Stage One
Appraisal Findings Report, this section presenting a brief summary of the options explored.
4.7.2 London City is the most physically constrained of all airports examined during this study. Its
single runway is built over water, the potential for expanding terminal buildings and apron areas
is limited and the approach and take-off climb slopes are determined by substantial and
important structures. Possible options for development were categorised under the three
scenarios shown below. The Base Case for London City is taken at the present level of
development, which is assumed to have a capacity of approximately 3.5mppa.
Table 4.10: Options at London City
Option Runways Configuration
Development within Current Planning Constraints
1A 1 Existing runway, apron extension and east runway hold area
1B 1 Existing runway, additional east terminal and apron
Development to Maximise Capacity within Current Code 2 Runway Classification
2A 1 Runway shifted north to accommodate parallel taxiway and extended
terminal
2B 1 Existing runway plus parallel taxiway and extended apron, requiring
terminal areas shifted south
2C 1 Existing runway, new terminal apron, parallel taxiway on north side
2D 2 Two parallel Code 2 runways, terminal location not specified
Development with Code 3 Runway Capability
3A 1 Code 3 runway, rotated clockwise for improved obstacle clearance
3B 1 Code 3 runway, rotated anticlockwise with terminal, etc on north side
3C 1 Code 3 runway approximately 550m north of existing
3D 1 Code 3 runway on existing alignment
SERAS Stage Two: Appraisal Findings Report
57FL1124000.RCE.RP.J03.020131 Appraisal Findings
Options 1 A and 1B (Figure 4.6)
4.7.3 These reflect current operator proposals and are aimed at reducing runway occupancy times.
Due to the absence of a parallel taxiway, these are currently high as a result of the need for
aircraft to back track along the runway for either landing or take-off. Option 1A introduces a
holding bay at the east end of the runway, allowing more than one aircraft to be held which can
then backtrack in rapid succession. As an alternative, Option 1B includes an additional apron
area at the east end, thereby reducing the proportion of aircraft that need to back track. Both
layouts are estimated to provide a capacity of 5mppa.
Options 2 A, B, C and D (Figure 4. 6)
4.7.4 These options provide additional capacity whilst retaining the existing runway length. They
increase runway capacity and provide terminal, apron and other facilities to match it. Option 2A
achieves this by shifting the runway to the north and providing a full length parallel taxiway and,
a substantial apron extension and additional terminal space. Whilst Option 2B achieves the
same, but with new construction over water, Option 2C proposes a radical change by placing
the taxiway, apron, terminal and other facilities on a new site on the north side of the dock.
Although expensive, all these options are feasible and are estimated to have a capacity of
7mppa. Option 2D, not illustrated, provided additional capacity through the use of two parallel
runways, one on each side of the dock area. However, the scale of land take, commercial and
residential property demolition and dock in-filling to accommodate the runways and the midfield
facilities required was considered unacceptable. This option was not therefore appraised as
part of Stage One.
Options 3 A , B, C and D (Figure 4.6 for 3A only)
4.7.5 Representing options to accommodate a 2,000m runway, the principal constraints are local
obstacles, notably the Canary Wharf Tower and the close Excel Building. These pose an
obstacle clearance problem for B737 type aircraft on both approach and take-off. Different
rotations and shifts of the runway alignment and locations were employed in each option but
significant obstacles remained and land take requirements high. Only Option 3A was
considered realistic, providing an estimated capacity of 10mppa. 3A comprised a rotation to
avoid Canary Wharf and a 925m eastward shift, placing the runway out across the Thames.
Summary of London City Options
4.7.6 Table 4.11 summarises the options at London City that were further appraised during Stage
One.

SERAS Stage Two: Appraisal Findings Report
58FL1124000.RCE.RP.J03.020131 Appraisal Findings
Table 4.11 Appraisal Options at London City
Option Configuration Mode Hourly
PATM
Capacity
Annual
PATMs
‘000
Annual
mppa
Existing Mixed 20-25 36 1.5
Base Maximum use of existing facilities Mixed 32 65 3.5
1A, 1B Maximum use of existing runway Mixed 32 73 5
2A, B, C Existing + parallel taxiway Mixed 43 100 7
3A Extension to 2,000m and rotation to
avoid obstacles
Mixed 43 100 10
Southampton
4.7.7 Development options at Southampton were appraised at a level of detail commensurate with
the other main airport sites in Stage One of SERAS. The limited ultimate capacity led to
Southampton latterly being included as part of the small site appraisal work. Four options were
appraised, Options 1 to 3 develop the existing runway and Option 4 provides a new longer
runway on a new alignment. Presently handling approximately 857,000 passengers per annum,
it is envisaged that the capacity within the current land-use planning system is 2-2.5mppa.These options are shown in Figure 4.7.
• Option 1 comprises new apron stands and a new terminal building to make
maximum use of the existing runway. Estimated capacity is 7mppa.
• Option 2 widens the runway to accommodate Code D aircraft, provides new
stands on the eastern boundary and a new terminal building. Estimated capacity
is 11mppa.
• Option 3 rotates the runway through 2 degrees to the east to create space for a
500m runway extension. With the runway again widened, a new taxiway system
is provided in addition to new stands and a terminal building. Estimated capacity
is 14mppa.
• Option 4 is effectively an entirely new airport with a category 3 runway 3500m
long and an associated terminal development, taxiway system and apron capable
of accommodating Code F aircraft. Estimated capacity is 31mppa.

SERAS Stage Two: Appraisal Findings Report
59FL1124000.RCE.RP.J03.020131 Appraisal Findings
4.7.8 Forecasts have been produced for Southampton from two sources. SPASM forecasts
produced in Stage Two indicated that usage of Southampton would be heavily dependent on
the provision of runway capacity elsewhere in the south east. In a constrained scenario, with
only the existing runways, Southampton is forecast to attract 3.5 mppa by 2015 and 5.7 mppa
by 2030. In a less constrained scenario, Southampton is forecast to attract 1.6 mppa by 2015
and 2.7 mppa by 2030. A separate Stage One forecast for the small sites suggested maximum
forecasts of 2.4 mppa by 2015 and 3.7 mppa by 2030, in the middle of the subsequently
modelled ranges
Alconbury and Hullavington
4.7.9 Optioneering work at Alconbury and Hullavington is described in two Stage One reports:
• Alconbury: Airport Optioneering, Halcrow, February 2001,
• RAF Hullavington: Capacity Development Options, Scott Wilson, April 2001.
4.7.10 Summary Appraisal work for both was described in a further Stage One report:
• Stage One: Alconbury and Hullavington, Halcrow, August 2001
4.7.11 Alconbury and Hullavington are both former military airfields retaining certain operational
facilities that were seen as having the potential to serve air freight and low cost passenger
services in particular.
4.7.12 Both were selected for appraisal on the basis that they are accessible to the south east market,
well connected to road and rail surface access infrastructure and sufficiently remote from large
population centres to allow the possibility of night-time operations.
Alconbury
4.7.13 The Options appraised at Alconbury were:
• Option 1 – General Air Freight and Express Parcel Hub. As a regional centre for
air freight operations, 24 hour movement capability would enable an annual
throughput of 1 million tonnes and attract an express parcel hubbing operation. It
also includes an aircraft maintenance facility to meet the on-line needs of the freight
aircraft fleet, a GA and Business Aviation base similar to the scale of facilities offered
at Farnborough and a business park area to accommodate a variety of commercial
developments.
SERAS Stage Two: Appraisal Findings Report
60FL1124000.RCE.RP.J03.020131 Appraisal Findings
• Option 2 – General Air Freight, Express Parcel Centre and AircraftMaintenance Centre. In addition to the air freight and express parcel facilities
included under Option One, this option includes for a major third-party aircraft
maintenance capability, on the assumption that in the event of significant
development occurring here then Cambridge Airport would be closed. A level of
facility was assumed that would be able to accommodate the entirety of the Marshall
Aerospace operations from that site. The GA and Business Aviation facilities are
retained and the assumption made that the latter would be of sufficient capacity to
absorb the small volume of activity in that sector from Cambridge. The business
park area is also retained.
• Option 3 – Specialised Low Cost Passenger Airport with General Air Cargo,
Express Parcel Centre and Aircraft Maintenance Capabilities. In this option the
GA and Business Aviation facilities provided in Option 2 are retained, whilst the area
dedicated to the business park is substantially reduced. Area is made available
instead for a 5mppa capacity low cost passenger terminal with associated airside
and landside facilities, sited to the south of the runway, adjacent to the village of
Little Stukely.
Hullavington
4.7.14 The Options appraised at Hullavington were:
• Option A – Dedicated Low Cost Airport. This option comprises a 2000m runway
parallel to that at RAF Lyneham on a ENE-WSW alignment. The runway would be
able to accommodate aircraft types typically used for low cost operations and would
be situated to the south of the site as far from the village of Hullavington as is
practically possible. Facilities to accommodate 10mppa would be provided together
with a small GA and aircraft maintenance capability. Surface access improvements
would include new airport access roads and a new rail station on the Great Western
Mainline.
• Option B – Dedicated Freight Airport. Similar to Alconbury Option 1, this option
assumes a facility capable of handling 1 million tonnes of freight per annum. The
single 2400m runway would be aligned as in Option A, but would extend beyond the
current airfield boundary to allow the retention of the RAF barracks. The small GA
and aircraft maintenance facilties are retained and a freight terminal and transfer
facility to the south of the runway would be served by road and rail loop from the
Great Western Mainline.
• Option C – Combined Low Cost and Freight Airport. This option combines
Options A and B, with capacities of 10mppa and 1 million tonnes of general air
freight per annum. The barracks would be lost through siting of the passenger and

SERAS Stage Two: Appraisal Findings Report
61FL1124000.RCE.RP.J03.020131 Appraisal Findings
cargo handling facilities, whilst the maintenance facility to the north of the runway
would be screened from the village of Hullavington by an earth bund. A small GA
facility would also be provided to the south.
4.8 Small Sites
4.8.1 Related SERAS work, notably the DTLR’s South East Business Aviation Study, indicated that
the region’s smaller airports and aerodromes may also have an important part to play in
handling overall passenger and freight traffic. The smaller sites currently serve the Business
Aviation and General Aviation sectors, although some can accommodate scheduled and
chartered passenger services on a small scale.
4.8.2 The pressure on the region’s main airports to fill capacity with higher volume, higher yielding
passenger services will tend to force GA and Business Aviation operators to look elsewhere for
slot capacity and affordable facilities, further reinforcing the important contribution that the
smaller sites are likely to play in these sectors.
4.8.3 Also, pressure of demand for finite capacity and prevailing slot allocation rules are making it
increasingly difficult for new-entrant carriers to access the market or for existing carriers to open
new routes. Domestic, ‘thin’ routes and low cost operations are being disadvantaged by the
favourable climate for larger aircraft on higher-yield routes and it is here where some of the
smaller sites may conceivably make a valuable contribution.
4.8.4 Some were formerly military bases and so have relatively long runways and many are located
away from major population centres, allowing for potential traffic growth with a low
environmental impact. All are going concerns with basic operational infrastructure in place to
allow development to support commercial services.
4.8.5 Development possibilities at small airport sites were addressed in two Stage One reports:
• Small Airports Optioneering, Halcrow, December 2000
• Small Airports – Demand and Impact Appraisal, Halcrow, July 2001
4.8.6 Two supporting studies were used to inform the Demand and Impact Appraisal work. They
provided forecasts of the potential for commercial air service activity at the small sites but took
two different approaches. One took a quantitative approach, based on assumptions about the
amount of traffic likely to be displaced from the major airports, and generated forecasts of
passengers, ATMs and freight. The other concentrated on passengers only and generated
forecasts from an airline standpoint where judgements were made on which routes and services
carriers might be willing to operate at each site and what level of demand might be required to

SERAS Stage Two: Appraisal Findings Report
62FL1124000.RCE.RP.J03.020131 Appraisal Findings
make those services commercially viable. It should be noted that no attempt was made to
refine the optioneering further to reflect the forecasts.
4.8.7 The small site work encompassed the following airports: Biggin Hill, Cambridge, Farnborough,
Lydd, Manston, Norwich, Shoreham and Southend. Southampton was included in the
forecasting studies, but, for optioneering, was treated as a main airport site and has been
described separately above. The primary features of the options appraised at each of the small
airport sites are summarised briefly below. The appraisal of these options is summarised in
Chapter 13.
Biggin Hill
4.8.8 In addition to its traditional role as an executive aviation facility, it was initially conceived that the
proximity of the airport to large centres of population would give Biggin Hill the potential to fulfil
a significant role in the scheduled and leisure charter passenger markets. Optioneering was
therefore targeted at a capacity in the order of 10mppa and a single option developed making
use of all existing developed areas plus all the land to the east of the runway under current
airport ownership. In addition to a substantial Business Aviation capability and aircraft
maintenance facilities, the option provides capacity of 8.6 mppa, constrained by the land area
available.
4.8.9 Although arriving and departing aircraft could be routed to largely avoid residential areas, the
fact that the average aircraft size would increase substantially would lead to a high
environmental impact in noise terms. Substantial improvements to the local road network would
be required, perhaps in addition to extension of the Croydon Tramlink, giving a direct link to
mainline rail services to London via East Croydon. The principal constraint to development is
likely to be airspace congestion where there would be major interaction with airspace corridors
to Heathrow, Gatwick and Stansted.
4.8.10 The forecasting work subsequently identified a domestic and EC scheduled and non-scheduled
demand in the range 300,000 to 500,000 passengers per annum (ppa) at 2015 and 500,000 to
800,000 ppa at 2030. With mainly regional jets this equated to approximately 7,000 forecast
ATMs at 2015 and 9,400 at 2030. Freight forecasts showed an annual throughput of 2,500
tonnes at 2015 and 3,500 tonnes at 2030, all carried on passenger aircraft.
Cambridge
4.8.11 The main tenant at Cambridge is Marshall Aerospace with its primary function of providing
access for aircraft to an extensive range of maintenance, repair and modification facilities.
Whilst it has a limited local catchment, European commercial services would be supported by a
strong local business base and good access to a wider area via the M11. Three options were
explored:

SERAS Stage Two: Appraisal Findings Report
63FL1124000.RCE.RP.J03.020131 Appraisal Findings
• Option 1 requires a shift of the existing runway to the north east to accommodate
the latest 300m RESA requirements, without which a civil operating licence could
not be secured. This shift would require the diversion of the A1303 road. With a
runway length of approximately 1800m, B737 operations could be supported,
likely to be the dominant aircraft for European scheduled, low cost and charter
services. For a handling capacity of 5 mppa, terminal and related facilities would
be located on the southern side of the runway with a new highway connection to
the A45. A rail link would be provided direct to the terminal area to facilitate a
connection to Cambridge itself.
• Option 2 extends the runway to 2270m which would expand the range of services
to include transatlantic charters, using aircraft such as the B767-300ER, and
higher capacity European charter flights. As with Option 1, the target capacity is
retained at 5 mppa to reflect the airport’s perceived catchment limitations.
• Option 3 serves the same markets as Option 1 but attempts to limit noise
exposure to areas to the south west of the airport. It shifts the runway 300m to
the north west to achieve the length provided in Option 1.
4.8.12 The principal constraint to development at Cambridge would be noise impact, although Option 3
would mitigate that by increasing the over-flight altitude. The overall effect on the local road
network would be positive with infrastructure being provided to give more direct access to the
A45 and M11.
4.8.13 Forecasts identify potential passenger demand in the range 1.6 to 1.9 mppa at 2015 and 3.2 to
3.4 mppa at 2030. With mainly B737-type aircraft, 28,000 ATMs are forecast at 2015 and
37,500 at 2030. Freight would be carried on passenger aircraft and could reach 12,500 tonnes
at 2015 and 18,500 tonnes at 2030.
Farnborough
4.8.14 The TAG Group, which owns Farnborough Aviation, the single ‘fixed base operator’ at the
DERA-administered MoD site, has made re-configuration proposals to develop the aerodrome
entirely for Business Aviation and supporting activities, including aircraft maintenance. With
large parts of the site needing to be reserved for the biennial staging of the SBAC air show,
optioneering focused primarily on whether the 2600m potential runway length could also
support commercial traffic in addition to the Business Aviation market. Two options were
assessed:
• Option 1 reflected the current Business Aviation aspirations, with an externally
imposed limit of 25,000 ATMs per year and aircraft up to a MTOW of 40 tonnes.
SERAS Stage Two: Appraisal Findings Report
64FL1124000.RCE.RP.J03.020131 Appraisal Findings
The predominance of business related traffic would restrict the passenger
numbers to a low figure of approximately 100,000.
• The runway availability in Option 2 accommodates the largest business jets,
which are simply variants of commercial airliners such as the B737-based BBJ
and similar Airbus types. It would therefore be feasible under this option to
support commercial passenger services on European routes in the scheduled,
low cost and low volume charter markets. Constrained by land availability north
of the runway, the optioneering capacity was determined at 6 mppa.
4.8.15 With both options being accommodated within the existing site boundary, the principal
constraint to development would be airspace interaction with Heathrow and Gatwick and a high
noise impact with Option 2 on the south westerly heading.
Lydd
4.8.16 With the exception of a twice-daily scheduled Lydd-Shoreham-LeTouquet service operated by
Skytrek, the predominant activity at Lydd is GA and training flights. There is little commercial
activity apart from a small aircraft maintenance and modification business and a number of
flying schools. The former owner, Atlantic Bridge, established a ten year development plan
which built on an initial phase to ‘prove’ the market for small scale scheduled services through
to a final phase targeting the potential growth generated by continuing pressure on the main
London airports. However, in view of the general absence of physical constraints both on and
around the site, optioneering aimed at exploring the potential for large scale passenger and
freight operations. Three options were developed, based on increasing levels of runway
capability:
• Option 1 would restrict operations to BAe 146 sized aircraft, mainly serving the
shorter haul domestic and European scheduled and low volume charter services.
Maintaining current levels of maintenance and support facilities, capacity would
be constrained by land availability to approximately 2 mppa.
• Option 2 would widen the runway to 45m and allow the facility to extend beyond
the current site boundary. Similar markets to Option 1 would be served but over
longer sectors and at higher loads. To handle a throughput of 5mppa a rail link to
Ashford with connections elsewhere via CTRL is included.
• Option 3 exploits surrounding land to yield maximum practical capacity. A full
code 4D facility with a runway length of 2450m would be provided for a high
target throughput of 25 mppa. Using aircraft up to B767 or A310 size, accessible
markets would be east coast USA and the Middle East. Additionally, to take
SERAS Stage Two: Appraisal Findings Report
65FL1124000.RCE.RP.J03.020131 Appraisal Findings
advantage of a potential 24 hour operating period, a freight capacity of 200,000
tonnes per year is assumed.
4.8.17 Options 1 and 2 have relatively little land take impact but Option 3 requires extensive land
acquisition. With relatively low noise impact, except in Option 3 where properties to the east
would be significantly affected, the principal impediment to development potential would be the
remote location of the airport relative to target markets.
4.8.18 Forecasts identified passenger demand of approximately 130,000 at 2030 with 1,500 annual
ATMs carrying 15,500 tonnes of freight, mostly to and from north west Europe on freighter
aircraft.
Manston
4.8.19 To reflect the absence of significant physical constraints and the current owners’ development
plans to expand the former military base to take advantage of the perceived lack of capacity at
the region’s main airports, optioneering focused on large scale passenger and freight
development potential. Two options were explored, one to handle 10mppa and the other
30mppa, but both with the added capability of accommodating 0.5 million annual tonnes of
freight and major aircraft maintenance facilities. Both would target the full spectrum of air
services, including long haul scheduled and charters utilising a range of aircraft up to the B747.
4.8.20 Similar in configuration to the current proposals, Option 1 aims to maximise capacity within the
current site boundary, extending the runway by 450m to 3200m with a full parallel taxiway. The
whole of the available land with airside frontage is developed for passenger terminal/ apron and
freight facilities, whilst land to the north is used for aircraft maintenance hangar development.
4.8.21 Option 2 is developed from Option 1, with the aim of matching terminal capacity to runway
capacity. With extended terminal, apron and parking areas the passenger capacity is raised to
30 mppa. Although freight and maintenance areas are kept at the same level, this option would
require a significant amount of additional land, taking a number of residential and commercial
properties and the whole of the RAF facilities. A rail link would be provided, which would
connect to Ashford and the London/CTRL services.
4.8.22 The principal constraint to development would be an increase in noise exposure at the new
levels of activity, particularly on the approach path over Ramsgate to the east. Although there
are no local airspace restrictions, Manston lies beneath some of the busiest cross channel
airways giving access to Europe and so movements would need to share airspace capacity with
heavy traffic flows to and from the main London airports.
4.8.23 Stage One forecasts indicated that Manston could support domestic, EC and non-EC scheduled
and non-scheduled services, including long haul. Passenger numbers are forecast to rise from

SERAS Stage Two: Appraisal Findings Report
66FL1124000.RCE.RP.J03.020131 Appraisal Findings
current levels of only 7,000 passengers a year to an upper figure of 1.6 mppa in 2015 and 2.7
mppa in 2030. Comprising mainly regional jets with a few charter aircraft of B757 type, forecast
ATMs reach 15,000 in 2015 and 20,400 in 2030. Forecast freight tonnages reach 118,000
tonnes in 2015 and 168,000 tonnes in 2030, mostly carried on long-haul freighter aircraft.
Norwich
4.8.24 Just a single option was explored at Norwich, corresponding closely to the development
proposals advanced by the current operator, Norwich Airport Ltd. Recognising the airport’s
limited catchment area and proximity to Stansted, growth scenarios of between 2 and 4 mppa in
2030 have been projected in both scheduled and charter business and in the capture of the
whole of the southern North Sea oil helicopter operations from the current one-third market
share. For optioneering, the view was taken that the potential of the airport would always
essentially be constrained by its distance from major demand concentrations and although
much has been done already to capture local demand there are limitations on how far this could
be perpetuated. Low cost operations based on ease of air access, fast turnaround and low
airport costs are one possible source of new traffic and so a slightly higher level of passenger
activity of 5 mppa was used as the basis for option development.
4.8.25 The layout retains the existing runway length of 1800m with additional terminal, apron and
parking areas based around the expansion of the existing facilities. A dedicated helicopter
terminal is provided and to create opportunities for revenue generation areas in the north of the
site not required for operational purposes are allocated for GA, Business Aviation and further
maintenance activity. Land in the north west corner of the site, fronting the A140, would be set
aside for general commercial development.
4.8.26 In impact terms the proposed north side developments are contrary to local planning policy as it
is currently formulated, being considered as encroachment into a strategic gap. The
development option would increase activity levels and average aircraft size but, particularly if
further residential building in sensitive areas is controlled, potential noise exposure is likely to
remain low as a result of both approach and departure tracks being over relatively open
countryside. Any substantial increase in activity would require improvements to be made to the
local road network and, although there is no scope for a direct rail link, local bus connection into
the city could offer some reduction in car access.
4.8.27 The separate demand appraisal work showed that from a current level of 375,000 passengers a
year, activity could grow to a level in the range 0.6 to 1.1 mppa in 2015 and 1.1 to 1.8 mppa in
2030. With a mixture of regional jets and B737 type aircraft, this constitutes annual ATMs of
16,500 in 2015 and 21,500 in 2030. Stage Two SPASM forecasts, which include Norwich but
not, for example, Cambridge or Southend Airports in national passenger allocations, suggest
that by 2015 Norwich could accommodate 0.5 to 0.7 mppa, and, by 2030, 0.7 to 4.4 mppa,
depending on the capacity provided at other airports in the south east.

SERAS Stage Two: Appraisal Findings Report
67FL1124000.RCE.RP.J03.020131 Appraisal Findings
4.8.28 A further point to note with Norwich is the concept that it could possibly relocate to RAF
Coltishall, should the RAF base become surplus to MoD requirements. Situated some 8 km
from the current site, initial examination has shown that the base could accommodate the scale
of operations envisaged at Norwich but the impact on the local road network would be high and
the site is further removed from centres of demand and labour.
Shoreham
4.8.29 In planning terms, the physical limitations of the site at Shoreham preclude consideration of the
development on a scale significantly greater than that contemplated in current airport proposals.
It is the airport operator’s belief that, based on the perceived level of prosperity and economic
activity in its catchment, and its relative ease of access from the M25 and areas on the southern
edge of Greater London, the airport has the potential to attract increased numbers of business-
oriented air services, both corporate/air taxi and scheduled. Some one quarter of the 80,000
current annual movements a year are training circuits, the remainder being a mixture of leisure
and private activity, some air taxi and private business flying, with the only scheduled service
being the Skytrek service to Le Touquet which originates from Lydd.
4.8.30 Optioneering focused on maximising capacity based on a realigned and extended main runway,
with an alternative option being entirely within the existing boundary:
• Option 1 retains the existing 825m long runway, which, with a slightly steeper than
average approach slope due the high ground to the north, limits use to aircraft of
large turboprop size with STOL capabilities, such as the de-Havilland Dash-7. With
traffic likely to be limited to short haul domestic and European services, Business
Aviation and GA, the capacity was set at 3 to 3.5 mppa. A new terminal would be
aligned parallel to the runway, road access would be by the present route and a new
rail station on the adjacent South Coast line would be envisaged.
• Option 2 would re-align and extend the runway to 1800m allowing operations by
B737 and similar aircraft. The markets served would be the same as in Option 1 but
to more distant destinations and with the potential to attract low cost operations.
Requiring the acquisition of land to the west this option would have a capacity of 5
mppa.
4.8.31 Although the area immediately around the site is generally open there is dense residential
development less than 1 km away on three sides. Option 2 increases aircraft size and
introduces more jets, and, with the re-alignment exposing a larger area of housing to the south
west, noise impact would be medium to high.
4.8.32 Forecasts show that passenger activity may rise to 0.5 mppa and 0.7 mppa in 2015 and 2030
respectively, with 12,000 and 17,000 commercial ATMs at the same horizon years. Freight
SERAS Stage Two: Appraisal Findings Report
68FL1124000.RCE.RP.J03.020131 Appraisal Findings
activity is likely to be minimal with only 1,500 annual tones being forecast in 2030 being carried
on passenger aircraft.
Southend
4.8.33 Of the 61,000 current annual ATMs at Southend, 75% are flying club and private movements
with only 2,500 being commercial fixed wing flights. CAA statistics indicate that in 2000
Southend served only 4,000 terminal passengers on scheduled and charter flights. Although
the site accommodates over 50 tenant businesses, engaged in a mixture of maintenance, repair
and refurbishment of aircraft up to B757 size, the potential of the airport is dependent on its
runway length and the degree to which capacity at the main London airports becomes
constrained.
4.8.34 Optioneering considered proposals by the current operators to develop the airport to achieve a
capacity of 10 mppa. This would require an extension of the runway to 1750m to allow the
airport to target low cost operators with possibly some conventional scheduled services and
Business Aviation. Site spatial constraints however restrict expansion possibilites and would
limit potential capacity to approximately 5 mppa. Proposals also include a rail station, offering
frequent services to Liverpool Street.
4.8.35 Land acquisition for the runway extension would require the demolition of a listed church and a
number of other adjacent properties, leading to a high impact in local heritage terms. With a
high proportion of residential and industrial development in surrounding areas, noise exposure
impact would be high as a result of an increased level of activity.
4.8.36 The maximum demand forecast at Southend was 2 mppa in 2030, comprising 24,200 annual
ATMs, mainly of B737 type aircraft with GA and Business Aviation aircraft in addition. Freight
throughput is forecast to be up to 8,000 tonnes in 2030, carried on passenger aircraft.

SERAS Stage Two: Appraisal Findings Report
69FL1124000.RCE.RP.J03.020131 Appraisal Findings
5 Stage Two: Options and Packages
5.1 Options at Each Airport
5.1.1 This section summarises the options that have been appraised at each airport in Stage Two of
SERAS. It also introduces the concept of the Stage Two appraisal Packages, which combine
individual airport options across the system to provide differing levels of system-wide capacity.
5.1.2 Explicit details of each option are provided under the relevant section for each airport in
Chapters 7 to 12. In principle, options at each of the airports fall into the following categories:
• an option which provides the level of capacity currently envisaged in the land use
planning system,
• an option which represents the maximum use of existing runways, and
• a number of options which represent additional runway and terminal capacity at
each airport.
Heathrow
5.1.3 The Heathrow options appraised in Stage Two are:
• Base Case (and Maximum Use of the Existing Runways) – this assumes T5 and
runways as currently envisaged in the land use planning system, operating in the
existing segregated mode;
• Option 1 – assumes that the two existing runways will operate in mixed mode
throughout the operating day;
• Option E1 – a variant of Option 1, with mixed mode operating only between 0700
and 1200 hours, the current practice of runway alternation applying thereafter;
• Option E4 – a new 2000m runway north of the A4, but no aircraft stands,
operating in mixed mode, with the existing runways operating in segregated
mode;
• Option E6 – the same new 2000m runway, serviced by aircraft stands north of the
A4 to minimise runway crossings, all runways operating in mixed mode;
SERAS Stage Two: Appraisal Findings Report
70FL1124000.RCE.RP.J03.020131 Appraisal Findings
• Option E8 – a new 4000m full length runway also to the north of the A4, only one
of the three runways operating in mixed mode at any one time on a rotational
basis.
5.1.4 The assessed annual passenger and ATM capacities for each option can be seen in Table 5.1.
Gatwick
5.1.5 The Gatwick options appraised in Stage Two are:
• Base Case – the current land use planning system;
• Maximum Use of the Existing Runway;
• Option 1 – a new full-length runway 385m south of the existing runway, with no
stagger, operating dependently;
• Option E1 – adds two new full-length runways: one 2900m to the north of the
existing, staggered 2000m west, the other 1035m south of the existing, allowing
independent operations on the three runways with the existing runway in mixed
mode
5.1.6 The assessed annual passenger and ATM capacities for each option can be seen in Table 5.1.
Stansted
5.1.7 The Stansted options appraised in Stage Two are:
• Base Case – the current land use planning system;
• Maximum Use of the Existing Runway;
• Option 5 – one new full-length runway separated from the existing runway by
2450m and with a large stagger, operating in mixed mode;
• Option 11 – adds a further runway to Option 5: a full -length close-parallel runway
to the north west of the existing runway and operating as a dependent pair;
• Option 7 – adds a fourth runway to the three runways in Option 11: a full-length
close-parallel runway to the Option 5 new runway.
5.1.8 The assessed annual passenger and ATM capacities for each option can be seen in Table 5.1.

SERAS Stage Two: Appraisal Findings Report
71FL1124000.RCE.RP.J03.020131 Appraisal Findings
Luton
5.1.9 Luton options appraised in Stage Two:
• Base Case – the current land use planning system;
• Option 2 – new 3000m parallel runway 200m to the south of the existing runway;
• Option E3 – new 3000m runway aligned NNE:SSW and to avoid Someries
Castle;
5.1.10 For both Options 2 and E3, variants to the layouts to accommodate increased freight activity
were assessed. The assessed annual passenger and ATM capacities for each option can be
seen in Table 5.1.
Cliffe Marshes
5.1.11 Between Stages One and Two, a detailed review of options at Cliffe Marshes was undertaken,
with the primary objective of consolidating the potential role of the airport and minimising
environmental impacts. The principal runway orientation at Cliffe Marshes is almost east –
west. A single north east – south west runway to the west has also been appraised. This
runway could only be used when the east – west runways were operated in segregated mode
and would be intended for night-time freight activity. The options that were subsequently
appraised at Stage Two are:
• Option A2(2) – one pair of wide-spaced runways operating in mixed mode;
• Option A2(3) – one pair of wide-spaced runways operating in mixed mode
supplemented by a single NE-SW runway to the west for easterly night-time
arrivals only;
• Option A2(4) – two pairs of close-parallel runways; each pair operating in
dependent segregated mode;
• Option A2(5) – two pairs of close-parallel runways operating in dependent
segregated mode, supplemented by a single NE-SW runway to the west for
easterly night-time arrivals only.
5.1.12 The assessed annual passenger and ATM capacities for each option can be seen in Table 5.1.
SERAS Stage Two: Appraisal Findings Report
72FL1124000.RCE.RP.J03.020131 Appraisal Findings
5.2 Packages of Airport Options
5.2.1 In Stage One of SERAS, options were evaluated and compared at each airport. In Stage Two,
the various available options at each airport have been selected and combined in different ways
into a number of packages to allow consideration of phased capacity improvement across the
system of airports. These packages are broadly categorised as described in the following
paragraphs and are defined in Tables 5.1 to 5.6.
Base Cases (Package 1) (Table 5.1)
5.2.2 The base case at each airport defines the option and its capacity as currently envisaged in the
land use planning system. There is one package which combines the base cases at each of the
existing main airports (Heathrow, Gatwick, Stansted and Luton).
No New Runways (Packages 2, 3 and 4) (Table 5.1)
5.2.3 These packages consist of options that maximise the use of existing runways. At Heathrow, this
includes incremental variants leading to full mixed mode operation.
5.2.4 Luton is a special case in that the maximum use scenario is represented by Option 2 or E3,
which have the same capacity, and entail the replacement of the existing runway but not the
development of an additional runway.
One New Runway: Appraised at 2015 and 2030 (Packages 5a, 5b, 5c, 6 and 7) (Table 5.2)
5.2.5 These packages each add one new runway at one of the existing airports, with the remaining airports in the package being the maximum use of existing options.
5.2.6 Package 5 adds a new runway at Heathrow, with variants a, b and c being the three runway
options that were selected to be carried forward to Stage Two. Packages 6 and 7 add a new
runway at Gatwick and Stansted respectively.
Two New Runways: Appraised at 2015 (Packages 8(i) and 8(ii)) (Table 5.3)
5.2.7 These two packages introduce new runways, at the new site at Cliffe Marshes, with the other
airport options being the maximum use of existing runways. Variant (i) adds a wide-spaced
parallel pair (Option A2(2)), and variant (ii) includes a NE-SW runway to the west of that pair to
take easterly night time freight arrivals only (Option A2(3)).

SERAS Stage Two: Appraisal Findings Report
73FL1124000.RCE.RP.J03.020131 Appraisal Findings
Two New Runways: Appraised at 2030 (Packages 9, 10, 11, 12 and 13) (Table 5.4)
5.2.8 Packages 9 and 10 add two new runways at Gatwick and Stansted respectively, with the
remaining existing airports at maximum use of existing runways status. Cliffe Marshes is
excluded.
5.2.9 Packages 11, 12 and 13 distribute two new runways, one each at Heathrow and Gatwick,
Heathrow and Stansted, and Gatwick and Stansted respectively. In each case the undeveloped airports are taken to be at maximum use of existing runway status.
Three New Runways: Appraised at 2030 (Packages 14 to 20) (Table 5.5)
5.2.10 Packages 14 to 19 distribute three new runways in various combinations at the existing airports,
with undeveloped airports operating in maximum use of existing runway status. Package 20 has
two of the additional three runways at Cliffe Marshes.
Four New Runways: Appraised at 2030 (Packages 21(i) and 21(ii) (Table 5.6))
5.2.11 In this scenario, all four runways are located at Cliffe Marshes, with Heathrow, Gatwick,
Stansted and Luton operating at maximum use of existing runway status. Variant (ii) also has
the single NE-SW runway, again catering only for easterly night time freight arrivals.
5.3 Other Airports
5.3.1 A number of airports have been categorised as small sites and have been included within the
packages under the heading ‘Others’. These have been assumed to contribute a constant level
of additional system capacity, except in Packages 3 and 4, which is higher and includes
Alconbury. Apart from Alconbury, other small sites include Southampton, Biggin Hill,
Cambridge, Farnborough, Lydd, Manston, Norwich, Shoreham and Southend.
5.3.2 The Alconbury option appraised in Stage Two, most notably for noise impacts, is Option 3.
5.3.3 Small site options are described in Chapters 4 and 13.

SERAS Stage Two: Appraisal Findings Report
74FL1124000.RCE.RP.J03.020131 Appraisal Findings
Table 5.1 Base Cases and No New Runways – Pre 2015 (Appraised at 2015) – Options and Passenger Capacities (mppa)
PackageNo. Package Title LHR LGW STN LTN Cliffe ‘Others’
PaxCapacity
mppa
PATM Capacity ‘000 Other Features of Note
1 Base Case86
Base Case
40
Base Case
15
Base Case
10
Base Case
0 5 156
LHR 480LGW 260STN 185LTN 100
Others 50*Total 1,075
Assumes developments currently in the land use planning systemAssumes segregated mode at LHR Assumes T5 at LHR
2
Maximum Use of Existing Runways at LHR, LGW, and STN.Option 2 or E3 at LTN(hereafter referred to as Max Use at LTN)
86
Max Use
46.5
Max Use
35
Max Use
31
Option 2 or
Option E3
0 15 213.5LHR 480LGW 260STN 259LTN 240
Others 150*Total 1,389
Assumes segregated mode at LHRAssumes T5 at LHRAlso appraised at 2030
3
Partial Mixed Mode at LHR, Max Use at LGW, STN and LTN and Max Use of ‘small sites’
91
Option E1
46.5 35 31 0 25 228.5
LHR 497LGW 260STN 259LTN 240
Others 250*Total 1,506
4
Full Mixed Mode at LHR, Max Use at LGW, STN and LTN and Max Use of ‘small sites’
105
Option 1
46.5 35 31 0 25 242.5
LHR 551 LGW 260STN 259LTN 240
Others 250*Total 1,560
* denotes estimate only

SERAS Stage Two: Appraisal Findings Report
75FL1124000.RCE.RP.J03.020131 Appraisal Findings
Table 5.2: One New Runway – Appraised at 2015 and 2030 – Options and Passenger Capacities (mppa)
PackageNo. Package Title LHR LGW STN LTN Cliffe ‘Others’
PaxCapacity
mppa
PATMCapacity
‘000
Other Features of Note
5aOne New Runway -Option E6 at LHR, Max Use LGW, STN and LTN
128
Option E6
46.5 35 31 0 15 255.5
LHR 754LGW 260STN 259LTN 240
Others 150*Total 1,663
5bOne New Runway -Option E4 at LHR, Max Use LGW, STN and LTN
112
Option E4
46.5 35 31 0 15 239.5LHR 655LGW 260STN 259LTN 240
Others 150*Total 1,564
5cOne New Runway -Option E8 at LHR, Max Use LGW, STN and LTN
121
Option E8
46.5 35 31 0 15 248.5
LHR 638LGW 260STN 259LTN 240
Others 150*Total 1,547
6One New Runway -Option 1 at LGW, Max Use LHR, STN and LTN
86 62
Option 1
35 31 0 15 229
LHR 480LGW 378STN 259LTN 240
Others 150*Total 1,507
7One New Runway -Option 5 at STN, Max Use LHR, LGW and LTN
86 46.5 82
Option 5
31 0 15 260.5
LHR 480LGW 260STN513LTN 240
Others 150*Total 1,643

SERAS Stage Two: Appraisal Findings Report
76FL1124000.RCE.RP.J03.020131 Appraisal Findings
Table 5.3: Two New Runways – Appraised at 2015 – Options and Passenger Capacities (mppa)
PackageNo. Package Title LHR LGW STN LTN Cliffe ‘Others’
PaxCapacity
mppa
PATMCapacity
‘000
Other Features of Note
8(i)Two New Runways - both at Cliffe, Max Use LHR, LGW, STN and LTN
86 46.5 35 31 77
Option A2(2)
15 290.5
LHR 480LGW 260STN 259LTN 240CLF 530
Others 150*Total 1,919
8(ii)
Two New Runways (Plus NE/SW Runway) - both at Cliffe, Max Use LHR, LGW, STN and LTN
86 46.5 35 31 77
Option A2(3)
15 290.5
LHR 480LGW 260STN 259LTN 240CLF 530
Others 150*Total 1,919

SERAS Stage Two: Appraisal Findings Report
77FL1124000.RCE.RP.J03.020131 Appraisal Findings
Table 5.4: Two New Runways – Appraised at 2030 – Options and Passenger Capacities (mppa)
PackageNo.
Package Title LHR LGW STN LTN Cliffe ‘Others’Pax
Capacitymppa
PATMCapacity
‘000
Other Features of Note
9Two New Runways - both at LGW. Max Use LHR, STN and LTN
86 115
Option E1
35 31 0 15 282
LHR 480LGW 675STN 259LTN 240
Others 150*Total 1,804
10Two New Runways - both at STN. Max Use LHR, LGW and LTN
86 46.5 102
Option 11
31 0 15 280.5
LHR 480LGW 260STN 637LTN 240
Others 150*Total 1,767
11Two New Rwys - One at LHR and One at LGW. Max Use at STN and LTN
128
Option E6
62
Option 1
35 31 0 15 271
LHR 754LGW 378STN 259LTN 240
Others 150*Total 1,781
12Two New Rwys - One at LHR and One at STN. Max Use at LGW and LTN
128
Option E6
46.5 82
Option 5
31 0 15 295.5
LHR 754LGW 259STN 513LTN 240
Others 150*Total 1,916
13
2030: Two New Rwys - One at LGW and One at STN.Max Use at LGW and LTN
86 62
Option 1
82
Option 5
31 0 15 276
LHR 480LGW 378STN 513LTN 240
Others 150*Total 1,761

SERAS Stage Two: Appraisal Findings Report
78FL1124000.RCE.RP.J03.020131 Appraisal Findings
Table 5.5: Three New Runways – Appraised at 2030 – Options and Passenger Capacities (mppa)
Package
No.Package Title LHR LGW STN LTN Cliffe ‘Others’
Pax
Capacity
mppa
PATM
Capacity
‘000
Other Features of
Note
14Three New Runways - all at STN. Max Use at LHR, LGW and LTN
86 46.5129
Option 7 31 0 15 307.5
LHR 480LGW 260STN 756LTN 240
Others 150*Total 1,886
15Three New Runways - One at LHR, One at LGW and One at STN. Max Use at LTN
128Option E6
62Option 1
82Option 5 31 0 15 318
LHR 754LGW 378STN 513LTN 240
Others 150*Total 2,035
16Three New Runways - One at LHR and Two at STN. Max Use at LGW and LTN
128Option E6 46.5 102
Option 11 31 0 15 315.5
LHR 754LGW 260STN 637LTN 240
Others 150*Total 2,041
17Three New Runways - One at LGW and Two at STN. Max Use at LHR and LTN
86 62Option 1
102Option 11 31 0 15 296
LHR 480LGW 378STN 637LTN 240
Others 150*Total 1,885

SERAS Stage Two: Appraisal Findings Report
79FL1124000.RCE.RP.J03.020131 Appraisal Findings
Package
No.Package Title LHR LGW STN LTN Cliffe ‘Others’
Pax
Capacity
mppa
PATM
Capacity
‘000
Other Features of
Note
18Three New Runways - One at LHR and Two at LGW. Max Use at STN and LTN
128Option E6
115Option E1 35 31 0 15 324
LHR 754LGW 675STN 259LTN 240
Others 150*Total 2,078
192030: Three New Runways -Two at LGW and One at STN.Max Use at LHR and LTN
86115
Option E182
Option 5 31 0 15 339
LHR 480LGW 675STN 513LTN 240
Others 150*Total 2,058
202030: Three New Runways -One at LGW and Two at Cliffe. Max Use at LHR and LTN
86 62Option 1
35 31 77Option A2(2)
15 306
LHR 480LGW 378STN 259LTN 240CLF 530
Others 150*Total 2,037

SERAS Stage Two: Appraisal Findings Report
80FL1124000.RCE.RP.J03.020131 Appraisal Findings
Table 5.6: Four New Runways – Appraised at 2030 – Options and Passenger Capacities (mppa)
Package No. Package Title LHR LGW STN LTN Cliffe ‘Others’Pax Capacity
mppa
PATM
Capacity ‘000
Other
Features of
Note
21 (i)
2030: Four New Runways – all at Cliffe. Max Use at LHR, LGW, STN and LTN
86 46.5 35 31 113
Option A2 (4)
15 326.5LHR 480LGW 260STN 259LTN 240CLF 781
Others 150*Total 2,170
21 (ii)
2030: Four New Runways (Plus NE/SW Runway) – all at Cliffe. Max Use LHR, LGW, STN and LTN
86 46.5 35 31 113
Option A2 (5)
15 326.5
LHR 480LGW 260STN 259LTN 240CLF 781
Others 150*Total 2,170

SERAS Stage Two: Appraisal Findings Report
FL1124000.RCE.RP.Jo3.020131.Appraisal Findings 81
6 Stage Two: Appraisal Process
6.1 Introduction
6.1.1 This chapter introduces the appraisal processes applied in Stage Two of SERAS principally to
give guidance in interpreting the findings presented in following chapters. It does this by setting
out the key principles and assumptions underlying the appraisals. This is not intended to be a
full, detailed methodology statement. The Stage Two Methodology report and its supporting
documents are intended to provide the fuller detail.
6.1.2 In SERAS, two main appraisal years, of 2015 and 2030, have been used. As explained in
Chapter 5, options involving no new runways, one new runway or two runways at Cliffe
Marshes have been appraised in 2015. Larger options have been appraised in 2030. The
appraisal of options is carried out relative to a base case. In this case, two bases are possible:
• The provision of facilities and capacity already allowed for in the land-use planning
system represents a ‘do-minimum’ and is more appropriate as a shorter term (2015)
base; and
• For the longer term (2030) this might be deemed too restrictive a base and an
unrealistic basis against which to estimate the impacts of options. It has been
assumed in the 2030 appraisals that a better basis for comparison will be the
maximum use of existing runways. There are several reasons for this. No major
addition to capacity – a new runway, for example – is likely until, we assume, 2011.
By this time the pressure of growing demand will have brought forward airports’
applications for additional capacity. So, for options with more than one runway, it
has been assumed that permissions will have been given for existing runways to
operate at their capacity.
6.1.3 The principal differences between these two base case scenarios arise at Stansted and Luton.
At Heathrow, there is no difference: T5 is assumed in both cases. At Gatwick, there are no
extra facilities, but there is significantly more throughput.
6.1.4 The SERAS appraisal process is wide-ranging. In different areas of the appraisal process it has
been found helpful, in order to capture the full range of impacts or to present impacts in forecast
years against known current conditions, to use different bases for comparison. The bases used
for the principal assessments of impacts are as follows:

SERAS Stage Two: Appraisal Findings Report
FL1124000.RCE.RP.Jo3.020131.Appraisal Findings 82
• The principal cost estimates are expressed as the incremental costs of options
over airport layouts which allow maximum use of the existing runways.
• The economic and financial impacts of options are appraised against a base of
the maximum use of the existing runways. The economic and financial impacts
of making maximum use of existing runways, relative to maintaining only those
capacities envisaged in the land-use planning system are separately estimated.
• Surface access impacts of options in 2015 are assessed relative to the airport
options as currently envisaged in the land-use planning system. In 2030, they
are assessed relative to options which make maximum use of existing runways.
• Land take impacts are assessed relative to airport layouts currently envisaged in
the land-use planning system, so that the full impacts of options are identified.
• Local air quality impacts are assessed using numbers of people exposed to
'exceedances' of the pollution concentration statistic embodied in UK Air Quality
Regulations 2000.
• Aircraft noise impacts are expressed relative to future year base cases
(operations currently envisaged in the land-use planning system for 2015 and
maximum use of existing runways for 2030) and against current or recent
observed noise levels so that forecast noise levels can better be set in context.
6.1.5 In this chapter principal elements of the SERAS appraisal process and assumptions underlying
the different parts of the appraisal process are set out.
6.2 Appraisal of Options and Packages
6.2.1 Many of the impacts of airport options can be identified on an option by option basis. Some
impacts can only be addressed for the South East airports as a system or at a national level.
Chapters 7 to 11 identify the impacts of the options appraised at Heathrow, Gatwick, Stansted,
Luton and Cliffe Marshes. The principal impacts addressed in this way are: option costs; traffic
forecasts; safety risk; surface access; environmental impacts - land take, water resources,
noise, local air quality; employment; land use and urbanisation; regional impacts; social
impacts; and impacts in relation to integration.
6.2.2 Some of these impacts are determined by airport layouts: others are related to the passenger
and freight traffic forecast to use an option. But the traffic forecasting has to recognise the
interactions between airports, so can only be undertaken on a package basis. Forecasts have
been made for all of the packages listed in Tables 5.1. to 5.6. The appraisal of options was
based on forecast use of each option in a ‘representative case’ forecast. Typically, the

SERAS Stage Two: Appraisal Findings Report
FL1124000.RCE.RP.Jo3.020131.Appraisal Findings 83
representative case for each option has been taken as the forecast for an option when it is
combined with the least amount of development at other airports. Normally the assumption is
that the airport option is added to ‘maximum use of existing runways’ at all other airports.
6.2.3 A number of areas of the appraisal required the best available traffic (passenger and ATM)
forecasts to be provided as inputs. In particular: airport employment forecasts are dependent
on forecast airport use by passengers and air freight; surface access modelling requires airport
passenger and employment forecasts; noise and air quality modelling requires ATM and
surface access forecasts; employment forecasts feed into the appraisal of land use and
urbanisation impacts.
6.2.4 In order to meet the study’s timetable, these downstream appraisal activities had to proceed
with the best available forecasts at the time, but subsequent refinements to the SPASM
forecasting model meant that the earlier forecasts used in these downstream parts of the
appraisal process differ to a small degree from the forecasts presented in this report. A
comparative review of the different forecasts confirms that the surface access, noise, air quality
and land use/urbanisation findings reported here would not be materially different if final
forecasts had been used.
6.2.5 The principal impacts that are addressed on a package basis, with results described in Chapter
14, are the economic and financial impacts, wider economic impacts and global air quality
impacts.
6.3 Capital Costs
6.3.1 Capital cost estimates have been presented in a standardised spreadsheet format to ensure a
comprehensive coverage of items and consistency of approach between options.
6.3.2 A common set of rates was applied to all major capital cost items such as terminals, satellites,
pavements, car parking, hangars, cargo and maintenance buildings. These were determined
from a range of rates used by the various optioneers at Stage One and from published
estimating data. This common set of rates guards against significant over or under estimating
and enables inter-airport comparisons to be made with a reasonable degree of confidence.
6.3.3 Where the level of detail applied to the optioneering did not allow sensible measurable
quantities to be determined, single ‘sums’ have been used. Typically these items have a much
less significant effect on the total costs than the major measurable items.
6.3.4 Figures in the Cost Estimate Tables are rounded to the nearest £ million and all costs are those
applicable at year 2000.
6.3.5 With the current level of scheme development, the estimating tolerance is considered to be in
the order of plus or minus 25%.

SERAS Stage Two: Appraisal Findings Report
FL1124000.RCE.RP.Jo3.020131.Appraisal Findings 84
Surface Access Scheme Costs
6.3.6 A breakdown of surface access costs is presented in a separate table. These include the
construction of road and rail access routes considered to be necessary for new airport layouts
or to cater for additional airport capacity. The cost of road diversions, either around or under an
airport footprint is included in enabling works. These scheme costs have been included in
economic and financial appraisals of options. Separately identified are estimates of the costs of
providing additional capacity on the strategic road networks which is only in part required for
higher volumes of airport traffic.
6.3.7 In some areas, the provision of additional airport capacity will bring forward the need for
interventions (or schemes) in order to deal with potential congestion on the strategic road
network. Schemes to be brought forward are of two types:
• Schemes that are triggered by airport capacity provision, and which would not
otherwise be needed within the forecasting period; and
• Schemes that would be required in any event, even without new airport capacity.
6.3.8 The surface access costs included in the Stage 2 appraisals include the full estimated costs of
schemes triggered by airport development. For those schemes required to serve a particular
airport option, initial estimates of when they would be needed have been made, both with and
without the additional airport capacity. Based on this analysis, the cost of bringing forward
schemes has been estimated, as the difference between the present year value of the scheme
costs, discounted from the respective years in which they would be needed. This process
would, of course, reduce the surface access costs attributable to the airport option, although
this reduction was found to be very small relative to the overall airport costs.
6.3.9 Conversely, those schemes that, based on the SERAS background assumptions, are required
without any new runways, may need to be brought forward if additional airport capacity is
provided nearby. However, since most of these schemes would be required by 2015 – and the
additional airport capacity could not be provided much before that date – the additional costs of
bringing forward such schemes will be small and has not been estimated at this stage.
6.3.10 It should be noted that, at Cliffe Marshes, it was assumed that the need for a (road and rail )
Lower Thames Crossing would pre-date the airport. The costs of the road and rail Lower
Thames Crossing were therefore excluded from the Cliffe airport infrastructure costs.
Details of Cost Estimates
6.3.11 The following are excluded from the capital cost estimates:
• Public Inquiry costs
SERAS Stage Two: Appraisal Findings Report
FL1124000.RCE.RP.Jo3.020131.Appraisal Findings 85
• Marketing
• Legal costs
• Environmental mitigation measures
• Compensation to affected communities & companies adjacent to the
development.
• Ground contamination
• Effects of timing of construction works, eg out of sequence working
• Hotels
• Demolition at end of useful life
• Relocation of disturbed structures
• Value Added Tax
6.3.12 Contingencies are shown as a separate line item in the estimates and have been added at a
rate of 25% of airport development costs. These are intended to cover design reserve and site
contingencies. Design reserve would be expected to reduce as design development advances.
Site contingencies are allowances for unforeseen site factors such as deleterious ground
conditions and post-tender design changes.
6.3.13 On-costs are also within this separate line item and attract the same rate of 25% of airport
development costs. These are intended to cover professional design fees, planning fees,
specialist consultants’ fees, construction/project management fees, insurances and site
preliminaries.
6.3.14 Land costs include compulsory purchase compensation and have been established from data
published in the Valuation Office Property Market Report, Autumn 2000, and additional local
house price data available in the public domain. Reference was made to DETR Review of
Compulsory Purchase and Compensation, published in July 2001. No account has been taken
of compensation payments outwith the footprint of the airport.
6.3.15 To reflect the higher cost of capital works in the Greater London area, rates at Heathrow have
been inflated by 10% relative to the other airport sites. For similar reasons, rates at Alconbury
have been deflated by 15% relative to the other airport sites. Rates at all other sites are
consistent. It is probable that at Heathrow, Gatwick and Stansted, BAA could obtain lower
construction rates through framework agreements with their core suppliers.

SERAS Stage Two: Appraisal Findings Report
FL1124000.RCE.RP.Jo3.020131.Appraisal Findings 86
6.3.16 Figures are also presented that show costs per additional million passengers per annum
(mppa), over and above the relevant base case at each airport. This allows easy comparison to
be made between options and airports of the costs of providing additional capacity.
6.3.17 Although it is recognised that some capital cost items will attract a disruption premium for works
on a live operational airfield, these have not been included at this stage. They are likely to
represent only a very small percentage of the total cost and could be considered to be within
the contingency allowance. Nevertheless, they do warrant further examination at a later stage
to determine the relative effects between individual options.
6.3.18 It is also recognised that revenue is likely to be generated at all sites through rental or leasing of
office space, maintenance facilities, hangarage, fuel supply, etc. This has not been included in
financial modelling at this stage but does warrant assessment at a later stage to allow a
balanced appraisal of the relative effects on financial viability between options and airports.
6.4 Demand Forecasts
SPASM
6.4.1 Air passenger demand forecasts and associated ATM forecasts are derived from a new
passenger allocation model developed by DTLR for SERAS and other related studies. The
model – SPASM – is an annual, national passenger allocation model, taking national air travel
demand forecasts, by category, each year from 1998 to 2030, and allocating this demand to
airports. 29 existing UK airports are represented in each SPASM run and there is the facility to
add three new airports into each run.
6.4.2 SPASM works on an annual level. Annual demands are fed in, as are annual airport capacities.
There is no facility within SPASM for addressing the allocation of demand in other periods, eg,
busy summer months or busy days. The capacities fed into SPASM are annual physical
capacities, of runways and terminals, assuming these are used to the full. SPASM’s base year
is 1998. The base capacities input to SPASM have been defined to accommodate 1998 actual
demands. Therefore, on an annual basis, physical runway and terminal capacities are not
exceeded and there are no capacity constraints at any airport in the base year within SPASM.
It is accepted that in reality, at particular times of the day, week and year, there was an excess
of demand over supply at some airports in 1998, which has not been removed subsequently.
6.4.3 The passenger demand allocated in SPASM comes from recent surveys of air passengers
conducted by the CAA and DTLR forecasts of growth in demand. The base year demand is
derived from different CAA surveys of departing passengers at UK airports carried out in 1998
and preceding years. In the case of surveys at airports carried out prior to 1998, surveyed
results have been factored up to 1998 totals. The surveyed data identifies the number of trips
made at each airport sub-divided as follows:

SERAS Stage Two: Appraisal Findings Report
FL1124000.RCE.RP.Jo3.020131.Appraisal Findings 87
• By category: four types of international scheduled air service passengers - UK
residents making business trips, UK residents making leisure trips, foreign
residents making business trips, foreign residents making leisure trips; those
interlining between international flights (I to I interliners); passengers on
international and domestic low cost services; passengers on charter flights;
passengers on domestic scheduled services.
• By UK origin or destination districts. The UK ends of international trips and both
ends of domestic trips are identified for 455 local authority districts in England,
Wales and Scotland (These reflect the 1991 census boundaries used as the
basis for coding CAA survey data. Subsequent reorganisation of districts in
Scotland and the creation of unitary authorites have reduced the number of
administrative areas.)
• For international trips, overseas origins/destinations are grouped into 48 world
zones, some of which represent individual routes – 21 destinations in Europe –
and the others represent groups of routes, eg, United States West and United
States East.
6.4.4 Unconstrained demand forecasts for each year between 1998 and 2030 are produced by
increasing 1998 demand in line with DTLR’s central forecasts in Air Traffic Forecasts for the
United Kingdom, DETR, May 2000 (see Table 2.6). At a national level, forecasts are
constrained to these totals. Within this constraint a lower rate of growth is applied to represent
the greater maturity of the air travel market in the East and South East of England and London.
Within these three regions, the growth rate assumed to 2015 is 1 percentage point per annum
lower than that in the rest of the country.
6.4.5 Passengers are allocated to airports on the basis of the combined cost of surface access
movements between their origin/destination districts and each airport, service frequencies and
shadow costs. A multinomial logit model formulation, calibrated for each trip category, is used
to allocate passengers between direct routes ( origin district – departing airport – arrival airport)
and indirect routes ( origin district – departing airport – interlining airport – arrival airport).
6.4.6 Interlining from regional UK airports is allowed for international scheduled trips at Heathrow,
Gatwick, Manchester, and at Stansted (in packages with a ‘large’ Stansted option) and at Cliffe
Marshes when that airport is open in the UK, and at Paris, Amsterdam, Frankfurt and Brussels.
6.4.7 The surface access costs used in the logit model are a combination of time costs and money
costs and a combination of costs by car and by public transport. Surface access costs used in
the modelling can be changed at intervals between 2000 and 2030. In the SPASM modelling in
SERAS, no specific allowance for new airport-related road schemes has been made, except in
relation to new airport sites. Travel times by car to airports generally increase through time
(travel times are adjusted in 2011 and 2021) as road networks are assumed to become
increasingly congested. Travel times by public transport to/from each airport vary from option to

SERAS Stage Two: Appraisal Findings Report
FL1124000.RCE.RP.Jo3.020131.Appraisal Findings 88
option in SERAS to represent the effects of the rail schemes associated with each option in the
following chapters
6.4.8 The value of additional service frequencies is represented in SPASM via a formula which gives
declining value to each additional daily frequency and incorporates a factor which allows for the
ability of passengers to tailor to a certain extent their arrival times at airports to aircraft
departure times.
Shadow Costs
6.4.9 Shadow costs are market clearing prices which limit demand at an airport for which demand
exceeds capacity to airport capacity. In practice, shadow costs might materialise as higher air
fares or charges for using those airports with the greatest excess demand. They could
ultimately accrue to airports, airlines or governments. With current regulatory and fiscal
policies, and in the absence of a proper market in airport slots, they are likely to accrue to the
airlines. Current regulatory policies limit airport charges and the return on capital at regulated
airports, and current fiscal policies levy the Air Passenger Duty on a flat rate basis at all
airports, irrespective of the balance of demand and capacity.
6.4.10 Shadow costs are generated in SPASM to limit allocated demand at any airport to airport
capacity. Two capacity measures are applied to each airport in each year in each SPASM run:
terminal capacities, expressed in millions of passenger per annum (mppa), and runway
capacities, expressed in ATMs per year. Relevant values for different options at South East
airports are given in Chapter 5. For each airport in each year of a model run, SPASM
determines whether either capacity is reached and, if both are, that for which excess demand is
greater, which becomes the binding capacity constraint. It then develops and tests appropriate
shadow costs (per passenger if terminal capacity is the binding constraint, or, more commonly
in SERAS, per ATM if runway capacity is the binding constraint). ATM shadow costs are
converted into costs per passenger, taking account of passengers per ATM by route. In an
iterative process, shadow costs per passenger are adjusted and passengers reallocated until
allocated passengers and their associated ATMs at each airport are within an accepted
tolerance interval around the defined capacities. The shadow costs generated at an airport in
one year are carried forward as the starting values in developing the next year’s shadow costs
at that airport if capacity has not changed in the meantime.
6.4.11 The application of shadow costs at any airport will push passengers away from the airport
where shadow costs apply, to other airports or out of the UK airport system. It follows that the
lower the capacity provided, more trips will be pushed out of the UK airport system altogether.
Some of the important general effects of shadow costs at SERAS airports are:
• ATM shadow costs are translated into a cost per passenger based on the number
of passengers per ATM on each route. An ATM shadow cost will therefore be a
larger cost per passenger on those routes with smaller aircraft, typically short

SERAS Stage Two: Appraisal Findings Report
FL1124000.RCE.RP.Jo3.020131.Appraisal Findings 89
haul scheduled services, both domestic and international. So, at airports with
ATM shadow costs, those services with larger aircraft and higher load factors (eg,
long haul scheduled) will tend to push out services with using smaller aircraft and
with lower load factors.
• Any shadow cost, other things being equal, will be a larger percentage addition to
the total cost of leisure passengers (who have a lower value of time) than
business passengers (who have a higher value of time). Leisure passengers are
therefore more likely to be pushed away from airports where shadow costs apply
than business passengers.
6.4.12 Shadow costs serve a useful function in estimating the economic surpluses or benefits accruing
from additional capacity. At capacity constrained airports, they are surpluses accruing to
producers (perhaps airlines) at the expense of passengers. Additional capacity will cause
shadow costs to fall, reducing producer surpluses but increasing consumer surpluses. The fall
in shadow costs with the additional capacity is the basis for estimating the benefit to additional
(generated) traffic.
Service frequencies in SPASM
6.4.13 The starting service frequencies in SPASM are actual service frequencies, by type (scheduled
by route, charter, low cost), in 1998. SPASM re-forecasts frequencies each year on the basis of
the allocated number of passengers by route at each airport and a series of graphs which relate
passengers to service frequency, allowing for increases in average aircraft sizes on a route as
the number of passengers grows.
6.4.14 SPASM is a demand-led model, so new services are generated at an airport whenever the
allocated demand is sufficient to justify a commercial frequency and load factor. Services can
decline through time at an airport, for example, when shadow costs push particular passengers
away from an airport, or if a new airport is assumed to open up and attract passengers away
from existing airports.
6.4.15 Allowance had to be made for the very high growth in low cost demand and services between
1998 and 2000, particularly at Stansted, Luton and Liverpool airports. Actual 2000 low cost
service frequencies were fed into SPASM to replace 1998 frequencies. Low cost services can
only be generated within SPASM at user-specified airports.
Principal SPASM Outputs
6.4.16 The output produced from each SPASM run, for each year between 1998 and 2030, falls into
three main categories:

SERAS Stage Two: Appraisal Findings Report
FL1124000.RCE.RP.Jo3.020131.Appraisal Findings 90
• Passenger forecasts, by UK district, by passenger type and by service category
(scheduled services by route, charter, domestic and international low cost, I to I
interlining) at each airport,
• Associated ATMs by route at each airport, and
• ATM or passenger shadow costs at each airport, as appropriate.
Use of SPASM Within SERAS
6.4.17 Within SERAS each core package has been run through SPASM , along with a series of
sensitivity tests and non-core runs. The runway and terminal capacities assumed for each
airport in each package are as set out in Chapter Five. The timing at which capacity
enhancements have been assumed for each package are set out in Table 6.1 for those
packages appraised in 2015 and in Table 6.2 for those packages appraised in 2030.
6.4.18 For packages beyond package 2, the package 2 assumptions hold at each of the main airports
other than those where capacity enhancement is being tested. Generally, where additional
runways are incorporated in a package, they have been assumed to be phased in accordance
with expected commercial pressures, ie, a sequence of Heathrow first, then Gatwick, Stansted
or Cliffe Marshes. The exception is package 20 which has new runways at Cliffe Marshes
introduced before a runway at Gatwick. If a package has two major investments, it is assumed
that the first is in 2011 and the second in 2021. If there are three major investments, the first is
in 2011, the second in 2018 and the third in 2024.

SERAS Stage Two: Appraisal Findings Report
FL1124000.RCE.RP.Jo3.020131.Appraisal Findings 91
Table 6.1: Timing of Capacity Enhancements in SERAS 2015 Core Packages
Package Enhancement
1 ATM capacity at Heathrow is assumed to be 470,000 from 2001 and 480,000 from 2007. Passenger
capacity is assumed to be 70 mppa from 2001 and 86 mppa from 2007
Passenger capacity at Gatwick grows from 35 mppa to 40 mppa in 2005
Passenger capacity at Stansted remains at 15 mppa, runway capacity at 185,000 ATMs
Passenger capacity at Luton increases from 5 mppa to 10 mppa in 2006: runway capacity remains at
100,000 ATMs
2 Heathrow capacities are as in Package 1
Passenger capacity at Gatwick grows from 35 mppa to 40 mppa in 2005 then to 46.5 mppa by 2011.
Passenger capacity at Stansted grows from 15 mppa in 2001 to 35 mppa in 2011 with associated
growth in ATM capacity
Passenger capacity at Luton increases from 10 mppa to 31 mppa in 2011, ATM capacity from 100,000
to 240,000 in 2011
3 Partial mixed mode operation at Heathrow phased in from 2007 (when T5 is assumed to open) to 2011
4 Full mixed mode operation at Heathrow phased in from 2007 (when T5 is assumed to open) to 2011
5A Full mixed mode operation at Heathrow phased in from 2007 (when T5 is assumed to open) to 2011
and new runway and terminal capacity at Heathrow in 2011
5B New runway and terminal capacity at Heathrow from 2011
5C Full mixed mode operation at Heathrow phased in from 2007 (when T5 is assumed to open) to 2011
and new runway and terminal capacity at Heathrow in 2011
6 New runway and terminal capacity at Gatwick from 2011
7 New runway and terminal capacity at Stansted from 2011
8(i), 8(ii) New runway and terminal capacity at Cliffe Marshes from 2011

SERAS Stage Two: Appraisal Findings Report
FL1124000.RCE.RP.Jo3.020131.Appraisal Findings 92
Table 6.2: Timing of Capacity Enhancements in SERAS 2030 Core Packages
Package Enhancement
9 New runway and terminal capacity to 486,000 ATMs and 83 mppa at Gatwick in 2011 and to 675,000
ATMs and 115 mppa in 2021
10 New runway and terminal capacity at Stansted to 513,000 ATMs and 82 mppa in 2011 and to 637,000
ATMs and 102 mppa in 2021
11 Mixed mode operation at Heathrow phased in from 2007. New runway and terminal capacity at
Heathrow (754,000 ATMs and 128 mppa) from 2011, and new runway and terminal capacity at
Gatwick (378,000 ATMs and 62 mppa) from 2021
12 Mixed mode operation at Heathrow phased in from 2007. New runway and terminal capacity at
Heathrow (754,000 ATMs and 128 mppa) from 2011, and new runway and terminal capacity at
Stansted (513,000 ATMs and 82 mppa) from 2021
13 New runway and terminal capacity at Gatwick (378,000 ATMs and 62 mppa) from 2011, and new
runway and terminal capacity at Stansted (513,000 ATMs and 82 mppa) from 2021
14 New runway and terminal capacity at Stansted to 513,000 ATMs and 82 mppa in 2011, to 637,000
ATMs and 102 mppa in 2018 and to 756,000 ATMs and 129 mppa in 2024
15 Mixed mode operation at Heathrow phased in from 2007. New runway and terminal capacity at
Heathrow (754,000 ATMs and 128 mppa) from 2011, new runway and terminal capacity at Gatwick
(378,000 ATMs and 62 mppa) from 2018, and new runway and terminal capacity at Stansted (513,000
ATMs and 82 mppa) from 2024
16 Mixed mode operation at Heathrow phased in from 2007. New runway and terminal capacity at
Heathrow (754,000 ATMs and 128 mppa) from 2011, new runway and terminal capacity at Stansted
(513,000 ATMs and 82 mppa) from 2018, and again from 2024 (637,000 ATMs and 102 mppa)
17 New runway and terminal capacity at Gatwick (378,000 ATMs and 62 mppa) from 2011, new runway
and terminal capacity at Stansted (513,000 ATMs and 82 mppa) from 2018 and again from 2024
(637,000 ATMs and 102 mppa)
18 Mixed mode operation at Heathrow phased in from 2007. New runway and terminal capacity at
Heathrow (754,000 ATMs and 128 mppa) from 2011, new runway and terminal capacity at Gatwick
(486,000 ATMs and 83 mppa) from 2018 and again from 2024 (675,000 ATMs and 115 mppa)
19 New runway and terminal capacity at Gatwick (486,000 ATMs and 83 mppa) from 2011, and again from
2018 (675,000 ATMs and 115 mppa) and new runway and terminal capacity at Stansted (513,000
ATMs and 82 mppa) from 2024
20 New runway and terminal capacity at Cliffe from 2011 (530,000 ATMs and 77 mppa) and new runway
and terminal capacity at Gatwick (378,000 ATMs and 62 mppa) from 2021
21(i), 21(ii) New runway and terminal capacity at Cliffe from 2011 (530,000 ATMs and 77 mppa) and again from
2021 (781,000 ATMs and 113 mppa)
SERAS Stage Two: Appraisal Findings Report
FL1124000.RCE.RP.Jo3.020131.Appraisal Findings 93
Airport Assumptions in SERAS Runs
6.4.19 In all the SERAS runs reported here it is assumed that regional airports are essentially
unconstrained, limiting the overspill from regions outside the South East into South East
airports. In practice, this has been achieved by assuming full use is made of existing runway
capacity at regional airports and additional runway and terminal capacity is provided at both
Manchester and Birmingham Airports in 2021.
6.4.20 Heathrow currently is served almost exclusively by scheduled services. It is assumed that this
will continue and charter and low cost services have been specifically excluded from Heathrow
in the SPASM modelling.
6.4.21 Gatwick is assumed to continue to operate a mixture of scheduled and charter services. Luton
is assumed to continue to operate a mixture of domestic and short haul and USA scheduled
services, charter and low cost services. London City is assumed to operate domestic and short
haul scheduled services only.
Seeding of Services at Stansted and Cliffe Marshes
6.4.22 At Stansted, different assumptions are made for single runway and multi-runway versions. It is
assumed that the services operated at a single runway Stansted will continue to develop from
the current mix of low cost, scheduled and charter services.
6.4.23 For multi-runway Stansted options, services have been ‘seeded’ within SPASM to represent a
change in the role of the airport. Similarly, services have been seeded at the new Cliffe
Marshes airport. Seeding effectively means that an operator or operators moves a major
tranche of services to an airport as a new runway or the airport opens. In the case of scheduled
services, for example, the seeding assumption is roughly based on the notion of the second
largest alliance currently operating at South East airports taking its services to the seeded
airport. SPASM assumes that the seeded service frequencies exist and uses them in the
allocation of passengers between the seeded and other, competing airports. No reduction is
made in service frequencies at the existing airports in this allocation process.
6.4.24 At Stansted, initial forecasts showed that current charter, low cost and short haul scheduled
services continued to grow, so seeding was confined to long haul and USA scheduled services.
Service frequencies representing 40% of Heathrow’s 1998 scheduled long haul and USA
services were assumed for multi-runway Stansted options in 2011.
6.4.25 At Cliffe Marshes, where no services at all exist prior to 2011, the seeded service frequencies
amount to 40% of Heathrow’s 1998 scheduled services, 23% of Gatwick’s 1998 charter
services and 11% of Stansted’s 2000 low cost services.
6.4.26 In many of the cases where services have been seeded in this way, a comparative unseeded
model run has been made so that the effect of seeding can be seen. In addition, a commercial

SERAS Stage Two: Appraisal Findings Report
FL1124000.RCE.RP.Jo3.020131.Appraisal Findings 94
viability test is applied to the seeded services, by comparing forecast frequencies at a
commercially viable load factor with the input seeded frequencies. If these are comparable it
can be assumed the seeded services are viable and likely to remain. If forecast frequencies are
lower than seeded frequencies, load factors will fall short of those necessary for commercial
viability and the seeded services may not survive.
Sensitivity Tests and Non-Core Runs
6.4.27 Sensitivity tests that have been run through SPASM, and through economic and financial
appraisals, fall into three categories:
• running Stansted or Cliffe Marshes options without seeding,
• infrastructure changes in core packages such as changes to runway phasing or
runway options, and
• the effects on air travel demand of applying ‘environmental taxes’ in support of
Government policy that aviation should bear its full costs, including external
costs.
6.4.28 Seeding: Core runs 7 and 14 have been run without seeding at Stansted, and core runs 8 and
21 without seeding at Cliffe Marshes.
6.4.29 Infrastructure changes: Core run 15 has been run with an extra runway and extra terminal
capacity added at Stansted in 2026 (637,000 ATMs and 102 mppa), and a different runway and
terminal capacity ordering prior to this of 2011 Heathrow, 2016 Gatwick and 2021 Stansted.
Similarly, core run 18 has been run with the addition of a runway and extra terminal capacty at
Stansted in 2026, and a new runway sequence preceding this of 2011 Heathrow, 2016 Gatwick,
and 2021 Gatwick. A further sensitivity test was to run core run 18 with this sequence, but
without the new capacity at Stansted in 2026.
6.4.30 Environmental Policy: Core runs 2, 15, 16 19 and 21 were run with an allowance for the
external costs of aviation, which are assumed to be passed on to passengers in the form of an
environmental charge, thereby reducing demand. To account for this, the demand for air travel
has been reduced evenly across all markets starting from a 0.5% reduction in 2006, increasing
annually to a 5% decline at the beginning of 2016. These are in line with the forecasts in ‘AirTraffic Forecasts for the United Kingdom’, DTLR, May 2000.
6.5 Safety Risk
6.5.1 The safety risks associated with new runways or increased use of existing runways has been
assessed by the identification of their associated Public Safety Zones (PSZs). These have
SERAS Stage Two: Appraisal Findings Report
FL1124000.RCE.RP.Jo3.020131.Appraisal Findings 95
been calculated in accordance with the ‘Green Book’ – Third Party Risk Near Airports andPublic Safety Zone Policy, DTLR, 1997.
6.5.2 Attention is focused on 1:10,000 risk areas and 1:100,000 risk areas. Within 1:10,000 risk
areas it is assumed existing residential or commercial buildings will be acquired and the costs of
any such acquisitions are included in option costs. An assessment has been made of the
proportion of the area between 1:10,000 and 1:100,000 risk contours already developed as a
proxy for the degree of 3rd party safety risk attached to each runway option. The 1999 resident
population in the area between these two contours has been estimated, on the basis of the
population in postcodes, which have their centroids between the two contours.
6.5.3 A refined methodology for generating PSZ risk contours was developed during Stage Two. This
was primarily to allow the actual twenty year modal splits and the irregular distribution of traffic
across multiple runways to be input directly.
6.6 Surface Access
Surface Access Modelling
6.6.1 A set of surface access models has been developed and validated specifically for use in
SERAS, to enable the surface access movements associated with different airport options to be
forecast, and then modelled alongside non-airport traffic to allow the effects of additional airport-
related trips on road and public transport networks to be assessed.
6.6.2 The SPASM passenger allocation model provides a forecast of the spatial distribution of
passengers for each airport option. Employee trip distribution models produce complementary
trip distributions for four categories of employees, who tend to live at different distances from
airports: airport and airline management, cabin crew, caterers and cleaners and all other
employees.
6.6.3 The SERAS air passenger mode choice model allocates passengers, by market segment and
surface origin zone, between modes on the basis of relative surface access costs by mode.
The structure of the model and the definition of the six air passenger market segments is the
same as in BAA’s Heathrow Surface Access Model (HSAM).
6.6.4 The SERAS employee passenger mode choice model similarly allocates employee trips to
different highway and public transport modes on the basis of their relative costs. The forecast
number of employees at an airport is a function of forecast passenger and freight throughputs.
In the surface access modelling, for those airport options with higher employment levels, no
compensating reduction in employment elsewhere (and therefore in trips associated with
SERAS Stage Two: Appraisal Findings Report
FL1124000.RCE.RP.Jo3.020131.Appraisal Findings 96
employment elsewhere) has been assumed, which may tend to inflate background traffic levels
in high airport employment options.
6.6.5 Air freight related surface access trips are forecast on the basis of forecast air freight tonnages
and existing relationships between freight tonnes and associated surface access movements.
Freight-related surface access traffic is assumed to have a similar distribution by time of day to
existing freight movements.
6.6.6 The forecasting of non-airport, background traffic, by road and public transport, starts with
SERAS base year trip matrices developed from the major data source models, NAOMI for trips
by road and PLANET for trips by public transport. Projections of future change in planning
parameters and in GDP growth were used to determine growth in travel demand by mode and
by district. Forecast changes in planning parameters consist of 2016 and 2031 estimates of
population, households by car ownership category, employed residents and jobs at County
level, consistent with TEMPRO 4 data supplied by DTLR. Background public transport trip
growth in the peak hour averages 24% between the base year (1997) and 2015, with no further
growth beyond then. Background road traffic growth in the peak hour averages 26% by 2015
and 40% by 2030. In the SERAS modelling, airport-related trips were removed from the
background traffic forecasts and replaced by the SERAS forecasts of airport-related trips for
different options.
6.6.7 Airport-related trips are removed from the forecasts of background traffic. SERAS forecasts of
airport-related trips and the remaining background non-airport trips by mode, derived from the
various sub-models, are combined prior to their assignment to the highway and public transport
networks. The models are designed to reflect conditions in an average hour in the morning
peak period (0700-1000). The models use a common 600-zone system, covering London, the
East and South East regions at District (or finer) level of detail and the rest of the UK at County
or Region level.
6.6.8 Forecast year networks contain currently-committed schemes as well as the existing networks.
Thameslink 2000 and CTRL II are included as committed schemes, but CrossRail is not. This
has been modelled and appraised in the context of particular airport options.
6.6.9 The main outputs from these models are:
• Flows, speeds, delays and traffic composition on existing and new roads to feed
into noise and air quality modelling, and and rail link flows to feed into noise
modelling,
• These flows also feed into the appraisal of surface access impacts. These
include the use made of new links, additional crowding or congestion created on
existing public transport services and road links, and the need for improvements
or capacity enhancements on parts of the existing strategic networks.
SERAS Stage Two: Appraisal Findings Report
FL1124000.RCE.RP.Jo3.020131.Appraisal Findings 97
Appraisal of Impacts on Surface Access Networks
6.6.10 The appraisal of conditions on the road network falls into two parts: the appraisal of the
requirements for access from the airports to the strategic road network, and the identification of
those parts of the strategic road network that may experience severe congestion problems as a
result of the airport expansion. For the purposes of the appraisal, only those roads that are
expected to carry 5% more traffic with the airport option than in the base case, and that are
forecast to have volume:capacity ratios greater than 0.9 are considered as problems.
6.6.11 In many cases, these parts of the strategic road network are being addressed in on-going
studies (eg Multi-Modal Studies) to address existing and potential future travel problems in their
corridors. Those studies are addressing the nature of the problems, potential policy or scheme
intervention responses, and the feasibility of those interventions.
6.6.12 In identifying potential problems associated with airport options, and subsequently indicating the
road improvement schemes that may be needed to cater for additional airport-related traffic,
SERAS has not, and could not, consider the range of possible responses (demand
management, pricing or new infrastructure) that the multi-modal studies may be addressing.
Nor has SERAS established the engineering or environmental feasibility of potential road
improvement schemes. It is for other studies to carry out this work and to identify appropriate
measures. The purpose of identifying the potential road schemes that may be required is to
provide a scale to the size of the problems associated with different airport options and thereby
to inform decisions in respect of future airport capacity provision and other studies formulating
plans for strategic road networks.
6.6.13 The approach followed in the case of major public transport schemes differs in one respect.
The rail schemes considered likely, following the assessment in Stage One, to be needed to
complement an airport option have been incorporated in model runs in order that the use made
of them can be assessed. The likely need for these schemes was assessed in terms of the
capacity that would be needed or the network coverage needed to achieve stated aims of
increasing public transport shares of airport trips. The schemes modelled with each option are
identified in subsequent chapters. Again the purposes of the appraisal are: to identify required
schemes; to provide a scale to the size of the problem associated with different airport options;
and to inform future decisions on airport capacity provision and the development of the strategic
rail network.
6.7 Environment: Land Take
6.7.1 The scale and complexity of the SERAS study, combined with the need for objectivity and
transparency, requires a carefully constructed and consistent approach to developing and
applying criteria for determining whether an environmental effect is significant and, if so, its level
of severity. In particular it is important that the technical environmental evaluation of significance
and its sub-division into levels of severity ensures parity across all topic areas.
SERAS Stage Two: Appraisal Findings Report
FL1124000.RCE.RP.Jo3.020131.Appraisal Findings 98
6.7.2 Any subsequent weighting of evaluations, to take account of other considerations, e.g.
perceptions, politically sensitive issues etc, should be determined by Ministers. In order to
ensure such parity, a two-stage methodology for determination of significance and severity has
been adopted comprising:
• Establishment of generic criteria for four levels of severity (HA*, HA, MA and LA)
of significant effects which can be applied across all topic areas; and
• Establishment of specific criteria for each topic area consistent with the generic
descriptions for each of the four levels of severity. These criteria relate directly to
the two key factors of the scale of impact and the value and sensitivity of the
resource or receptor affected (ie individual, or groups of people, designated sites
etc).
6.7.3 The topic areas addressed under the generic Land Take heading are:
• Impacts on people: residential properties taken
• Land take, by land use type
• Contaminated land
• Ecology
• Heritage
• Landscape/Townscape
• Community impacts
• Construction impacts
6.7.4 The definition of levels of severity were developed from a standard seven-point scale (High,
medium and low adverse, neutral, and low, medium and high beneficial) with the addition of a
further High* adverse category. The four levels of adverse impact are defined as follows:
• High* adverse (HA*), an effect which in isolation should have a substantial
bearing on decision making,
• High adverse (HA), an effect which in isolation could have a material influence on
decision making,
SERAS Stage Two: Appraisal Findings Report
FL1124000.RCE.RP.Jo3.020131.Appraisal Findings 99
• Medium adverse (MA), an effect which on its own could have some influence on
decision making, particularly when combined with other similar effects,
• Low adverse (LA), an effect which on its own is likely to have a negligible
influence on decision making, but when combined with other effects could have a
more material influence.
6.7.5 Table 6.3 summarises for each land take topic the criteria used to define levels of
adversity.
6.7.6 The classification of adverse impacts into these four categories has taken account of
international and national legislation, policy and guidance; findings from other studies; and
appropriate best practice. In this report, the focus is on identifying the more important HA* and
HA impacts.
6.7.7 While decision makers may seek uncontested objective criteria, and criteria, by definition, have
their basis in science, it should be recognised that there will inevitably be uncertainties
associated with any such criteria as applied to environmental appraisal. Such uncertainties
relate both to incomplete baseline data, which can result in inconclusive or ambiguous evidence
(scientific uncertainties), and varying opinions as to the likely consequences of particular
activities (judgmental uncertainties). These uncertainties exist in the opinions of technical
specialists as well as the perceptions of others with an influence on decision making (including
politicians, lobby groups and the public).

SERAS Stage Two: Appraisal Findings Report
FL1124000.RCE.RP.Jo3.020131.Appraisal Findings 100
Table 6.3 Criteria for evaluating levels of adversity for Land Take
Land Use
Residential Industrial/commercial Recreational Public Buildings Agricultural
Basis of criterion Number of residentialproperties taken. Ability to replace locally (based on provision for housing within representative Structure Plans). Expressed in terms of level of housing provision.
Area of industrial land lost. Ability to replace locally. It is assumed thatcommercial land is easier to replace than residential as developers will pay more for commercial sites
Recreational area lost. Ability to replace locally. Assumed that is easier to replace than commercial, since Green Belt can be used. Also, length lost ofnational footpath and potential for local re-routing. Modified by qualitative considerations, including proximity to residential area served, total area of designated site and consideration of use of an area for informal recreation.
Number of buildings lostand ability to replace locally. Some (eg hospitals) can be replaced like commercial buildings. Others (schools, churches) need to be in the community they serve.
Based on agricultural area lost and quality of agricultural land (where known). Grades 1-3a are taken into account: loss of grade 3b and below is not considered significant
National Policy or Guidance PPG 3, Urban & Rural White Papers
PPG 4. PPG 17 None PPG 7, Rural White Paper, DMRB, Dibden and WCML methodology
High * Adverse > 60% of nominal annual provision ie >2,580 properties with no scope for reprovision
Substantial loss of commercial premises
Substantial loss of recreational facilities
Substantial loss of public buildings
Substantial loss of agricultural land

SERAS Stage Two: Appraisal Findings Report
FL1124000.RCE.RP.Jo3.020131.Appraisal Findings 101
Land Use
Residential Industrial/commercial Recreational Public Buildings Agricultural
High Adverse >40% of nominal annual provision ie >1,720 properties with scope for reprovision
>150% of nominal annual provision ie >322 ha
>648 ha from a park/playing field/ outdoor area; or loss of 322 ha from an indoor facility; or loss of >50% from a specific site designated at county or district level
Loss of >4 public buildings through a combination of >2 places of worship, >2 schools: > 2 hospitals: > 2 other significant public buildings
Loss of >100 ha of Best and Most Versatile (BMV) land
Medium Adverse 20-40% of nominal annual provision ie 860-1720properties
50 – 150% of nominal annual provision ie 108-322 ha
216-648 ha from a park/playing field/ outdoor area; or loss of 108-322ha from indoor facility; or loss of 15-50% from a specific site designated atcounty or district level
Loss of 3 or 4 public buildings
Loss of 41-100 ha of BMV
Low Adverse <20% of nominal annual provision ie < 860 properties
<50% of nominal housing provision ie <108 ha
<216 ha from a park/playing field/ outdoor area; or loss of <108 ha from an indoor facility; or loss of <15% from a specific site designated at county or district level
Loss of 1 or 2 public buildings
Loss of 20-40 ha of BMV

SERAS Stage Two: Appraisal Findings Report
FL1124000.RCE.RP.Jo3.020131.Appraisal Findings 102
Contamination Construction Impacts Ecology
Loss of Greenfield
Potential forpollution
Effect on people in their homes
Effect on ecological resource
Land take Noise and AQ disturbance factors
Basis of criterion
Based on the proportion of land taken for development.
Based on the presence of a previous or existingcontaminativeuse and qualitativeassessment of likelypathways and sensitivereceptors
Based on area of expansion, scale of major works (eg cut and fill, tunneling), number of residential receptors (ie individual , or groups of people) and proximity to works.Modified by qualitative criteria including potential off-site traffic movements, location of access routes and nature of construction requirements.
Based on area of expansion, scale of major works (eg cut and fill, tunneling), number of ecological designation (international or national) and proximity to works.Modified by qualitative criteria including potential off-sitetraffic movements, location of access routes and nature of construction requirements.
Based on site designation (and equivalent non-designated sites), and on area of land take.Modified by qualitative considerations including Environmental Capital consideration (if known) eg rarity and typicalness in a local, regional and national context; Ability to substitute (if known); and; Total area of designated site.
Based on proximity of new runways to noise-sensitive and visual sensitive species populations receptors. Modified by qualitativeconsideration:proportion/ area of site affected
National Policy or Guidance
None DMRB,ICRCL
DMRB DMRB PPG 9, Habitats Regulations, DMRB, GOMMMS, CTRL and Dibden methodology
PPG 9, Habitats Regulations, DMRB, GOMMMS, CTRL and Dibden methodology
High * Adverse None due to temporary impact only
Large scale long term works within 50m of internationally or nationally designated ecological site
Major impact on internationally designated site or equivalent which has potential to affect its integrity
International site, with species sensitive to noise and visual disturbance, within 100m of source. Plus noise impacts on receptors within 1km of end of runway or 200m to side of runway

SERAS Stage Two: Appraisal Findings Report
FL1124000.RCE.RP.Jo3.020131.Appraisal Findings 103
Contamination Construction Impacts Ecology
Loss of Greenfield
Potential forpollution
Effect on people in their homes
Effect on ecological resource
Land take Noise and AQ disturbance factors
High Adverse >90% Green Field
Great Scale forcontamination
Large scale works affecting >500 residential properties within 250m of large scale works
Large scale works within 50-250m or medium scale works within 50m of internationally or nationally designated ecological site
25-50% land take on internationally designated site. >50% land take on nationally designated site
International or national site with species sensitive to noise within 1km of end of runway or 200m to side of runway
MediumAdverse
60-90% Green Field
ModerateScale for contamination
Small scale works within 50m or medium scale within 50-250m or large scale works within 250-1,000m of >500 residential properties
Small scale works within 50m or medium scale within 50-250m or large scale works within 250-1,000m of internationally or nationally designated ecological site
Up to 25% land take on internationally designated site. 25-50% land take on nationally designated site.>50% land take on Regional or County designated sites
International or national site with species sensitive to noise within 1-3km of end of runway or 200-500m from side: or county/district designation within 100m of end of runway or 50m to the side
Low Adverse 30-60% Green Field
Minor Scale forcontamination
>500 properties within 250m of small scale works or 100-500residential properties within 250m of medium scale works or >500 properties within 250m of large scale works
Internationally or nationally designated ecological site within 250-1,000m of medium scale works or 50-250m of small scale worksmitigated
Up to 25% land take on nationally designated site.25-50% land take on Regional or County designated sites. Over 50% land take on District or local designated sites
International or national site with sensitive species within 3-5km of end of runway or country/district site within 200m of end of runway.
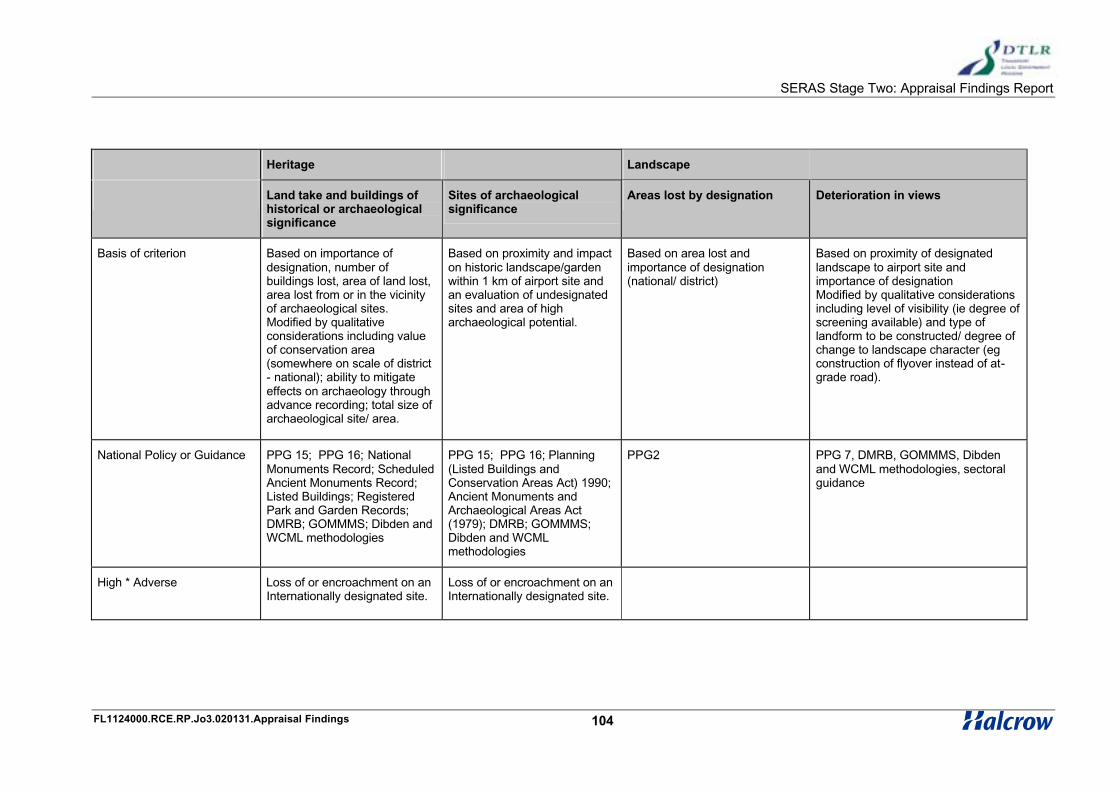
SERAS Stage Two: Appraisal Findings Report
FL1124000.RCE.RP.Jo3.020131.Appraisal Findings 104
Heritage Landscape
Land take and buildings of historical or archaeological significance
Sites of archaeological significance
Areas lost by designation Deterioration in views
Basis of criterion Based on importance of designation, number of buildings lost, area of land lost, area lost from or in the vicinity of archaeological sites. Modified by qualitative considerations including value of conservation area (somewhere on scale of district - national); ability to mitigate effects on archaeology through advance recording; total size of archaeological site/ area.
Based on proximity and impact on historic landscape/garden within 1 km of airport site and an evaluation of undesignated sites and area of higharchaeological potential.
Based on area lost and importance of designation (national/ district)
Based on proximity of designated landscape to airport site and importance of designationModified by qualitative considerationsincluding level of visibility (ie degree of screening available) and type of landform to be constructed/ degree of change to landscape character (eg construction of flyover instead of at-grade road).
National Policy or Guidance PPG 15; PPG 16; National Monuments Record; Scheduled Ancient Monuments Record; Listed Buildings; Registered Park and Garden Records;DMRB; GOMMMS; Dibden and WCML methodologies
PPG 15; PPG 16; Planning (Listed Buildings and Conservation Areas Act) 1990; Ancient Monuments and Archaeological Areas Act (1979); DMRB; GOMMMS; Dibden and WCML methodologies
PPG2 PPG 7, DMRB, GOMMMS, Dibden and WCML methodologies, sectoral guidance
High * Adverse Loss of or encroachment on an Internationally designated site.
Loss of or encroachment on an Internationally designated site.

SERAS Stage Two: Appraisal Findings Report
FL1124000.RCE.RP.Jo3.020131.Appraisal Findings 105
Heritage Landscape
Land take and buildings of historical or archaeological significance
Sites of archaeological significance
Areas lost by designation Deterioration in views
High Adverse Any loss of Grade I or II* listed building; or Loss of >5 Grade II listed buildings; or Loss of >5% of Conservation Area or Registered Park or Garden; or any loss of SAM or non-scheduled area of NationalImportance; or >50% of historic site, monument or area of archaeological potential
Significant loss of undesignated sites and areas of high archaeological potential
>50 ha of nationally designated site,
> 100 ha of regional / county designated site,
> 200 ha of district designated site.
Nationally designated site within 3 km of airport site or County site within 1 km with qualitative appraisal for scale of impact
Medium Adverse Loss of 2-5 Grade II listed buildings; or Loss of 2-5% of Conservation Area or Registered Park or Garden; or loss of 25-50% of historic site, monument or area of archaeological potential
<10 undesignated sites of local or regional interest
10 –50 ha of nationally designated site, 50 - 100 ha of regional / county designated site, 100 - 200 ha of district designated site.
Nationally designated site within 3-5km of airport site, or County site within 1-3 km, or District site within 1 km.
Low Adverse Loss of 1 Grade II listed building; or Loss of <2% of Conservation Area or Registered Park or Garden; or loss of <10% of historic site, monument or area of archaeological potential
Minimal impact and low potential and/or mitigation possible
<10 ha of nationally designated site, <50ha of regional / county designated site, <100ha of district designated site.
Nationally designated site within >5 km of airport site, or County site within 3-5 km, or District site within 1-3 km

SERAS Stage Two: Appraisal Findings Report
FL1124000.RCE.RP.Jo3.020131.Appraisal Findings 106
Community Impacts
Community infrastructure Community structure/
distinctiveness
Employment
Basis of criterion Based on loss on residential housing particularly for vulnerable groups.
Based on effect of the development on community structure and urban form.
Loss of employment opportunities and loss of commercial land.
National Policy or Guidance No published guidance. Follows current EIA practice in terms of the approach to identifying the significance of effects.
No published guidance. Follows current EIA practice in terms of the approach to identifying the significance of effects.
No published guidance. Follows current EIA practice in terms of the approach to identifying the significance of effects In the absence of established methodologies this is a qualitative assessment.
High * AdverseNot used in this category
High Adverse Displacement of >20% of persons in Ward with consideration of IMD of affected groups, nature and number of community facilities lost.
>20% increase in population of Core Catchment Area: or >50% of housing capacity. Consideration also of nature of settlement patterns and ability to accommodation housing demand whilst retaining character and extent of wards subject to increased noise levels or subject to new noise disturbance.
Qualitative appraisal of loss of commercial/industrialfacilities; new employment opportunities, diversity etc. Relationship of Core Catchment Area unemployment to national average; below average unemployment is assumed to indicate that additional jobs would not necessarily represent a net community benefit.
Medium Adverse Displacement of 10-20% of persons in Ward with consideration of IMD of affected groups, nature and number of community facilities lost.
10 – 20% increase in population of Core Catchment Area: or 25 – 50% of housing capacity. Consideration alsoof nature of settlement patterns and ability to accommodation housing demand whilst retaining character and extent of wards subject to increased noise levels or subject to new noise disturbance.
As above

SERAS Stage Two: Appraisal Findings Report
107FL1124000.RCE.RP.Jo3.020131.Appraisal Findings
6.7.8 Specific assumptions and limitations relating to each of the relevant topic areas are
included in the Stage Two Methodology Report. Generic limitations and assumptions
include:
• The Stage Two appraisal includes some but not all aspects of an
Environmental Capital Approach. It does consider non-designated sites
(which were not considered in Stage One) but does not rigorously follow an
Environmental Capital Approach in determining the value of resources and
undertaking the appraisal, although where possible GOMMS criteria have
been incorporated.
• The confidential nature of the project restricted consultation and thus the
views of key statutory consultees (English Nature, Countryside
Commission, English Heritage, etc) have not yet been sought.
• The appraisal of the environmental effects arising from induced development
and surface access has been excluded from this study. It goes beyond the
scope of this study to design surface access improvements or other surface
access strategies which are being addressed in, for example, multi-modal
studies. The location and design of induced development is also beyond the
scope of this study, and is for consideration in the land-use planning system,
starting with the next revision of Regional Planning Guidance.
• The future baseline in 2030 (without airport development), against which the
evaluation has been made, has been estimated from local plans and other
available sources as identified in the main text. This information is unlikely,
however, to reflect reality in 2030. While some information regarding future
changes was available, this was very limited. In most cases it did not extend
to 2030 and it varied between locations.
• The appraisal has been primarily based on desk studies alone with no
consultation and only limited site visits. It is therefore possible that some
resources may be missed, particularly those which are not officially
designated. Furthermore, there are limits to the verification of the accuracy
of data (eg, the number of houses affected by each option has to be
estimated from OS maps).
• The appraisal has been undertaken for development options at each airport
site up to the 2030 planning horizon. Explicit appraisal of developments
within current planning permissions and for the maximum use of facilities at
each site has not been undertaken as these have been deemed to be
confined within the existing airport boundaries.
• Mitigation. At this stage in the appraisal process, and given the need to
maintain confidentiality, it has not been possible to identify all feasible

SERAS Stage Two: Appraisal Findings Report
108FL1124000.RCE.RP.Jo3.020131.Appraisal Findings
opportunities for mitigating impacts, whether by modifications to layouts and
designs, relocating affected resources, re-creating habitats or other means.
In some cases, for example impacts on contaminated land and water
resources, where it is very often possible to mitigate the impacts of major
projects, qualitative judgement on the scope for mitigation has been applied
here in the assessment of the potential severity of impacts. In other cases,
no allowance for potential mitigation has been made, so, on that basis, the
recorded impacts may overstate true impacts to the extent that they can be
mitigated.
6.8 Environment: Water
6.8.1 The appraisal of the impacts of options on water resources follows the approach used for
the appraisal of land take impacts. The severity of impacts on the water environment takes
account of the scale of the impact and the importance and sensitivity of the resource
affected. Adverse impacts are similarly classified as HA*, HA, MA and LA. National policy
and guidance, in particular that emanating from the Environment Agency, and other
standard appraisal approaches, have been used in determining the severity of impacts.
6.8.2 Impacts on four areas of the water environment, as set out below, are appraised. In each
case the appraisal year is 2030.
• Surface Water Quality. The appraisal system takes account of the sensitivity
of the receptor and the potential of the proposal to cause harm. The
appraisal findings have been modified by qualitative consideration of the
potential for mitigation. The appraisal takes account of the Environment
Agency’s GQA (General Quality Assessment) scheme River Quality
Objectives, and fisheries designation. Standard appraisal approaches
(DMRB, NATA) are also drawn upon.
• Groundwater. The appraisal system takes account of the sensitivity of the
receptor and the potential of the proposal to cause harm. The appraisal
findings have been modified by a qualitative consideration of the potential for
mitigation. The appraisal takes account of the Environment Agency’s Policy
and Practice for the Protection of Groundwater which includes Groundwater
Vulnerability mapping and source protection Zones. Again, DMRB and
NATA are drawn upon.
• Flooding. The appraisal system takes account of the sensitivity of the
receptor and the potential of the proposal to cause harm. The appraisal
findings have been modified by a qualitative consideration of the potential for
mitigation. The appraisal takes account of the Environment Agency’s 1 in

SERAS Stage Two: Appraisal Findings Report
109FL1124000.RCE.RP.Jo3.020131.Appraisal Findings
100 year flood plain mapping and the Flood Estimation Handbook, along
with DMRB and NATA.
• Water Resources. The appraisal is based on a qualitative assessment of
available water resources, having regard to the Environment Agency
publication Water Resources for the Future, March 2001.
6.8.3 The appraisal is initially carried out for the base case option, i.e. for the current land-use
planning system. The assessment of future options is set against the base case, in that
assessments only consider those impacts that are additional to those identified under the
base case option.
6.9 Environment: Noise Impacts
Aircraft Noise - Daytime
6.9.1 To assess daytime aircraft noise the LAeq,16h (07.00 to 23.00) noise contours are presented
for the 3 month summer period normally used for aircraft noise contours in the UK. ERCD’s
ANCON 2 model has been used to produce contours from 54 dB LAeq,16h upwards in 3 dB
intervals. This enables comparison to be made of forecast 2015 or 2030 contours with
different options and current or recent modelled noise contours.
6.9.2 The correspondence between aircraft noise levels on the LAeq scale and average
annoyance levels, which relates back to original survey work published in the Wilson
Report in 1963, is as follows:
Table 6.4: Aircraft Noise and Annoyance
Noise level LAeq,16h dB Average Annoyance Response
57 Low
63 Moderate
69 High
6.9.3 Although 57 dB is commonly taken as the indicator of the onset of significant community
annoyance, the 54 dB contour is also presented as a sensitivity test.

SERAS Stage Two: Appraisal Findings Report
110FL1124000.RCE.RP.Jo3.020131.Appraisal Findings
Aircraft Noise – Night-time
6.9.4 Current policies in relation to night-time noise at major UK airports are implemented
through night-time noise quotas which take account of numbers of night-time flights,
permitted aircraft types and noise emissions by aircraft type. Following the October 2001
ruling by the European Commission for Human Rights on night flights, policies with regard
to night flights (numbers of flights, permitted aircraft types, etc) are under review. Until this
review is completed, there is no basis on which forecasts of night flights or of night-time
noise can be made. As illustrative examples, 90dB(A) SEL (Sound Exposure Level)
footprints for each existing and proposed runway option have been produced based on
typical loudest (QC2) aircraft likely to operate at night-time. To represent night-time aircraft
noise impacts an indicator that predicts sleep disturbance is the most useful. Research
into aircraft noise and sleep disturbance, produced by the CAA in 1992 but now under
review, showed that aircraft pass-by events below 90dB(A) SEL were unlikely to produce
sleep disturbance. The SEL gives a measure of peak noise level and is not a function of
the number of noise events.
Assessment of Noise Impact
6.9.5 Populations within the noise contours and SEL footprints have been estimated by ERCD
using 1991 census data as updated by CACI Ltd to mid-1999. For forecast years, the
population data remains unchanged except where airport options indicate that houses
would be demolished in order for development to take place. In these cases the
populations within the revised airport boundaries have been subtracted from the totals.
6.9.6 ERCD’s ANCON Version 2 model is a semi-empirical model which calculates LAeq at a
point on the ground by summing the SELs due to all passing aircraft. Calculations are
repeated for a grid of receptors and from the results the noise contours are determined.
6.9.7 ANCON 2 is used to produce the annual published noise contours for the three designated
London airports Heathrow, Gatwick and Stansted. Since 1995 it has been the practice to
produce two sets of contours. These are based on the “actual” modal (landing/take-off
direction) split over the relevant period, and the “standard” modal split, based on the 20
year average. When comparing predicted noise contours it is important to be aware of the
directional split assumptions. The modal directional split assumed for the SERAS
modelling has been the current “standard” at each airport. These are 77/23
Westerly/Easterly at Heathrow, 73/27 at Gatwick, 76/24 at Stansted and 76/24 at Luton.
For the new site at Cliffe Marshes a split of 70/30 was adopted.
6.9.8 The input data provided for the model includes summer average ATMs for the 0700-2300
daytime period, split into aircraft types. Details of aircraft tracks and precise runway
locations are also provided with the split of movements between these. The process for
determining this data is outlined below.
SERAS Stage Two: Appraisal Findings Report
111FL1124000.RCE.RP.Jo3.020131.Appraisal Findings
SIDs, Allocation of ATMs to Runways, Distribution of ATMs to SIDs and Future Aircraft Fleet
6.9.9 The allocation of ATMs from SPASM output between runways at each airport allows for
their distribution to runway-specific Standard Instrument Departure routes (SIDs). For all
arrival movements, straight-in flight tracks were assumed. The allocation of ATMs to tracks
is the primary input for the noise modelling process and a derivative input for the air quality
and CO2 modelling.
6.9.10 The allocation rationale adopted for the new short runway options at Heathrow, Options E4
and E6, was to transfer from the existing full length runways to the new all aircraft types
with performance characteristics suitable for operating from the short runway (2000m).
These are all aircraft within the two lowest seat bands in SPASM, with 150 seats or less.
Where that number of ATMs fell short of the assessed short runway capacity, a number of
larger aircraft types, operating within a range of 750km, were also transferred to make up
the shortfall.
6.9.11 For the full-length runway options, the requirement to allocate between the new and
existing runways on the basis of aircraft size or performance characteristics was not
applicable. To maintain the notion of ‘maximum achievable capacity’ no attempt has been
made to constrain or allocate particular movements to the new runways, the assumption
being that all aircraft types could operate equally from any of the runways. Thus, for
options that have three full length runways (such as Option E8 at Heathrow or Option 11 at
Stansted) the allocation was split equally between the three, ie. 33.3% / 33.3% / 33.3%.
6.9.12 Once allocated to runways, the forecast ATMs, by market (or route group), were distributed
across the SIDs in a way that reflected the current (2001) SID usage.
6.9.13 Where existing runways have been retained, existing SIDs have also mostly been retained.
Where new runways have been introduced at existing airports, new SIDs have been
designed to converge with the existing SIDs either by the first waypoint or sooner,
cognisant of minimum radii and other air navigation rules. In the case of new airports, ie.
Cliffe Marshes, SIDs used in noise contour generation have been designed to minimise
overflying of populated areas as far as possible. ATMs classified by aircraft size bands
and allocated by track were provided for each option for which noise impacts were to be
modelled, and ERCD assigned aircraft types.
Future Aircraft Types
6.9.14 Aircraft types were assigned by ERCD to the forecast movements using a ‘bottom-up’
approach for replacement of old aircraft as they are phased out or retired. For future
aircraft types, aircraft noise performance characteristics were defined using available
manufacturers’ data and assumptions based on likely future international regulations.
SERAS Stage Two: Appraisal Findings Report
112FL1124000.RCE.RP.Jo3.020131.Appraisal Findings
6.9.15 The bottom-up approach to the replacement of old aircraft had the following steps:
• Start with the existing fleet mix at each airport for which noise impacts were
modelled,
• Phase out those that will not be permitted to operate in the forecast years of 2015
and 2030, in this case Chapter 2 aircraft,
• Divide remaining aircraft types into those no longer in production and those still in
production,
• Develop a retirement profile for those types no longer in production based on the
current age profile of the European fleet,
• For those aircraft types still in production, retirement has been ignored. This
means, conservatively, that, for a given type, an aircraft bought in, say, 2010 will
have the same noise performance as one currently in operation.
• Additional aircraft to replace retired aircraft or to cater for growth are drawn
equally from all relevant types in a ‘supply pool’.
6.9.16 The Supply Pool comprises existing types no longer in production, existing types still in
production and future types not yet flown. Manufacturers’ data describing noise
performance has been used where available. For new types, noise performance has been
derived from that of similar types whose performance is known.
Noise Characteristics
6.9.17 ICAO contracting states have agreed to ban Chapter 2 aircraft operations by 31 March
2002 and CAEP, ICAO’s Committee for Aviation Environmental Protection, is considering
the adoption of more stringent noise standards, both for new designs and the phase out of
the noisiest Chapter 3 aircraft.
6.9.18 The SERAS and RASCO noise modelling work undertaken for DTLR has considered three
principal design standards, based on reductions below current Chapter 3 permitted noise
levels of 8dB, 11dB and 14dB, with Chapter 3 levels to be bettered at each of the three
noise measurement points.
6.9.19 For the core model runs, deliberately cautious assumptions have been made in both
relevant areas. It has been assumed that a new design standard of Chapter 3 –8dB will be
introduced in 2002, and that aircraft that do not comply with Chapter 3 –5dB will be phased
out beginning in 2007.
6.9.20 For sensitivity testing, more stringent standards of Chapter 3 –14dB have been assumed in
both areas. The sensitivity testing has also incorporated an accelerated retirement
programme for those aircraft no longer in production in 2000 and a reconsideration of the
aircraft types that might be present in future aircraft fleets. In practice, this has tended to
replace long-range variants of some new aircraft types in the core model runs with shorter-

SERAS Stage Two: Appraisal Findings Report
113FL1124000.RCE.RP.Jo3.020131.Appraisal Findings
range variants of the same types more likely to be in general use and more compatible with
forecast air services.
6.9.21 A decision on a new standard was taken in early 2001, after this modelling work had
started, when CAEP recommended that ICAO member states adopt a Chapter 3 –10dB
standard for the certification of new aircraft designs submitted after 1 January 2006. No
agreement was reached on the phase out of marginal Chapter 3 aircraft.
Surface Access Noise
6.9.22 The surface access noise assessment is based on the advice given on multi-modal
environmental assessment in GOMMMS. This involves separately tabulating for roads and
railways estimates of population exposed to changes in noise. From these, estimates of
the population annoyed by noise are determined by applying annoyance response
relationships. The incremental changes in population annoyed are then determined for the
scenario under test and these values are summed to give the total change in estimated
population annoyed for that scenario.
Road traffic noise
6.9.23 The SERAS highway surface access model is used to determine estimates of population
subject to changes in noise levels. The following steps are involved:
• traffic model outputs are processed to calculate source noise (basic noise
levels) for Do Minimum and Do Something scenarios;
• a simplified prediction methodology is used to determine noise contours
within 300m of each road;
• populations within noise contours are estimated; and
• annoyance response relationships are applied to allow changes in
population annoyed by noise to be estimated (GOMMMS Plan method).
6.9.24 Traffic noise predictions use a simplified version of the methodology given in Calculation of
Road Traffic Noise (CRTN 1988). The Basic Noise Level is calculated, which is the LA10, 18h
level at 10 m from the edge of the road. This is based on the 18 hour AAWT traffic flow
and speed, and percentage of heavy vehicles. A look-up table is used that applies
corrections for distance assuming propagation over absorbent ground in relation to each
road link. The amount of data to be processed has been minimised by screening out links
with noise level changes of less than 1 dB and links with basic noise levels of less than 57
dB LA10, 18h.

SERAS Stage Two: Appraisal Findings Report
114FL1124000.RCE.RP.Jo3.020131.Appraisal Findings
Rail noise
6.9.25 Data from the SERAS railway surface access model is used to determine estimates of
population subject to changes in noise levels. The process used is:
• to adapt public transport model rail outputs into appropriate form to calculate
source noise levels;
• calculate LAeq,18h noise values for Do Minimum and Do Something scenarios;
• estimate the population within 200m of each railway line; and
• apply annoyance response relationships to allow changes in population
annoyed by noise to be estimated (GOMMMS Strategy method).
6.9.26 Railway noise calculations use simplified predictions based on the methodology given in
Calculation of Railway Noise (CRN 1995). The equivalent to the Basic Noise Level is the
LAeq,18h level at 25 m from the edge of the railway. This is based on the 18 hour traffic flow
by type and number of rail vehicles and the average speed for each train type. The amount
of data to be processed has been minimised by screening out links with noise level
changes of less than 1 dB and links with basic noise levels of less than 55 dB LAeq, 18h.
6.10 Environment: Local Air Quality Impacts
6.10.1 The air quality assessment undertaken for Stage Two of SERAS is designed to provide a
comparative assessment of the performance of airport options with respect to local air
quality impacts. The pollutants considered are NO2 and PM10. The focus of the
assessment is the identification of potential air quality problems. These are defined as
locations where population would be exposed to resultant concentrations of pollutants in
excess of the concentration statistic incorporated in the Air Quality (England) Regulations
2000. The air quality statistics used as assessment criteria for defining poor air quality in
SERAS Stage Two are:
• Annual mean Nitrogen Dioxide concentrations of 40µg/m3
• 90th percentile of running 24-hour mean PM10 concentrations of 50µg/m3
6.10.2 It should be noted that at a given location, the annual-mean NO2 objective is recognised as
being more onerous than the 1-hour NO2 objective. Similarly the 90th percentile of 24-hour
means objective for PM10 is recognised as being more onerous than the annual-mean
objective at the same location.

SERAS Stage Two: Appraisal Findings Report
115FL1124000.RCE.RP.Jo3.020131.Appraisal Findings
6.10.3 Pollutant concentrations in the study area are modelled from two contributor sources: the
contribution from those sources explicitly included in the dispersion modelling carried out
for this assessment; and the contribution from all other sources, included via background
‘source mapping’. Dispersion modelling accounts for all significant emissions sources and
local meteorology to give total ground level pollution concentrations within a pre-defined
study area.
6.10.4 Emission sources directly modelled include:
• ‘aircraft-related’ emissions, including engine exhaust emissions in the Landing
and Take-Off (LTO) cycle, Auxiliary Power Unit (APU) emissions, fugitive PM10
emissions from aircraft brake and tyre wear on landing;
• road-vehicle emissions on a major road network around the airport, including
engine exhaust emissions and cold start emissions;
• emissions from airside support vehicles.
6.10.5 Air quality results are provided for representative options at each airport, for 2015 and
2030 as appropriate. These results are expressed in terms of resultant pollution contours,
identifying the areas in which pollution concentration statistics are forecast to be exceeded,
and the population exposed to any exceedances of these values. This methodology takes
into account the fact that air quality standards only apply in non-occupational near-ground
level outdoor locations, where a person might be expected to be exposed over the relevant
averaging period.
6.10.6 For SERAS, the estimated population potentially exposed to different degrees of
exceedance are identified, and summarises these into a SERAS Key Indicator, to allow
direct comparison between options and packages. The Air Quality Key Indicator for
SERAS Stage Two is 'the number of people exposed to an exceedance of the air quality
standard, weighted by the degree of exceedance'. The higher the key indicator, the worse
the air quality impact is.
6.10.7 The SERAS air quality methodology has been specified and developed to provide a
comparison between options using key indicators of air quality, rather than a validated and
accurate estimate of air pollution concentrations. The method aims to produce estimates
of air pollution concentrations as realistic as is feasible with the approach adopted, but the
absolute numbers have uncertainties as a result. Where approximations and
simplifications have had to be made, or where there are gaps in the knowledge base, the
SERAS methodology tends towards over-prediction rather than under-prediction.
6.10.8 Following on from the main appraisal, some key assumptions have been relaxed in
sensitivity tests relating to NO2, applied (for illustration) to options at Heathrow, where
impacts were found to be worst. The principal assumptions modified in the sensitivity tests

SERAS Stage Two: Appraisal Findings Report
116FL1124000.RCE.RP.Jo3.020131.Appraisal Findings
are set out in Table 6.5. For the purposes of this table, assumptions are expressed simply.
In practice, many caveats and exemptions apply.
Table 6.5: Aircraft-related Emissions - Assumptions
Technical Area Core model runs Sensitivity test 1 Sensitivity test 2
Future (new) engine
performance – NOx
Just meet CAEP/4 limit for
Oxides of Nitrogen
All engines not yet
certificated would, by 2015,
match the NOx
performance of current
dual-annular combustors
(DAC) engines, giving
lower emissions than
CAEP/4 (20% at π=40, less
at higher π )
Based on aggressive take-
up of ultra-low NOx
technology. All aircraft
using Heathrow must have
LTO EI NOx of no more
than 45% of CAEP/4 limit.
% thrust on take-off All aircraft at 100% Reduced thrust (85%)
applied as % of fleet by
aircraft type, based on BA
data for Heathrow
Reduced take-off thrust
(75-100%) defined for all
major jets, where relevant,
using ‘assumed
temperature method’
Reverse thrust on
landing
Larger jets, where relevant,
use reverse thrust on
landing
Same as core Larger jets assumed to use
reverse idle, where
relevant, on landing
APU emissions APU emissions assume
that Pre-Conditioned Air
(PCA) is not used. APU
usage assumed to be for
90 minutes before
departure for wide-bodied
and 30 minutes for narrow-
bodied aircraft. Assumed
15/20 minutes on arrival
All stands assumed to be
fitted with PCA and all
aircraft with APUs use this
facility. APU usage
reduced to 15/10 minutes
before departure and 5
minutes on arrival
Same as test 1
6.10.9 The core assumptions are more likely to over-estimate than under-estimate local air quality
impacts. The assumptions in sensitivity test 1 are considered to approximate to the best
available current technology in 2015. The assumptions in sensitivity test 2 are demanding
and optimistic, and are only likely to be realised as a result of a stringent government and
airport operating policy, and at some expense to the airlines.

SERAS Stage Two: Appraisal Findings Report
117FL1124000.RCE.RP.Jo3.020131.Appraisal Findings
6.11 Employment
6.11.1 In order to gain a better understanding of the economic, land use and surface access
impacts of increasing airport capacity, forecasts of future airport employment are required.
The principal assumptions underlying the model used to forecast employment for each
option, in 2015 and 2030 as appropriate, are as follows.
Key assumptions
6.11.2 Employment data was obtained from surveys at BAA airports (Heathrow, Gatwick and
Stansted) and Luton airport in 1998, and, in some cases, earlier years. It has been
assumed that the employment structure at Cliffe Marshes will be similar to that at
Heathrow, but that, as a new airport, labour could be saved in particular areas (passenger
services, sales, clerical; maintenance; apron and cargo-related; catering and cleaning).
These savings would allow a reduction in employees per passenger of around 25%.
These observed data provide the starting points in the forecasting of employment at each
airport.
6.11.3 Three types of employment are forecast for 2015 and 2030 options:
• direct on-site employment – employees working at the airport;
• direct off-site employment – employees working directly for the airport but
located within 20 minutes of the airport boundary. Direct off-site
employment is assumed to be equivalent to 15 percent of direct total
employment.
• indirect employment – jobs which supply services to the aviation industry
and are supported by purchases made by the industry. The indirect
employment multiplier based on past experience is assumed to be 0.3, ie,
0.3 indirect jobs for each direct job.
6.11.4 Long run labour productivity growth is assumed to be 1.5% per annum. The same rate is
applied to all airport employees over the forecast period.
6.11.5 Employment forecasts are based on the forecast growth in passengers over 1998 levels.
Using the employee per mppa ratio for each airport the number of employees required to
serve the additional passengers are estimated.
6.11.6 Allowances have been made to the employee per mppa ratio for airports that are forecast
to serve a higher proportion of low cost carriers, which typically employ fewer employees
per mppa.

SERAS Stage Two: Appraisal Findings Report
118FL1124000.RCE.RP.Jo3.020131.Appraisal Findings
6.11.7 The approach followed, of relating all current airport employees to passenger movements
within employee:mppa ratios, allows for current ratios of freight:passenger movements
within forecast employment totals. Where forecast freight movements differ substantially
from current ratios, additional forecasts of freight related employment have been made.
Skill groups
6.11.8 For regional and social impacts the employment skills mix is an important issue.
Employment at airports typically breaks down as follows:
• Skill Group A (Professional) 8.5%
• Skill Group B (Managerial and Technical) 14%
• Skill Group C1 (Skilled non-manual) 18%
• Skill Group C2 (Skilled manual) 28.5%
• Skill Group D/E (Partially skilled and unskilled) 31%
6.11.9 The Cliffe skill mix is based primarily on that of Heathrow. However a new airport could
take advantage of new technology and working practices which could lead to a slightly
different skill mix. For Cliffe it is assumed there would be fewer passenger services, sales
and clerical staff (Skill Group C1 employees), fewer apron and maintenance staff (C2/D)
and fewer catering and cleaning staff (D/E) than currently employed at Heathrow. The
assumed skill mix for Cliffe is as follows:
• Skill Group A (Professional) 9%
• Skill Group B (Managerial and Technical) 15%
• Skill Group C1 (Skilled non-manual) 13%
• Skill Group C2 (Skilled manual) 32%
• Skill Group D/E (Partially skilled and unskilled) 31%
6.12 Land Use & Urbanisation
6.12.1 The principal objective of the land use and urbanisation appraisal has been to identify the
extent of off-site developments associated with each of the airport options. In practice
these are mainly requirements for housing and employment. The estimates of employment
land are based largely on the off-site employment impacts of the options and their
associated land and floorspace requirements. The housing element is assessed based on
the potential need for in-migration to fill airport jobs, and the requirements for additional
housing (and associated services) arising from these in-migrants. The relationship of

SERAS Stage Two: Appraisal Findings Report
119FL1124000.RCE.RP.Jo3.020131.Appraisal Findings
these requirements to existing and future housing provision through the RPG is also
considered and the capacity of the catchment areas to accommodate any excess is
considered.
Employment Land Requirements
6.12.2 Assumptions have been made on worker floorspace density and ratios of floorspace to site
area, ranging from 17.9 to 40.1m2 floorspace per worker (based on a recent study for
SERPLAN on worker densities). This has been translated into land take assuming a plot
ratio of 1:0.5, equivalent to 50% site coverage of single storey development. To the extent
that off-airport employment includes denser development such as hotels or offices, the
resulting estimates will over-estimate land take. It is also possible that existing businesses
will be able to produce greater output or switch markets without needing to expand their
premises.
6.12.3 It has been assumed that no additional land allocations would be necessary for induced
(employee expenditure-induced) employment and would expect these to be
accommodated in the main service centres nearest to any new urbanisation. Similarly no
new allocations are assumed to be necessary for attracted employment where proximity to
the airport would be only one of several factors influencing locational choices.
Dwelling Requirements
6.12.4 The estimation of dwelling requirements starts with the airport employment forecasts. The
Department’s own trip end model, TEMPRO, provides a labour market context within which
additional employment requirements can be considered. TEMPRO contains forecasts of
future population and households (e.g. potential labour supply) derived from ONS sources
and forecasts of employment growth (labour demand) based on forecasts sourced from
independent forecasters, Cambridge Econometrics. Using TEMPRO data as a base it is
possible to consider the extent to which there may be surplus labour in the region to fill any
additional airport jobs, based on defined core and wider catchment areas. The latter are
defined in relation to each of the airports and are specified in more detail in the airport-
related chapters that follow.
6.12.5 The TEMPRO forecasts of household requirements are also compared with the RPG
provision to examine the extent of existing under- or over-provision of housing in the
London, South East and Eastern regions (e.g. the areas covered by RPGs 3, 6 & 9). In the
case of London, the Mayor’s housing capacity estimates are used as these provide the
most recent figures that best reflect prevailing policy and housing trends.
6.12.6 To implement the method it has been necessary to make assumptions about the extent to
which TEMPRO forecasts at regional level already incorporate airport related employment

SERAS Stage Two: Appraisal Findings Report
120FL1124000.RCE.RP.Jo3.020131.Appraisal Findings
growth, and the extent to which airport related housing requirements are already
incorporated in the RPG provision. A more detailed discussion of these issues follows
below.
The relationship of airport employment forecasts to the employment forecasts
contained within the TEMPRO model.
6.12.7 TEMPRO forecasts are derived from independent forecasts commissioned by DTLR from
Cambridge Econometrics (CE). They are derived from national forecasts and are
unconstrained. For the purposes of the study it is assumed that all airport requirements
are included in regional employment forecast totals, although it is assumed that the
decision to pursue a particular option may result in differences in the sub regional
distribution of employment growth. By implication it is also assumed that if future airport
expansion is constrained, then the TEMPRO employment forecasts may not be realised.
However, it is also assumed that, in the context of a South East economy where there are
potential factors such as land or labour in scarce supply, there is also an element of
“crowding out”. That is to say that airports may displace some other forms of employment.
It should also be noted that TEMPRO forecasts employment levels in excess of available
workforce for the SERAS region over the period, suggesting very high levels of
employment within the SERAS region, and, if realised, potentially fuelling additional
housing pressures.
The relationship of airport housing requirements to RPG provision.
6.12.8 This refers particularly to relationships with RPG 9, which specifies housing provision for
the former South East standard planning region, which is the area in which (with London)
most of the airport related housing pressures will be experienced. The main exception to
this is Stansted where urbanisation pressures will also be likely to occur in the former East
Anglia region.
6.12.9 RPG 9 identifies requirements only up to 2006 (although in the absence of further guidance
it is suggested that the targets should simply be rolled forward beyond this period) and the
RPG itself suggests that a higher figure may in fact be possible as a consequence of the
plan-led approach. RPG 9 housing provision is not designed to meet the needs of any
specific sector or economic development. Housing pressures created by airport
development can therefore be judged similarly to those created by any other expanding
sector. Airports and airport related sectors have been rapidly growing in recent years and
have clearly fuelled a significant proportion of past regional growth trends. The future
options under consideration in SERAS are predicated on continuing overall growth in
demand for movement through airports, but at a declining rate.
6.12.10 However, there is a shortfall between current RPG housing provision and the levels of
household growth under a number of soundly based household forecasts (including ONS

SERAS Stage Two: Appraisal Findings Report
121FL1124000.RCE.RP.Jo3.020131.Appraisal Findings
household forecasts). This means that there is insufficient housing provision within the
current version of the RPG to meet all of the needs arising from all economic development.
Assuming even an “equal shares” approach (and no change in provision), not all airport-
related housing pressures are likely to be addressed through the RPG provision.
6.12.11 The calculation made of airport-related housing requirements seeks to identify the excess
of housing requirements over RPG provision. It starts by assuming that all airport
employment growth is contained in the TEMPRO employment forecasts. Housing
requirements associated with airports are then defined as the product of an airport’s share
of forecast employment growth and the under-provision of dwellings in the RPG compared
with those assumed to be required in TEMPRO. These comparisons are made for the core
and wider catchment areas of each airport, recognising that, in location terms, housing
pressures and provision are not necessarily well matched across the region, and airports
are locationally specific. The extent to which the RPG makes sufficient provision will be
dependent on competing claims in a particular location, with the balance of probabilities
suggesting that areas of economic pressure will face the largest overall shortfalls.
6.12.12 The uncertainties associated with future housing provision are compounded by further
uncertainties relating to the long term forecasting of employment, by sector and location,
which mean that statements on the requirement for new housing can at best be regarded
as a guideline figure. The balance between the future labour force and employment needs
in an area may be met in different ways. Airport development may come on stream in
periods when housing markets and completion rates are otherwise depressed and the
pressure for new housing is reduced. New transport infrastructure projects may act to
widen airport catchment areas for some types of labour, reducing the pressure for new
housing perhaps at the expense of sustainability criteria that require commuting distances
to be minimised. Over a 30 year period, the scope for changes in employment structure,
working practices, technology and in adjustment processes in housing markets are further
reasons for considering estimates of housing requirements as guidelines only.
6.13 Social Impact
6.13.1 In constructing indicators of social deprivation for use in Stage 2 of SERAS, a district has
been defined as “deprived” if it falls within the top 30% (by ranking) of districts within the
national Indices of Multiple Deprivation (IMD) on both the following criteria:
• a count of individuals experiencing income deprivation; and
• a count of individuals experiencing employment deprivation.
6.13.2 The districts that fall into this top 30% within the SERAS airports Core and Wider
Catchment Areas (CCAs and WCAs) have then been selected for subsequent analysis.

SERAS Stage Two: Appraisal Findings Report
122FL1124000.RCE.RP.Jo3.020131.Appraisal Findings
6.13.3 As the analysis is necessarily of a judgmental nature, only the smallest and largest
development options at each airport have been selected to demonstrate the possible
contribution that the plans could make towards addressing issues of social exclusion.
6.13.4 Forecast on and off-site additional employment forecasts have then been compared
against potential low skill labour surpluses in these “deprived districts”.
6.14 Regional Impacts
6.14.1 The appraisal of regional impacts of airport development options has been made against
the relevant regional policies for the East, South East and London regions. These are
summarised in Table 6.6 below.
Table 6.6: Relevant Regional Policies
Region Planning and Transportation Policy
Economic Strategy Other / Non-Statutory
East GO-EAST (Nov 2000)
RPG6: East Anglia
EEDA (June 2001) East of
England 2010
South East GOSE/GO-EAST/GOL
(March 2001) RPG9: South
East
SEEDA (Oct 1999) Building
A World Class Region
RTP (May 1999) Areas
of Economic Pressure
GOSE/GO-EAST/GOL (Feb
1995) RPG9a: Thames
Gateway
London GLA/Mayor of London (May
2001) Towards The London
Plan
LDA (July 2001) Success
Through Diversity: London’s
Economic Development
Strategy
6.14.2 The assessment of the impact of development options against regional policy has also
been made with reference to relevant Policy Planning Guidance (PPG) documentation.
The working assumption that has been made is that these broad principles are likely to
prevail over the next 30 years. As such, development options will have to recognise that
they are appraised against these longstanding principles. This reflects the reality of

SERAS Stage Two: Appraisal Findings Report
123FL1124000.RCE.RP.Jo3.020131.Appraisal Findings
greater public awareness of the environment and the growing level of international
commitment, guidance and regulation to secure sustainable development.
6.14.3 The various policy objectives contained within the documents noted above have been
structured under the headings of housing, economy (employment/labour force) and
transport. The objectives have then been structured as outlined below to allow scoring (by
means of a qualitative scoring index) of small and large scale development options, in
terms of their positive or negative contribution towards the achievement of regional policy
objectives.
Table 6.7: Regional Policy Objectives
Area Objectives
Housing Accommodate housing growth
Meet brownfield development targets
Meet affordable housing targets
Provision of housing near to employment areas
Employment/Labour Force Meet demand for labour
Diversify employment base
Assist people entering or re-entering the job market
Develop requisite training and skills profile
Provide employment sites in sustainable locations
Develop business clusters
Provide a range of business accommodation
Transport Allow multi-modal access to major hubs, eg, ports
Reduce the need to travel
Reduce pressures of longer distance commuting
Improve rail network
6.15 Integration Impacts
6.15.1 The appraisal of impacts in relation to Integration is taken in the context of SERAS to relate
to the way in which airport development options fit with other Government policies, and
particularly whether they complement or are in conflict with other policies. The Appraisal
SERAS Stage Two: Appraisal Findings Report
124FL1124000.RCE.RP.Jo3.020131.Appraisal Findings
Framework for Airports in the South East identified relevant policy areas in which the
impacts of airport development options should be appraised. In some Government policy
areas, however, it is apparent that policies are under review and that next versions of
policies are awaiting the formulation of future airports policy. Regional transport policies,
for example, will be developed on the basis of on-going strategic, multi-modal studies and
future airports policy, and the next revision of Regional Planning Guidance will incorporate
future airports policy into spatial development policies.
6.15.2 The five policy areas in which the impact of airport development options have been
appraised are:
• Airport Strategy: a comment on airport development options in relation to
levels of airport use and development incorporated in current plans,
• Land Development Strategy: a comment on airport development options in
terms of Green Belt taken, greenfield land taken and brownfield land re-
used,
• Transport Strategy: a comment on the surface transport requirements of
airport development options in relation to strategic plans,
• Social Strategy: a comment on airport development strategies in relation to
social exclusion policies (see Section 6.14 above),
• Spatial Strategy: a comment on airport development strategies in relation to
spatial development policy (see Section 6.15 above).
6.16 Financial
Purpose of Financial Appraisal
6.16.1 The principal purpose of the financial appraisal is to estimate the rate of return generated
by the additional investment and capacity provided in each package relative to the base
case. Returns are based on a comparison of airport capital and operating costs with
airport revenues and revenues from other sources. Calculated rates of return are
compared with a high target rate of return of 12.5% (pre-tax, nominal) to establish the
financial viability of the investment options within a package. Rates of return are calculated
first on the basis of the revenues generated by the investment option. Supplementary
sources of revenue are considered in sensitivity tests. All estimated figures are in nominal
terms with inflation assumed to grow at 2.5% per annum over a 60 year period (2000-60).
All costs and revenues are discounted back to 2000. Principal outputs are project Net
Present Values (NPV), assuming a 12.5% discount rate, and Internal Rates of Return
(IRR).

SERAS Stage Two: Appraisal Findings Report
125FL1124000.RCE.RP.Jo3.020131.Appraisal Findings
Cost and Revenue Calculations
6.16.2 The costs and revenues of each option are calculated as incremental numbers above the
base case. That is, the appraisals show the financial performance of the options in each
package on the assumption that they are additional to package 2.
6.16.3 Capital costs relating to the construction of each package have been separately estimated.
Runway-related costs are assumed to be incurred in the years prior to assumed runway
opening, eg, 2011, 2021, etc as appropriate. Terminal costs are fed in by the model in
tranches of 10 mppa capacity as the available terminal capacity is filled up. Initial capital
costs are supplemented by refurbishment costs. Runways and terminals are assumed to
be refurbished every eight and twelve years respectively, at a cost of 10% of the original
capital cost.
6.16.4 Airport operating costs are based on current operating costs per passenger at each airport
as reported in the University of Bath’s Airport Industry Statistics, 2001. Operating costs at
Cliffe Marshes have been assumed to be 10% lower than Heathrow’s, as some efficiency
improvements can be expected with the operation of a new airport.
6.16.5 Airport revenues per passenger, from both aeronautical and non-aeronautical sources, for each airport have also been derived from the University of Bath’s Airport Industry Statistics.
Other than changing in line with inflation, the core assumption is that they do not change through time, ie, this is equivalent to a regulatory regime of x = 0 in an (Retail Price Index)
RPI – x formula. This assumption effectively implies the retention of the ‘single till’ principle
in setting aeronautical charges.
6.16.6 The effects on IRRs of supplementary revenues levied on air passengers in two different
ways are examined in sensitivity tests. These are: a levy on departing passengers, either
at the airport where the particular investment is made or applied more widely across the
South East airport system; or a change from 0 in the value of x in the RPI ± x formula,
again either at the airport where the investment is made or more widely across South East
airports.
6.16.7 The principal results presented for each package in Chapter 14 are:
• The NPV and IRR of individual investment options or combined options at
one airport within each package run with standard assumptions,
• The effects on IRRs of variations in revenues per passenger, operating costs
per passenger and total capital costs,
• The effects on IRRs of different levies applied on departing passengers,
either at the airport where the investment is made or more widely, and

SERAS Stage Two: Appraisal Findings Report
126FL1124000.RCE.RP.Jo3.020131.Appraisal Findings
• The effects on IRRs of a change in x in an RPI – x formula, again either at
the airport where the investment is made or more widely.
6.17 Economic Appraisal
6.17.1 The appraisal of the direct economic impacts of the SERAS packages is carried out in a
spreadsheet model called SCAB. Within SCAB the net benefits to users (generated and
existing) and producers are calculated and compared with the capital costs of packages to
calculate a net present value (NPV) of the economic impacts. These net present values
can then be compared for different packages. SCAB takes outputs from SPASM (forecasts
of passengers, ATMs and shadow costs), and uses these to calculate the benefits to
generated users and to existing users for each package. Producer surpluses and capital
costs are derived from the SERAS financial model. The additional revenue to the
Government from the Air Passenger Duty charged to additional passengers is calculated
and added to the benefits. There are also freight user benefits, which are also added into
the net benefits. NPVs are calculated using the Government’s current test discount rate of
6% per annum in real terms.
6.17.2 SPASM gives forecasts for each year to 2030, but the economic benefits need to be
measured for at least 30 years after the last investment in a package, so inputs of costs
and benefits are extended to 2060. In order to be consistent, as the packages have capital
investment in different years, the costs and benefits reported here are measured between
2000 and 2060 for all packages. The years over which costs and benefits are measured is
a user input to the model. It is assumed that no further capacity is added after 2030.
6.17.3 The base case against which the benefits are measured is package 2 (maximum use of
existing runways). The costs and benefits of package 2 compared to package 1 (current
land use planning system) are measured separately.
Benefits to Generated Users
6.17.4 Benefits to generated users are calculated for each type of user, except International to
International interliners, whose origins and destinations are both outside the UK, and who
give benefit to the UK economy only through airport and airline surpluses. The calculation
of benefits to generated passengers at all airports means that the benefits generated at
airports where capacity is increased are dissipated to the extent that there is a loss of
passengers at other airports. Benefits to generated users are calculated at all airports for
each year using the following formula:
0.5*(T2-T1)(C1-C2)
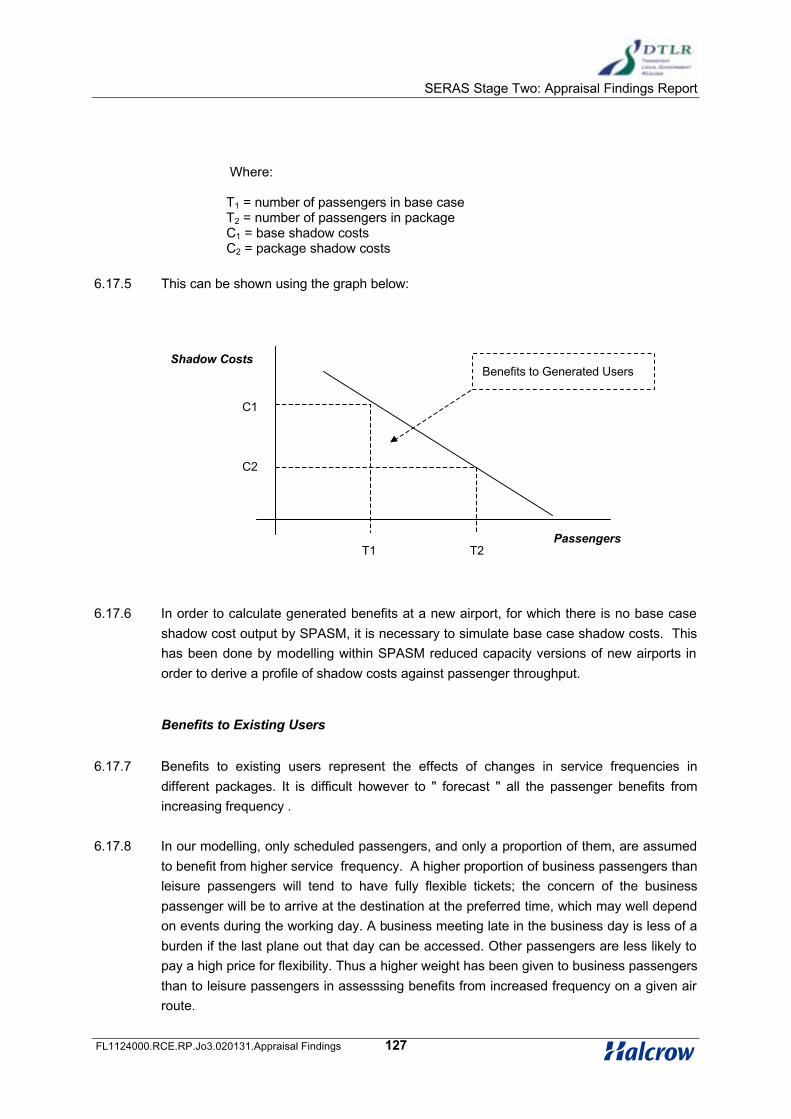
SERAS Stage Two: Appraisal Findings Report
127FL1124000.RCE.RP.Jo3.020131.Appraisal Findings
Where:
T1 = number of passengers in base caseT2 = number of passengers in packageC1 = base shadow costsC2 = package shadow costs
6.17.5 This can be shown using the graph below:
6.17.6 In order to calculate generated benefits at a new airport, for which there is no base case
shadow cost output by SPASM, it is necessary to simulate base case shadow costs. This
has been done by modelling within SPASM reduced capacity versions of new airports in
order to derive a profile of shadow costs against passenger throughput.
Benefits to Existing Users
6.17.7 Benefits to existing users represent the effects of changes in service frequencies in
different packages. It is difficult however to " forecast " all the passenger benefits from
increasing frequency .
6.17.8 In our modelling, only scheduled passengers, and only a proportion of them, are assumed
to benefit from higher service frequency. A higher proportion of business passengers than
leisure passengers will tend to have fully flexible tickets; the concern of the business
passenger will be to arrive at the destination at the preferred time, which may well depend
on events during the working day. A business meeting late in the business day is less of a
burden if the last plane out that day can be accessed. Other passengers are less likely to
pay a high price for flexibility. Thus a higher weight has been given to business passengers
than to leisure passengers in assesssing benefits from increased frequency on a given air
route.
Benefits to Generated Users
C1
C2
T1 T2Passengers
Shadow Costs

SERAS Stage Two: Appraisal Findings Report
128FL1124000.RCE.RP.Jo3.020131.Appraisal Findings
Producer Benefits
6.17.10 Benefits to producers are calculated using the formula below:
6.17.11 The revenue and operating costs are in real prices, and the producer benefits are then discounted at a real rate of 6% per annum.
6.17.12 The benefits to producers are measured at all airports. The financial model has outputs for the five main airports in the appraisal (Heathrow, Gatwick, Luton, Stansted, and Cliffe Marshes). The other airports are measured using average revenues and operating costs for all of these airports.
6.17.13 Benefits to producers take account of all passenger types. They are measured for airports only, not airlines.
Government Revenue
6.17.14 Additional Government revenue is generated by the Air Passenger Duty charged to the additional passengers for each package. This is charged at a standard rate of £10 for destinations in the EEA and £40 for other destinations, and a reduced rate of £5 for destinations in the EEA and £20 for other destinations, with the reduced rate applying to passengers who are carried in the lowest class of travel on any flight.
NPVs
6.17.15 The costs (also in real values, discounted at 6% per annum) and benefits are brought together in a summary sheet containing an NPV calculator. This shows benefits to users, split by foreign and UK passengers, by new (generated) and existing users, benefits for freight users and benefits to producers and the government.
Environmental Charges
6.17.16 Sensitivity tests have been undertaken to reflect Government policy that aviation should bear its full costs including external costs. Three principal sources of external cost associated with the SERAS packages have been taken into account: increased noise; local air quality effects, particularly nitrogen dioxide; and increased global warming impacts,
Producer Benefits = Change in passengers x (revenue per passenger – operating costs per passenger)
6.17.9 Benefits to existing users are measured at all UK airports.
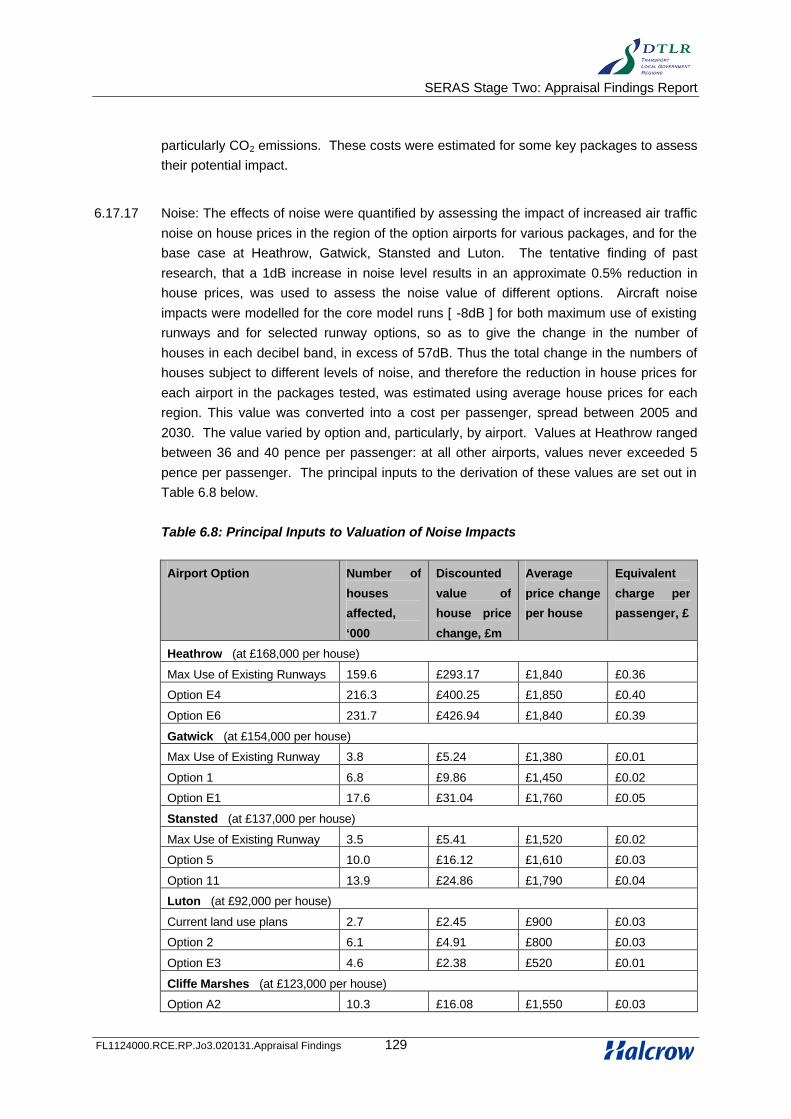
SERAS Stage Two: Appraisal Findings Report
129FL1124000.RCE.RP.Jo3.020131.Appraisal Findings
particularly CO2 emissions. These costs were estimated for some key packages to assess their potential impact.
6.17.17 Noise: The effects of noise were quantified by assessing the impact of increased air traffic noise on house prices in the region of the option airports for various packages, and for the base case at Heathrow, Gatwick, Stansted and Luton. The tentative finding of past research, that a 1dB increase in noise level results in an approximate 0.5% reduction in house prices, was used to assess the noise value of different options. Aircraft noise impacts were modelled for the core model runs [ -8dB ] for both maximum use of existing runways and for selected runway options, so as to give the change in the number of houses in each decibel band, in excess of 57dB. Thus the total change in the numbers of houses subject to different levels of noise, and therefore the reduction in house prices for each airport in the packages tested, was estimated using average house prices for each region. This value was converted into a cost per passenger, spread between 2005 and 2030. The value varied by option and, particularly, by airport. Values at Heathrow ranged between 36 and 40 pence per passenger: at all other airports, values never exceeded 5 pence per passenger. The principal inputs to the derivation of these values are set out in Table 6.8 below.
Table 6.8: Principal Inputs to Valuation of Noise Impacts
Airport Option Number of
houses
affected,
‘000
Discounted
value of
house price
change, £m
Average
price change
per house
Equivalent
charge per
passenger, £
Heathrow (at £168,000 per house)
Max Use of Existing Runways 159.6 £293.17 £1,840 £0.36
Option E4 216.3 £400.25 £1,850 £0.40
Option E6 231.7 £426.94 £1,840 £0.39
Gatwick (at £154,000 per house)
Max Use of Existing Runway 3.8 £5.24 £1,380 £0.01
Option 1 6.8 £9.86 £1,450 £0.02
Option E1 17.6 £31.04 £1,760 £0.05
Stansted (at £137,000 per house)
Max Use of Existing Runway 3.5 £5.41 £1,520 £0.02
Option 5 10.0 £16.12 £1,610 £0.03
Option 11 13.9 £24.86 £1,790 £0.04
Luton (at £92,000 per house)
Current land use plans 2.7 £2.45 £900 £0.03
Option 2 6.1 £4.91 £800 £0.03
Option E3 4.6 £2.38 £520 £0.01
Cliffe Marshes (at £123,000 per house)
Option A2 10.3 £16.08 £1,550 £0.03

SERAS Stage Two: Appraisal Findings Report
130FL1124000.RCE.RP.Jo3.020131.Appraisal Findings
6.17.18 Local Air Quality: The Committee on the Medical Effects of Air Pollutants (COMEAP) gives
guidance on which health effects are considered sufficiently robust for quantification. Evidence of the effects of NO2 on acute mortality is not considered sufficiently robust and COMEAP therefore currently do not advise quantification. There is some evidence, however, that hospital admissions for respiratory diseases are related to concentrations of NO2 and COMEAP suggest quantification as a sensitivity analysis. The available information suggests that respiratory hospital admissions might increase by 0.5% for each 10ug/m3 of NO2. This implies an increased admission rate of approximately 5 per 100,000 people at an NHS cost of £1500 – 2700 per respiratory hospital admission. These values give a total cost of between £7,500 and £13,500 for every 100,000 people subject to an increase of 10ug/m3 of NO2.. It is only at Heathrow that any significant number of people are subject to changes in NO2 of this magnitude in excess of standards with any of the estimation assumptions made, and there the highest estimate is of 30-40,000 affected, indicating that the money value of NO2 effects will be sufficiently small for them not to be expressly represented in any environmental levy.
6.17.19 Global Air Quality: CO2 has been taken as the principal indicator of SERAS options on
global air quality. Estimates were made of the CO2 emissions in 2030 for three selected packages, representing different levels of capacity provision. These estimates, together with an allowance for other contributors to radiative forcing due to aircraft air polluting emissions, and valuing the damage cost of a tonne of carbon at around £70 (and therefore around £20 per tonne of CO2), suggested equivalent charges would add around 3-4% to air fares.
6.17.20 On the basis of these estimates, with global air quality impacts being both the dominant
item and not airport-specific, it seemed appropriate to test the effects of environmental charges as set out in Valuing the External Costs of Aviation, DTLR, December 2000. It was therefore assumed that the introduction of these charges, determined principally by global air quality impacts, would cause the demand for air travel to be reduced by 0.5% in 2006, increasing annually to a 5% decline at the beginning of 2016.
Wider Economic Benefits 6.17.21 In addition to the direct benefits, increased airport capacity is expected to have wider,
indirect economic impacts for the economy as a whole, or for those parts of the economy most closely linked to aviation and air transport. The potential for wider economic impacts from increased airport capacity has been assessed in this study through: the potential increase in productivity across the economy as a whole due to an increase in business-related travel; the increase in foreign direct investment that might follow from increased numbers of business trips by foreign residents; and impacts on the tourism industry.
6.17.22 The potential for productivity growth across the economy as a whole has been assessed
from the change in business trips by air to/from the UK with different packages.

SERAS Stage Two: Appraisal Findings Report
131FL1124000.RCE.RP.Jo3.020131.Appraisal Findings
6.17.23 The benefits from increased foreign direct investment (FDI) due to increased business
travel into the UK are found from the percentage of unconstrained demand for business travel by air to/from the UK by foreign passengers lost with each package. The amount of FDI which could be attributable to each of these passengers, and thus the foregone foreign direct investment, are referred to.
6.17.24 The impacts on the tourism industry of each package are estimated from the potential
change in expenditure in the UK tourism industry associated with each package. The estimates take account of numbers of foreign visitors to the UK and their expenditure and the number of UK visitor trips overseas and the amount UK tourists spend abroad. Calculation of the relative magnitudes of expenditure foregone, by foreign visitors to the UK and UK visitors overseas, is used to calculate the net benefit (or cost) to the UK tourism industry for each package.

SERAS Stage Two: Appraisal Findings Report
132FL1124000.RCE.RP.Jo3.020131.Appraisal Findings
6.18 Air Freight
Air Freight Forecasts
6.18.1 Freighter movements made up 3% of total air traffic movements at London airports in 2000. Freight forecasts have therefore been based on a simplified approach, with base year freight movements increased by national growth forecasts, any excess demand being reallocated across airports on the basis of generalised cost.
Unconstrained Freight Forecasts
6.18.2 For forecasting purposes air freight has been categorised as either:
• express – door to door transport of time-sensitive products, with an average shipment weight between five and ten kilograms, predominately moved by the four integrators, TNT, Fedex, UPS and DHL; or
• standard – less time-sensitive goods usually handled through forwarders or agents
6.18.3 There are two modes of air freight transport; bellyhold, where freight is carried in the bellyhold of an aircraft, and dedicated freighter, where freight is carried by scheduled or charter air freight services. Base year, 1998, express and standard freight volumes by bellyhold and dedicated freighter have been estimated for each airport based on operators’ flight schedules and information contained in the UK Air Freight Study1.
6.18.4 Express air freight has grown by an average of 20% per annum over recent years and now
accounts for over 20% of the UK air freight market. Growth rates for standard air freight have averaged 6% over the last decade. These growth rates will be unsustainable over the long term and growth is forecast to decline to 3% per year, the growth in the road freight industry. Total UK air freight has been held to the totals forecast in the UK Air Freight Study, leading to a six-fold increase in air freight by 2030. The share of express freight is expected to increase to 52% in 2030, slightly below the current share in the US. Air freight forecasts are summarised in Table 6.9
1 UK Air Freight Study, Part 1, November 1999, Part 2, August 2000, MDS Transmodal
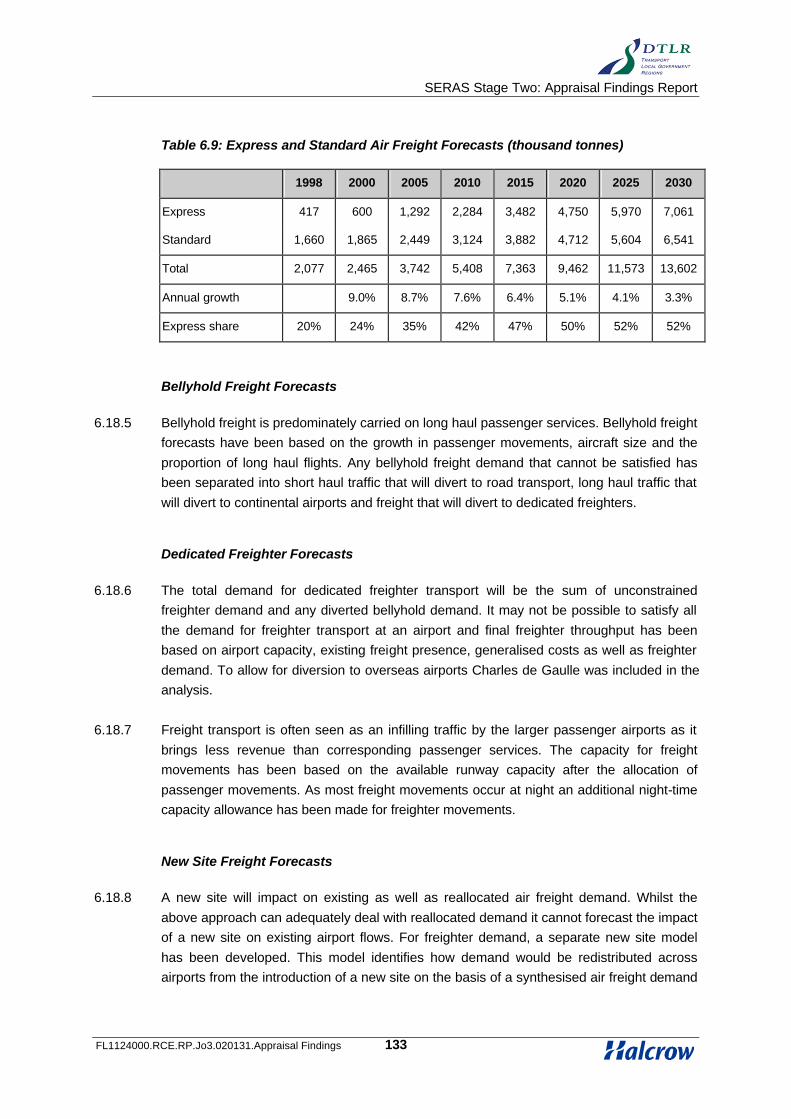
SERAS Stage Two: Appraisal Findings Report
133FL1124000.RCE.RP.Jo3.020131.Appraisal Findings
Table 6.9: Express and Standard Air Freight Forecasts (thousand tonnes)
1998 2000 2005 2010 2015 2020 2025 2030
Express 417 600 1,292 2,284 3,482 4,750 5,970 7,061
Standard 1,660 1,865 2,449 3,124 3,882 4,712 5,604 6,541
Total 2,077 2,465 3,742 5,408 7,363 9,462 11,573 13,602
Annual growth 9.0% 8.7% 7.6% 6.4% 5.1% 4.1% 3.3%
Express share 20% 24% 35% 42% 47% 50% 52% 52%
Bellyhold Freight Forecasts
6.18.5 Bellyhold freight is predominately carried on long haul passenger services. Bellyhold freight forecasts have been based on the growth in passenger movements, aircraft size and the proportion of long haul flights. Any bellyhold freight demand that cannot be satisfied has been separated into short haul traffic that will divert to road transport, long haul traffic that will divert to continental airports and freight that will divert to dedicated freighters.
Dedicated Freighter Forecasts
6.18.6 The total demand for dedicated freighter transport will be the sum of unconstrained freighter demand and any diverted bellyhold demand. It may not be possible to satisfy all the demand for freighter transport at an airport and final freighter throughput has been based on airport capacity, existing freight presence, generalised costs as well as freighter demand. To allow for diversion to overseas airports Charles de Gaulle was included in the analysis.
6.18.7 Freight transport is often seen as an infilling traffic by the larger passenger airports as it
brings less revenue than corresponding passenger services. The capacity for freight movements has been based on the available runway capacity after the allocation of passenger movements. As most freight movements occur at night an additional night-time capacity allowance has been made for freighter movements.
New Site Freight Forecasts
6.18.8 A new site will impact on existing as well as reallocated air freight demand. Whilst the above approach can adequately deal with reallocated demand it cannot forecast the impact of a new site on existing airport flows. For freighter demand, a separate new site model has been developed. This model identifies how demand would be redistributed across airports from the introduction of a new site on the basis of a synthesised air freight demand

SERAS Stage Two: Appraisal Findings Report
134FL1124000.RCE.RP.Jo3.020131.Appraisal Findings
matrix and generalised costs. The impact on bellyhold traffic has been identified through a comparison of unconstrained passenger demand forecasts with and without the new site.
Economic and Financial Appraisal
6.18.9 Airport accounts typically display all costs and revenues in passenger terms, effectively ignoring the (marginal) contribution of freight transport. The financial model uses revenues and costs in these terms and so implicitly includes freight revenues and costs. The financial model will therefore give accurate estimates of costs and revenues if the existing proportions of passenger and freight traffic continue into the future. For South East airports, this is generally the case. At existing South East airports, even if this constant proportion does not hold, any changes in costs and revenues will be small, as freight accounts for less than 5% of total revenues. The impact of freight traffic has therefore not been separately identified for the existing SERAS airports.
6.18.10 At Cliffe Marshes, per passenger costs and revenues have been based on those at
Heathrow, so only allow for a small element of freighter aircraft and freight revenues. As a significant amount of freight traffic is expected at Cliffe, freight costs and revenues have been separately identified.
6.18.11 A simplified approach has been taken to the appraisal of the economic impacts on air
freight. Only the impact on generated traffic has been included. This has followed the same principles as the estimation of benefits to generated passenger traffic, with the benefits measured in terms of user surpluses. Air freight is assumed to benefit from a reduction in ATM shadow costs when additional runway capacity is introduced.
6.19 CO2
6.19.1 The published Appraisal Framework for Airports in the South East and Eastern Regions of England requires an assessment to be made of the impact of aviation strategy on climate change, using CO2 as a proxy. According to the DTLR Report Treatment of Uncertainty for National Estimates of Greenhouse Gas Emissions, over the report’s study period of 1990
to 2010, the uncertainties in national CO2 estimates are three times larger than the expected change in CO2 emissions. Transport accounted for 20.5% of total energy CO2
emissions in 1990, with civil aviation accounting for just 2% of the transport-related emissions.
6.19.2 Given the uncertainties, to assess the impact of overall aviation strategies broad estimates
of the CO2 implications for three SERAS packages have been made. The packages were deliberately chosen to represent a range of the capacity scenarios being appraised in SERAS. Package 2 is a base case with maximum use of the existing runways, but no new runways. Package 5C adds a new runway at Heathrow and is a middle range capacity scenario. Package 18 is a large capacity scenario adding a new runway at Heathrow and
SERAS Stage Two: Appraisal Findings Report
135FL1124000.RCE.RP.Jo3.020131.Appraisal Findings
two new runways at Gatwick. Possible new airport sites do not figure in these packages tested.
6.19.3 Details of the approach are outlined in the SERAS Methodology Report. The SERAS CO2
approach has a "without prejudice" disclaimer that the approach shall not be taken to imply any UK Government preference among the various SBSTA allocation alternatives.
6.19.4 Estimation of CO2 impacts for each scenario took account of CO2 emissions from the
following sources: total mission aircraft emissions; surface access related emissions; and extra emissions from displaced movements under capacity constrained scenarios.
6.19.5 Aircraft emissions estimates are from landing and take-off (LTO) cycles and from cruise:
generally LTO accounts for 20% of aviation-related CO2 and cruise for 80%. Emissions from domestic and international flights from SERAS airports were estimated on the basis of forecast ATMs in 2015, 'great circle' city-pair distances, and representative 2015 aircraft/engine types (as assumed in the local air quality and noise modelling). Emissions estimates include all domestic aviation from and to SERAS airports. Only 50% of total emissions from international flights from SERAS airports have been counted as being attributable to UK policy.
6.19.6 Surface access related emissions are included from all surface access trips in the SERAS
study area to and from SERAS airports. Estimates are based on forecast vehicle kilometres in SERAS surface access models, and future vehicle fleet and emission assumptions taken from the UK Emissions Factor Database and the DMRB as appropriate.
6.19.7 In capacity-constrained South East scenarios, more passengers would travel (flying or by
road/rail) from SERAS airports to UK regional airports and European airports for onward connections (rather than flying direct from the SERAS airports). This could mean increased aircraft CO2 at regional and European airports, and people travelling longer distances by car and train to reach other airports. These displaced movements are included in CO2 estimates: those going to other airports by road/rail are estimated using passenger movements from SPASM; those going by air are included in the total domestic CO2 determined earlier. Aircraft emissions from non-SERAS airports to international destinations are excluded due to lack of data.
6.19.8 Some elements of the CO2 estimates are based on the situation in 2015 (ATM and basic
surface access data for example). However, these components are assumed to be at capacity by 2015, and so are assumed constant to 2030.
6.19.9 The approach provides results as total CO2 emissions (tonnes) for each SERAS package,
and relative changes over the base case.

136FL1124000.RCE.RP.Jo3.020131.Appraisal Findings
SERAS Stage Two: Appraisal Findings Report
Intentionally Blank

SERAS Stage Two: Appraisal Findings Report
FL1124000.RCE.RP.J03.020131.Appraisal Findings 137
7 Appraisal of Options at Main Sites: Heathrow
7.1 Options Appraised in Stage Two
7.1.1 The options appraised at Heathrow consist of mixed mode operation on the existing two
runways and alternative versions of a new runway to the north of the airport. They differ from
the Stage One options principally in that it has been assumed in Stage Two that Terminal Five
will proceed and will be in place by 2007. T5 is therefore assumed in the version of Heathrow
which is defined as both ‘currently envisaged in the land-use planning system’ and ‘makes
maximum use of the existing runways’.
7.1.2 All options assume the reconfiguration of the Central Terminal Area (CTA) – Terminals 1, 2 and
3 – and the space between the existing runways at Heathrow, which is likely to be required over
the period to 2030. These costs are included in the base case: the appraisal of the options
allows for the additional cost relative to the base of providing extra terminal or runway capacity
or associated facilities.
7.1.3 Two mixed mode options have been appraised. Option 1 has the two existing runways
operating in mixed mode throughout the operating day. The current practice of runway
alternation to give periods of relief from being overflown, for half a day each day, would not be
maintained. In addition, the Cranford Agreement, which limits the use of the northern runway
for take-offs in easterly operations, would cease. It has been assumed that mixed mode
operation would be phased in between 2007 and 2011, the 2007 start date reflecting the
provision of additional terminal capacity with the opening of Terminal 5.
7.1.4 Option E1 assumes that mixed mode operation would apply only in the mornings between 0700
and 1200 hours. From 1200 onwards, the practice of runway alternation would apply giving
relief from being overflown after noon on half of the days. Options 1 and E1 share essentially
the same airport layout, to accommodate movements in the morning peak period.
7.1.5 Three alternative new runway options have been appraised. They are all north of the existing
airport, north of the A4 but south of the M4. In each case it is assumed that a new runway could
be in place by 2011. They are combined with different ways of operating the existing runways
and would add ATM capacity of between 158,000 and 274,000 to the 480,000 assumed with
the two existing runways in segregated mode.
7.1.6 Option E4 has a new 2000m runway but no aircraft stands north of the current north runway
(09L-27R). The new runway would operate in mixed mode and the existing runways in
segregated mode.
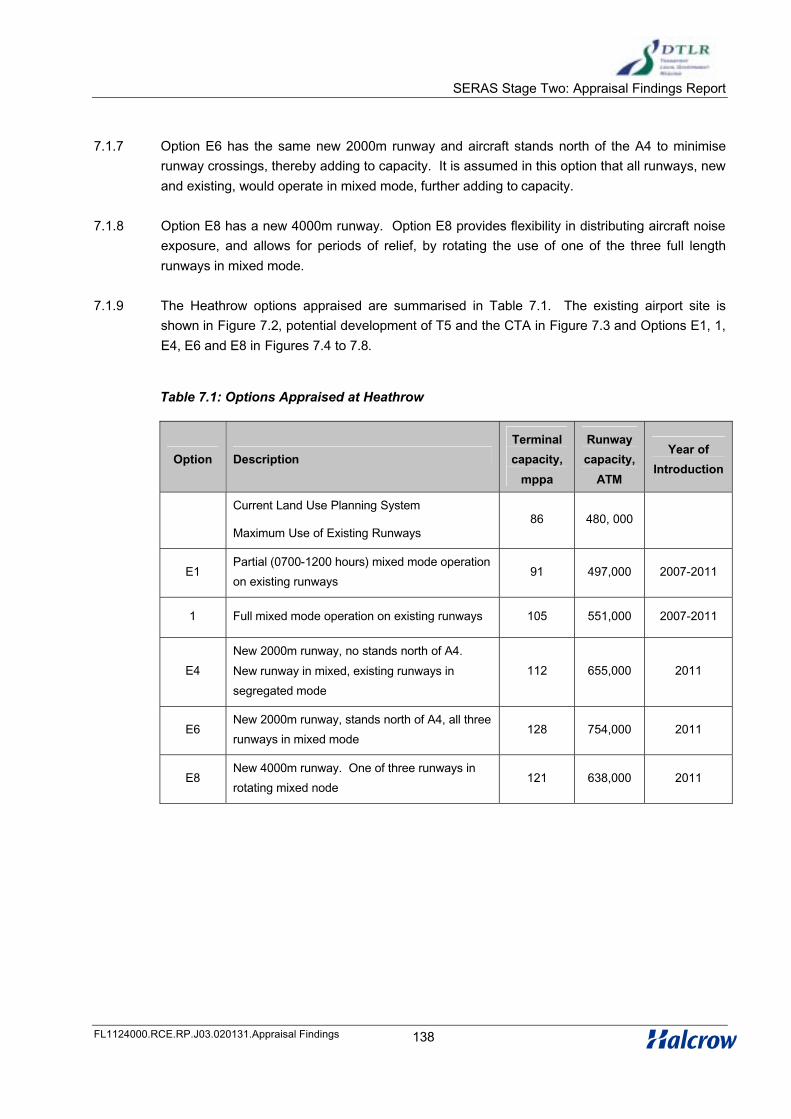
SERAS Stage Two: Appraisal Findings Report
FL1124000.RCE.RP.J03.020131.Appraisal Findings 138
7.1.7 Option E6 has the same new 2000m runway and aircraft stands north of the A4 to minimise
runway crossings, thereby adding to capacity. It is assumed in this option that all runways, new
and existing, would operate in mixed mode, further adding to capacity.
7.1.8 Option E8 has a new 4000m runway. Option E8 provides flexibility in distributing aircraft noise
exposure, and allows for periods of relief, by rotating the use of one of the three full length
runways in mixed mode.
7.1.9 The Heathrow options appraised are summarised in Table 7.1. The existing airport site is
shown in Figure 7.2, potential development of T5 and the CTA in Figure 7.3 and Options E1, 1,
E4, E6 and E8 in Figures 7.4 to 7.8.
Table 7.1: Options Appraised at Heathrow
Option Description
Terminal
capacity,
mppa
Runway
capacity,
ATM
Year of
Introduction
Current Land Use Planning System
Maximum Use of Existing Runways86 480, 000
E1Partial (0700-1200 hours) mixed mode operation
on existing runways91 497,000 2007-2011
1 Full mixed mode operation on existing runways 105 551,000 2007-2011
E4
New 2000m runway, no stands north of A4.
New runway in mixed, existing runways in
segregated mode
112 655,000 2011
E6New 2000m runway, stands north of A4, all three
runways in mixed mode128 754,000 2011
E8New 4000m runway. One of three runways in
rotating mixed node121 638,000 2011

SERAS Stage Two: Appraisal Findings Report
FL1124000.RCE.RP.J03.020131.Appraisal Findings 139
7.2 Capital Costs
Introduction
7.2.1 Table 7.2 below shows the estimated incremental capital costs for each option above the 86
mppa capacity Base Case. Table 7.3 gives the breakdown of surface access (road and rail)
costs.
Table 7.2: Estimated Incremental Capital Costs for Heathrow Options above Base Case(£ million)
Item Option E1 Option 1 Option E4 Option E6 Option E8
Capacity 91 mppa 105 mppa 112 mppa 128 mppa 121 mppa
Terminals & Satellites
Terminal Buildings
Satellite Buildings
Baggage Handling
Total
212
0
86
298
212
0
86
298
339
55
87
481
549
134
95
777
458
79
94
630
Aircraft Pavements
Runways
Taxiways
Aprons / Stands
Total
0
5
129
134
0
5
129
134
25
48
169
242
25
54
255
335
52
59
148
259
Enabling Works & Infrastructure
Demolition, Earthworks, etc
Car Parking
Utility Services
Airside Roads and public
road diversions
Tracked Transit
Drainage
Landscaping
Total
29
5
10
0
113
11
3
171
29
17
10
0
113
11
3
183
170
23
21
45
161
28
10
458
188
37
31
61
393
35
12
759
333
31
31
63
357
33
22
870

SERAS Stage Two: Appraisal Findings Report
FL1124000.RCE.RP.J03.020131.Appraisal Findings 140
Item Option E1 Option 1 Option E4 Option E6 Option E8
Navigation Aids (ATC, ILS & AGL) 0.3 0.3 7 7 8
Cargo & Maintenance
Cargo buildings & aprons
Hangar/ Maintenance
buildings & aprons
Total
9
0
9
9
0
9
10
12
22
19
12
31
19
12
31
Support Facilities, etc
Support facilities
Offices
Other facilities / services
Total
87
140
0
227
87
140
0
227
156
253
0
409
156
253
0
409
156
253
0
409
On-costs 210 213 405 579 552
Contingencies 262 266 506 724 689
Land Costs 16 16 201 274 402
Sub-total:
Airport Development Costs1328 1348 2731 3895 3849
Airport Development Costs per
mppa provided above 86 mppa
Base Case
266 71 105 93 110
Costs of Associated Surface
Access (see Table 7.3)288 288 1253 1253 1253
Total Capital Costs 1616 1636 3984 5148 5102
Total Capital Costs per mppa
provided above 86 mppa Base
Case
323 86 153 123 146

SERAS Stage Two: Appraisal Findings Report
FL1124000.RCE.RP.J03.020131.Appraisal Findings 141
Table 7.3: Estimated ‘Airport Specific’ Surface Access Costs (£ million)
7.2.2 As described in Chapter 6, Heathrow rates have been inflated by 10% relative to the other
airport sites in order to reflect the higher cost of capital works in the locality.
7.2.3 The reconstruction or re-modelling of the Central Terminal Area (CTA - comprising Terminals 1,
2 & 3) is inherent in the facilities planning for every Option, including the Base Case, and has
been estimated to cost in the order of £1.6 billion, excluding on-costs but including an allowance
for working within an operational airfield. This view has been taken in recognition of the age
and condition of the existing facilities and the notion that reconstruction would be required
irrespective of other airport development in order to retain an acceptable level of service
standard. The costs of these works are not recorded in the above table. This also applies to
costs associated with T5, also included in every option including the Base Case, which has a
Item Option E1 Option 1 Option E4 Option E6 Option E8
Road Schemes
Tunnelled link to M3
A4 & M4 Spur diverted in tunnels –inc. in Airport Development Cost
Sub Total
n/a
0
n/a
0
340
340 As E4 As E4
Rail Schemes
T5 to Staines (Airtrack)
Upgrade Acton Wells - Cricklewood
Improvement near Willesden
Multitrack Airport Junction to Acton
(proportion attributable to Airport)
Hayes Station alterations and
Double-track Stockley Viaduct
Heathrow West Stn & connections
Airtrack – Colnbrook Branch
Sub Total
238
n/a
n/a
n/a
50
n/a
n/a
288
238
n/a
n/a
n/a
50
n/a
n/a
288
238
88
38
375
n/a
125
50
913 As E4 As E4
Total 288 288 1253 1253 1253
SERAS Stage Two: Appraisal Findings Report
FL1124000.RCE.RP.J03.020131.Appraisal Findings 142
capital cost in the order of £2.1 billion using the same rates as for other Heathrow options,
excluding on-costs.
Airport Option Costs
7.2.4 The incremental airport development costs for both Options 1 and E1 are similar. The higher
passenger capacity for Option 1 results from the full mixed mode operations against partial
mixed mode operations, between 0700 and 1200 hours only, for Option E1. Facility planning
and space provision, however, is based on requirements to accommodate the busy, or peak
hour, throughput, which will be the same in both cases. Consequently, the costs per additional
mppa are significantly higher by comparison for Option E1.
7.2.5 The three new runway options have costs per additional mppa of £105, £93 and £110 million
respectively. E4 is a new 2000m runway operating in mixed mode with the existing runways
remaining in segregated mode, giving an assessed annual passenger capacity of 112 mppa.
E6 is also the new 2000m runway but with the new and the existing runways all operating in
mixed mode, giving a capacity of 128 mppa. The lower cost per additional mppa reflects this
higher throughput. E8 is a new full length 4000m runway but with just one of the three runways
operating in mixed mode at any time. Together with the physical costs associated with the
additional runway length in E8, this accounts for the higher cost per mppa in this option. The
capital cost of E6 is significantly higher than E4, primarily due to the provision of additional
satellite and terminal space and the extension of the tracked transit system to the remote
northern satellite. However, this increase is more than offset in terms of cost per mppa.
7.2.6 Road costs related to airport construction in Options E4, E6 and E8, included under ‘enabling
works and infrastructure’, are high, in the range from £40M to £60M million. This is due to
diverting the A4 and M4 spur beneath the site in tunnels which range from about 550m to
1050m long.
7.2.7 The cost of the tracked transit system differs considerably across the options. In Options 1 and
E1 it links the rebuilt CTA to the T4/T6 area whilst in Option E4 it has an additional link to the
satellite east of the CTA. In Options E6 and E8 it is the most expensive because a connection is
required to the new satellite to the north of the A4.
7.2.8 The relative costs of providing car parking at Heathrow are lower than at other SERAS airports
due to a high proportion of surface access being by public transport.
7.2.9 Office space provision is the highest of all airports and has a ratio of between 5400 and 8800
m2 per mppa. It is probable that much of this floorspace could generate revenue through rent or
leasing.
7.2.10 Although not included in the estimates, a cost premium may be expected for working in
operational areas. This may occur for example in all options with the construction of T6 aprons

SERAS Stage Two: Appraisal Findings Report
FL1124000.RCE.RP.J03.020131.Appraisal Findings 143
and the interface of T4 with T6 and in E4, E6 and E8 with taxiways tying in to the existing
northern runway.
7.2.11 Land costs contribute up to 10% of the Airport Development Costs of E4, E6 and E8, primarily
due to a high proportion of the acquired land being residential and commercial.
Surface Access Costs
7.2.12 The rail access costs for all options include Airtrack, running from the mainline near Staines via
T5 with rail improvements to take the trains on to the north of the airport. In Options E1 and 1,
trains are turned back at Hayes, whilst in E4, E6 and E8 they are taken on to St Pancras.
Among the costs for the St Pancras route is an assumed 50% contribution (£375M) to the cost
of multitracking between Airport Junction and Acton Wells. The costs of Options E4, E6 and E8
include the provision of a new ‘Heathrow West’ Intercity station, with connections to the north
and south.
7.2.13 The only road access costs at Heathrow are for the provision of a dual 2-lane highway in tunnel
from T4/T6, southwards to connect with the A316/M3. This is required for Options E4, E6 and
E8. The scheme is not defined and costs have been estimated on the assumption of half being
bored and half in cut and cover. Other major access road improvements are considered to be
required and constructed for the Base Case. Diversions of the A4 and M4 spur in tunnels
(Options E4, E6 and E8) are included in the airport development costs since they are necessary
consequences of construction.
7.2.14 Required improvements to the strategic road network, ie those not specifically required to
accommodate airport related traffic, are on the A4 west of the airport. The cost of widening the
A4 from A3044 junction to M4 junction 5, from single 2 lane to dual 2 lane (required for 2030) is
estimated to be about £12 million.
7.3 Demand Forecasts - Heathrow
7.3.1 Forecast passenger movements, ATMs and passengers per passenger ATM for each Heathrow
option are summarised, at 5 year intervals between 2000 and 2030 in the following tables, while
freight forecasts are considered in Chapter 15:
• Table 7.4: Current Land Use Planning System / Maximum Use of Existing
Runways
• Table 7.5: Option E1
• Table 7.6: Option 1

SERAS Stage Two: Appraisal Findings Report
FL1124000.RCE.RP.J03.020131.Appraisal Findings 144
• Table 7.7: Option E4
• Table 7.8: Option E6
• Table 7.9: Option E8
7.3.2 The principal features of the demand forecasts for each option are summarised below. In the
forecasting it has been assumed that neither charter services nor low cost services would
operate at Heathrow in any of the cases appraised.
Current Land Use Planning System/Maximum Use of Existing Runways
7.3.3 This option is heavily capacity-constrained throughout the period, with runway capacity the
dominant constraint. The assumed terminal capacity, of 86 mppa with T5, is not reached until
2019, when the forecast number of passengers per PATM has risen to around 175 from 139 in
2000. Within the capacity constraint, there is an increase in the number of long haul and USA
ATMs and a fall in domestic and short haul. The number of I to I interliners grows from 18 mppa
to 22 mppa by 2015 and 24 mppa by 2030. Heathrow becomes more of a business airport. Of
passengers to or from the UK, the number of business passengers increases from 16 mppa in
2000 to 24 mppa in 2015 and 34 mppa in 2030. The number of leisure passengers increases
only from 26 mppa in 2000 to a maximum in any year of 27 mppa, and falls to 24 mppa by
2030. Heathrow also becomes a more ‘local’ airport in this and all cases. In 2000, 81% of trips
to/from the UK via Heathrow were to/from London and the South East. By 2015 this proportion
rises to 85% and to 89% by 2030.
Mixed Mode on Existing Runways: Options E1 and 1
7.3.4 The partial mixed mode option (Option E1) provides only a small increase in ATM capacity over
the use of the runways in segregated mode (17,000 ATMs or 3.5% of segregated mode
capacity). It typically adds around 3 mppa to annual passenger movement through Heathrow,
of whom most are short haul passengers up to 2020, then more long haul and USA
passengers. With the full mixed mode option (Option 1), the additional runway capacity (15%)
allows an increase in the number of short haul ATMs through time and some additional long
haul and USA ATMs. The available runway capacity is always fully utilised and the existing
terminal capacity of 86 mppa is filled in 2011. The number of I to I interliners grows to a
maximum of 29 mppa by 2025. The number of business passengers grows to 27 mppa by
2015 and 39 mppa by 2030, with a maximum number of leisure passengers in 2020 of 33
mppa, declining to 29 mppa by 2030.
SERAS Stage Two: Appraisal Findings Report
FL1124000.RCE.RP.J03.020131.Appraisal Findings 145
Option E4
7.3.5 The new runway capacity introduced in 2011 (175,000 ATMs) is always fully utilised, principally
by additional short haul services but also some increases in long haul, USA and domestic
services. The number of I to I interliners at Heathrow increases to a maximum of 33 mppa by
2015 but falls to 31 mppa by 2030. The number of leisure passengers increases to a maximum
of 43 mppa in 2015, but falls to 30 mppa by 2030. The number of business passengers
increases from 16 mppa in 2000 to 33 mppa by 2015 and 46 mppa in 2030.
Option E6
7.3.6 This option provides the largest increase in both runway and terminal capacity over the base
case in 2011. Runway capacity is 754,000 ATMs as opposed to 480,000 ATMs and terminal
capacity 128 mppa as opposed to 86 mppa. The terminal constraint prevents runway capacity
from being fully used. By 2016, the average number of passengers per ATM is 180 and by
2030 is 188. Again the additional capacity is principally taken by short haul services. The
number of I to I interliners increases to a maximum of 38 mppa. The number of leisure trips
to/from the UK increases to a maximum of 51 mppa in 2015 but falls to 38 mppa by 2030, and
the number of business trips to/from the UK increases to 35 mppa by 2015 and 50 mppa by
2030.
Option E8
7.3.7 As with Option E4, the additional runway capacity provided in 2011 is filled from its introduction,
with increases in all route categories. The number of I to I interliners increases to a maximum
of 34 mppa in 2030, the number of leisure trips to/from the UK increases to a maximum of 41
mppa in 2015 but falls to 37 mppa by 2030. The number of business trips to/from the UK
reaches 32 mppa by 2015 and 47 mppa by 2030.

SERAS Stage Two: Appraisal Findings Report
FL1124000.RCE.RP.J03.020131.Appraisal Findings 146
Table 7.4: Heathrow Option - Current Land Use Planning System / Maximum Use of Existing Runways
2000 2005 2010 2015 2020 2025 2030
Passengers, mppa
Scheduled Domestic 4 4 4 5 6 7 7
Short haul 30 31 31 29 30 29 28
USA 14 16 17 18 21 22 23
Long haul 16 19 22 24 29 31 31
Total 64 70 74 76 86 89 89
Charter 0 0 0 0 0 0 0
Low cost 0 0 0 0 0 0 0
Total 64 71 75 77 86 89 89
ATMs, ‘000
Scheduled Domestic 68 60 58 56 56 56 54
Short haul 278 279 276 259 256 244 234
USA 48 55 60 61 70 74 76
Long haul 65 78 86 88 99 105 106
Total 459 472 480 464 481 479 470
Charter 0 0 0 0 0 0 0
Low cost 0 0 0 0 0 0 0
Total 461 474 482 466 483 481 473
Passengers/PATM
Scheduled 139 149 155 165 178 185 189
Charter 0 0 0 0 0 0 0
Low cost 0 0 0 0 0 0 0
Average 139 149 155 165 178 185 189
Note: Figures in bold are capacity-constrained forecasts
‘Other’ categories, not shown, are included in totals. Totals may not sum due to rounding

SERAS Stage Two: Appraisal Findings Report
FL1124000.RCE.RP.J03.020131.Appraisal Findings 147
Table 7.5: Heathrow Option E1 - Partial Mixed Mode Operation on Existing Runways
2000 2005 2010 2015 2020 2025 2030
Passengers, mppa
Scheduled Domestic 4 4 5 5 6 6 6
Short haul 30 31 32 31 32 31 30
USA 14 16 17 19 21 23 24
Long haul 16 19 23 25 29 31 33
Total 64 70 77 80 88 91 93
Charter 0 0 0 0 0 0 0
Low cost 0 0 0 0 0 0 0
Total 64 71 77 81 88 92 94
ATMs, ‘000
Scheduled Domestic 68 60 59 56 56 56 55
Short haul 278 279 287 278 266 257 248
USA 48 55 61 64 71 76 79
Long haul 65 78 87 91 99 106 111
Total 459 472 493 489 492 496 493
Charter 0 0 0 0 0 0 0
Low cost 0 0 0 0 0 0 0
Total 461 474 495 491 494 498 495
Passengers/PATM
Scheduled 139 149 155 165 178 185 190
Charter 0 0 0 0 0 0 0
Low cost 0 0 0 0 0 0 0
Average 139 149 155 165 178 185 190
Note: Figures in bold are capacity-constrained forecasts
‘Other’ categories, not shown, are included in totals. Totals may not sum due to rounding

SERAS Stage Two: Appraisal Findings Report
FL1124000.RCE.RP.J03.020131.Appraisal Findings 148
Table 7.6: Heathrow Option 1: Full Mixed Mode Operation on Existing Runways
2000 2005 2010 2015 2020 2025 2030
Passengers, mppa
Scheduled Domestic 4 4 5 5 6 6 7
Short haul 30 31 38 38 39 37 37
USA 14 16 18 21 23 25 26
Long haul 16 19 24 27 31 33 35
Total 64 70 85 91 99 101 104
Charter 0 0 0 0 0 0 0
Low cost 0 0 0 0 0 0 0
Total 64 71 85 91 99 101 104
ATMs, ‘000
Scheduled Domestic 68 60 61 59 57 57 56
Short haul 278 279 322 325 322 305 293
USA 48 55 64 68 75 81 83
Long haul 65 78 88 95 104 110 116
Total 459 472 536 546 558 552 548
Charter 0 0 0 0 0 0 0
Low cost 0 0 0 0 0 0 0
Total 461 474 538 548 560 554 550
Passengers/PATM
Scheduled 139 149 157 166 177 183 189
Charter 0 0 0 0 0 0 0
Low cost 0 0 0 0 0 0 0
Average 139 149 157 166 177 183 189
Note: Figures in bold are capacity-constrained forecasts
‘Other’ categories, not shown, are included in totals. Totals may not sum due to rounding

SERAS Stage Two: Appraisal Findings Report
FL1124000.RCE.RP.J03.020131.Appraisal Findings 149
Table 7.7: Heathrow Option E4 - New 2000m Runway, Existing Runways in Segregated Mode
2000 2005 2010 2015 2020 2025 2030
Passengers, mppa
Scheduled Domestic 4 4 4 5 6 6 7
Short haul 30 31 31 54 52 47 57
USA 14 16 17 24 25 26 20
Long haul 16 19 22 30 33 35 31
Total 64 70 74 113 116 114 115
Charter 0 0 0 0 0 0 0
Low cost 0 0 0 0 0 0 0
Total 64 71 75 114 116 115 115
ATMs, ‘000
Scheduled Domestic 68 60 58 66 59 57 58
Short haul 278 279 276 412 387 349 396
USA 48 55 60 76 80 83 65
Long haul 65 78 86 100 110 117 106
Total 459 472 480 654 636 606 625
Charter 0 0 0 0 0 0 0
Low cost 0 0 0 0 0 0 0
Total 461 474 482 656 638 608 627
Passengers/PATM
Scheduled 139 149 155 174 182 189 184
Charter 0 0 0 0 0 0 0
Low cost 0 0 0 0 0 0 0
Average 139 149 155 174 182 189 184
Note: Figures in bold are capacity-constrained forecasts
‘Other’ categories, not shown, are included in totals. Totals may not sum due to rounding
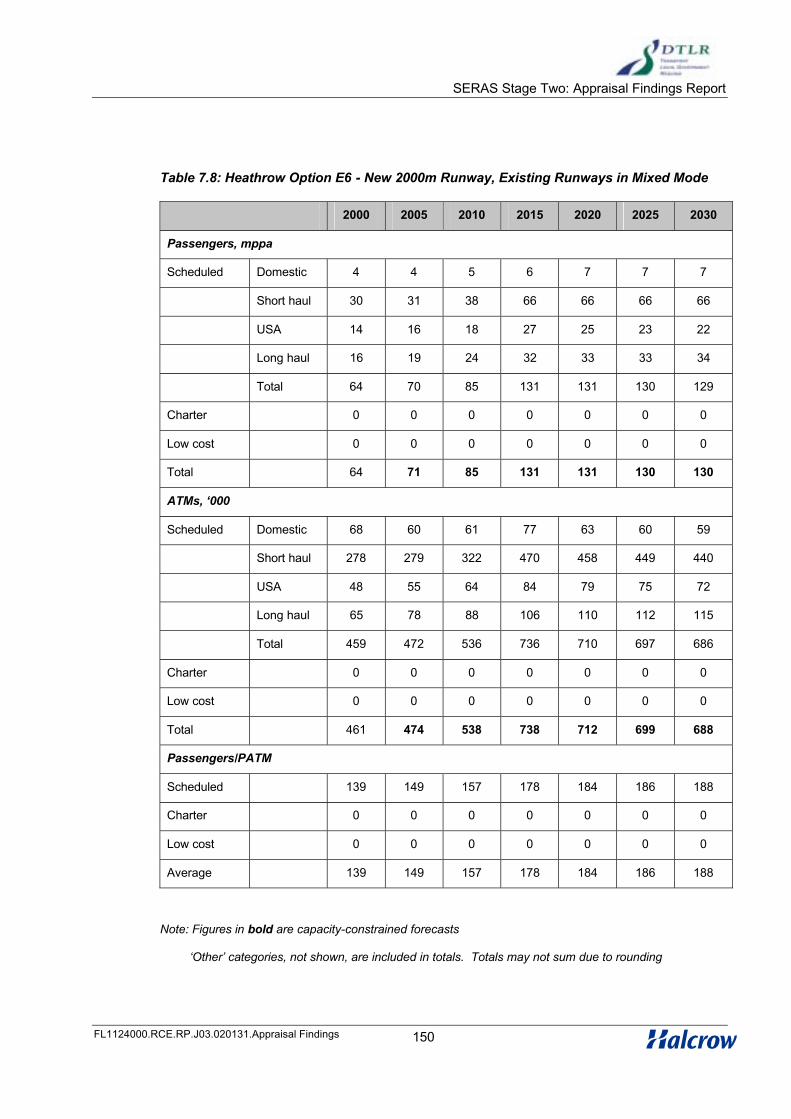
SERAS Stage Two: Appraisal Findings Report
FL1124000.RCE.RP.J03.020131.Appraisal Findings 150
Table 7.8: Heathrow Option E6 - New 2000m Runway, Existing Runways in Mixed Mode
2000 2005 2010 2015 2020 2025 2030
Passengers, mppa
Scheduled Domestic 4 4 5 6 7 7 7
Short haul 30 31 38 66 66 66 66
USA 14 16 18 27 25 23 22
Long haul 16 19 24 32 33 33 34
Total 64 70 85 131 131 130 129
Charter 0 0 0 0 0 0 0
Low cost 0 0 0 0 0 0 0
Total 64 71 85 131 131 130 130
ATMs, ‘000
Scheduled Domestic 68 60 61 77 63 60 59
Short haul 278 279 322 470 458 449 440
USA 48 55 64 84 79 75 72
Long haul 65 78 88 106 110 112 115
Total 459 472 536 736 710 697 686
Charter 0 0 0 0 0 0 0
Low cost 0 0 0 0 0 0 0
Total 461 474 538 738 712 699 688
Passengers/PATM
Scheduled 139 149 157 178 184 186 188
Charter 0 0 0 0 0 0 0
Low cost 0 0 0 0 0 0 0
Average 139 149 157 178 184 186 188
Note: Figures in bold are capacity-constrained forecasts
‘Other’ categories, not shown, are included in totals. Totals may not sum due to rounding

SERAS Stage Two: Appraisal Findings Report
FL1124000.RCE.RP.J03.020131.Appraisal Findings 151
Table 7.9: Heathrow Option E8 - New 4000m Runway, One of Three Runways in Mixed Mode
2000 2005 2010 2015 2020 2025 2030
Passengers, mppa
Scheduled Domestic 4 4 5 5 6 6 6
Short haul 30 31 38 52 53 52 52
USA 14 16 18 23 25 27 28
Long haul 16 19 24 30 33 35 38
Total 64 70 85 110 117 120 124
Charter 0 0 0 0 0 0 0
Low cost 0 0 0 0 0 0 0
Total 64 68 85 110 118 121 125
ATMs, ‘000
Scheduled Domestic 68 60 61 63 59 58 57
Short haul 278 279 322 398 395 384 375
USA 48 55 64 75 82 86 89
Long haul 65 78 88 99 109 117 125
Total 459 472 535 635 644 644 646
Charter 0 0 0 0 0 0 0
Low cost 0 0 0 0 0 0 0
Total 461 474 538 637 646 646 648
Passengers/PATM
Scheduled 139 149 157 173 182 187 193
Charter 0 0 0 0 0 0 0
Low cost 0 0 0 0 0 0 0
Average 139 149 157 173 182 187 193
Note: Figures in bold are capacity-constrained forecasts
‘Other’ categories, not shown, are included in totals. Totals may not sum due to rounding

SERAS Stage Two: Appraisal Findings Report
FL1124000.RCE.RP.J03.020131.Appraisal Findings 152
7.4 Safety Risk
7.4.1 The Stage Two assessment of safety risk appraises the third party risk associated with both
existing and new runway options. The full extent of the 1;10,000 and 1:100,000 designated risk
areas are shown on the following Figures. The runway end origins of the 1:1,000,000 contours
are also shown but extend beyond the limits of the drawings.
• Figure 7.9 – Maximum Use of Existing Runways
• Figure 7.10 – Option E1, Partial Mixed Mode
• Figure 7.11 – Option1, Full Mixed Mode
• Figure 7.12 – Option E4, New 2000m runway in mixed mode with existing in
segregated
• Figure 7.13 – Option E6, New 2000m runway in mixed mode with existing also in
mixed
• Figure 7.14 – Option E8, New full-length runway in rotating mixed mode
1:10,000 Risk Contours
7.4.2 The impact of the 1:10,000 risk contours are shown in Table 7.10 below;
Table 7.10: 1:10,000 Risk Contours
ImpactMax
Use1 E1 E4 E6 E8
Increase in Area (ha) above Max
Use (West and East)W 12.5E 11.8
W +2.3E +2.2
W +0.4E +0.4
W +5.1E +4.9
W +7.7E +7.4
W +4.6E +4.5
Properties within contour
(outside airport boundary) above
Max Use
None 2 2 2 2 2
% developed area affected
(outside airport boundary) above
Max Use
0 0 0 0 0 0
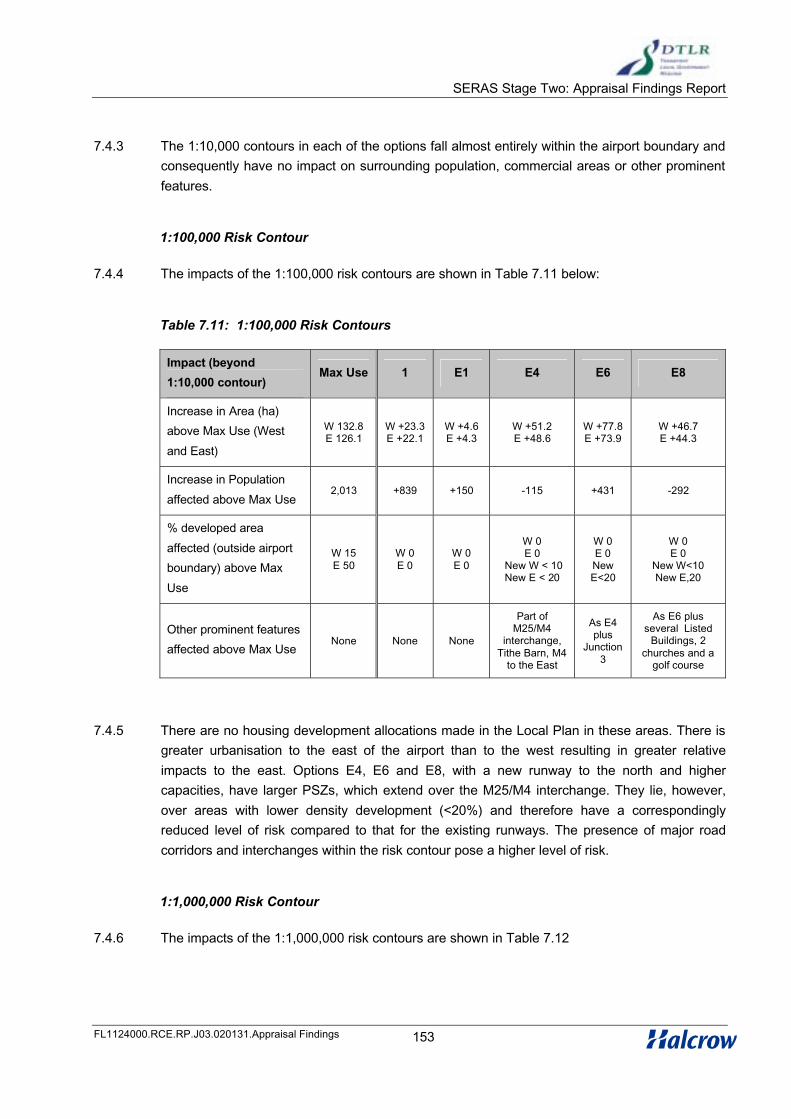
SERAS Stage Two: Appraisal Findings Report
FL1124000.RCE.RP.J03.020131.Appraisal Findings 153
7.4.3 The 1:10,000 contours in each of the options fall almost entirely within the airport boundary and
consequently have no impact on surrounding population, commercial areas or other prominent
features.
1:100,000 Risk Contour
7.4.4 The impacts of the 1:100,000 risk contours are shown in Table 7.11 below:
Table 7.11: 1:100,000 Risk Contours
Impact (beyond
1:10,000 contour)Max Use 1 E1 E4 E6 E8
Increase in Area (ha)
above Max Use (West
and East)
W 132.8E 126.1
W +23.3 E +22.1
W +4.6E +4.3
W +51.2E +48.6
W +77.8E +73.9
W +46.7E +44.3
Increase in Population
affected above Max Use2,013 +839 +150 -115 +431 -292
% developed area
affected (outside airport
boundary) above Max
Use
W 15E 50
W 0E 0
W 0E 0
W 0E 0
New W < 10New E < 20
W 0E 0NewE<20
W 0E 0
New W<10New E,20
Other prominent features
affected above Max UseNone None None
Part of M25/M4
interchange,Tithe Barn, M4
to the East
As E4 plus
Junction3
As E6 plus several Listed
Buildings, 2 churches and a
golf course
7.4.5 There are no housing development allocations made in the Local Plan in these areas. There is
greater urbanisation to the east of the airport than to the west resulting in greater relative
impacts to the east. Options E4, E6 and E8, with a new runway to the north and higher
capacities, have larger PSZs, which extend over the M25/M4 interchange. They lie, however,
over areas with lower density development (<20%) and therefore have a correspondingly
reduced level of risk compared to that for the existing runways. The presence of major road
corridors and interchanges within the risk contour pose a higher level of risk.
1:1,000,000 Risk Contour
7.4.6 The impacts of the 1:1,000,000 risk contours are shown in Table 7.12

SERAS Stage Two: Appraisal Findings Report
FL1124000.RCE.RP.J03.020131.Appraisal Findings 154
Table 7.12: 1,000,000 Risk Contours
Impact
(beyond
1:100,000
contour)
Max Use 1 E1 E4 E6 E8
Increase in area (ha) above Max Use (West and East)
W 1253.1 E 1189.8
W +233.4E +221.6
W +45.6E +43.3
W +512.4E +486.4
W +778.2E +738.9
W +467.2E +443.6
% developedarea affected above Max Use
W <10E 65–70
W +<5E +<5
W 0E 0
W0E0
New W + <5New E +15 to
20
W0E0
New W + <5New E + 15 to
20
W0E0
New W + <5New E + 15 to
20
7.4.7 Prominent features affected at Max Use:
• West – M25 and J14 of M25, railway line
• East – School, 3 churches, cemetery, civic centre, recreation centre, A4, A30,
Royal Botanic Gardens
7.4.8 Prominent features affected above Max Use:
• Option 1: West – 1 Church; East – None
• Option E1: West – None; East – None
• Option E4: West – M25 J15, M4; East – 2 schools, M4
• Option E6: West – M25 J15, M4; East – 2 schools, M4
• Option E8: West – M25 J15, M4; East – A4, 2 churches

SERAS Stage Two: Appraisal Findings Report
FL1124000.RCE.RP.J03.020131.Appraisal Findings 155
7.5 Surface Access
Infrastructure and service assumptions - roads
7.5.1 For the purposes of surface access demand forecasting, the changes to the existing road
access arrangements were based on the findings of Stage One appraisals. This helped define a
number of schemes associated with each option, as summarised in Table 7.13 and shown in
Figure 7.19. All of the options (including the maximum use of existing runways) include the new
links proposed between the M25 and Terminal 5. No further changes to the road access
arrangements are assumed for the options with partial mixed mode (Option E1) or full mixed
mode (Option 1) operation.
7.5.2 It should be noted that options including a new runway would each require that some of the
existing A4 and M4 Spur be put into tunnel – the extent of tunnelling differing between options.
Similarly, it has been assumed that some of the local roads in Harmondsworth and Harlington,
severed by the new runway and apron facilities in these options, would be closed. It is assumed
that each of the higher capacity options, with an additional runway, would require an additional
road access from the M3/A316 to the southern terminals. A notional alignment for this
(tunnelled) link is shown on Figure 7.19. All new and improved roads are assumed to be built
as dual 2-lane carriageways with grade-separated junctions.

SERAS Stage Two: Appraisal Findings Report
FL1124000.RCE.RP.J03.020131.Appraisal Findings 156
Table 7.13: Changes to road access – Heathrow Options
Scheme
Current Land
Use Planning
System
Maximum Use
of Existing
Runways
(Package 1 & 2)
Option E1
(Partial
mixed mode)
(Package 3)
Option 1
(Full mixed
mode)
(Package 4)
Options
E6/E4/E8
(Package
5a/b/c)
1. Closure of local roads in
Harmondsworth and Harlington!
2. M4 Spur in tunnel beneath
extended airport!
3. A4 in tunnel beneath extended
airport!
4. Widening of south-western
section of Perimeter Road! ! !
5. Widening of eastern section of
Southern Perimeter Road! ! !
6. New link between M3/A316 and
southern terminals !
Infrastructure and service assumptions – rail
7.5.3 Additions to Base Case / Max Use rail infrastructure and services were based on Stage One
findings and shaped by discussions, with DTLR and SRA in particular, on the potential to
integrate airport-focused schemes with parallel improvements in infrastructure and services
planned to accommodate future increases in non-airport demand. It is assumed that in the
Base Case T5 will be accompanied at least by extension of the Heathrow Express and
Piccadilly Line to serve T5 and by the upgrading of the Piccadilly Line, to give higher
frequencies and increased capacity. Schemes /services that were associated with each Option
are summarised in Table 7.14 and shown in Figures 7.23 to 7.26.
7.5.4 The "Airtrack" link between T5 and Staines is assumed for Options E1, 1 and E4/6/8 and
services to Heathrow via the proposed CrossRail project (linking suburban lines in East and
West London) are assumed for Options 1 and E4/6/8. The services proposed for the Airtrack
link are paired with new services proposed to the north east of the airport running on existing
lines, but which will need further infrastructure works: between Acton and Cricklewood for

SERAS Stage Two: Appraisal Findings Report
FL1124000.RCE.RP.J03.020131.Appraisal Findings 157
access to St Pancras and Watford (West Coast Main Line); and additional tracks on the Great
Western between Hayes and Acton (or a major overhaul of Thames Trains suburban services) if
more than 4 additional trains per hour are to be run. The latter is also needed for CrossRail.
7.5.5 It should, however, be noted that the main function of these airport services would be to
improve the public transport accessibility of the airport (and thus increase public transport's
mode share and reduce highway demand) rather than to address any specific public transport
crowding issues. The infrastructure improvements and services could be equally applicable in
the Base Case, and their step-wise association with Options E1 and 1 is intended to facilitate
the measurement of the marginal impacts of each scheme on airport options with broadly
similar surface access demand.
7.5.6 A surface station to the west of T5, with links to the Great Western Main Line and via Airtrack to
Staines is added for Options E4/6/8, allowing direct InterCity (diesel) access to the airport with a
tracked-transit link via T5. With a further link between T5 and this station's northern access line,
local (Cross-Rail) Services can run to Slough and Reading.

SERAS Stage Two: Appraisal Findings Report
FL1124000.RCE.RP.J03.020131.Appraisal Findings 158
Table 7.14: Changes to rail access – Heathrow Options
Infrastructure Services
Current Land Use Planning System/Maximum Use of
Existing Runways
Option E1(Partial mixed
mode)
Option 1(Full mixed
mode)
OptionsE6/E4/E8
Extension of rail and
underground networks to T5
Heathrow Express and Piccadilly Line services at T5
T5-T123-Hayes-Ealing rail service! ! ! !
Piccadilly Line Upgrade Increased frequency and capacity on Piccadilly line ! ! ! !
"Airtrack" link T5-Staines
Upgrade Acton-Cricklewood
Additional tracks Hayes-Acton
Guildford-Woking-Staines-Heathrow-
Reading-Bracknell-Staines-Heathrow-
Waterloo-Richmond-Staines-Heathrow-
Paired with
Heathrow-Ealing-W.Hampstead-St.Pancras
Heathrow - Ealing-Watford-St Albans
!
!
!
!
!
!
CrossRail Heathrow-Ealing-Paddington-City-Stratford-Romford-Shenfield ! !
"Heathrow West" station,
connections to Iver/West
Drayton and Staines
InterCity services from South West, South Wales, Birmingham,
Manchester, Newcastle, Leeds, Brighton (via Gatwick)!
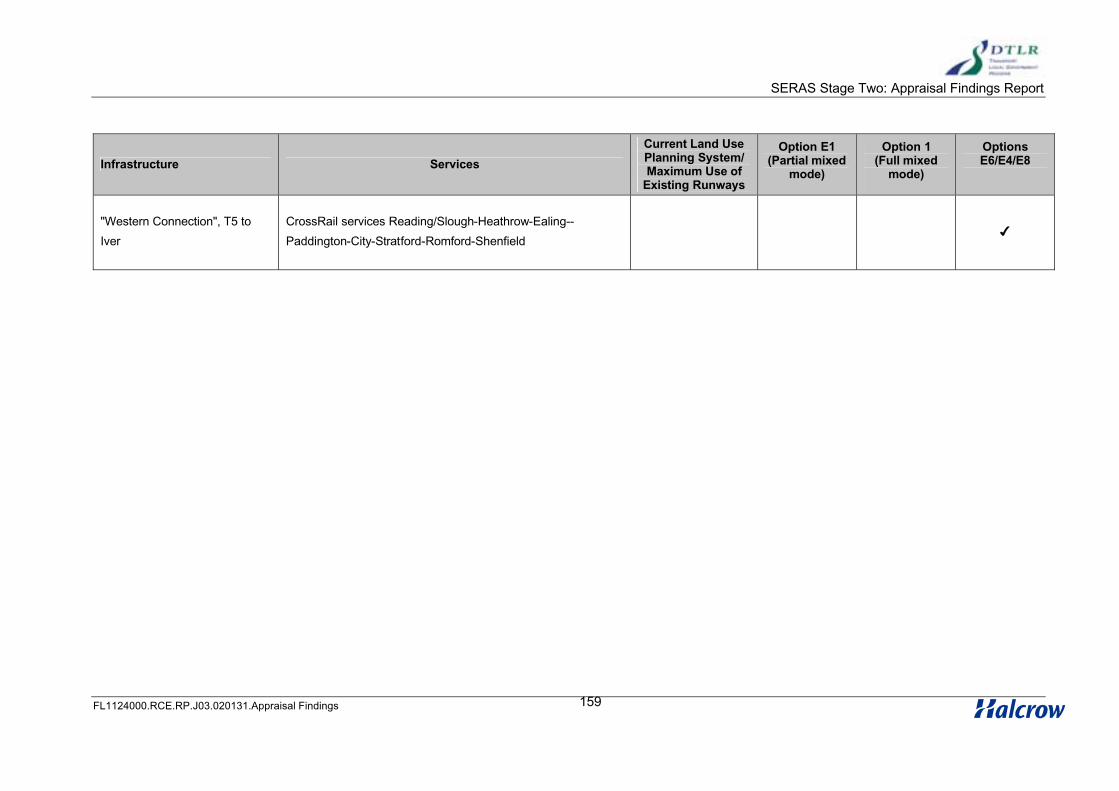
SERAS Stage Two: Appraisal Findings Report
FL1124000.RCE.RP.J03.020131.Appraisal Findings 159
Infrastructure Services
Current Land Use Planning System/Maximum Use of
Existing Runways
Option E1(Partial mixed
mode)
Option 1(Full mixed
mode)
OptionsE6/E4/E8
"Western Connection", T5 to
Iver
CrossRail services Reading/Slough-Heathrow-Ealing--
Paddington-City-Stratford-Romford-Shenfield!
SERAS Stage Two: Appraisal Findings Report
FL1124000.RCE.RP.J03.020131.Appraisal Findings 160
Catchment Areas and Accessibility
7.5.7 Catchment area and accessibility analyses have been carried out to provide indicators of the
accessibility of options to the air passenger markets they serve, and the workforce they might
attract. These analyses are based on:
• Travel times derived from the SERAS models’ representation of the forecast year
road and public transport networks associated with each option. (Note that this
system uses a finer zoning system in the main study area than was used in Stage
One.)
• Air passengers – the number and geographical distribution of total air passengers
used in the catchment area analyses is based on the SERAS forecast from the
2015 air passenger allocation model, assuming maximum use of existing
runways. For the purposes of the catchment area analysis, a fixed air passenger
demand matrix was assumed; and
• Workforce – for the purposes of the workforce catchment analyses, estimates of
the total potential workforce were based on TEMPRO planning projections of total
resident labour force. A fixed forecast of resident labour force for the year 2016,
modified to take account of dwelling allocations in Regional Planning Guidance,
was used.
7.5.8 The results of the catchment area analyses are summarised in the Appraisal Summary Tables
under the heading “Accessibility” and shown in Figures 7.15 to 7.18. Public transport
catchments increase substantially between the Maximum Use options and Options E6, E4 and
E8 (air passengers within one hour’s overall journey time increasing from 19 to 31 million pa,
and resident workforce increasing from 0.5 to 0.8 million), reflecting the improvements in rail
services associated with the larger capacity options. Heathrow’s good accessibility by road is
reflected in its greater catchments (80 million annual air passengers, and around 2 million
potential workers within one hour’s travel time). Catchments by road are similar between
options.
7.5.9 The accessibility of options to the air passenger market in Central London (and beyond) is of
particular interest and is summarised in Table 7.15. It should be noted that the public transport
travel times quoted in this table exclude walking access and egress, and waiting times – they
therefore indicate minimum travel times. It should also be noted that these figures relate to the
Central Terminal Area – travel times to other terminals will vary.
7.5.10 With the services assumed for the Base Case, Heathrow has moderate public transport
accessibility from Central London – with only Paddington within 15 minutes travel time. Table

SERAS Stage Two: Appraisal Findings Report
FL1124000.RCE.RP.J03.020131.Appraisal Findings 161
7.15 also illustrates the effect of the new rail services added in Options E1 and 1, with direct
services to Liverpool Street and Waterloo.
Table 7.15: Accessibility from Central London – Heathrow options.
Current Land
Use Planning
System
Maximum Use
of Existing
Runways
Option E1 Option 1Option
E4/E6/E8
By Car
Liverpool Street 87 As Max. Use As Max. Use 88
St Pancras/Kings Cross/Euston 78 As Max. Use As Max. Use 79
Marylebone/Paddington 65 As Max. Use As Max. Use 66
Waterloo 82 As Max. Use As Max. Use 83
By Public Transport
Liverpool StreetInterchange
neededAs Max. Use
4 tph in 28
minutesAs Option 1
St Pancras/Kings Cross
18tph in 52
minutes
Piccadilly Line
4 tph in 37
minutesAs Option E1 As Option E1
Marylebone/Paddington4 tph in 15
minutesAs Max. Use
4 tph in 15
minutes
4 tph in 18
minutes
As Option 1
WaterlooInterchange
needed
2 tph in 41
minutes
2 tph in 41
minutes
4 tph in 42
minutes
Surface Access Travel Demands
7.5.11 The main indicators of surface access demand in 2015 for each option at Heathrow are
summarised in Tables 7.16 and 7.17. Corresponding results for the forecast year 2030 are
presented in Table 7.18 and 7.19. Note that for the purposes of the surface access appraisal,
the full modelling procedure was only applied to one (Option E8) of the three large capacity
options: E4 (112mppa), E6 (128mppa) and E8 (121mppa). Surface access requirements for the

SERAS Stage Two: Appraisal Findings Report
FL1124000.RCE.RP.J03.020131.Appraisal Findings 162
other two options would be similar to those for Option E8 and have been assessed by
interpolation and extrapolation.
7.5.12 Air passenger capacity and demand estimates have been described above and are repeated in
Tables 7.16 and 7.18 for convenience. Note that both the amount of spare capacity (in 2015)
and the number of interlining passengers vary between options – reflecting the interaction
between Heathrow and other airports in the packages from which these estimates were derived.
This results in the forecast number of passengers requiring surface access in 2015 being less
with Option E1 than in the Base Case, despite its higher capacity. By 2030 Option E8 would be
operating at capacity.
Employee Travel Demands
7.5.13 The forecast number of on-site employees in 2015 and 2030 is reported in Tables 7.16 and
7.18 and is assumed to be a function of overall passenger demand and assumed improvements
in productivity, giving a reduction in employees between 2015 and 2030, despite the increased
passenger throughput. (Further details of the employment forecasts can be found in section
7.10.)
7.5.14 In 2015, the number of peak hour employee-related car trips is estimated to increase by 20%
between the Base Case and Option 1 and by over 40% in Option E8, reflecting the increases in
total employment and a small shift towards public transport in Option E8. Employee trips by
public transport are forecast to increase by over 30% in Option 1 and by almost 60% in Option
E8. However, Table 7.18 shows that by 2030, the number of car trips is expected to reduce,
as a result of the assumed employment productivity gains (2-way car trips in Option E8 falling
from 5,900 in 2015 to around 4,900 by 2030).
Air Passenger Travel Demands
7.5.15 Tables 7.17 and 7.19 summarise the air passenger mode split results for each option in 2015
and 2030 respectively. In 2015, Table 7.17 indicates a higher proportion of trips being made by
public transport in Option E8 (40.9%), than the 37.4% in the Base Case. The mode share
forecasts for 2030 are similar, but further growth of between 15 and 20% in the absolute
number of public transport trips is forecast. The mode share results are influenced by the
mixture of passengers by type and their geographical distribution, but it appears that air
passengers are more inclined to switch mode in response to the introduction of improved rail
services than are employees.
7.5.16 Finally, it is worth noting the changes in overall peak hour road traffic demand generated by
these options, (see Tables 7.17 and 7.19). Table 7.17 shows increases over the Base Case of
around 15% for Option 1 and almost 30% for Option E8. By 2030, the overall road traffic
demand generated by Heathrow is estimated to increase in the Base Case by around 7.5%
(from 12,050 to 12,950 vehicles per hour 2-way). Road traffic in Option E8 in 2030 shows a

SERAS Stage Two: Appraisal Findings Report
FL1124000.RCE.RP.J03.020131.Appraisal Findings 163
further increase of just over 10% relative to the Base Case (Package 2), but note that, due to
the decrease in employee-related trips, this 2030 flow of 14,400 is lower than the 15,600
estimated for Option E8 in 2015.

SERAS Stage Two: Appraisal Findings Report
FL1124000.RCE.RP.J03.020131.Appraisal Findings 164
Table 7.16: Main indicators and employee mode shares – Heathrow 2015.
Main Indicators
Current Land Use Planning
System
Maximum Use of Existing Runways
Option E1 –Partial Mixed
Mode
Option 1 – Full Mixed Mode Option E8
Total capacity (mppa) 86 86 91 105 121
Total passengers requiring surface access (mppa) 55.6 50.5 53.6 61.2 73.1
Total employees on-site 66800 65200 71500 80000 95300
Employees’ Highway trips (AM peak hour): vehicles
Origin 642 627 696 766 909
Destination 3515 3433 3816 4207 4990
Total 4157 4060 4512 4973 5899
Employees’ Public Transport trips (AM peak hour): persons
Origin 162 158 178 214 258
Destination 835 815 917 1095 1326
Total 997 973 1095 1309 1584
% Public Transport trips
Origin 19% 19% 19% 21% 21%
Destination 18% 18% 18% 20% 20%
Total 18% 18% 19% 20% 20%

SERAS Stage Two: Appraisal Findings Report
FL1124000.RCE.RP.J03.020131.Appraisal Findings 165
Table 7.17: Air passenger mode choice and overall surface access demand – Heathrow 2015.
Mode Base Year
Current Land Use Planning SystemMaximum Use of
Existing Runways
Option E1 – Partial Mixed Mode
Option 1 – Full Mixed Mode Option E8
No.
(mppa)% No. % No. % No. % No. %
Underground 6.56 17.0% 6.79 12.2% 4.75 8.9% 6.25 10.2% 7.45 10.2%
Bus 5.98 15.5% 7.90 14.2% 7.35 13.7% 8.56 14.0% 10.20 14.0%
Taxi 9.70 25.2% 13.90 25.0% 12.49 23.3% 14.43 23.6% 16.82 23.0%
Park and fly 6.16 16.0% 9.08 16.3% 8.65 16.1% 9.84 16.2% 11.77 16.1%
Kiss and fly 9.60 24.9% 11.81 21.2% 10.88 20.3% 12.41 20.3% 14.62 20.0%
Premium rail 0.50 1.3% 5.06 9.1% 4.19 7.8% 5.03 7.8% 5.81 8.0%
National rail 0.50 1.3% 1.07 1.9% 5.28 9.97% 4.72 7.7% 6.40 8.8%
Total 38.50 100.0% 55.62 100.0% 53.60 100.0% 61.24 100.0% 73.07 100.0%
Public 13.04 33.9% 20.83 37.4% 21.57 40.2% 24.56 40.1% 29.86 40.9%
Private 25.46 66.1% 34.79 62.6% 32.03 59.8% 36.68 59.9% 43.21 59.1%
Total peak hour demand including employees, air passengers, freight and service traffic.
Road (vehicles 2-way) 11,300 12,050 13,700 13,700 15,600

SERAS Stage Two: Appraisal Findings Report
FL1124000.RCE.RP.J03.020131.Appraisal Findings 166
Table 7.18: Main indicators and employee mode shares – Heathrow 2030.
Main Indicators
MaximumUse of
ExistingRunways
Option E8
Total capacity (mppa) 86 121
Total passengers requiring surface access (mppa) 68.6 88.1
Total employees on-site 60700 80900
Highway trips (average AM peak hour): vehicles
Origin 597 749
Destination 3279 4123
Total 3876 4872
Public Transport trips (average AM peak hour): persons
Origin 144 218
Destination 735 1109
Total 879 1327
% Public Transport trips
Origin 19% 22%
Destination 17% 20%
Total 18% 20%
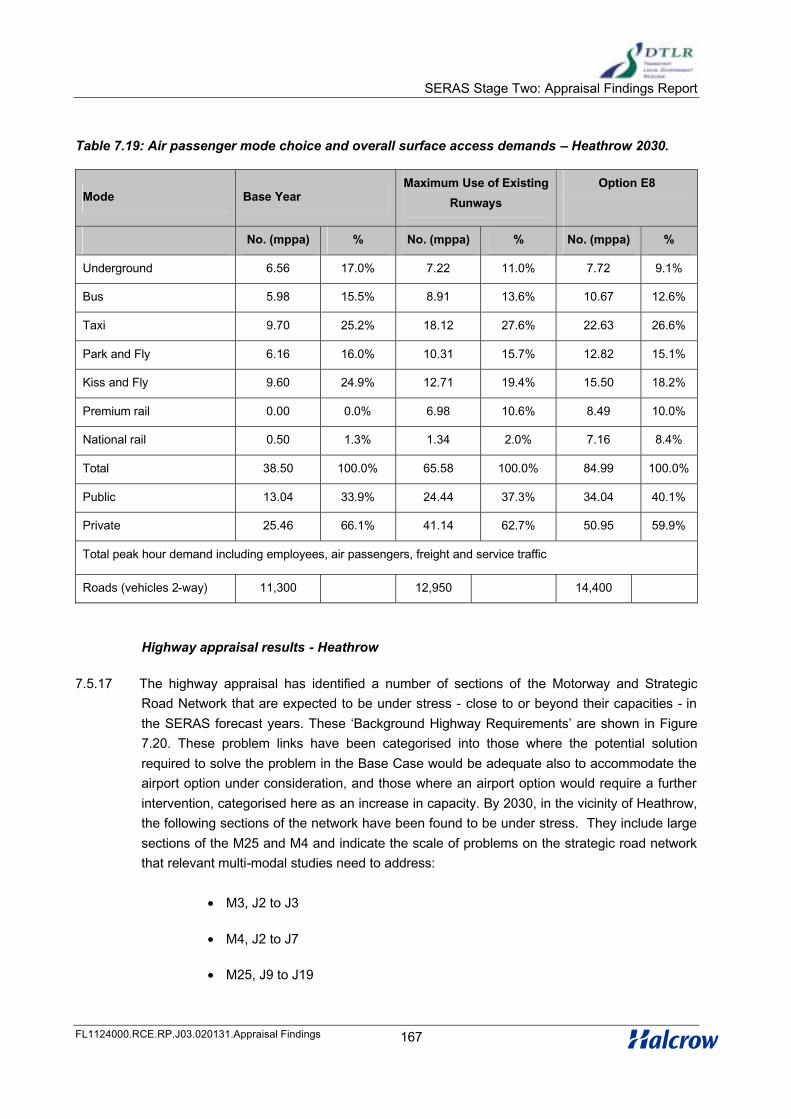
SERAS Stage Two: Appraisal Findings Report
FL1124000.RCE.RP.J03.020131.Appraisal Findings 167
Table 7.19: Air passenger mode choice and overall surface access demands – Heathrow 2030.
Mode Base YearMaximum Use of Existing
Runways
Option E8
No. (mppa) % No. (mppa) % No. (mppa) %
Underground 6.56 17.0% 7.22 11.0% 7.72 9.1%
Bus 5.98 15.5% 8.91 13.6% 10.67 12.6%
Taxi 9.70 25.2% 18.12 27.6% 22.63 26.6%
Park and Fly 6.16 16.0% 10.31 15.7% 12.82 15.1%
Kiss and Fly 9.60 24.9% 12.71 19.4% 15.50 18.2%
Premium rail 0.00 0.0% 6.98 10.6% 8.49 10.0%
National rail 0.50 1.3% 1.34 2.0% 7.16 8.4%
Total 38.50 100.0% 65.58 100.0% 84.99 100.0%
Public 13.04 33.9% 24.44 37.3% 34.04 40.1%
Private 25.46 66.1% 41.14 62.7% 50.95 59.9%
Total peak hour demand including employees, air passengers, freight and service traffic
Roads (vehicles 2-way) 11,300 12,950 14,400
Highway appraisal results - Heathrow
7.5.17 The highway appraisal has identified a number of sections of the Motorway and Strategic
Road Network that are expected to be under stress - close to or beyond their capacities - in
the SERAS forecast years. These ‘Background Highway Requirements’ are shown in Figure
7.20. These problem links have been categorised into those where the potential solution
required to solve the problem in the Base Case would be adequate also to accommodate the
airport option under consideration, and those where an airport option would require a further
intervention, categorised here as an increase in capacity. By 2030, in the vicinity of Heathrow,
the following sections of the network have been found to be under stress. They include large
sections of the M25 and M4 and indicate the scale of problems on the strategic road network
that relevant multi-modal studies need to address:
• M3, J2 to J3
• M4, J2 to J7
• M25, J9 to J19
SERAS Stage Two: Appraisal Findings Report
FL1124000.RCE.RP.J03.020131.Appraisal Findings 168
• A312 to east of Heathrow; and
• A316
7.5.18 The additional potential scheme improvements required by the airport options are summarised
in Table 7.20 and illustrated in Figure 7.21 (for Options 1 and E1) and Figure 7.22 (for Options
E4/E6/E8).

SERAS Stage Two: Appraisal Findings Report
FL1124000.RCE.RP.J03.020131.Appraisal Findings 169
Table 7.20: Highway capacity problems and potential schemes - Heathrow
DescriptionInitial
StandardPotential standard required by:
2015 2030
Current Land Use Planning System
Max Use of Existing Runways
Option E1 Option 1 OptionE6/E4/E8
Max Use of ExistingRunways
Option E6/E4/E8
Airport Access
M4 spur D3(M) D3(M) D3(M) D3(M) D3(M) tunnel D3(M) D3(M) tunnel
A4 tunnel D2/S4 D2/S4 D2/S4 D2/S4 D2 tunnel D2/S4 D2 tunnel
Link to M3 n/a n/a n/a n/a D2 n/a D2
Eastern section of Southern Perimeter Road
S2 D2 D2 D2 D2 D2 D2
Eastern Perimeter Road S2 D2 D2 D2 D2 D2 D2
South West Perimeter Road S2 D2 D2 D2 D2 D2 D2
Strategic Network
A4: A3044 to M4 J5 S2 S2 S2 S2 D2 S2 D2

SERAS Stage Two: Appraisal Findings Report
FL1124000.RCE.RP.J03.020131.Appraisal Findings 170
Rail Network Performance - Heathrow
7.5.19 The Piccadilly Line is most crowded in the Base Case, particularly in 2030, when line loading is
forecast to exceed capacity between Hammersmith and Knightsbridge in the morning peak, with
5% of demand airport-related. In all the options, the provision of alternative services between
the airport and central London leads to the line being less crowded, particularly in Options in
which CrossRail is assumed. CrossRail also diverts non-airport trips away from the line.
7.5.20 Similarly, higher airport throughput has limited impact on the demand for Heathrow Express. As
shown in Table 7.17, its (Premium rail) mode share declines with increasing airport throughput,
owing to diversion of demand to alternative routes. Table 7.19 shows a similar trend, but
demand for this service is signficantly higher in 2030, rising values of time reducing the
disincentive of the premium fare.
7.5.21 The main mode split values in Table 7.17 show the relative impacts of Airtrack and CrossRail
services at the airport. The Airtrack scheme modelled with partial mixed mode (Option E1)
provides services from the south west (Waterloo, Guildford, Reading) through Heathrow and
along an upgraded Great Western Main Line to St Pancras and Watford. It increases the public
transport mode share by some 3% and is forecast to carry 600 and 1,900 passengers into the
airport from the south west and north east respectively in the morning peak three hours.
7.5.22 As originally conceived, Airtrack services terminated at Heathrow, rather than running through
the airport, but studies in the late 1990s demonstrated the operational value of connecting
Airtrack services from the south west with services to St Pancras and the north. Following the
Ladbroke Grove accident, however, it is considered that even a small number of additional
services between the airport and London will require extra tracks on GWML, which will add
substantially to costs and delay the time at which services could be introduced.
7.5.23 Variants which would cost less and could be implemented more quickly, but which all have
some comparative disbenefit, include: turning trains back at Heathrow (expensive additional
tunnelling work under Heathrow); displacing commuter trains on GWML (at a cost to
commuters); extending Heathrow Express services from T5 to Reading and Guildford (lowering
the image of this premium service and introducing a risk of poorer timekeeping); running
through Heathrow but turning trains back at Hayes. The last option would cost, in total, around
£50 million, a saving of around £450 million on the modelled option, but would lose services to
the north east and would be likely to change public transport mode shares only from 37.4% in
the base to 37.9%.
7.5.24 For the longer-term, two principal ways of increasing rail connections between the airport and
Central London have been tested: additional services to St Pancras and CrossRail. Either
would require additional track capacity on GWML and they thus have similar costs west of
Acton. The modelling of CrossRail suggests that this is preferable in terms of accessibility and
SERAS Stage Two: Appraisal Findings Report
FL1124000.RCE.RP.J03.020131.Appraisal Findings 171
passenger loadings - 700 peak period trips on the St Pancras service in the Option E1 test
decline to 200 in the Option 1 test when CrossRail is introduced.
7.5.25 However, as shown in Table 7.17, adding CrossRail to a Heathrow surface access network that
already contains Airtrack does not appear to add to the airport’s accessibility, with public
transport’s mode share being marginally lower in Option 1 than in Option E1. While this decline
is due to the different passenger mix and distribution of trip ends in Option 1 compared to E1,
airport demand is minimal east of Liverpool Street, so most airport demand on CrossRail is
abstracted from the Piccadilly Line, St Pancras service and Heathrow Express. Further
potential disadvantages are that it would prevent the development of St Pancras as a
‘superhub’, and would increase the numbers of air passengers (and their luggage) on crowded
CrossRail and Thameslink 2000 services, perhaps compromising the station dwell times which
will be particularly important to the smooth operation of Thameslink 2000.
7.5.26 The importance of frequency to airport access services is shown by Option E8, where the
halving of waiting time at Waterloo and Clapham Junction compared to Option 1 trebles airport
demand on these services. As noted, in the 2030 tests Heathrow Express demand increases at
the expense of cheaper, slower routes between London and the Airport.
7.6 Environment: Land Take
Context
7.6.1 The environmental issues considered in Stage Two of SERAS builds on work undertaken in
Stage One on land use, ecology, heritage, landscape and townscape, water, noise and air
quality. Stage Two in addition appraises impacts on contamination and community issues. For
each of these environmental topics a baseline is defined and then the results of the appraisal of
each option is presented. Details of existing land uses and environmental features within the
study area are provided in Figures 7.27 to 7.31. Summaries of the key impacts of each option
are presented in the Appraisal Summary Table. Fuller details of the environmental appraisal
baseline data and appraisal of options can be found in the supporting report.

SERAS Stage Two: Appraisal Findings Report
FL1124000.RCE.RP.J03.020131.Appraisal Findings 172
Existing Conditions
Land Use – residential, commercial/industrial, public buildings, recreation, agriculture,
planning constraints
7.6.2 The airport is surrounded by various urban areas within Greater London including Hounslow,
Feltham, Ashford, Staines, Egham, Slough, Windsor, Hillingdon and Ealing. There are several
commercial/industrial areas in the immediate vicinity of the airport, plus two sites allocated for
future commercial/industrial development in the London Borough of Hounslow Local Plan.
7.6.3 There are areas of agricultural land of Grade I plus further areas where the quality is not known.
There are also numerous sand and gravel workings and much of the area to the north and west
is considered to have potential for sand and gravel reserves.
7.6.4 Much of the undeveloped area surrounding Heathrow is classified as Green Belt.
Contamination (Figure 7.27)
7.6.5 Twenty-eight potential sources of contamination have been identified in the study area. Of
these, 22 are considered to have potential for greater than minor scale contamination. There
are 8 areas with the potential for a ‘great’ scale of contamination. All of these are either landfill
sites that have been licensed to accept ‘difficult’ or ‘putrescible’ waste or are landfills or potential
landfill of unknown content. There are 8 other sites with the potential for a ‘moderate’ scale of
contamination.
Ecology (Figure 7.28)
7.6.6 There is one internationally-designated site (of very high ecological value) within the area of
search. The South West London Waterbodies are designated as a Special Protection Area
(SPA) and Ramsar site. All areas within the SPA are also designated as Sites of Special
Scientific Interest (SSSI). The South West London Waterbodies SPA comprises a series of
embanked water supply reservoirs and former gravel pits that support a range of man-made
and semi-natural open water habitats. The large expanse of open water and the bare muds on
the reservoir margins provide habitat for wildfowl and waders and the site has been designated
because it regularly supports more than 1% of the biogeographic populations of wintering
gadwall and shoveler. The South West London Waterbodies are considered to have a low
potential for substitution as, although the water bodies are man-made, they cover a
considerable area (828 ha) of south west London and this space would be hard to find
elsewhere in London for habitat recreation.

SERAS Stage Two: Appraisal Findings Report
FL1124000.RCE.RP.J03.020131.Appraisal Findings 173
7.6.7 There are four nationally-designated Sites of Special Scientific Interest (SSSIs) (of high
ecological value) within the area of search, including the following:
• Staines Moor SSSI consists of the largest area of alluvial meadows in Surrey
(including several oxbow lakes) and a semi-natural stretch of the River Colne.
This site is considered to have no potential for substitution due to the complex
mosaic of habitats and hydrological conditions.
• Thorpe Hay Meadow SSSI is thought to be the last remaining example of a
Thames Valley hay meadow in Surrey, and contains a range of characteristic
lime-loving plants including meadow cranesbill, cowslip, and hoary plantain. This
site is considered to have no potential for substitution due to the rarity and age of
the habitat.
• Langham Pond SSSI consists of a pond surrounded by alluvial meadows, hedges
and broad-leaved woodland.
• Hythe End Gravel Pits SSSI comprises a mosaic of open water, islands,
grassland, scrub and woodland.
7.6.8 There are two sites of Metropolitan Importance for Nature Conservation within the area of
search (medium ecological value). These are the River Crane and adjacent habitats and the
River Colne Valley. In both areas the rivers act to connect other areas of semi-natural and have
no potential for substitution.
7.6.9 There are two further designated areas of county importance (medium ecological value) within
the area of search and some wildlife heritage sites (also of medium ecological value) outside
the area of search. There are also three sites designated as Sites of Borough Importance for
Nature Conservation (Grade I) (of low to medium ecological value). There are five further sites
within the area of search which are undesignated but which are considered to be of low
ecological value.
Heritage (Figures 7.29 and 7.30)
7.6.10 The Base Case contains 38 undesignated archaeological sites or groups of sites (considered
for this appraisal to be of county/district value). The maximum area of expansion contains an
additional such 32 sites with a further 55 sites lying in the surrounding 500m corridor. The area
contains one Scheduled Ancient Monument, a 14th century Tithe Barn at Harmondsworth to the
north. A further three SAMs lie within the 500m corridor.
7.6.11 The area contains two designated areas of high archaeological potential. These comprise the
historic cores of Harmondsworth and Harlington.
SERAS Stage Two: Appraisal Findings Report
FL1124000.RCE.RP.J03.020131.Appraisal Findings 174
7.6.12 Archaeology - The current airport site and its area of expansion lies within an area of high
archaeological activity and potential as demonstrated by excavations within the current airport
boundary and in the surrounding area. There is archaeological evidence in the area of historic
activities dating from prehistoric times. The pattern of landscape and settlement probably
changed little from the medieval to the post-medieval period. Much of this settlement pattern
has now been swallowed up by the construction of the airport and the westward growth of
suburban London.
7.6.13 Listed Buildings - The study area, contains 102 Listed Buildings. This includes: one Grade I
Listed Building, the Manor Farm Barn at Harmondsworth which is also a Scheduled Ancient
Monument); two Grade II* Listed Buildings; and 95 Grade II Listed Buildings; three Grade B
Listed churches and 1 Grade C Listed church. The exact level of significance of the Grade A
and Grade B buildings is uncertain: in the early days of the Listing programme, churches were
exempt from Listed Building controls and were classified as A, B or C.
7.6.14 Conservation Areas - The area of proposed landtake contains two Conservation Areas at
Harmondsworth and Cranford. The 500m corridor contains 4 further Conservation Areas.
Landscape and Visual (Figure 7.31)
7.6.15 Landscape/Townscape - The landscape in the vicinity of Heathrow falls within the Thames
Valley which comprises a broad floodplain of fragmented, poor agricultural land dominated by
the urban influences of the towns of Reading, Bracknell, Windsor and Slough and metropolitan
London. The landscape within 5km of the site at Heathrow has been divided into three areas of
distinct landscape and townscape character.
7.6.16 Runnymede Hills rise above the otherwise flat and low-lying landscape and provide panoramic
views across the floodplain. The landscape is well wooded and relates to the adjoining wooded
hills at Virginia Water and Windsor Great Park. The character of the landscape in the vicinity of
Runnymede and Coopers Hill is especially distinct due to its historic associations with the
signing of the Magna Carta. Land at Runnymede through to Virginia Water is designated at
district level as an Area of Landscape Importance. The overall value of the landscape is
assessed as high.
7.6.17 Colne Valley runs in a north to south direction to join the River Thames in the vicinity of Staines.
The valley has a more vegetated character than the open landscapes to the west and east.
This shallow valley effectively forms the western boundary of the metropolitan area of London
and its character merges with that of the Thames Valley to form an extensive area for which the
presence of water is the defining characteristic. Pylons and transport infrastructure have
resulted in a visually and physically fragmented landscape. The overall value of this area of
contrasts is assessed as low.

SERAS Stage Two: Appraisal Findings Report
FL1124000.RCE.RP.J03.020131.Appraisal Findings 175
7.6.18 West London Suburbs are characterised by late twentieth century low-rise urban expansion
over flat and low-lying topography. The character of these suburbs is heavily influenced by the
presence of the existing airport and the associated commercial activities and transport
infrastructure that dominate the area. The overall value of the landscape is assessed as low.
Visual
7.6.19 The extent of the indicative zone of potential visual impact (ZVI) of the maximum extent of
Airport Options boundaries is limited by the flat topography and the presence of built-up areas.
The ZVI therefore generally remains close to the periphery of the airport. Key visual receptors
within 5km of the site would include residents in the West London Suburbs to the north, east
and south. Visibility is likely to be restricted to glimpses and will very much depend on the
precise location and scale of proposed buildings. The ZVI includes a number of major roads –
many close to the perimeter of the existing airport or proposed landtake. In all cases, however,
the sensitivity of these very busy routes is reduced by the urban context and views of existing
facilities.
Community
7.6.20 Community Infrastructure - The settlement pattern predominantly comprises a series of linked
urban and suburban areas. Most of these developed in the 20th century, partly in response to
the expansion of the airport, and comprise a relatively unstructured pattern of residential
neighbourhoods around local service centres.
7.6.21 Community Structure/Distinctiveness - The population of the airport’s Core Catchment Area, as
defined in the Land Use and Urbanisation Study Stage One Report is approximately 845,000.
The linked urban and suburban areas are separated mainly by transport corridors, open spaces
and gravel workings. A small number of settlements retain some village characteristics.
7.6.22 Employment - Unemployment levels within the Core Catchment Area, at 3%, are below the
national average. The economy of the area is generally buoyant, reflecting its proximity to the
airport, to Central London and to the motorway network. However, it has experienced structural
change in recent years, with decline in manufacturing sectors such as defence, resulting in
over-dependence on the service sector.
High Adverse Impacts: Option 1
7.6.23 Archaeology - One known archaeological site, representing the location of an undated site
discovered during excavations and augur survey in 1994, would be disturbed. It would also
affect an area of likely archaeological potential. The loss of such sites without record would
constitute a HA effect although it is likely that this impact could be substantially mitigated
SERAS Stage Two: Appraisal Findings Report
FL1124000.RCE.RP.J03.020131.Appraisal Findings 176
through the implementation of an agreed programme of archaeological investigation, evaluation
and excavation prior to the construction programme.
High Adverse Impacts: Option E1
7.6.24 This option would have the same effects as Option 1 i.e. HA on the potential archaeological
resource, although this could be substantially mitigated.
High Adverse Impacts: Option E4
7.6.25 The loss of 59ha of agricultural land (of unknown agricultural land quality) and 169ha of land of
Grade 1 agricultural land quality would result in HA effects. In addition, some of the land to the
north and west of the Base Case boundary (60ha) comprises unworked sand and gravel
deposit and this resource could be sterilized.
7.6.26 A HA effect is associated with landtake from the Green Belt within the new airport boundary
(228ha).
7.6.27 One Scheduled Ancient Monument, the 14th century Tithe Barn at Manor Farm, would be lost.
In addition this option would result in substantial disturbance within an area of High
Archaeological Importance centred around the medieval centre of Harmondsworth and would
affect 22 undesignated sites. As with Option 1, this part of the area taken is of likely
archaeological potential . Although it is possible that this could be substantially mitigated, the
resultant severity is likely to remain HA as a consequence of the loss of the SAM.
7.6.28 A number of Listed Buildings would be lost under this option. These include Manor Farm Barn,
a Grade I Listed building (also recorded as a Scheduled Ancient Monument), the Grade B
church of St. Mary’s, 9 Grade II Listed Buildings. The loss of the Grade I and Grade II buildings
would constitute a HA adverse effect.
7.6.29 The loss of about 25% of the Harmondsworth Conservation Area would constitute a HA effect.
High Adverse Impacts: Option E6
7.6.30 The loss of agricultural land of Grade I would increase to 198 ha. In addition, slightly more land
(73ha) of unworked sand and gravel deposit would be sterilized. Effects are likely to remain
HA.
7.6.31 The loss of land designated as Green Belt would increase to 269 ha and effects are likely to
remain HA.
SERAS Stage Two: Appraisal Findings Report
FL1124000.RCE.RP.J03.020131.Appraisal Findings 177
7.6.32 The impacts on archaeology, Listed Buildings and Conservation Areas, are as Option E4 with
an additional area of landtake which will affect a further area of archaeological potential.
7.6.33 The construction works for this option would impinge on more residential communities. In
particular, more residential properties in Sipson and Harmondsworth are likely to be affected
raising the likely impact to HA. Cumulative effects due to construction would be HA.
High Adverse Impacts: Option E8
7.6.34 There would be a loss of 302ha of land of Grade 1 agricultural land quality. In addition, some of
the land (79ha) comprises unworked sand and gravel deposit and sterilization of this resource
combined with the loss of Grade I agricultural land would result in HA effects.
7.6.35 There would be an HA impact on people with some 893 households displaced
7.6.36 A HA effect is associated with landtake from the Green Belt due to land within the new airport
boundary (338 ha).
7.6.37 Impacts on the archaeological resource would be as Option E6 with the addition of impacts on:
• an additional area of archaeological sensitivity, located around the village centre
of Harlington;
• an additional 10 undesignated archaeological sites.
7.6.38 There would also be a loss of: 1 Grade I Listed Building; two grade B churches, 52 Grade II
Listed Buildings, which constitutes a HA adverse effect. A HA effect would also result from the
additional loss of around 25% of Cranford Park Conservation Area and 25% of the
Harmondsworth Conservation Area.
7.6.39 The scale of construction works is high and over 500 residential receptors would be affected,
resulting in HA effects. The distance of the area of the main construction activity in the north
from nationally or internationally designated sites means they are unlikely to be significantly
affected. The cumulative effects of construction are considered to be HA.

SERAS Stage Two: Appraisal Findings Report
FL1124000.RCE.RP.J03.020131.Appraisal Findings 178
7.7 Environment: Water
Existing Conditions
7.7.1 Heathrow Airport is situated within both the River Crane and River Colne surface water
catchments. The study area is bounded to the north by the Grand Union Canal, to the east by
the River Crane, and to the west by the River Colne and River Wraysbury (Figure 7.32). The
canalised Duke of Northumberland’s River and Longford River pass in culverts beneath the
western end of the existing runways and then flow eastward along the southern perimeter of the
Airport. There are two large reservoirs to the south west of the study area, and numerous
former gravel pits that now form lakes. The runoff from the Airport flows into four balancing
reservoirs, which provide temporary storage before gradually discharging into the Stanwell
Ditch, River Wraysbury, Portlane Brook and the River Crane.
7.7.2 The water quality is monitored in six watercourses within the study area. The Airport does not
appear to impact on the quality of the water in these rivers. There are 2 licensed surface water
abstractions within the study area.
7.7.3 The Airport is outside of the 1 in 100 year flood risk area identified by the Environment Agency.
However, there is a significant expanse of floodplain along the western side of the study area
corresponding to the Colne catchment, which is sensitive to flooding.
7.7.4 The study area is located on the River Gravels of the middle Thames valley. The permeable
gravels are regarded as a major aquifer, and are highly productive and able to support large
abstractions for public supply and other purposes. There are 23 licensed groundwater
abstractions within the study area, and a groundwater supported SSSI within the south west
part of the study area.
7.7.5 From a regional perspective, the available water resources are virtually fully committed.
However this varies between water companies and resource zones across the region.
Currently there are additional, albeit limited, groundwater resources available in the middle
Thames and in the confined chalk aquifer under London.
Impact of Options
7.7.6 The options have been assessed against a base case, which is the current land use planning
system, and therefore only consider impacts that are additional to those assessed under the
base case. The assessments consider the sensitivity of the water environment and the
potential to cause harm, allowing for the scope for mitigation. Table 7.21 summarises the
assessment for each of the water objectives, for each of the options.

SERAS Stage Two: Appraisal Findings Report
FL1124000.RCE.RP.J03.020131.Appraisal Findings 179
7.7.7 All of the options at Heathrow present a potential impact on groundwater and surface water,
and three options a potential impact on water resources, as ‘High Adverse’. The impacts on the
other water objectives are either ‘Medium’ or ‘Low Adverse’, as many of them may be mitigated.
7.7.8 Water quality impacts may be mitigated using water treatment techniques such as reed beds
and balancing ponds. Flooding impacts may be mitigated using balancing ponds, to attenuate
runoff and take out the peak flow. The effectiveness of these measures is dependent upon
adequate sizing of ponds, and the use of appropriate treatment techniques.
7.7.9 All of the options require engineering works to at least one river. This would involve either
culverting or diverting the river, hence the allocation of a High Adverse score. The Environment
Agency is generally opposed to culverting, and such works are seen as a significant impact.
7.7.10 There are numerous areas of contamination around Heathrow Airport that are at risk of being
mobilised within all of the development options. Although this could be controlled through
appropriate management, there is a high risk to the aquifer, which forms an important resource.
7.7.11 Large increases in passenger numbers significantly increase the airport’s demand for water,
and that of the surrounding residential areas that provide the human resource base for the
airport. Without any further water resource development or effort to manage demand, the area
would have a deficit. However, assuming that water companies maximise existing strategic
links and their use of existing and planned licensed resources between resource zones, the
resource zones that supply Heathrow Airport would just be sufficient to meet the demand
imposed by Options E1 and 1, but would have a slight deficit under Options E4, E6 and E8.
This assumes that companies will achieve their leakage reduction targets, and also allows for
environmental needs, such as the South West London Gravel Pits and Reservoirs, which are
internationally significant.
7.7.12 Assuming appropriate supply and demand management techniques are put into place, and the
Airport and other water users within the region are water-efficient, by carrying out good
housekeeping and management with respect to water, and using water saving technology, it
should be possible to meet the demand imposed by Options E1 and 1. However, even with
these measures it may be difficult to meet the demand imposed by Options E4, E6 and E8.

SERAS Stage Two: Appraisal Findings Report
FL1124000.RCE.RP.J03.020131.Appraisal Findings 180
Table 7.21: Heathrow Water Appraisal Summary Table
OptionBase Case & Maximum Use of Existing Runway Option E1 Option 1 Option E6 Option E4 Option E8
Surface Water 4 rivers receive treated Airport drainage. 2 rivers would need to be either culverted or diverted. 2 licensed abstractions within the study area. Potential water quality impacts could be mitigated.
Medium Adverse
1 river would need to be either culverted or diverted. Potential water quality impacts could be mitigated.
Medium Adverse
1 river would need to be either culverted or diverted. Potential water quality impacts could be mitigated.
Medium Adverse
3 river reaches would need to be either culverted or diverted.Potential water quality impacts could be mitigated.
Medium Adverse
3 river reaches would need to be either culverted or diverted.Potential water quality impacts could be mitigated.
Medium Adverse
2 rivers would need to be either culverted or diverted. Potential water quality impacts could be mitigated.
Medium Adverse
Groundwater Major aquifer. 23 licensed abstractions (including a Zone 3 SPZ for a PWS) within the study area. Potential impact from mobilisation of contaminants could be prevented through appropriate management.
High Adverse
Major aquifer. Potential impact from mobilisation of contaminants could be prevented through appropriatemanagement.
High Adverse
Major aquifer. Potential impact from mobilisation of contaminants could be prevented through appropriatemanagement.
High Adverse
Major aquifer. Potential impact from mobilisation of contaminants could be prevented through appropriatemanagement.
High Adverse
Major aquifer. Potential impact from mobilisation of contaminants could be prevented through appropriatemanagement.
High Adverse
Major aquifer. Potential impact from mobilisation of contaminants could be prevented through appropriatemanagement.
High Adverse
FloodingTo the west of the Airport the catchment is dominated by floodplain, and is at risk of flooding.Medium Adverse
No additional impacts as compared to the base case.Low Adverse
No additional impacts as compared to the base case.Low Adverse
No additional impacts as compared to the base case.Low Adverse
No additional impacts as compared to the basecase.Low Adverse
No additional impacts as compared to the base case.Low Adverse
Water ResourcesIncrease in demand would have been planned for, and may be met through supply and demand management, and water saving technology.
Low Adverse
Significant increase in demand may be met through supply and demand management, and water saving technology.
Medium Adverse
Significant increase in demand may be met through supply and demand management, and water saving technology.
Medium Adverse
It may be difficult to meet the significant increase in demand, even through supply and demand management, and water saving technology.High Adverse
It may be difficult to meet the significant increase in demand, even through supply and demand management, and water savingtechnology.High Adverse
It may be difficult to meet the significant increase in demand, even through supply and demand management, and water saving technology.High Adverse

SERAS Stage Two: Appraisal Findings Report
FL1124000.RCE.RP.J03.020131.Appraisal Findings 181
7.8 Environment: Noise Impacts
Aircraft Noise: Daytime
7.8.1 The Heathrow noise contours for 2000, and each of the Options in 2015 or 2030 as appropriate
are shown on Figures 7.33 to 7.64. Note that the 2000 contours include Concorde movements
at 1999 levels. Tables 7.22 to 7.25 give the areas and estimated populations under the daytime
LAeq,16h noise contours for each of these scenarios with changes against 2000 contours and the
Base Case respectively.
7.8.2 Heathrow exposes by far the largest number of people to aircraft noise of all the airports in the
study area, with a population of 306,700 within the 2000 57 dB contour (266,700 without
Concorde). The ‘with Concorde’ figure has fallen slightly from 319,300 in 1994, despite the
steady growth in air traffic over this period. This change should be taken as approximate as the
1994 and 2000 population estimates are based on different census years. The contours have
changed shape, extending over new areas such as over Slough to the north west of Heathrow
and have decreased in area since 1994. The 57 dB contour has reduced in area by 15%. The
reduced contour area is due to the introduction of quieter aircraft types which has been
accelerated since 1995 when the compulsory phasing out of the older and noisier Chapter 2
aircraft began. The phase-out in Europe is to be completed by 1 April 2002. Other factors –
redefinition of routings, more effective monitoring and fines - have also contributed. The
Heathrow contours are generally wider, i.e. spread to the north and south, at the western end.
This reflects the predominant arrival/departure directional split that is around 75% in favour of
westerly operations. Therefore the lobes in the contours (reflecting departure noise) to the
west, north west and south west are greater in size than those to the north east and south east,
and, in areas where arrivals noise predominates, the contours extend further to the east then to
the west.
Options in 2015
7.8.3 With the Maximum Use Option which is the Base Case for 2015, the population under the 57 dB
contour is forecast to be 320,500, an increase of 13,800 over 2000. However the 57 dB contour
area will decrease by 4 sq km from 149 to 144.6 sq km. This small reduction reflects planned
development with T5 in place, Concorde not being in operation and other expected fleet
changes.
7.8.4 Option E1 involves operating the existing runways in partial mixed mode and Option 1 in full
mixed mode. Comparing Option E1 and Option 1 with the Base in 2015, it can be seen that the

SERAS Stage Two: Appraisal Findings Report
FL1124000.RCE.RP.J03.020131.Appraisal Findings 182
population under the 57 dB noise contour increases by 6% with Option E1, and by 25% with
Option 1.

SERAS Stage Two: Appraisal Findings Report
FL1124000.RCE.RP.J03.020131.Appraisal Findings 183
Table 7.22 : Heathrow Daytime Aircraft Noise Contours – 2015 vs 2000 Existing Situation
Area (sq km)
Excluding Including Max Use Option E1 Option 1 Option E6 Option E4 Option E8
Concorde Concorde Total Change Total Change Total Change Total Change Total Change Total Change
LAeq
(dB)1994
1999 2000 2015 Cw 2000 2015 cw 2000 2015 cw 2000 2015 cw 2000 2015 cw 2000 2015 cw 2000
>54 n/a 214.8 260.5 266.9 6.4 281.7 21.2 306 45.5 420.5 160 379.4 118.9 374.3 113.8
>57 175.5 124.2 149 144.6 -4.4 151.9 2.9 165.3 16.3 236.8 87.8 211.9 62.9 208.8 59.8
>60 97.4 74.4 84.1 83.6 -0.5 87.7 3.6 94.9 10.8 136.8 52.7 125.3 41.2 123.5 39.4
>63 60.3 45.9 51.6 49.3 -2.3 51.4 -0.2 55.2 3.6 82.8 31.2 75.7 24.1 77.1 25.5
>66 40.3 29.1 33.2 30.8 -2.4 32 -1.2 34.6 1.4 49.7 16.5 45.2 12 50.3 17.1
>69 27.5 17.1 20.8 18.7 -2.1 19.5 -1.3 21 0.2 28.9 8.1 26.3 5.5 27.7 6.9
>72 17.9 8.8 11.4 9.4 -2 9.9 -1.5 10.8 -0.6 15.8 4.4 13.8 2.4 13.6 2.2
Population (000s)
Excluding Including Max Use Option E1 Option 1 Option E6 Option E4 Option E8
Concorde Concorde Total Change Total Change Total Change Total Change Total Change Total Change
LAeq
(dB)1994
1999 2000 2015 cw 2000 2015 cw 2000 2015 cw 2000 2015 cw 2000 2015 cw 2000 2015 cw 2000
>54 n/a 522 603.3 707.9 104.6 748.7 145.4 835.2 231.9 1187.9 584.6 1076.8 473.5 1144.8 541.5
>57 319.3 266.7 306.7 320.5 13.8 339.9 33.2 384.9 78.2 588.6 281.9 512.4 205.7 531.6 224.9
>60 182.6 124.2 158.8 150.7 -8.1 162.3 3.5 172.3 13.5 274.2 115.4 241 82.2 240.9 82.1
>63 99.3 66 82 73.9 -8.1 78 -4 85.2 3.2 128.1 46.1 111.7 29.7 115.3 33.3
>66 50.8 26.9 32.9 30.5 -2.4 33 0.1 37.6 4.7 58.7 25.8 48.2 15.3 51.3 18.4
>69 18.6 9.8 13 10.9 -2.1 12 -1 13.7 0.7 18.6 5.6 15.2 2.2 15 2
>72 6.7 2.7 3.6 2.8 -0.8 3.2 -0.4 3.3 -0.3 4.6 1 3.8 0.2 3.1 -0.5

SERAS Stage Two: Appraisal Findings Report
FL1124000.RCE.RP.J03.020131.Appraisal Findings 184
Table 7.23: Heathrow Daytime Aircraft Noise Contours – 2015 vs 2015 Base Case
Area (sq km)
Max Use Opt E1 Option 1 Option E6 Option E4 Option E8
2015 Total Change Total Change Total Change Total Change Total Change
LAeq
(dB)
Base 2015 cw Base 2015 Cw Base 2015 cw Base 2015 cw Base 2015 cw Base
>54 266.9 281.7 14.8 306.0 39.1 420.5 153.6 379.4 112.5 374.3 107.4
>57 144.6 151.9 7.3 165.3 20.7 236.8 92.2 211.9 67.3 208.8 64.2
>60 83.6 87.7 4.1 94.9 11.3 136.8 53.2 125.3 41.7 123.5 39.9
>63 49.3 51.4 2.1 55.2 5.9 82.8 33.5 75.7 26.4 77.1 27.8
>66 30.8 32.0 1.2 34.6 3.8 49.7 18.9 45.2 14.4 50.3 19.5
>69 18.7 19.5 0.8 21.0 2.3 28.9 10.2 26.3 7.6 27.7 9.0
>72 9.4 9.9 0.5 10.8 1.4 15.8 6.4 13.8 4.4 13.6 4.2
Population (000s)
Max Use Option E1 Option 1 Option E6 Option E4 Option E8
2015 Total Change Total Change Total Change Total Change Total Change
LAeq
(dB)
Base 2015 cw Base 2015 Cw Base 2015 cw Base 2015 cw Base 2015 cw Base
>54 707.9 748.7 40.8 835.2 127.3 1187.9 480.0 1076.8 368.9 1144.8 436.9
>57 320.5 339.9 19.4 384.9 64.4 588.6 268.1 512.4 191.9 531.6 211.1
>60 150.7 162.3 11.6 172.3 21.6 274.2 123.5 241.0 90.3 240.9 90.2
>63 73.9 78.0 4.1 85.2 11.3 128.1 54.2 111.7 37.8 115.3 41.4
>66 30.5 33.0 2.5 37.6 7.1 58.7 28.2 48.2 17.7 51.3 20.8
>69 10.9 12.0 1.1 13.7 2.8 18.6 7.7 15.2 4.3 15.0 4.1
>72 2.8 3.2 0.4 3.3 0.5 4.6 1.8 3.8 1.0 3.1 0.3
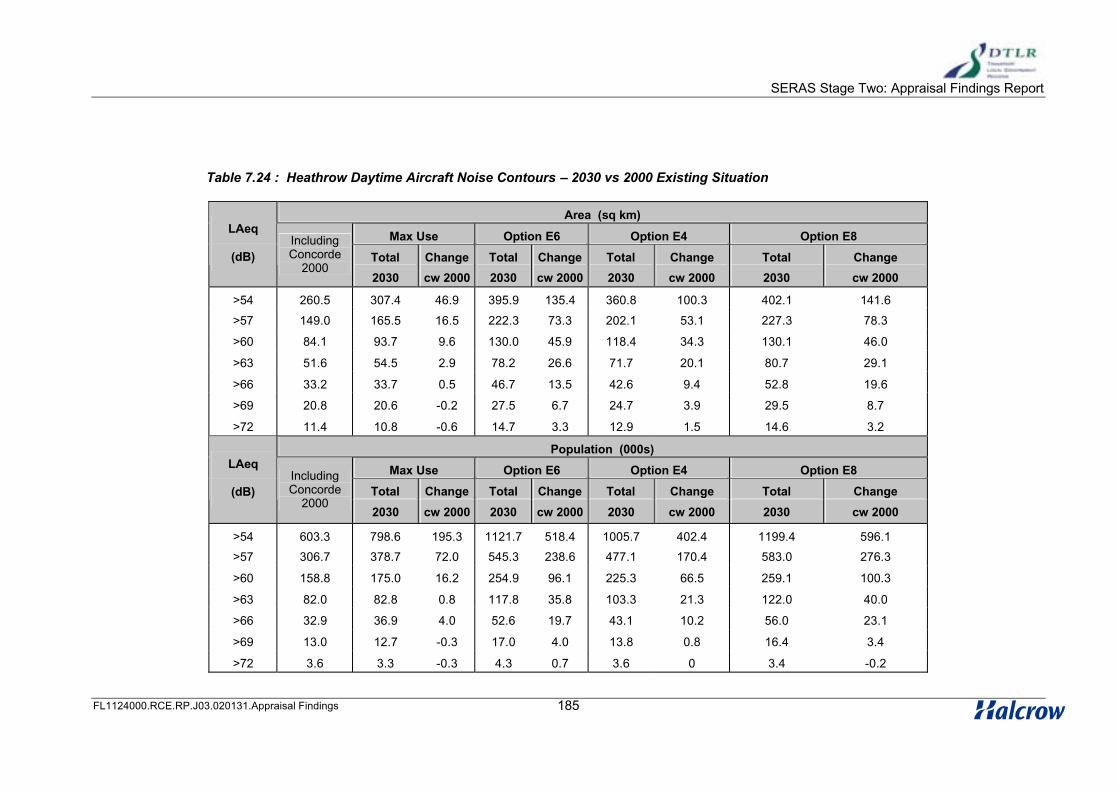
SERAS Stage Two: Appraisal Findings Report
FL1124000.RCE.RP.J03.020131.Appraisal Findings 185
Table 7.24 : Heathrow Daytime Aircraft Noise Contours – 2030 vs 2000 Existing Situation
Area (sq km)
Max Use Option E6 Option E4 Option E8
Total Change Total Change Total Change Total Change
LAeq
(dB)IncludingConcorde
20002030 cw 2000 2030 cw 2000 2030 cw 2000 2030 cw 2000
>54 260.5 307.4 46.9 395.9 135.4 360.8 100.3 402.1 141.6
>57 149.0 165.5 16.5 222.3 73.3 202.1 53.1 227.3 78.3
>60 84.1 93.7 9.6 130.0 45.9 118.4 34.3 130.1 46.0
>63 51.6 54.5 2.9 78.2 26.6 71.7 20.1 80.7 29.1
>66 33.2 33.7 0.5 46.7 13.5 42.6 9.4 52.8 19.6
>69 20.8 20.6 -0.2 27.5 6.7 24.7 3.9 29.5 8.7
>72 11.4 10.8 -0.6 14.7 3.3 12.9 1.5 14.6 3.2
Population (000s)
Max Use Option E6 Option E4 Option E8
Total Change Total Change Total Change Total Change
LAeq
(dB)IncludingConcorde
20002030 cw 2000 2030 cw 2000 2030 cw 2000 2030 cw 2000
>54 603.3 798.6 195.3 1121.7 518.4 1005.7 402.4 1199.4 596.1
>57 306.7 378.7 72.0 545.3 238.6 477.1 170.4 583.0 276.3
>60 158.8 175.0 16.2 254.9 96.1 225.3 66.5 259.1 100.3
>63 82.0 82.8 0.8 117.8 35.8 103.3 21.3 122.0 40.0
>66 32.9 36.9 4.0 52.6 19.7 43.1 10.2 56.0 23.1
>69 13.0 12.7 -0.3 17.0 4.0 13.8 0.8 16.4 3.4
>72 3.6 3.3 -0.3 4.3 0.7 3.6 0 3.4 -0.2

SERAS Stage Two: Appraisal Findings Report
FL1124000.RCE.RP.J03.020131.Appraisal Findings 186
Table 7.25: Heathrow Daytime Aircraft Noise Contours – 2030 vs 2030 Base Case
Area (sq km)
Max Use Option E6 Option E4 Option E8
Total Total Change Total Change Total Change
Laeq
(dB)
2030 2030 Cw Base 2030 Cw Base 2030 cw Base
>54 307.4 395.9 88.5 360.8 53.4 402.1 94.7
>57 165.5 222.3 56.8 202.1 36.6 227.3 61.8
>60 93.7 130.0 36.3 118.4 24.7 130.1 36.4
>63 54.5 78.2 23.7 71.7 17.2 80.7 26.2
>66 33.7 46.7 13.0 42.6 8.9 52.8 19.1
>69 20.6 27.5 6.9 24.7 4.1 29.5 8.9
>72 10.8 14.7 3.9 12.9 2.1 14.6 3.8
Population (000s)
Max Use Option E6 Option E4 Option E8
Total Total Change Total Change Total Change
Laeq
(dB)
2030 2030 Cw Base 2030 Cw Base 2030 cw Base
>54 798.6 1121.7 323.1 1005.7 207.1 1199.4 400.8
>57 378.7 545.3 166.6 477.1 98.4 583 204.3
>60 175.0 254.9 79.9 225.3 50.3 259.1 84.1
>63 82.8 117.8 35.0 103.3 20.5 122.0 39.2
>66 36.9 52.6 15.7 43.1 6.2 56.0 19.1
>69 12.7 17.0 4.3 13.8 1.1 16.4 3.7
>72 3.3 4.3 1 3.6 0.3 3.4 0.1

SERAS Stage Two: Appraisal Findings Report
FL1124000.RCE.RP.J03.020131.Appraisal Findings 187
7.8.5 With the new runway proposals, the area covered by the 54 dB contour parallel to the runways
extends by some 1 to 1.5 km to the north. Option E4 and Option E8 lead to increases in the
populations within the 57 dB contour of around 200,000 compared with the Base, and increases
of just over 4,000 in the population exposed to 69 dB and above. Option E6, which has three
runways operating in mixed mode, shows the greatest adverse impact. The population within
the 57 dB contour increases by 268,000 compared with the Base, and by nearly 8,000 within
the 69 dB contour. Option E6 would also result in an additional 1,800 people being brought
within the 72 dB contour, a 64% increase over the Base. This compares with a figure of 1,000
(36% increase) for Option E4, which has the next highest impact on the higher noise level
contour. In summary, increases in 57 dB contours could affect another 64,000 people if the
existing layout is retained, but operation is changed to full mixed mode. An additional runway
increases the 57 dB contour area by around 65 sq km, affecting a further population of around
200,000.
7.8.6 The recent T5 decision imposes a condition restricting the area enclosed by the 57 dB contour
to 145 sq km as from 2016. In 2015, the Maximum Use option just falls within this limit: all other
options exceed it.
Options in 2030
7.8.7 With the Maximum Use Option, the Base Case for 2030, the population under the 57 dB
contour will be 378,700, an increase of 72,000 over 2000. The 57 dB contour area would also
increase by 17 sq km. The growth in the contours would be to the north west over Slough, to
the south west over Egham, and to the north east over Ealing.
7.8.8 Option E6 produces a smaller impact in 2030 than in 2015. The population under the 57 dB
contour would be 545,300, 7% less than in 2015. However, this would still bring an extra
166,600 people under the 57 dB contour compared with the 2030 Base Case, and 238,600
more than under the Existing contour.
7.8.9 Option E4 also demonstrates a reduced impact in 2030 compared with 2015. The population
falling within the 57 dB contour would be 477,100, which is a reduction of 111,500. Option E8
would have a greater impact in 2030 than in 2015 with around a further 50,000 people within
the 57 dB contour, giving a total of 583,000. This option in particular results in an extension of
the predicted 57 dB contour to the east over central and southeast London.
7.8.10 All of the forecasts for 2030 show a wider area affected than the 145 sq km set as a limit in the
T5 Decision. The maximum use option exceeds the limit by 21 sq km, the additional runway
options by 60 to 80 sq km.
7.8.11 To summarise, even in 2030 the increases in the 57 dB contour would be small if the existing
runway layout is retained and operated as at present. Adding a short runway to the north would
add around 50 sq km to the 57 dB contour area, increasing to over 70sq km if all runways are
SERAS Stage Two: Appraisal Findings Report
FL1124000.RCE.RP.J03.020131.Appraisal Findings 188
operated in mixed mode. The increase approaches 80 sq km for a full-length additional runway,
due to the impact of the larger aircraft classes landing and departing over areas not currently
affected in such a way.
Sensitivity Tests
Options E4 and E6: Sensitivity Test with Different Class 3 Aircraft Types on New Short Runway
7.8.12 Chapter 6 outlines the rationale adopted for transferring aircraft from the existing full length
runways to the new shorter runways in Options E4 and E6. It was the intention that the Class 3
aircraft to be transferred were all of the B757 type, operating within a range of 750km.
However, the contours generated for those options assume a mix of aircraft including some
larger than the B757 having in some cases more onerous noise characteristics. To test how
significantly different the contours for these two options might be with the correct Class 3
assumptions, the worst affected case in movement number terms, Option E4, was re-run at
2030 assigning all Class 3 movements as B757 movements. Results showed that for the
57dBA LAeq,16h contour level there would be a reduction in contour area of less than 3% and an
associated reduction of less than 4 % for population affected within. These were considered to
be within the tolerance limits accepted for the modelling technique applied and thus contours for
Options E4 and E6 were left unchanged.
Option E4: Sensitivity Test with Accelerated Retirement, Aircraft Type Reassignment
and Increased Noise Stringency
7.8.13 The combined effects of variations in assumptions in these three areas for Option E4 in 2015
are summarised in Table 7.26. The three variations were separately modelled. The
accelerated retirement assumption had negligible effect, in part because few older aircraft types
no longer in production in 2000 use Heathrow. The assumption of more short haul rather than
long haul variants of aircraft types gave a 16% reduction in the 57 dB contour area and the
more stringent noise rule (Chapter 3 –14 dB) gave a further 11% reduction. The more stringent
noise rule of Chapter 3 –14 dB may, by 2015, be more compatible than the core assumption of
Chapter 3 –8 dB with the CAEP recommendation that a Chapter 3 – 10 dB standard for new
aircraft designs be implemented in 2006. The combined effect is to reduce the 57 dB contour
area from 211.9 sq km with the core assumptions to 155.7 sq km, a 27% reduction in area. The
resulting area exceeds the limit set in the T5 decision by 10.7 sq km or 7%.

SERAS Stage Two: Appraisal Findings Report
FL1124000.RCE.RP.J03.020131.Appraisal Findings 189
Table 7.26: Option E4 2015 Noise Sensitivity Test Results
Core Assumptions Sensitivity Test
LAeq (dB) Area sq km Population ‘000 Area sq km Population ‘000
>54 379.4 1076.8 276.2 747.7
>57 211.9 512.4 155.7 333.3
>60 125.3 241.0 95.8 162.4
>63 75.7 111.7 57.6 75.7
>66 45.2 48.2 33.4 27.3
>69 26.3 15.2 19.2 8.6
>72 13.8 3.8 9.5 2.3
Aircraft Noise: night time
7.8.14 Tables 7.27 and 7.28 show the population numbers and associated house counts within the
departure and arrival 90 dBA SEL footprints for easterly and westerly operations respectively.
The footprints are shown in a supporting document and represent an ‘average worst’ QC2
aircraft, applied to each departure track (SID) and each runway’s approach path for arrivals.
7.8.15 SID references are: BPK – Brookmans Park; BUZ – Buzad; CPT – Compton; DVR – Dover;
MID – Midhurst; SAM – Southampton
Table 7.27 – Night Noise Population and House Counts – Easterly Operations
Existing Options E4 and E6 Option E8
Runway 09L 09R 09L (2000m rwy) 09R (4000m rwy)
Popl’n
(000’s)
Houses
(000’s)
Popl’n
(000’s)
Houses
(000’s)
Popl’n
(000’s)
Houses
(000’s)
Popl’n
(000’s)
Houses
(000’s)
Departures
BPK 15.8 6.1 17.2 6.3 34.0 12.0 20.1 7.8
BUZ 15.8 6.1 17.2 6.3 34.2 12.1 20.0 7.7
CPT 17.2 6.7 9.0 3.5 24.0 9.2 20.9 8.2
DVR 21.6 8.4 8.1 3.4 24.6 9.5 19.8 7.8
MID 10.1 4.1 9.9 4.0 25.9 9.9 19.9 7.8
SAM 9.7 4.0 8.8 3.5 24.9 9.5 20.1 7.9
Average 15.0 5.9 11.7 6.5 27.9 10.4 20.1 7.9
Arrivals 10.8 5.0 4.2 1.8 8.3 3.2 7.7 2.9

SERAS Stage Two: Appraisal Findings Report
FL1124000.RCE.RP.J03.020131.Appraisal Findings 190
Table 7.28 – Night Noise Population and House Counts – Westerly Operations
Existing Options E4 and E6 Option E8
Runway 27R 27L 27R (2000m rwy) 27R (4000m rwy)
Popl’n
(000’s)
Houses
(000’s)
Popl’n
(000’s)
Houses
(000’s)
Popl’n
(000’s)
Houses
(000’s)
Popl’n
(000’s)
Houses
(000’s)
Departures
BPK 3.2 1.5 2.3 1.0 17.1 7.0 6.9 2.9
CPT 3.6 1.6 2.2 0.9 7.6 3.2 5.9 2.4
DVR 3.6 1.6 2.3 1.0 7.4 3.2 4.9 2.0
MID 3.5 1.6 2.4 1.0 7.7 3.3 5.8 2.3
SAM 3.6 1.6 2.2 0.9 7.8 3.3 5.9 2.4
WOB 3.2 1.5 2.3 1.0 16.7 6.8 7.1 3.0
Average 3.5 1.6 2.3 1.0 10.7 4.5 6.1 2.5
Arrivals 38.3 15.1 37.0 15.4 20.2 8.1 23.3 10.2
7.8.16 With the two existing runways, counts show that under the Max Use, Option E1 and Option 1
scenarios, Rwy 09R would have less impact on population for easterly departures than does
Rwy 09L. Easterly departures have more impact in both population and house count terms for
Options E4 and E6 than for E8. On easterly arrivals, significantly more people are affected with
operations on 09L than 09R whilst for Options E4, E6 and E8 a similar number of people are
affected. On Westerly departures Rwy 27R under Options E4 and E6 have a high impact on
population compared to other options. Westerly arrivals impact the highest numbers of
population and houses, particularly when arriving on the existing 27R and 27L.
7.8.17 On easterly operations, the use of the existing runways would subject fewer people to night-
time noise. On westerly operations, numbers of people affected could be reduced by using one
of the new runways for arrivals, if runway length permits.
Surface Access Noise: Highways
7.8.18 Table 7.29 gives the overall results (total Estimated Population Annoyed - EPA) from the
GOMMMS plan level assessment for road traffic noise. The Surface Access Noise section of
the Appraisal Summary Table also includes the EPA values split by noise contour bands.

SERAS Stage Two: Appraisal Findings Report
FL1124000.RCE.RP.J03.020131.Appraisal Findings 191
Table 7.29 – Heathrow Surface Access Noise Assesssment: Highways
Total change in Estimated Population Annoyed (EPA) by road traffic noise (‘000)
Year Option E1 Option 1 Option E6 Option E4 Option E8
2015 0 0 +2.2 +2.2 +2.2
2030 N/a n/a +2.8 +2.8 +2.8
7.8.19 The noise impacts of changes in road traffic for Options E1 and 1 in 2015 are compared with
the 2015 Base Case. These Options produce no change in the EPA by road traffic noise. The
traffic noise effects of Options E6, E4 and E8 are all the same. The impacts are concentrated
around Heathrow, including M25 Junctions 14 to 15, and parts of the A30. The total change in
EPA is assessed as an increase of 2,200 people for these Options. For 2030, the Base Case is
the road network for Package 2. Compared with this, the traffic noise effects for Options E6, E4
and E8 are limited to the Heathrow area, affecting a similar set of roads in this vicinity to that in
2015. The assessment results in an increase in EPA of 2,800 people.

SERAS Stage Two: Appraisal Findings Report
FL1124000.RCE.RP.J03.020131.Appraisal Findings 192
Surface Access Noise: Railways
7.8.20 Table 7.30 gives the results (total EPA) from the GOMMMS strategy level assessment for
railway noise.
Table 7.30 – Heathrow Surface Access Noise Assesssment: Railways
Total change in Estimated Population Annoyed (EPA) by railway noise (‘000)
Year Option E1 Option 1 Option E6 Option E4 Option E8
2015/2030 +4.7 +4.7 +6.4 +6.4 +6.4
7.8.21 The railway noise impacts for the options at Heathrow are compared against the Base Case
which is the Maximum Use of Existing Runways Scenario. The impacts apply for 2015 and also
for 2030 where this is appropriate. The increases in rail services and associated noise impacts
for Options E1 and 1 are virtually the same. The greatest noise impact will occur on a line
between Acton Wells and Cricklewood where a 6 train per hour passenger service
(SISTERHEX) is proposed for a line currently only used for freight. The remaining noise
impacts will arise on the line between Reading and Staines, Staines and Terminal 5 and
Virginia Water and Byfleet. The total change in Estimated Population Annoyed (EPA) by railway
noise for both Option E1 and Option 1 is an increase of 4,700 people.
7.8.22 For Options E6, E4 and E8 there are similar or increased noise impacts on the lines affected by
Options E1 and 1. In addition, there will be increased noise impacts for people affected by the
main line to the West between West Ealing through Hayes and Slough to Reading. The total
increase in EPA would be 6,400 people for these Options.
7.8.23 This assessment should be considered as a worst case appraisal. It is based on initially
assumed rail services, which, given their passenger forecasts, may not all be implemented.
However, changes in service levels would not be expected to alter the relative positions
between the different options in terms of railway noise impacts.
SERAS Stage Two: Appraisal Findings Report
FL1124000.RCE.RP.J03.020131.Appraisal Findings 193
7.9 Environment: Local Air Quality Impacts
Introduction
7.9.1 Air quality results are provided for representative options at each airport, for 2015 and 2030 as
appropriate. The air quality statistics used as assessment criteria for defining poor air quality in
SERAS Stage Two are: annual mean Nitrogen Dioxide concentrations of 40µg/m3; and the 90th
percentile of running 24-hour mean PM10 concentrations of 50µg/m3. In practice, annual mean
PM10 compared to a statistic of 40µg/m3 is also reported, as the 90th percentile values are a
simple factor of these. The Air Quality Key Indicator for Stage Two of SERAS is 'the number of
people exposed to an exceedance of the air quality standard, weighted by the degree of
exceedance'. The higher the key indicator, the worse the air quality impact is.
2015 Results
7.9.2 Figures 7.68 to 7.71, 7.73 and 7.75 illustrate the air pollution contours for Heathrow options in
2015. For each option, figures are for annual mean Nitrogen Dioxide, and for annual mean
PM10 and 90th percentile of 24hour mean PM10 where relevant. The outer box is the study area
for air quality in each case. Each figure also includes a table of the numbers of people exposed
under each contour. Table 7.31 also summarises, for Nitrogen Dioxide, the population exposed
to exceedances and determines the SERAS Key Indicator, to allow direct comparison between
options and packages. Table 7.32 provides similar results for PM10.
7.9.3 Heathrow options in 2015 result in large key indicator values for annual mean Nitrogen Dioxide.
The base case scores best, but results in over 14,000 people exposed to exceedances. Option
E6 scores the worst, with around 42,000 people exposed. Expressed as a simple average of
annual mean concentration, airport related Oxides of Nitrogen across the options in 2015
account for between 57% and 64% of total Oxides of Nitrogen in the Heathrow study area.
‘Airport related’ includes aircraft emissions, airside emissions, and airport related surface
access emissions. The figures clearly show the highest annual mean Nitrogen Dioxide
contours fall directly on the runways, and particularly the ends of the runway, associated with
acceleration during take-off roll. The figures also show the major roads of the M25 and M4 with
areas of exceedance.
7.9.4 Results clearly show that Heathrow options in 2015 have little impact on PM10, with no
population exposed to exceedances of either annual mean PM10 or 90th percentile of 24hour
mean PM10 in any option. Expressed as a simple average, airport related PM10 in 2015
accounts for less than 9% of total PM10 in the Heathrow study area. Some locations do exceed
air quality statistics, but these are solely over the runways. As no option results in population

SERAS Stage Two: Appraisal Findings Report
FL1124000.RCE.RP.J03.020131.Appraisal Findings 194
exposed to exceedances of the air quality statistics, figures are only provided for the package
option with the largest most extensive PM10 contours, for illustration.
Table 7.31: Nitrogen Dioxide Key Indicators - Heathrow 2015
Population exposed to exceedance of annual mean
NO2 of 40 µg/m3
Package Option40-50
µg/m3
50-60
µg/m3
60-70
µg/m3
70-80
µg/m3
80-90
µg/m3
90-100
µg/m3
>100
µg/m3
Total
population
exposed
Key
Indicator
1 Base Case 8828 4195 1095 151 78 0 0 14347 21497
3 Option E1 - Partial Mixed
Mode9563 4319 1375 197 177 0 0 15631 23999
4 Option 1 - Full Mixed Mode 11986 5013 1808 590 135 78 0 19610 30939
5a Option E6 – New 2000m rwy
north of A427744 6573 4551 1499 972 197 177 41713 67820
5b Option E4 – New 2000m rwy
north of A4 but no new
stands
23916 6422 2648 1599 231 213 0 35029 53533
5c Option E8 – New 4000m rwy
north of A418315 7911 5308 1596 936 245 135 34446 63540
Table 7.32: PM10 Key Indicators - Heathrow 2015
Annual mean PM10 of 40 µg/m3 90th Percentile of 24hour mean
PM10 of 50 µg/m3
Package OptionTotal population
exposed
Key
Indicator
Total population
exposed
Key
Indicator
1 Base Case 0 0 0 0
3 OptionE1 - Partial Mixed Mode 0 0 0 0
4 Option 1 - Full Mixed Mode 0 0 0 0
5a Option E6 – New 2000m rwy north of A4 0 0 0 0
5bOption E4 – New 2000m rwy north of A4
but no new stands0 0 0 0
5c Option E8 – New 4000m rwy north of A4 0 0 0 0
SERAS Stage Two: Appraisal Findings Report
FL1124000.RCE.RP.J03.020131.Appraisal Findings 195
2030 results
7.9.5 Figures 7.72, 7.74, and 7.76 to 7.78 illustrate the air pollution contours for Heathrow options in
2030. For each option, figures are for annual mean Nitrogen Dioxide, and for annual mean
PM10 and 90th percentile of 24hour mean PM10 where relevant. The outer box is the study area
for air quality in each case. Each figure also includes a table of the numbers of people exposed
under each contour. Table 7.33 also summarises, for Nitrogen Dioxide, the population exposed
to exceedances and determines the SERAS Key Indicator, to allow direct comparison between
options and packages. Table 7.34 provides similar results for PM10.
7.9.6 Heathrow options in 2030 result in large key indicator values for annual mean Nitrogen Dioxide.
Of the 2030 options, option E4 scores best, but results in over 33,000 people exposed to
exceedances. Option E8 scores the worst, with over 43,000 people exposed. The 2030
situation is better than 2015 for options E4 and E6, but worse for option E8. The 2015 base
case still scores best, (but with over 14,000 people exposed to exceedances). Expressed as a
simple average, airport related Oxides of Nitrogen across the options in 2030 account for
between 60% to 63% of total Oxides of Nitrogen in the Heathrow study area. ‘Airport related’
includes aircraft emissions, airside emissions, and airport related surface access emissions.
The figures clearly show the highest annual mean Nitrogen Dioxide contours fall directly on the
runways, and particularly the holding points. The figures also show the major roads of the M25
and M4 with areas of exceedance.
7.9.7 Table 7.33 results clearly show that Heathrow options in 2030 (as in 2015) have little impact on
PM10, with no population exposed to exceedances of either annual mean PM10 or 90th
percentile of 24 hour mean PM10 in any option. Expressed as a simple average, airport related
PM10 in 2030 accounts for less than 9% of total PM10 in the Heathrow study area. Some
locations do exceed air quality statistics, but these are solely over the runways. As no option
results in population exposed to exceedances of the air quality statistics, figures are only
provided for the package option with the largest most extensive PM10 contours, for illustration
(option E6).

SERAS Stage Two: Appraisal Findings Report
FL1124000.RCE.RP.J03.020131.Appraisal Findings 196
Table 7.33: Nitrogen Dioxide Key Indicators - Heathrow 2030
Population exposed to exceedance of annual mean
NO2 of 40 µg/m3
Package Option
40-50
µg/m3
50-60
µg/m3
60-70
µg/m3
70-80
µg/m3
80-90
µg/m3
90-100
µg/m3
>100
µg/m3
Total
population
exposed
Key
Indicator
5aOptionE6 – New 2000m
rwy north of A427440 6213 4124 1604 602 115 98 40196 63040
5b
OptionE4 – New 2000m
rwy north of A4 but no new
stands
22288 6430 2916 1369 238 136 0 33377 51378
5cOptionE8 – New 4000m
rwy north of A424509 7887 5667 3624 935 546 295 43463 81796
Table 7.34: PM10 Key Indicators - Heathrow 2030
Annual mean PM10 of
40 µg/m3
90th Percentile of 24hour
mean PM10 of 50 µg/m3
Package OptionTotal population
exposed
Key
Indicator
Total population
exposed
Key
Indicator
5a Option E6 – New 2000m rwy north of A4 0 0 0 0
5bOption E4 – New 2000m rwy north of A4 but
no new stands0 0 0 0
5c Option E8 – New 4000m rwy north of A4 0 0 0 0
Sensitivity Tests
7.9.8 Two NO2 sensitivity tests have been carried out for 2015 at Heathrow, applying the revised
assumptions set out in Table 6.5. Sensitivity test 1 was applied to Option E6: sensitivity test 2
to Option E4. The effects in terms of the numbers of people exposed to exceedances of NO2
are summarised in Table 7.35.
SERAS Stage Two: Appraisal Findings Report
FL1124000.RCE.RP.J03.020131.Appraisal Findings 197
Table 7.35: Effects of Air Quality Sensitivity Tests
Total population exposed to exceedance of annual mean
NO2 of 40 µg/m3
Core
assumptions
Sensitivity test 1 Sensitivity test 2
Option E6 41,713 25,929
Option E4 35,029 5,235
7.9.9 The sensitivity tests have an increasing effect in reducing aircraft emissions leaving fewer
people exposed to exceedances of NO2. With the more demanding assumptions in sensitivity
test 2, the population still left exposed to exceedances of annual mean NO2 with a new runway
Option E4 is just over 5,000, predominantly in areas around the A4 and in Harlington to the
north of the airport, and around the M4 in West Drayton, to the north of the new runway, and
Hayes.
7.10 Employment
Employment Forecasts
7.10.1 The employment forecasts for each option based on current employees at Heathrow and
projected forwards to 2015 and 2030 are shown in Tables 7.36 and 7.37. The combination of
passenger forecasts, productivity growth of 1.5% per annum and assumed on/off site
employment produces a range of results. Total direct on/off site employment at Heathrow
ranges between 75,000 for maximum use of existing runways and 128,000 with an additional
runway in 2015. 2030 estimates for additional runway options indicate that continuing
productivity gains will mean that total direct on/off site employment at the maximum reaches
102,000.
7.10.2 It is estimated that Heathrow options would generate a maximum additional 49,000 direct on/off
site jobs by 2015 over current levels, with this figure reducing to 23,000 by 2030. At the
maximum, the additional indirect employment generated by the runway options in 2015 is
15,000 new jobs and 7,000 by 2030.

SERAS Stage Two: Appraisal Findings Report
FL1124000.RCE.RP.J03.020131.Appraisal Findings 198
Table 7.36: Current and forecast employment at Heathrow by option 2015
Current & Forecast
Employment by
Option
Current
1998
Max Use
2015
E1
2015
1
2015
E6
2015
E4
2015
E8
2015
Direct on-site 68,500 65,200 68,900 77,400 110,300 96,600 92,800
Direct off-site 10,300 10,100 10,800 12,300 18,000 15,700 15,000
Indirect 23,600 22,600 23,900 26,900 38,500 33,700 32,300
Total Employment 102,400 97,900 103,600 116,600 166,800 146,000 140,100
Passengers (mppa) 62 77 81 91 131 114 110
Direct employees/mppa 1,270 985 984 983 982 982 983
Total employees/mppa 1,651 1,280 1,279 1,278 1,277 1,277 1,277

SERAS Stage Two: Appraisal Findings Report
FL1124000.RCE.RP.J03.020131.Appraisal Findings 199
Table 7.37: Current and forecast employment at Heathrow by option 2030
Current & Forecast
Employment by Option
Current
1998
Max Use
2030
E6
2030
E4
2030
E8
2030
Direct on-site 68,500 60,700 87,700 77,500 84,300
Direct off-site 10,300 9,600 14,300 12,500 13,700
Indirect 23,600 21,100 30,600 27,000 29,400
Total Employment 102,400 91,400 132,600 117,000 127,400
Passengers (mppa) 62 89 130 115 125
Direct employees/mppa 1,270 787 786 786 786
Total employee/mppa 1,651 1,023 1,021 1,022 1,021
7.11 Land Use/Urbanisation
Summary
7.11.1 The core catchment area for Heathrow is generally densely developed; with most open space
allocated as part of the Green Belt. The capacity review has indicated that in these conditions it
is difficult to isolate likely future housing sites without a detailed knowledge of the particular
areas. This is because, unless Green Belt sites are lost to housing development, the boroughs
are reliant on intensification, and windfall and brownfield sites as sources of future housing land.
7.11.2 The scope for a further major expansion of Heathrow is limited by very low unemployment
levels and strong competition from high tech manufacturing and service firms in the Western
Policy Area and the M4 corridor. There is already emerging a shortage of homes for key
workers.
7.11.3 Currently the airport accounts for 14.5% of the jobs in its Core Catchment Area (Hillingdon,
Hounslow, Ealing and Spelthorne). This could increase to 23% in 2015 with the largest airport

SERAS Stage Two: Appraisal Findings Report
FL1124000.RCE.RP.J03.020131.Appraisal Findings 200
development option, but would decline to 17.5% in 2030 with continued growth in labour
productivity.
7.11.4 There is a large forecast housing shortfall in Heathrow’s core and wider catchment areas, ie,
the difference between TEMPRO housing projections and the housing provision in RPG. The
shortfall is 106,000 in 2015 and 124,000 in 2030, out of around 1.3 million houses in the
combined area. The largest airport option accounts for 28% of total employment growth to
2015, but only 8% to 2030. On this basis, the largest airport development option could be said
to demand some 29,400 houses above RPG provision by 2015 and 9,600 by 2030, adding to
current pressures in the Western Policy Area. In terms of housing capacity, it is unlikely that
any of the larger Heathrow options could be accommodated without major Green Belt releases
and a major reconfiguration of the existing settlement structure.
7.11.5 The development implications of off airport employment vary significantly between options, with
requirements for up to 131 hectares in 2015 of off-site employment land within reasonable
proximity to the airport. The UDPs of all four districts in the core catchment area offer
employment land, particularly large brownfield sites in Ealing, but it is unlikely that sufficient
vacant or redevelopable land exists in the core catchment area to accommodate the larger
airport requirements. Additional land releases would probably be required to fully meet
maximum airport requirements.
Employment Land Requirements
London Borough of Hillingdon
7.11.6 Hillingdon has a thriving local economy with pockets of deprivation. The number of jobs in the
borough is rising steadily and the unemployment rate is below average for Greater London and
Outer London. There is a corridor of vacant and condemned sites in the Hayes/West Drayton
corridor, which have become available due largely to the collapse of the defence industry. Over
5,000 jobs have been lost in recent years.
7.11.7 It is policy in Hillingdon to actively encourage the establishment of airport related industries in
the borough, including those attracted to the area in part because of Heathrow. It wants to
encourage stronger links between existing companies and workers and airport related activity.
At the same time however, it does not want to become over dependent on Heathrow.
7.11.8 Examination of the adopted Hillingdon UDP (1998) indicates that there is some scope for
additional direct off airport and indirect employment to locate on existing allocated sites within
the district; these include the sites in the Hayes/West Drayton corridor specifically. If additional
land is needed, similar issues concerning additional land releases will apply, as discussed
under Overall Capacity in the section on housing below.

SERAS Stage Two: Appraisal Findings Report
FL1124000.RCE.RP.J03.020131.Appraisal Findings 201
London Borough of Hounslow
7.11.9 Hounslow is a major employment centre providing 100,000 jobs. Heathrow airport plays an
integral role in the local economy both as the most important local source of employment and
through the associated activities, office and warehouse based located within Hounslow.
7.11.10 UDP employment policies seek to maintain and enhance the importance of Hounslow as an
employment centre. The adopted plan (1996) notes that there are several B8 (warehouse)
uses close to the airport, and that these are encouraged in these locations as they have the
advantage of integrating land use and transport, reducing the length and time of journeys and
linking warehousing to the airport and the national road network. The main employment area in
the borough is the Great West Road Employment area, containing 384,000 sq m of floorspace,
60% of which is offices.
7.11.11 There is also a requirement to regenerate parts of the borough, particularly town centres e.g.
Brentford, Feltham, Hounslow and Chiswick. As a part of this the Council is looking to
concentrate office development, at high densities, in these centres.
7.11.12 Examination of the UDP identifies a range of employment sites in the borough, and implies, in
the regeneration areas particularly, that there are some vacant sites. If there were insufficient
vacant or redevelopment sites, similar issues concerning land releases will apply.
London Borough of Ealing
7.11.13 Ealing has a wide range of employment sites within it, including the extensive industrial estates
of Park Royal and Perivale. Historically the borough economy had a strong manufacturing
base, this continues to be eroded and has resulted in the availability of 80 acres of large
brownfield sites in traditional industrial areas, including the Atlas Road site and Southern
Gateway site in Park Royal.
7.11.14 The borough’s planning policies seek to encourage the regeneration of vacant employment
sites, and identifies ‘renewal areas’ and ‘opportunity sites’. Although the adopted UDP (1995)
notes the loss of employment land to other uses, namely retail and housing, it seeks to retain
employment use on these established sites. It therefore identifies a series of ‘major
employment locations’ within which employment uses are to be retained.
7.11.15 The UDP seeks to discourage large scale warehouse and distribution employers within areas,
particularly Park Royal, in order to reduce lorry flows and increase employee numbers (by
raising employment densities). This area therefore would suit only particular types of indirect
airport employment, namely those that are based in offices, and not in larger warehouse
developments. At the same time, Park Royal has an established history of catering firms, and
therefore provides an obvious location for airport related caterers to locate.

SERAS Stage Two: Appraisal Findings Report
FL1124000.RCE.RP.J03.020131.Appraisal Findings 202
7.11.16 Given the relatively wide range of existing employment sites in the borough, it is assumed that
there is sufficient flexibility to accommodate a reasonable level of additional off airport
employment. If additional land were required, similar issues concerning land releases will
apply.
Spelthorne District Council
7.11.17 There is currently 709,000 sq m of existing employment space (industrial, warehouse and office
floorspace) in the district, representing 10% of total floorspace in Surrey. The local plan (as
proposed to be adopted) notes that the airport generates high demand for employment land,
including pressure for Green Belt sites. Currently, the airport employs 10% of the economically
active population.
7.11.18 The local plan notes that the scope for major additional employment floorspace is constrained
by the Green Belt, there being very few ‘greenfield sites’. Currently there is no case for its
release, and there is a natural turnover of sites and some vacant space. In 1998 there was just
under 50,000 sq m (5 ha) of vacant employment land; there is potential for around 4,000 new
jobs at current densities on allocated employment sites. Therefore there is potential to
accommodate at least some additional indirect airport employment on existing sites in the
future.
7.11.19 The local plan expects all airport related development to be located within the airport; this is
clearly defined as passenger terminals, cargo facilities, maintenance facilities, oil storage,
airline offices, car parking, car hire depots, catering facilities, and other developments that
primarily serve the airport. The local plan therefore makes no provision for additional indirect
employment.
7.11.20 Examination of the plan indicates that there is some scope for indirect airport employment to
locate on existing allocated sites within the district. If additional land is required, issues
concerning additional land releases will apply.
Housing Capacity
7.11.21 The largest development option would require an additional 64,400 employees in 2015
(covering direct on-site and off-site and indirect employment) over current (1998) levels
declining to 30,200 by 2030. The RPG housing provision in the core and wider catchment
areas is for an additional 204,000 houses to 2030.
7.11.22 Mixed mode operation on the existing runways would account for 6% of forecast employment
growth to 2015 in the core and wider catchment areas, but additional runways would account
for between 16% and 28% of forecast employment growth. In terms of overall impact on
housing allocations, it is deemed that the options which make alternative uses of the existing
runways would present low pressures within the area – whilst additional housing is required, the

SERAS Stage Two: Appraisal Findings Report
FL1124000.RCE.RP.J03.020131.Appraisal Findings 203
levels forecast are not deemed to present major problems when considered against allocation
forecasts. But any of the options which involve new runways will create major pressures on the
housing market in the surrounding areas. A summary assessment of the scope for future
additional provision is provided below.
7.11.23 The four boroughs/districts comprising Heathrow core catchment area are generally built up
with remaining land being Green Belt. In these areas therefore, the intensification of existing
sites, and the adequate utilisation of windfall sites and brownfield land provide the most likely
source of future housing sites to accommodate airport employees.
7.11.24 The settlement structure and policy context is as follows. The built up area of Hillingdon is
densely developed and accounts for about half of the borough area, the remainder is open
space, predominantly Green Belt. The main settlements are Hayes, West Drayton, Uxbridge
and Harefield.
7.11.25 In 1991 there were 204,400 people living in LB Hounslow in 88,300 dwellings. The five main
centres in the borough, Hounslow, Chiswick, Feltham, Hounslow West and Brentford, have
coalesced to form a continuous built up area.
7.11.26 UDP policies seek to protect the local environment and retain housing land. Following major
housing development in the 1980s, most housing is now concentrated in the eastern and
central parts of the borough (Chiswick), leading to concerns about ‘town cramming’ in these
areas. Most recently, demand for housing has largely been met by conversions to smaller
units. The UDP indicates that this is not a long term solution, as a high proportion of the
existing housing stock is not suitable for conversion. Policies are in place to prevent the loss of
residential space and to increase the density of properties where appropriate. It is accepted
that due to development land constraints housing demand in the borough will continue to
outstrip supply.
7.11.27 Ealing has a population of 293,000 (1992) and comprises five distinct settlement areas,
including Acton town centre, the Ealing area, Hanwell, Park Royal, and the Greenford, Northolt
and Perivale Area. It is generally urbanised in character, with pockets of Green Belt to its
western margins and widespread coalescence between different neighbourhoods. The UDP
refers to pressure for housing and other development to the west of the district, i.e. those areas
closest to Heathrow.
7.11.28 Via its development sites at Park Royal, Hanwell and Perivale, the borough provides a range of
employment and residential development sites. The borough contains several regeneration
areas (Hanwell, Southall, Park Royal) all of which would benefit economically from the location
of additional employment and residential developments in their proximity.

SERAS Stage Two: Appraisal Findings Report
FL1124000.RCE.RP.J03.020131.Appraisal Findings 204
7.11.29 Sixty per cent of Spelthorne’s area is protected by Green Belt; the remainder is built up area.
There is limited scope for large scale urban expansion or a new settlement, without the erosion
of the Green Belt and/or infilling of major water supply reservoirs.
7.11.30 There are five main settlements in the district: Staines, Ashford, Sunbury, Shepperton, and
Stanwell. These are, in the main, joined together as part of a continuous urban fabric. Between
the 1930s and 1950s there was large scale residential expansion in the area. This extended
the built up area to its current boundaries, with the Green Belt designation preventing the
development of further greenfield sites.
7.11.31 For the last forty years, additional housing development has been restricted to the
intensification and recycling of land within the built up area. For the same period it has not been
possible to meet demand for housing within the district.
7.12 Integration Impacts
Regional / sub-regional policy
7.12.1 Heathrow Airport impacts on the sub-regions of the Thames Valley (including the Western
Policy Area) and the Blackwater Valley. The impacts of an expanded airport are discussed
below under the headings of employment/labour force, housing and transport infrastructure.
Employment / Labour Force
7.12.2 In a low growth scenario at Heathrow, the impacts on employment and the labour force
generally are likely to be positive. Although the labour pool has little capacity, this is largely due
to commuting to London that can be reversed by the development of strong business clusters
around the airports. With the strength of the M4 corridor and the record of companies being
retained in the region, these clusters are likely to increase in variety and strength the larger the
growth at the two airports. This must be tempered however by the policy aim of sustainable
growth. It is unlikely that continued expansion at the present rate can be continued in a
sustainable manner. Large scale growth at Heathrow could therefore have the effect of
compromising the underlying strategy contained in regional guidance.
7.12.3 The nature of clustering around Heathrow Airport points to a continuation of similar high-
technology, R&D sectors expanding further along key corridors such as the M4 corridor and
continuing to utilise the knowledge base of the Oxford-Cambridge arc. This will consolidate the
employment profile of the region, thus doing little to assist people entering or re-entering the job
market. What it will do however, particularly through the learning centres of Oxford and
SERAS Stage Two: Appraisal Findings Report
FL1124000.RCE.RP.J03.020131.Appraisal Findings 205
Cambridge, is serve to provide the requisite training and skills profile to continue the high-
technology clustering in the sub-region.
Housing
7.12.4 In an area that experiences such high pressure on housing land and prices, the ability to
accommodate housing growth created by expansion at Heathrow is questionable. Particularly in
respect of the types of businesses that will continue to cluster in the vicinity of Heathrow, and
the corresponding types of worker that will be attracted, the cycle of current residential patterns
would ideally be repeated. In other words, there would be further pressure on large, spacious,
greenfield developments to house a high skill workforce. With the restrictions on Green Belt
release for development, this is not a realistic option.
7.12.5 Development is therefore to be focused on brownfield development closer to town centres. In
the centres of the Thames and Blackwater Valleys, this inevitably lends itself to higher density
affordable housing. This would infer that affordable housing targets will have a better chance of
being met, but the sheer level of job creation in the area caused by airport expansion will
reduce the overall levels. Nevertheless, brownfield development levels will almost certainly rise,
provided developers wish to develop in these centres. The increase in jobs created by the
airport will improve the likelihood of this occurring.
7.12.6 The policy of providing housing close to employment areas is likely to be contributed in a
slightly negative way by expansion at Heathrow. Although increased town centre living,
particularly by lower skilled workers in affordable housing will increase. However, the majority
of off-site jobs created will continue to be in high technology clusters along the M4 corridor and
across the Oxford-Cambridge Arc. Without strict implementation of company transport plans
(which do have a greater patronage where businesses cluster) and demand management, this
will lead to increased car-based travel.
Transportation / Infrastructure Improvements
7.12.7 Overall, the impact of development at Heathrow on transportation infrastructure is positive. This
assumes however, that an acceptable package of transport proposals given in the regional
guidance are implemented. As such, any increase in the capacity of Heathrow will have the
effect of kick-starting rail development and improvement, although this will mostly be links into
London or directly into the airport.
7.12.8 Increased high-technology business clusters are likely to have the effect of localising a small
percentage of the local high-skill workforce that commutes to London, thus reducing the need to
travel and for much long distance commuting to occur. However, inevitably the associated rail
improvements will have the counterbalancing effect of increasing commuting into London for
other workers. Also, it will increase the possibility of long distance commuting the other way, i.e.
from Greater London into the new business clusters that will be created.

SERAS Stage Two: Appraisal Findings Report
FL1124000.RCE.RP.J03.020131.Appraisal Findings 206
7.12.9 In a high growth scenario, the impact is likely to be negative. It is unlikely that the improvements
identified in regional policy will be sufficient to support the increased levels of road and public
transport usage. With the existing pattern of development along corridors and arcs continuing,
only a radical combination of large scale infrastructure developments and strict demand
management measures are likely to be sufficient to cope.
Social Impacts
Low Growth Scenario
7.12.10 Under the lower growth scenarios (up to 2015), around an additional 14,000 jobs are forecast to
be generated in total – by Option 1. Of these, over 4,000 are forecast to be low skill in nature,
with potentially 2,500 being located on-site and 1,500 off-site.
7.12.11 In terms of filling both the on-site and off-site jobs, in 1998 there was a shortage of only 1,000
available jobs in the deprived districts. However, the forecasts for labour market capacity up to
2016 indicate that the number of available jobs may only rise slightly whereas the low skill
workforce could rise considerably, possibly sufficient to result in over 6,000 surplus workers.
7.12.12 As such, several thousand of the additional jobs generated could be accommodated in each of
the three deprived districts in the CCA. The largest proportions would be in Ealing and
Hillingdon because it has the highest available resident labour force for low skill workers.
7.12.13 There is likely to be high levels of movement between the three deprived boroughs, both to
access on-site and off-site jobs. In order to reach the maximum numbers possible in each
borough, it would require improved bus services to serve them, either in the form of the existing
public network or private works buses provided by employers.
High Growth Scenario
7.12.14 Under a high growth scenario (also up to 2015), up to 64,400 jobs could be generated – by
Option E6. Of these, over 21,000 could be low skill in nature, with potentially 13,300 being
located on-site and over 7,700 off-site.
7.12.15 With the high growth scenario peaking around 2016, the labour market situation will be similar
to the low growth scenario, i.e. a maximum surplus of 6,000 workers. As such, this worker
surplus can fill a fair percentage of airport-generated employment but clearly several thousand
jobs will need to be filled by workers from elsewhere.
SERAS Stage Two: Appraisal Findings Report
FL1124000.RCE.RP.J03.020131.Appraisal Findings 207
7.12.16 Again, in order to fill even this percentage of the total jobs created in the three deprived districts,
it will require improvements to existing bus services and possibly the provision of works buses.

SERAS Stage Two: Appraisal Findings Report
FL1124000.RCE.RP.J03.020131.Appraisal Findings 208
8 Appraisal of Options at Main Sites: Gatwick
8.1 Options Appraised in Stage Two
8.1.1 Two options carried forward from Stage One have been appraised at Gatwick: one with one
new runway and one with two. As currently envisaged in the land-use planning system,
Gatwick operates as a single runway, two terminal airport with a capacity of 40 mppa. It was
assumed that, under pressure of long term demand growth, maximum use of the existing
runway could see capacity increase to 46.5 mppa (see Figure 8.1 for airport location).
8.1.2 Option 1 adds a new full length runway 385m to the south of the existing runway, with no
stagger. Dependent operations would apply to this close parallel runway pair, probably with
landings on the southern runway.
8.1.3 Option E1 adds two new full length runways to the existing runway. A new runway is added
some 2900m to the north, staggered 2000m to the west, and a new runway is added 1035m to
the south, permitting independent operations on the three runways. The new northern runway
would be operated only to and from the west, to avoid overflying Horley, with the new southern
runway operating to and from the east. The existing runway would continue to operate in mixed
mode.
8.1.4 The Gatwick options appraised are summarised in Table 8.1. Figure 8.2 shows the existing
airport layout and Figure 8.3 shows a revised layout to make maximum use of the existing
runway. Option 1 is shown in Figure 8.4 and Option E1 in Figure 8.5.
Table 8.1: Options Appraised at Gatwick
Option Description
Terminal
capacity,
mppa
Runway
capacity,
ATM
Year of
Introduction
Current Land Use Planning System 40 260,000
Maximum Use of Existing Runway 46.5 260,000
1New runway 365m to south of existing
runway, making close parallel dependent pair62 378,000 2011
E1
Two new runways operated in segregated
mode. One 2900m to north and one 1035m to
south of existing runway
115 675,0002011 and
2021

SERAS Stage Two: Appraisal Findings Report
FL1124000.RCE.RP.J03.020131.Appraisal Findings 209
8.2 Capital Costs
Introduction
8.2.1 Table 8.2 below shows the estimated incremental capital costs for each option above the
46.5mppa maximum use capacity of the existing runway. Table 8.3 gives the breakdown of
surface access (road and rail) costs.
Table 8.2: Estimated Incremental Capital Costs for Gatwick Options above Max Use Case (£ million)
Item Option 1 Option E1
Capacity 62 mppa 115 mppa
Terminals & Satellites
Terminal Buildings
Satellite Buildings
Baggage Handling & conveyors
Total
290
80
66
436
891
283
154
1328
Aircraft Pavements
Runways
Taxiways
Aprons / Stands
Total
32
68
35
135
64
234
163
461
Enabling Works & Infrastructure
Demolition, Earthworks, etc
Car Parking
Utility Services
Airside Roads and public
Road diversions
Tracked Transit
Drainage
Landscaping
Total
27
123
20
14
99
10
10
303
60
401
84
114
510
23
21
1213
Navigation Aids (ATC, ILS & AGL) 7 23
Cargo & Maintenance
Cargo buildings & aprons
Hangar/ Maintenance
Buildings & aprons
Total
28
74
102
60
98
157
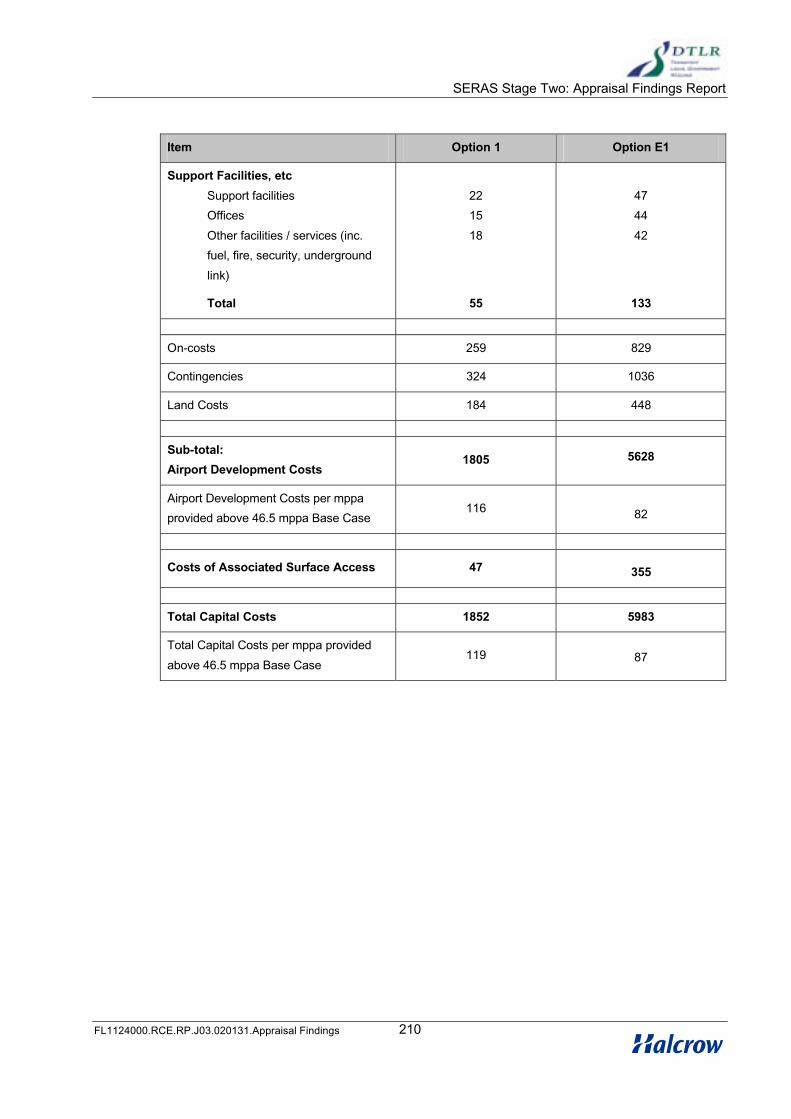
SERAS Stage Two: Appraisal Findings Report
FL1124000.RCE.RP.J03.020131.Appraisal Findings 210
Item Option 1 Option E1
Support Facilities, etc
Support facilities
Offices
Other facilities / services (inc.
fuel, fire, security, underground
link)
Total
22
15
18
55
47
44
42
133
On-costs 259 829
Contingencies 324 1036
Land Costs 184 448
Sub-total:
Airport Development Costs1805 5628
Airport Development Costs per mppa
provided above 46.5 mppa Base Case 116 82
Costs of Associated Surface Access 47 355
Total Capital Costs 1852 5983
Total Capital Costs per mppa provided
above 46.5 mppa Base Case 119 87

SERAS Stage Two: Appraisal Findings Report
FL1124000.RCE.RP.J03.020131.Appraisal Findings 211
Table 8.3: Estimated ‘Airport Specific’ Surface Access Costs (£ million)
Item Option 1 Option E1
Road Schemes
M23 J9 to J9a widening D2(M)-D3(M)
M23 J9 to J9a widening D2(M)-D5(M)
Widen spur west of J9a D2-D3
Widen spur west of J9a D2-D4(M)
Access to new North Terminal
A23 diversion – included in Airport
Development Cost
Sub Total
13
n/a
34
n/a
n/a
47
n/a
27
n/a
54
24
105
Rail Schemes
Croydon underpass
Sub Total
n/a
0
250
250
Total 47 355
Airport Option Costs
8.2.2 Current planning strategy at Gatwick is focused on accommodating 40mppa within the existing
site. However, through greater use of larger aircraft and off-peak slots, it is considered that an
additional 6.5mppa could be accommodated within the same facility provision. No cost has
therefore been allocated to this increase in capacity.
8.2.3 Enabling works costs for the options are low, mainly due to the nature of the site requiring
comparatively small volumes of earthworks.
8.2.4 The tracked transit system contributes 14% of the cost of Option E1 (8% to Option 1). In total, it
is longer than for any other equivalent SERAS option and costs per mppa for the system are
higher than at any other site except for some Heathrow options.
8.2.5 Car parking costs at Gatwick are about £7 million per mppa, slightly higher than at Stansted, but
much higher than at other sites. This appears to be due to a high number of spaces provided
and because the majority is in multi-storey or decked construction.
8.2.6 Although not included in the estimates, a cost premium may be expected for working in
operational areas. This may occur with the construction of taxiways immediately south of the
existing runway.

SERAS Stage Two: Appraisal Findings Report
FL1124000.RCE.RP.J03.020131.Appraisal Findings 212
8.2.7 Land costs contribute 10% and 8% of the Airport Development Costs of Options 1 and E1
respectively. These are amongst the highest land take costs of all sites. This is primarily due to
the high proportion the acquired land being commercial and the high value of such land in the
area.
Surface Access Costs
8.2.8 The rail access costs do not include for Gatwick Station and Brighton mainline upgrades which
it is assumed would be fully funded by the local train operating company and track owner.
Option E1 includes a rail underpass at Croydon.
8.2.9 Road costs are for road widening and for a new road, all providing access from Junction 9 of
the M23. Diversion of the A23 to the south of the airport (at grade in Option 1 and tunnelled in
E1) is included in the Airport Development Cost since it is a necessary consequence of
construction.
8.2.10 Required improvements to the strategic road network in Option E1, ie those not specifically
required to accommodate airport related traffic, are on the M23 from junctions 8 to 10 (dual 3 up
to dual 4) and unspecified improvements to the A264 (east of the M23). The combined cost for
these works would be about £57 million.
8.3 Demand Forecasts
8.3.1 Forecast passenger movements, ATMs and passengers per passenger ATM for each Gatwick
option are summarised at 5 year intervals between 2000 and 2030 in the following tables:
• Table 8.4: Current Land Use Planning System
• Table 8.5: Maximum Use of the Existing Runway
• Table 8.6: Option 1
• Table 8.7: Option E1
8.3.2 The principal features of the demand forecasts for each option are summarised below. In the
forecasting it has been assumed that both charter services and low cost services could operate
at Gatwick.
Current Land Use Planning System
8.3.3 Gatwick Airport is currently operating very close to its runway capacity, so while the planning
system allows for 40 mppa, the lack of additional runway capacity means that additional
SERAS Stage Two: Appraisal Findings Report
FL1124000.RCE.RP.J03.020131.Appraisal Findings 213
passenger throughput can only be achieved by an increase in passengers per ATM. Total
passengers at Gatwick are actually higher in this package than with maximum use of the
runway. This is because charter demand, which diverts to Luton in the maximum use option,
remains at Gatwick due to the heavy constraint that Luton is under in the current land use
planning system. This results in a P/PATM of 174 instead of 160 in the maximum use case and
therefore larger passenger numbers.
Maximum Use of the Existing Runway
8.3.4 This option has the same runway capacity as envisaged in the land use planning system, and it
is this runway constraint that dominates in the period to 2030. Passenger throughput is limited
to less than 40 mppa until after 2020. Despite the ATM constraint, the number of passengers is
forecast to continue to grow beyond then as the number of passengers per ATM continues to
increase. The greatest absolute growth is in passenger numbers on scheduled USA and short
haul services, less so on domestic and long haul services. Charter passengers decline from the
current 12 mppa to 8 mppa in 2015 and 5 mppa in 2030. The number of I to I interliners grows
from 3 mppa to 4 mppa then stays at around that level. Leisure trips are forecast to dominate
trips to/from the UK, increasing from some 24 mppa in 2000 to 24 mppa in 2015 and 26 mppa
in 2030. The number of business trips is forecast to increase from 4 mppa in 2000 to 6 mppa in
2015 and 10 mppa in 2030. Gatwick too becomes more local. Trips to/from London and the
South East are 83% of Gatwick’s trips to/from the UK in 2000 but 89% by 2015 and 92% by
2030.
Option 1
8.3.5 The additional runway capacity introduced in 2011 is fully utilised from then, by a large increase
in short haul ATMs and smaller increases in ATMs on USA and long haul routes. The
additional runway capacity in this option encourages a small increase in charter traffic, but, from
the time the additional capacity is introduced, scheduled services are forecast to account for
over 75% of Gatwick’s passengers. The number of I to I interliners increases to a maximum of
9 mppa with the second runway. Leisure trips to/from the UK increase to 33 mppa in 2015 and
35 mppa in 2030 and business trips to 9 mppa in 2015 and 15 mppa by 2030.
Option E1
8.3.6 Additional runway capacity, up to 486,000 ATMs is introduced in 2011 and to 675,000 ATMs in
2021. This runway capacity is always fully used. Most additional passengers are on short haul
scheduled services. These account for 18 mppa out of the 32 mppa additional passengers
(over maximum use of the existing runway) in 2015 and 29 mppa out of the 48 mppa additional
passengers (over Option 1) in 2030. There are also additional long haul scheduled and charter
passengers.

SERAS Stage Two: Appraisal Findings Report
FL1124000.RCE.RP.J03.020131.Appraisal Findings 214
8.3.7 There is an increase in I to I interliners to 14 mppa in 2015 and 24 mppa in 2030. Leisure trips
to/from the UK increase to 41 mppa in 2015 and 57 mppa in 2030. Business trips increase to
12 mppa in 2015 and 25 mppa in 2030.

SERAS Stage Two: Appraisal Findings Report
FL1124000.RCE.RP.J03.020131.Appraisal Findings 215
Table 8.4: Gatwick Option: Current Land Use Planning System
2000 2005 2010 2015 2020 2025 2030
Passengers, mppa
Scheduled Domestic 1 1 2 2 2 2 2
Short haul 12 12 14 14 14 16 14
USA 5 6 7 8 10 12 14
Long haul 2 2 2 3 3 4 5
Total 20 21 25 27 29 34 35
Charter 12 12 10 9 9 9 9
Low cost 1 ** ** ** ** ** **
Total 32 34 34 36 39 43 45
ATMs, ‘000
Scheduled Domestic 38 32 27 27 28 29 29
Short haul 133 137 144 147 136 146 125
USA 19 21 14 30 35 40 45
Long haul 10 11 11 15 17 19 23
Total 200 201 207 219 216 234 222
Charter 50 52 44 38 36 35 35
Low cost 6 ** ** ** ** ** **
Total 256 256 252 258 253 269 258
Passengers/PATM
Scheduled 100 107 116 124 136 144 158
Charter 230 231 231 241 253 259 269
Low cost 99 78 83 93 ** ** **
Average 125 132 136 142 153 159 174
Note: Figures in bold are capacity-constrained forecasts
‘Other’ categories, not shown, are included in totals. Totals may not sum due to rounding
** = less than 0.5 mppa or less than 500 ATMs
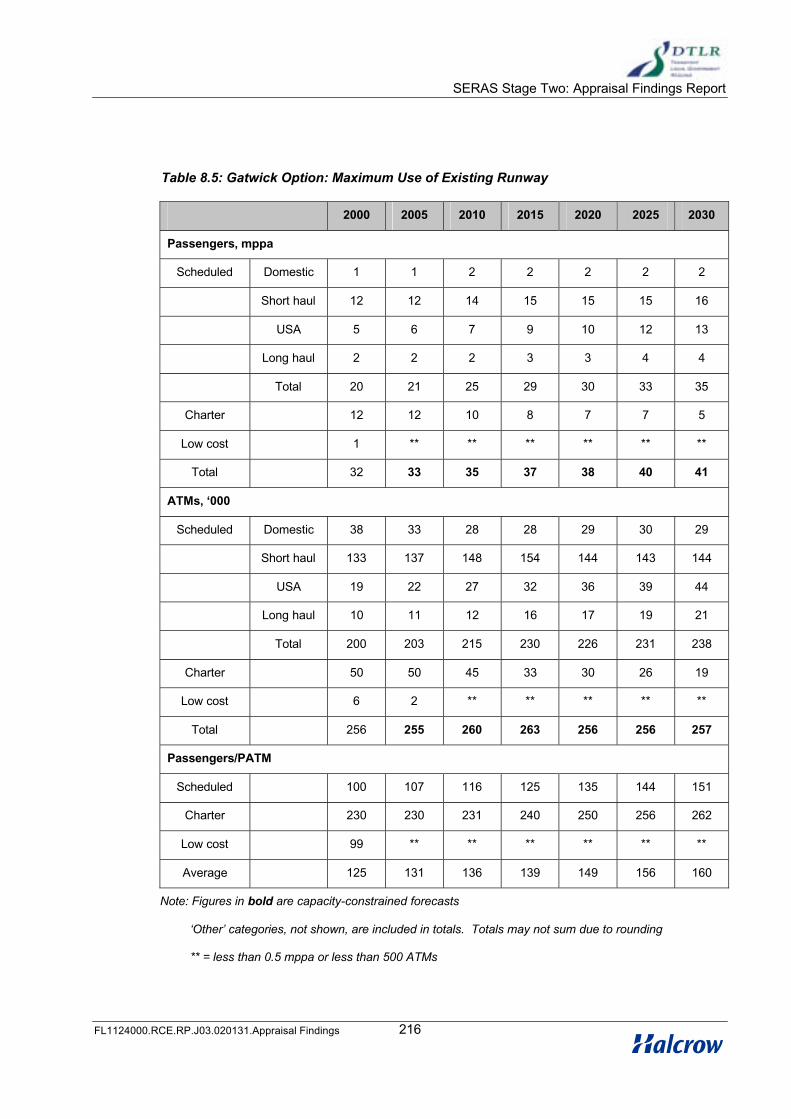
SERAS Stage Two: Appraisal Findings Report
FL1124000.RCE.RP.J03.020131.Appraisal Findings 216
Table 8.5: Gatwick Option: Maximum Use of Existing Runway
2000 2005 2010 2015 2020 2025 2030
Passengers, mppa
Scheduled Domestic 1 1 2 2 2 2 2
Short haul 12 12 14 15 15 15 16
USA 5 6 7 9 10 12 13
Long haul 2 2 2 3 3 4 4
Total 20 21 25 29 30 33 35
Charter 12 12 10 8 7 7 5
Low cost 1 ** ** ** ** ** **
Total 32 33 35 37 38 40 41
ATMs, ‘000
Scheduled Domestic 38 33 28 28 29 30 29
Short haul 133 137 148 154 144 143 144
USA 19 22 27 32 36 39 44
Long haul 10 11 12 16 17 19 21
Total 200 203 215 230 226 231 238
Charter 50 50 45 33 30 26 19
Low cost 6 2 ** ** ** ** **
Total 256 255 260 263 256 256 257
Passengers/PATM
Scheduled 100 107 116 125 135 144 151
Charter 230 230 231 240 250 256 262
Low cost 99 ** ** ** ** ** **
Average 125 131 136 139 149 156 160
Note: Figures in bold are capacity-constrained forecasts
‘Other’ categories, not shown, are included in totals. Totals may not sum due to rounding
** = less than 0.5 mppa or less than 500 ATMs
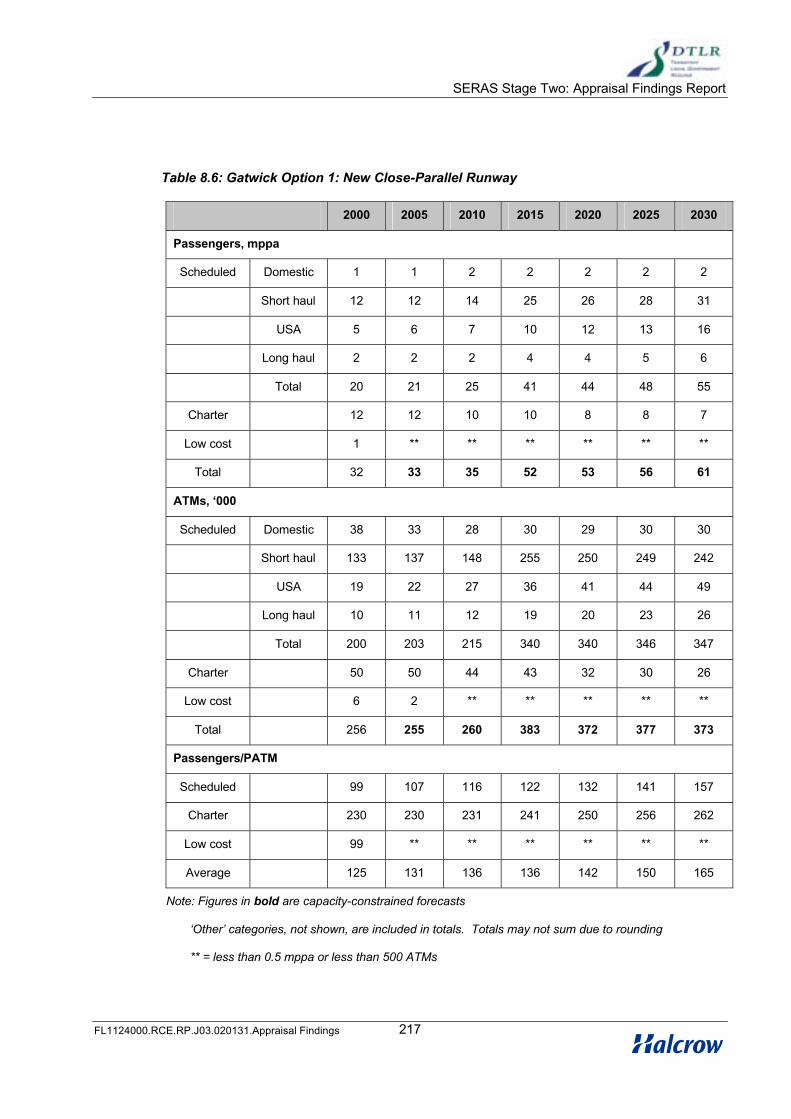
SERAS Stage Two: Appraisal Findings Report
FL1124000.RCE.RP.J03.020131.Appraisal Findings 217
Table 8.6: Gatwick Option 1: New Close-Parallel Runway
2000 2005 2010 2015 2020 2025 2030
Passengers, mppa
Scheduled Domestic 1 1 2 2 2 2 2
Short haul 12 12 14 25 26 28 31
USA 5 6 7 10 12 13 16
Long haul 2 2 2 4 4 5 6
Total 20 21 25 41 44 48 55
Charter 12 12 10 10 8 8 7
Low cost 1 ** ** ** ** ** **
Total 32 33 35 52 53 56 61
ATMs, ‘000
Scheduled Domestic 38 33 28 30 29 30 30
Short haul 133 137 148 255 250 249 242
USA 19 22 27 36 41 44 49
Long haul 10 11 12 19 20 23 26
Total 200 203 215 340 340 346 347
Charter 50 50 44 43 32 30 26
Low cost 6 2 ** ** ** ** **
Total 256 255 260 383 372 377 373
Passengers/PATM
Scheduled 99 107 116 122 132 141 157
Charter 230 230 231 241 250 256 262
Low cost 99 ** ** ** ** ** **
Average 125 131 136 136 142 150 165
Note: Figures in bold are capacity-constrained forecasts
‘Other’ categories, not shown, are included in totals. Totals may not sum due to rounding
** = less than 0.5 mppa or less than 500 ATMs

SERAS Stage Two: Appraisal Findings Report
FL1124000.RCE.RP.J03.020131.Appraisal Findings 218
Table 8.7: Gatwick Option E1: Two New Runways
2000 2005 2010 2015 2020 2025 2030
Passengers, mppa
Scheduled Domestic 1 1 2 2 2 3 3
Short haul 12 12 14 33 35 56 60
USA 5 6 7 11 13 17 19
Long haul 2 2 2 9 10 14 15
Total 20 21 25 55 60 90 97
Charter 12 12 10 12 10 14 13
Low cost 1 ** ** ** ** ** **
Total 32 33 35 68 69 104 109
ATMs, ‘000
Scheduled Domestic 38 33 28 41 30 45 36
Short haul 133 137 148 327 331 478 489
USA 19 22 27 39 43 54 57
Long haul 10 11 12 39 42 56 60
Total 200 203 215 446 446 633 642
Charter 50 50 45 50 38 53 47
Low cost 6 2 ** ** ** ** **
Total 256 255 260 496 483 686 688
Passengers/PATM
Scheduled 99 107 116 125 134 142 150
Charter 230 230 231 240 254 261 270
Low cost 199 78 ** ** ** ** **
Average 125 131 136 137 144 151 158
Note: Figures in bold are capacity-constrained forecasts
‘Other’ categories, not shown, are included in totals. Totals may not sum due to rounding
** = less than 0.5 mppa or less than 500 ATMs

SERAS Stage Two: Appraisal Findings Report
FL1124000.RCE.RP.J03.020131.Appraisal Findings 219
8.4 Safety Risk
8.4.1 The Stage Two assessment of safety risk appraises the third party risk associated with both
existing and new runway options. The full extent of the 1;10,000 and 1:100,000 designated risk
areas are shown on the following Figures. The runway end origins of the 1:1,000,000 contours
are also shown but extend beyond the limits of the drawings.
• Figure 8.6 – Maximum Use of Existing Runways
• Figure 8.7 – Option 1, New close dependent full length runway 385m south of the
existing
• Figure 8.8 – Option E1, Two new full length runways – one 2900m to the north of
the existing, staggered 2000m to the west, one 1035m to the south of the
existing, allowing independet operations on the three runways with the existing
runway in mixed mode
1:10,000 Risk Contour
8.4.2 The impacts of the 1:10,000 risk contours are shown in Table 8.8
Table 8.8: 1:10,000 Risk Contours
Impact Max Use 1 E1
Increase in Area (ha) above Max
Use (West and East)W 6.9E 6.6
W +3.2E +3.1
W +11.1E +10.6
Properties within contour
(outside airport boundary) above
Max Use
None None 3
% of developed area affected,
(outside airport boundary)0 0 0
8.4.3 The 1:10,000 contours for each option fall almost entirely within the airport boundary and
consequently have no impact on surrounding population, commercial areas or other prominent
features. The new runway in option E1 results in approximately three properties lying within the
1:10,000 risk contour, which would require relocating.
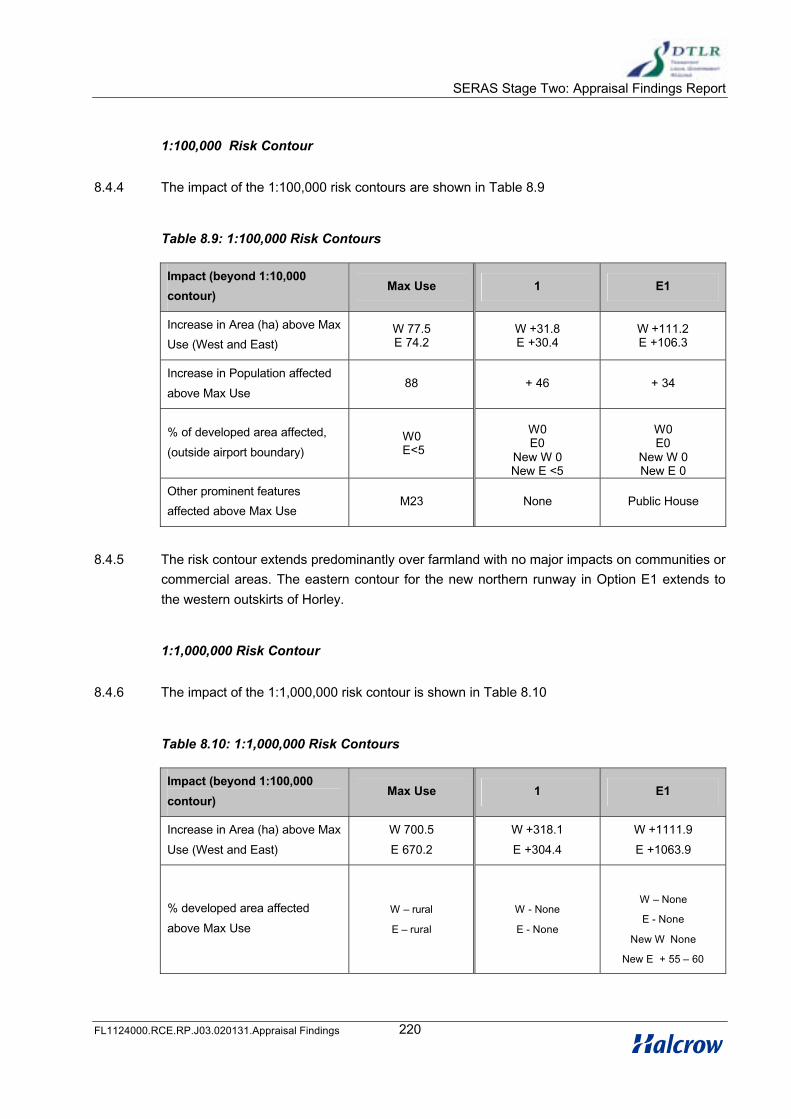
SERAS Stage Two: Appraisal Findings Report
FL1124000.RCE.RP.J03.020131.Appraisal Findings 220
1:100,000 Risk Contour
8.4.4 The impact of the 1:100,000 risk contours are shown in Table 8.9
Table 8.9: 1:100,000 Risk Contours
Impact (beyond 1:10,000
contour)Max Use 1 E1
Increase in Area (ha) above Max
Use (West and East)W 77.5E 74.2
W +31.8E +30.4
W +111.2 E +106.3
Increase in Population affected
above Max Use88 + 46 + 34
% of developed area affected,
(outside airport boundary)W0E<5
W0E0
New W 0New E <5
W0E0
New W 0New E 0
Other prominent features
affected above Max UseM23 None Public House
8.4.5 The risk contour extends predominantly over farmland with no major impacts on communities or
commercial areas. The eastern contour for the new northern runway in Option E1 extends to
the western outskirts of Horley.
1:1,000,000 Risk Contour
8.4.6 The impact of the 1:1,000,000 risk contour is shown in Table 8.10
Table 8.10: 1:1,000,000 Risk Contours
Impact (beyond 1:100,000
contour)Max Use 1 E1
Increase in Area (ha) above Max
Use (West and East)
W 700.5
E 670.2
W +318.1
E +304.4
W +1111.9
E +1063.9
% developed area affected
above Max Use
W – rural
E – rural
W - None
E - None
W – None
E - None
New W None
New E + 55 – 60

SERAS Stage Two: Appraisal Findings Report
FL1124000.RCE.RP.J03.020131.Appraisal Findings 221
8.4.7 Prominent features affected at Max Use:
• West – none
• East – M23, 1 church
8.4.8 Prominent features affected above Max Use:
• Option 1: West – None; East – A22, 1 church
• Option E1: West – A24; East – 1 school, A23
8.5 Surface Access
Infrastructure and service assumptions – roads
8.5.1 For the purposes of surface access demand forecasting, the changes to the existing road
access arrangements were based on the findings of Stage One appraisals. This helped define a
number of schemes associated with each option, as summarised in Table 8.11. No changes to
the Reference Case road access arrangements are assumed for the appraisal of options with
capacities limited to that incorporated in the Current Land Use Planning System and the
Maximum Use of the Existing Runway.
8.5.2 As shown in Figure 8.13, Option 1 would require only the closure of the local road between
Charlwood and Povey Cross, and the re-alignment (assumed at-grade) of the A23 near
Lowfield Heath. Option E1 (Figure 8.14) would require closure of Balcombe Road at Tinsley
Green and of the local road between Charlwood and Povey Cross; the A23 would need to be
put in tunnel beneath the new runway. In addition, Option E1 would require construction of an
airport access link to the new northern terminal.

SERAS Stage Two: Appraisal Findings Report
FL1124000.RCE.RP.J03.020131.Appraisal Findings 222
Table 8.11: Changes to road access – Gatwick Options
Scheme
Current Land
Use
Planning
System
Maximum
Use of
Existing
Runways
Option 1 Option E1
1 Road closure Povey Cross to
Charlwood! !
2 Road closure in Povey Cross !
3 New airport access road !
4 Widening of M23 Spur and Airport
Access Road!
5 A23 realignment at Lowfield Heath (in
tunnel in Option E1)! !
6 Closure of Balcombe Road, Tinsley
Green!
Infrastructure and service assumptions – rail
8.5.3 Additions to rail infrastructure and services were based on Stage One findings, and shaped by
discussions with DTLR and SRA in particular, on the potential to integrate airport-focused
schemes with parallel improvements in infrastructure and services planned to accommodate
future increases in non-airport demand.
8.5.4 As indicated in Figure 8.17, Gatwick is already served by an extensive network of rail services,
which will be further enhanced in the Base Case/Max Use Options by planned changes to
South Central, Thameslink and CrossCountry services. No further additions to the scale or
scope of rail services are assumed for Option 1.
8.5.5 To accommodate the extra services to London needed to meet demand in Option E1, additional
tracks are needed between Purley Oaks and Selhurst / Norwood Junction. These are assumed
to be in tunnel through this densely developed urban area.
8.5.6 Schemes and services associated with each Option are summarised in Table 8.12 and shown
in Figures 8.17 and 8.18.
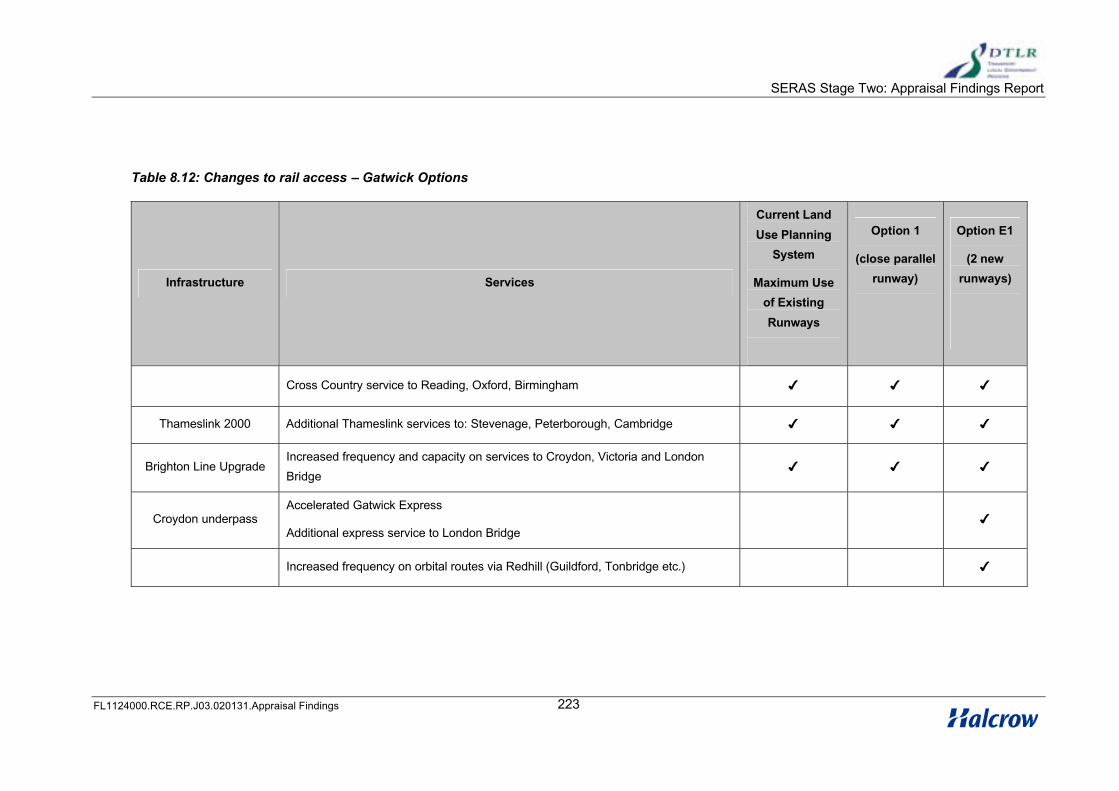
SERAS Stage Two: Appraisal Findings Report
FL1124000.RCE.RP.J03.020131.Appraisal Findings 223
Table 8.12: Changes to rail access – Gatwick Options
Infrastructure Services
Current Land
Use Planning
System
Maximum Use
of Existing
Runways
Option 1
(close parallel
runway)
Option E1
(2 new
runways)
Cross Country service to Reading, Oxford, Birmingham ! ! !
Thameslink 2000 Additional Thameslink services to: Stevenage, Peterborough, Cambridge ! ! !
Brighton Line UpgradeIncreased frequency and capacity on services to Croydon, Victoria and London
Bridge! ! !
Croydon underpassAccelerated Gatwick Express
Additional express service to London Bridge!
Increased frequency on orbital routes via Redhill (Guildford, Tonbridge etc.) !

SERAS Stage Two: Appraisal Findings Report
FL1124000.RCE.RP.J03.0120131.Appraisal Findings 224
Accessibility Analysis
8.5.7 The results of the catchment area analyses are summarised in the Appraisal Summary Tables
under the heading “Accessibility”, and presented in Figures 8.9 to 8.12. Public transport
catchments remain largely the same between the Maximum Use option and Options 1 and E1
(air passengers within one hour’s overall journey time increasing from 25 to 33 million pa, and
resident workforce increasing from 0.9 to 1.1 million), reflecting the limited improvements in rail
accessibility. Gatwick’s fair accessibility by road is reflected in its smaller catchments (around
22 million air passengers pa, and 1 million potential workers within one hour’s travel time).
Catchments by road are similar between options.
8.5.8 The accessibility of options to the air passenger market in Central London is of particular
interest and is summarised in Table 8.13. It should be noted that the public transport travel
times quoted in this table exclude walking access and egress, and waiting times – they
therefore indicate minimum travel times.
8.5.9 With the services assumed for the Maximum Use of Existing Runways, Gatwick has generally
good public transport accessibility – with Victoria and London Bridge within 30 mins and all
other main line stations within an hour’s travel time of the airport via interchange. Table 8.13
also illustrates the limited effect on accessibility of the new rail services added in Options E1.
Table 8.13: Accessibility from Central London – Gatwick options.
Current Land Use
Planning System
Maximum Use of
Existing Runways
Option 1- Close
ParallelOption E1
By Car, minutes
Cannon Street 100 As Max Use 105
Blackfriars 98 As Max Use 103
St Pancras/Kings Cross 103 As Max Use 108
Charing Cross 97 As Max Use 102
Victoria 94 As Max Use 99
Waterloo 93 As Max Use 98
London Bridge 96 As Max Use 101
By Public Transport, tph in minutes

SERAS Stage Two: Appraisal Findings Report
FL1124000.RCE.RP.J03.0120131.Appraisal Findings 225
Current Land Use
Planning System
Maximum Use of
Existing Runways
Option 1- Close
ParallelOption E1
Cannon Street 4 minutes from London Bridge
Blackfriars 6 tph in 37 As Max Use As Max Use
St Pancras/Kings Cross 6 tph in 43 As Max Use As Max Use
Charing Cross 8 minutes from London Bridge
Victoria 4 tph in 30
4 tph in 33As Max Use
4 tph in 25
4 tph in 33
Waterloo 5 minutes from London Bridge
London Bridge 10 tph in 29 As Max Use4 tph in 25
10 tph in 29
8.5.10 The main indicators of surface access demand in 2015 for each option at Gatwick are
summarised in Tables 8.14 and 8.15. Corresponding results for the forecast year 2030 are
presented in Tables 8.16 and 8.17.
8.5.11 Air passenger capacity and demand estimates have been described above. Note that both the
amount of spare capacity and the number of interlining passengers vary between option –
reflecting the interaction between Gatwick and other airports in the packages from which these
estimates were derived. In 2015, this results in the forecast number of passengers requiring
surface access being less in Package 2 than in Package 1, despite its higher capacity. By 2030
both Options 1 and E1 would be operating at capacity.
8.5.12 The forecast number of on-site employees in 2015 and 2030 is reported in Tables 8.14 and
8.16 and is assumed to be a function of overall passenger demand and productivity changes.
Note the small reduction (from 35,400 to 33,400) in on-site employees between 2015 and 2030
for Option 1, despite the increased passenger throughput. (For further details of employment
forecasts see section 8.10.)
8.5.13 In 2015, the number of peak hour employee-related car trips is forecast to remain roughly the
same with maximum use of the existing runway as with the layout currently envisaged in the
land use planning sytem, but to increase by about a third (from 1780 to 2370) with Option 1,
reflecting the increases in total employment and a small shift towards public transport.
Employee trips by public transport are forecast to increase by 40% (from 310 to 430) with
Option 1. By 2030, Table 8.16 shows that the number of car trips with Option 1 is expected to

SERAS Stage Two: Appraisal Findings Report
FL1124000.RCE.RP.J03.0120131.Appraisal Findings 226
remain around the same level as in 2015, while Option E1 is estimated to generate more than
double the number of employee-related car trips when compared with the Base Case (3,880 in
Option E1 in 2030, 1,780 in the Base Case in 2015).
8.5.14 Tables 8.15 and 8.17 summarise the air passenger mode split results for each option in 2015
and 2030 respectively. In 2015, Table 8.15 indicates a higher proportion of trips being made by
public transport with Option 1 (38.4%), compared to 35.1% for the Base Case. In both the
Maximum Use scenario and Option1, public transport is estimated to carry a larger share of air
passenger trips by 2030 than was the case in 2015. Option E1 achieves the highest share
(44.8%) of air passengers by public transport, but this increase results from the mix of
passenger types and UK trip-end locations forecast for this option, rather than any significant
change to the airport’s public transport accessibility.
8.5.15 Finally, it is worth noting the changes in overall peak hour road traffic demand generated by
these options, (see Table 8.15 and 8.17). Table 8.15 shows little difference between the current
land use system and maximum use of existing runway layouts in 2015, but a 20% higher figure
with Option 1. By 2030, the overall road traffic demand generated by Gatwick is estimated to
increase with maximum use of the runway by around 15% (from 6,200 in 2015 to 7,200 vehicles
per hour, 2-way in 2030). Road traffic with Options 1 and E1 is estimated to be 9,200 and
12,950 vehicles/hour, 2-way.
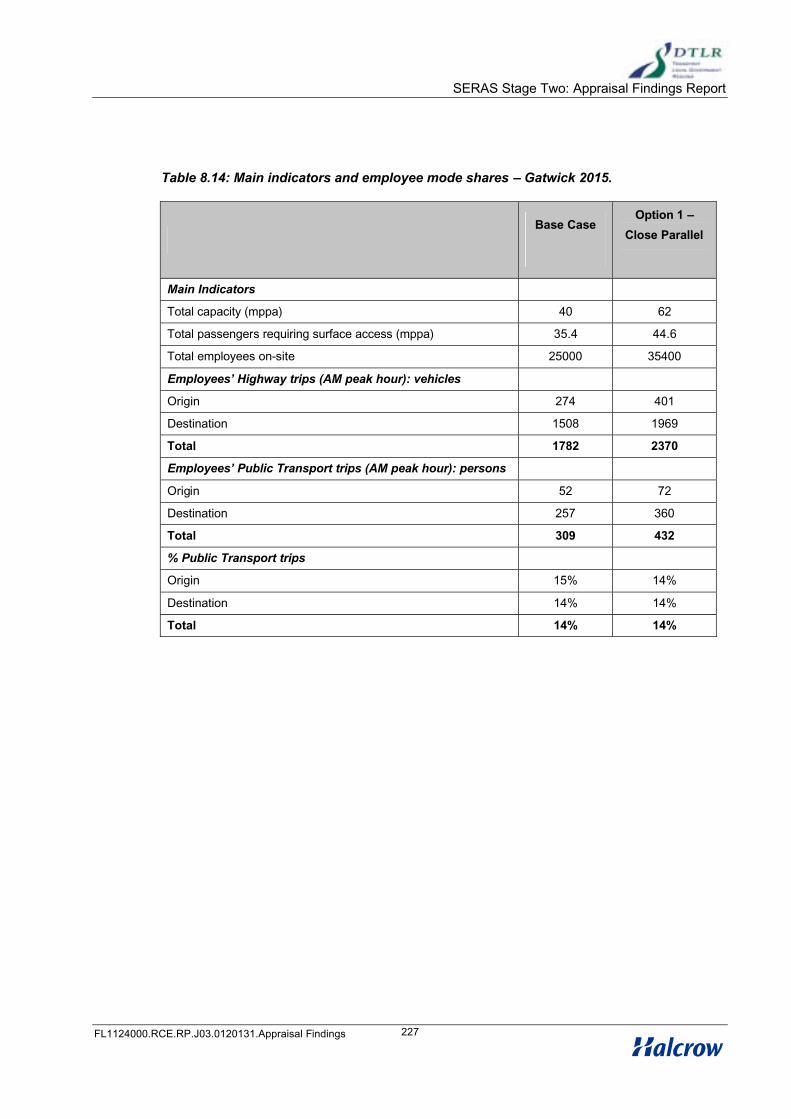
SERAS Stage Two: Appraisal Findings Report
FL1124000.RCE.RP.J03.0120131.Appraisal Findings 227
Table 8.14: Main indicators and employee mode shares – Gatwick 2015.
Base CaseOption 1 –
Close Parallel
Main Indicators
Total capacity (mppa) 40 62
Total passengers requiring surface access (mppa) 35.4 44.6
Total employees on-site 25000 35400
Employees’ Highway trips (AM peak hour): vehicles
Origin 274 401
Destination 1508 1969
Total 1782 2370
Employees’ Public Transport trips (AM peak hour): persons
Origin 52 72
Destination 257 360
Total 309 432
% Public Transport trips
Origin 15% 14%
Destination 14% 14%
Total 14% 14%

SERAS Stage Two: Appraisal Findings Report
FL1124000.RCE.RP.J03.020131.Appraisal Findings 228
Table 8.15: Air passenger mode choice and overall surface access demand – Gatwick 2015.
Mode Base Year Base Case Max Use Option 1 – Close Parallel
No.
mppa% No. % No. % No. %
Bus 3.12 14.8% 3.29 9.3% 2.92 9.1% 4.56 10.2%
Taxi 2.79 13.2% 4.60 13.0% 4.27 13.3% 5.64 12.7%
Park and fly 5.70 27.0% 10.30 29.1% 9.29 28.9% 12.32 27.6%
Kiss and fly 5.04 23.8% 8.11 22.9% 7.46 23.2% 9.50 21.3%
Premium rail 0.00 0.0% 0.00 0.0% 0.00 0.0% 0.00 0.0%
National rail 4.50 21.3% 9.14 25.8% 8.17 25.4% 12.57 28.2%
Total 21.15 100.0% 35.44 100.0% 32.11 100.0% 44.60 100.0%
Public 7.62 36.0% 12.39 35.1% 11.09 34.5% 17.14 38.4%
Private 13.53 64.0% 23.05 64.9% 21.03 65.5% 27.46 61.6%
Total peak hour demand (including employees, air passengers, freight and service traffice
Road (vehicles 2-way) 5,200 6,700 6,200 8,200
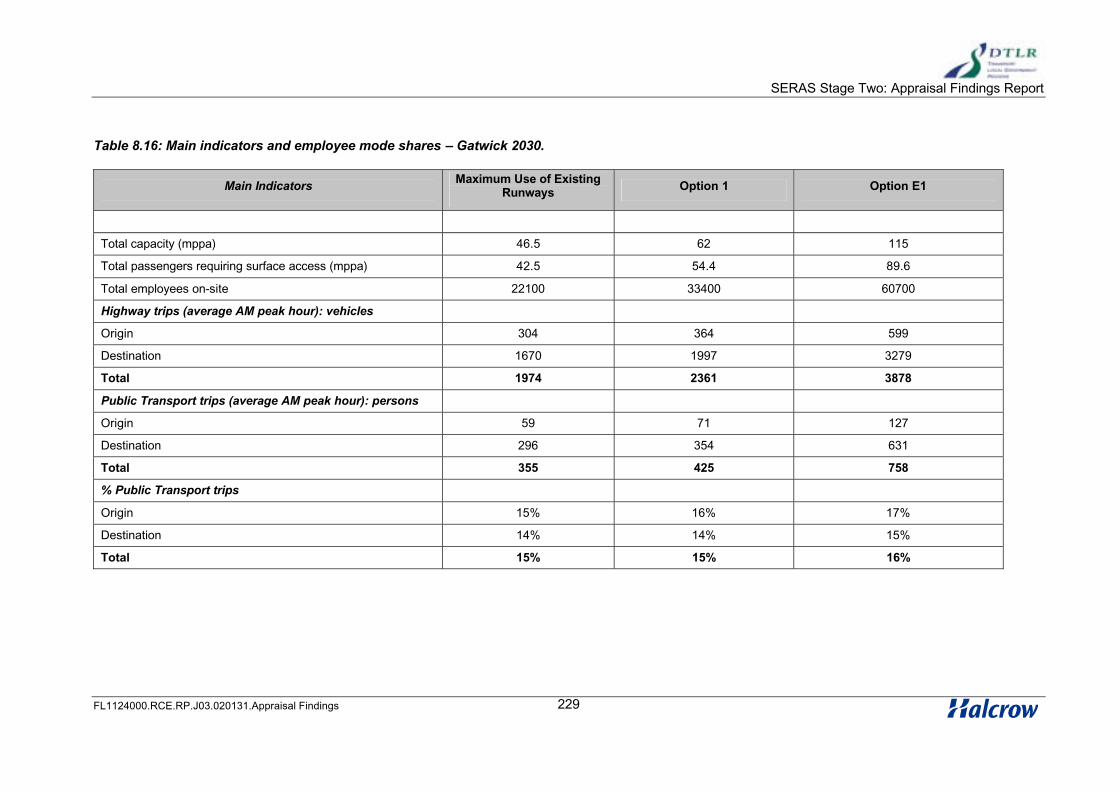
SERAS Stage Two: Appraisal Findings Report
FL1124000.RCE.RP.J03.020131.Appraisal Findings 229
Table 8.16: Main indicators and employee mode shares – Gatwick 2030.
Main Indicators Maximum Use of Existing Runways Option 1 Option E1
Total capacity (mppa) 46.5 62 115
Total passengers requiring surface access (mppa) 42.5 54.4 89.6
Total employees on-site 22100 33400 60700
Highway trips (average AM peak hour): vehicles
Origin 304 364 599
Destination 1670 1997 3279
Total 1974 2361 3878
Public Transport trips (average AM peak hour): persons
Origin 59 71 127
Destination 296 354 631
Total 355 425 758
% Public Transport trips
Origin 15% 16% 17%
Destination 14% 14% 15%
Total 15% 15% 16%

SERAS Stage Two: Appraisal Findings Report
FL1124000.RCE.RP.J03.020131.Appraisal Findings 230
Table 8.17: Air passenger mode choice and overall surface access demand – Gatwick 2030.
Mode Base YearMaximum Use of Existing
RunwaysOption 1 Option E1
No.
(mppa)%
No.
(mppa)%
No.
(mppa)%
No.
(mppa)%
Bus 3.12 14.8% 4.11 10.0% 5.53 10.4% 9.52 10.8%
Taxi 2.79 13.2% 5.40 13.1% 6.90 13.0% 10.88 12.3%
Park and fly 5.70 27.0% 10.98 26.7% 13.71 25.8% 21.28 24.1%
Kiss and fly 5.04 23.8% 8.81 21.4% 10.82 20.3% 16.53 18.7%
Premium rail 0.00 0.0% 0.00 0.0% 0.00 0.0% 0.00 0.0%
National rail 4.50 21.3% 11.87 28.8% 16.26 30.6% 30.04 34.0%
Total 21.15 100.0% 41.17 100.0% 53.21 100.0% 88.25 100.0%
Public 7.62 36.0% 15.99 38.8% 21.78 40.9% 30.56 44.8%
Private 13.53 64.0% 25.19 61.2% 31.43 59.1% 48.69 55.2%
Total peak hour demand including employee bs, air passengers, freight and service traffic.
Road (vehicles 2-way) 5,200 7,200 9,200 12,950

SERAS Stage Two: Appraisal Findings Report
FL1124000.RCE.RP.J03.020131.Appraisal Findings 231
Highway appraisal results - Gatwick
8.5.16 The highway appraisal has identified a number of sections of the Motorway and Strategic Road
Network that are expected to be under stress - close to or beyond their capacities - in the
SERAS forecast years. These ‘Background Highway Requirements’ are shown in Figure 7.20.
These problem links have been categorised into those where the potential solution required to
solve the problem in the Base Case would be adequate also to accommodate the airport option
under consideration, and those where an airport option would require a further intervention,
categorised here as an increase in capacity. By 2030, in the vicinity of Gatwick, the following
sections of the network would be under stress:
• M25: J2 to J16
• A23: south of Crawley
8.5.17 The additional potential scheme improvements required by the airport options are summarised
in Table 8.18 and illustrated in Figure 8.15 (for Option 1) and Figure 8.16 (for Option E1).

SERAS Stage Two: Appraisal Findings Report
FL1124000.RCE.RP.J03.020131.Appraisal Findings232
Table 8.18: Highway capacity problems and potential schemes - Gatwick
DescriptionInitial
Standard
Potential standard required by:
2015 2030
Current Land Use Planning
System(Package 1)
Max Use of Existing
Runways(Package 2)
Option 1(Package 6)
Max Use of Existing
Runways(Package 2)
Option 1(Package 6)
Option E1(Package 9)
Airport Access
Airport Access to New Terminal (proposed) n/a n/a n/a n/a n/a D4(M)
A23 Access to Gatwick
NorthD2 D2 D2 D3 D2 D3 D4(M)
M23 J9 to J9a D2(M) D2(M) D2(M) D3(M) D2(M) D3(M) D5 (M)
A23 Realignment D2 D2 D2 D2 D2 D2 D2 tunnel
Strategic Network
M23 J8 to J9 D3(M) D3(M) D3(M) D3(M) D3(M) D3(M) D4 (M)
M23 J9 to J10 D3(M) D3(M) D3(M) D3(M) D3(M) D3(M) D4 (M)
M23/A23 Junction Links junction improvement
A264: M23 to B2028 S2 S2 S2 S2 S2 S2 improved S2

SERAS Stage Two: Appraisal Findings Report
FL1124000.RCE.RP.J03.020131.Appraisal Findings 233
Rail Network Performance - Gatwick
8.5.18 Even with the increased capacity that Thameslink 2000 and the Brighton Main Line Upgrade
make possible, the rail lines between Gatwick and London are forecast to be close to capacity
in the peak by 2015. SERAS model runs predict that, given the improvement in accessibility
with Thameslink 2000 compared to the Base Year, the majority of air passenger trips between
the airport and central London will choose this route. This contributes to a peak hour load factor
of 132% of seats between East Croydon and London Bridge in the 2015 peak hour in the base
case, with 6% of the traffic being airport related. (The design capacity of the new Thameslink
and South Central trains will be around 140% of seating for sections where standing is
acceptable, which includes East Croydon-London Bridge. Nevertheless, such peak crowded
conditions would not be suitable for air passengers accompanied by heavy luggage.) Fewer
trips route via Victoria than now, and there is surplus capacity on Gatwick Express.
8.5.19 As noted, the shift of types of traffic between airports in Package 2 compared to the Base Case
means that there is less surface access demand at Gatwick with Maximum Use of the Existing
Runway. The peak load factor falls to 131%, of which just over 5% is airport related. However,
with Option 1 in 2015 the additional airport demand contributes to increased peak crowding on
Thameslink services, with a load factor of 134%, of which 7% is airport related.
8.5.20 Surface access demand rises further by 2030 – with no increase in rail network capacity, peak
load factors are 143% (7% airport traffic) for Max Use and 145% (above design capacity for
modern commuter rolling stock, 8% airport related) with option 1.
8.5.21 For Option E1 a Croydon underpass is assumed, allowing an increase in both capacity and
speed for airport expresses. Demand for the accelerated service to Victoria increases threefold,
but the majority of trips still go via London Bridge. The second airport express to London Bridge
achieves a peak load factor of 93%, diverting both air passengers and long distance commuters
from Thameslink, but the peak hour load factor between East Croydon and London Bridge is
still 136% (slightly below design capacity), with 10% of traffic on these commuter trains airport
related.
8.5.22 Further, substantial, infrastructure improvments at Redhill and between Purley and central
London, not included in the SERAS models or cost estimates, would be needed to increase
capacity and separate airport traffic from other passengers on this busy commuter corridor.

SERAS Stage Two: Appraisal Findings Report
FL1124000.RCE.RP.J03.020131.Appraisal Findings 234
8.6 Environment: Land Take
Context
8.6.1 The consideration of environmental issues in Stage Two of SERAS builds on work undertaken
in Stage One on land use, ecology, heritage, landscape and townscape, water, noise and air
quality. Stage Two in addition appraises impacts on contamination and community issues. For
each of these environmental topics a baseline is defined and then the results of the appraisal of
each option are presented. Details of existing land uses and environmental features within the
study area are provided in Figures 8.19 to 8.22. Summaries of the key impacts of each option
are presented in the Appraisal Summary Table. Fuller environmental appraisal details of the
baseline data and appraisal of options can be found in the supporting report.
Existing Conditions
Land Use – residential, commercial/industrial, public buildings, recreation, agriculture, planning constraints (Figure 8.19)
8.6.2 The Gatwick Airport Site is located approximately 40 km south of central London in the northern
part of West Sussex. It lies within Crawley Borough, close to the southern border of Mole
Valley with Reigate further north. The northern perimeter of the site is bounded by the town of
Horley and the villages of Povey Cross and Hookwood, beyond these are the towns of Reigate
and Redhill. To the south is the town of Crawley and various scattered properties and small
settlements.
8.6.3 There are several commercial/industrial areas in the immediate vicinity of the site including
warehouses, depots, a superstore, hotels, a caravan park, a sewage pumping station and a
sewage treatment works. There are also two hospitals (one of which may be disused) and a
place of worship close to the southern perimeter. There is a playing field also nearby and the
Sussex Border Path runs to the east and west of the current site and round its northern
perimeter.
8.6.4 Agriculture is the main land use in the study area with land to the north and north west
predominantly of Grade 4 quality with some Grade 3; land to the south is a mixture of Grade 3
and 4. To the east the land is predominantly Grade 3. There are also three nurseries located at
Fernhill to the east of the airport.
8.6.5 The airport is almost entirely surrounded by areas of Green Belt, Strategic Gap and Countryside
Areas of Development Restraint within which there are restrictions on development.

SERAS Stage Two: Appraisal Findings Report
FL1124000.RCE.RP.J03.020131.Appraisal Findings 235
Contamination (Figure 8.19)
8.6.6 There are 43 areas identified, which are potential sources of contamination. Of these there are
seven sites which pose moderate or moderate/minor potential for contamination. These sites
include a petrol station, farm sludge pit, trading estate, former works/depot, sewage works,
scrap yard and the site of a major chemical spillage.
Ecology (Figure 8.20)
8.6.7 The following sites of nature conservation value within the Area of Search are all priority
habitats in the Sussex and/or the Surrey Local Biodiversity Action Plan. There are no
internationally designated sites of very high ecological value within the immediate vicinity of the
site. There are, however, three nationally designated sites (of high ecological value):
8.6.8 Glovers Wood Site of Special Scientific Interest (SSSI) is almost entirely semi-natural
broadleaved woodland with a calcareous gill that supports a very rich ground flora. Small-
leaved lime and wych elm are present (rare in the Weald) and the site also provides habitat for
some rare craneflies.
8.6.9 Hedgecourt Lake SSSI consists of a range of habitats, including woodland, grassland, and fen-
marginated open water. The site supports a wide variety of animal life including several locally
distributed beetles and a large breeding bird colony.
8.6.10 Clockhouse Brickworks is a SSSI designated for its geological interest.
8.6.11 There are 7 county designated Sites of Nature Conservation Interest (SINCs) or potential
SINCs (of medium value) within the area of search, including the following:
• Ricketts Wood ancient semi-natural woodland.
• Three contiguous sites of ancient semi-natural woodland (Pockmires Wood, Rider
Gill and Beggars Gill)
• Edolphs Copse supporting a mixture of ancient semi-naturalwoodland, secondary woodland and meadows.
• Withy Gill is wetland habitat with areas of wet meadowland,reedbed and open water.
• A wooded bank alongside the River Mole at Lee Street Sewage Treatment
Works.

SERAS Stage Two: Appraisal Findings Report
FL1124000.RCE.RP.J03.020131.Appraisal Findings 236
8.6.12 There are also a selection of sites considered to be of low ecological value in the vicinity of the
airport which include:
• Eight ancient woodlands (although of low value there is no potential for
substitution)
• Two district designated Areas of High Ecological Value (although classified of low ecological value for the purposes of this appraisal) comprised of woodland/ scrub and grassland
• Seven areas of woodland and scrub,
• Hedgerows border many of the arable fields (approximately 4km of hedgerowsare located within the maximum option boundary) and some of these may beancient or species-rich (hedgerows are not illustrated on the constraints map).These hedgerows provide wildlife corridors between habitats, particularlywoodland (see above) and copses (see below).
• Approximately five small copses. Together with the hedgerows, these areasprovide links to adjacent woodlands. Some of these copses may be remnants of ancient woodland, in which case there is no potential for substitution.
8.6.13 The following undesignated sites of low ecological value are located within the current airport
perimeter, mainly in the north west of the site:
• Brockley Wood, an ash/ oak ancient woodland.
• Twenty hedgerows some of which may be ancient and/or species-rich
• Grassland areas which provide undisturbed areas for nesting skylarks
• Three balancing ponds supporting marginal species such as goat willow,
common reed, soft-rush, hard rush, and bulrush.
• The diverted River Mole.
• A small area of woodland/scrub.
Heritage (Figure 8.21)
8.6.14 Archaeology - The Base Case airport site contains five known archaeological sites. Two of
these have been designated as Archaeologically Sensitive areas in the Crawley Local Plan. The
areas of proposed expansion contain an additional eight sites. The wider study area (500m
around the maximum option boundary) contains a further 19 archaeological sites, of which 3 are
Scheduled Ancient Monuments (national value).
SERAS Stage Two: Appraisal Findings Report
FL1124000.RCE.RP.J03.020131.Appraisal Findings 237
8.6.15 Although the area covered by the Base Case airport and its proposed expansion contains a
relatively low level of known archaeological sites, as defined by the National Monuments
Record, this would appear likely to be a product of the relatively low level of archaeological
investigation in the area in the past and the site is nevertheless likely to have a high potential to
contain hitherto undetected sites. The nature of the archaeology within the Airport site and its
environs is discussed below.
• Prehistoric Period (500,000 - 43BC) - Evidence of prehistoric settlement within
the study area is demonstrated by a number of findspots spread throughout that
area
• Roman settlement (43AD - 410AD) - The study area contains a low level of
demonstrated Roman activity.
• Medieval - This period is well represented across the study area. Sites include
eight moated settlements which also contain Listed Buildings (all of which are
Grade II*).
• Post Medieval - This period is also very highly represented with a range of sites
and findspots within the study area.
8.6.16 In the absence of contextual information regarding the above archaeological sites, all those
other than Scheduled Ancient Monuments, which are of national value, and Archaeologically
Sensitive Areas, which are considered to be of regional value, have for the purposes of this
study been considered to be of county/district value, except for those identified as of potential
higher or lower value in the Appraisal sections below.
8.6.17 Listed Buildings - The study area contains 76 Listed Buildings, including 9 Grade I/II*. Of these
two Grade II Listed Buildings (Edgeworth House and Wing House) are within the Base Case
airport boundary. In the 500m corridor surrounding the areas of proposed expansion there are
an additional 47 Grade II Listed Buildings and 3 Grade I/II* Listed Buildings.
8.6.18 Conservation Areas - The areas of proposed expansion impinges upon one Conservation Area
(Charlwood Village) to the west. The wider study area (500 m) contains two additional
Conservation Areas (Ifield and Horley) while Burstow Conservation Area lies just beyond the
500m boundary.
8.6.19 Historic Parks and Gardens - There are no historic parks or gardens within the Base Case
airport boundary, the proposed areas of expansion or the 500m study corridor surrounding
these areas.

SERAS Stage Two: Appraisal Findings Report
FL1124000.RCE.RP.J03.020131.Appraisal Findings 238
Landscape and Visual (Figure 8.22)
8.6.20 Landscape/Townscape - The landscape in the vicinity of Gatwick is generally low-lying with high
levels of woodland, hedgerows and mature hedgerow trees that are typical of the Weald and
which considerably limit intervisibility between different areas. Similarly, the Surrey Hills AONB
(located a little over 5km to the north west of the site) is also well wooded and most views
towards the site will be screened by the low ridge of hills to the north west of Charlwood village.
Five areas of distinct landscape and townscape character have been identified within 5 km of
the proposed development.
• Mole Catchment Towns and Urban Fringe contains the built-up areas of Crawley
and Horley as well as the major north-to-south transport corridor formed by the
railway, M23, A23 and A217. The value of this landscape has been assessed as
low.
• Wooded Low Weald is an intimate and attractive landscape character area with
undulating topography, sinuous woodlands and historic houses and villages that
are distinctive to the region. The value of this landscape has been assessed as
medium. The historic village and Conservation Area at Charlwood straddles the
boundary of the Mole Catchment and Wooded Low Weald character areas.
• Open Low Weald is more open in character than the Wooded Low Weald, with
the exception of glimpsed views from hilltops such as at Outwood. The Open
Low Weald contains a designated Area of Local Landscape and a Conservation
Area at Burstow. The value of this landscape has also been assessed as
medium.
• High Weald AONB lies to the south-east of the town of Crawley. Although its
importance and sensitivity is enhanced by a national designation and the
presence of an Historic Garden (its value is assessed as high), the north-western
fringe of the High Weald is heavily forested and this protects the landscape from
the effects of development in the Mole Catchment below.
• High Weald Northern Fringe lies outside of the AONB boundary and is heavily
settled. It also is visually contained by high levels of vegetation. The area
contains two Areas of Special Environmental Quality. The value of this
landscape has been assessed as medium.
8.6.21 Visual - The extent of the indicative zone of potential visual impact (ZVI) of the maximum extent of Airport Options boundaries is limited by the heavily wooded and well-treed character of the
surrounding landscape character areas. The flat topography and extensive tree planting
associated with major roads and railways means that there are few views of the airport from the
SERAS Stage Two: Appraisal Findings Report
FL1124000.RCE.RP.J03.020131.Appraisal Findings 239
low lying urban areas of Horley and Crawley. The ZVI therefore remains very close to the
airport boundaries on the southern and eastern sides of the site.
8.6.22 Key visual receptors in the area include homes facing down into the Mole Catchment from the
ridges at Norwood Hill and Russ Hill and the eastern fringes of the village of Charlwood. The
fringes of Horley and Crawley lie very close to the airport site, but in the case of Crawley, much
of this area is commercial (at Manor Royal) rather than residential. The network of lanes to the
west of the airport fall within the ZVI but there are few footpaths that are likely to be used by
visitors for recreational purposes.
Community
8.6.23 The area of proposed land take includes parts of six wards: Charlwood, Langley Green,
Northgate, Horley East, Pound Hill North and Rusper.
8.6.24 Community Infrastructure - There are three tiers of settlement in the vicinity of Gatwick Airport.
The urban areas of Horley and Crawley lie to the north and south respectively. The second tier
comprises nucleated villages such as Charlwood to the west. The lowest tier comprises
hamlets such as Tinsley Green, Fernhill, Povey Cross and Hookwood, together with scattered
farmsteads and other properties.
8.6.25 The IMD ranking of the 12 baseline wards ranges from Langley Green (2,641) to Pound Hill
North (7,865). This represents a range of 3,224 places, or about 38% of the national spectrum.
The national IMD ranking of wards runs from 1 (most deprived) to 8,414 (least deprived). The
three most deprived local wards, falling below the median rank of 4,207, are Langley Green,
Northgate and Ifield. These wards lie within the built-up area of Crawley and its northern fringe,
located immediately to the south of the airport boundary.
8.6.26 Community Structure/Distinctiveness – Work undertaken in Stage One of SERAS concludes
that the long-term housing capacity of the Core Catchment Area (the districts of Reigate &
Banstead, Crawley and Mid Sussex) is 4,700 dwellings within the Local Plan period. This
assumed that such an increase could be accommodated by intensification of existing built-up
areas, development of brownfield sites, a degree of urban fringe expansion and new “village”
settlements.
8.6.27 The 1999 noise contour map indicates that intrusive levels of aircraft noise are likely to be
experienced mainly by communities within the following wards: Rural South, Rusper,
Charlwood, Langley Green, Northgate, Pound Hill North, Burstow and Horne, Felbridge and
Horley East.
8.6.28 Employment - At 3%, unemployment levels within the Core Catchment Area are comfortably
below the national average.

SERAS Stage Two: Appraisal Findings Report
FL1124000.RCE.RP.J03.020131.Appraisal Findings 240
High Adverse Impacts: – Option 1
8.6.29 The loss of two nurseries from Fernhill to the east of the current airport boundary would result in
LA effects. There would be a loss of 266 ha of agricultural land to the south, west and east.
Approximately 50% of this land is Grade 4 agricultural land quality and 50% is Grade 3.
Consequently, approximately 133 ha of BMV land would be lost due to Option 1, resulting in HA
effects.
8.6.30 The cumulative effects on Heritage resources is considered to be HA largely as a result of the
loss of 3 Grade II* and 4 Grade II listed buildings, and the potential for loss of undetected sites
from an area of 301ha of land take. Although mitigation through prior excavation could reduce
effects on archaeological resources, the cumulative effects would remain HA owing to the loss
of the listed buildings.
High Adverse Impacts – Option E1
8.6.31 The loss of three nurseries from Fernhill would result in LA effects. 863ha of agricultural land
would be lost due to Option E1. Approximately 70% of the land lost is of Grade 4 agricultural
land quality and the remaining 30% is Grade 3. Consequently, approximately 259 ha of BMV
land would be lost, resulting in HA effects.
8.6.32 There would be an extensive loss of Green Belt, (533 ha) in addition to 393 ha of district-
designated Strategic Gap, resulting in HA effects.
8.6.33 The cumulative effects on Heritage resources is considered to be HA largely as a result of the
loss of 6 Grade II* and 18 Grade II listed buildings, the loss of a small portion of the
Conservation Area at Charlwood Village and the potential for loss of undetected sites from an
area of 1065ha of landtake. Although mitigation through prior excavation could reduce effects
on archaeological resources, the cumulative effects would remain HA owing to the loss of the
listed buildings.
8.6.34 The cumulative effect on the local community would be HA. Relatively more deprived
communities to the south of the existing airport would be subject to additional impacts. Less
deprived communities to the north of the airport would also be brought into the zone of impact,
including severe landtake impacts within Charlwood ward.
8.6.35 The works would result in a large increase in the airport land area and will be extensive. In
addition the proximity of the works to residential properties in Horley, Charlwood, the northern
edge of Langley Green as well as Glovers Wood SSSI, means that construction effects are
potentially of HA significance.
SERAS Stage Two: Appraisal Findings Report
FL1124000.RCE.RP.J03.020131.Appraisal Findings 241
8.7 Environment: Water
Existing Conditions
8.7.1 Gatwick Airport is situated within the Upper Mole surface water catchment. Within the study
area there are numerous streams, which join the River Mole to flow northwards through the
catchment (Figure 8.23). In addition to seven ponds around the airport that receive surface
drainage, three watercourses; River Mole, Crawters Brook and Gatwick Stream, also receive
direct drainage from the airport.
8.7.2 The water quality is monitored in the River Mole, Gatwick Stream and Burstow Brook. The
quality of these rivers appears to deteriorate as a result of discharges from three sewage
treatment works. Additionally, the River Mole appears to be affected by discharges from the
airport, as there is a slight deterioration in quality immediately downstream of the runway.
8.7.3 The River Mole is a fairly ‘flashy’ river, due to the impermeable nature of the catchment. The
development of Gatwick Airport has had a marked effect on flooding from the Mole after heavy
rain, as the runoff is significantly faster.
8.7.4 The catchment is largely comprised of Weald Clay, which is a non-aquifer. There are small
areas of minor aquifer that would support only small, probably private abstractions. There are
no public water supplies (surface water or groundwater) or other licensed abstractions within
the study area.
8.7.5 From a regional perspective, the available water resources are virtually fully committed.
However this varies between water companies and resource zones across the region. The
supply/demand balance for the resource zone that supplies Gatwick Airport is currently
adequate. Using the total water consumption per passenger for BAA Airports, Gatwick Airport
currently uses approximately 3% of the licensed resources in the resource zone.
Impact of options
8.7.6 The options have been assessed against a base case, which is the current land use planning
system, and therefore only consider impacts that are additional to those assessed under the
base case. The assessments consider the sensitivity of the water environment and the
potential to cause harm, which includes scope for mitigation. Table 8.19 and the Appraisal
Summary Table summarise the assessment for each of the water objectives, for each of the
options.
8.7.7 Most of the options for Gatwick Airport present a potential impact of low or medium adverse, as
many of them may be mitigated.

SERAS Stage Two: Appraisal Findings Report
FL1124000.RCE.RP.J03.020131.Appraisal Findings 242
8.7.8 Water quality impacts may be mitigated using water treatment techniques such as reed beds
and balancing ponds. Flooding impacts may be mitigated using balancing ponds, to attenuate
runoff and take out the peak flow. The effectiveness of these measures is dependent upon
adequate sizing of ponds, and the use of appropriate treatment techniques.
8.7.9 Both Option 1 and Option E1 require engineering works to several rivers. This would involve
either culverting or diverting the river; the Environment Agency are generally opposed to
culverting, and such works are seen as a significant impact. Due to their potential to cause
harm these are considered High Adverse. Further diversion of the River Mole would be
undesirable as 1.5 km have only recently been diverted.
8.7.10 Large increases in passenger numbers significantly increase the airport’s demand for water,
and also within the surrounding residential areas that provide the human resource base for the
airport. Without any further water resource development or effort to manage demand, the area
would have a deficit. However, assuming that water companies maximise existing strategic
links and their use of existing and planned licensed resources between resource zones, the
resource zone that supplies Gatwick Airport would have a slight surplus. This also assumes
that companies will achieve their leakage reduction targets.
8.7.11 The water companies may not have planned for such extensive growth of the Airport. However,
assuming appropriate supply and demand management techniques are put into place, and the
Airport and other water users within the region are water efficient, by carrying out good
housekeeping and management with respect to water, and using water saving technology, it
should be possible to meet the demand.
Table 8.19: Appraisal Summary Table for the Water Environment
OptionBase Case Maximum Use of
Existing Runway
Option 1 Option E1
Surface
Water
3 rivers receive
airport drainage;
one shows a
decrease in water
quality.
Medium Adverse
No additional
impacts as
compared to the
base case.
Low Adverse
3 rivers would need
to be either
culverted or
diverted. Potential
water quality
impacts could be
mitigated.
Medium Adverse
4 rivers would need
to be either
culverted or
diverted. Potential
water quality
impacts could be
mitigated.
Medium Adverse
Groundwater Study area largely
non-aquifer, with no
licensed
No additional
impacts as
compared to the
No additional
impacts as
compared to the
No additional
impacts as
compared to the

SERAS Stage Two: Appraisal Findings Report
FL1124000.RCE.RP.J03.020131.Appraisal Findings 243
OptionBase Case Maximum Use of
Existing Runway
Option 1 Option E1
abstractions.
Low Adverse
base case.
Low Adverse
base case.
Low Adverse
base case.
Low Adverse
Flooding The airport has had
a marked increase
on flooding.
High Adverse
No additional
impacts as
compared to the
base case.
Low Adverse
Increased flood risk
could be mitigated
using balancing
pond.
Low Adverse
Large increase in
flood risk could be
mitigated using
balancing pond(s).
Low Adverse
Water
Resources
No significant
change to present
levels of demand.
Low Adverse
No significant
change to present
levels of demand.
Low Adverse
Significant increase
in water demand.
Demand may be
met through supply
and demand
management, and
water saving
technology.
Low Adverse
Significant increase
in water demand.
Demand may be
met through supply
and demand
management, and
water saving
technology.
Medium Adverse
8.8 Environment: Noise Impacts
Aircraft Noise: Daytime
8.8.1 The Gatwick noise contours for 2000 and each of the Options in 2015 or 2030 as appropriate
are shown on Figures 8.24 to 8.43. Tables 8.20 to 8.23 give the areas and estimated
populations under the daytime LAeq,16h noise contours for each of these scenarios. Gatwick
Airport currently exposes the second largest number of people to aircraft noise of the existing
airports in the study. A population of 8,600 lies within the 2000 57 dB contour, although this has
reduced from 14,600 in 1994. This change should be taken as approximate as the 1994 and
2000 population estimates are based on different census years. This reduction in noise
exposure is despite the steady growth in air traffic over this period. The Gatwick contours have
become longer (extended to the east and west) but narrower over time. A small decrease in
contour area has corresponded to a near halving in the population under the 57 dB contour as
the contours have receded from the populated areas of Horley and Crawley. The explanation

SERAS Stage Two: Appraisal Findings Report
FL1124000.RCE.RP.J03.020131.Appraisal Findings 244
for the general reduction in noise contour area is the introduction of quieter aircraft types over
this period, as discussed in relation to Heathrow.
Options in 2015
8.8.2 The current Land Use Planning system is the Base Case for 2015. Under this scenario the
population under the 57 dB contour will reduce to 5,900 with the planned development in place,
this is a 31% reduction compared with 2000. The reduction is again due to the aircraft fleet
becoming quieter, with the phase out of older aircraft and the introduction of quieter models,
and other noise limitation policies.
8.8.3 Comparing the Maximum Use Option with the Base, the population under the noise contours
only increases very marginally. Option 1 adds a new close parallel runway to the south of the
existing runway. This results in increases in contour area of around 30% over the Base which
produces an increase in the population within the 57 dB contour of 3,200, to 9,100. The area in
the 69 dB contour increases by 3.1 sq km, although the population only increases by around
100 due to the low population density of the newly affected area.
8.8.4 Comparing the 2015 Options with the area under the 57 dB contour in 1994, it can be seen that
the Base Case and Max Use Option remain within this value while Option 1 marginally exceeds
the 1994 area.
Options in 2030
8.8.5 The Maximum Use Option is the Base Case for 2030. The population under the 57 dB contour
with this option in 2030 would be 54% higher than in 2015 at 9,400. However, this figure only
represents an increase of 800 or 9% over the existing population under the 57 dB contour.
Table 8.20: Gatwick Daytime Aircraft Noise Contours – 2015 vs 2000 Existing Situation
Area (sq km)
Land Use Planning Max Use Option 1
Total Change Total Change Total Change
LAeq
(dB)1994
Existing
20002015 cw 2000 2015 Cw 2000 2015 cw 2000
>54 N/a 118.1 108 -10.1 111.8 -6.3 147.2 29.1
>57 83 71.8 63.7 -8.1 64.8 -7 83.4 11.6
>60 1 43.6 37.8 -5.8 38.4 -5.2 49.2 5.6
>63 1 26.5 22 -4.5 22.6 -3.9 29.3 2.8
>66 1 15.8 12.6 -3.2 13 -2.8 17.5 1.7
>69 1 9 7 -2 7.2 -1.8 10.1 1.1
>72 1 4.9 3.7 -1.2 3.9 -1 5.8 0.9

SERAS Stage Two: Appraisal Findings Report
FL1124000.RCE.RP.J03.020131.Appraisal Findings 245
Area (sq km)
Land Use Planning Max Use Option 1
Total Change Total Change Total Change
LAeq
(dB)1994
Existing
20002015 cw 2000 2015 Cw 2000 2015 cw 2000
Population (000s)
Land Use Planning Max Use Option 1
Total Change Total Change Total Change
LAeq
(dB) 1994 Existing
20002015 cw 2000 2015 Cw 2000 2015 cw 2000
>54 N/a 20.7 14.1 -6.6 15.7 -5 24.2 3.5
>57 14.6 8.6 5.9 -2.7 6.1 -2.5 9.1 0.5
>60 1 3.1 2 -1.1 2.1 -1 3.3 0.2
>63 1 1.4 1.1 -0.3 1.1 -0.3 1.4 0
>66 1 0.5 0.3 -0.2 0.3 -0.2 0.5 0
>69 1 0.2 0.2 0 0.2 0 0.3 0.1
>72 1 0.1 0.1 0 0.1 0 0.1 0
Table 8.21 Gatwick Daytime Aircraft Noise Contours – 2015 vs 2015 Base Case
Area (sq km)
Land Use Planning Max Use Option 1
2015 Total Change Total Change
LAeq
(dB)
Base Case 2015 cw Base 2015 cw Base
>54 108 111.8 3.8 147.2 39.2
>57 63.7 64.8 1.1 83.4 19.7
>60 37.8 38.4 0.6 49.2 11.4
>63 22 22.6 0.6 29.3 7.3
>66 12.6 13 0.4 17.5 4.9
>69 7 7.2 0.2 10.1 3.1
>72 3.7 3.9 0.2 5.8 2.1
Population (000s)
Land Use Planning Max Use Option 1
2015 Total Change Total Change
LAeq
(dB)
Base Case 2015 cw Base 2015 cw Base
>54 14.1 15.7 1.6 24.2 10.1
>57 5.9 6.1 0.2 9.1 3.2
>60 2 2.1 0.1 3.3 1.3
>63 1.1 1.1 0 1.4 0.3
>66 0.3 0.3 0 0.5 0.2
>69 0.2 0.2 0 0.3 0.1
>72 0.1 0.1 0 0.1 0

SERAS Stage Two: Appraisal Findings Report
FL1124000.RCE.RP.J03.020131.Appraisal Findings 246
Table 8.22: Gatwick Daytime Aircraft Noise Contours – 2030 vs 2000 Existing Situation
Area (sq km)
Max Use Option 1 Option E1
Total Change Total Change Total Change
LAeq
(dB)
Existing
20002030 cw 2000 2030 cw 2000 2030 cw 2000
>54 118.1 142.3 24.2 225.2 107.1 418.7 300.6
>57 71.8 79.5 7.7 118.5 46.7 238.4 166.6
>60 43.6 46.3 2.7 66.8 23.2 142.6 99
>63 26.5 27.3 0.8 39.2 12.7 84 57.5
>66 15.8 16 0.2 23.5 7.7 50.7 34.9
>69 9 9 0 13.9 4.9 30.3 21.3
>72 4.9 4.9 0 8 3.1 16.5 11.6
Population (000s)
Max Use Option 1 Option E1
Total Change Total Change Total Change
LAeq
(dB)
Existing
20002030 cw 2000 2030 cw 2000 2030 cw 2000
>54 20.7 22.9 2.2 38.6 17.9 114.7 94
>57 8.6 9.4 0.8 16.7 8.1 43.8 35.2
>60 3.1 2.9 -0.2 5.6 2.5 22.5 19.4
>63 1.4 1.3 -0.1 2 0.6 7.9 6.5
>66 0.5 0.5 0 1 0.5 3.4 2.9
>69 0.2 0.3 0.1 0.5 0.3 1.3 1.1
>72 0.1 0.1 0 0.2 0.1 0.5 0.4
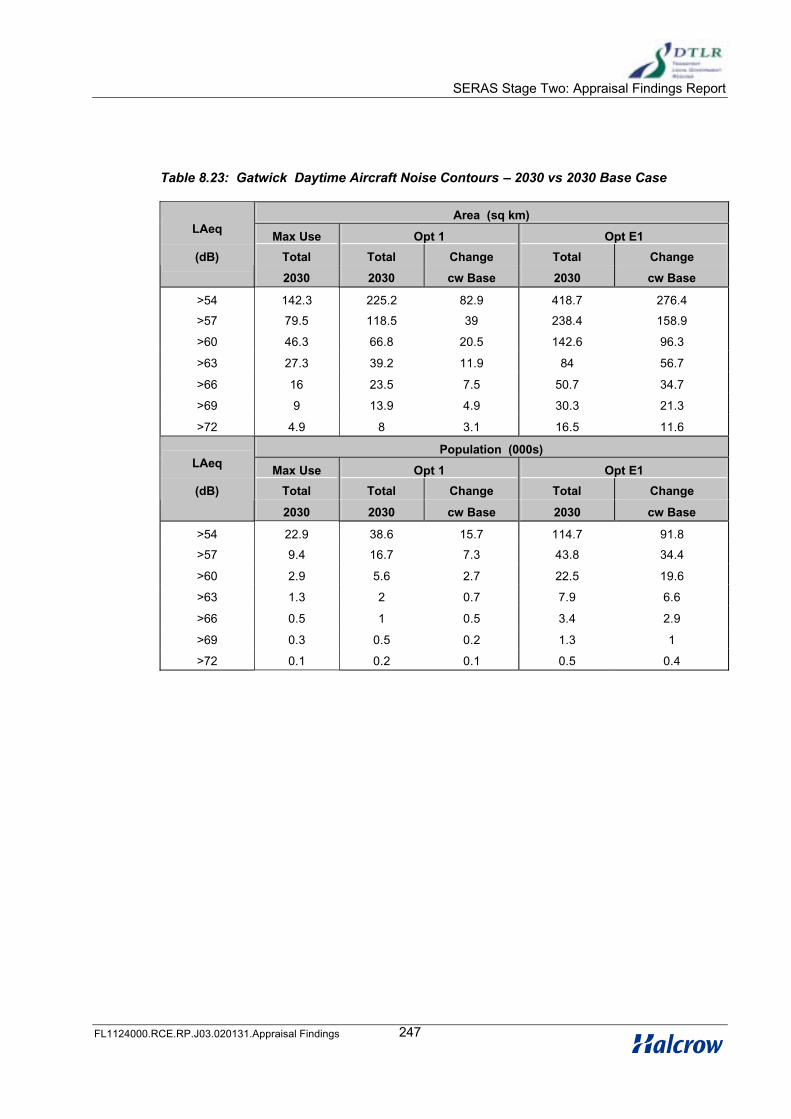
SERAS Stage Two: Appraisal Findings Report
FL1124000.RCE.RP.J03.020131.Appraisal Findings 247
Table 8.23: Gatwick Daytime Aircraft Noise Contours – 2030 vs 2030 Base Case
Area (sq km)
Max Use Opt 1 Opt E1
Total Total Change Total Change
LAeq
(dB)
2030 2030 cw Base 2030 cw Base
>54 142.3 225.2 82.9 418.7 276.4
>57 79.5 118.5 39 238.4 158.9
>60 46.3 66.8 20.5 142.6 96.3
>63 27.3 39.2 11.9 84 56.7
>66 16 23.5 7.5 50.7 34.7
>69 9 13.9 4.9 30.3 21.3
>72 4.9 8 3.1 16.5 11.6
Population (000s)
Max Use Opt 1 Opt E1
Total Total Change Total Change
LAeq
(dB)
2030 2030 cw Base 2030 cw Base
>54 22.9 38.6 15.7 114.7 91.8
>57 9.4 16.7 7.3 43.8 34.4
>60 2.9 5.6 2.7 22.5 19.6
>63 1.3 2 0.7 7.9 6.6
>66 0.5 1 0.5 3.4 2.9
>69 0.3 0.5 0.2 1.3 1
>72 0.1 0.2 0.1 0.5 0.4
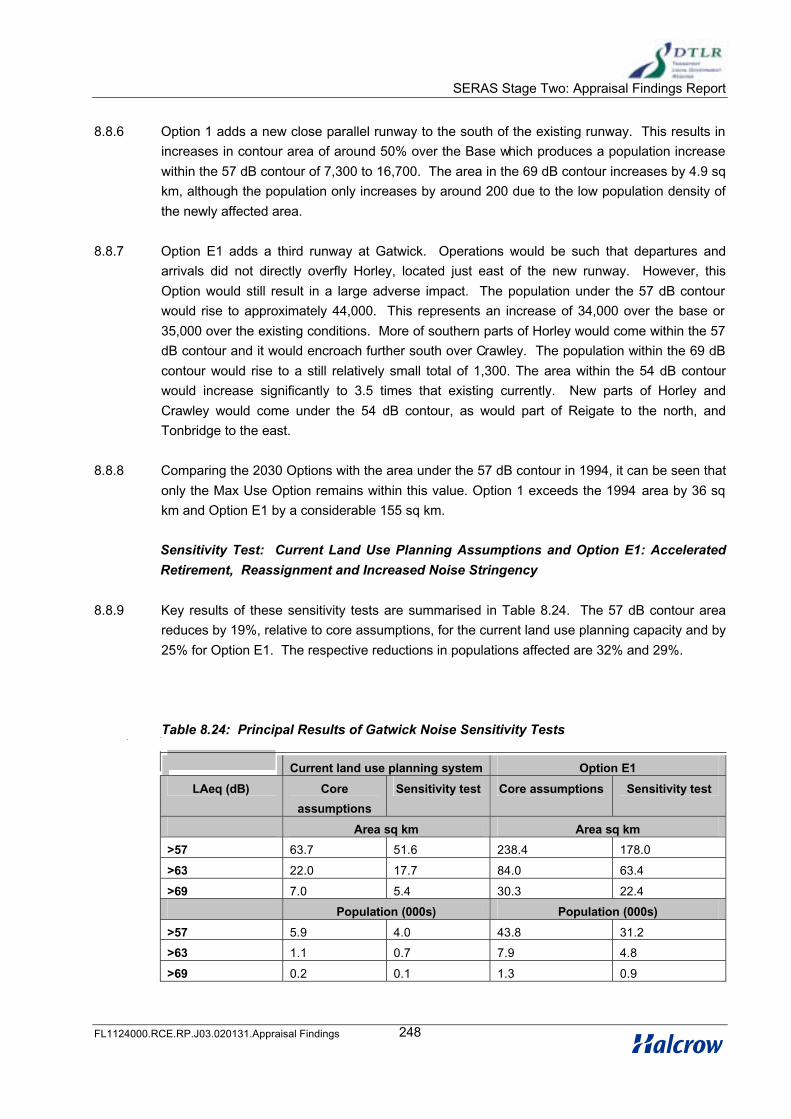
SERAS Stage Two: Appraisal Findings Report
FL1124000.RCE.RP.J03.020131.Appraisal Findings 248
8.8.6 Option 1 adds a new close parallel runway to the south of the existing runway. This results in
increases in contour area of around 50% over the Base which produces a population increase
within the 57 dB contour of 7,300 to 16,700. The area in the 69 dB contour increases by 4.9 sq
km, although the population only increases by around 200 due to the low population density of
the newly affected area.
8.8.7 Option E1 adds a third runway at Gatwick. Operations would be such that departures and
arrivals did not directly overfly Horley, located just east of the new runway. However, this
Option would still result in a large adverse impact. The population under the 57 dB contour
would rise to approximately 44,000. This represents an increase of 34,000 over the base or
35,000 over the existing conditions. More of southern parts of Horley would come within the 57
dB contour and it would encroach further south over Crawley. The population within the 69 dB
contour would rise to a still relatively small total of 1,300. The area within the 54 dB contour
would increase significantly to 3.5 times that existing currently. New parts of Horley and
Crawley would come under the 54 dB contour, as would part of Reigate to the north, and
Tonbridge to the east.
8.8.8 Comparing the 2030 Options with the area under the 57 dB contour in 1994, it can be seen that
only the Max Use Option remains within this value. Option 1 exceeds the 1994 area by 36 sq
km and Option E1 by a considerable 155 sq km.
Sensitivity Test: Current Land Use Planning Assumptions and Option E1: Accelerated
Retirement, Reassignment and Increased Noise Stringency
8.8.9 Key results of these sensitivity tests are summarised in Table 8.24. The 57 dB contour area
reduces by 19%, relative to core assumptions, for the current land use planning capacity and by
25% for Option E1. The respective reductions in populations affected are 32% and 29%.
Table 8.24: Principal Results of Gatwick Noise Sensitivity Tests
Current land use planning system Option E1
LAeq (dB) Core
assumptions
Sensitivity test Core assumptions Sensitivity test
Area sq km Area sq km
>57 63.7 51.6 238.4 178.0
>63 22.0 17.7 84.0 63.4
>69 7.0 5.4 30.3 22.4
Population (000s) Population (000s)
>57 5.9 4.0 43.8 31.2
>63 1.1 0.7 7.9 4.8
>69 0.2 0.1 1.3 0.9
SERAS Stage Two: Appraisal Findings Report
FL1124000.RCE.RP.J03.020131.Appraisal Findings 249
Aircraft Noise: Night-time
8.8.10 Tables 8.25 and 8.26 below show the population numbers and associated house counts within
the departure and arrival 90 dBA SEL footprints for easterly and westerly operations
respectively. The footprints are shown in a supporting document and represent an ‘average
worst’ QC2 aircraft, applied to each departure track (SID) and each runway’s approach path for
arrivals.

SERAS Stage Two: Appraisal Findings Report
FL1124000.RCE.RP.J03.020131.Appraisal Findings 250
Table 8.25: Night Noise Population and House Counts – Easterly Operations
Existing Option 1 Option E1
Runway 08 08L 08R 08L 08C 08R
Popl’n
(000’s)
Hse
(000’s)
Popl’n
(000’s)
Hse
(000’s)
Popl’n
(000’s)
Hse
(000’s)
Popl’n
(000’s)
Hse
(000’s)
Popl’n
(000’s)
Hse
(000’s)
Popl’n
(000’s)
Hse
(000’s)
Departures
All 0.9 0.3 0.8 0.3 0.7 0.3 - - 0.7 0.3 0.6 0.2
Arrivals 0.1 0.1 0.1 <0.1 0.1 <0.1 1.0 0.4 0.1 <0.1 0.3 0.1
Table 8.26: Night Noise Population and House Counts – Westerly Operations
Existing Option 1 Option E1
Runway 26 26R 26L 26R 26C 26L
Popl’n
(000’s)
Hse
(000’s)
Popl’n
(000’s)
Hse
(000’s)
Popl’n
(000’s)
Hse
(000’s)
Popl’n
(000’s)
Hse
(000’s)
Popl’n
(000’s)
Hse
(000’s)
Popl’n
(000’s)
Hse
(000’s)
Departures
BOG/KEN/SA
M
0.1 <0.1 0.1 <0.1 0.1 0.1 0.1 <0.1 0.5 0.2 1.1 0.5
CLN/DVR/LA
M
0.1 <0.1 0.1 <0.1 0.1 0.1 0.1 <0.1 0.5 0.2 0.8 0.3
WIZ 0.1 <0.1 0.1 <0.1 0.1 0.1 0.1 <0.1 0.5 0.2 0.7 0.3
Average 0.1 <0.1 0.1 <0.1 0.1 0.1 0.1 <0.1 0.5 0.2 0.9 0.4
Arrivals 0.8 0.3 0.8 0.3 0.9 0.3 - - 0.8 0.3 0.8 0.3

SERAS Stage Two: Appraisal Findings Report
FL1124000.RCE.RP.J03.020131.Appraisal Findings 251
8.8.11 SID references are: BOG – Bogna; KEN – Kennet; SAM – Southampton; CLN – Clacton; DVR
– Dover; LAM – Lambourne; WIZ - Wizad
8.8.12 The numbers of people and houses affected at Gatwick with both easterly and westerly arrivals
and departures are relatively low. Easterly arrivals on 08L under Option E1 have a higher
impact on population than on 08C by a factor of ten and on O8R by a factor of three. Westerly
departures are more significant on 26L under Option E1 whilst arrivals have a similar impact
under all scenarios.
Surface Access Noise: Highways
8.8.13 Table 8.27 gives the overall results (total EPA) from the GOMMMS plan level assessment for
road traffic noise. The Surface Access Noise part of the Appraisal Summary Table also
includes the EPA values split by noise contour bands.
Table 8.27: Gatwick Surface Access Noise Assesssment: Highways
Total change in Estimated Population Annoyed (EPA) by road traffic noise (000’s)
Year Maximum Use Option 1 Option E1
2015 0 -0.4 n/a
2030 n/a +0.6 +2.4
8.8.14 The noise impacts of changes in road traffic for the Maximum Use option and Option 1 in 2015
are compared with the Base Case, which is the road network for Package 1. There are no
effects in the Gatwick area for the Maximum use option and therefore the result is assessed as
no change in EPA. For Option 1 the traffic noise effects include the wider Gatwick area,
extending to the Guildford, Dorking and Billingshurst areas. The total change in Estimated
Population Annoyed (EPA) by road traffic noise is a decrease of 400 for Option 1.
8.8.15 For 2030, the Base Case is the road network for Package 2 and the traffic noise effects for
Options 1 and E1 have been assessed for this year. For Option 1 impacts are limited to the
wider Gatwick area, including the A23 south of Gatwick, some roads in Dorking, and the A24
between Beare Green and Horsham. The assessment results in a net increase in EPA of 600
people. For Option E1 the traffic noise effects are also centred around Gatwick, but spread
over a wider area. These include some B roads near to Guildford and Billingshusrt, part of the
A286 north of Chichester and the A280 outside Worthing. The total change in EPA for Option
E1 is an increase of 2,400 people.

SERAS Stage Two: Appraisal Findings Report
FL1124000.RCE.RP.J03.020131.Appraisal Findings 252
Surface Access Noise: Railways
8.8.16 Table 8.28 gives the results (total EPA) from the GOMMMS strategy level assessment for
railway noise.
Table 8.28: Gatwick Surface Access Noise Assesssment: Railways
Total change in Estimated Population Annoyed (EPA) by railway noise (000’s)
Year Maximum Use Option 1 Option E1
2015/2030 N/a 0.0 +1.4
8.8.17 The railway noise impacts for the Options at Gatwick are compared against the Base Case
which is the Maximum Use of existing runways scenario. The impacts apply for 2015 and also
for 2030 where this is appropriate. There are no increases in rail sevices for Option 1 over those
applying to the Base Case (Maximum Use option). The increases in rail services and
associated noise impacts for Option E1 apply between Redhill and Purley and from East
Croydon to London Bridge via New Cross Gate. The total change in Estimated Population
Annoyed (EPA) by railway noise for Option E1 is an increase of 1,400 people.
8.9 Environment: Local Air Quality Impacts
Introduction
8.9.1 Air quality results are provided for representative options at each airport, for 2015 and 2030 as
appropriate. The air quality statistics used as assessment criteria for defining poor air quality in
SERAS Stage Two are: annual mean Nitrogen Dioxide concentrations of 40µg/m3; and the 90th
percentile of running 24-hour mean PM10 concentrations of 50µg/m3. In practice, annual mean
PM10 compared to a statistic of 40µg/m3 are also reported, as the 90th percentile values are a
simple factor of these. The Air Quality Key Indicator for SERAS Stage Two is 'the number of
people exposed to an exceedance of the air quality standard, weighted by the degree of
exceedance'. The higher the key indicator, the worse the air quality impact is.
Results 2015
8.9.2 Figures 8.45 to 8.47 illustrate the air pollution contours for Gatwick options in 2015. For each
option, figures are for annual mean Nitrogen Dioxide, and for annual mean PM10 and 90th
percentile of 24hour mean PM10 where relevant. The outer box is the study area for air quality in
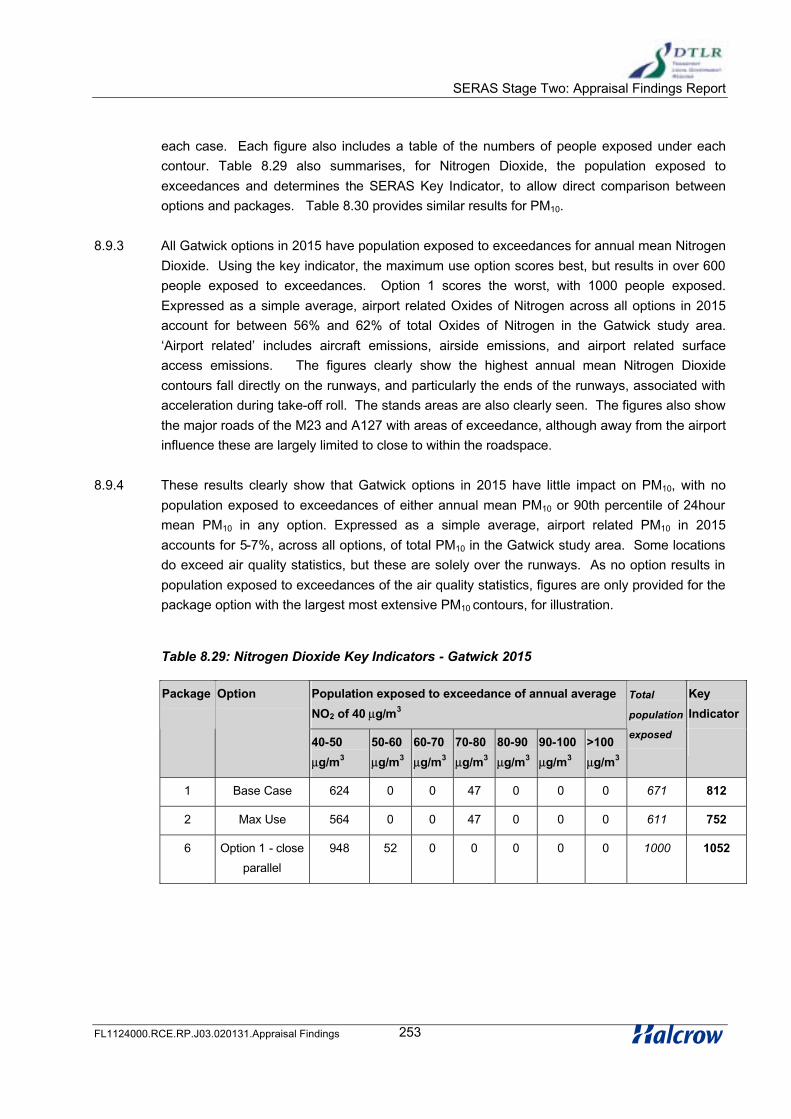
SERAS Stage Two: Appraisal Findings Report
FL1124000.RCE.RP.J03.020131.Appraisal Findings 253
each case. Each figure also includes a table of the numbers of people exposed under each
contour. Table 8.29 also summarises, for Nitrogen Dioxide, the population exposed to
exceedances and determines the SERAS Key Indicator, to allow direct comparison between
options and packages. Table 8.30 provides similar results for PM10.
8.9.3 All Gatwick options in 2015 have population exposed to exceedances for annual mean Nitrogen
Dioxide. Using the key indicator, the maximum use option scores best, but results in over 600
people exposed to exceedances. Option 1 scores the worst, with 1000 people exposed.
Expressed as a simple average, airport related Oxides of Nitrogen across all options in 2015
account for between 56% and 62% of total Oxides of Nitrogen in the Gatwick study area.
‘Airport related’ includes aircraft emissions, airside emissions, and airport related surface
access emissions. The figures clearly show the highest annual mean Nitrogen Dioxide
contours fall directly on the runways, and particularly the ends of the runways, associated with
acceleration during take-off roll. The stands areas are also clearly seen. The figures also show
the major roads of the M23 and A127 with areas of exceedance, although away from the airport
influence these are largely limited to close to within the roadspace.
8.9.4 These results clearly show that Gatwick options in 2015 have little impact on PM10, with no
population exposed to exceedances of either annual mean PM10 or 90th percentile of 24hour
mean PM10 in any option. Expressed as a simple average, airport related PM10 in 2015
accounts for 5-7%, across all options, of total PM10 in the Gatwick study area. Some locations
do exceed air quality statistics, but these are solely over the runways. As no option results in
population exposed to exceedances of the air quality statistics, figures are only provided for the
package option with the largest most extensive PM10 contours, for illustration.
Table 8.29: Nitrogen Dioxide Key Indicators - Gatwick 2015
Population exposed to exceedance of annual average
NO2 of 40 µg/m3
Package Option
40-50
µg/m3
50-60
µg/m3
60-70
µg/m3
70-80
µg/m3
80-90
µg/m3
90-100
µg/m3
>100
µg/m3
Total
population
exposed
Key
Indicator
1 Base Case 624 0 0 47 0 0 0 671 812
2 Max Use 564 0 0 47 0 0 0 611 752
6 Option 1 - close
parallel
948 52 0 0 0 0 0 1000 1052

SERAS Stage Two: Appraisal Findings Report
FL1124000.RCE.RP.J03.020131.Appraisal Findings 254
Table 8.30: PM10 Key Indicators - Gatwick 2015
Annual average PM10 of
40 µg/m3
90th Percentile of 24hour
mean PM10 of 50 µg/m3
Package Option
Total
population
exposed
Key
Indicator
Total
population
exposed
Key
Indicator
1 Base Case 0 0 0 0
2 Max Use 0 0 0 0
6 Option 1 - close parallel 0 0 0 0
Results 2030
8.9.5 Figures 8.48 to 8.51 illustrate the air pollution contours for Gatwick options in 2030. For each
option, figures are for annual mean Nitrogen Dioxide, and for annual mean PM10 and 90th
percentile of 24 hour mean PM10 where relevant. The outer box is the study area for air quality
in each case. Each figure also includes a table of the numbers of people exposed under each
contour. Table 8.31 also summarises, for Nitrogen Dioxide, the population exposed to
exceedances and determines the SERAS Key Indicator, to allow direct comparison between
options and packages. Table 8.32 provides similar results for PM10.
8.9.6 All Gatwick options in 2030 have population exposed to exceedances for annual mean Nitrogen
Dioxide. Using the key indicator, option 1 scores better than E1, but both score worse than
2015 options. Option E1 scores the worst of all options (2015 or 2030), with over 7000 people
exposed. Expressed as a simple average, airport related Oxides of Nitrogen in 2030 account
across all options for between 69% and 76% of total Oxides of Nitrogen in the Gatwick study
area (an increase over 2015). ‘Airport related’ includes aircraft emissions, airside emissions,
and airport related surface access emissions. The figures clearly show the highest annual
mean Nitrogen Dioxide contours fall directly on the runways, and particularly the ends of the
runways associated with acceleration during take-off roll. The stands areas are also clearly
seen. The figures also show the major roads of the M23 and A127 with areas of exceedance,
although away from the airport influence these are largely limited to close to within the
roadspace.
8.9.7 These results clearly show that Gatwick options in 2030 (as in 2015) have little impact on PM10,
with no population exposed to exceedances of either annual mean PM10 or 90th percentile of
24hour mean PM10 in any option. Expressed as a simple average, airport related PM10 in 2030
accounts across all options for 8-9% of total PM10 in the Gatwick study area. Some locations do
exceed air quality statistics, but these are solely over the runways. As no option results in

SERAS Stage Two: Appraisal Findings Report
FL1124000.RCE.RP.J03.020131.Appraisal Findings 255
population exposed to exceedances of the air quality statistics, figures are only provided for the
package option with the largest most extensive PM10 contours, for illustration (option E1).
Table 8.31: Nitrogen Dioxide Key Indicators - Gatwick 2030
Population exposed to exceedance of annual
average NO2 of 40 µg/m3
Package Option
40-50
µg/m3
50-60
µg/m3
60-70
µg/m3
70-80
µg/m3
80-90
µg/m3
90-100
µg/m3
>100
µg/m3
Total
popul’n
exposed
Key
Indicator
6 Option 1 - close
parallel
2833 869 131 0 0 0 0 3833 4964
9 Option E1 - 2 new
runways
4818 1924 400 55 19 0 0 7216 10181
Table 8.32: PM10 Key Indicators - Gatwick 2030
Annual average PM10 of
40 µg/m3
90th Percentile of 24hour
mean PM10 of 50 µg/m3
Package Option
Total
population
exposed
Key
Indicator
Total
population
exposed
Key
Indicator
6 Option 1 - close parallel 0 0 0 0
6 Option 1 - close parallel 0 0 0 0
9 Option E1 - 2 new runways 0 0 0 0
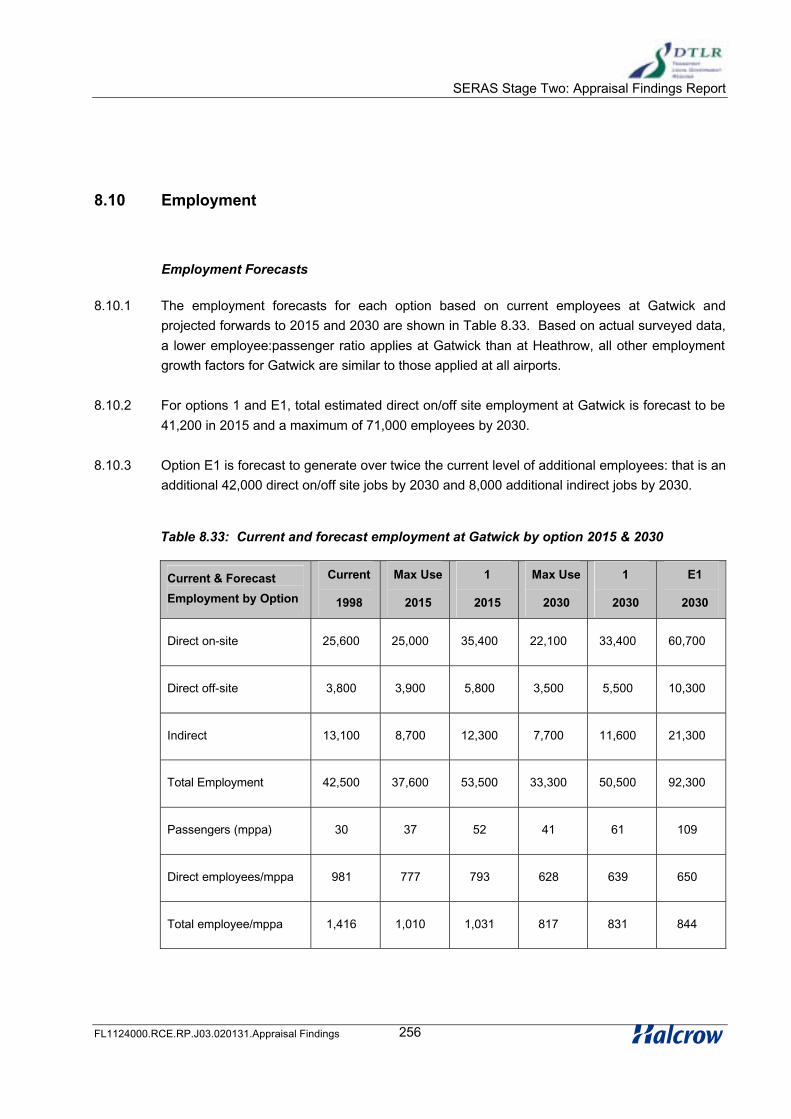
SERAS Stage Two: Appraisal Findings Report
FL1124000.RCE.RP.J03.020131.Appraisal Findings 256
8.10 Employment
Employment Forecasts
8.10.1 The employment forecasts for each option based on current employees at Gatwick and
projected forwards to 2015 and 2030 are shown in Table 8.33. Based on actual surveyed data,
a lower employee:passenger ratio applies at Gatwick than at Heathrow, all other employment
growth factors for Gatwick are similar to those applied at all airports.
8.10.2 For options 1 and E1, total estimated direct on/off site employment at Gatwick is forecast to be
41,200 in 2015 and a maximum of 71,000 employees by 2030.
8.10.3 Option E1 is forecast to generate over twice the current level of additional employees: that is an
additional 42,000 direct on/off site jobs by 2030 and 8,000 additional indirect jobs by 2030.
Table 8.33: Current and forecast employment at Gatwick by option 2015 & 2030
Current & Forecast
Employment by Option
Current
1998
Max Use
2015
1
2015
Max Use
2030
1
2030
E1
2030
Direct on-site 25,600 25,000 35,400 22,100 33,400 60,700
Direct off-site 3,800 3,900 5,800 3,500 5,500 10,300
Indirect 13,100 8,700 12,300 7,700 11,600 21,300
Total Employment 42,500 37,600 53,500 33,300 50,500 92,300
Passengers (mppa) 30 37 52 41 61 109
Direct employees/mppa 981 777 793 628 639 650
Total employee/mppa 1,416 1,010 1,031 817 831 844

SERAS Stage Two: Appraisal Findings Report
FL1124000.RCE.RP.J03.020131.Appraisal Findings 257
8.11 Land Use/Urbanisation
Summary
8.11.1 Gatwick’s core catchment area consists of Crawley, Reigate and Banstead and Mid Sussex.
Crawley is very built up, in comparison with Reigate and Banstead and Mid Sussex, which are
potentially constrained by national designations and topography.
8.11.2 The additional employment associated with Option 1 is 11,000 jobs in 2015 and 8,000 in 2030.
Option E1, by contrast, could add 49,800 jobs in 2030. To accommodate the employment
needs of Option 1, the proportion of core catchment area employment at the airport would need
to increase from 13.8% currently to 15% in 2015. To accommodate Option E1, it would need to
increase to 24% by 2030.
8.11.3 In terms of housing capacity, it is possible that options other than Option E1 could be
accommodated, although Option 1 may present a certain degree of pressure. There might be a
capacity of up to 6,000 dwellings in the core catchment area, if quite extensive Green Belt
releases around the main settlements in Reigate and Banstead could be justified by very
special circumstances. There would, however, be political and local opposition to expansion of
settlements in West Sussex, a county that has strenuously maintained that it has almost
reached its environmental capacity.
8.11.4 Option E1 would require major Green Belt releases, although some of this could be offset by
providing additional housing in the wider catchment area in areas linked by public transport
including Brighton and south London.
8.11.5 In terms of off-airport employment, there is unlikely to be sufficient allocated employment land
for anything but the smaller options, and then only if high density premises are assumed. Little
vacant and redevelopable land is likely to be available given that most industry in the immediate
area around Gatwick is modern. There are significant competing pressures for land from other
economic sectors. Within the core catchment area there is a greater chance of accommodating
off-airport employment in the West Sussex districts than in Reigate and Banstead. The
possibility exists for accommodating indirect employment further from the airport, for example in
the Brighton area (a Priority Area for Economic Regeneration in RPG9).
Employment Land Requirements
8.11.6 The development implications of off-airport employment vary between options, with
requirements for up to 23 ha in 2015 and 101 hectares in 2030 of off-site employment land
within reasonable proximity to the airport.

SERAS Stage Two: Appraisal Findings Report
FL1124000.RCE.RP.J03.020131.Appraisal Findings 258
Crawley Borough Council
8.11.7 The Crawley local plan (adopted, April 2000) recognises the high dependency of the district on
the airport and the associated employment opportunities. Crawley new town is the major
employment centre in West Sussex, which, in the 1970s and 1980s enjoyed full employment
and a strong economy. More recently the economy has been characterised by increases in the
numbers employed in service sectors (hotels, distribution and catering, transport and
communications), with the continued decline of the manufacturing industry. Throughout,
Gatwick airport has been the main generator of local employment.
8.11.8 To avoid over dependency, the authority are seeking to diversify their economy and therefore,
implicitly, are seeking not to encourage more airport related employment provision within the
district. The local plan identifies 83,000m2 of land (8.3 ha) for new business floorspace. Some
of this is provided for off airport related employment use.
8.11.9 There is a general concern within the district about the overheating of the local economy. The
district experiences a very tight labour market, as well as severe land and infrastructure
constraints. Additional employment land provision is likely to generate skill shortages within the
labour force as well as provide unwelcome additional pressure for other uses, including housing
and transport requirements. The local plan specifically seeks to restrict this, in seeking to
prevent offices and warehousing activity that generate additional traffic or housing
requirements.
8.11.10 In these circumstances, it is unlikely that current employment land provision within Crawley
borough will be able to accommodate significant increases in airport related employment
generated by airport expansion. The drive to avoid overheating also strongly suggests that
there are already tight land and labour constraints within the district, which would only be
exacerbated with increased airport activity. In this context it becomes more likely that only a
radical land take solution, involving developing on greenfield sites, could provide the means of
significantly increasing employment, and overall development land capacity, in Crawley.
Reigate and Banstead
8.11.11 As with other districts in the Western Policy Area, the authority experienced an overheating
local economy in 1990s. A high proportion of local residents work outside the district: in the
early 1990s approximately half the population commuted to central London, increasingly more
people work in outer London.
8.11.12 Reigate and Banstead district does not support direct airport related employment outside the
airport boundary. Airport related uses are accepted especially in the south of the borough, but
there is provision to prevent the development of extensive new car parking. In addition, the
local plan clearly specifies that warehousing exceeding 5,000 sq m gross is considered
inappropriate in relation to Gatwick Airport. The large buildings and plots would generate high

SERAS Stage Two: Appraisal Findings Report
FL1124000.RCE.RP.J03.020131.Appraisal Findings 259
levels of additional activity, and provide an inefficient worker:floorspace density in areas
experiencing a shortage of employment land.
8.11.13 While Reigate and Banstead currently tolerates additional employment generated by Gatwick
airport, the nature of this employment is restricted to those with high worker densities, and
those which cannot be expected to locate on the airport. This suggests that in the current
situation there is pressure for employment land, and that potentially it will be difficult to find land
to accommodate any of the major airport expansion options.
Mid Sussex
8.11.14 Employment in the district is mainly concentrated in the three main towns of Burgess Hill, East
Grinstead and Haywards Heath. The area has traditionally experienced a healthy and
prosperous economy, and has grown significantly over the past 20-30 years. The economy is
diverse and resilient (lower levels of unemployment in times of recession than other parts of
West Sussex). The labour force has high skill levels. There is provision in the local plan for
150,000m2 of employment space (15 ha) up to 2006, mostly in the three main towns, but it is
anticipated that demand will exceed supply.
8.11.15 Haywards Heath is recognised as a source for labour for Gatwick airport due to the good public
transport links provided on the Thameslink line. It may be that in future there is more scope to
source labour from here, particularly following on from the development of the south west site
and associated relief road when it is possible additional housing sites will come forward. There
is no other commentary in the plan relating to airport related employment provision.
8.11.16 Despite existing employment land constraints, it should be possible to accommodate some
additional off airport jobs here although there will be competing pressures from other sectors.
Housing Capacity
8.11.17 The largest option at Gatwick would require up to 49,800 additional employees, around 35% of
the total forecast employment growth in the core and wider catchment areas. Within these
areas there is a forecast housing shortfall to 2030 of around 60,000 houses, suggesting that the
largest option might be responsible for some 21,000 additional houses over RPG provision
being required. Option 1, on the same basis, would generate a need for around 7,000
additional houses to 2015 and 3,400 to 2030. RPG provision to 2030 is an additional 145,000
houses.
8.11.18 Crawley New Town, is the main settlement in the district. The population increased from
10,000 in 1951 to 96,000 in 1995, and is estimated to increase to 99,000 by 2006. Crawley is
well served by the M23 motorway and the Thameslink rail service, both of which link the area
with London and beyond via the strategic motorway and rail networks. Crawley is surrounded

SERAS Stage Two: Appraisal Findings Report
FL1124000.RCE.RP.J03.020131.Appraisal Findings 260
by countryside and a small part of the southern area is within the High Weald Area of
Outstanding Natural Beauty. In addition, several strategic gaps are in place to prevent urban
sprawl and retain the uniqueness of Crawley and surrounding villages.
8.11.19 Gatwick airport is entirely located within the Borough. While it benefits the borough, every effort
is made to restrict adverse impacts of the airport. This includes controlling airport driven
development pressure. The local plan requires that development land arising from growth at
Gatwick Airport should be met primarily on the airport boundary, within which several areas for
future development are allocated. The local plan recognises that a variety of airport related
uses, eg hotels, could be located within the borough, on allocated employment sites.
8.11.20 Crawley has several strategic gaps in place - between Crawley and Horsham, and Crawley and
Gatwick Airport/Horley. These are derived from structure plan policy. There is a recognition
that the Crawley - Gatwick gap is under pressure, with tranches having been recently lost to
housing development to meet ‘compelling circumstances’ as set out in the Structure Plan.
8.11.21 Reigate and Banstead extends north from Gatwick airport. The airport is located adjacent to its
southernmost boundary. It has four main centres, Redhill, Reigate, Horley and Banstead.
Other large villages include Woodmansterne, Chipstead, Kingswood, Lower Kingswood, Walton
on the Hill and Salfords.
8.11.22 The Borough comprises a number of towns and villages set within attractive countryside,
stretching either side of the North Downs escarpment. It has urban and environmental areas of
high quality - Reigate has a large Conservation Area, and the Surrey Hills Area of Outstanding
Natural Beauty extends from east to west north of Reigate. The district is crossed by the M25
and M23, and is therefore readily accessible to London and beyond.
8.11.23 The district is subject to strong development pressures, and uses three local plan policy devices
to resist it. Green Belt accounts for a large proportion of the total land area, and seeks to
prevent the outward spread of existing settlements. In addition, the local plan only allocates
modest increases in housing and business provision within the district.
8.11.24 The district of Mid Sussex extends immediately south of Crawley borough. The three main
settlements are Haywards Heath, Burgess Hill and East Grinstead, remaining settlements are
villages of various sizes. The north part of Mid Sussex includes the Weald AONB, the southern
part is straddled by the South Downs AONB, soon to become the South Downs National Park.
The M23/A23 extends southwards through the district close to its western border, the A272 to
Haywards Heath and the A264 to East Grinstead provide the main road infrastructure. The
Thameslink line also bisects the district, with a major station at Haywards Heath.
8.11.25 The northern part of the district is subject to strong development pressures, and is on the edge
of the Western Policy Area (area of overheating) as identified in RPG 9 (March 2001). There is

SERAS Stage Two: Appraisal Findings Report
FL1124000.RCE.RP.J03.020131.Appraisal Findings 261
also a significant proportion of the area not appropriate for development, by virtue of its
topography and national designations (Weald and South Downs).
8.12 Integration Impacts
Regional /sub-regional policy
8.12.1 Gatwick Airport impacts upon the sub-regions of the South Coast and Crawley/Gatwick/M23
Area. The impacts of an expanded airport are discussed below under the headings of
employment/labour force, housing and transport infrastructure.
Employment / Labour Force
8.12.2 The two sub-regions in the south – the South Coast and the Crawley/Gatwick/M23 area –
exhibit several common features when examining their labour markets and employment
demand. Any major expansion of Gatwick Airport would provide widespread difficulties in terms
of meeting demand for labour. This is because both sub-regions have labour mismatches. On
the South Coast, there is plenty of available labour but this is largely unskilled and does not fit
with the new industry jobs developing now, nor would it be suited for the types of businesses
that would develop in the area as a result of airport expansion. In the Crawley/Gatwick/M23
sub-region, there is again a lack of labour, but this time at both ends of the skills spectrum.
8.12.3 Despite this, the potential to expand the employment base is more positive. On the South Coast
there are strong local universities and clusters of large high-technology industries that can
provide training. This latter point applies also in the Crawley/Gatwick/M23 area, as the existing
strength of the industrial clusters connected to the airport provide a strong economic base upon
which to build. It is these strengths that will also provide opportunities for people entering the
job market. Additionally, when considering the criterion of developing the requisite training and
skills profile, the expansion of Gatwick and its associated growth in clustering of high-value,
high-skill sectors, will impact on the universities in the area. The potential is then created to
develop similar offshoots in R&D, high-technology sectors, etc., as experienced by Oxford and
Cambridge Universities. Where there may be a weakness, particularly on the South Coast, is
the existing low skills base of the workforce.
8.12.4 This leads on to the consideration of providing employment sites in sustainable locations. The
effect of the development of a university ‘technology base’ is that, while it will attract
employment into business clusters, it will seek its workforce from outside of the sub-region, due
to the low existing skills base. This is less of an issue along the Crawley/Gatwick/M23 corridor,
as the existing clusters of businesses close to the airport and to Crawley are well established.

SERAS Stage Two: Appraisal Findings Report
FL1124000.RCE.RP.J03.020131.Appraisal Findings 262
Also, development will naturally follow the M27 corridor rather than focusing on the urban
centres where the labour force is located. Despite this, the opportunity is available to provide a
range of business accommodation in both sub-regions.
Housing
8.12.5 Both the South Coast and Crawley/Gatwick/M23 sub-regions are broadly able to accommodate
housing demand created by the expansion of Gatwick Airport. On the South Coast there is a
clear policy aim to provide affordable housing with easy access to the new developing
employment areas along the M27 corridor. This will allow people to live near to their
employment base. What it will also be liable to do however, is take in greenfield sites, thus not
assisting the sub-region to meet its brownfield housing targets.
8.12.6 The housing market in the Crawley/Gatwick/M23 area is buoyant and matches the profile of
high-skill workers employed in the existing clusters of industries attracted by the airport. There
is much available housing and there is clear scope to meet the identified need for affordable
housing that will support the lower skill jobs created as a result of airport expansion. With the
ability to develop in the existing urban areas, this provides a sound base for reaching the
brownfield targets as well as providing housing relatively close to the employment areas.
Transportation / Infrastructure Improvements
8.12.7 The high quality of both existing and proposed transport infrastructure connecting London and
the rest of the South East to the key port hubs at Southampton and Portsmouth will be further
enhanced by airport development at Gatwick. The airport will bring forward further
improvements to road and rail connections in order to provide fast access for freight to and from
continental Europe. Also, a high growth scenario could allow Gatwick, via the two ports, to
become a long-haul hub for freight bound for the rest of Europe. This in particular would
enhance the rail network in the two sub-regions.
8.12.8 Airport development however, is unlikely to reduce the need to travel. With the potential
opening up of university technology clusters, and the spreading of clusters along corridors such
as the M23 and M27, businesses are likely to look further afield for employees. This is
supported by the quality of transport links and the poor supply of labour in high skill functions.
As Gatwick expands and seeks more actively to gain employees from the South Coast, this
area will suffer the most as more and more people commute long distances from South Coast
locations into the Gatwick sub-region.

SERAS Stage Two: Appraisal Findings Report
FL1124000.RCE.RP.J03.020131.Appraisal Findings 263
Social Impact
Low Growth Scenario
8.12.9 Under a low-growth scenario (up to 2015), some 11,000 jobs could be generated in total –
Option 1. Of these, it is likely that around 3,700 will be low skill in nature, with potentially up to
2,300 being located on-site and 1,400 off-site.
8.12.10 In 1998 there was a surplus in Croydon and Brighton & Hove of 3,500 workers. Although there
is forecast to be an increase in the number of jobs up to 2016, this will be more than offset by
an increase in the workforce. As such, the surplus of workers will grow a small amount.
Nevertheless, it will be possible for almost all the off-site jobs to be accommodated in the
deprived districts. Approximately 2,000 could possibly be located in Brighton & Hove and
around 1,000 in Croydon.
8.12.11 When considering what infrastructure improvements would be necessary to secure a high
percentage of the generated jobs in the two deprived districts, the range of potential service
improvements along the London-Gatwick-Brighton corridor, particularly in respect of rail, would
be important. This is particularly necessary in order to open up the Brighton & Hove labour
market, which although the more distant, has the greater labour market capacity.
High Growth Scenario
8.12.12 Under a high growth scenario (up to 2030), some 51,000 jobs could be generated – Option E1.
Of these, possibly 15,500 could be low skill in nature, with over 9,700 potentially being located
on-site and over 5,800 off-site.
8.12.13 Although at 2016 there is a labour surplus approaching 4,000 workers, the period from 2016 to
2030 is forecast to see a net increase of more than 3,700 jobs in the labour market. This would
leave a very small surplus of workers in the labour market. This is mostly due to a large
projected fall in the workforce. Provided the improvements to rail and road services outlined in
the low growth scenario are in place, then continued airport growth would negate this through
increasing commuting from the deprived districts.
8.12.14 As such, it is reasonable to assume that further capacity is available to take on several
thousand more of the jobs between 2016 and 2030. In addition, strong regeneration policy
would reinforce the Croydon-Gatwick-Brighton corridor, and assist in the potential consolidation
of low skill jobs to those workers available in the regeneration corridors. As stated, the potential
may be there for some of the extra jobs created to be filled by workers commuting in from along
the Sussex Coast, a designated Priority Area for Economic Regeneration (PAER).
SERAS Stage Two: Appraisal Findings Report
FL1124000.RCE.RP.J03.020131.Appraisal Findings. 264
9 Appraisal of Options at Main Sites: Stansted
9.1 Options Appraised in Stage Two
9.1.1 Three options, which can be seen to build on one another, have been appraised at Stansted.
The location of Stansted is shown in Figure 9.1. The capacity currently envisaged in the land-
use planning system is 15 mppa: see Figures 9.2 and 9.3 for the existing airport layout and the
approved Phase 2 of the airport’s development to take capacity up to about 15 mppa.
Stansted Airport Ltd submitted a planning application in August 2001 to increase capacity to 25
mppa by 2010, and will seek a commensurate increase in the number of passenger ATMs. The
maximum capacity of the existing runway is assumed to be 35 mppa. Figure 9.4 shows a
layout to make maximum use of the existing runway.
9.1.2 Option 5 (Figure 9.5) adds one new full length runway separated from the existing runway by
2450m and with a large stagger. The depth of land available allows terminal and stand capacity
to be provided between the two runways. Option 5 assumes the two runways would be
operated in mixed mode, and that the additional runway could be in place by 2011.
9.1.3 Option 11 (Figure 9.7) adds a further runway to Option 5. This would be a new full length, close
parallel runway on the north west side of the existing runway. These two runways would be a
dependent pair. It is assumed this third runway could be in place by 2021.
9.1.4 Option 7 (Figure 9.6) adds a fourth runway to the three runways in Option 11. The additional
runway is a full length close parallel runway to the Option 5 new runway. It is assumed that the
new runways could be in place in 2011, 2018 and 2024.
9.1.5 The options appraised at Stansted are summarised in Table 9.1

SERAS Stage Two: Appraisal Findings Report
FL1124000.RCE.RP.J03.020131.Appraisal Findings. 265
Table 9.1: Options Appraised at Stansted
Option DescriptionTerminal
capacity, mppa
Runway
capacity,
ATM
Year of
Introduction
Current Land Use Planning System 15 185,000
Maximum Use of Existing Runway 35 259,000
5New full length runway 2450m to south
of existing runway82 513,000 2011
11
Two new runways in total. Option 5
plus new full length runway close-
parallel to existing runway
102 637,000 2011 and 2021
7
Three new runways in total. Option 11
plus a new full length, close parallel
runway to that in Option 5, making two
pairs of close parallel runways
129 756,0002011, 2018
and 2024
9.2 Capital Costs
9.2.1 Table 9.2 below shows the estimated incremental capital costs for each option above the
35mppa capacity maximum use of the existing runway case. Table 9.3 gives the breakdown of
surface access (road and rail) costs.
Table 9.2: Estimated Incremental Capital Costs for Stansted Options above Max Use
Case (£ million)
Item Option 5 Option 7 Option 11
Capacity 82 mppa 129 mppa 102 mppa
Terminals & Satellites
Terminal Buildings
Satellite Buildings
Baggage Handling/conveyors
Total
594
250
100
944
1129
434
168
1731
810
309
118
1237

SERAS Stage Two: Appraisal Findings Report
FL1124000.RCE.RP.J03.020131.Appraisal Findings. 266
Item Option 5 Option 7 Option 11
Aircraft Pavements
Runways
Taxiways
Aprons / Stands
Total
34
52
146
232
102
108
286
496
68
82
221
371
Enabling Works & Infrastructure
Demolition, Earthworks, etc
Car Parking
Utility Services
Airside Roads and public
Road diversions
Tracked Transit
Drainage
Landscaping
Total
55
133
82
7
258
25
5
565
73
436
123
11
429
38
10
1120
62
324
82
11
289
37
7
812
Navigation Aids (ATC, ILS & AGL) 7 22 15
Cargo & Maintenance
Cargo buildings & aprons
Hangar/ Maintenance buildings &
aprons
Total
51
81
132
98
132
230
74
89
163
Support Facilities, etc
Support facilities
Offices
Other facilities / services (inc. fuel,
security, pedestrian link, archaeology)
Total
47
36
39
122
94
44
44
182
67
36
39
142
On-costs 501 945 685
Contingencies 626 1181 856
Land Costs 57 138 96

SERAS Stage Two: Appraisal Findings Report
FL1124000.RCE.RP.J03.020131.Appraisal Findings. 267
Item Option 5 Option 7 Option 11
Sub-total:
Airport Development Costs3185 6045 4378
Airport Development Costs per mppa
provided above 35 mppa Base Case68 64 65
Costs of Associated Surface
Access785 1879 1629
Total Capital Costs 3970 7924 6007
Total Capital Costs per mppa
provided above 35 mppa Base Case84 84 90
Table 9.3: Estimated ‘Airport Specific’ Surface Access Costs (£ million)
Item Option 5 Option 7 Option 11
Road Schemes
Airport Road extension + links to A120 & M11
(all dual 2)
Sub Total
69
69
69
69
69
69
Rail Schemes
Second tunnel & 2nd Airport Station
Loop to Elsenham + 3rd Station
Grade separation Stansted Mountfitchet
Multitrack to South Tottenham
Access to St Pancras
Bishops Stortford – Braintree line
Sub Total
91
n/a
n/a
625
n/a
n/a
716
91
94
13
1250
112
250
1810
91
94
13
1250
112
n/a
1560
Total 785 1879 1629
Airport Option Costs
9.2.2 The airport development costs associated with increasing the capacity of the airport from
current land use planning of 15mppa to the Base Case of 35mppa are estimated to total £894
million, with negligible additional surface access costs.
SERAS Stage Two: Appraisal Findings Report
FL1124000.RCE.RP.J03.020131.Appraisal Findings. 268
9.2.3 Car parking costs are high, similar to Gatwick, mostly due to a high proportion being multi-
storey or decked.
9.2.4 Enabling works costs are low, mainly due to nature of the site requiring comparatively small
volumes of earthworks.
9.2.5 In all Options, the tracked transit system accounts for 10 to 12% of the total cost.
9.2.6 Although not included in the cost estimates, a premium may be expected for working in
operational areas. This appears only to be of significance with constructing sections of
taxiways associated with runways 3 and 4 adjacent to operational runways 1 and 2 (assuming
phased runway construction). Interfacing of new and existing rail links would also require
working outside normal hours. It is assumed that construction of new buildings would not
require vehicles to go across existing aircraft pavements.
9.2.7 Additional remobilisation costs would be incurred if runway construction is phased, i.e.
constructing Option 5 followed at later dates by Options 11 and 7.
9.2.8 Land costs contribute about 2% of the Airport Development Costs. These are amongst the
lowest land-take costs of all sites. This is primarily due to the acquired land containing a below
average number of residential properties and a very small commercial area.
Surface Access Scheme Costs
9.2.9 The rail access costs for all options include for a second tunnel and additional stations at the
airport and for necessary improvements on the main line – between the airport and London.
Measures to increase capacity between Cambridge and Peterborough for the services assumed
for Options 7 and 11 has been excluded from the cost estimates – following the air passenger
allocation and air passenger mode choice modelling exercises there was found to be insufficient
demand to justify all the additional trains. Although not included in the cost estimates, the SRA
advise that a premium may be expected for working on operational lines, and that where
alteration to track layout is required, re-signalling maybe needed over a far wider area than the
infrastructure upgrade itself, with further cost implications.
9.2.10 In all options, road costs are for providing new access roads from the M11 in the north and the
A120 in the east.
9.2.11 Required improvements to the strategic road network, i.e. those not specifically required to
accommodate airport related traffic, involve widening sections of the M11 from dual 3 lane to
dual 4 lane. This would be required between Junctions 6 and 7 by 2030 in Options 7 and 11 at
an estimated cost of £28 million. It would also be required between Junctions 7 and 8 by 2030
in Option 7 at an estimated cost of £41 million. Costs for a proposed traffic management
scheme on the A1184 would be negligible by comparison.

SERAS Stage Two: Appraisal Findings Report
FL1124000.RCE.RP.J03.020131.Appraisal Findings. 269
9.3 Demand Forecasts
9.3.1 Forecast passenger movements, ATMs and passengers per passenger ATM for each Stansted
option are summarised at 5 year intervals between 2000 and 2030 in the following tables:
• Table 9.4: Current Land Use Planning System
• Table 9.5: Maximum Use of the Current Runway
• Table 9.6: Option 5
• Table 9.7: Option 11
• Table 9.8: Option 7
9.3.2 In the forecasting it has been assumed that the role of Stansted will change as it increases in
size. Stansted currently is a major airport for low cost services and serves a relatively local
catchment for scheduled services. With an additional runway (or runways) at Stansted and no
significant expansion of capacity at other South East airports, it is assumed that the role of
Stansted could change into that of a second international hub airport in the South East,
complementing Heathrow.
9.3.3 In the forecasting of demand at Stansted, a similar approach has been taken to the forecasting
of demand as at Cliffe Marshes. It has been assumed that at both airports, with two runways
being available in 2011, a major airline or an airline alliance, suffering from heavily constrained
capacity at Heathrow and Gatwick, would be willing to relocate services to the expanded
Stansted or the new Cliffe Marshes. The services assumed to be relocated to Stansted are
40% of Heathrow’s long haul and USA scheduled services. Stansted is assumed to retain its
low cost services and the short haul scheduled services will develop in any event. The
forecasts produced for the options at Stansted and Cliffe Marshes with two or more runways
start in 2011 on a seeded basis and test whether the services would survive or indeed grow in
their new locations. The capacity assumed to be ‘freed up’ at Heathrow and Gatwick is still
available to compete with the additional capacity at Stansted or at Cliffe Marshes.
9.3.4 The principal features of the demand forecasts for each option are summarised below.
Current Land Use Planning System
9.3.5 The current passenger capacity of 15 mppa dominates these forecasts. The total is reached
before 2005 and not exceeded. Continuing growth in passengers per ATM leads to a reduction
in ATMs to stay within passenger capacity. There is growth in short haul and domestic
scheduled services at the expense of charter and low cost.

SERAS Stage Two: Appraisal Findings Report
FL1124000.RCE.RP.J03.020131.Appraisal Findings. 270
Maximum Use of Existing Runway
9.3.6 In this scenario Stansted is assumed to continue to operate the types of services it does
currently: principally low cost services, domestic and short haul scheduled services and some
charter services. The runway capacity, which is assumed to grow to 259,000 ATMs by 2011,
dominates the forecasts. The forecast passenger throughput is limited to around 23 mppa by
2015 and 26 mppa by 2030. Passengers on scheduled services are forecast to increase from 4
mppa in 2000 to 16 mppa by 2015 and 20 mppa in 2030. Passengers on low cost services are
forecast to increase from 8 mppa in 2000 to 10 mppa in 2005 but then begin to decline as
scheduled services take an increasing share of the available capacity.
Option 5: One New Runway
9.3.7 From 2011, with the additional runway and terminal capacity and an assumed airline or
alliance’s willingness to relocate, a very different set of passenger and ATM forecasts result.
The available runway capacity is fully utilised from 2014 and the number of passengers at
Stansted is forecast to exceed 50 mppa in each year from 2012. Most of these passengers are
on scheduled services, with short haul, USA and long haul services all registering large
increases in volume. The number of passengers, constrained by lack of runway capacity, only
reaches 74 mppa by 2030.
9.3.8 The number of I to I interliners is forecast to be 20 mppa in 2015 and 24 mppa by 2030. The
number of low cost passengers declines from 2015 onwards. Stansted remains predominantly
an airport for leisure passengers, who account for 74% of trips to/from the UK via Stansted in
2000, 70% in 2015 and 59% in 2030. Leaving aside I to I interliners, 90% of those making trips
to/from the UK via Stansted in 2000, 87% in 2015 and 92% in 2030 are travelling to/from
London, the East and South East regions.
The Effects of Seeding
9.3.9 The seeding of long haul and US services as a new runway is built at Stansted in 2011 gives a
frequency of 62,000 ATMs attracting passenger demand of 17mppa (an average of over 250
passengers per ATM), with services strengthening the following year so that 70,000 ATMs are
forecast. Without seeding, short haul schedule services take up the capacity that is available in
the absence of long haul services, with short haul passengers making up 75% of the total
throughput in 2030, compared with 46% with seeding. The average number of passengers per
PATM in the seeded run is 151 in 2030, in the unseeded run this figure is 127.
Option 11: Two New Runways
9.3.10 In the modelling, the second runway has been assumed to come on stream in 2021. The new
runway capacity fills up in its first year. The capacity of two runways (Option 5) had been used
up in 2015 so there may be a case for introducing the third runway earlier than 2021. (NB: In

SERAS Stage Two: Appraisal Findings Report
FL1124000.RCE.RP.J03.020131.Appraisal Findings. 271
the modelling of the four runway option (Option 7), this third runway is assumed to open in 2018
and its capacity is fully used in 2018.)
9.3.11 The new runway in 2021 allows an increase of 25 mppa over the 2020 forecast, from 68 mppa
in 2020 to 93 mppa in 2021. Thereafter, because of the runway constraint, there is only limited
passenger growth, to 98 mppa in 2030. This is 24 mppa more than the two runway Option 5
allowed. I to I interliners account for an additional 6 mppa, there are an additional 12 mppa
leisure trips to/from the UK and an additional 5 mppa business trips. So, in 2030, setting I to I
interliners aside, there are 41 mppa leisure trips and 25 mppa business trips to/from the UK via
Stansted, i.e., leisure trips are 62% of total passengers in 2030 as opposed to 60% with Option
5. 92% of Stansted passengers in 2030 are from London, the East and South East regions.
Option 7: Three New Runways
9.3.12 As explained above, in the modelling of this option the third runway is assumed to be introduced
in 2018 and its capacity is fully utilised from its introduction. The fourth runway is assumed to
be introduced in 2024 and again its capacity is fully utilised from its introduction. In 2030,
scheduled services account for 619,000 ATMs (83% of the total), with around 410,000 short
haul ATMs, 100,000 long haul and 75,000 USA ATMs. There are 36,000 domestic ATMs. Low
cost ATMs are 113,000 (15% of the total) and charter are the remaining 2%.
9.3.13 This Option allows 24 mppa more than the three runway Option 11 in 2030 (122 mppa
compared with 98 mppa). Of these, 7 mppa are I to I interliners (36 mppa in total in 2030), 13
mppa are leisure passengers and 4 mppa are business passengers. By 2030, setting aside I to
I interliners, this four runway option is serving 54 mppa leisure trips and 29 mppa business trips,
i.e., leisure trips have increased to 65% of the total. Passengers to/from London, the East and
South East regions are 91% of the total, excluding I to I interliners.
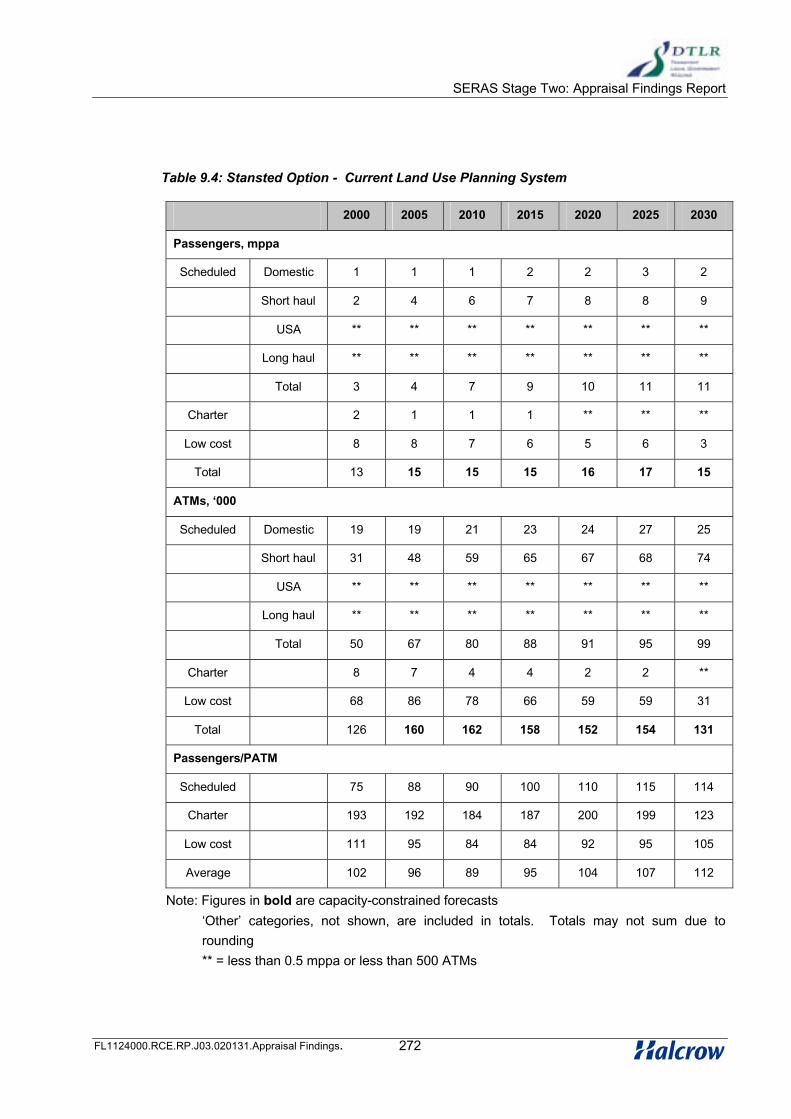
SERAS Stage Two: Appraisal Findings Report
FL1124000.RCE.RP.J03.020131.Appraisal Findings. 272
Table 9.4: Stansted Option - Current Land Use Planning System
2000 2005 2010 2015 2020 2025 2030
Passengers, mppa
Scheduled Domestic 1 1 1 2 2 3 2
Short haul 2 4 6 7 8 8 9
USA ** ** ** ** ** ** **
Long haul ** ** ** ** ** ** **
Total 3 4 7 9 10 11 11
Charter 2 1 1 1 ** ** **
Low cost 8 8 7 6 5 6 3
Total 13 15 15 15 16 17 15
ATMs, ‘000
Scheduled Domestic 19 19 21 23 24 27 25
Short haul 31 48 59 65 67 68 74
USA ** ** ** ** ** ** **
Long haul ** ** ** ** ** ** **
Total 50 67 80 88 91 95 99
Charter 8 7 4 4 2 2 **
Low cost 68 86 78 66 59 59 31
Total 126 160 162 158 152 154 131
Passengers/PATM
Scheduled 75 88 90 100 110 115 114
Charter 193 192 184 187 200 199 123
Low cost 111 95 84 84 92 95 105
Average 102 96 89 95 104 107 112
Note: Figures in bold are capacity-constrained forecasts
‘Other’ categories, not shown, are included in totals. Totals may not sum due to
rounding
** = less than 0.5 mppa or less than 500 ATMs
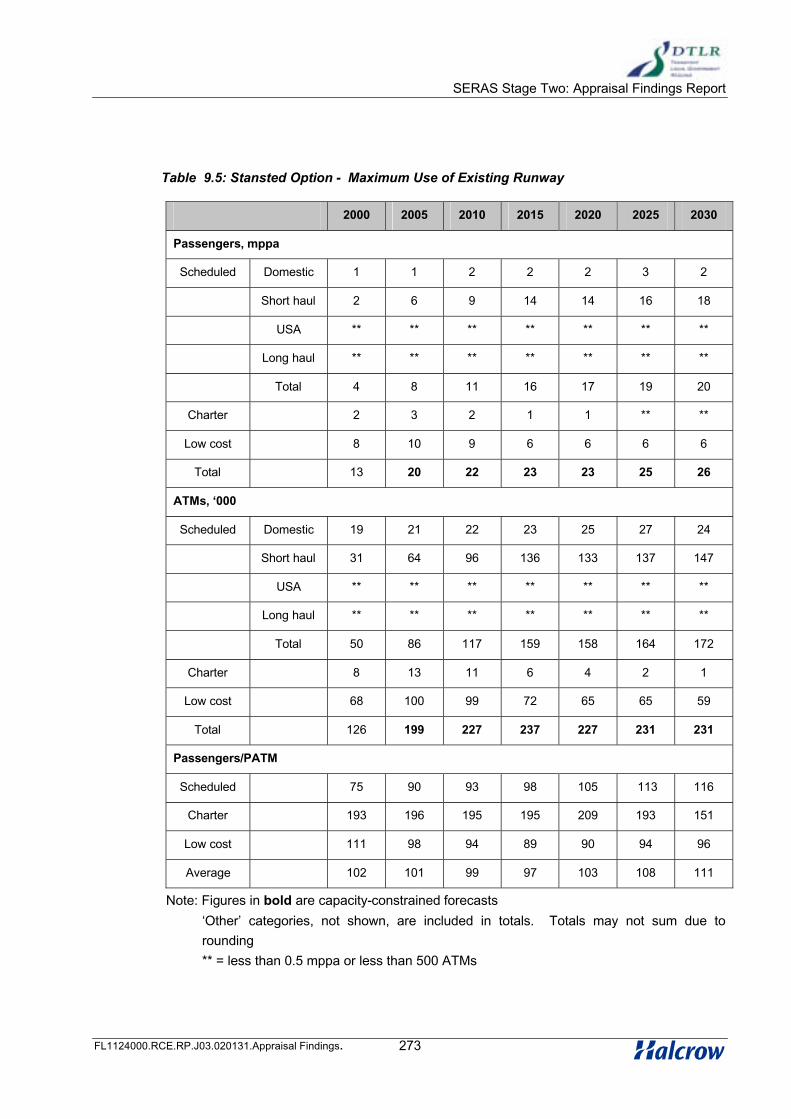
SERAS Stage Two: Appraisal Findings Report
FL1124000.RCE.RP.J03.020131.Appraisal Findings. 273
Table 9.5: Stansted Option - Maximum Use of Existing Runway
2000 2005 2010 2015 2020 2025 2030
Passengers, mppa
Scheduled Domestic 1 1 2 2 2 3 2
Short haul 2 6 9 14 14 16 18
USA ** ** ** ** ** ** **
Long haul ** ** ** ** ** ** **
Total 4 8 11 16 17 19 20
Charter 2 3 2 1 1 ** **
Low cost 8 10 9 6 6 6 6
Total 13 20 22 23 23 25 26
ATMs, ‘000
Scheduled Domestic 19 21 22 23 25 27 24
Short haul 31 64 96 136 133 137 147
USA ** ** ** ** ** ** **
Long haul ** ** ** ** ** ** **
Total 50 86 117 159 158 164 172
Charter 8 13 11 6 4 2 1
Low cost 68 100 99 72 65 65 59
Total 126 199 227 237 227 231 231
Passengers/PATM
Scheduled 75 90 93 98 105 113 116
Charter 193 196 195 195 209 193 151
Low cost 111 98 94 89 90 94 96
Average 102 101 99 97 103 108 111
Note: Figures in bold are capacity-constrained forecasts
‘Other’ categories, not shown, are included in totals. Totals may not sum due to
rounding
** = less than 0.5 mppa or less than 500 ATMs

SERAS Stage Two: Appraisal Findings Report
FL1124000.RCE.RP.J03.020131.Appraisal Findings. 274
Table 9.6 Stansted Option 5 - New Runway to South of Existing Runway
2000 2005 2010 2015 2020 2025 2030
Passengers, mppa
Scheduled Domestic 1 1 2 2 2 2 2
Short haul 2 6 9 25 30 33 34
USA ** ** ** 12 14 15 15
Long haul ** ** ** 12 14 15 16
Total 4 8 11 51 61 65 68
Charter 2 3 2 2 1 ** **
Low cost 8 10 9 11 7 7 6
Total 13 20 22 64 69 72 74
ATMs, ‘000
Scheduled Domestic 19 21 22 32 29 27 27
Short haul 31 64 96 235 269 276 279
USA ** ** ** 44 48 51 54
Long haul ** ** ** 54 62 64 67
Total 50 86 117 364 407 418 428
Charter 8 13 11 9 5 1 **
Low cost 68 100 99 120 76 68 65
Total 126 199 227 493 488 488 492
Passengers/PATM
Scheduled 75 90 93 140 149 155 159
Charter 193 196 195 201 204 202 151
Low cost 111 98 94 95 96 96 96
Average 102 101 99 130 141 147 151
Note: Figures in bold are capacity-constrained forecasts
‘Other’ categories, not shown, are included in totals. Totals may not sum due to rounding
** = less than 0.5 mppa or less than 500 ATMs

SERAS Stage Two: Appraisal Findings Report
FL1124000.RCE.RP.J03.020131.Appraisal Findings. 275
Table 9.7: Stansted Option 11 - Two New Runways
2000 2005 2010 2015 2020 2025 2030
Passengers, mppa
Scheduled Domestic 1 1 2 2 2 2 3
Short haul 2 6 9 25 30 43 47
USA ** ** ** 12 14 18 19
Long haul ** ** ** 12 14 18 19
Total 4 8 11 51 60 82 88
Charter 2 3 2 2 1 2 1
Low cost 8 10 9 11 7 10 8
Total 13 20 22 64 68 94 98
ATMs, ‘000
Scheduled Domestic 19 21 22 32 28 31 29
Short haul 31 64 96 233 266 346 364
USA ** ** ** 44 48 62 65
Long haul ** ** ** 55 61 74 78
Total 50 86 117 364 404 513 537
Charter 8 13 11 9 5 10 7
Low cost 68 100 99 120 74 96 81
Total 126 199 227 492 482 619 624
Passengers/PATM
Scheduled 75 90 93 141 148 160 164
Charter 193 196 195 201 204 197 205
Low cost 111 98 94 94 97 106 102
Average 102 101 99 131 141 152 157
Note: Figures in bold are capacity-constrained forecasts
‘Other’ categories, not shown, are included in totals. Totals may not sum due to rounding
** = less than 0.5 mppa or less than 500 ATMs
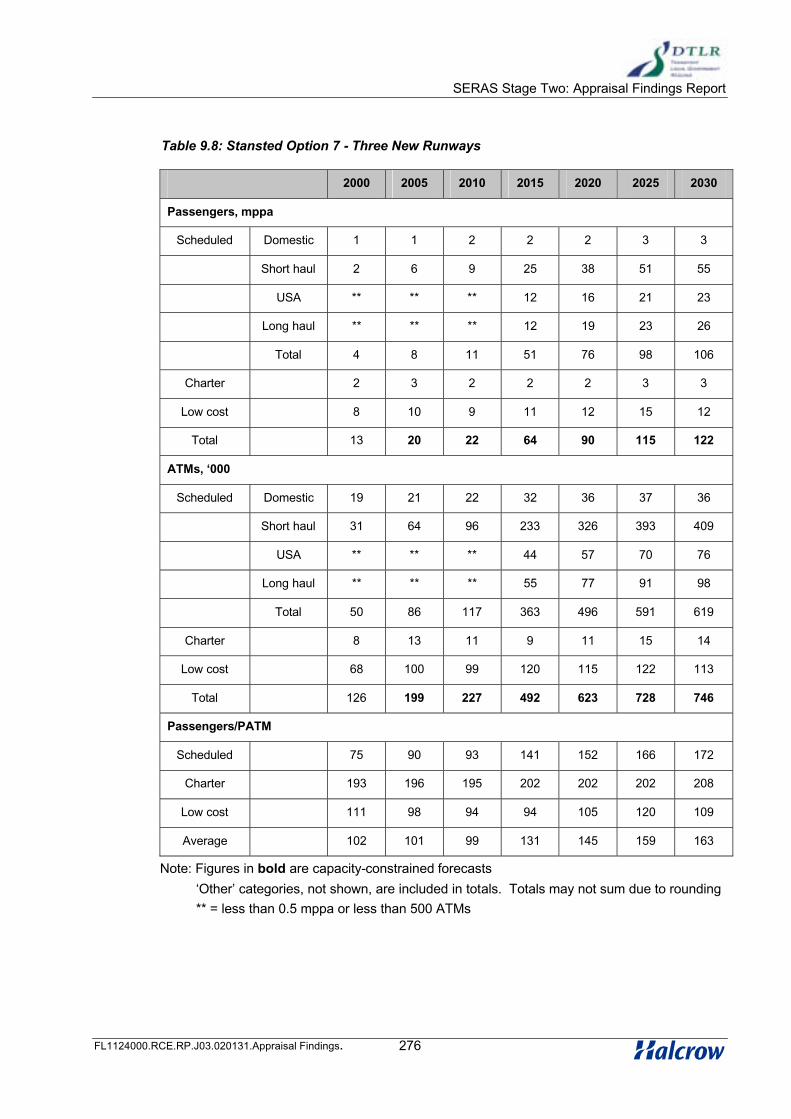
SERAS Stage Two: Appraisal Findings Report
FL1124000.RCE.RP.J03.020131.Appraisal Findings. 276
Table 9.8: Stansted Option 7 - Three New Runways
2000 2005 2010 2015 2020 2025 2030
Passengers, mppa
Scheduled Domestic 1 1 2 2 2 3 3
Short haul 2 6 9 25 38 51 55
USA ** ** ** 12 16 21 23
Long haul ** ** ** 12 19 23 26
Total 4 8 11 51 76 98 106
Charter 2 3 2 2 2 3 3
Low cost 8 10 9 11 12 15 12
Total 13 20 22 64 90 115 122
ATMs, ‘000
Scheduled Domestic 19 21 22 32 36 37 36
Short haul 31 64 96 233 326 393 409
USA ** ** ** 44 57 70 76
Long haul ** ** ** 55 77 91 98
Total 50 86 117 363 496 591 619
Charter 8 13 11 9 11 15 14
Low cost 68 100 99 120 115 122 113
Total 126 199 227 492 623 728 746
Passengers/PATM
Scheduled 75 90 93 141 152 166 172
Charter 193 196 195 202 202 202 208
Low cost 111 98 94 94 105 120 109
Average 102 101 99 131 145 159 163
Note: Figures in bold are capacity-constrained forecasts
‘Other’ categories, not shown, are included in totals. Totals may not sum due to rounding
** = less than 0.5 mppa or less than 500 ATMs

SERAS Stage Two: Appraisal Findings Report
FL1124000.RCE.RP.J03.020131.Appraisal Findings. 277
9.4 Safety Risk
9.4.1 The Stage Two assessment of safety risk appraises the third party risk associated with both
existing and new runway options. The full extent of the 1;10,000 and 1:100,000 designated risk
areas are shown on the following. The runway end origins of the 1:1,000,000 contours are also
shown but extend beyond the limits of the drawings:
• Figure 9.8 – Maximum use of existing runways option
• Figure 9.9 – Option 5, New full-length runway 2450m to the east of the existing,
staggered to the north and operating in mixed mode
• Figure 9.11 – Option 11, Further new full-length runway creating a new close
parallel dependent pair.
• Figure 9.10 – Option 7, Adds a fourth full-length close parallel runway to the three
in Option 11.
1:10,000 Risk Contours
9.4.2 The impact of the 1:10,000 risk contours are shown in Table 9.9 below:
Table 9.9: 1:10,000 Risk Contours
Impact Max Use Option 5 Option 11 Option 7
Increase in Area (ha) above Max
Use (South West and North
East)
SW 6.9
NE 6.6
SW +6.9
NE +6.5
SW +10.2
NE +9.7
SW +13.4
NE +12.7
Properties within contour
(outside airport boundary) above
Max Use
None None None 4
% developed area affected,
(outside airport boundary) above
Max Use
0 0 0 0
9.4.3 The 1:10,000 contour in each of the options falls almost entirely within the airport boundary and
consequently has no impact on surrounding population, commercial areas or other prominent
features. Where it does extend beyond the airport boundary the area is predominantly rural.

SERAS Stage Two: Appraisal Findings Report
FL1124000.RCE.RP.J03.020131.Appraisal Findings. 278
1:100,000 Risk Contours
9.4.4 The impact of the 1:100,000 risk contour is shown in Table 9.10 below
Table 9.10: 1:100,000 Risk Contours
Impact (beyond 1:10,000
contour)Max Use Option 5 Option 11 Option 7
Increase in Area (ha) above Max
Use (South West and North
East)
SW 77.2
NE 73.9
SW +68.6
NE +64.8
SW +101.8
NE +96.41
SW +133.7
NE +126.8
Increase in Population affected
above Max Use1 + 254 + 320 + 1,273
% developed area affected,
(outside airport boundary) above
Max Use
NE 0
SW <1
NE 0
SW 0
New NE <1
NewSW<5
NE 0
SW 0
New NE <1
New SW<5
NE 0
SW 0
New NE<1
New SW<5
Other prominent features
affected above Max UseNone
NE- Tilty &
Dalton Hall
SW- Village of
Brewers End
and SAM
As Option 5
plus school
and public
house
As Option 7
9.4.5 The area is predominantly rural with scattered residential properties and farms. The higher
capacity options extend over small villages with associated higher risk. The impact on
communities and commercial activities is minimal.
1:1,000,000 Risk Contour
9.4.6 The impacts of the 1:1,000,000 risk contours are shown in Table 9.11

SERAS Stage Two: Appraisal Findings Report
FL1124000.RCE.RP.J03.020131.Appraisal Findings. 279
Table 9.11: 1:1,000,000 Risk Contours
Impact (beyond 1:100,000
contour)Max Use Option 5 Option 11 Option 7
Increase in Area (ha) above Max
Use (South West and North East)
SW 702.5
NE 668.3
SW +680.8
NE +647.6
SW +1013.1
NE +963.8
SW +1322.1
NE +1267.2
% developed area affected above
Max Use
SW <5
NE <5
SW 0
NE 0
New SW + <5
New NE rural
SW 0
NE -<5
New SW rural
New NE rural
SW 0
NE 0
New SW + <5
New NE rural
Prominent features affected at Max Use:
• South west – M11, 1 church
• North east – 2 churches
Prominent features affected above Max Use:
• Option 5: South west – 2 churches, school; North east – Abbey remains
• Option 11: South west – M11 J8; North east – 1 church
• Option 7: South west – None; North east – None
9.5 Surface Access
Infrastructure and service assumptions - roads
9.5.1 For the purposes of surface access demand forecasting, the changes to the existing road
access arrangements were based on the findings of Stage One appraisals. This helped define a
number of schemes associated with each option, as summarised in Table 9.12 and shown in
Figure 9.16. No changes to the Reference Case road access arrangements are assumed for
the appraisal of options with capacities limited to that incorporated in the Current Land Use
Planning System and the Maximum Use of the Existing Runway.
9.5.2 Options 5, 7 and 11 each involves extension of the existing Airport Access Road, and in each
case this been assumed to be linked, from a point near Tilty, via new links to the M11 north
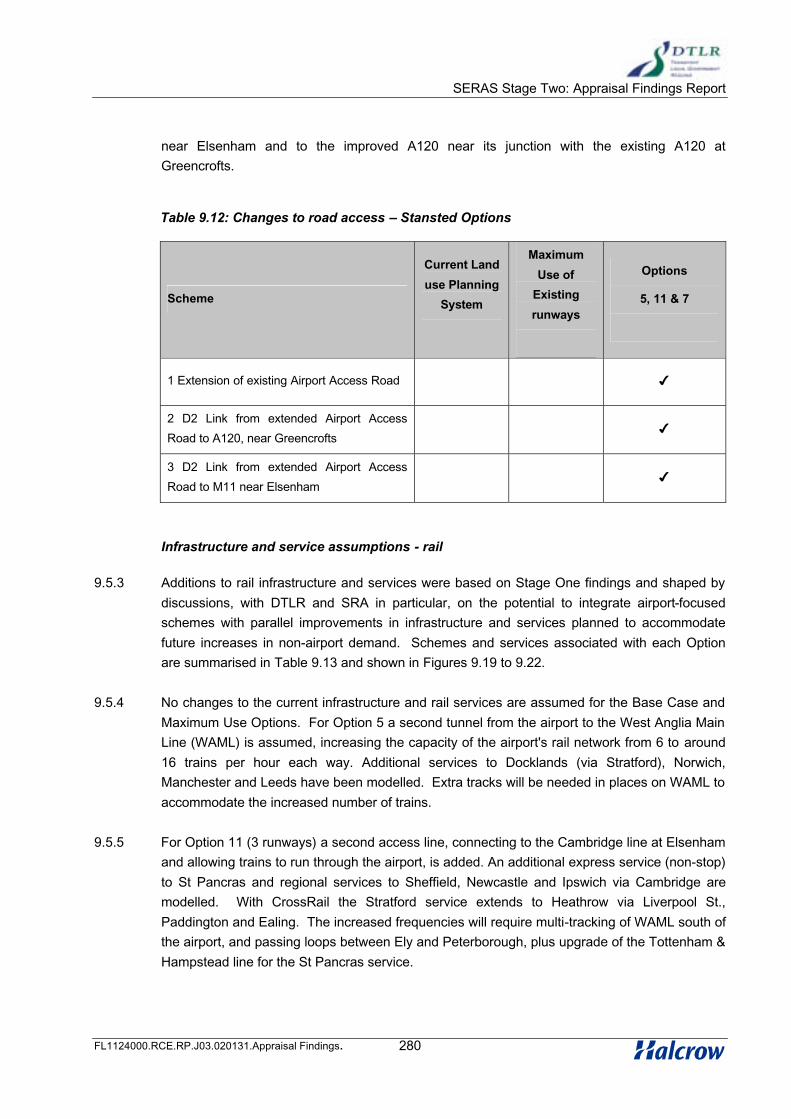
SERAS Stage Two: Appraisal Findings Report
FL1124000.RCE.RP.J03.020131.Appraisal Findings. 280
near Elsenham and to the improved A120 near its junction with the existing A120 at
Greencrofts.
Table 9.12: Changes to road access – Stansted Options
Scheme
Current Land
use Planning
System
Maximum
Use of
Existing
runways
Options
5, 11 & 7
1 Extension of existing Airport Access Road !
2 D2 Link from extended Airport Access
Road to A120, near Greencrofts!
3 D2 Link from extended Airport Access
Road to M11 near Elsenham!
Infrastructure and service assumptions - rail
9.5.3 Additions to rail infrastructure and services were based on Stage One findings and shaped by
discussions, with DTLR and SRA in particular, on the potential to integrate airport-focused
schemes with parallel improvements in infrastructure and services planned to accommodate
future increases in non-airport demand. Schemes and services associated with each Option
are summarised in Table 9.13 and shown in Figures 9.19 to 9.22.
9.5.4 No changes to the current infrastructure and rail services are assumed for the Base Case and
Maximum Use Options. For Option 5 a second tunnel from the airport to the West Anglia Main
Line (WAML) is assumed, increasing the capacity of the airport's rail network from 6 to around
16 trains per hour each way. Additional services to Docklands (via Stratford), Norwich,
Manchester and Leeds have been modelled. Extra tracks will be needed in places on WAML to
accommodate the increased number of trains.
9.5.5 For Option 11 (3 runways) a second access line, connecting to the Cambridge line at Elsenham
and allowing trains to run through the airport, is added. An additional express service (non-stop)
to St Pancras and regional services to Sheffield, Newcastle and Ipswich via Cambridge are
modelled. With CrossRail the Stratford service extends to Heathrow via Liverpool St.,
Paddington and Ealing. The increased frequencies will require multi-tracking of WAML south of
the airport, and passing loops between Ely and Peterborough, plus upgrade of the Tottenham &
Hampstead line for the St Pancras service.
SERAS Stage Two: Appraisal Findings Report
FL1124000.RCE.RP.J03.020131.Appraisal Findings. 281
9.5.6 With 4 runways (Option 7) reinstatement of part of the Bishop’s Stortford-Braintree line is
assumed, together with an upgrade of the Braintree-Witham branch. The Ipswich service
diverts via Braintree and Colchester, extending to Norwich, and a service via Braintree to
Chelmsford, Romford and Liverpool Street.
Accessibility Analysis
9.5.7 The results of the catchment area analyses are summarised in the Appraisal Summary Tables
under the heading “Accessibility” and shown in Figures 9.12 to 9.15. Public transport
catchments increase substantially between the Maximum Use option and Options 5, 11 and 7
(air passengers within one hour’s overall journey time increasing from 1 to 2.3 million pa, and
resident workforce increasing from 0.1 to 0.2 million), reflecting the improvements in rail
accessibility. Stansted’s better accessibility by road is reflected in its larger catchments (around
33 million air passengers pa, and 2.3 million potential workers within one hour’s travel time).
Catchments by road are similar between options.
9.5.8 The accessibility of options to the air passenger market in Central London is of particular
interest and is summarised for Stansted options in Table 9.14. It should be noted that the public
transport travel times quoted in this table exclude walking access and egress, and waiting times
– they therefore indicate minimum travel times.
9.5.9 With the services assumed for the Maximum Use of Existing Runways (Package 2), Stansted
has poor public transport accessibility relative to other existing airports – of the main line termini
only Liverpool Street is served direct, the others lying between 50 and 60 minutes travel time of
the airport with interchange. Table 9.14 illustrates the effect of the new rail services added in
Options 11 and 7.

SERAS Stage Two: Appraisal Findings Report
FL1124000.RCE.RP.J03.020131.Appraisal Findings. 282
Table 9.13: Changes to rail access –Stansted Options
Infrastructure Services
Maximum Use
of Existing
runways
Option 5
(2 wide spaced
runways)
Option 11
( 3 runways)
Option 7
(2 pair close
parallel
runways)
2nd tunnel to Cambridge line,
passing loops between Harlow and
Tottenham Hale
2nd Express service, to Tottenham Hale and Stratford
services north to: Manchester via Birmingham, Manchester via
Nottingham, Leeds and Norwich
! ! !
Extend Ipswich-Cambridge service to airport !
Upgrade Tottenham & Hampstead
line S. Tottenham to Kentish Town,
3-4 tracks between Stansted
Mountfitchet and Tottenham Hale
3rd Express service, non-stop to St Pancras ! !
CrossRail Extend Stratford service to Heathrow via central London, Ealing ! !
2nd access line to airport (from
Elsenham), (freight) passing loops
between Ely and Peterborough
InterCity service to Newcastle
Regional service to Sheffield via Nottingham, Derby! !

SERAS Stage Two: Appraisal Findings Report
FL1124000.RCE.RP.J03.020131.Appraisal Findings. 283
Infrastructure Services
Maximum Use
of Existing
runways
Option 5
(2 wide spaced
runways)
Option 11
( 3 runways)
Option 7
(2 pair close
parallel
runways)
Re-instate Bishop’s Stortford-
Braintree line between airport and
Braintree, upgrade Braintree
branch
Services to Norwich via Colchester and Ipswich, Liverpool
Street via Chelmsford and Romford!

SERAS Stage Two: Appraisal Findings Report
FL1124000.RCE.RP.J03.020131.Appraisal Findings. 284
Table 9.14: Accessibility from Central London – Stansted options.
Maximum Use Option 5 Option 11 Option 7
By Car, minutes
Liverpool Street 54 54 54 54
St Pancras/Kings
Cross/Euston61 61 61 61
Marylebone/Paddington 68 68 68 68
By Public Transport, tph
in minutes
Liverpool Street 4 tph in 44 4 tph in 404tph in 39
4tph in 42As Option 11
St Pancras/Kings Cross Interchange
required
Interchange
required4 tph in 40 As Option 11
PaddingtonInterchange
required
Interchange
required4 tph in 52 As Option 11
9.5.10 The main indicators of surface access demand in 2015 for each option at Stansted are
summarised in Tables 9.15 and 9.16. Corresponding results for the forecast year 2030 are
presented in Tables 9.17 and 9.18.
9.5.11 Air passenger capacity and demand estimates have been described above. Note that the
proportion of interlining passengers varies substantially between options and between years –
reflecting the different function that the airport provides in the packages from which these
estimates were derived.
9.5.12 The forecast number of on-site employees in 2015 is reported in Tables 9.15 and 9.17 and is
assumed to be a function of overall passenger demand and changes in productivity – note the
reduction in employees between 2015 and 2030 for the Maximum Use scenario and Option 5.
(Further details of the employment forecasts can be found in Section 9.10.)
9.5.13 In 2015, the number of peak hour employee-related car trips is estimated to increase by almost
80% between Packages 1 and 2 and to more than treble in Option 5, reflecting the increases in
total employment and a small shift towards public transport in Option 5. The share of employee
trips forecast to be made by public transport is very small, at 5% even in Option 5. Table 9.17

SERAS Stage Two: Appraisal Findings Report
FL1124000.RCE.RP.J03.020131.Appraisal Findings. 285
shows that the number of car trips is expected to reduce by 2030 as a result of the assumed
productivity gains.
9.5.14 Tables 9.16 and 9.18 summarise the air passenger mode split results for each option in 2015
and 2030 respectively. In 2015, Table 9.16 indicates a fluctuation from 39.3% by public
transport with the airport as defined in the current land use planning system decreasing to
34.8% with maximum use of the runway and increasing to 37.0% in Option 5. These results are
influenced by the mixture of passengers by type and their geographical distribution, but indicate
the limited success in increasing public transport’s share of Stansted’s traffic by means of
improved services alone. In 2030, public transport’s mode share increases in the Maximum
Use Scenario and Option 5 to around 40% (compared with 35-37% in 2015), with further
increases to around 46 % for Options 7 and 11. Note the very large increases in public transport
demand – doubling, trebling and quadrupling in Options 5, 11 and 7 when compared to the
Maximum Use scenario.
9.5.15 Finally, it is worth noting the changes in overall peak hour road traffic demand generated by
these options, (see Tables 9.16 and 9.18). Table 9.16 shows increases over the current land
use system of around 70% with maximum use of the runway and more than three-fold for
Option 5. By 2030, the overall road traffic demand generated by Stansted is estimated to
decrease in the Maximum Use scenario by around 10% (from 4,100 to 3,750 vehs per hour, 2-
way). Options 5, 11 and 7 are estimated to generate substantially more road traffic, with the
number of trips compared with the Maximum Use Scenario respectively doubling, trebling and
increasing by a factor of 3.5.
Table 9.15: Main indicators and employee mode shares – Stansted 2015.
Main Indicators
Current Land
Use Planning
System
Maximum Use of
Existing Runway
Option 5 –
wide spaced
Total capacity (mppa) 15 35 82
Total passengers requiring surface access
(mppa)13.4 22.0 37.5
Total employees on-site 6,700 13,100 39,200
Employees’ Highway trips (AM peak
hour): vehicles
Origin 118 209 394
Destination 639 1133 2136
Total 757 1342 2530

SERAS Stage Two: Appraisal Findings Report
FL1124000.RCE.RP.J03.020131.Appraisal Findings. 286
Main Indicators
Current Land
Use Planning
System
Maximum Use of
Existing Runway
Option 5 –
wide spaced
Employees’ Public Transport trips (AM
peak hour): persons
Origin 4 7 21
Destination 20 35 113
Total 24 42 134
% Public Transport trips
Origin 3% 3% 5%
Destination 3% 3% 5%
Total 3% 3% 5%
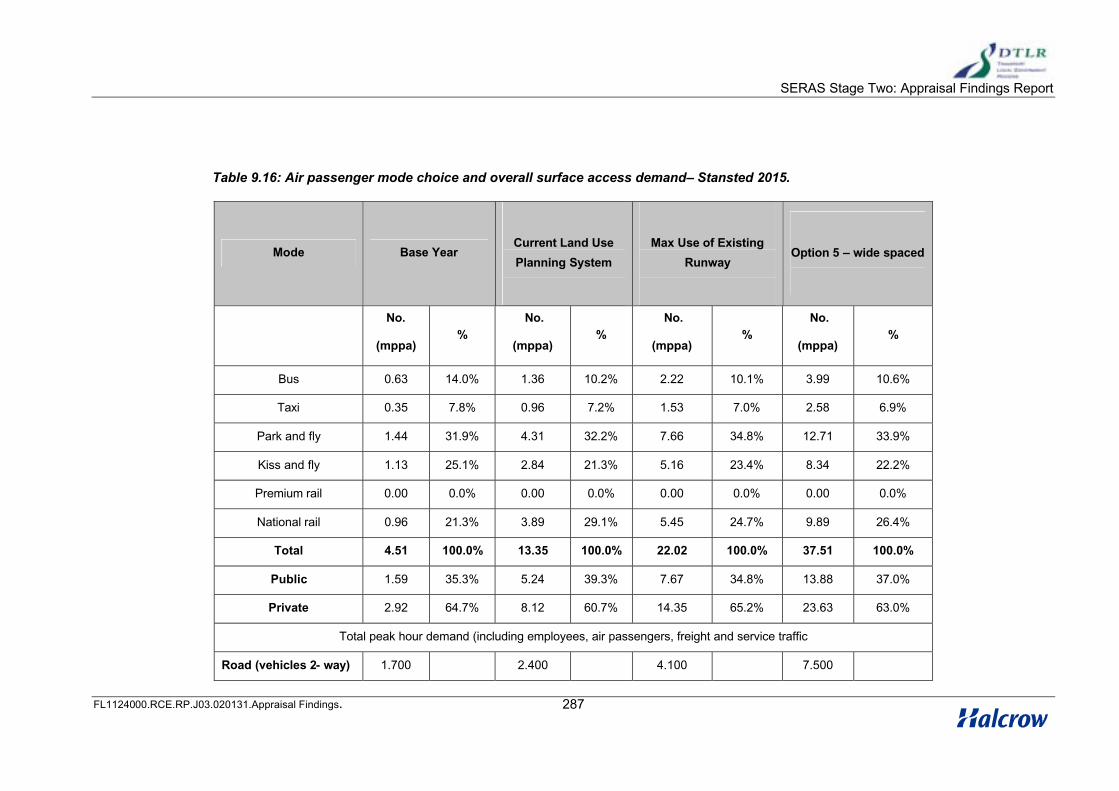
SERAS Stage Two: Appraisal Findings Report
FL1124000.RCE.RP.J03.020131.Appraisal Findings. 287
Table 9.16: Air passenger mode choice and overall surface access demand– Stansted 2015.
Mode Base YearCurrent Land Use
Planning System
Max Use of Existing
RunwayOption 5 – wide spaced
No.
(mppa)%
No.
(mppa)%
No.
(mppa)%
No.
(mppa)%
Bus 0.63 14.0% 1.36 10.2% 2.22 10.1% 3.99 10.6%
Taxi 0.35 7.8% 0.96 7.2% 1.53 7.0% 2.58 6.9%
Park and fly 1.44 31.9% 4.31 32.2% 7.66 34.8% 12.71 33.9%
Kiss and fly 1.13 25.1% 2.84 21.3% 5.16 23.4% 8.34 22.2%
Premium rail 0.00 0.0% 0.00 0.0% 0.00 0.0% 0.00 0.0%
National rail 0.96 21.3% 3.89 29.1% 5.45 24.7% 9.89 26.4%
Total 4.51 100.0% 13.35 100.0% 22.02 100.0% 37.51 100.0%
Public 1.59 35.3% 5.24 39.3% 7.67 34.8% 13.88 37.0%
Private 2.92 64.7% 8.12 60.7% 14.35 65.2% 23.63 63.0%
Total peak hour demand (including employees, air passengers, freight and service traffic
Road (vehicles 2- way) 1.700 2.400 4.100 7.500

SERAS Stage Two: Appraisal Findings Report
FL1124000.RCE.RP.J03.020131.Appraisal Findings. 288
Table 9.17: Main indicators and employee mode shares – Stansted 2030.
Main Indicators
Maximum
Use of
Existing
Runways
Option 5 Option 11 Option 7
Total capacity (mppa) 35 82 102 129
Total passengers requiring surface access
(mppa)23.2 46.0
69.582.7
Total employees on-site 12,000 37,100 48,500 60,800
Highway trips (average AM peak hour):
vehicles
Origin 154 372 546 650
Destination 832 2017 2953 3538
Total 986 2389 3499 4188
Public Transport trips (average AM peak
hour): persons
Origin 7 19 29 33
Destination 37 105 151 176
Total 44 124 180 209
% Public Transport trips
Origin 4% 5% 5% 5%
Destination 4% 5% 5% 4%
Total 4% 5% 5% 4%
Table 9.18: Air passenger mode choice and overall surface access demand – Stansted 2030.
Mode Base Year
Maximum Use of
Existing Runways Option 5 Option 11 Option 7

SERAS Stage Two: Appraisal Findings Report
FL1124000.RCE.RP.J03.020131.Appraisal Findings. 289
Mode Base Year
Maximum Use of
Existing Runways Option 5 Option 11 Option 7
No.
(mppa)%
No.
(mppa)%
No.
(mppa)%
No.
(mppa)
% No.
(mppa)%
Underground 0.00 0.0% 0.00 0.0% 0.00 0.0% 0.00 0.0% 0.00 0.0%
Bus 0.63 14.0% 2.13 10.0% 4.77 10.9% 7.67 11.4% 9.30 11.5%
Taxi 0.35 7.8% 1.66 7.8% 2.99 6.8% 4.36 6.5% 5.17 6.4%
Park and fly 1.44 31.9% 6.84 32.0% 13.93 31.8% 19.72 29.2% 23.63 29.3%
Kiss and fly 1.13 25.1% 4.47 20.9% 8.75 19.9% 12.34 18.3% 14.84 18.4%
Premium rail 0.00 0.0% 0.00 0.0% 0.00 0.0% 0.00 0.0% 0.00 0.0%
National rail 0.96 21.3% 6.26 29.3% 13.42 30.6% 23.34 34.6% 27.63 34.3%
Total 4.51 100.0% 21.37 100.0% 43.86 100.0% 67.44 100.0% 80.57 100.0%
Public 1.59 35.3% 8.39 39.3% 18.19 41.5% 31.02 46.0% 36.93 45.8%
Private 2.92 64.7% 12.98 60.7% 25.67 58.5% 36.42 54.0% 43.64 54.2%
Total peak hour demand including employees, air passengers, freight and service traffic.
Road
(vehicles
2-way)
1,700 3,750 7,850 11,300 13,300
Highway appraisal results - Stansted
9.5.16 The highway appraisal has identified a number of sections of the Motorway and Strategic Road
Network that are expected to be under stress - close to or beyond their capacities - in the
SERAS forecast years. These ‘Background Highway Requirements’ are illustrated in Figure
9.17 and 9.18. These problem links have been categorised into those where the potential
solution required to solve the problem in the Base Case would be adequate also to
accommodate the airport option under consideration, and those where an airport option would
require a further intervention, categorised here as an increase in capacity. By 2030, in the
vicinity of Stansted, the following sections of the network would be under stress:
• A10: Ware to A120
• A120: Braintree to Marks Tey and Bishop’s Stortford to A10

SERAS Stage Two: Appraisal Findings Report
FL1124000.RCE.RP.J03.020131.Appraisal Findings. 290
• M25: J15 to J29
9.5.17 The additional potential scheme improvements required by the airport options at Stansted are
summarised in Table 9.19, and illustrated in Figures 9.17 (for Option 5) and Figure 9.18 (for
Options 7 and 11).
Rail Network Performance – Stansted
9.5.18 With the existing service pattern at Stansted (assumed for the Base and Maximum Use options)
there are no airport related congestion issues. While Cambridge - London commuter services
are forecast to be crowded between Cheshunt and Tottenham Hale, very few airport trips are
assigned to these services (0.1% of traffic). Rather, commuters are forecast to make increasing
use of the fast and frequent dedicated airport express services, using Stansted Airport as a rail-
head. The airport express service has a peak load factor of 63% in the Base Case (with only
35% of traffic airport-related) and 72% in the Maximum Use scenario (43% airport-related).
9.5.19 More than 50% of these airport trips are predicted to interchange at Tottenham Hale with the
Victoria Line, which is forecast to be at capacity in the peak hour south of Seven Sisters and
extremely crowded south of Finsbury Park by 2015. Airport trips do not contribute greatly to this
crowding (less than 2% of traffic south of Finsbury Park), but will experience uncomfortable
travel.
9.5.20 In Option 5 an additional Airport Express, to Stratford for Docklands, has been modelled.
Calling at both Bishop’s Stortford and Tottenham Hale, the new service diverts a significant
number of commuters from the Cambridge - Liverpool St. services (eliminating crowding on this
line), as well as attracting 50% of airport-related rail trips between the airport and London,
giving a peak load factor of 80%. However, 2/3 of airport trips are projected to continue to
interchange at Tottenham Hale, rather than Liverpool St or Stratford, increasing crowding on the
Victoria Line compared to the Base, with nearly 4% of traffic departing Tottenham Hale being
airport-related.
9.5.21 For Option 11 a further, non-stop, express service to St Pancras has been assumed, and the
Stratford service extends into the CrossRail tunnel. Total demand assigned to the three airport
express services is comfortably within their capacity. The assignment results, however,
suggest that the stopping patterns assumed will need to be amended: the St Pancras service
has a load factor of only 32%, but demand exceeds seating capacity on the CrossRail service
south of Bishop’s Stortford and exceeds design capacity south of Tottenham Hale. These two
new services do, however, give some relief to the Victoria Line, on which passenger numbers
are lower than in the base (Max Use) option even though airport-related demand is almost
300% higher.

SERAS Stage Two: Appraisal Findings Report
FL1124000.RCE.RP.J03.020131.Appraisal Findings. 291
Table 9.19: Highway capacity problems and potential schemes - Stansted
Description InitialStandard
Potential standard required by:
2015 2030
CurrentLand Use PlanningSystem
Max Use of ExistingRunways
Option 5Max Use of
ExistingRunways
Option 5 Option 11 Option 7
Airport Access
Airport Access Road Extension (proposed) n/a n/a D2 N/a D2 D2 D2
Airport Link to A120 East (proposed) n/a n/a D2 N/a D2 D2 D2
Airport Link to M11 (proposed) n/a n/a D2 N/a D2 D2 D2
Strategic Network
M11: J7 to J8 D3(M) D3(M) D3(M) D3(M) D3(M) D3(M) D3(M) D4(M)
M11: J6 to J7 D3(M) D3(M) D3(M) D3(M) D3(M) D3(M) D4(M) D4(M)
M25: J26 to J27 D3 (M) D3 (M) D3 (M) D4 (M) D4 (M) D4 (M) D4 (M) D4 (M)
A1184 Sawbridgeworth Trafficmanagement
Trafficmanagement

SERAS Stage Two: Appraisal Findings Report
FL1124000.RCE.RP.J03.020131.Appraisal Findings. 292
9.5.22 The same express services have been modelled with Option 7, for which demand is forecast to
be 20% higher. The CrossRail service is overcrowded south of Bishop’s Stortford, and also has
nearly 100% of seats occupied in the contra-peak direction, whereas the Liverpool Street and St
Pancras services are lightly loaded. As noted, altering the intermediate stops assumed for
these services would address this imbalance in train loading. The Victoria Line is also less
crowded than in the Base with this Option.
9.5.23 With most airport express services to London modelled and running non-stop between the
Airport and inner London, it should be noted that the two additional tracks needed for Option 11
and 7 need not follow the existing WAML alignment which winds through heavily developed low
lying land in the Lee Valley, but could follow a near alignment on which there are fewer adverse
land take and environmental impacts. This may be more feasible, and cheaper, than widening
and resignalling the existing rail corridor.
9.6 Environment: Land Take
Context
9.6.1 The environmental issues considered in Stage Two of SERAS builds on work undertaken in
Stage One on land use, ecology, heritage, landscape and townscape, water, noise and air
quality. Stage Two in addition appraises impacts on contamination and community issues. For
each of these environmental topics a baseline is defined and then the results of the appraisal of
each option is presented. Details of existing land uses and environmental features within the
study area are provided in Figures 9.23 to 9.26. Summaries of the key impacts of each option
are presented in the Appraisal Summary Table. Fuller details of the environmental appraisal
baseline data and appraisal of options can be found in the supporting report.
Existing Conditions
Land Use – residential, commercial/industrial, public buildings, recreation, agriculture, planning constraints (Figure 9.23)
9.6.2 The airport is situated in largely rural surroundings with nearby towns of Bishop’s Stortford,
Stansted Mountfitchet and Elsenham and villages of Molehill Green, Woodgates End and Brick
End. The predominant land use in the area is agriculture. The majority of this land is of Grade 2
agricultural land quality. There is also a nursery north of Molehill Green.
SERAS Stage Two: Appraisal Findings Report
FL1124000.RCE.RP.J03.020131.Appraisal Findings. 293
9.6.3 An area to the west of the site, and west of the M11, is designated as Green Belt. There is also
an area extending round most of the current airport which is classified as Stansted Airport
Countryside Protection Zone, the aims of which are to protect the land from new buildings and
uses which promote coalescence between the airport and existing development in the
surrounding countryside or which adversely affect the open characteristics of the zone. A
buffer strip within and adjacent to the existing airport perimeter has been designated as
Strategic Landscape Area and Open Space in which development is not normally permitted.
Contamination (Figure 9.23)
9.6.4 Fifty potential sources of contamination have been identified in the study area. Areas with
potential for ‘moderate’ scale of contamination comprise: a fuel depot, former aircraft
engineering works, sewage treatment works, a petrol station and sites of some recorded
pollution incidents.
Ecology (Figure 9.24)
9.6.5 There are six nationally designated sites (of high ecological value) within the vicinity of the
airport, as follows:
• Hatfield Forest is a National Nature Reserve (NNR) and Site of Special Scientific Interest (SSSI). The site comprises over 400ha of mixed ancient coppicewoodland, scrub, unimproved grassland chases and plains with ancient pollards and herb-rich grassland bordering a large lake.
• Eastend and Pledgdon Woods are part of Elsenham Wood SSSI. The sitesconsist of mosaic ancient woodland, and the coppice layers have ash, hazel, and field maple present.
• High Wood SSSI is approximately 4.5 km east. The site has ancient woodland, with the damp grassy rides providing habitat for numerous sedges, invertebrates and birds.
• Little Hallingbury Marsh and Thorley Flood Pound SSSIs are wet grassland and wetland sites close to the village of Spellbrook
• Two flooded gravel pits to the north of Ugley Green form another SSSI.
9.6.6 The following district-designated sites are located in the vicinity of the airport site:
• Seven ancient woodlands. There is a great deal of connectivity between thesites.
• Fourteen important woodlands. There is substantial connectivity between allwoodland sites in the area, due to their number and the length of hedgerows inthe area.

SERAS Stage Two: Appraisal Findings Report
FL1124000.RCE.RP.J03.020131.Appraisal Findings. 294
9.6.7 The following habitats in the vicinity of the airport are undesignated but considered to be of
district importance:
• The majority of arable fields to the north and east of the current airport boundary
are bordered by ancient and/or species-rich hedgerows, totalling approximately
4km in length. Such hedgerows are a BAP habitat within Essex and are
particularly important for butterflies and moths, the smaller farmland birds and
dormice, while hedgerow trees are an important habitat for the larger birds and
bats and dead wood invertebrates including stag beetles. Hedgerows are
important as wildlife corridors and act as a means of ecological connectivity
between woodland sites and other similar habitats: woodlands in the area around
Stansted airport are extremely well-connected due to this network of hedgerows.
These areas are not shown on the ecological constraints map. The hedgerows
are considered to be of at least low ecological value but when considered as a
network in combination with the woodlands, this value increases to medium.
• Cereal field margins are the strips of land lying between cereal crops and the field
boundary and extending for a limited distance into the crop, which are
deliberately managed to create conditions that benefit key farmland species. The
area to the east and north of the current airport boundary is predominantly arable
land, and some of the land that lies between the crops and the hedgerows,
totalling approximately 4 km, will be of low conservation value.
9.6.8 There are also other semi-natural sites considered to be of low ecological value within the
current airport boundary, including the following:
• A strip of semi-improved grassland and low scrub, approximately 700m long
located just inside the north eastern boundary fence.
• A Wildlife Area of 4.5 ha set aside for nature conservation purposes located in the
south of the current airport boundary. This site supports a diverse plant
assemblage including orchids (particularly pyramidal orchids), oxlip and sulphur
clover. The site also supports a pond with breeding great crested newts (a
national BAP species) and an ancient hedgerow.
• A fen area (2.34 ha) with a number of small springs and oozes consisting of
reeds, other wetland plants and patches of scrub is located adjacent to the
eastern boundary.
• 11 woodland sites located within and near to the current airport boundaries, 4 of
which support a typical ancient woodland tree/ shrub/ herbaceous flora damaged
or disturbed.

SERAS Stage Two: Appraisal Findings Report
FL1124000.RCE.RP.J03.020131.Appraisal Findings. 295
• 75 hedgerows located within the current airport boundaries. These hedgerows
provide links between the remnant woodlands within the current airport boundary.
• Grassland covering an area of 184 ha located within the current airport
boundaries. The grassland areas are important for several LBAP species
including grey partridges, brown hares, sulphur clover and skylark. Skylarks are
particularly important and the airport grasslands are likely to support 120 birds
during the breeding season.
• 11 ponds within the current airport boundary.
Heritage (Figure 9.25)
9.6.9 Archaeology - Two intensive programmes of archaeological investigations at the current airport
site have demonstrated the presence of a rich archaeological resource covering multi-period
activity dating from the neolithic to post-medieval periods. This indicates that the proposed area
of expansion to the east, which has been the subject of comparatively little archaeological
investigation, may also have a high potential to contain hitherto undetected archaeological
deposits. The main finds recorded within the study area include a complex of Prehistoric and
Roman sites.
9.6.10 The Prehistoric Period (to 50BC) is represented by a number of sites and finds are located
across the entire Stansted landholding. The sites include Neolithic findspots, Bronze Age and
Iron Age settlements and burials. Roman settlements (43AD-AD410) are well represented
within the airport and in the wider area. Bishop’s Stortford and Great Dunmow were small
towns in the Roman period, situated beside Stane Street Roman road, which runs directly south
of the airport along the line of the modern A120 road. Such an important line of communication
is likely to have attracted settlement. Late Iron Age/Roman sites have been identified across
the entire airport, though the main concentration appears to lie in its western half. The area of
the proposed expansion contains no known Roman sites, although a scatter of Roman pottery
just outside this area coupled with the known level of Roman archaeology within the airport site
would indicate that the area has the potential to contain hitherto undetected deposits.
9.6.11 Excavations within the airport have identified six, possibly eight, medieval settlement sites,
some containing houses. Within the area surrounding the airport the Boulder Clay geology has
given rise to a large number of moated settlement sites. Most survive partly as earthworks,
usually with a post-medieval structure in the enclosed area. The area of the proposed airport
extension contains four such sites, two of which are Scheduled Ancient Monuments.
Immediately outside the area of the proposed airport extension lie a further two Scheduled
Ancient Monuments, the remains of Tilty Abbey and Takeley Priory.
9.6.12 Listed Buildings - 64 Grade II Listed Buildings and one Grade II* Listed Building are located
within the proposed area of expansion. The Grade II listed buildings are fairly evenly spread

SERAS Stage Two: Appraisal Findings Report
FL1124000.RCE.RP.J03.020131.Appraisal Findings. 296
across the area of proposed expansion, although there are substantial clusters in the village
centres such as Bamber’s Green, Molehill Green and Brick End. In addition a Grade I Listed
Building and Scheduled Ancient Monument (Warish Hall Farm) building is situated under the
1:10,000 southern risk contour of the most eastern proposed runway. The current airport site
also contains three Grade II Listed buildings comprising the 16th/17th century Bury Lodge (now
converted to a hotel) and two associated 15th-16th century barns to the east.
9.6.13 Conservation Areas - There are no Conservation Areas within the area of proposed
development although the Great Easton Conservation area lies 350m outside of the area.
Landscape and Visual (Figure 9.26)
9.6.14 Landscape/Townscape - Stansted falls within the South Suffolk and North Essex Clayland - an
especially extensive regional landscape character area identified by the Countryside Agency.
For the purposes of this assessment the landscape in the vicinity of Stansted has been divided
into three distinct landscape character areas.
• North Essex Clayland Plateau is an open, but well wooded landscape of arable
farmland with frequent small to medium sized woodlands that result in a generally
wooded skyline. The landscape contains a number of Historic Parklands –
although these are generally visually enclosed. The pattern of medium to large-
scale arable fields is generally open, but sometimes enclosed by a variety of
informal hedgerows with frequent mature hedgerow trees. Despite the proximity
of the existing airport, the landscape of the plateau retains a rural and unspoilt
character in many places. This landscape is highly sensitive to the proposed
development. The value of this landscape has been assessed as Medium due to
its distinct historic character but extensive area.
• Chelmer Upper Valley Reaches comprise a number of tributaries to the main
river. This shallow but intimate landscape is distinct from the surrounding
plateau due to its enclosed views (with relatively close skyline) and the presence
of several historic towns and villages along the course of the river. The value of
this landscape has been assessed as Medium/High.
• Stort Valley is broader, less intimate and more linear than the valley of the Upper
Chelmer, this landscape is visually separated from the plateau by woodland and
topography. The value of this landscape has been assessed as Medium.
9.6.15 Visual - The site is well screened to the south and to the north-west by woodland. The principal
areas of potential site visibility comprise glimpsed views across the plateau from the south-east;
views across the Chelmer Valley from west facing slopes towards the fringe of the plateau
above Tilty; and occasional views from higher ground to the north and north-east – again
principally towards the plateau fringe above Tilty. The existing airport facilities are rarely visible
and there are few existing detractors present in the landscape.

SERAS Stage Two: Appraisal Findings Report
FL1124000.RCE.RP.J03.020131.Appraisal Findings. 297
9.6.16 Key potential visual receptors in the area include the villages of Takeley, Broxted and Great
Easton – the latter a Conservation Area with many listed buildings and with views across the
Chelmer valley towards the plateau site. The principal road network is generally well contained
by vegetation but footpaths in the area provide access to higher and more open areas.
Community
9.6.17 Community Infrastructure – There are four tiers of settlement in the vicinity of Stansted Airport:
the urban area of Bishop’s Stortford; the small towns of Stansted Mountfitchet and Great
Dunmow; and nucleated villages such as Great Hallingbury, Takeley, Elsenham and Thaxted.
The lowest tier comprises hamlets such as Bamber’s Green, Molehill Green and Brick End, with
scattered farmsteads and other properties. All the potentially affected wards fall comfortably
above the median national Index of Multiple Deprivation (IMD) ranking.
9.6.18 Community Structure/Distinctiveness – Work undertaken in Stage One concluded that (within
the Local Plan period) the long-term housing capacity of the Core Catchment Area (i.e. the
districts of Uttlesford and East Hertfordshire) is between 10,000-12,000 dwellings. It was
assumed that such an increase could be accommodated by intensification of existing built-up
areas, development of brownfield sites, a degree of urban fringe expansion and new “village”
settlements.
9.6.19 Employment – at 4% the unemployment levels within the Core Catchment Area (the districts of
Uttlesford and East Hertfordshire) are below the national average.
High Adverse Impacts: – Option 5
9.6.20 There would be a negligible loss of commercial facilities, although the loss of 680 ha of grade 2
agricultural land from within the Option boundary is considered to represent a HA effect. A HA
effect is anticipated from encroachment onto land (457 ha) as a result of the potential conflict
with its district designation as Stansted Airport Countryside Protection zone to protect the open
characteristics of the area.
9.6.21 Two Scheduled Monuments, which are considered to be of national value, would be lost as a
result of this option. In addition, this option would involve 697ha of new landtake from an area of
unknown archaeological resource, but of likely high archaeological potential, suggesting that
hitherto undetected sites, of unquantified value, may be affected by the proposals. The severity
of effects resulting from loss of known archaeological resources or sites of archaeological
potential is therefore considered to be HA.
9.6.22 This option would involve the loss of 29 Grade II Listed Buildings. Most are scattered across the
area of the proposed airport expansion to the east of the current airport site, although there are
significant concentrations within the village/hamlet centres at Molehill Green, Woodgates End

SERAS Stage Two: Appraisal Findings Report
FL1124000.RCE.RP.J03.020131.Appraisal Findings. 298
and Brick End. Owing to the numbers lost, the severity of effects resulting from such losses
would be HA. The cumulative effect on Heritage resources is considered to be HA largely as a
result of the loss of the two Scheduled Ancient Monuments and at least 29 Grade II Listed
Buildings.
9.6.23 Community Structure/Distinctiveness - Stage One work forecast that this option could give rise
to a demand for an additional 18,170 dwellings within the Core Catchment Area. This equates
to a population of approximately 43,000, which represents a 22% increase in the population of
the Core Catchment Area and is likely to be additional to “baseline” demand as reflected in
current housing capacity. Such an increase would represent a significant change in the
structure (including physical coalescence of settlements and mix of residents) of the local
community, since it would be achieved mainly by in-migration, and is regarded as an HA effect.
The housing demand associated with Option 5 would substantially exceed the capacity of the
Core Catchment Area. This suggests that such demand could be met only by fundamental
change in the settlement pattern (e.g. large-scale excisions from the Green Belt or creation of
new urban communities). This degree of change would represent a HA effect on local
communities.
High Adverse Impacts: – Option 7
9.6.24 The loss of 1179 ha of grade 2 agricultural land is considered to represent a HA effect. A HA
effect is anticipated from encroachment onto land (747 ha) as a result of the potential conflict
with its district designation as Stansted Airport Countryside Protection zone, to protect the open
characteristic of the zone.
9.6.25 Ecology impacts would be as for Option 5 except that over 50% of Elsenham Wood SSSI would
be lost, resulting in HA effects. In summary five areas of well connected woodland, including a
large part of a SSSI, three ancient woodland sites and part of another ancient woodland site will
be lost. In addition, over 4 km of species-rich, ancient hedgerow will be lost, resulting in HA
cumulative effects on ecology.
9.6.26 Heritage: The two Scheduled Monuments lost with Option 5 would be lost and this option may
also involve the loss of a third SAM, the site of the medieval Takeley Priory at Warish Hall. Four
additional undesignated sites, as listed on the National Monuments Record, would also be lost.
In addition 1216ha of new land would be taken from an area of unknown archaeological
resource, but of likely high archaeological potential. The severity of effects resulting from loss
of known archaeological resources or sites of archaeological potential is therefore considered to
be HA.
9.6.27 This option would involve the loss of one Grade II* Listed Building, and 64 Grade II Listed
Buildings. These are scattered across the area of the proposed airport expansion to the east of
the current airport site, although there are substantial concentrations within the village/hamlet

SERAS Stage Two: Appraisal Findings Report
FL1124000.RCE.RP.J03.020131.Appraisal Findings. 299
centres at Molehill Green and Brick End. Effects arising from loss of listed buildings are
therefore likely to be of HA severity.
9.6.28 The cumulative effects on Heritage are considered to be HA largely as a result of the loss of the
three Scheduled Ancient Monuments, one Grade I Listed Building, one Grade II* Listed Building
and 64 Grade II Listed Buildings.
9.6.29 Option 7 locates main buildings and extensive car parking facilities at the eastern end of the site
which encroaches onto the upper slopes of the landscape of the Chelmer Valley. The landtake
extends closer to the village of Great Easton than either Option 5 or 11. Large-scale facilities in
this location would be difficult to mitigate. These facilities would potentially be extremely visible
in views from the east and north east and, due to the close proximity of the Great Easton
Conservation Area, the overall visual effect is likely to be HA.
9.6.30 This option was not specifically addressed in the Stage One investigation of land use and
urbanisation impacts. However, on the assumption that housing demand would increase
approximately in line with airport capacity, this option could generate nearly half as much
demand again as Option 5. This would represent a HA effect in terms of community structure.
The cumulative effects on community are considered to be HA, taking account of direct loss of
infrastructure due to landtake, and the indirect impacts of population growth, housing demand
and employment.
High Adverse Impacts: - Option 11
9.6.31 The loss of 1174 ha of grade 2 agricultural land from within the airport is considered to
represent a HA effect. A HA effect is anticipated from encroachment onto land (683 ha) as a
result of the potential conflict with its district designation as Stansted Airport Countryside
Protection Zone, to protect the open characteristic of the zone.
9.6.32 Ecology impacts would be as for Option 5. In summary, four areas of well connected woodland,
including a large part of a SSSI and three ancient woodland sites will be lost. In addition, over 4
km of species-rich/ancient hedgerow will be lost, resulting in HA cumulative effects on ecology.
9.6.33 Heritage: Two Scheduled Monuments would be lost. Three additional sites as listed on the
National Monuments Record would also be lost. In addition, this option would involve 1044ha of
new landtake from an area of unknown archaeological resource, but of likely high
archaeological potential. The option would involve the loss of 50 Grade II Listed Buildings. The
cumulative effects on Heritage are considered to be HA largely as a result of the loss of two
Scheduled Ancient Monuments and the 50 Grade II Listed Buildings.
9.6.34 The cumulative effects on community are considered to be HA, taking account of direct loss of
infrastructure due to landtake, and the indirect impacts of population growth, housing demand
and employment.
SERAS Stage Two: Appraisal Findings Report
FL1124000.RCE.RP.J03.020131.Appraisal Findings. 300
9.7 Environment: Water
Existing Conditions
9.7.1 Stansted Airport is situated within the Upper Stort and the Upper Roding surface watercatchments (Figure 9.27). Within the study area, three watercourses flow in a southerly
direction to join with the River Stort, which flows to the west of the Airport. One of these, the
Pincey Brook, receives runoff from the Airport once it has passed through balancing ponds.
The River Roding rises to the north east of the Airport and flows southwards. In addition to the
watercourses in the study area, there are a number of natural ponds, and a spring within the
airport boundary itself.
9.7.2 The water quality is monitored in four watercourses within the study area. The chemical quality
in all of the watercourses is good, however the biological quality varies more widely. The
Pincey Brook appears to be affected by discharges from a sewage treatment works; none of the
watercourses appear to be directly impacted by activities at the Airport. It is more likely that
changes in quality arise from agricultural impacts or other sources of contamination. There are
four small licensed surface water abstractions to the south of the study area.
9.7.3 Less than 1% of the study area has been designated within the 1 in 100 year flood risk area
identified by the Environment Agency.
9.7.4 All the rivers within the study area are classified as Chalk Rivers. In the study area the Chalk,
which is a major aquifer, is overlain by Tertiary deposits of Reading Beds and London Clay,
which serve to protect the underlying aquifer from contamination. There is one small licensed
groundwater abstraction to the north west of the study area.
9.7.5 From a regional perspective, the available water resources are virtually fully committed. There
is limited scope for further groundwater development within the resource zone that supplies
Stansted Airport. Additionally, there are unsustainable groundwater abstractions occurring
within adjacent resource zones.
Impact of Options
9.7.6 The options have been assessed against a base case, which is the current land use planning
system, and therefore only considers impacts that are additional to those assessed under the
base case. The assessments consider the sensitivity of the water environment and the
potential to cause harm, which includes scope for mitigation..
9.7.7 All of the options at Stansted present a potential impact on water resources as High or High*
Adverse. Options 5, 7 and 11 represent High Adverse impacts on surface water quality. The
SERAS Stage Two: Appraisal Findings Report
FL1124000.RCE.RP.J03.020131.Appraisal Findings.
301
impacts on the other water objectives are either Medium or Low Adverse, as many of them may be mitigated. Impacts are summarised in Table 9.20 and in the Appraisal Summary Table.
9.7.8 Water quality impacts may be mitigated using water treatment techniques such as reed beds
and balancing ponds. All of the options potentially impact upon a spring. To prevent contamination of the underlying aquifer, appropriate measures would need to be taken during both construction and operation of the airport development option. Flooding impacts may be mitigated using balancing ponds, to attenuate runoff and take out the peak flow. The effectiveness of these measures is dependent upon adequate sizing of ponds, and the use of appropriate treatment techniques.
9.7.9 Options 5, 7 and 11 require engineering works to several rivers, hence the high adverse score.
This would involve either culverting or diverting the river; the Environment Agency is generally opposed to culverting, and such works are seen as a significant impact.
9.7.10 Large increases in passenger numbers significantly increase the airport’s demand for water,
and also within the surrounding residential areas that provide the human resource base for the airport. Without any further water resource development or effort to manage demand, the resource zone that supplies Stansted Airport would have a deficit. Assuming that water companies maximise existing strategic links and their use of existing and planned licensed resources between resource zones, the Stansted resource zone would still have a slight deficit. This also assumes that companies will achieve their leakage reduction targets, and also allows for environmental demands. Abstraction recovery for the benefit of the environment will be a significant impact upon Three Valleys Water (the water company that supplies the airport).
9.7.11 Given the large increases in demand for water imposed by these options, and the pressures
described above, it may be difficult to meet this demand, even assuming that appropriate supply and demand management techniques are put into place, and other water users within the region are water efficient.
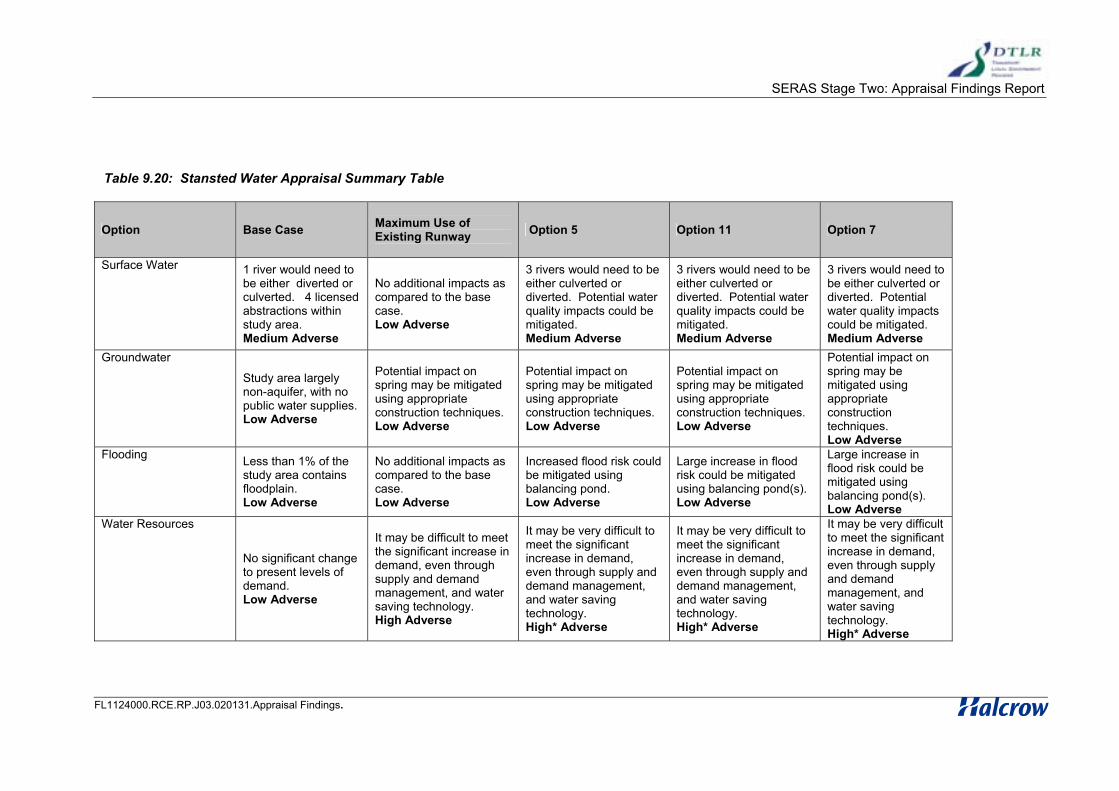
SERAS Stage Two: Appraisal Findings Report
FL1124000.RCE.RP.J03.020131.Appraisal Findings.
Table 9.20: Stansted Water Appraisal Summary Table
Option Base Case Maximum Use of Existing Runway
Option 5 Option 11 Option 7
Surface Water 1 river would need to be either diverted or culverted. 4 licensed abstractions within study area. Medium Adverse
No additional impacts as compared to the base case. Low Adverse
3 rivers would need to be either culverted or diverted. Potential water quality impacts could be mitigated. Medium Adverse
3 rivers would need to be either culverted or diverted. Potential water quality impacts could be mitigated. Medium Adverse
3 rivers would need to be either culverted or diverted. Potential water quality impacts could be mitigated. Medium Adverse
Groundwater
Study area largely non-aquifer, with no public water supplies. Low Adverse
Potential impact on spring may be mitigated using appropriate construction techniques. Low Adverse
Potential impact on spring may be mitigated using appropriate construction techniques. Low Adverse
Potential impact on spring may be mitigated using appropriate construction techniques. Low Adverse
Potential impact on spring may be mitigated using appropriate construction techniques. Low Adverse
Flooding Less than 1% of the study area contains floodplain. Low Adverse
No additional impacts as compared to the base case. Low Adverse
Increased flood risk could be mitigated using balancing pond. Low Adverse
Large increase in flood risk could be mitigated using balancing pond(s). Low Adverse
Large increase in flood risk could be mitigated using balancing pond(s). Low Adverse
Water Resources
No significant change to present levels of demand. Low Adverse
It may be difficult to meet the significant increase in demand, even through supply and demand management, and water saving technology. High Adverse
It may be very difficult to meet the significant increase in demand, even through supply and demand management, and water saving technology. High* Adverse
It may be very difficult to meet the significant increase in demand, even through supply and demand management, and water saving technology. High* Adverse
It may be very difficult to meet the significant increase in demand, even through supply and demand management, and water saving technology. High* Adverse

SERAS Stage Two: Appraisal Findings Report
FL1124000.RCE.RP.J03.020131.Appraisal Findings.
302
9.8 Environment: Noise Impacts
Aircraft Noise: Daytime
9.8.1 The Stansted contours for 2000 and each of the Options in 2015 or 2030 as appropriate are shown on Figures 9.28 to 9.50. Tables 9.21 to 9.24 give the areas and estimated populations under the daytime LAeq,16h noise contours for each of these scenarios with changes against the Existing Situation and the Base Case. Stansted Airport currently exposes a relatively small number of people to aircraft noise. A population of 6,000 lies within the 2000 57 dB contour, and this has increased from 3,400 in 1994 as the airport has been developed and traffic has grown, although the increase has been from a low baseline. This change should be taken as
approximate only, as the 1994 and 2000 population estimates are based on different census years. Since 1994 the contours have become longer (extended to the north west and south east) but have not widened significantly, except at the southern end. This has meant that the population affected has remained relatively small, as the 57 dB contour has not encroached over Bishop’s Stortford significantly.
9.8.2 The Current Land Use Planning system is the Base Case for 2015. With this scenario the
population under the 57 dB contour would reduce to 4,000 with the planned development in place, this is a 33% reduction compared with 2000. The reduction is again due to the aircraft fleet becoming quieter with the phase out of older aircraft and the introduction of quieter models.
Options in 2015
9.8.3 Comparing the Maximum Use Option with the Base, the population under the noise contours will increase substantially. The populations within the 57 dB to 69 dB contours will increase by 60-100%. The population in the 57 dB contour will increase by 2,800, to 6,800. Option 5 adds a new full length runway to the south of the existing runway. This results in an increase in the 57 dB contour area of 180% compared with the Base, bringing a further 6,600 (ie, 10,600 in total) to this level of noise exposure. Bishop’s Stortford is the main settlement affected. There will also be a substantial increase in population within the 66 dB contour, from 400 to 2,300.
9.8.4 Comparing the 2015 Options with the area under the 57 dB contour in 1994, it can be seen that
the Base Option remains within this value while Max Use and Option 5 exceed the 1994 area.

SERAS Stage Two: Appraisal Findings Report
FL1124000.RCE.RP.J03.020131.Appraisal Findings. 303
Table 9.21 : Stansted Daytime Aircraft Noise Contours – 2015 vs 2000 Existing Situation
Area (sq km)
Land Use Planning Max Use Option 5
Total Change Total Change Total Change
LAeq
(dB)1994
Existing
20002015 cw 2000 2015 cw 2000 2015 cw 2000
>54 n/a 92 63.9 -28.1 101.2 9.2 172.5 80.5
>57 37.9 52.9 37.5 -15.4 56.6 3.7 105.9 53
>60 23.3 32.6 22.1 -10.5 32.9 0.3 63.5 30.9
>63 14.4 20.3 13.1 -7.2 19.3 -1 32.8 12.5
>66 9 12.5 7.5 -5 11.4 -1.1 18.6 6.1
>69 5.7 7.5 4.2 -3.3 6.5 -1 10.3 2.8
>72 3.6 4.4 2.2 -2.2 3.6 -0.8 5.5 1.1
Population (000s)
Land Use Planning Max Use Option 5
Total Change Total Change Total Change
LAeq
(dB)1994
Existing
20002015 cw 2000 2015 cw 2000 2015 cw 2000
>54 n/a 13.4 8.1 -5.3 13 -0.4 24.6 11.2
>57 3.4 6 4 -2 6.8 0.8 10.6 4.6
>60 1.3 2.3 1.5 -0.8 2.6 0.3 5.2 2.9
>63 0.7 1.3 0.6 -0.7 1.2 -0.1 3.4 2.1
>66 0.3 0.5 0.2 -0.3 0.4 -0.1 2.3 1.8
>69 0.2 0.2 0.1 -0.1 0.2 0 1 0.8
>72 0.2 0.1 0.1 0 0.1 0 0.1 0

SERAS Stage Two: Appraisal Findings Report
FL1124000.RCE.RP.J03.020131.Appraisal Findings. 304
Table 9.22 Stansted Daytime Aircraft Noise Contours – 2015 vs 2015 Base Case
Area (sq km)
Land Use Planning Max Use Option 5
2015 Total Change Total Change
Laeq
(dB)
Base Case 2015 cw Base 2015 Cw Base
>54 63.9 101.2 37.3 172.5 108.6
>57 37.5 56.6 19.1 105.9 68.4
>60 22.1 32.9 10.8 63.5 41.4
>63 13.1 19.3 6.2 32.8 19.7
>66 7.5 11.4 3.9 18.6 11.1
>69 4.2 6.5 2.3 10.3 6.1
>72 2.2 3.6 1.4 5.5 3.3
Population (000s)
Land Use Planning Max Use Opt 5
2015 Total Change Total Change
Laeq
(dB)
Base Case 2015 cw Base 2015 Cw Base
>54 8.1 13 4.9 24.6 16.5
>57 4 6.8 2.8 10.6 6.6
>60 1.5 2.6 1.1 5.2 3.7
>63 0.6 1.2 0.6 3.4 2.8
>66 0.2 0.4 0.2 2.3 2.1
>69 0.1 0.2 0.1 1 0.9
>72 0.1 0.1 0 0.1 0

SERAS Stage Two: Appraisal Findings Report
FL1124000.RCE.RP.J03.020131.Appraisal Findings. 305
Table 9.23: Stansted Daytime Aircraft Noise Contours – 2030 vs 2000 Existing Situation
Area (sq km)
Max Use Option 5 Option 7 Option 11
Total Change Total Change Total Change Total Change
LAeq
(dB)
Existing
2030 cw 2000 2030 cw 2000 2030 cw 2000 2030 Cw 2000
>54 92 129.5 37.5 302.9 210.9 544 452 479.9 387.9
>57 52.9 70.7 17.8 176.9 124 302.6 249.7 272 219.1
>60 32.6 41 8.4 105.8 73.2 177.6 145 159.2 126.6
>63 20.3 24.2 3.9 61.9 41.6 106.7 86.4 93.2 72.9
>66 12.5 14.3 1.8 32.3 19.8 59.4 46.9 51.5 39
>69 7.5 8.4 0.9 18.6 11.1 32.3 24.8 28.8 21.3
>72 4.4 4.7 0.3 10.3 5.9 19.3 14.9 16.9 12.5
Population (000s)
Max Use Option 5 Option 7 Option 11
Existing Total Change Total Change Total Change Total Change
LAeq
(dB)
2030 cw 2000 2030 cw 2000 2030 cw 2000 2030 Cw 2000
>54 13.4 17.6 4.2 37.7 24.3 83.1 69.7 69 55.6
>57 6 8.8 2.8 24.1 18.1 35.1 29.1 34.5 28.5
>60 2.3 4.3 2 10.2 7.9 23.1 20.8 18.2 15.9
>63 1.3 1.6 0.3 5.1 3.8 9.3 8 8.8 7.5
>66 0.5 0.7 0.2 3.4 2.9 4.8 4.3 4.5 4
>69 0.2 0.3 0.1 2.4 2.2 3.1 2.9 3 2.8
>72 0.1 0.1 0 1 0.9 2.4 2.3 1.7 1.6

SERAS Stage Two: Appraisal Findings Report
FL1124000.RCE.RP.J03.020131.Appraisal Findings. 306
Table 9.24 Stansted Daytime Aircraft Noise Contours – 2030 vs 2030 Base Case
Area (sq km)
Option 5 Option 7 Option 11
Total Change Total Change Total Change
Laeq
(dB)
Max Use
2030 cw Base 2030 cw Base 2030 Cw Base
>54 129.5 302.9 173.4 544 414.5 479.9 350.4
>57 70.7 176.9 106.2 302.6 231.9 272 201.3
>60 41 105.8 64.8 177.6 136.6 159.2 118.2
>63 24.2 61.9 37.7 106.7 82.5 93.2 69
>66 14.3 32.3 18 59.4 45.1 51.5 37.2
>69 8.4 18.6 10.2 32.3 23.9 28.8 20.4
>72 4.7 10.3 5.6 19.3 14.6 16.9 12.2
Population (000s)
Option 5 Option 7 Option 11
Total Change Total Change Total Change
Laeq
(dB)
Max Use
2030 Cw Base 2030 Cw Base 2030 Cw Base
>54 17.6 37.7 20.1 83.1 65.5 69 51.4
>57 8.8 24.1 15.3 35.1 26.3 34.5 25.7
>60 4.3 10.2 5.9 23.1 18.8 18.2 13.9
>63 1.6 5.1 0.5 9.3 4.7 8.8 4.2
>66 0.7 3.4 2.7 4.8 4.1 4.5 3.8
>69 0.3 2.4 2.1 3.1 2.8 3 2.7
>72 0.1 1 0.9 2.4 2.3 1.7 1.6

SERAS Stage Two: Appraisal Findings Report
FL1124000.RCE.RP.J03.020131.Appraisal Findings. 307
Options in 2030
9.8.5 The Maximum Use Option is the Base Case for 2030. The population within the 57 dB contour
would be 2,000 more than in 2015, with the additional population affected being in
Sawbridgeworth as well as in Bishop’s Stortford. However, the total number within the 57 dB
contour remains below 9,000. This represents a 2,800 increase over existing conditions. The
population increase for the 63 dB contour is 3,300 over existing conditions.
9.8.6 Option 5 adds a new full length runway to the south of the existing runway. This results in an
increases in the 57 dB contour area of 50% compared with the Base, bringing a further 15,300
to this level of noise exposure, an 18,000 increase over existing conditions. Bishop’s Stortford
is the main settlement affected. There will also be a substantial increase in the population
within the 69 dB contour over the Base, from 300 to 2,400.
9.8.7 Option 7 would have two pairs of parallel runways. This proposal would result in a 26,300
increase in the population within the 57 dB contour over the base, and 29,100 increase over
existing conditions. New areas affected over Option 5 would include most of Sawbridgeworth
and more of Bishop’s Stortford. The number of people under the 69 dB contour would increase
substantially to 3,100 compared with 300 in the Base and 200 in existing conditions.
9.8.8 Option 11 is similar to Option 7 with two western runways but only one eastern runway. The
populations under the 57 dB and 69 dB contours are much the same as for Option 11.
However, the population under the 54 dB contour would be 17% lower at 69,000.
9.8.9 To summarise, comparisons of populations within the 57 dB contours against existing
conditions indicate that Maximum Use of existing runway will affect a further 800 people in 2015
while adding a further runway would cause a further 4,600 people to be affected. By 2030 the
new runway will affect an additional population of around 18,000. The 3 or 4 runway layouts
raise the numbers exposed to 57 dB by approximately 29,000 to around 35,000 people.
Sensitivity Tests: Land Use Planning System Option and Option 7 with Accelerated
Retirement, Reassignment and Increased Noise Stringency
9.8.10 Table 9.25 below presents the results of sensitivity tests combining assumptions relating to
aircraft type retirement rates, the reassignment of aircraft types and a Chapter 3 – 14dB noise
stringency requirement. The areas within the 57dB contours fall by 26% and 25% respectively
for the land use planning system option in 2015 and the largest option, Option 7, in 2030. The
area under the 57dB contour for the land use planning system option in 2015 falls to 27.6 sq
km, 27% less than the 1994 area.
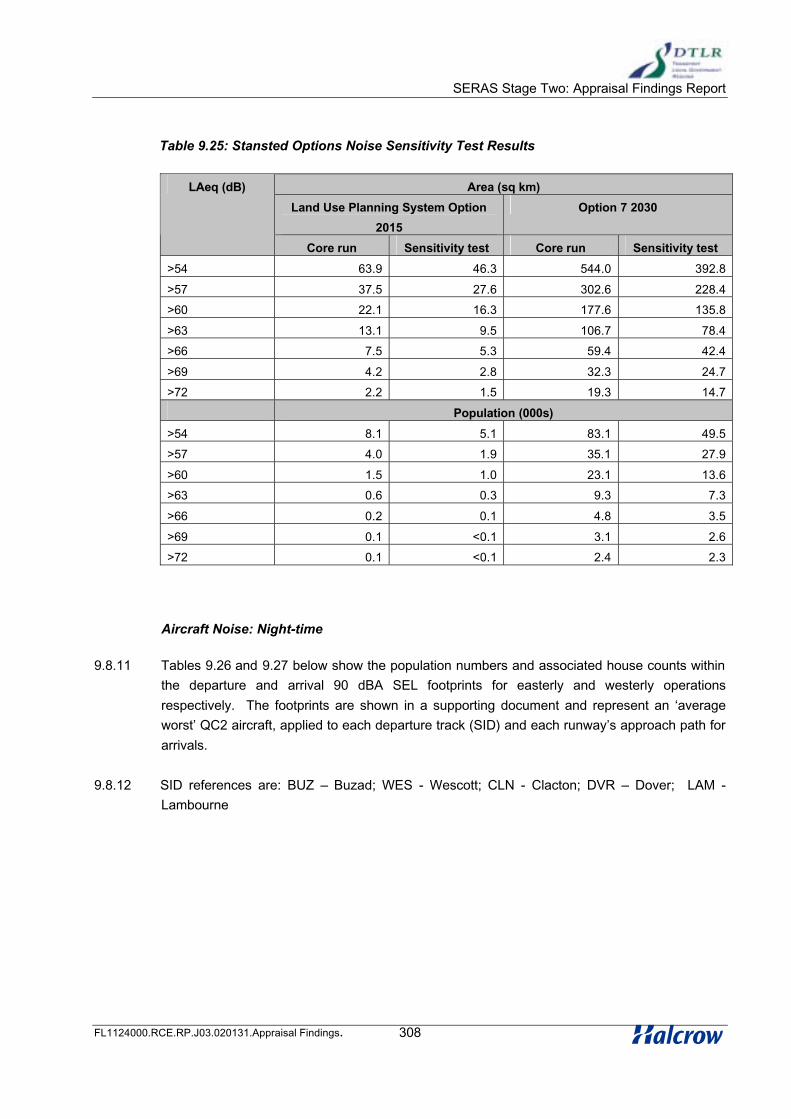
SERAS Stage Two: Appraisal Findings Report
FL1124000.RCE.RP.J03.020131.Appraisal Findings. 308
Table 9.25: Stansted Options Noise Sensitivity Test Results
Area (sq km)
Land Use Planning System Option
2015
Option 7 2030
LAeq (dB)
Core run Sensitivity test Core run Sensitivity test
>54 63.9 46.3 544.0 392.8
>57 37.5 27.6 302.6 228.4
>60 22.1 16.3 177.6 135.8
>63 13.1 9.5 106.7 78.4
>66 7.5 5.3 59.4 42.4
>69 4.2 2.8 32.3 24.7
>72 2.2 1.5 19.3 14.7
Population (000s)
>54 8.1 5.1 83.1 49.5
>57 4.0 1.9 35.1 27.9
>60 1.5 1.0 23.1 13.6
>63 0.6 0.3 9.3 7.3
>66 0.2 0.1 4.8 3.5
>69 0.1 <0.1 3.1 2.6
>72 0.1 <0.1 2.4 2.3
Aircraft Noise: Night-time
9.8.11 Tables 9.26 and 9.27 below show the population numbers and associated house counts within
the departure and arrival 90 dBA SEL footprints for easterly and westerly operations
respectively. The footprints are shown in a supporting document and represent an ‘average
worst’ QC2 aircraft, applied to each departure track (SID) and each runway’s approach path for
arrivals.
9.8.12 SID references are: BUZ – Buzad; WES - Wescott; CLN - Clacton; DVR – Dover; LAM -
Lambourne

SERAS Stage Two: Appraisal Findings Report
FL1124000.RCE.RP.J03.020131.Appraisal Findings. 309
Table 9.26: Night Noise Population and House Counts – Easterly Operations
Existing Option 5 Option 11
Runway 05 05L 05R 05L 05C 05R
Popl’n
(000’s)
Hse
(000’s)
Popl’n
(000’s)
Hse
(000’s)
Popl’n
(000’s)
Hse
(000’s)
Popl’n
(000’s)
Hse
(000’s)
Popl’n
(000’s)
Hse
(000’s)
Popl’n
(000’s)
Hse(000’s)
Departures
BUZ/WES 0.4 0.2 0.4 0.1 0.5 0.2 0.1 0.1 0.2 0.1 0.5 0.2
CLN 0.4 0.2 0.4 0.2 0.5 0.2 0.2 0.1 0.2 0.1 0.5 0.2
DVR/LAM 0.2 0.1 0.4 0.2 0.5 0.2 0.2 0.1 <0.1 ,0.1 0.5 0.2
Average 0.3 0.2 0.4 0.2 0.5 0.2 0.2 0.1 0.2 0.1 0.5 0.2
Arrivals 1.5 0.6 1.5 0.6 1.5 0.6 0.6 0.2 1.5 0.6 1.5 0.6
Option 7
Runway 05LL 05L 05R 05RR
Popl’n
(000’s)
Hse
(000’s)
Popl’n
(000’s)
Hse
(000’s)
Popl’n
(000’s)
Hse
(000’s)
Popl’n
(000’s)
Hse
(000’s)
Departures
BUZ/WES 0.1 0.1 0.2 0.1 0.4 0.2 0.7 0.3
CLN 0.2 0.1 0.2 0.1 0.4 0.2 0.7 0.3
DVR/LAM 0.2 0.1 <0.1 <0.1 0.4 0.2 0.7 0.3
Average 0.2 0.1 0.2 0.1 0.4 0.2 0.7 0.3
Arrivals 0.6 0.2 1.5 0.6 1.5 0.6 1.8 0.8

SERAS Stage Two: Appraisal Findings Report
FL1124000.RCE.RP.J03.020131.Appraisal Findings. 310
Table 9.27: Night Noise Population and House Counts – Westerly Operations
Existing Option 5 Option 11
Runway 23 23R 23L 23R 23C 23L
Popl’n
(000’s)
Hse
(000’s)
Popl’n
(000’s)
Hse
(000’s)
Popl’n
(000’s)
Hse
(000’s)
Popl’n
(000’s)
Hse
(000’s)
Popl’n
(000’s)
Hse
(000’s)
Popl’n
(000’s)
Hse
(000’s)
Departures
BUZ/WES 0.8 0.3 0.8 0.3 2.0 0.8 0.2 0.1 0.8 0.3 2.0 0.8
CLN 0.4 0.2 0.4 0.2 2.0 0.8 0.3 0.1 0.4 0.2 2.0 0.8
DVR/LAM 0.6 0.2 0.6 0.2 2.0 0.8 0.3 0.1 0.6 0.2 2.0 0.8
Average 0.6 0.2 0.6 0.2 2.0 0.8 0.3 0.1 0.6 0.2 2.0 0.8
Arrivals 1.7 0.7 1.7 0.7 0.4 0.2 1.0 0.4 1.7 0.7 0.4 0.2
Option 7
Runway 23RR 23R 23L 23LL
Popl’n
(000’s)
Hse
(000’s)
Popl’n
(000’s)
Hse
(000’s)
Popl’n
(000’s)
Hse
(000’s)
Popl’n
(000’s)
Hse
(000’s)
Departures
BUZ/WES 0.2 0.1 0.8 0.3 1.9 0.8 2.0 0.8
CLN 0.3 0.1 0.4 0.2 1.9 0.8 2.0 0.8
DVR/LAM 0.3 0.1 0.6 0.2 1.9 0.8 2.0 0.8
Average 0.3 0.1 0.6 0.2 1.9 0.8 2.0 0.8
Arrivals 1.0 0.4 1.7 0.7 0.4 0.2 0.3 0.1

SERAS Stage Two: Appraisal Findings Report
FL1124000.RCE.RP.J03.020131.Appraisal Findings. 311
9.8.13 The numbers of people and houses affected at Stansted are relatively low across all options.
Surface Access Noise: Highways
9.8.14 Table 9.28 gives the overall results (total EPA) from the GOMMMS plan level assessment for
road traffic noise. The Surface Access Noise part of the Appraisal Summary Table also
includes the EPA values split by noise contour bands.
Table 9.28: Stansted Surface Access Noise Assessment: Highways
Total change in Estimated Population Annoyed (EPA) by road traffic noise (000’s)
Year Maximum Use Option 5 Option 11 Option 7
2015 +0 +0.7 n/a n/a
2030 n/a +0.3 +1.5 +3.0
9.8.15 The noise impacts of changes in road traffic for the Maximum Use option and Option 5 in 2015
are compared with the Base Case, which is the road network for the current land use planning
system option. The roads around Stansted affected for Option 5 include the M11, A120 and
B1004 in Bishop’s Stortford. The net changes in Estimated Population Annoyed (EPA) by road
traffic noise are zero for Maximum Use and 700 for Option 5.
9.8.16 For 2030, the traffic noise effects for Options 5, 11 and 7 have been assessed against a Base
Case of the road network for Package 2, maximum use of the existing runway. For Option 5, a
similar set of roads to that in 2015 is affected. The assessment results in a net increase in EPA
of 300 people. For Option 11 the traffic noise effects spread over a wider area. The M11
between the A120 and the A505 shows noise impacts, as well as the A1301 south of
Cambridge. Impacts would also arise in Braintree and Chelmsford. The total change in EPA
for Option 11 is an increase of 1,500 people. The impacts for Option 7 extend over a greater
area than for Option 11. Effects extend south on the M11 down to the M25 and to the east.
The total increase in EPA for Option 7 is 3,000.

SERAS Stage Two: Appraisal Findings Report
FL1124000.RCE.RP.J03.020131.Appraisal Findings. 312
Surface Access Noise: Railways
9.8.17 Table 9.29 gives the results (total EPA) from the GOMMMS strategy level assessment for
railway noise.
Table 9.29: Stansted Surface Access Noise Assessment: Railways
Total change in Estimated Population Annoyed (EPA) by railway noise (000’s)
Year Maximum Use Option 5 Option 11 Option 7
2015/2030 N/a +1.8 +3.4 +4.5
9.8.18 The railway noise impacts for the Options at Stansted are compared against the Base Case
which is the Maximum Use of the existing runway scenario. The impacts apply for 2015 and
also for 2030 where this is appropriate. The increases in rail services and associated noise
impacts for Option 5 apply to the railway line from Stratford in East London, through South
Tottenham, through Bishop’s Stortford, to Cambridge and Ely. The change in Estimated
Population Annoyed (EPA) by railway noise for Option 5 is an increase of 1,800 people. For
Option 11, in general, the same sections of line would be affected. The greater service
increases result in larger noise impacts. The assessment for Option 11 is an increase in EPA of
3,400.
9.8.19 With Option 7 a new line is assumed between the airport and Braintree. The new train services
would give rise to noise impacts for people living near to this line and the lines between
Braintree and Norwich, via Witham, Colchester and Ipswich. The change in EPA with this
Option would be an increase of 4,500 people.
9.8.20 The above assessment should be considered as a worst case appraisal. It may be that the
additional airport rail services would not be as extensive as those appraised. However, any
changes would not be expected to alter the relative positions between the railway noise impacts
for the airport options.

SERAS Stage Two: Appraisal Findings Report
FL1124000.RCE.RP.J03.020131.Appraisal Findings. 313
9.9 Environment: Local Air Quality Impacts
Introduction
9.9.1 Air quality results are provided for representative options at each airport, for 2015 and 2030 as
appropriate. The air quality statistics used as assessment criteria for defining poor air quality in
SERAS Stage Two are: annual mean Nitrogen Dioxide concentrations of 40µg/m3; and the 90th
percentile of running 24-hour mean PM10 concentrations of 50µg/m3. In practice, annual mean
PM10 compared to a statistic of 40µg/m3 are also reported, as the 90th percentile values are a
simple factor of these. The Air Quality Key Indicator for SERAS stage2 is 'the number of people
exposed to an exceedance of the air quality standard, weighted by the degree of exceedance'.
The higher the key indicator, the worse the air quality impact is.
Results 2015
9.9.2 Figures 9.51 to 9.53 illustrate the air pollution contours for Stansted options in 2015. For each
option, figures are for annual mean Nitrogen Dioxide, and for annual mean PM10 and 90th
percentile of 24 hour mean PM10 where relevant. The outer box is the study area for air quality
in each case. Each figure also includes a table of the numbers of people exposed under each
contour. Table 9.30 also summarises, for Nitrogen Dioxide, the population exposed to
exceedances and determines the SERAS Key Indicator, to allow direct comparison between
options and packages. Table 9.31 provides similar results for PM10.
9.9.3 In 2015, only Option 5 at Stansted results in population exposed to exceedances for annual
mean Nitrogen Dioxide, with around 20 people exposed. This is a result of the new runway
being very close to the eastern airport boundary, with population close by. Expressed as a
simple average, airport related Oxides of Nitrogen in 2015 account for between 25% (base) and
50% (option 5) of total Oxides of Nitrogen in the Stansted study area. ‘Airport related’ includes
aircraft emissions, airside emissions, and airport related surface access emissions. The figures
clearly show the highest annual mean Nitrogen Dioxide contours fall directly on the runways,
and particularly the ends of the runways, associated with acceleration during take-off roll. The
stands areas are also clearly seen. The figures also show that major roads in the area are not
contributing to areas of exceedance.
9.9.4 Results clearly show that Stansted options in 2015 have no impact on PM10, with no population
exposed to exceedances of either annual mean PM10 or 90th percentile of 24 hour mean PM10,
in any option. Expressed as a simple average, airport related PM10 in 2015 accounts for just 2-
5% of total PM10 in the Stansted study area across all options. Very few locations exceed air
quality statistics, solely over the ends of runways. As no option results in population exposed to
exceedances of the air quality statistics, figures are only provided for the package option with
the largest most extensive PM10 contours, for illustration.

SERAS Stage Two: Appraisal Findings Report
FL1124000.RCE.RP.J03.020131.Appraisal Findings. 314
Table 9.30: Nitrogen Dioxide Key Indicators - Stansted 2015
Population exposed to exceedance of annual mean
NO2 of 40 µg/m3
Package Option
40-50
µg/m3
50-60
µg/m3
60-70
µg/m3
70-80
µg/m3
80-90
µg/m3
90-100
µg/m3
>100
µg/m3
Total
popul’n
exposed
Key
Indicator
1 Base Case 0 0 0 0 0 0 0 0 0
2 Max Use 0 0 0 0 0 0 0 0 0
7 Option 5 -
wide spaced
21 0 0 0 0 0 0 21 21
Table 9.31: PM10 Key Indicators - Stansted 2015
Annual mean PM10 of 40 µg/m3 90th Percentile of 24hour mean
PM10 of 50 µg/m3
Package Option
Total population
exposed
Key
Indicator
Total popul’n
exposed
Key
Indicator
1 Base Case 0 0 0 0
2 Max Use 0 0 0 0
7 Option 5 - wide spaced 0 0 0 0
Results 2030
9.9.5 Figures 9.54 to 9.58 illustrate the air pollution contours for Stansted options in 2030. For each
option, figures are for annual mean Nitrogen Dioxide, and for annual mean PM10 and 90th
percentile of 24 hour mean PM10 where relevant. The outer box is the study area for air quality
in each case. Each figure also includes a table of the numbers of people exposed under each
contour. Table 9.32 also summarises, for Nitrogen Dioxide, the population exposed to
exceedances and determines the SERAS Key Indicator, to allow direct comparison between
options and packages. Table 9.33 provides similar results for PM10.
9.9.6 In 2030, all three options at Stansted result in population exposed to exceedances for annual
mean Nitrogen Dioxide. Option 5 has the best key indicator, but has 45 people exposed to
exceedances. Option 7 has the worst key indicator score, and has nearly 300 people exposed
to exceedances. Options in 2030 are worse than 2015 options. Expressed as a simple
average, airport related Oxides of Nitrogen in 2030 account for between 66% and 76% of total
Oxides of Nitrogen in the Stansted study area across all options, (much higher than in 2015).
‘Airport related’ includes aircraft emissions, airside emissions, and airport related surface
access emissions. The figures clearly show the highest annual mean Nitrogen Dioxide

SERAS Stage Two: Appraisal Findings Report
FL1124000.RCE.RP.J03.020131.Appraisal Findings. 315
contours fall directly on the runways, and particularly the ends of the runway, associated with
acceleration during take-off roll. The stands areas are also clearly seen. The figures also show
that major roads in the area are not contributing to population exposed to areas of exceedance.
9.9.7 Results clearly show that Stansted options in 2030 (as in 2015) have no impact on PM10, with
no population exposed to exceedances of either annual mean PM10 or 90th percentile of 24
hour mean PM10, in any option. Expressed as a simple average, airport related PM10 in 2030
accounts for 6-9% of total PM10 in the Stansted study area across all options (higher than in
2015). Very few locations, limited to the runways, exceed air quality statistics. As no option
results in population exposed to exceedances of the air quality statistics, figures are only
provided for the package option with the largest most extensive PM10 contours, for illustration
(Option 7).
Table 9.32: Nitrogen Dioxide Key Indicators - Stansted 2030
Population exposed to exceedance of annual mean
NO2 of 40 µg/m3
Package Option
40-50
µg/m3
50-60
µg/m3
60-70
µg/m3
70-80
µg/m3
80-90
µg/m3
90-100
µg/m3
>100
µg/m3
Total
popul’n
exposed
Key
Indicator
7 Option 5 - wide
spaced
5 19 0 21 0 0 0 45 127
14 Option 7 - 2 pair
close parallel
133 141 24 0 0 0 0 298 487
10 Option 11 - 3
runways
66 28 0 19 21 0 0 134 303
Table 9.33: PM10 Key Indicators - Stansted 2030
Annual mean PM10 of
40 µg/m3
90th Percentile of 24hour mean
PM10 of 50 µg/m3
Package Option
Total population
exposed
Key
Indicator
Total population
exposed
Key
Indicator
7 Option 5 - wide spaced 0 0 0 0
14 Option 7 - 2 pair close parallel 0 0 0 0
10 Option 11 - 3 runways 0 0 0 0

SERAS Stage Two: Appraisal Findings Report
FL1124000.RCE.RP.J03.020131.Appraisal Findings. 316
9.10 Employment
Employment Forecasts
9.10.1 Employment forecasts for each option based on current employees at Stansted and projected
forwards to 2015 and 2030 are shown in Table 9.34. Current data show that Stansted has a
lower employee:passenger ratio than either Heathrow or Gatwick. All other applied growth
factors are similar to those applied at other airports.
9.10.2 In 2015, total direct on/off site employment at Stansted ranges between 15,300 employees with
maximum use of the existing runway and 46,000 with an additional runway. At the maximum by
2030, Option 7 results in 71,400 total direct on/off site employees, a nine-fold increase over
current direct employment levels. Compared with current employment levels, this represents
an additional 64,000 direct on/off site new jobs and a further 19,000 additional indirect jobs.
Table 9.34: Current and forecast employment at Stansted by option 2015 & 2030
Current &
Forecast
Employment by
Option
Current
1998
Max Use
2015
Option 5
2015
Max Use
2030
Option 5
2030
Option 11
2030
Option 7
2030
Direct on-site 6,700 13,100 39,200 12,000 37,100 48,500 60,800
Direct off-site 1,000 2,200 6,800 2,000 6,400 8,500 10,600
Indirect 2,300 4,600 13,800 4,200 13,100 17,200 21,400
Total
Employment10,100 19,900 59,800 18,200 56,600 74,200 92,800
Passengers
(mppa)10 23 64 26 74 98 122
Direct
employees/mppa816 664 715 544 585 584 587
Total
employee/mppa1,061 864 930 708 761 760 764

SERAS Stage Two: Appraisal Findings Report
FL1124000.RCE.RP.J03.020131.Appraisal Findings. 317
9.11 Land Use/Urbanisation
Summary
9.11.1 Current employment generated by the airport (on- and off-site direct employment and indirect
employment) is around 10,000 jobs. With the largest options appraised, employment totals
could increase to around 60,000 jobs in 2015 and just over 90,000 in 2030. The current core
catchment area is defined as Uttlesford, Harlow and East Hertfordshire districts. A wider
catchment area, potentially embracing Braintree, Chelmsford, Enfield and Epping Forest, would
need to be considered for the larger options.
9.11.2 The employment growth associated with the larger options (up to 49,700 jobs to 2015 and up to
82,700 jobs to 2030) is large in relation to total TEMPRO employment growth in the core and
wider catchment areas (45,000 jobs to 2015 and 74,000 jobs to 2030) and to housing provision
(RPG provision is for 83,000 additional houses in the core and wider catchment areas to 2030,
making 475,000 households in total). Meeting this additional labour demand will require a
sectoral shift in current employment patterns (from the low base of 5% of current core
catchment area jobs being at the airport), some remote sourcing of employees (in the Lee
Valley for example) and additional development, requiring a change in current planning policies.
In practice there might be a capacity of up to 12,000 dwellings in the core catchment area as a
progression of current planning policies, assuming two new settlements and some Green Belt
releases.
9.11.3 Development on this scale would result in a fundamental change in the urban-rural character of
the two districts, and such a scenario is unrealistic within current planning policy for the area.
The context could be changed, however, through the sub-regional study currently being
undertaken.
9.11.4 In terms of off-airport employment, significant land allocation alteration is needed to provide for
the larger options. It should be possible for the scale of anticipated indirect employment to be
accommodated for development of the existing runway if additional land allocations are made.
Current core catchment area planning policies assume that airport related development would
take place on the airport itself. Further alteration to land allocations would be needed to
accommodate the off-site employment associated with new runway options in either 2015 or
2030 within the immediate airport core catchment area. There are fewer competing pressures
from other industries than around Heathrow and Gatwick, but as the amount of direct
employment that has to be accommodated off site grows, it would become successively difficult
to find sites within the existing planning framework.

SERAS Stage Two: Appraisal Findings Report
FL1124000.RCE.RP.J03.020131.Appraisal Findings. 318
Employment Land Requirements
9.11.5 The off-airport employment implications vary significantly (given the very different scales of
development) between options, with requirements for up to 94 hectares in 2015 and 164
hectares in 2030 of off-site employment land within reasonable proximity to the airport.
9.11.6 While options confined to the existing single runway do not fundamentally change the airport’s
share of the CCA and WCA workforce, the larger options imply major sectoral shifts, with the
airport’s share projected to increase to around 36% of the CCA workforce with the largest
option, Option 7, by 2030.
Uttlesford District Council
9.11.7 Within Uttlesford, the combination of low unemployment and the expected scale of growth in
employment associated with an airport capacity of 15 mppa (within the existing planning
permission), has meant that in planning policy terms there has been no real need to identify
significant areas for further economic development. The Essex Structure Plan, for example,
indicates the scale of provision required between 1990 and 2001 to be 22 hectares.
9.11.8 The existing local plan also assumes that airport related developments would take place on the
airport itself. There is a joint policy stance agreed between Hertfordshire, Essex, Uttlesford and
East Hertfordshire Councils to direct all “airport related employment generating developments”
onto the airport site
9.11.9 These circumstances mean that in practice the local plan makes no provision for the scale of
off-airport employment that may be required for an expanded airport, if indeed a substantial
proportion of this is to be located off the airport site.
9.11.10 If, as seems likely, the development to accommodate direct and a proportion of indirect
employment cannot be accommodated on site, then similar issues concerning additional land
releases will apply to those discussed under housing capacity. Given the nature of employment
uses, provision of additional employment land is most likely to take the form of town edge
expansions or through redevelopment of larger brownfield sites.
East Herts District Council
9.11.11 As might be expected given the joint agreed policy stance noted above, this takes a similar
approach to the Uttlesford plan, with the assumption that indirect employment will be located
within the airport site.
9.11.12 As at March 1995 the outstanding capacity for employment uses within the district was
approximately 62 ha.

SERAS Stage Two: Appraisal Findings Report
FL1124000.RCE.RP.J03.020131.Appraisal Findings. 319
9.11.13 If further allocations are required, they would raise similar issues to finding new housing land as
discussed below.
Harlow District Council
9.11.14 A review of the local plan suggests there is only limited land available currently within the district
boundary drawn tightly around the town. However there are extensive built up employment
areas which have been redeveloped in recent years, resulting in a reasonable supply of
employment land. This process seems likely to continue. In addition, unemployment rates
higher than the regional average may prompt limited town edge expansions if insufficient
employment land were available to accommodate local job requirements.
Housing Capacity
9.11.15 The options appraised in 2015 would require 8,100 additional jobs (maximum use of the
existing runway) or as many as 49,700 jobs (Option 5). While maximum use of the existing
runway would not cause undue problems in the labour market, Option 5 could only be
accommodated with a major sectoral shift in employment. It would equate to 25% of core
catchment area and 7% of wider catchment area jobs in 2015. Further expansion of the airport
to 2030 would see these proportions increase to 36% in the core catchment area and11% in the
wider catchment area. The pressure major airport expansion would put on the labour market is
demonstrated by the growth in potential airport employment to 2030 (46,500 to 82,700 jobs with
different options) and the projected TEMPRO employment growth in the airport’s core and wider
catchment areas of 74,000.
9.11.16 The housing shortfall in the combined catchment areas is small. TEMPRO housing projections
exceed housing provision by 21,000 to 2015 and 17,000 to 2030. On this basis, the largest
development option would require some 19,000 dwellings in excess of RPG provision,
equivalent to an annual average provision of over 630 additional dwellings per year in the
period to 2030.
9.11.17 Within Uttlesford, the principal north-south transport corridor runs close to the west of Stansted
and contains the M11 London - Cambridge motorway and London Liverpool Street - Cambridge
railway line. Both are directly connected to the airport. The single carriageway A120 runs
immediately to the south of the Airport which connects Harwich and Colchester, through to the
district of East Hertfordshire. This pattern of accessibility means that most of the existing towns
of the M11 and A120 corridors meet the criteria for access to the airport.
9.11.18 Much of the rural parts of the district up to the edge of existing built up areas are designated as
Areas of Special Landscape Value. However, this is not an absolute constraint to new
development, with policy suggesting that any development that is permitted in these areas will
need to be particularly well designed and in scale, to accord with the special characteristics of
the area.

SERAS Stage Two: Appraisal Findings Report
FL1124000.RCE.RP.J03.020131.Appraisal Findings. 320
9.11.19 East Herts district lies immediately to the west of Stansted and includes the town of Bishop’s
Stortford, about 2 miles from the airport. The district’s main connection with the airport is the
A120 single carriageway road, which runs west from the airport for about 15 miles as far as the
A10, the former main route from London to Cambridge and providing links with centres such as
Hertford and Ware. There are also road connections to the south west linking the airport with
towns such as Sawbridgeworth and Harlow (Harlow District).
9.11.20 The southern part of the district forms part of the Metropolitan Green Belt which surrounds
several of the larger towns. This Green Belt was extended in the mid 1980s to include some
areas to the north of Bishop’s Stortford.
9.12 Integration Impacts
Regional/sub-regional policy
9.12.1 Stansted Airport impacts upon the sub-regions of the East London/Lower Lea Valley,
London/Stansted/Cambridge/Harlow and Cambridge. The impacts of an expanded airport are
discussed below under the headings of employment/labour force, housing and transport
infrastructure.
Employment / Labour Force
9.12.2 All three sub-regions in the East (East London/Lower Lea Valley, London/Stansted/
Cambridge/Harlow and the Cambridge sub-region) clearly have the potential to support the
additional employment created by growth at Stansted and, to a lesser extent, at Cliffe Marshes.
In East London/Lower Lea Valley there is both a large labour force and much brownfield
employment land available. With heavy reliance on the manufacturing sector, the existing skills
profile would make it difficult to diversify the employment base. However, there is an
abundance of available institutions that are capable of developing these skills if they are able to
access the workforce, which suffers from heavy deprivation; often a difficult task without
considerable funding and support.
9.12.3 In the London/Stansted/Cambridge sub-region, the demand for labour can equally be met,
although there is more opportunity to diversify the employment base. With the sub-region
covering such a range of areas, people and skills, the opportunity afforded by airport expansion
to capitalise on these is clear. In the Cambridge sub-region however, the existing skills profile
is far more entrenched, being centred around the high technology and R&D sectors. This
extends to considerations of developing the requisite training and skills profile for the sub-
region. In the other two sub-regions however, the clustering of high-profile businesses in the

SERAS Stage Two: Appraisal Findings Report
FL1124000.RCE.RP.J03.020131.Appraisal Findings. 321
vicinity of Stansted Airport will go some way towards assisting the development of skills that
these areas need. This extends to those entering the job market, with the high skill sectors in
the Cambridge area being considerably less flexible in terms of job requirements than the lower
skill sectors likely to be more dominant in the East London/Lower Lea Valley/ Harlow sub-
regions.
9.12.4 The degree to which these sub-regions are suited to developing business clusters is variable.
East London and the Lower Lea Valley are not particularly close to any of the airports, and the
only clear sectoral strength in the area is logistics. As such, there are several other PAERs in
the region that will have a competitive advantage in developing clusters of businesses,
specifically the northern parts of the London-Stansted-Cambridge sub-region, Harlow and
Cambridge itself. These areas are more proximate to the airports and in the case of
Cambridge, it already has a considerable cluster developing. Harlow is in the best potential
new location, being able to feed off the economically buoyant areas of Cambridge and London
Docklands yet with the scope for economic restructuring and growth to occur. While this
provides the opportunity for clusters of both high technology businesses and further expansion
of existing strong sectors such as logistics to occur, it suffers from boundaries restricted by
green belt designations that may hinder development of clusters in a high growth scenario.
This may restrict the range of business accommodation on offer, as it may also in the wider
Cambridge sub-region.
Housing
9.12.5 All of the Eastern sub-regions are tightly constrained by metropolitan green belt. As such,
large-scale housing development to support possible growth in airport-related employment
would be difficult. Most of this growth in East London/Lower Lea Valley would be affordable in
nature and built on brownfield sites, and would therefore assist in reaching targets set in
regional guidance. However, in contrast, most of the development in the Cambridge sub-region
would come in the form of a new settlement, particularly if large-scale expansion of Stansted
took place.
9.12.6 Whether brownfield development would be sustainable in East London/Lower Lea Valley in
terms of being located near to employment destinations is uncertain. Whilst there is a
reasonable supply of employment land available, businesses drawn to Stansted Airport are
likely to locate much closer and on better transport routes to the airport and Central London. As
such, workers may be coming from East London and the Lower Lea Valley, yet will be
commuting to other parts of the sub-region nearer to Stansted and Cambridge.
9.12.7 The resultant effect is a redistribution of workers to the northern and eastern parts of the
amalgamated sub-regions, i.e. Harlow, the Stansted area and the Cambridge sub-region.
Again, a new settlement close to Cambridge would be perfect to house workers in the local high
technology clusters that would continue to grow with the expansion of Stansted.

SERAS Stage Two: Appraisal Findings Report
FL1124000.RCE.RP.J03.020131.Appraisal Findings. 322
Transportation / Infrastructure Improvements
9.12.8 The impact of airport development on the sub-regions in the East varies in terms of sustainable
regional policy for transportation. Development at Stansted will have little effect on reducing the
need to travel. With a large proportion of the workforce based close to the major areas of
potential employment, travel will be minimised. However, the increases of people in
employment will inevitably have the effect of increasing travel overall. As the high growth
scenario is approached, this will have an overall negative effect.
9.12.9 In contrast, in the Cambridge sub-region, the potential development of a new settlement will
bring with it a clustering of employment opportunities. Provided that workers in the new
settlement can be broadly matched to the requirements of the businesses, there will be a large
reduction on the need to travel for these workers.
9.12.10 One criterion within which airport development will accrue benefit to the sub-regions is the need
to improve the rail network. With the links to London well established, major airport growth and
development will consolidate these links as well as developing radial links connecting along the
major corridors in the sub-regions. This is particularly in respect of freight, with the eastern
regions being the major area through which freight will pass to access the rest of the country.
Also freight will pass in the other direction from Stansted Airport to access the rest of the South
East and continental Europe via the ports and the Channel Tunnel.
Social Impacts
Low Growth Scenario
9.12.11 Under a low-growth scenario (up to 2015), around 10,000 jobs could be generated in total. Of
these, over 3,300 could be low skill in nature, with 2,100 possibly being located on-site and
1,200 off-site.
9.12.12 In 1998 there was a shortage in Harlow and Enfield of over 5,700 jobs. This is forecast to
increase further by almost 1,500 jobs up to 2016. As such, there would be a strong possibility
that all of the jobs created could be filled by the Harlow and Enfield labour markets.
9.12.13 With reasonable transport infrastructure already in place between Harlow and Stansted, it is
likely that the majority of on-site employment can be accommodated by workers from the
district. It could also take a large percentage of the off-site jobs, although improvements to local
bus services would be needed. It is extremely unlikely that Enfield workers would take any
more than 10% of the jobs created, regardless of the transport improvements made.

SERAS Stage Two: Appraisal Findings Report
FL1124000.RCE.RP.J03.020131.Appraisal Findings. 323
High Growth Scenario
9.12.14 Under a high growth scenario (up to 2030), around 82,000 jobs are forecast to be generated in
the highest case. Of these, more than 27,000 may be low skill in nature, with as many as
17,000 potentially located on-site and 10,000 off-site.
9.12.15 As stated above, by 2016 there is a very large labour surplus in the two districts. By 2031, with
a net balance of 1,900 jobs gained, the worker surplus is likely to fall again to as low as 5,000.
As such, it is still likely that several thousand of the available workers in Harlow can take up
airport-generated positions. Consolidation of this is provided by Harlow being a focus point for
regeneration policy and with the existing transport infrastructure being reasonable. Provided
further improvements are made to local bus and train services, it is reasonable to assume that
this scenario can be achieved.
9.12.16 Enfield workers also have the scope to fill as many as 2,000 low skill jobs. However, in order to
achieve this, the relatively poor connectivity of Enfield to Stansted needs to be rectified. In
addition, the district does not benefit from being the focus of regeneration policy. This is
concentrated more on west Essex (in Harlow), East Hertfordshire (Hoddesdon) and East
London.
9.12.17 It should be noted, in conclusion, though, that such a large development at Stansted will not be
serviced by recourse to surplus labour pools. The paragraphs above suggest that up to half of
the low skill jobs might be filled from the labour sources in Enfield and Harlow, but the
remainder will need to be sourced from further afield or by in-migration.

SERAS Stage Two: Appraisal Findings Report
FL1124000.RCE.RP.JO3.020131.Appraisal Findings 324
10 Appraisal of Options at Main Sites: Luton
10.1 Options Appraised in Stage Two
10.1.1 The Base Case at Luton, limited to development currently envisaged in the land-use planning
system, has a capacity of 10 mppa, as reflected in the Bedfordshire Structure Plan. Figure 10.1
indicates the airport’s location and Figure 10.2 the existing layout. In the Stage One Report, the
capacity of the existing 2160m runway and terminal zone at their maximum use was taken to be
15 mppa. At the end of Stage One, it was agreed that, in the absence of options that added a
runway, options making maximum use of the single runway could have a capacity of around 30
mppa, allowing for extension of the runway, the development of taxiways and other facilities. In
Stage Two, in Package 2 (maximum use of existing runways) therefore, Luton has an assumed
capacity of 31 mppa. Two versions of an extended and re-aligned runway have been
appraised.
10.1.2 Option 2 has a new 3000m runway built 200m south of and parallel to the present runway. The
latter would be retained to form the basis of a parallel taxiway (Figure 10.3).
10.1.3 Option E3 creates a new 3000m runway on a NNE-SSW alignment, similar to that at Stansted.
The intention of this was to reduce airspace interaction between Luton and Stansted and to
reduce noise impacts in the vicinity of Luton airport (Figure 10.5).
10.1.4 In both cases it is assumed that the new runway could be in place by 2011 and would have a
runway capacity of 240,000 ATMs supported by a terminal capacity of 31 mppa. Initial
modelling of air freight in Stage Two of SERAS indicated that in constrained South East
scenarios, a large volume of air freight, to be carried on freighters, might wish to take advantage
of any runway capacity at Luton not taken up by passenger ATMs. There are various reasons,
including commercial and environmental feasibility, why Luton might not be able to
accommodate these demands. To assess what may be feasible, alternative layouts at Luton
which provide for substantial freight movement as well as passenger movement have also been
subjected to some appraisal (Figures 10.4 and 10.6).
10.1.5 The options appraised at Luton are summarised in Table 10.1 and illustrated in Figures 10.2 to
10.6.

SERAS Stage Two: Appraisal Findings Report
FL1124000.RCE.RP.JO3.020131.Appraisal Findings 325
Table 10.1: Options appraised at Luton
Option Description
Terminal
Capacity
mppa
Runway
Capacity
ATM
Year of
Introduction
Current Land Use Planning System 10 100,000
2
New 3000m runway to south of
existing
31 240,000 2011
E3 New 3000m runway realigned NE-SW
adjusted to avoid Someries
31 240,000 2011
10.2 Capital Costs
10.2.1 Table 10.2 below shows the estimated incremental capital costs for each option above the 10
mppa capacity Base Case. Table 10.3 gives the breakdown of surface access (road and rail)
costs.
Table 10.2: Estimated Incremental Capital Costs for Luton Options above Base Case (£ million)
Item
Option 2
Core Layout
Option 2
with Freight
Facilities
Option E3
Core Layout
Option E3
with Freight
Facilities
Capacity 31 mppa 31 mppa 31 mppa 31 mppa
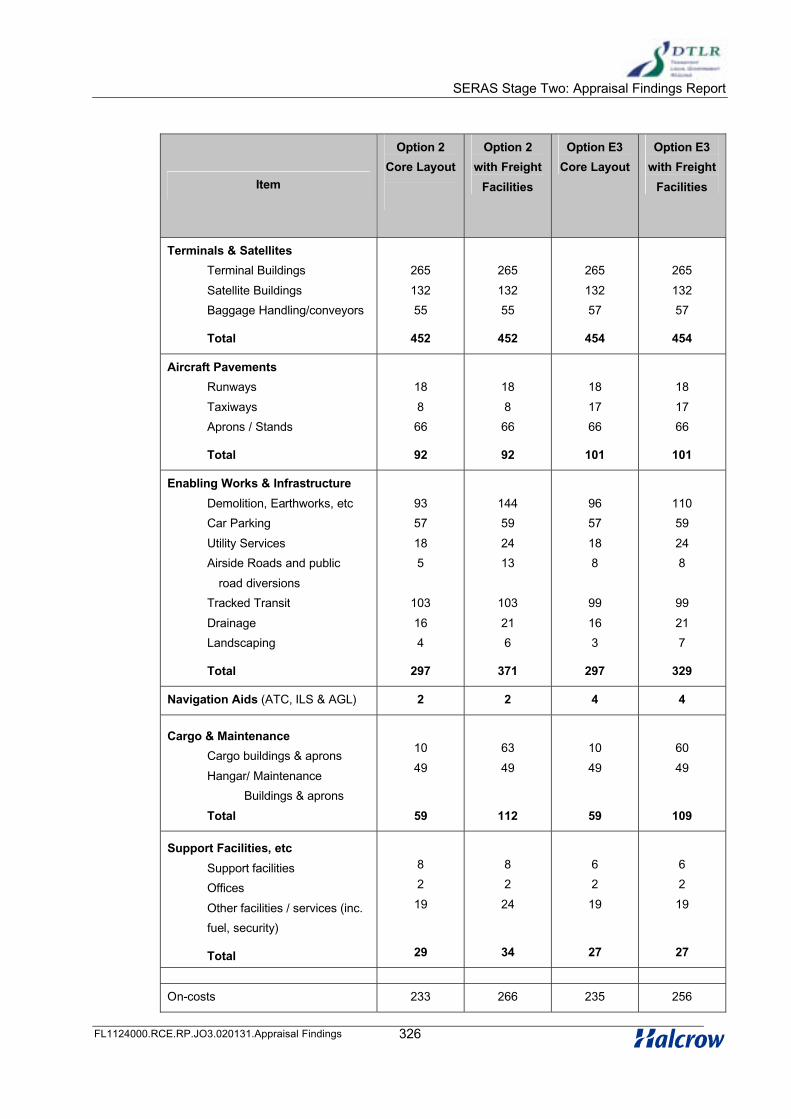
SERAS Stage Two: Appraisal Findings Report
FL1124000.RCE.RP.JO3.020131.Appraisal Findings 326
Item
Option 2
Core Layout
Option 2
with Freight
Facilities
Option E3
Core Layout
Option E3
with Freight
Facilities
Terminals & Satellites
Terminal Buildings
Satellite Buildings
Baggage Handling/conveyors
Total
265
132
55
452
265
132
55
452
265
132
57
454
265
132
57
454
Aircraft Pavements
Runways
Taxiways
Aprons / Stands
Total
18
8
66
92
18
8
66
92
18
17
66
101
18
17
66
101
Enabling Works & Infrastructure
Demolition, Earthworks, etc
Car Parking
Utility Services
Airside Roads and public
road diversions
Tracked Transit
Drainage
Landscaping
Total
93
57
18
5
103
16
4
297
144
59
24
13
103
21
6
371
96
57
18
8
99
16
3
297
110
59
24
8
99
21
7
329
Navigation Aids (ATC, ILS & AGL) 2 2 4 4
Cargo & Maintenance
Cargo buildings & aprons
Hangar/ Maintenance
Buildings & aprons
Total
10
49
59
63
49
112
10
49
59
60
49
109
Support Facilities, etc
Support facilities
Offices
Other facilities / services (inc.
fuel, security)
Total
8
2
19
29
8
2
24
34
6
2
19
27
6
2
19
27
On-costs 233 266 235 256

SERAS Stage Two: Appraisal Findings Report
FL1124000.RCE.RP.JO3.020131.Appraisal Findings 327
Item
Option 2
Core Layout
Option 2
with Freight
Facilities
Option E3
Core Layout
Option E3
with Freight
Facilities
Contingency 291 332 294 320
Land Costs 12 14 52 53
Sub-total:
Airport Development Costs1465 1673 1524 1653
Airport Development Costs per mppa
provided above 10 mppa Base Case 70 80 73 79
Costs of Associated Surface
Access72 72 72 72
Total Capital Costs 1537 1745 1596 1725
Total Capital Costs per mppa
provided above 10 mppa Base Case 73 83 76 82
Table 10.3: Estimated ‘Airport Specific’ Surface Access Costs (£ million)
Item
Option 2
Core Layout
Option 2
with Freight
Facilities
Option E3
Core Layout
Option E3
with Freight
Facilities
Road Schemes
NE by-pass – Years 2015 & 2030
Widen A1081 & A505 - Year 2030
Sub Total for 2015
Sub Total for 2030
60
12
60
72
60
12
60
72
60
12
60
72
60
12
60
72
Rail Schemes Subtotal 0 0 0 0
Total 2015
Total 2030
60
72
60
72
60
72
60
72
Airport Option Costs
10.2.2 In all options, 9 to 15% of the total cost is attributed to enabling works – mostly due to
earthworks. Since the site level is pre-determined by levels of connecting taxiways etc, a

SERAS Stage Two: Appraisal Findings Report
FL1124000.RCE.RP.JO3.020131.Appraisal Findings 328
balanced cut / fill exercise is not possible and hence there is a requirement for large volumes of
imported fill material.
10.2.3 In both options with added freight capacity, approximately 6% of the total cost is attributed to
cargo handling facilities, compared with about 1% in the options with core facility only.
10.2.4 Terminal and satellite rates per mppa (about £21.5M) are high compared to other SERAS sites.
This is partly explained by a new space provision of 7000 m2/mppa, slightly above the SERAS
standard to raise the whole facility, combining an existing, remodelled terminal and new
terminal space, closer to the standard.
10.2.5 Car parking provision is the highest of all SERAS sites per mppa, but this is not reflected
significantly in the cost due to most being surface parking.
10.2.6 Although not modelled in SERAS, it has been estimated that construction of a full length parallel
taxiway on the existing site could increase the airport capacity to 27 mppa. The estimated
Airport Development Cost for this together with associated facilities is £986 million (£58M per
additional mppa).
10.2.7 Although not included in the cost estimates, a premium may be expected for working in
operational areas. This would be of significance at Luton in any terminal and stand expansion;
in Option 2 when constructing link taxiways across a live runway; in Option E3 while
constructing about 600m of runway and taxiway where they cross the existing airfield
pavements.
10.2.8 With a low office space provision of 95m2 per mppa it is not likely to contribute revenue
generating floorspace.
10.2.9 The cost of a tracked transit system, linking the core terminal to the rail station in the valley to
the west, is included in both options. Both options also include for conveyor systems for
passenger access between the core terminal and the piers. In addition, Option 2 costs include
a conveyor system in tunnel beneath the apron area, connecting the core terminal and the
satellite.
10.2.10 Land costs are relatively low for Option 2 with mostly agricultural land-take. They increase
significantly for E3 due to a higher proportion of industrial land-take .
Surface Access Costs
10.2.11 At £3.4m per mppa, the surface access scheme costs are low. This is particularly because
there are no proposals to introduce a direct rail link. It is assumed that the proposed Luton and
Dunstable guided bus route will link to the airport but no costs have been allowed. It has been
assumed that, despite the currently proposed runway location in Option E3, the North East by-
pass will not have a tunnelled section.

SERAS Stage Two: Appraisal Findings Report
FL1124000.RCE.RP.JO3.020131.Appraisal Findings 329
10.2.12 Improvements to the strategic road network already proposed, ie those not specifically required
to accommodate airport related traffic, are on the M1 southbound from junctions 10 to 9 (3 lane
up to 4 lane in 2015), on the M1 from junctions 12 to 13 (dual 3 lane up to dual 4 lane in 2015)
and on the M1 from junctions 10 to 12 (dual 3 lane up to dual 4 lane in 2030). The cost of these
schemes would be about £9 million, £37 million and £45 million respectively.
10.3 Demand Forecasts
10.3.1 Forecast passenger movements, ATMs and passengers per passenger ATM for each Luton
option are summarised at 5 year intervals between 2000 and 2030 in the following tables:
• Table 10.4: Current Land-Use Planning System
• Table 10.5: Options 2 and E3
10.3.2 Options 2 and E3 have the same runway characteristics and the same runway and terminal
capacities. One set of forecasts therefore applies to both options. The forecasts assume that
Luton develops the types of services that currently operate: some domestic and short haul
scheduled services, charter and, principally, low cost services. Principal features of the
forecasts with each option are set out below.
Current Land-Use Planning System
10.3.3 In the current land-use planning system, Luton’s passenger capacity is limited to 10 mppa. The
forecasts indicate that this capacity will be taken up by a mix of low cost and charter
passengers, with very few scheduled passengers. The number of passenger ATMs stays
below 80,000 throughout the forecast period.
Options 2 and E3
10.3.4 Runway capacity is assumed to increase from 100,000 ATMs to 240,000 ATMs in 2011 when
the new runway comes into use. For all but the early years from 2000, the airport is forecast to
be operating at or close to its runway capacity. Together with the assumed service types and
forecast passengers per ATM, the runway capacity prevents the assumed terminal capacity of
31 mppa being reached. Passenger forecasts grow to 17 mppa in 2015 and 29 mppa in 2030,
with an average of 129 passengers per ATM, up from 113 in 2000 and 115 in 2015. Currently
Luton airport is used almost exclusively by leisure and business passengers on low cost and
charter services. The new runway capacity in 2011 gives a large increase in short haul
scheduled services (carrying around 30% of passengers from 2020 onwards) and some
increase in both charter and low cost services. It is forecast that business passengers are
currently around 23% of total passengers, in 2015 there are forecast to be 3.6 million business
passengers (21% of the total) and in 2030, 8.1 mppa (29% of the total).

SERAS Stage Two: Appraisal Findings Report
FL1124000.RCE.RP.JO3.020131.Appraisal Findings 330
Table 10.4: Luton – Current Land-Use Planning System
2000 2005 2010 2015 2020 2025 2030
Passengers, mppa
Scheduled Domestic ** ** ** ** ** ** **
Short haul ** ** ** ** ** ** 1
USA
Long haul
Total ** ** ** ** ** ** 1
Charter 2 2 4 4 6 8 5
Low cost 5 5 5 4 3 2 2
Total 7 7 8 8 9 11 8
ATMs, ‘000
Scheduled Domestic 2 2 2 2 2 2 2
Short haul ** ** ** ** ** ** 19
USA
Long haul
Total ** ** ** ** ** ** 21
Charter 16 19 26 28 40 48 31
Low cost 42 48 48 43 31 27 19
Total 61 70 77 74 74 78 72
Passengers/PATM
Scheduled 61
Charter 123 129 138 137 154 167 148
Low cost 110 95 97 97 90 94 93
Average 108 102 109 110 123 137 106
Note: Figures in bold are capacity-constrained forecasts
‘Other’ categories, not shown, are included in totals. Totals may not sum due to rounding
** = less than 0.5 mppa or less that 500 ATMs

SERAS Stage Two: Appraisal Findings Report
FL1124000.RCE.RP.JO3.020131.Appraisal Findings 331
Table 10.5: Luton - Options 2 and E3
2000 2005 2010 2015 2020 2025 2030
Passengers, mppa
Scheduled Domestic ** ** ** ** ** ** **
Short haul ** ** ** 1 7 8 9
USA 0 0 0 0 0 0 0
Long haul 0 0 0 0 0 0 0
Total ** ** ** 1 7 8 9
Charter 1 2 2 5 6 7 9
Low cost 5 5 6 11 11 11 10
Total 6 7 9 17 24 27 29
ATMs, ‘000
Scheduled Domestic 2 2 2 2 2 2 2
Short haul ** ** ** 18 85 88 88
USA 0 0 0 0 0 0 0
Long haul 0 0 0 0 0 0 0
Total 2 2 2 20 87 90 89
Charter 11 14 19 33 41 44 51
Low cost 42 50 55 93 89 85 80
Total 56 67 77 146 217 220 221
Passengers/PATM
Scheduled 35 37 37 67 84 92 101
Charter 120 123 126 145 151 161 179
Low cost 117 109 116 121 125 131 130
Average 113 109 115 119 113 121 129
Note: Figures in bold are capacity-constrained forecasts
‘Other’ categories, not shown, are included in totals. Totals may not sum due to rounding
** = less than 0.5 mppa or less than 500 ATMs

SERAS Stage Two: Appraisal Findings Report
FL1124000.RCE.RP.JO3.020131.Appraisal Findings 332
10.4 Safety Risk
10.4.1 The Stage Two assessment of safety risk appraises the third party risk associated with both
existing and new runway options. The full extent of the 1;10,000 and 1:100,000 designated risk
areas are shown on the following figures. The 1:1,000,000 contours are partially shown.
• Figure 10.7 – Base Case
• Figure 10.8 – Option 2 Core Layout, New 3000m parallel runway 200m to the
south of the existing runway.
• Figure 10.9 – Option E3 Core Layout, New 3000m runway aligned NNE:SSW and
to avoid Someries Castle.
10.4.2 PSZ contours have been generated using the passenger plus freight ATM totals.
1:10,000 Risk Contours
10.4.3 The impacts of the 1:10,000 risk contours are shown in Table 10.6 below:
Table 10.6: 1:10,000 Risk Contours
Impact Base 2 E3
Increase in Area (ha) above
Base (West and East)W 4.1E 3.9
W +3.0E +2.8
W +3.0E +2.8
Population count within contour
(outside airport boundary)None None None
% developed area affected,
(outside airport boundary)0 0 0
10.4.4 In the base case, the west 1:10,000 PSZ crosses the main rail line and the A1081, while the
east PSZ crosses only an unclassified road in an area of farmland. In Option 2, with the runway
moved south, the west PSZ crosses the rail line and the B653, and the east PSZ cuts a minor
road. The area at both ends is otherwise predominantly undeveloped. The realigned runway in
Option E3 leaves the west PSZ entirely in agricultural land, with the east zone again cutting only
minor roads.
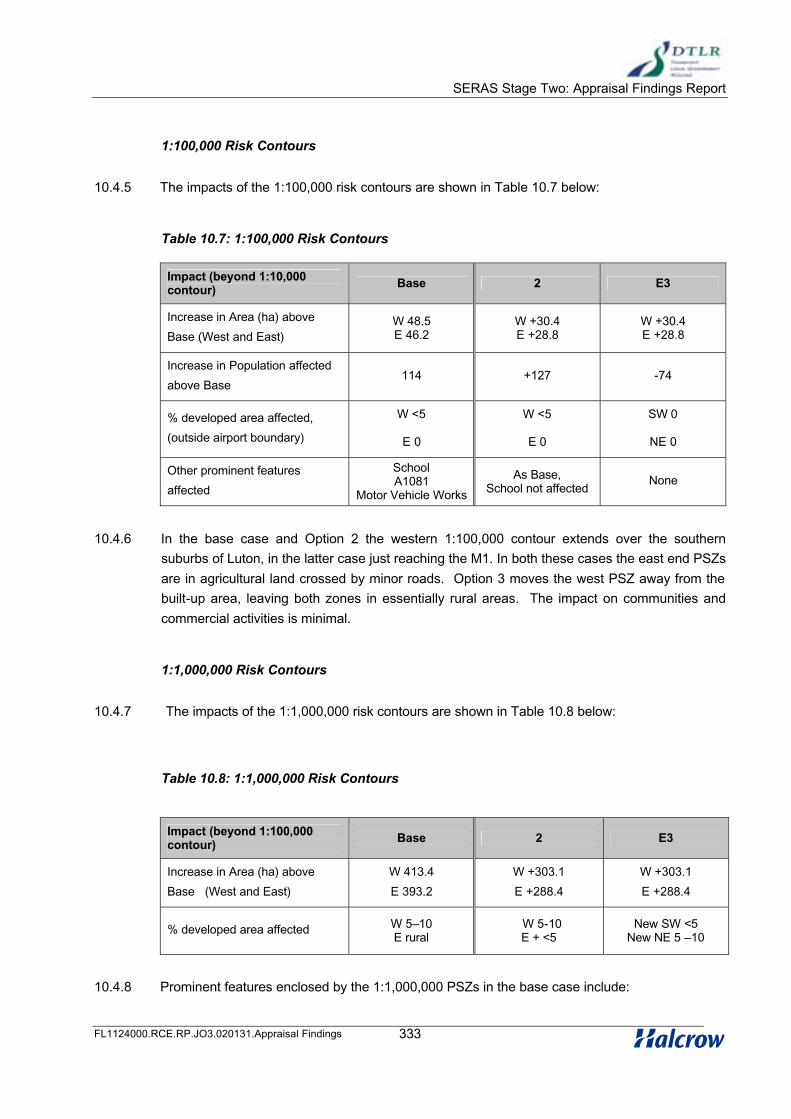
SERAS Stage Two: Appraisal Findings Report
FL1124000.RCE.RP.JO3.020131.Appraisal Findings 333
1:100,000 Risk Contours
10.4.5 The impacts of the 1:100,000 risk contours are shown in Table 10.7 below:
Table 10.7: 1:100,000 Risk Contours
Impact (beyond 1:10,000 contour) Base 2 E3
Increase in Area (ha) above
Base (West and East)W 48.5E 46.2
W +30.4E +28.8
W +30.4E +28.8
Increase in Population affected
above Base114 +127 -74
% developed area affected,
(outside airport boundary)
W <5
E 0
W <5
E 0
SW 0
NE 0
Other prominent features
affected
SchoolA1081
Motor Vehicle Works
As Base,School not affected
None
10.4.6 In the base case and Option 2 the western 1:100,000 contour extends over the southern
suburbs of Luton, in the latter case just reaching the M1. In both these cases the east end PSZs
are in agricultural land crossed by minor roads. Option 3 moves the west PSZ away from the
built-up area, leaving both zones in essentially rural areas. The impact on communities and
commercial activities is minimal.
1:1,000,000 Risk Contours
10.4.7 The impacts of the 1:1,000,000 risk contours are shown in Table 10.8 below:
Table 10.8: 1:1,000,000 Risk Contours
Impact (beyond 1:100,000 contour) Base 2 E3
Increase in Area (ha) above
Base (West and East)
W 413.4
E 393.2
W +303.1
E +288.4
W +303.1
E +288.4
% developed area affected W 5–10E rural
W 5-10E + <5
New SW <5New NE 5 –10
10.4.8 Prominent features enclosed by the 1:1,000,000 PSZs in the base case include:

SERAS Stage Two: Appraisal Findings Report
FL1124000.RCE.RP.JO3.020131.Appraisal Findings 334
• West; M1, A5 (T)
• East; None
10.4.9 Prominent features affected in the case of Option 2 include:
• West; M1, Stockwood Park Golf Course
• East;1 church, A1(M)
10.4.10 Prominent features affected in the case of Option E3 include:
• West; M1 Junction 9
• East; A505, 1 church
10.5 Surface Access
Infrastructure and service assumptions - roads
10.5.1 For the purposes of surface access demand forecasting, the changes to the existing road
access arrangements were based on the findings of Stage One appraisals. This helped define
the schemes associated with each option, as summarised in Table 10.9 and shown in Figure
10.12. No changes to the Reference Case road access arrangements are assumed when
appraising the option with capacity limited to that incorporated in the Current Land Use Planning
System (Package 1).
10.5.2 Options 2 and E3 would have the same capacities and requirements for road access
improvements.

SERAS Stage Two: Appraisal Findings Report
FL1124000.RCE.RP.JO3.020131.Appraisal Findings 335
Table 10.9: Changes to road access – Luton Options
Scheme
Current Land
Use Planning
System
Option 2 Option E3
1 Luton North East By-pass ! !
2 Widen A1081, M1 to Airport Way ! !
Infrastructure and service assumptions - rail
10.5.3 Additions to the Base Case and Maximum Use of existing runway rail infrastructure and
services were based on Stage One findings and shaped by discussions, with DTLR and SRA in
particular, on the potential to integrate airport-focused schemes with parallel improvements in
infrastructure and services planned to accommodate future increases in non-airport demand.
10.5.4 Schemes and services associated with the options are summarised in Table 10.10 and shown
in Figures 10.13 and 10.14. As indicated in Figure 10.13, the airport is currently served by
Thameslink services at the nearby Luton Airport Parkway station, with the Thameslink 2000
project further increasing both the capacity and scope of these services. While no changes to
rail infrastructure are associated with the options, it is assumed that all services (both
Thameslink 2000 and Midland Mainline) will call at Luton Airport Parkway given increased
airport demand in Options 2 and E3.
10.5.5 It is also assumed that the Luton-Dunstable guided busway will be extended to the airport in
Options 2 and E3, improving accessibility between the airport and the rail station.
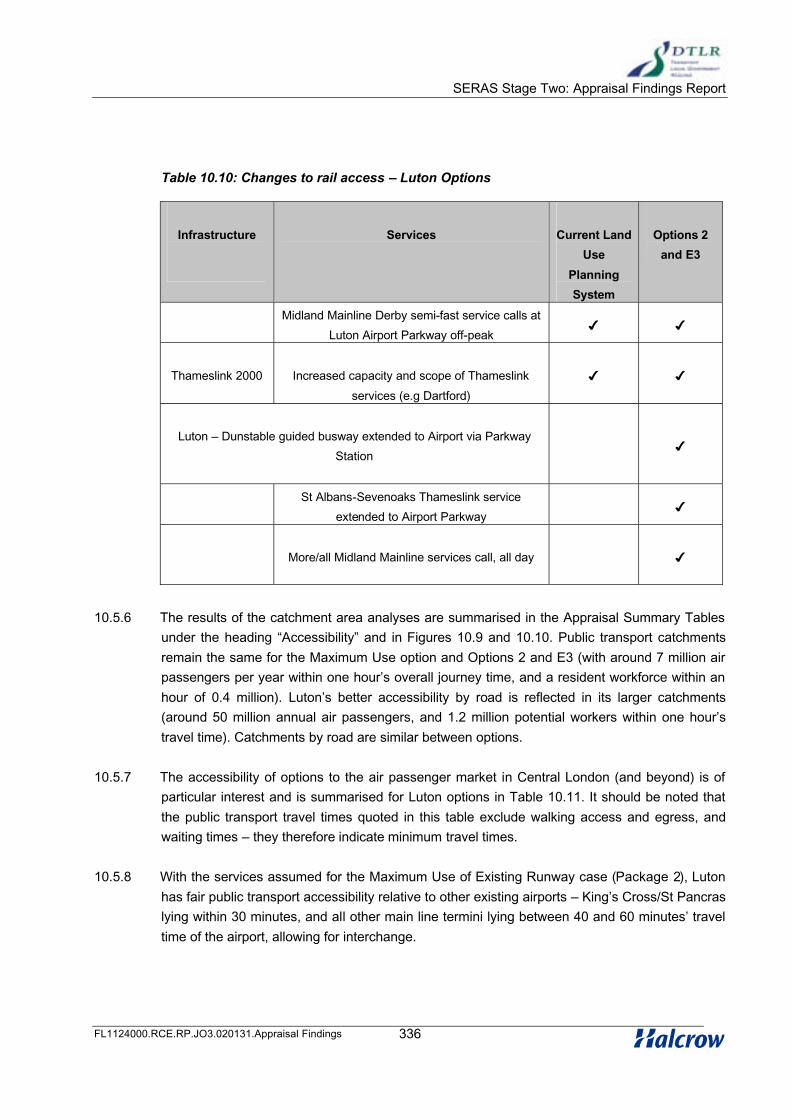
SERAS Stage Two: Appraisal Findings Report
FL1124000.RCE.RP.JO3.020131.Appraisal Findings 336
Table 10.10: Changes to rail access – Luton Options
Infrastructure Services Current Land
Use
Planning
System
Options 2
and E3
Midland Mainline Derby semi-fast service calls at
Luton Airport Parkway off-peak! !
Thameslink 2000 Increased capacity and scope of Thameslink
services (e.g Dartford)
! !
Luton – Dunstable guided busway extended to Airport via Parkway
Station!
St Albans-Sevenoaks Thameslink service
extended to Airport Parkway!
More/all Midland Mainline services call, all day !
10.5.6 The results of the catchment area analyses are summarised in the Appraisal Summary Tables
under the heading “Accessibility” and in Figures 10.9 and 10.10. Public transport catchments
remain the same for the Maximum Use option and Options 2 and E3 (with around 7 million air
passengers per year within one hour’s overall journey time, and a resident workforce within an
hour of 0.4 million). Luton’s better accessibility by road is reflected in its larger catchments
(around 50 million annual air passengers, and 1.2 million potential workers within one hour’s
travel time). Catchments by road are similar between options.
10.5.7 The accessibility of options to the air passenger market in Central London (and beyond) is of
particular interest and is summarised for Luton options in Table 10.11. It should be noted that
the public transport travel times quoted in this table exclude walking access and egress, and
waiting times – they therefore indicate minimum travel times.
10.5.8 With the services assumed for the Maximum Use of Existing Runway case (Package 2), Luton
has fair public transport accessibility relative to other existing airports – King’s Cross/St Pancras
lying within 30 minutes, and all other main line termini lying between 40 and 60 minutes’ travel
time of the airport, allowing for interchange.

SERAS Stage Two: Appraisal Findings Report
FL1124000.RCE.RP.JO3.020131.Appraisal Findings 337
Table 10.11: Accessibility from Central London –Luton options (minutes)
Current Land Use
Planning SystemOptions 2 & E3
By Car, minutes
Blackfriars 91 As current land use planning system
St Pancras/Kings Cross/Euston 85 As current land use planning system
London Bridge 100 As current land use planning system
By Public Transport, tph in
minutes
Blackfriars 6 tph in 40 As current land use planning system
St Pancras/Kings Cross/Euston 1 tph in 26
6 tph in 36
4 tph in 26
6 tph in 36
London Bridge 6 tph in 46 As current land use planning system
10.5.9 The main indicators of surface access demand in 2015 for each option at Luton are summarised
in Tables 10.12 and 10.13. Corresponding results for the forecast year 2030 are presented in
Tables 10.14 and 10.15. Air passenger capacity and demand estimates have been described
above. It should be noted that the amount of unused capacity varies between options –
reflecting the interaction between Luton and other airports in the packages from which these
estimates were derived. The net effect of these changes between packages 1 and 2 in 2015 is
that the number of passengers requiring surface access increases by a factor of just over 2
compared with a three-fold increase in capacity.
10.5.10 The forecast number of on-site employees is assumed to be a function of overall passenger
demand and productivity changes. Further details of the employment forecasts can be found in
Section 10.10.
10.5.11 In 2015, the number of peak hour employee-related car trips is estimated to increase by around
75% between packages 1 and 2, reflecting the increases in total employment and a small shift
towards public transport in Options 2 and E3. Employee trips by public transport are forecast to
more than double. By 2030 Table 10.14 shows that little change is expected in the number of
employee related trips for Options 2 or E3.
10.5.12 Tables 10.13 and 10.15 summarise the air passenger mode split results for each option in 2015
and 2030 respectively. In 2015. Table 10.13 indicates a higher proportion of trips being made
by public transport in Option 2/E3 (20%), compared to 14.5% for Package 1. These results are
influenced by the mixture of passengers by type and their geographical distribution, but it

SERAS Stage Two: Appraisal Findings Report
FL1124000.RCE.RP.JO3.020131.Appraisal Findings 338
appears that air passengers are more inclined to switch mode in response to the introduction of
improved rail services than is the case with employees. By 2030, public transport is estimated
to increase its share of air passengers trips for Options 2 and E3 from 20% to 22% - still well
below that forecast for other airports.
10.5.13 Finally, it is worth noting the changes in overall peak hour road traffic demand generated by
these options, (see Tables 10.13 and 10.15). Table 10.13 shows a near trebling in traffic
between the base year and Package 1 and a further increase of 75% between Package 1 and
Options 2 or E3. By 2030, the overall road traffic demand generated by these options at Luton
is estimated to increase by around 25%.
Table 10.12: Main indicators and employee mode shares – Luton 2015.
Main Indicators
CurrentLand Use PlanningSystem
Options 2& E3
Total capacity (mppa) 10 31
Total passengers requiring surface access (mppa) 8.1 17.4
Total employees on-site 6200 10900
Employees’ Highway trips (AM peak hour): vehicles
Origin 98 174
Destination 534 944
Total 632 1118
Employees’ Public Transport trips (AM peak hour): persons
Origin 10 23
Destination 56 122
Total 66 145
% Public Transport trips
Origin 9% 12%
Destination 9% 11%
Total 9% 11%

SERAS Stage Two: Appraisal Findings Report
FL1124000.RCE.RP.JO3.020131.Appraisal Findings 339
Table 10.13: Air passenger mode choice and overall surface access demand– Luton 2015.
Mode Base Year Current Land Use Planning System Option 2 & E3
No.
mppa% No. % No. %
Underground 0.00 0.0% 0.00 0.0% 0.00 0.0%
Bus 0.33 14.5% 0.58 7.2% 1.67 9.6%
Taxi 0.27 11.8% 0.80 9.9% 1.78 10.2%
Park and fly 0.73 32.0% 3.53 43.6% 6.70 38.5%
Kiss and fly 0.95 41.7% 2.58 31.9% 5.43 31.2%
Premium rail 0.00 0.0% 0.00 0.0% 0.00 0.0%
National rail 0.00 0.0% 0.60 7.4% 1.81 10.4%
Total 2.28 100.0% 8.08 100.0% 17.38 100.0%
Public 0.33 14.5% 1.18 14.6% 3.49 20.0%
Private 1.95 85.5% 6.90 85.4% 13.90 80.0%
Total peak hour demand (including employees, air passengers, freight service traffic)
Roads (vehicles 2-way) 4,750 8,300

SERAS Stage Two: Appraisal Findings Report
FL1124000.RCE.RP.JO3.020131.Appraisal Findings 340
Table 10.14: Main indicators and employee mode shares – Luton 2030.
Main Indicators Options 2 and E3
Total capacity (mppa) 31
Total passengers requiring surface access (mppa) 28.6
Total employees on-site 13800
Highway trips (average AM peak hour): vehicles
Origin 170
Destination 924
Total 1094
Public Transport trips (average AM peak hour): persons
Origin 22
Destination 120
Total 142
% Public Transport trips
Origin 11%
Destination 11%
Total 11%

SERAS Stage Two: Appraisal Findings Report
FL1124000.RCE.RP.JO3.020131.Appraisal Findings 341
Table 10.15: Air passenger mode choice and overall surface access demand – Luton 2030
Mode Base Year Option 2 & E3
No.(mppa)
% No.(mppa)
Underground 0.00 0.0% 0.00 0.0%
Bus 0.33 14.5% 2.96 10.4%
Taxi 0.27 11.8% 2.81 9.8%
Park and Fly 0.73 32.0% 10.98 38.5%
Kiss and Fly 0.95 41.7% 8.41 29.4%
Premium rail 0.00 0.0% 0.00 0.0%
National rail 0.00 0.0% 3.42 11.9%
Total 2.28 100.0% 28.56 100.0%
Public 0.33 14.5% 6.37 22.3%
Private 1.95 85.5% 22.20 77.7%
Total Peak hour demand including employees, air passengers, freight and service traffic
Roads (vehicles 2-way) 10,600
Highway appraisal results – Luton
10.5.14 The highway appraisal has identified a number of sections of the Motorway and Strategic Road
Network that are expected to be under stress (close to or beyond their capacities) in the SERAS
forecast years. The ‘Background Highway Requirements’ are illustrated in Figure 10.13. These
“problem” links have been categorised into those where the potential solution required to solve
the problem in the Base Case would be adequate also to accommodate the airport option under
consideration, and those where an airport option would require a further intervention
(categorised here as an increase in capacity). By 2030, in the vicinity of Luton, the following
sections of the network would be under stress:
• M1: J7 to J9
• M25: J20 to J21
SERAS Stage Two: Appraisal Findings Report
FL1124000.RCE.RP.JO3.020131.Appraisal Findings 342
10.5.15 The additional potential scheme improvements required by the airport options at Luton are
summarised in Table 10.16, and illustrated in Figure 10.12.

SERAS Stage Two: Appraisal Findings Report
FL1124000.RCE.RP.JO3.020131.Appraisal Findings 343
Table 10.16: Highway capacity problems and potential schemes
DescriptionInitial
Standard
Potential standard required by:
2015 2030
Current Land Use Planning System Options 2/E3 Options 2/E3
Airport Access
Luton North East Bypass
(proposed)n/a D2 D2
A1081 from M1 J10a to
Luton NE BypassS2 D2 D2 D3
Strategic Network
M1 J10 to J9 (southbound) D3(M) D3(M) D4(M) D4(M)
M1 J10 to J12 D3(M) D3(M) D3(M) D4(M)
M1 J12 to J13 D3(M) D3(M) D4(M) D4(M)

SERAS Stage Two: Appraisal Findings Report
FL1124000.RCE.RP.JO3.020131.Appraisal Findings 344
Rail Network Performance - Luton
10.5.16 With the increase in capacity arising from longer (12-car) trains on Thameslink services
following the Thameslink 2000 project, airport related congestion issues are not expected
between the Airport Parkway station and London. Airport related traffic is projected to comprise
just 1.3% of peak Thameslink traffic on the most crowded section of the line (Mill Hill to West
Hampstead) with the Current Land Use Planning System Option.
10.5.17 With additional services assumed to call at Luton Airport Parkway in the Maximum Use option,
the proportion of airport related traffic on Thameslink is projected only to rise to just over 2%,
with more than 1/3 of airport trips forecast to use the non-stop Midland Mainline service to St
Pancras. Airport traffic would comprise 14% of peak demand on these trains, leading to high
load factors, but lengthening of these services, assumed to comprise only 2 cars in the
modelling, by 50% is being considered by the train operating comnpany independently of airport
growth issues. Further lengthening is likely to meet increased demand.
10.5.18 Airport related demand in this rail corridor is forecast to increase further by 2030, comprising
just over 3% of peak trips on Thameslink and 17% on Midland Mainline. These will, however,
not contribute significantly to crowding on either service.
10.6 Environment: Land Take
10.6.1 The environmental issues considered in Stage Two of SERAS builds on work undertaken in
Stage One on land use, ecology, heritage, landscape and townscape, water, noise and air
quality. Stage Two in addition appraises contamination and community issues. For each of
these environmental topics a baseline is defined and then the results of the appraisal of each
option is presented. Details of existing land uses and environmental features within the study
area are provided in Figures 10.15 to 10.18. Summaries of the key impacts of each option are
presented in the Appraisal Summary Table. Fuller details of the baseline data and appraisal of
options can be found in the supporting environmental appraisal report.
10.6.2 The details of further land take in each option for additional freight facilities was provided after
the environmental appraisal had been completed and reported on. The appraisal of the impact
of the additional freight facilities therefore has not been done to the same level of analysis and
provides only an indicative estimation of the likely levels of impact.

SERAS Stage Two: Appraisal Findings Report
FL1124000.RCE.RP.JO3.020131.Appraisal Findings 345
Existing Conditions
Land Use – residential, commercial/industrial, public buildings, recreation, agriculture,planning constraints (Figure 10.15)
10.6.3 The Luton Airport Site is located in South Bedfordshire, with the county of Hertfordshire
immediately to the south and east. It is situated within the area covered by Luton Borough
Council. The airport is sited in largely rural surroundings with the town of Luton to the north and
west. There are villages and scattered farms and properties to the south and east.
10.6.4 Commercial areas within the maximum option boundary include some small scale works and
part of an employment area defined in the Local Plan. Suggested commercial uses within this
employment area include light industrial and office employment, warehousing, leisure facilities
and a hotel. There are no schools, hospitals or places of worship within the area of proposed
expansion. There are no nationally designated footpaths within the area, although there is one
recreational area. These playing fields are classified as Open Space, a district designation to
preserve the area for recreational use.
10.6.5 Other than the above uses and scattered woodlands, the predominant land use in the area is
agriculture. All land surrounding the airport is of Grade 3 agricultural land quality.
10.6.6 The areas to the south west, south and east of the current site are designated as Green Belt,
with further such areas to the west beyond the M1 and to the north-east of Luton.
Contamination (Figure 10.15)
10.6.7 There are 22 possible sources of contamination identified in the study area. Of these 6 are
considered to have potential for greater than ‘minor’ scale contamination. The only area with the
potential for a ‘great’ scale of contamination is a landfill site covering approximately 49 hectares.
One area, an industrial estate, has the potential for a ‘moderate’ scale of contamination. Areas
with the potential for a ‘moderate/minor’ scale of contamination comprise: a ‘Works’, an
engineering works and two fuel sites.
Ecology (Figure 10.16)
10.6.8 The following sites of nature conservation value within the Area of Search are all priority
habitats in the Bedfordshire Local Biodiversity Action Plan. The following designated sites are
located within the area of search:
SERAS Stage Two: Appraisal Findings Report
FL1124000.RCE.RP.JO3.020131.Appraisal Findings 346
• A nationally designated site (of high ecological value) Wain Wood is ancient semi-
natural woodland dominated by oak and hornbeam. Within the woodland are
areas of calcareous and acidic grassland. The presence of the Purple Hairstreak
butterfly is notable.
• Three County Wildlife Sites (of medium ecological value), George Wood, Luton
Hoo woods, and Hardingdell and Fernell’s Woods. These are important as
ancient woodland sites and for the invertebrates, fungi and lichens that these
areas can support. Luton Hoo is also a parkland and wood pasture.
• A further County Wildlife Site, Wigmore Park (also of medium ecological value) is
an area of rough grassland and scrub. From this site there is a strip of wooded
lane (a green lane), also a part of the county wildlife site, that extends to
woodland at the eastern end of the runway (see below).
• Five sites of district importance (Burnt Wood, Withstocks Wood, Limekiln Wood
and Diamondend Springs and Sewett’s Wood, Sellbarn’s Dell, Hurst Wood and
an unnamed wood immediately east of the current runway).
10.6.9 Two of these sites, Burnt Wood and the site immediately east of the current airport boundary,
are situated within the area of proposed development. These are all mixed or broadleaved
woodland sites, that are likely to be ancient woodland, supporting a mixture of trees species as
well as being important for ground plant communities. Important species of birds, mammals,
insects and lichens are also likely to be present.
10.6.10 From aerial photographs and the London Luton Airport development brief, it has also been
possible to identify five other sites that are likely to be of low (district) ecological value, though
they do not have a conservation designation. Together these sites add to the ecological
connectivity of the woodland in the area and include:
• An area of neutral/calcareous grassland with areas of scattered broadleaved
woodland;
• A belt of broadleaved woodland linked to the designated woodland;
• Recently developed rough grassland and scrub;
• A small area of acid grassland;
• Dane Street Meadow which is managed for nature conservation purposes;
• Approximately 90 ha of grassland surrounds the runway and taxiways and
although managed for operational purposes, this habitat supports skylarks and
brown hares.

SERAS Stage Two: Appraisal Findings Report
FL1124000.RCE.RP.JO3.020131.Appraisal Findings 347
10.6.11 The arable farmland that surrounds the current airport boundary has two nationally important
priority habitats for conservation as outlined in the Local Biodiversity Action Plan, these being
cereal field margins and ancient and/or species-rich hedgerow. There could be approximately
2km of both habitats within the maximum option boundary.
Heritage (Figure 10.17)
10.6.12 Archaeology - Although the area of the current airport and its proposed extension contains a
relatively low level of known archaeological sites, as defined by the National Monuments
Record, this would appear likely to be a product of the relatively low level of archaeological
investigation in the area in the past and it is significant to note that the recent archaeological
fieldwork in the area has revealed a range of multi-period sites. These include prehistoric and
Roman sites discovered during recent excavations. This would suggest that the proposed area
of expansion is likely to contain further hitherto undetected archaeological sites. The nature of
the archaeology in the area is discussed below:
• Prehistoric – the proposed development area contains two prehistoric findspots,
comprising a handaxe and a quantity of flints and pot sherds;
• Roman – There are two known Roman sites and another possible site which
may be a substantial Roman building;
• Early Medieval - The area contains one early medieval site comprising the
possible site of an Anglo-Saxon cemetery (complete with rich grave goods)
discovered in 1913. The exact location of the site is uncertain.
• Medieval –There is one likely medieval site. Unspecified medieval features have
been uncovered. The area around these sites is also designated in the Local
Plan as an Archaeologically Sensitive Area. Immediately to the south of the
area of proposed expansion lies the Scheduled Ancient Monument of Someries
Castle, a medieval magnate’s residence containing surviving 15th century
buildings and the remains of a formal garden; and
• Modern – there is one modern (1900-2001) site, Spittlesea Hospital, the former
Luton Infectious Diseases Isolation Hospital, which was constructed in 1912.
10.6.13 In the absence of contextual information regarding the above archaeological sites, all those
other than Scheduled Ancient Monuments, which are of national value, and Archaeologically
Sensitive Areas, which are considered to be of regional value, have for the purposes of this
study been considered to be of county/district value, except for those identified as of potential
higher or lower value in the Appraisal sections below.
10.6.14 Listed Buildings - The study area contains 10 Listed Buildings all of which are of Grade II.

SERAS Stage Two: Appraisal Findings Report
FL1124000.RCE.RP.JO3.020131.Appraisal Findings 348
Landscape and Visual (Figure 10.18)
10.6.15 Landscape/Townscape - The landscape in the vicinity of Luton falls within the Chilterns
although most of the study area falls outside of that part of the Chilterns that has been
designated an Area of Outstanding Natural Beauty (AONB). The landscape within 5km of the
site at Luton has been divided into four areas of distinct landscape and townscape character
and these reflect the types of landscapes that are typical throughout the Chiltern Hills.
• North Luton Rolling Plateau extends over the dip slope from the principal Chiltern
escarpment. This is an area of open, rolling arable landscape of large fields with
very few hedgerows. The landscape has high levels of intervisibility and is
dominated by the presence of the urban areas of Luton. Pylons are a highly
visible feature in the landscape. The general value of this landscape is assessed
as low;
• Luton Escarpments comprise a group of relatively small areas that retain a
distinctive scarp character reminiscent of the principal Chiltern scarp to the north.
The scarp slopes are highly visible landforms and provide panoramic views of the
surrounding areas. Several areas of the scarp are designated at either the
county or local level and Warden Hill falls within the Chilterns AONB boundary.
The overall value of these landscapes is assessed as medium/high;
• Plateau with Valleys is an extensive area of typically Chiltern landscape. The
landscape is characterised by the combination of well-wooded plateau areas
separated by more intimate dry valleys. There is an extensive network of winding
lanes, which are usually enclosed by banks or hedgerows, and many small
villages. The area is designated locally as a Landscape Conservation Area but is
for the most part excluded from the Chilterns AONB. The overall value of this
landscape is assessed as medium; and
• Lee Valley is a distinct river valley to the south east of Luton. Although the valley
shares many characteristics with other principal arterial valleys in the Chilterns,
the Lee Valley has been less adversely affected by transport and other urban
fringe influences. The valley has a mature and well-wooded character and is
designated as an Area of Great Landscape Value. The value is assessed as
medium/high.
10.6.16 Visual - The indicative zone of potential visual impact (ZVI) of the maximum extent of AirportOptions boundaries extends principally over the Plateau with Valleys to the north and east of
the existing airport and to the opposite slopes of the Lee Valley. Much of the urban area of
Luton is screened from the airport by the steep scarp slope. The present airport occupies some
of the highest ground in the vicinity and occasional glimpses can be gained from more distant
hilltops to the north and north-east in both the Plateau with Valleys and the North Luton Rolling
Plateau.

SERAS Stage Two: Appraisal Findings Report
FL1124000.RCE.RP.JO3.020131.Appraisal Findings 349
10.6.17 Key visual receptors within 5km of the site would include residents in the farms, villages,
hamlets and other settlements. The village of Breachwood Green is particularly sensitive due to
its ridge-top location and open views towards the site of the airport. Other sensitive receptors
would include visitors to Luton Hoo Park.
Community
10.6.18 Community Infrastructure – There are four tiers of settlement in the immediate vicinity of the
site: the urban area of Luton; villages such as Breachwood Green and Whitwell; hamlets such
as Tea Green, Wandon End and Peters Green; and scattered farmsteads and other properties.
10.6.19 Community Structure/Distinctiveness – The population is 183,300. Luton is the largest urban
area, and is surrounded by largely rural areas. To the west it merges with the built-up area of
Dunstable. 87% of the Core Catchment Area is already built-up and Luton is unable to meet its
own future housing needs even without major expansion of the airport.
10.6.20 Employment – Luton has experienced a protracted decline in its core employment base, which
is dominated by the Vauxhall car plant (the closure of which was announced recently).
Unemployment levels, at 5.3%, are above the national average.
10.6.21 The High Adverse impacts of Options appraised at Luton are summarised below.
High Adverse Impacts: Option 2
10.6.22 The cumulative effects on the Heritage resources is considered to be HA as a consequence of
the potential for loss without record of undetected sites from an area of 88ha of landtake. This
effect could however be substantially mitigated through the implementation of an agreed
programme of archaeological prospection, evaluation and excavation prior to the construction
programme. Since there are no direct impacts upon designated archaeological sites,
Conservation Areas or Historic Parks and Gardens such mitigation through prior excavation is
likely to reduce effects on heritage resources, to LA.
10.6.23 Since housing capacity in Luton is already constrained the additional demand generated by
airport expansion either would have to be met elsewhere, or could be met locally only by
substantial change to the settlement pattern. This would be likely to take the form of major
incursions into the Green Belt or the establishment of a new settlement. In either case, urban
development would be likely to subsume the surrounding pattern of rural settlement. This would
represent an HA effect on the structure and distinctiveness of local communities.
10.6.24 The loss of one locally designated site reduces the scope for mitigation. There will also be a
loss of 109 ha of Grade 3 agricultural land.

SERAS Stage Two: Appraisal Findings Report
FL1124000.RCE.RP.JO3.020131.Appraisal Findings 350
High Adverse Impacts: Option 2 plus Freight
10.6.25 Option 2 with additional facilities for freight is expected to have similar impacts to Option 2, but
also the loss of more agricultural land, the loss of a designated archaeological site and an area
of unknown archaeological potential.
10.6.26 HA impacts on housing development would be the same as Option 2.
High Adverse Impacts: Option E3
10.6.27 Option E3 will be as for Option 2 with regard to the heritage resource but with 116ha of new
landtake.
10.6.28 Housing capacity would be constrained with additional demand needing to be met elsewhere
leading to HA impacts
10.6.29 There are likely to be Medium/High Adverse impacts to properties in Wigmore, as well as on
access routes, during construction.
High Adverse Impacts: Option E3 plus Freight
10.6.30 The impacts of Option E3 plus freight will be as for E3 with HA impacts relating to housing
capacity issues and construction disturbance. There would also be a reduced buffer zone at
Someries Castle Scheduled Ancient Monument.
10.7 Environment: Water Resources
Existing Conditions
10.7.1 Luton Airport is situated within the Upper Lee surface water catchment. The only surface
waterbody within the study area is the Luton Hoo Lake, which has been artificially modified; the
inflow and outflow of the lake is the River Lee. The lake also receives the runoff from the airport
by surface water outfall (see Figure 10.19).
10.7.2 The water quality in the River Lee through Luton reflects the pressures of urban runoff and
discharges, including storm sewer outfalls. The quality improves immediately south of the
urban area, which corresponds to the location of Luton Hoo Lake. There is a high proportion of
contaminated suspended solids within the River Lee through Luton; these settle out in the Luton
Hoo Lake resulting in improved water quality downstream.
SERAS Stage Two: Appraisal Findings Report
FL1124000.RCE.RP.JO3.020131.Appraisal Findings 351
10.7.3 Less than 1% of the study area has been designated within the 1 in 100 year flood risk area
identified by the Environment Agency.
10.7.4 The Upper Chalk is at outcrop within the study area, with the Middle Chalk being exposed in the
valley bottom of the River Lee. The Upper Chalk is the major aquifer in the area from which
large quantities of water are abstracted; the study area intersects the source protection zones
for ten public water supplies, and contains six other licensed abstractions. The Chalk is able to
provide large quantities of water due to its system of fissures, which allow rapid flow; there are
also several springs in the study area. This characteristic, however, makes the aquifer highly
vulnerable to contamination.
10.7.5 From a regional perspective, the available water resources are virtually fully committed. There
is limited scope for further groundwater development within the resource zone that supplies
Luton Airport. Additionally, there are unsustainable groundwater abstractions occurring within
adjacent resource zones.
Impact of Options
10.7.6 The options have been assessed against a base case, which is the current land use planning
system, and therefore only considers impacts that are additional to those assessed under the
base case. The assessments consider the sensitivity of the water environment and the
potential to cause harm, which includes scope for mitigation. Table 10.17 below summarises
the assessments for each of the water objectives, for each of the options.
10.7.7 The options at Luton present a potential impact on groundwater and water resources as ‘High’
and ‘High* Adverse’ respectively. The impacts on the other water objectives are ‘Low Adverse’,
as many of them may be mitigated.
10.7.8 Option 2 (with and without freight) potentially impacts upon a spring. To prevent contamination
of the underlying aquifer, appropriate measures would need to be taken during both
construction and operation of the airport development option. Flooding impacts may be
mitigated using balancing ponds, to attenuate runoff and take out the peak flow. The
effectiveness of these measures is dependent upon adequate sizing of ponds, and the use of
appropriate treatment techniques.
10.7.9 The runways in both options (2 and E3, with and without freight), intersect a zone 3 of a source
protection zone for a public water supply. Zone 3 represents the total catchment area to the
source, and therefore any contaminants reaching the groundwater within this area may reach
the supply. It is essential that this does not occur, however all groundwater should be afforded
equal protection as the aquifer forms an important resource.
10.7.10 Large increases in passenger numbers significantly increase the airport’s demand for water,
and also within the surrounding residential areas that provide the human resource base for the

SERAS Stage Two: Appraisal Findings Report
FL1124000.RCE.RP.JO3.020131.Appraisal Findings 352
Airport. Without any further water resource development or effort to manage demand, the
resource zone that supplies Luton Airport would have a deficit. Assuming that water companies
maximise existing strategic links and their use of existing and planned licensed resources
between resource zones, the Luton resource zone would still have a slight deficit. This also
assumes that companies will achieve their leakage reduction targets, and also allows for
environmental demands. Abstraction recovery for the benefit of the environment will be a
significant impact upon Three Valleys Water (the water company that supplies the Airport).
10.7.11 Given the large increases in demand for water imposed by these options, and the pressures
described above, it may be difficult to meet this demand, even if appropriate supply and
demand management techniques are put in place, and other water users within the region are
water-efficient.
Table 10.17: Luton Water Appraisal Summary Table
Option Base Case2 (with or without
freight)
E3 (with or without
freight)
Surface Water River receives treated
Airport drainage. The
quality in the river
increases. No licensed
abstractions within the
study area.
Low Adverse
No additional impacts as
compared to the base
case.
Low Adverse
No additional impacts as
compared to the base
case.
Low Adverse
GroundwaterStudy area is major
aquifer. 16 licensed
abstractions (including
SPZs for 10 PWS) within
the study area.
High Adverse
Study area is major
aquifer. Potential impact
on spring may be
mitigated using
appropriate construction
techniques. Runway
intersects a zone 3 of an
SPZ for a PWS.
High Adverse
Study area is major
aquifer. Runway
intersects a zone 3 of an
SPZ for a PWS.
High Adverse
FloodingLess than 1% of the study
area contains floodplain
Low Adverse
Increased flood risk could
be mitigated using
balancing pond.
Low Adverse
Increased flood risk could
be mitigated using
balancing pond.
Low Adverse

SERAS Stage Two: Appraisal Findings Report
FL1124000.RCE.RP.JO3.020131.Appraisal Findings 353
Option Base Case2 (with or without
freight)
E3 (with or without
freight)
Water
Resources
No significant change to
present levels of demand.
Low Adverse
It may be difficult to meet
the significant increase in
demand, even through
supply and demand
management, and water
saving technology.
High* Adverse
It may be difficult to meet
the significant increase in
demand, even through
supply and demand
management, and water
saving technology.
High* Adverse
10.8 Environment: Noise Impacts
Aircraft Noise: Daytime
10.8.1 The Luton contours for 1999 and each of the Options in 2015 or 2030 as appropriate are shown
on Figures 10.20 to 10.33. Tables 10.18 to 10.20 give the areas and estimated populations
under the daytime LAeq,16h noise contours for each of these scenarios with changes against the
Existing Situation and the Base Case respectively. It is noted that the 1999 Luton contours were
produced for the airport using the INM noise model. The predicted contours for this study were
produced using the ANCON 2 model. As there are systematic differences between the two
models, comparisons between the existing situation and future contours for Luton should only
be taken as an approximate indication of the likely changes.
10.8.2 Luton currently exposes a larger population than Stansted to aircraft noise. A population of
8,300 lies within the 1999 57 dB contour. From the ‘London Luton Airport Development Brief’
(LLAOL, 2000) the 57 dB contour area in 1984 was 31.1 km2. The daytime noise climate
around Luton has therefore improved overall since the mid-1980s in line with Gatwick and
Heathrow. However, the noise contours are now growing again due to the airport’s rapid
growth in traffic since 1996.
Options in 2015
10.8.3 The current Land Use Planning system is the Base Case for 2015. With this scenario the
population under the 57 dB contour will reduce to 6,400. The reduction is again due to the
aircraft fleet becoming quieter with the phase out of older aircraft and the introduction of quieter
models, and other policies.

SERAS Stage Two: Appraisal Findings Report
FL1124000.RCE.RP.JO3.020131.Appraisal Findings 354
10.8.4 Comparing Option 2 with the Base, the population under the 57 dB to 69 dB noise contours will
increase substantially. The population within the 57 dB contour will increase by 6,700 and in the
63 dB contour by approximately 900. Against the 1999 contours the population subject to 57
dB would increase by 4,800 and that exposed to 63 dB by 1,000.
10.8.5 Option E3 involves a full length runway realigned NE-SW to replace the existing runway. This
results in considerably reduced noise impacts than Option 2. In 2015, the population forecast
within the 57 dB contour would be 10,400 compared with 13,100 with option 2 and 6,400 in the
Base Case. Within 63 dB contours, the respective populations affected are 200 (Option E3),
2,000 (Option 2) and 1,000 (Base Case). Option E3 will cause some areas to be newly affected
by aircraft noise. These include some western parts of Hitchin, northern parts of Harpenden and
some eastern areas of Luton, which would fall under the 57 dB contour.
Options in 2030
10.8.6 The area under the 57 dB contour of Option 2 in 2030 increases by 60% over that in 2015, from
43.6 sq km to 69.8 sq km. The corresponding population increases by around 20,000 to
33,000. The additional population would be concentrated in central and southern parts of Luton
and in Stevenage.

SERAS Stage Two: Appraisal Findings Report
FL1124000.RCE.RP.JO3.020131.Appraisal Findings 355
Table 10.18 : Luton Daytime Aircraft Noise Contours – 2015 vs 1999 Existing Situation
Area (sq km)
Land Use Planning Option 2 Option E3
Total Change Total Change Total Change
LAeq
(dB)
Existing
19992015 cw 1999 2015 cw 1999 2015 cw 1999
>54 n/a 33.9 N/a 72.0 N/a 72.4 n/a
>57 19.4 19.7 0.3 43.6 24.2 40.8 21.4
>60 12 11.1 -0.9 25.5 13.5 23.1 11.1
>63 7.5 6.2 -1.3 14.5 7.0 13.6 6.1
>66 4.6 3.3 -1.3 8.2 3.6 8.1 3.5
>69 2.7 1.8 -0.9 4.5 1.8 4.6 1.9
>72 1.5 0.9 -0.6 2.4 0.9 2.5 1
Population (000s)
Land Use Planning Option 2 Option E3
Total Change Total Change Total Change
Existing
1999
2015 cw 1999 2015 cw 1999 2015 cw 1999
>54 n/a 10.5 n/a 35.7 n/a 19.4 n/a
>57 8.3 6.4 -1.9 13.1 4.8 10.4 2.1
>60 3.5 2.9 -0.6 5.7 2.2 1.4 -2.1
>63 1 1.1 0.1 2.0 1 0.2 -0.8
>66 0.5 <0.1 n/a 0.4 -0.1 0.1 -0.4
>69 0 <0.1 n/a 0.1 0 0.1 0.1
>72 0 <0.1 n/a 0.1 0 <0.1 n/a
* Contours produced using INM, not ANCON 2
Table 10.19 : – 2015 vs 2015 Base Case
Area (sq km)
Land Use Option 2 Option E3
2015 Total Change Total Change
LAeq
(dB)
Base Case 2015 Cw Base 2015 Cw Base
>54 33.9 72.0 38.1 72.4 38.5
>57 19.7 43.6 23.4 40.8 21.1
>60 11.1 25.5 14.4 23.1 12
>63 6.2 14.5 8.3 13.6 7.4
>66 3.3 8.2 4.9 8.1 4.8
>69 1.8 4.5 2.7 4.6 2.8

SERAS Stage Two: Appraisal Findings Report
FL1124000.RCE.RP.JO3.020131.Appraisal Findings 356
Area (sq km)
Land Use Option 2 Option E3
2015 Total Change Total Change
LAeq
(dB)
Base Case 2015 Cw Base 2015 Cw Base
>72 0.9 2.4 1.5 2.5 1.6
Population (000s)
>54 10.5 35.7 25.2 19.4 8.9
>57 6.4 13.1 6.7 10.4 4
>60 2.9 5.7 2.8 1.4 -1.5
>63 1.1 2.0 0.9 0.2 -0.9
>66 <0.1 0.4 0.3 0.1 0
>69 <0.1 0.1 0 0.1 0
>72 <0.1 0.1 0 <0.1 0
Table 10.20 : Luton Daytime Aircraft Noise Contours – 2030 vs 2015 & 1999
Area (sq km)
Max Use Option 2
Existing Total Change Total Change Change
LAeq
(dB)
1999* 2030 Cw 1999 2030 Cw 1999 cw 2015
>54 n/a 33.9 N/a 122.6 N/a 88.7
>57 19.4 19.7 0.3 69.8 50.4 50.1
>60 12 11.1 -0.9 42.1 30.1 31
>63 7.5 6.2 -1.3 24.6 17.1 18.4
>66 4.6 3.3 -1.3 14 9.4 10.7
>69 2.7 1.8 -0.9 7.8 5.1 6
>72 1.5 0.9 -0.6 4.3 2.8 3.4
Population (000s)
Max Use Option 2
Existing Total Change Total Change Change
LAeq
(dB)
1999* 2015 Cw 1999 2030 Cw 1999 Cw 2015
>54 n/a 10.5 N/a 63.5 N/a 53
>57 8.3 6.4 -1.9 33 24.7 26.6
>60 3.5 2.9 -0.6 11.2 7.7 8.3
>63 1 1.1 0.1 5.5 4.5 4.4
>66 0.5 <0.1 N/a 1.8 1.3 1.2
>69 0 <0.1 N/a 0.3 0.3 0.2
>72 0 <0.1 N/a 0.1 0.1 0.1
* Contours produced using INM, not ANCON 2
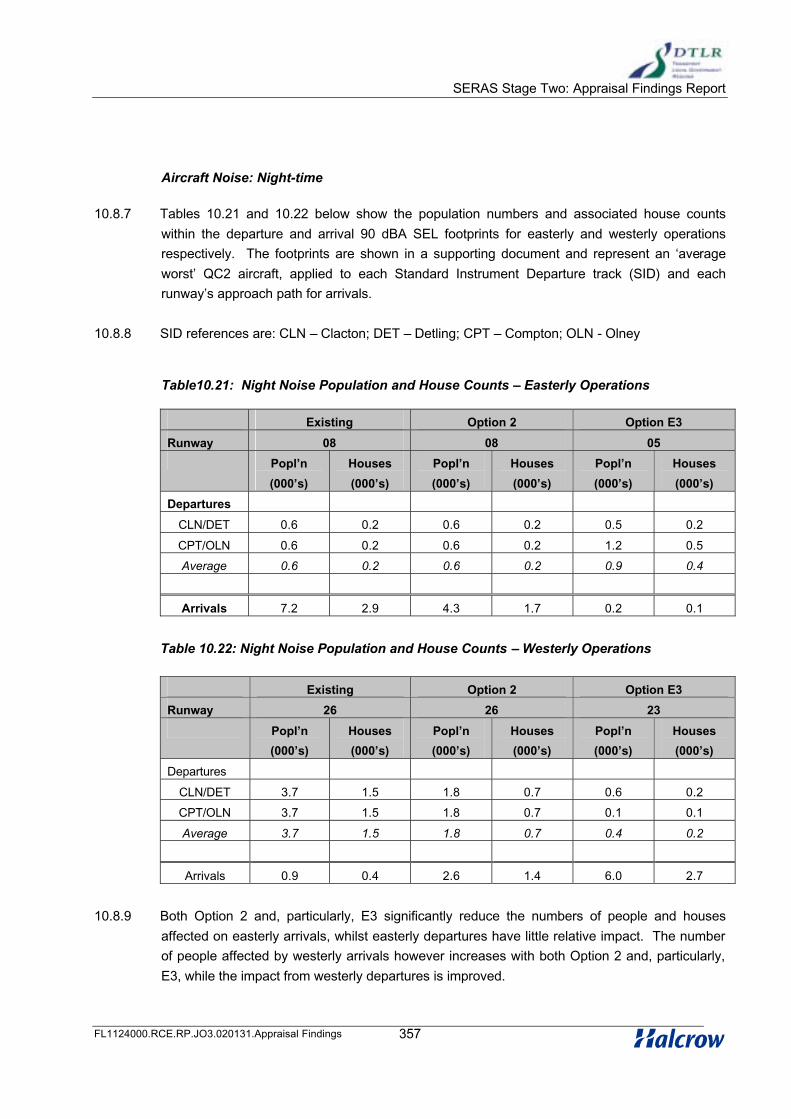
SERAS Stage Two: Appraisal Findings Report
FL1124000.RCE.RP.JO3.020131.Appraisal Findings 357
Aircraft Noise: Night-time
10.8.7 Tables 10.21 and 10.22 below show the population numbers and associated house counts
within the departure and arrival 90 dBA SEL footprints for easterly and westerly operations
respectively. The footprints are shown in a supporting document and represent an ‘average
worst’ QC2 aircraft, applied to each Standard Instrument Departure track (SID) and each
runway’s approach path for arrivals.
10.8.8 SID references are: CLN – Clacton; DET – Detling; CPT – Compton; OLN - Olney
Table10.21: Night Noise Population and House Counts – Easterly Operations
Existing Option 2 Option E3
Runway 08 08 05
Popl’n
(000’s)
Houses
(000’s)
Popl’n
(000’s)
Houses
(000’s)
Popl’n
(000’s)
Houses
(000’s)
Departures
CLN/DET 0.6 0.2 0.6 0.2 0.5 0.2
CPT/OLN 0.6 0.2 0.6 0.2 1.2 0.5
Average 0.6 0.2 0.6 0.2 0.9 0.4
Arrivals 7.2 2.9 4.3 1.7 0.2 0.1
Table 10.22: Night Noise Population and House Counts – Westerly Operations
Existing Option 2 Option E3
Runway 26 26 23
Popl’n
(000’s)
Houses
(000’s)
Popl’n
(000’s)
Houses
(000’s)
Popl’n
(000’s)
Houses
(000’s)
Departures
CLN/DET 3.7 1.5 1.8 0.7 0.6 0.2
CPT/OLN 3.7 1.5 1.8 0.7 0.1 0.1
Average 3.7 1.5 1.8 0.7 0.4 0.2
Arrivals 0.9 0.4 2.6 1.4 6.0 2.7
10.8.9 Both Option 2 and, particularly, E3 significantly reduce the numbers of people and houses
affected on easterly arrivals, whilst easterly departures have little relative impact. The number
of people affected by westerly arrivals however increases with both Option 2 and, particularly,
E3, while the impact from westerly departures is improved.

SERAS Stage Two: Appraisal Findings Report
FL1124000.RCE.RP.JO3.020131.Appraisal Findings 358
Surface Access Noise: Highways
10.8.10 Table 10.23 gives the overall results (total EPA) from the GOMMMS plan level assessment for
road traffic noise. The Surface Access Noise section of Appraisal Summary Table 10.13 also
includes the EPA values split by noise contour bands.
Table 10.23 – Luton Surface Access Noise Assesssment: Highways
Total change in Estimated Population Annoyed (EPA) by road traffic noise (‘000)
Year Option 2 Option E3
2015 + 6.3 + 6.3
10.8.11 The noise impacts of changes in road traffic for Option 2 and option E3 in 2015 are compared
with the Base Case road network. The same changes arise from both of these Options. A
number of roads in the Luton area are affected, including the minor road between Chalton and
Streatley and the B655 from Barton-le-Clay to Hitchin, parts of the A505 and the A1081 and a
link road in Stevenage. The total increase in Estimated Population Annoyed (EPA) by road
traffic noise is 6,300 for both Option 2 and E3.
Surface Access Noise: Railways
10.8.12 There would be no significant increases in railway services for Option 2 and Option E3 over the
Base Case. Therefore, there would be no increases in railway noise attributable to these
Options.

SERAS Stage Two: Appraisal Findings Report
FL1124000.RCE.RP.JO3.020131.Appraisal Findings 359
10.9 Environment: Local Air Quality Impacts
Introduction
10.9.1 Air quality results are provided for representative options at each airport, for 2015 and 2030 as
appropriate. The air quality statistics used as assessment criteria for defining poor air quality in
Stage Two of SERAS are: annual mean Nitrogen Dioxide concentrations of 40µg/m3; and the
90th percentile of running 24-hour mean PM10 concentrations of 50µg/m3. In practice, annual
mean PM10 compared to a statistic of 40µg/m3 are also reported, as the 90th percentile values
are a simple factor of these. The Air Quality Key Indicator for SERAS Stage 2 is 'the number of
people exposed to an exceedance of the air quality standard, weighted by the degree of
exceedance'. The higher the key indicator, the worse the air quality impact is.
Results
10.9.2 Figures 10.36 to 10.40 illustrate the air pollution contours for Luton options in 2015. For each
option, figures are for annual mean Nitrogen Dioxide, and for annual mean PM10 and 90th
percentile of 24hour mean PM10 where relevant. The outer box is the study area for air quality in
each case. Each figure also includes a table of the numbers of people exposed under each
contour. Table 10.24 also summarises, for Nitrogen Dioxide, the population exposed to
exceedances and determines the SERAS Key Indicator, to allow direct comparison between
options and packages. Table 10.25 provides similar results for PM10.
10.9.3 Only Option 2 at Luton results in population exposed to exceedances for annual mean Nitrogen
Dioxide in 2015, with around 45 people exposed. Expressed as a simple average, airport
related Oxides of Nitrogen in 2015 account for between 17% (base) and 35% (option 2) of total
Oxides of Nitrogen in the Luton study area. ‘Airport related’ includes aircraft emissions, airside
emissions, and airport related surface access emissions. The figures clearly show the highest
annual mean Nitrogen Dioxide contours fall directly on the runways, and particularly the ends of
runways, associated with acceleration during take-off roll. The figures also show that major
roads in the area are not contributing to areas of exceedance.
10.9.4 These results clearly show that Luton options in 2015 have no impact on PM10, with no
population exposed to exceedances of either annual mean PM10 or 90th percentile of 24hour
mean PM10, in any option. Expressed as a simple average, airport related PM10 in 2015
accounts for just 2-3% of total PM10 in the Luton study area across all options. Very few
locations, limited to over the runways, exceed air quality statistics.

SERAS Stage Two: Appraisal Findings Report
FL1124000.RCE.RP.JO3.020131.Appraisal Findings 360
Table 10.24: Nitrogen Dioxide Key Indicators - Luton 2015
Population exposed to exceedance of annual mean
NO2 of 40 µg/m3
Package Option
40-50
µg/m3
50-60
µg/m3
60-70
µg/m3
70-80
µg/m3
80-90
µg/m3
90-100
µg/m3
>100
µg/m3
Total
popul’n
exposed
Key
Indicator
1 Base Case 0 0 0 0 0 0 0 0 0
2 Option 2 46 0 0 0 0 0 0 46 46
2 Option E3 0 0 0 0 0 0 0 0 0
Table 10.25: PM10 Key Indicators - Luton 2015
Annual mean PM10 of
40 µg/m3
90th Percentile of 24hour
mean PM10 of 50 µg/m3
Package Option
Total
population
exposed
Key
Indicator
Total
popul’n
exposed
Key Indicator
1 Base Case 0 0 0 0
2 Option 2 0 0 0 0
2 Option E3 0 0 0 0
Results 2030
10.9.5 Options at Luton are in place in 2015. There are no additional results for 2030.
10.10 Employment
Employment Forecasts
10.10.1 Employment forecasts for each option based on current employees at Luton and projected
forwards to 2015 and 2030 are shown in Table 10.26. Luton’s employee: passenger ratio
reflects the proportion of low cost passengers and separate allowance is made for the forecast
high freight volumes. All other applied growth factors are similar to those applied at other
airports.

SERAS Stage Two: Appraisal Findings Report
FL1124000.RCE.RP.JO3.020131.Appraisal Findings 361
10.10.2 Total direct on/off site employment at Luton is estimated to almost double by 2015 from current
levels of just over 7,000, to just under 13,000 direct employees. By 2030 the number of direct
on/off site employees could increase to just over 16,000 with growth in forecast passenger
traffic more than offsetting productivy gains. Handling the high volumes of freight forecast at
Luton could generate a further 7,000 or so direct on/off site jobs and 2,000 indirect jobs in 2015
and 2030.
Table 10.26: Current and forecast employment at Luton by option 2015 & 2030
Current & Forecaset
Employment by Option
Current
1998
2/E3
Core
2015
2/E3 *
+ Freight
2015
2/E3
Core
2030
2/E3 *
+ Freight
2030
Direct on-site 6,200 10,900 17,300 13,800 19,700
Direct off-site 900 1,800 2,900 2,300 3,400
Indirect 2,100 3,800 6,100 4,800 6,900
Total Employment 9,300 16,500 26,300 20,900 30,000
Passengers (mppa) 4 21 21 29 29
Freight tonnes (000s) 60 N/a 1,092 N/a 1,245
Direct employees/mppa 1,624 731 1,162 564 809
Total employee/mppa 2,111 949 1,513 732 1,051
* Includes estimated employees from substantial change in assumed freight component

SERAS Stage Two: Appraisal Findings Report
FL1124000.RCE.RP.JO3.020131.Appraisal Findings 362
10.11 Land Use/Urbanisation
Summary
10.11.1 In terms of housing, there is unlikely to be sufficient capacity within the Luton Borough
boundaries to accommodate the anticipated new housing demand associated with any option.
However, there should be sufficient flexibility in the immediate wider catchment area to
accommodate the scale of housing and employment development likely to be required by these
airport options.
10.11.2 In terms of off airport employment, there may be scope to accommodate all the land
requirements for indirect airport employment associated with the options, as industrial
restructuring may yield brownfield sites for redevelopment, in addition to the Vauxhall site.
Luton is a Priority Area for Economic Regeneration (PAER) in RPG9 and can be expected to
welcome new sources of employment.
10.11.3 In summary, the impact of all the proposed development options is deemed to be low.
Employment Land Requirements
10.11.4 The off-airport employment requirements vary between options and with the potential role of the
airport in relation to air freight. At a maximum, up to 39 hectares of off-site employment land
within reasonable proximity to the airport could be required. In terms of workforce share, the
largest options considered at Luton would raise the airport’s share of the core catchment area
workforce from 7% to around 20% by 2015 and 24% by 2030.
10.11.5 Given its relatively tightly drawn boundaries, the overall scope for accommodating additional
large scale employment uses within the Borough of Luton itself may be relatively limited. The
Bedfordshire Structure Plan identified a requirement for 80 hectares of industrial land between
1988 and 2001. As at January 1996 the local plan suggests that the Borough was likely to face
a deficit of just over 13 hectares on this provision.
10.11.6 However, Luton contains extensive areas of existing industrial land, some of which will fall
vacant over the next thirty or so years thereby adding to the future land availability. The
implications of the recently announced closure of the Vauxhall plant immediately adjacent to the
airport and consequent effects in supplier industries may be significant in this respect. There
are also other areas, including extensive areas of former railway sidings, that may come
forward in the future.

SERAS Stage Two: Appraisal Findings Report
FL1124000.RCE.RP.JO3.020131.Appraisal Findings 363
10.11.7 There may well be scope to accommodate the above levels of airport related employment as a
result of industrial restructuring. If this land is not available, then development would probably
have to be accommodated outside the Borough.
Housing Capacity
10.11.8 The higher employment forecasts suggest that an additional 17,000 jobs by 2015 and 20,700 by
2030 might be provided at the airport. These growth rates represent 30% of all employment
growth in the core and wider catchment areas to 2015 and 23% to 2030. RPG provision is for
22,000 additional households in the core catchment area and a further 59,000 in the wider
catchment area to 2030. There is a shortfall of 8,700 dwellings to 2015 (TEMPRO requirement
minus RPG provision) of which 2,600 would be required to meet the housing requirements of a
developed Luton Airport. These levels of expansion represent modest amounts of excess
provision over RPG projections, even for the larger options which incorporate freight
development.
10.11.9 The Luton catchment area is heavily built up and already under considerable development
pressures and constraints.
10.11.10 The Borough of Luton, by its own admission, suffers from a serious deficiency of open space
(LLP, 1997, p.12). This judgement is in accord with conclusions made by the Secretary of State
for the Environment, Transport and the Regions that Luton cannot meet its own housing
requirements within its own tightly-drawn boundary.
10.11.11 Luton is unlikely, therefore, to meet its own future housing needs even without major airport
expansion. The possible exception would be if brownfield or windfall sites become available for
housing.
10.11.12 If the immediate wider catchment area is considered, however, there are a wide range of
potential options for accommodating growth. Options include:
• Brownfield redevelopment within neighbouring Dunstable where industrial
restructuring within the vehicle manufacturing sector may be envisaged. Public
transport improvements including a guided bus between Dunstable and Luton
(and the airport) are under consideration;
• New/expanded settlements in the Thameslink/A6 corridor, north of the airport on
former airfields/brownfield land, including the proposed new settlement at Elstow;
• Intensification or town-edge expansion in Bedford, which has significant areas of
industrial land that may fall vacant in the future.

SERAS Stage Two: Appraisal Findings Report
FL1124000.RCE.RP.JO3.020131.Appraisal Findings 364
10.12 Integration Impacts
Regional/Sub-regional policy
10.12.1 Luton Airport impacts upon the sub-regions of Luton/Dunstable/Houghton Regis and Milton
Keynes. The impacts of an expanded airport are discussed below under the headings of
employment/labour force, housing and transport infrastructure.
Employment / Labour Force
10.12.2 The Luton/Dunstable/Houghton Regis sub-region has great potential for supporting any
employment and labour market growth created by expansion at Luton Airport. There is plenty of
capacity in the labour market that can fill jobs created in either a low growth or high growth
scenario. There is a similar situation in Milton Keynes, although the labour market is less slack
and more highly skilled in composition. The growth can have an equally great effect in terms of
diversifying the employment base, however with so many people previously employed in the
manufacturing sector, this would require retraining and skills development.
10.12.3 The growth of Luton University can facilitate the alleviation of skills mismatches to a degree, in
tandem with training programmes put in place by new and existing employers. Regeneration
funding can be used to this end. Milton Keynes also has a strong learning seat for technical
skills with the presence of the Open University. However, it is likely that higher value clusters
will develop in Milton Keynes, thus there will be a higher level of national and international
import of labour skills from outside the sub-region.
10.12.4 Substantial growth at Luton Airport will assist the development of business clusters generally, a
common theme around most large airports worldwide. However, a stumbling block for inward
investors in Luton/Dunstable/Houghton Regis could be a lack of availability of a range of
business accommodation. Whilst there are vast swathes of previously developed land, much of
this requires considerable remedial treatment. The success of these areas to attract businesses
depends on how the remediation can be funded, how easy it is to achieve and whether new
businesses can be given further incentives to locate in the sub-region, e.g. tax exemptions. As
such, there is a certain critical mass in this type of regeneration area for business clustering. In
Milton Keynes, the infrastructure has a more firm existing foundation, thus clustering has a far
greater chance of success, particularly in the higher value functions that inevitably tend to group
close to airports. Its proximity to the Oxford Cambridge arc and good transport links should
secure continued growth of these clusters.

SERAS Stage Two: Appraisal Findings Report
FL1124000.RCE.RP.JO3.020131.Appraisal Findings 365
Housing
10.12.5 In the Luton/Dunstable/Houghton Regis sub-region, the housing growth requirements
associated with the expansion of Luton Airport, are far less likely to be compatible with existing
regional policy than the employment-related requirements. The towns are very densely
populated and are constrained by tight green belt designations. In a low growth scenario there
is potential to follow regional guidance and reallocate some of the large areas of brownfield
employment land for residential development. However, if growth continues further, it is likely
that the housing capacity of the sub-region will be reached and there will be a shortage. Clearly
though, it will be possible to achieve brownfield targets and most of this housing, due to the
composition of the residential workforce, will be affordable in nature.
10.12.6 Milton Keynes in contrast, is focusing on continued growth of employment and housing over the
next 20 years. As such, airport expansion, certainly in a low growth scenario will fit in well with
maintaining the sub-region’s growth profile.
10.12.7 What the reallocation of certain employment land in Luton/Dunstable/Houghton Regis for
residential use will do is locate housing nearer to the employment areas, thus fulfilling one of
the key sustainability criteria for the PAER.
Transportation / Infrastructure Improvements
10.12.8 Low growth at Luton Airport is liable to have the effect of reducing the need to travel for workers
in both the Luton/Dunstable/Houghton Regis and Milton Keynes sub-regions. However, as
growth continues there will be an inevitable spreading of employment locations as clustering in
the regeneration area loses its critical mass. Similarly with long distance commuting, in a low
growth scenario this will decrease. However, as growth continues but gets more tightly
squeezed and more workers develop a range of skills, it is inevitable that with better links, some
of these workers will be lost to the London labour market.
10.12.9 As stated, the growth of Luton Airport will improve transport links, in particular rail links, with
Thameslink 2000 and improvements to the Midland Mainline service becoming more likely to go
ahead swiftly.
Social Impacts
Low Growth
10.12.10 Under a low-growth scenario (up to 2015), around 10,000 jobs could be generated in total –
Maximising Use of the existing runway. Of these, 3,000 are likely to be low skill in nature, with
1,900 possibly located on-site and 1,100 off-site.

SERAS Stage Two: Appraisal Findings Report
FL1124000.RCE.RP.JO3.020131.Appraisal Findings 366
10.12.11 Worker surplus in Luton district in 1998 stood at over 3,000. By 2016, this is forecast to have
increased up to 4,000. Clearly it would be possible for all the off-site jobs to be accommodated
in the deprived district, particularly given the fact that unemployment alone stood at 3,000 in
October 2000. The location of the workforce so close to the airport and all likely off-site
employment sites minimises the need for major improvements to transport infrastructure.
High Growth
10.12.12 Under a high growth scenario (up to 2030), 19,000 jobs could be generated – under Option 7a.
Of these, over 6,300 could be low skill in nature, with potentially 4,000 being located on-site and
2,300 off-site.
10.12.13 With the high growth scenario peaking around 2015, the labour market situation will be similar
to the low growth scenario, i.e. a surplus of workers numbering as many as 4,000. As such, the
worker capacity will be available but not to fill all the jobs generated.
10.12.14 There is, however, strong evidence to suggest that all the labour market capacity in Luton
district can be taken by the airport-generated employment. One of the reasons for this is the
role of regeneration policy which focuses on the district itself. Indeed, it is also possible that
regeneration policy is strong enough to redirect several hundred of the remaining jobs to other
parts of the regeneration area, specifically to Dunstable in South Bedfordshire, making up part
of the Luton/Dunstable/Houghton Regis PAER. This will increase in likelihood if the transport
links within the PAER are strengthened. Improved bus networks and the provision of employer
bus services are likely to have the greatest effect.
SERAS Stage Two: Appraisal Findings Report
FL1124000.RCE.RP.J03.020131.Appraisal Findings 367
11 Appraisal of Options at Main Sites: Cliffe
11.1 Options Appraised in Stage Two
11.1.1 Between Stages One and Two a substantial review of the options at Cliffe Marshes has been
undertaken, to identify layouts that minimise relevant impacts (land take, residential property
take, on important ecological resources, noise): see Figure 11.1 (in this volume) for the
reconsidered location. Consideration has also been given to:
• the potential role of a new airport, the way in which an airport might operate and the
capacity it might provide;
• a mitigation strategy to deal with the worst of the impacts on important ecological
resources; and
• a strategy for attracting airlines to a new airport, intended to act as a major hub airport
with a full range of scheduled services and air freight services, perhaps supplemented
by charter or low cost services.
11.1.2 The options appraised at Cliffe in Stage Two reflect this further consideration. The basic layout
has, in its largest form, two pairs of close parallel runways, oriented approximately east:west. In
its earlier phase, one of each pair of runways would be built to give a pair of wide-spaced
independent runways.
11.1.3 Either the initial pair of wide-spaced runways or the later two pairs of close parallel runways
might be accompanied by a further runway to the west of the main body of the airport and
oriented in a north east:south west direction. This runway would be used for arrivals on easterly
operations at night or at other times when only one runway was being used for arrivals and one
for departures. This would be intended to minimise noise impacts. At busy periods of the day,
when two runways were required to be operating in mixed mode, the runways used would have
to be the parallel east:west pair, in order to avoid conflicting flight paths.
11.1.4 There is no airport currently envisaged in the land-use planning system at Cliffe and the concept
of making maximum use of the existing runways does not apply. In these two cases, Cliffe has
a capacity of zero.
11.1.5 OptionA2(2) has a pair of wide-spaced runways, (Figure 11.2) assumed to come into use in
2011.

SERAS Stage Two: Appraisal Findings Report
FL1124000.RCE.RP.J03.020131.Appraisal Findings 368
11.1.6 Option A2(3) supplements this pair of wide-spaced runways with the NE:SW runway, again
assumed to come into use in 2011 (Figure 11.3).
11.1.7 OptionsA2(4) and A2(5) add close parallel runways to the east:west runways in A2(2) and A2(3)
respectively (Figures 11.4 and 11.5). These additional runways are assumed to come into use
in 2021.
11.1.8 The options appraised at Cliffe are summarised in Table 11.1
Table 11.1: Options Appraised at Cliffe
Option Description Terminal
capacity,
mppa
Runway
capacity, ATM
Year of
Introduction
A2(2) Pair of wide-spaced independent runways 77 530,000 2011
A2(3) Pair of wide-spaced independent runways
& NE:SW runway
77 530,000 2011
A2(4) Two pairs of close-parallel runways 113 781,000 2011 and 2021
A2(5) Two pairs of close-parallel runways plus
NE:SW runway
113 781,000 2011 and 2021
11.2 Capital Costs
11.2.1 Table 11.2 below gives the estimated absolute costs for each option. They represent complete
costs for each scheme up to full option capacity. Table 11.3 gives the breakdown of surface
access (road and rail) costs.

SERAS Stage Two: Appraisal Findings Report
FL1124000.RCE.RP.J03.020131.Appraisal Findings 369
Table 11.2: Estimated Capital Costs for Cliffe Options (£ million)
Item Option A2
A2(2)2 runways
A2(3)2 runways + NE-SW
A2(4)4 runways
A2(5)4 runways+ NE-SW
Capacity 77 mppa 77 mppa 113 mppa 113 mppa
Terminals & Satellites
Terminal Buildings
Satellite Buildings
Baggage Handling
Total
913
466
100
1479
913
466
100
1479
1346
686
150
2181
1346
686
150
2181
Aircraft Pavements
Runways
Taxiways
Aprons / Stands
Total
83
63
539
686
125
95
539
759
166
115
543
825
208
147
543
899
Enabling Works & Infrastructure
Demolition, Earthworks, etc
Car Parking
Utility Services
Airside Roads and public
road diversions
Tracked Transit
Drainage
Landscaping
Total
1873
127
180
42
309
100
99
2730
1985
127
180
46
309
109
111
2867
1992
186
180
42
456
115
104
3076
2097
186
180
46
456
124
116
3207
Navigation Aids (ATC, ILS & AGL) 72 78 84 90
Cargo & Maintenance
Cargo buildings & aprons
Hangar/ Maintenance
Buildings & aprons
Total
212
71
283
212
71
283
309
104
413
309
104
413

SERAS Stage Two: Appraisal Findings Report
FL1124000.RCE.RP.J03.020131.Appraisal Findings 370
Item Option A2
A2(2)2 runways
A2(3)2 runways + NE-SW
A2(4)4 runways
A2(5)4 runways+ NE-SW
Support Facilities, etc
Support facilities
Offices
Other facilities / services
(inc. fuel, fire, security, light
rail)Total
114190190
494
114190190
494
171285190
646
171285190
646
On-costs 1436 1490 1806 1859
Contingency 1795 1862 2258 2324
Land Costs 189 194 190 195
Sub-total: Airport Development
Costs9162 9505 11480 11812
Airport Development Costs per
mppa provided 119 123 102 105
Costs of Associated Surface
Access680 680 1790 1790
Total Capital Costs 9844 10187 13272 13604
Total Capital Costs per mppa
provided128 132 117 120
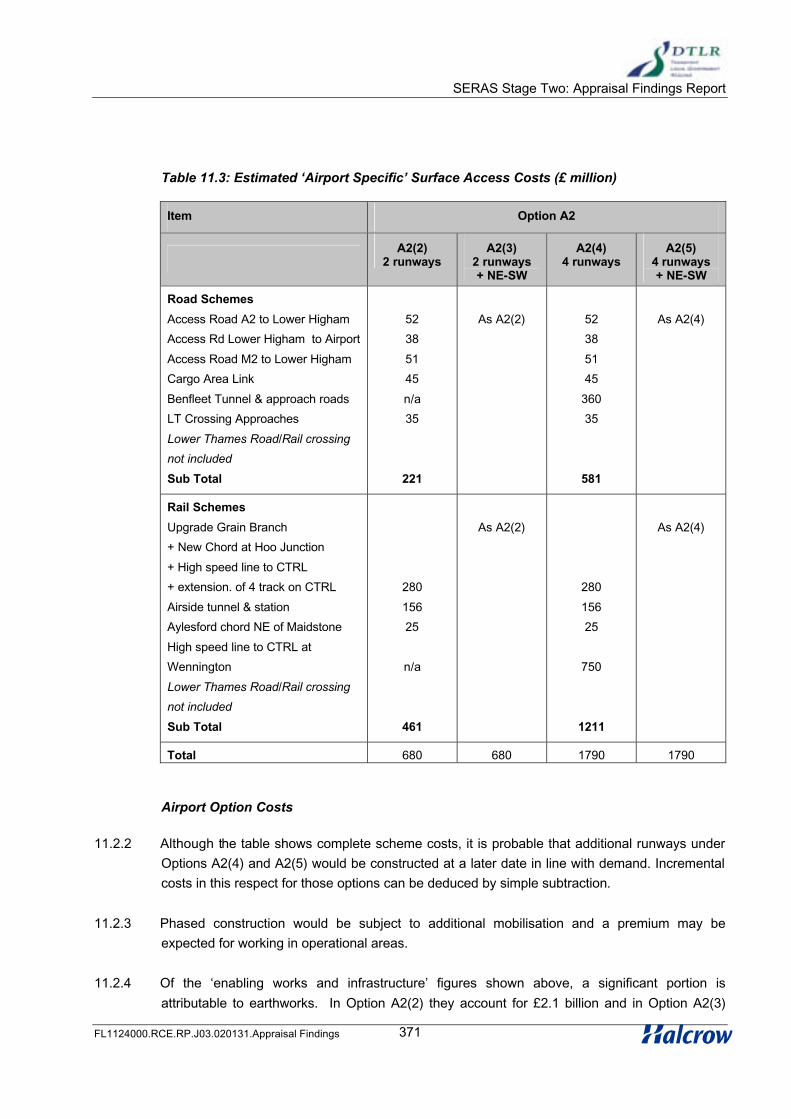
SERAS Stage Two: Appraisal Findings Report
FL1124000.RCE.RP.J03.020131.Appraisal Findings 371
Table 11.3: Estimated ‘Airport Specific’ Surface Access Costs (£ million)
Item Option A2
A2(2)2 runways
A2(3)2 runways+ NE-SW
A2(4)4 runways
A2(5)4 runways + NE-SW
Road Schemes
Access Road A2 to Lower Higham
Access Rd Lower Higham to Airport
Access Road M2 to Lower Higham
Cargo Area Link
Benfleet Tunnel & approach roads
LT Crossing Approaches
Lower Thames Road/Rail crossing
not included
Sub Total
52
38
51
45
n/a
35
221
As A2(2) 52
38
51
45
360
35
581
As A2(4)
Rail Schemes
Upgrade Grain Branch
+ New Chord at Hoo Junction
+ High speed line to CTRL
+ extension. of 4 track on CTRL
Airside tunnel & station
Aylesford chord NE of Maidstone
High speed line to CTRL at
Wennington
Lower Thames Road/Rail crossing
not included
Sub Total
280
156
25
n/a
461
As A2(2)
280
156
25
750
1211
As A2(4)
Total 680 680 1790 1790
Airport Option Costs
11.2.2 Although the table shows complete scheme costs, it is probable that additional runways under
Options A2(4) and A2(5) would be constructed at a later date in line with demand. Incremental
costs in this respect for those options can be deduced by simple subtraction.
11.2.3 Phased construction would be subject to additional mobilisation and a premium may be
expected for working in operational areas.
11.2.4 Of the ‘enabling works and infrastructure’ figures shown above, a significant portion is
attributable to earthworks. In Option A2(2) they account for £2.1 billion and in Option A2(3)

SERAS Stage Two: Appraisal Findings Report
FL1124000.RCE.RP.J03.020131.Appraisal Findings 372
£2.2 billion including contingencies. These figures reflect a balanced cut and fill operation,
creating a platform at approximately 18m above sea level, designed to optimise cost by
avoiding the need for excessive and costly disposal or import of material and thereby
minimising construction impacts on the local community. At this stage of estimating, no
provision has been made for any import of soil or disposal of material off site; requirements for
treating existing marshland have not been investigated, nor have the exact details of the soil
and rock strata. Refinements to the location of the platform reveal that there may be better
locations in terms of the overall volume and cost of earthworks. It is proposed that this be
addressed through a sensitivity appraisal of volumes at various locations to the west of the
current site. Initial calculations suggest that a saving of 10 to 20% may be feasible, representing
£210 to £420 million in Option A2(2).
11.2.5 It has been assumed at this stage that the earthworks platform for the two outer runways in the
parallel pairs (giving the third and fourth parallel runways) will be formed at the same time as
the platform for the two runway option. This will avoid the costly requirement for disposal or
storage of excess material at the initial phase and costly import of material at a later stage.
Pavements and supporting infrastructure such as AGL would be implemented when the
demand for the additional runways arises. Alternatively, if it were clear from the outset that only
two east:west runways would ever be provided, a smaller platform, with some cost savings,
could be built.
11.2.6 As a new site, costs for providing infrastructure such as drainage (for the whole site area), utility
services, support facilities and pavements are high when compared with other existing airports.
This is primarily due to the fact that there are no pre-existing operational facilities, such as those
that other existing sites are able to share, or use more efficiently, when providing additional
capacity.
11.2.7 Office space is provided at about 2500m2 per mppa. This appears to be high when compared
with Luton (95m2/mppa), Stansted (600) and Gatwick (730). However, at Heathrow, the rate is
over 5000m2 per mppa. It is probable that much of this floorspace at Cliffe could generate
revenue through rent or leasing.
11.2.8 Cargo handling provision is high, reflecting the proposed function of this airport as a major
cargo hub, representing a ratio of 15 tonnes of annual freight per m2 of cargo building space.
11.2.9 No account has been taken in the main appraisal of the costs associated with ecological
mitigation measures. They will be more significant than at other sites.
11.2.10 Land purchase costs are amongst the most expensive of all airports. However, when
considered in terms of the area of the site, at about £0.1million per hectare, they are amongst
the lowest: this results from a high proportion of undeveloped land being acquired. In terms of
numbers of passengers, a cost of £2.5m per mppa in Option A2(2) is comparatively high for a

SERAS Stage Two: Appraisal Findings Report
FL1124000.RCE.RP.J03.020131.Appraisal Findings 373
rural site; due partly to this being a new site with no pre-existing facilities and the proposed
accommodation of a high proportion of freight-only flights.
Surface Access Costs
11.2.11 Surface access costs represent 7 to 13% of the total capital cost – higher than at Gatwick
(about 6%) and Luton (5%), but less than at Heathrow (30%) and Stansted (20%). The costs
are for all new construction of road and rail routes on the Isle of Grain and a new road tunnel to
Benfleet for the larger options. They include for a single two-lane road to connect to the cargo
and maintenance areas at the east of the site; this route would probably continue to the existing
container terminal. At this stage of estimating, ground profiles have not been taken into account
and actual volumes of earthworks have not been considered, though they could have a greater
bearing on costs than at other sites. Costs for construction of the Lower Thames Road/Rail
Crossing have not been included: it has been assumed that this will be built in any event prior to
the new airport.
11.2.12 Required improvements to the strategic road network, i.e. those not specifically required to
accommodate airport related traffic, are on the A13 near Tilbury, from A1089 junction to meet
the Lower Thames Crossing approach road (dual 2 lane up to dual 3 lane). The estimated cost
for these works is about £6 million.
11.3 Demand Forecasts
11.3.1 Forecast passenger movements, ATMs and passengers per passenger ATM for each Cliffe
Marshes option are summarised at 5 year intervals between 2000 and 2030 in the following
tables:
• Table 11.4: Options A2(2) and A2(3)
• Table 11.5: Options A2(4) and A2(5)
11.3.2 The additional NE:SW runway in Options A2(3) and A2(5) does not affect the passenger
forecasts. One set of forecasts applies to both A2(2) and A2(3), and one to both A2(4) and
A2(5).
11.3.3 In the forecasting it has been assumed that a new airport at Cliffe Marshes could, as could an
expanded Stansted, be a second international hub airport in the South East, complementing
Heathrow.

SERAS Stage Two: Appraisal Findings Report
FL1124000.RCE.RP.J03.020131.Appraisal Findings 374
11.3.4 The forecasting of demand at Cliffe Marshes has assumed that, on its opening in 2011, a major
airline or an airline alliance, suffering from heavily constrained capacity at Heathrow and
Gatwick, would be willing to relocate services to the new site. The services assumed to be
relocated are: 40% of all Heathrow’s scheduled services, 23% of Gatwick’s charter services and
11% of Stansted’s 2000 low cost services. The forecasts produced for the options at Cliffe
Marshes start in 2011 on that basis and test whether the services would survive or indeed grow
in their new locations. The capacity assumed to be ‘freed up’ at Heathrow and Gatwick is still
available to compete with the additional capacity at Cliffe Marshes.
11.3.5 The principal features of the demand forecasts for each option are summarised below.
Options A2(2) and A2(3): Two Runways
11.3.6 The passenger forecasts in the assumed opening year of 2011 are 33 mppa: they grow to 58
mppa by 2015 and to the assumed terminal capacity of 77 mppa in the early 2020s. The
runway capacity of 530,000 ATMs is reached in 2018. Forecast ATMs are 213,000 in 2011,
436,000 in 2015 and 530,000 by 2018. Scheduled services dominate: principally short haul but
with some domestic, USA and long haul. They account for 83% of ATMs in 2015 and 88% by
2030. Charter services make up most of the rest. The forecast number of I to I interliners is 18
mppa in 2015 and 19 mppa in 2030, with a slight fall in between. As at Stansted, leisure
passengers dominate movement to/from the UK at Cliffe, accounting for 80% of all trips to/from
the UK in 2015 and 71% in 2030. Leaving aside I to I interliners, 89% of Cliffe Marshes
passengers in 2015 and 96% in 2030 are travelling to/from London, the East and South East
regions.
The Effects of Seeding
11.3.7 The services seeded at Cliffe in 2011 generally pass a commercial viability test. The main
forecasts presented in the following tables are based on seeded forecasts. Forecast ATMs in
2012 are 302,000, considerably higher than the seeded ATMs in 2011 of around 214,000: ie,
the forecast demand for services at Cliffe more than matches the assumed capacity, implying
that the airlines that move there would be able to achieve commercially satisfactory load
factors. Forecasts of international scheduled services, charter and low cost services
substantially exceed seeded levels: it is only domestic scheduled services that fall short of
seeded levels.
11.3.8 Without the seeding of services, however, if services and demand were left to grow without the
major boost of an airline or alliance moving to Cliffe, lower passenger numbers are forecast.
Passengers in the year of opening, 2011, would be 9 mppa, not 34 mppa; in 2015 passengers
would be 34 mppa, not 62 mppa; and in 2020 passengers would be 60 mppa, not 74 mppa.
Use of the airport grows more slowly, but by 2024, even without the seeding of services, the
runway capacity is fully utilised.

SERAS Stage Two: Appraisal Findings Report
FL1124000.RCE.RP.J03.020131.Appraisal Findings 375
Options A2(4) and A2(5): Four Runways
11.3.9 In the modelling of this option, the additional runway capacity is assumed to be introduced in
2021, but the analysis of Option A2(2) has indicated that the capacity provided by two runways
is fully utilised by 2018. The additional capacity allows the 2025 forecast to increase from 78
mppa to 104 mppa and the 2030 forecast to increase from 79 mppa to 110 mppa. The assumed
terminal capacity of 113 mppa is effectively reached in 2028 but there is some unused runway
capacity.
11.3.10 The additional capacity is used by more passengers in all categories. By 2030, I to I interliners
are 26 mppa, up from 18 mppa in 2015; scheduled passengers are 92 mppa, up from 46 mppa
in 2015; and there are 15 mppa charter passengers, up from 10 mppa in 2015. The additional
capacity in 2030 allows 58 mppa leisure trips to be made, compared with 42 mppa with only two
runways, and 24 mppa business trips compared with 17 mppa with only two runways.

SERAS Stage Two: Appraisal Findings Report
FL1124000.RCE.RP.J03.020131.Appraisal Findings 376
Table 11.4: Cliffe Marshes: Options A2(2) and A2(3)
2000 2005 2010 2015 2020 2025 2030
Passengers, mppa
Scheduled Domestic 2 2 2 1
Short haul 27 37 41 44
USA 10 11 12 12
Long haul 8 9 10 11
Total 46 59 65 68
Charter 10 13 12 11
Low cost 2 2 1 **
Total 0 0 0 58 74 78 79
ATMs, ‘000
Scheduled Domestic 20 24 18 15
Short haul 273 344 361 365
USA 35 38 40 41
Long haul 33 37 40 42
Total 360 443 459 464
Charter 58 70 66 60
Low cost 18 18 13 4
Total 0 0 0 436 531 538 528
Passengers/PATM
Scheduled 126 130 140 146
Charter 171 182 184 184
Low cost 120 139 94 97
Average 0 0 0 134 139 145 146
Note: Figures in bold are capacity-constrained forecasts
‘Other’ categories, not shown, are included in totals. Totals may not sum due to rounding
** = less than 0.5 mppa or less than 500 ATMs

SERAS Stage Two: Appraisal Findings Report
FL1124000.RCE.RP.J03.020131.Appraisal Findings 377
Table 11.5: Cliffe Marshes: Options A2(4) and A2(5)
2000 2005 2010 2015 2020 2025 2030
Passengers, mppa
Scheduled Domestic 2 2 3 3
Short haul 27 37 54 59
USA 10 11 18 17
Long haul 8 9 14 14
Total 46 59 88 92
Charter 10 13 14 15
Low cost 2 2 3 3
Total 58 74 104 110
ATMs, ‘000
Scheduled Domestic 20 24 26 26
Short haul 273 344 470 485
USA 34 38 57 55
Long haul 33 37 51 51
Total 360 443 603 617
Charter 58 70 73 77
Low cost 18 18 19 19
Total 436 531 696 712
Passengers/PATM
Scheduled 126 130 143 146
Charter 171 182 189 197
Low cost 1209 139 151 154
Average 134 139 150 154
Note: Figures in bold are capacity-constrained forecasts
‘Other’ categories, not shown, are included in totals. Totals may not sum due to rounding
** = less than 0.5 mppa or less than 500 ATMs

SERAS Stage Two: Appraisal Findings Report
FL1124000.RCE.RP.J03.020131.Appraisal Findings 378
11.4 Safety Risk
11.4.1 The Stage Two assessment of safety risk appraises the third party risk associated with both
existing and new runway options. The full extent of the 1;10,000 and 1:100,000 designated risk
areas are shown on the following Figures. The runway end origin of the 1:1,000,000 contours
are also shown but the contours extend beyond the limit of the drawings:
• Figure 11.6 – Option A2(2), One pair of wide spaced full length runways
operating in mixed mode.
• Figure 11.7 – Option A2(3), One pair of wide spaced full length runways
operating in mixed mode, supplemented by a single NE/SW runway to the west
for easterly night time freight arrivals.
• Figure 11.8 – Option A2(4), Two pairs of full length close spaced parallel
runways, each pair operating in dependent segregated mode.
• Figure 11.9 – Option A2(5), Two pairs of full length close spaced parallel
runways, each pair operating in dependant segregated mode, supplemented by a
single NE/SW runway to the west for easterly night time freight arrivals.
1:10,000 Risk Contours
11.4.2 The impacts of the 1:10,000 risk contours are shown in Table 11.6 below:
Table 11.6: 1:10,000 Risk Contours
Impact Option
A2(2)
Option
A2(3)
Option
A2(4)
Option
A2(5)
Area (ha) (West and East)W 14.0E 13.4
W 14.0E 13.4SW 0.4NE 0.2
W 20.0E 19.3
W 20.0E 19.3SW 0.5NE 0.3
Properties within contour
(outside airport boundary)1 1 None None
% developed area affected,
(outside airport boundary)0 0 0 0
11.4.3 The 1:10,000 contours in each of the options fall almost entirely within the proposed airport
boundary. The area is predominantly rural and marshland.

SERAS Stage Two: Appraisal Findings Report
FL1124000.RCE.RP.J03.020131.Appraisal Findings 379
1:100,000 Risk Contours
11.4.4 The impacts of the 1:100,000 risk contours are shown in Table 11.7 below.
Table 11.7: 1:100,000 Risk Contours
Impact (beyond 1:10,000
contour)
Option
A2(2)
Option
A2(3)
Option
A2(4)
Option
A2(5)
Area (ha) (West and East) W 147.6E 142.1
W 147.6E 142.3SW 11.6NE 6.4
W 208.7E 200.8
W 208.7E 200.8SW 12.8NE 7.1
Population affected.
(Outside airport boundary) 208 208 24 24
% developed area (outside
airport boundary)<1 <1 <1 <1
Other prominent features
affectedCoastal marshland
11.4.5 The area is predominantly agricultural and marshland. The impact on communities and
commercial activities is minimal.
1:1,000,000 Risk Contour
11.4.6 The impacts of the 1:1,000,000 risk contours are shown in Table 11.8 below:
Table 11.8: 1:1,000,000 Risk Contours
Impact (beyond 1:100,000
contour)
Option
A2(2)
Option
A2(3)
Option
A2(4)
Option
A2(5)
Area (ha) (West and East) W 1404.5E 1351.6
W 1404.5E 1351.6SW 49.5NE 27.3
W 2015.1E 1939.2
W 2015.1E 1939.2SW 61.1NE 33.6
% developed area affected W <5E <5
W <5E <5
SW ruralNE rural
W <5E <5
W <5E <5
SW ruralNE rural
11.4.7 The prominent features within 1:1,000,000 risk areas are set out below. They do not represent
major concentrations of people and are therefore of low risk:

SERAS Stage Two: Appraisal Findings Report
FL1124000.RCE.RP.J03.020131.Appraisal Findings 380
• Option A2(2): West – Cooling Castle, nature reserve; East – none.
• Option A2(3): West – Cooling Castle, nature reserve; East – none; South West –
none; North east - none
• Option A2(4): West – Cooling Castle, nature reserve; East – 80% of Lower Stoke
village
• Option A2(5): West – Cooling Castle, nature reserve; East – 80% Lower Stoke
village; South West – none; North east - none
11.5 Surface Access
Infrastructure and service assumptions - roads
11.5.1 For the purposes of surface access demand forecasting, the changes to the existing road
access arrangements were based on the still relevant findings of Stage One appraisals. This
helped define a number of schemes associated with each option, as summarised in Table 11.9
and shown in Figures 11.14 and 11.15.
11.5.2 Options A2(2) and A2(3) have the same capacities (77mppa) and are assumed to require the
same access arrangements. This comprises a link from the new airport to the A2 west of
Shorne Wood, and a road linking between the A2/M2 interchange (at Shorne Ridgeway) and
the A13 at Orsett, with an interchange between these two new links near Church Street for
access to the airport from north of the Thames. The northern part of the M2/A2 to A13 link
would comprise the multi-modal, tunnelled Lower Thames Crossing, with provision for road and
rail traffic.
11.5.3 Options A2(4) and A2(5) again have the same capacities (113mppa). This size of airport has
been assumed to require an additional access and a second road-only crossing of the Thames,
linking the airport to the A130 on Canvey Island and then to Benfleet, is assumed. This would
connect the airport to the labour markets of the Southend area as well as providing an
alternative access for passengers.

SERAS Stage Two: Appraisal Findings Report
FL1124000.RCE.RP.J03.020131.Appraisal Findings 381
Table 11.9: Road access arrangements – Cliffe Marshes Options
Scheme OptionsA2(2) & A2(3)
OptionsA2(4) & A2(5)
1 Access from airport to A2 west of Shorne Wood ! !
2 Link between M2/A2 and A13 at Orsett ! !
3 Access from airport to A130, including Thames tunnel !
Infrastructure and service assumptions - rail
11.5.4 Rail infrastructure and service assumptions were based on Stage One findings and shaped by
discussions, with DTLR and SRA in particular, on the potential to integrate airport-focused
schemes with parallel improvements in infrastructure and services planned to accommodate
future increases in non-airport demand. Schemes and services associated with each Option
are summarised in Table 11.10 and summarised in Figures 11.17 and 11.18.
11.5.5 Rail connections from the airport to the existing rail networks on both sides of the Thames are
planned in both Options. To the south, an upgrade of the existing Grain freight branch is
assumed, joining the North Kent Line at Hoo (local services) and extended to CTRL I at
Singlewell (express services). To the north west, the Lower Thames Crossing will join the
Tilbury-Southend line near East Tilbury. As shown in Figure 11.17, these connections will
permit a number of local services to be diverted/extended to the airport.
11.5.6 For Option A2(2) services south to Dover/Ramsgate via the Medway Towns; Tonbridge and
Gatwick via Maidstone (West); and Charing Cross via Gravesend, Dartford and all three
Dartford Loop lines are assumed. With a new chord south of Aylesford, services can also run to
Maidstone (East) and Ashford. In the north, services to Shoeburyness via Pitsea (Basildon)
and Southend; Grays, Upminster, Barking and Fenchurch Street are assumed. With CrossRail,
services could run via Barking and Stratford, central London, Ealing and Heathrow.
11.5.7 Express services are assumed to run via CTRL I to Bromley South and Waterloo, and via CTRL
I & II to Ebbsfleet, St Pancras and Birmingham.
11.5.8 For Option A2(4), a further high-speed link is assumed, extending from the Lower Thames
Crossing at East Tilbury to CTRL II at Wennington, sharing the A13 transport corridor. This
relieves congestion in CTRL II's Thames Tunnel, with the diversion of the St Pancras Express,
Birmingham and CrossRail services to the new link. Additional Express services to Leeds and
SERAS Stage Two: Appraisal Findings Report
FL1124000.RCE.RP.J03.020131.Appraisal Findings 382
Newcastle are assumed for the accessibility modelling, which would require a new chord
between CTRL II and the East Coast Main Line at Belle Isle (Islington).
Accessibility Analysis
11.5.9 The results of the catchment area analyses are summarised in the Appraisal Summary Tables
under the heading “Accessibility” and in Figures 11.10 to 11.13. Public transport catchments
vary significantly between Options A2(2) and A2(4), increasing from around 7 million air
passengers pa within one hour’s overall journey time in Option A2(2) to around 21 million for
Option A2(4). The resident workforce within an hour’s travel time by public transport varies
between 0.5 and 1 million. Cliffe’s accessibility by road is reflected in its larger catchments of
around 21-22 million air passengers pa, and 2.3-2.4 million potential workers within one hour’s
travel time. Catchments by road are similar between options.
11.5.10 The accessibility of options to the air passenger market in Central London is of particular
interest and is summarised for Cliffe options in Table 11.11. It should be noted that the public
transport travel times quoted in this table exclude walking access and egress, and waiting times
– they therefore indicate minimum travel times.
11.5.11 With the services assumed for Option A(2), Cliffe has fair to good public transport accessibility
relative to other existing airports – King’s Cross/St Pancras lying within 30 minutes, and all
other main line termini being within 60 minutes’ travel time of the airport, many with direct
services. Public transport access times are further reduced in Option A2(4), with Blackfriars,
King’s Cross/St Pancras, Euston and Charing Cross being within around 30 minutes travel time
and all other main line termini being within 40 minutes.

SERAS Stage Two: Appraisal Findings Report
FL1124000.RCE.RP.J03.020131.Appraisal Findings 383
Table 11.10: Rail Access – Cliffe Options
Infrastructure ServicesOption A2(2)
2-runways
Option A2(4)
4-runways
Upgrade of Grain freight branch, junction with North Kent Line at Hoo
Local services to: Ramsgate / Dover via Chatham and Faversham; Tonbridge and Gatwick via Maidstone West; Charing Cross via Gravesend, Dartford and
Woolwich/Sidcup/Bexleyheath! !
Chord south of Aylesford on Medway Valley Line Local service to Ashford via Maidstone East ! !
High Speed link from Hoo to CTRL I at Singlewell
Express service to Waterloo via Bromley South; St Pancras via CTRL I, Ebbsfleet and CTRL II
! !
Express services to St Pancras non-stop via CTRL I and CTRL II; Birmingham via CTRL I and CTRL II, Milton Keynes, Coventry
!
Multi-modal Lower Thames Crossing to East Tilbury
Local services to: Shoeburyness via Pitsea and Southend; Fenchurch Street via Grays , Upminster, Barking
! !
CrossRail Heathrow via Grays, Purfleet, Barking, Stratford, Liverpool St, Paddington and Ealing !
High speed link from East Tilbury to Wennington
Express services to St Pancras non-stop via CTRL II; Birmingham via CTRL II, Milton Keynes, Coventry
!
Chord between CTRL and ECML Express services to Newcastle and Leeds !
CrossRail Heathrow via Barking, Stratford, Liverpool St, Paddington and Ealing !
Local service to Fenchurch Street via Grays , Purfleet, Barking !

SERAS Stage Two: Appraisal Findings Report
FL1124000.RCE.RP.J03.020131.Appraisal Findings 384
Table 11.11: Accessibility from Central London – Cliffe options.
Options A2(2) & A2(3) Options A2(4) & A2(5)
By Car, minutes
Fenchurch Street 66 66
Blackfriars 71 71
Liverpool Street 67 67
St Pancras/Kings Cross/Euston 77 77
Marylebone/Paddington 85 85
Charing Cross 72 72
Waterloo 71 71
London Bridge 67 67
By Public Transport, tph in
minutes
Fenchurch Street 2 tph in 49 2 tph in37
Blackfriars 5 minutes from London Bridge
Liverpool Street 4 tph in 53 4 tph in 37
St Pancras/Kings Cross/Euston 2 tph in 26
2 tph in 30
4 tph in 22
2 tph in 30
Paddington 4 tph in 63 4 tph in 47
Charing Cross 6 tph in 62 as Option 8
Waterloo 4 tph in 33 as Option 8
London Bridge 6 tph in 54 as Option 8
11.5.12 The main indicators of surface access demand in 2015 for each option at Cliffe are
summarised in Tables 11.12 and 11.13. Corresponding results for the forecast year 2030 are
presented in Tables 11.14 and 11.15. Air passenger capacity and demand estimates have
been described above. Note that both the amount of spare capacity and the number of
interlining passengers vary between Cliffe and other airports – reflecting its interaction with
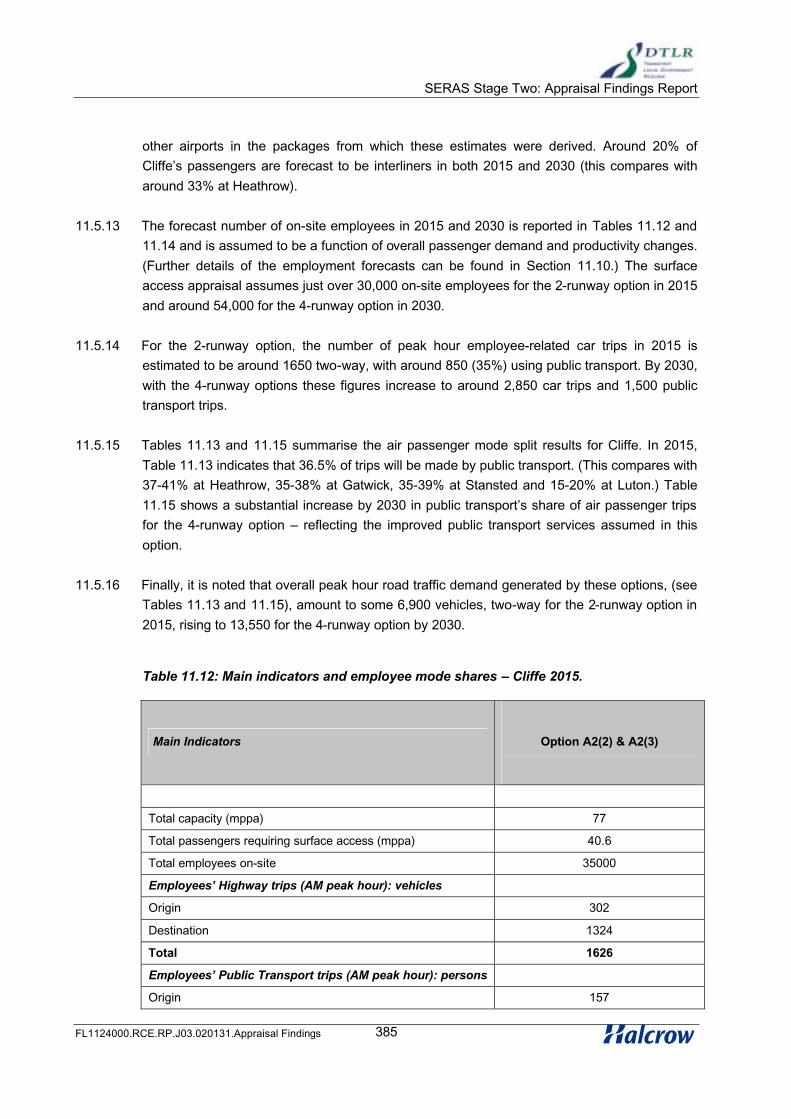
SERAS Stage Two: Appraisal Findings Report
FL1124000.RCE.RP.J03.020131.Appraisal Findings 385
other airports in the packages from which these estimates were derived. Around 20% of
Cliffe’s passengers are forecast to be interliners in both 2015 and 2030 (this compares with
around 33% at Heathrow).
11.5.13 The forecast number of on-site employees in 2015 and 2030 is reported in Tables 11.12 and
11.14 and is assumed to be a function of overall passenger demand and productivity changes.
(Further details of the employment forecasts can be found in Section 11.10.) The surface
access appraisal assumes just over 30,000 on-site employees for the 2-runway option in 2015
and around 54,000 for the 4-runway option in 2030.
11.5.14 For the 2-runway option, the number of peak hour employee-related car trips in 2015 is
estimated to be around 1650 two-way, with around 850 (35%) using public transport. By 2030,
with the 4-runway options these figures increase to around 2,850 car trips and 1,500 public
transport trips.
11.5.15 Tables 11.13 and 11.15 summarise the air passenger mode split results for Cliffe. In 2015,
Table 11.13 indicates that 36.5% of trips will be made by public transport. (This compares with
37-41% at Heathrow, 35-38% at Gatwick, 35-39% at Stansted and 15-20% at Luton.) Table
11.15 shows a substantial increase by 2030 in public transport’s share of air passenger trips
for the 4-runway option – reflecting the improved public transport services assumed in this
option.
11.5.16 Finally, it is noted that overall peak hour road traffic demand generated by these options, (see
Tables 11.13 and 11.15), amount to some 6,900 vehicles, two-way for the 2-runway option in
2015, rising to 13,550 for the 4-runway option by 2030.
Table 11.12: Main indicators and employee mode shares – Cliffe 2015.
Main Indicators Option A2(2) & A2(3)
Total capacity (mppa) 77
Total passengers requiring surface access (mppa) 40.6
Total employees on-site 35000
Employees’ Highway trips (AM peak hour): vehicles
Origin 302
Destination 1324
Total 1626
Employees’ Public Transport trips (AM peak hour): persons
Origin 157

SERAS Stage Two: Appraisal Findings Report
FL1124000.RCE.RP.J03.020131.Appraisal Findings 386
Main Indicators Option A2(2) & A2(3)
Destination 691
Total 848
% Public Transport trips
Origin 33%
Destination 33%
Total 33%

SERAS Stage Two: Appraisal Findings Report
FL1124000.RCE.RP.J03.020131.Appraisal Findings 387
Table 11.13: Air passenger mode choice and overall surface access demand – Cliffe 2015.
Mode Options A2(2) & A2(3)
No. %
Underground / LRT 0.01 0.0%
Bus 4.35 11.1%
Taxi 6.33 16.2%
Park and fly 9.12 23.4%
Kiss and fly 9.31 23.8%
Premium rail 5.80 14.8%
National rail 4.13 10.6%
Total 39.05 100.0%
Public 14.29 36.5%
Private 24.76 63.5%
Road (vehicles, 2-way) 6,900
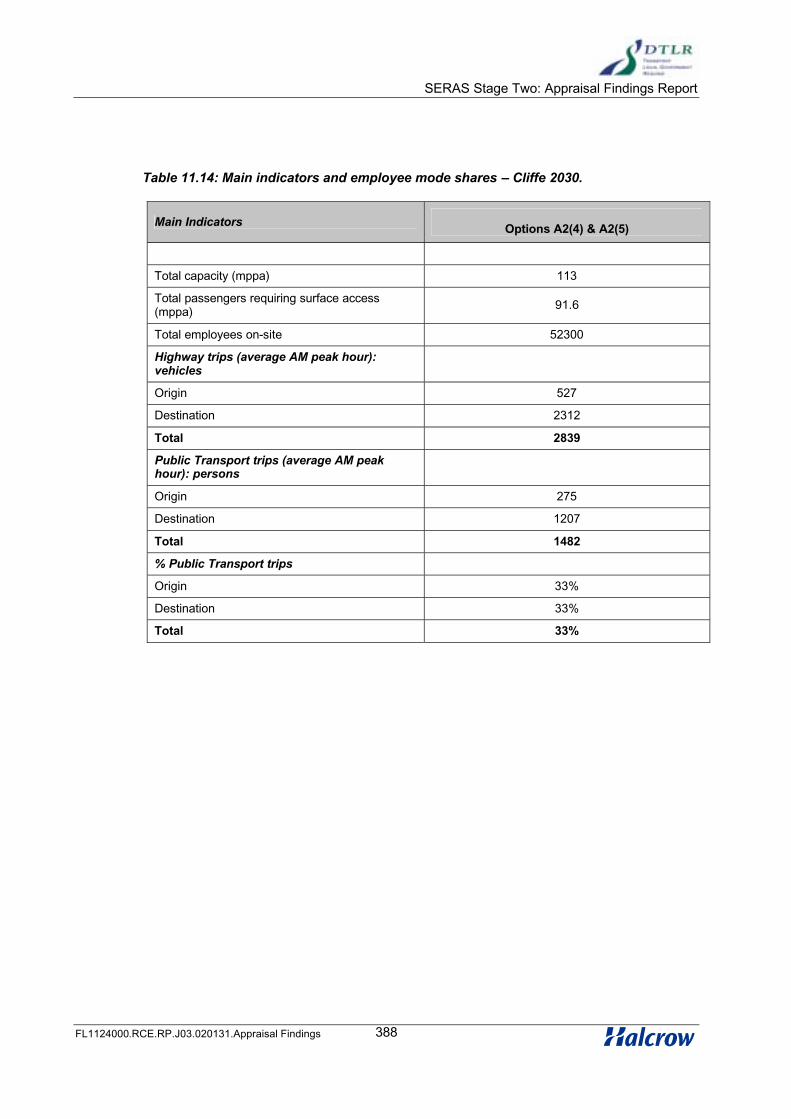
SERAS Stage Two: Appraisal Findings Report
FL1124000.RCE.RP.J03.020131.Appraisal Findings 388
Table 11.14: Main indicators and employee mode shares – Cliffe 2030.
Main Indicators Options A2(4) & A2(5)
Total capacity (mppa) 113
Total passengers requiring surface access (mppa) 91.6
Total employees on-site 52300
Highway trips (average AM peak hour): vehicles
Origin 527
Destination 2312
Total 2839
Public Transport trips (average AM peak hour): persons
Origin 275
Destination 1207
Total 1482
% Public Transport trips
Origin 33%
Destination 33%
Total 33%
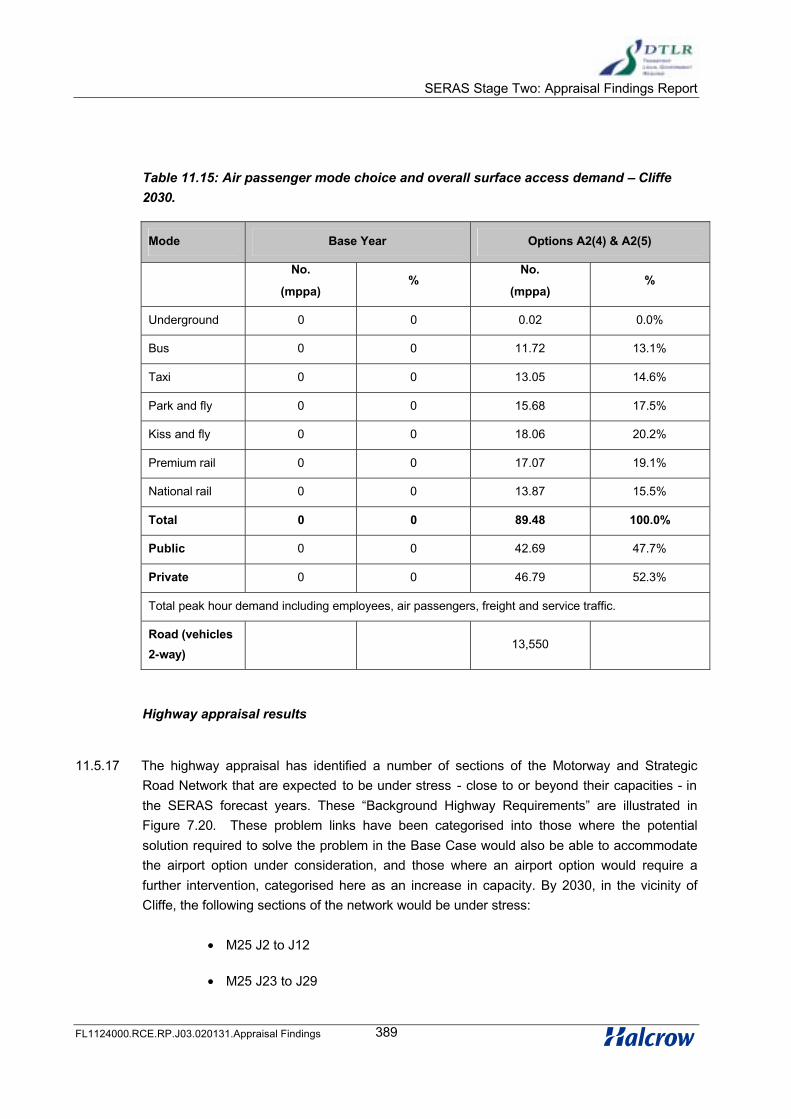
SERAS Stage Two: Appraisal Findings Report
FL1124000.RCE.RP.J03.020131.Appraisal Findings 389
Table 11.15: Air passenger mode choice and overall surface access demand – Cliffe 2030.
Mode Base Year Options A2(4) & A2(5)
No.
(mppa)%
No.
(mppa)%
Underground 0 0 0.02 0.0%
Bus 0 0 11.72 13.1%
Taxi 0 0 13.05 14.6%
Park and fly 0 0 15.68 17.5%
Kiss and fly 0 0 18.06 20.2%
Premium rail 0 0 17.07 19.1%
National rail 0 0 13.87 15.5%
Total 0 0 89.48 100.0%
Public 0 0 42.69 47.7%
Private 0 0 46.79 52.3%
Total peak hour demand including employees, air passengers, freight and service traffic.
Road (vehicles
2-way)13,550
Highway appraisal results
11.5.17 The highway appraisal has identified a number of sections of the Motorway and Strategic
Road Network that are expected to be under stress - close to or beyond their capacities - in
the SERAS forecast years. These “Background Highway Requirements” are illustrated in
Figure 7.20. These problem links have been categorised into those where the potential
solution required to solve the problem in the Base Case would also be able to accommodate
the airport option under consideration, and those where an airport option would require a
further intervention, categorised here as an increase in capacity. By 2030, in the vicinity of
Cliffe, the following sections of the network would be under stress:
• M25 J2 to J12
• M25 J23 to J29
SERAS Stage Two: Appraisal Findings Report
FL1124000.RCE.RP.J03.020131.Appraisal Findings 390
11.5.18 The additional potential scheme improvements required by the airport options at Cliffe are
summarised in Table 11.16 and illustrated in Figure 11.16.
Rail Network Performance – Cliffe
11.5.19 With Option A2(2) in 2015, the major flow of airport related demand between the airport and
central London routes predominantly via the CTRL expresses to St Pancras, which carry
around two thirds of the traffic. Smaller numbers use the express to Waterloo and CrossRail,
with limited numbers on the slower regional services to Charing Cross and Fenchurch Street.
11.5.20 None of these airport services experiences any crowding. The Waterloo service attracts
nearly as many employee trips as air passenger trips towards the airport in the morning peak,
and also attracts commuters towards London. Overall, the number of long-distance commuter
trips diverting to airport expresses exceeds the number of air passengers using the commuter
services extended to the airport, relieving crowding elsewhere, especially on the Chatham
Main Line services to Victoria.
11.5.21 With Option A2(4) modelled in 2030, there is a significant change in passenger mix and trip-
end distribution compared to the smaller option, resulting in a marked increase in public
transport’s mode share. Public transport is projected to attract nearly 45% of 2030 air
passenger access demand with the service pattern assumed for Option A2(2), rising to nearly
48% if journey times to London are reduced and frequencies increased with a second high-
speed link, to the CTRL corridor at Wennington near Purfleet.
11.5.22 Demand to central London exceeds 10,000 trips over the morning peak period, with more than
60% using the express services to St Pancras (load factor 75-80%) and a further 25% the
accelerated CrossRail service. The latter route is also forecast to attract a high number of
commuter trips (many of them longer distance, diverting via the airport to join the trains), with
a peak load factor of 75% leaving the airport and severe overcrowding west of Barking.
11.5.23 In the light of these initial assignment results, the stopping pattern of services assumed for the
modelling exercise may need to be adjusted to balance out flows of air passengers and
commuters, and avoid overcrowding on some trains. However, the diversion of so many
commuter trips to airport services will significantly reduce crowding on other, non-airport,
services.

SERAS Stage Two: Appraisal Findings Report
FL1124000.RCE.RP.J03.020131.Appraisal Findings 391
Table 11.16: Highway capacity problems and potential schemes - Cliffe
Description InitialStandard Potential standard required by:
2015 2030
Current Land Use Planning System
Option A2(2) & A2(3) Maximum Use Existing Runways Option A2(4) & A2(5)
Airport Access
Airport access to A2 west of Shorne Wood (proposed)
n/a n/a D2 n/a D2
Airport access, Lower Higham – Airport(proposed)
n/a n/a D3(M) n/a D3(M)
Airport access, Lower Higham – M2 (proposed)
n/a n/a D2(M) n/a D2(M)
Lower Thames Crossing (proposed) n/a n/a D2 tunnel n/a D2 tunnel
Link from Lower Higham to airport cargo and maintenance area (proposed) n/a n/a S2 n/a S2
Benfleet Tunnel (proposed) n/a n/a n/a n/a D2
Strategic Network
M25: J26 to J29 D3 (M) D3 (M) D4 (M) D4 (M) D4 (M)
A13: A1089 to A128/LTC D2 n/a D3 n/a D3

SERAS Stage Two: Appraisal Findings Report
FL1124000.RCE.RP.J03.020131.Appraisal Findings 392
11.5.24 As noted in Section 11.3, SPASM forecasts demand at Cliffe to be predominantly 95% from the
South East. Demand assigned to the Inter City Routes (Birmingham, Leeds and Newcastle) is
negligible. These services would not be needed, either to accommodate demand or increase
the public transport mode share at the airport, avoiding the need for a chord at Belle Isle.
11.6 Environment: Land Take
11.6.1 The environmental issues considered in Stage Two of SERAS builds on work undertaken in
Stage One on land use, ecology, heritage, landscape and townscape, water, noise and air
quality. Stage Two in addition appraises impacts on contamination and community issues. For
each of these environmental topics a baseline is defined and then the results of the appraisal of
each option is presented. Details of existing land uses and environmental features within the
study area are provided in Figures 11.19 to 11.22. Summaries of the key impacts of each option
are presented in the Appraisal Summary Table. Fuller details of the baseline data and appraisal
of options can be found in the supporting environmental appraisal report.
Existing Conditions
Land Use – residential, commercial/industrial, public buildings, recreation, agriculture,planning constraints (Figure 11.19)
11.6.2 The proposed airport site development would take a large area of land on the Hoo peninsula.
The site has currently no airport-associated use. Current land uses are described below.
11.6.3 Residential - The towns of Gravesend, Rochester, Strood, Chatham, Gillingham, Sheerness
and Canvey Island lie within a 7km radius of the proposed development. A series of smaller
settlements are located closer to (but outside the footprint of) the proposed site and include
Cliffe which lies just 500m to the west. Several small villages (AllHallows – on – Sea,
Allhallows, St Mary Hoo, and parts of High Halstow and Lower Stoke) are located within the
footprint of the proposed site. The areas between these villages are generally open land,
containing scattered properties.
11.6.4 Commercial/Industrial - There are various small-scale commercial areas including: a caravan
site, a hotel, a pumping station, a water tower and a radio/TV mast.
11.6.5 Recreation -The North Kent Marshes are used for unofficial recreation by birdwatchers and
ramblers. The Saxon Shore Way national footpath runs through the maximum option boundary.
In addition, several formal recreational areas are situated within the footprint of the proposed
site development and include a yacht club, a community woodland and allotments. Many of
these are also designated at district level as Open Space.

SERAS Stage Two: Appraisal Findings Report
FL1124000.RCE.RP.J03.020131.Appraisal Findings 393
11.6.6 Public Buildings - Two places of worship are located within the footprint of the proposed airport
development site (one each within Allhallows and St Mary Hoo). One school is also located
within this area (at Allhallows).
11.6.7 Agriculture - The remainder of land on the Hoo Peninsula is predominantly in agricultural use. A
significant proportion of land is of high agricultural quality including orchards. Nearer the
Thames, much of the land is coastal grazing marsh of predominantly Grade 3 agricultural land
quality with some Grade 4.
11.6.8 Land Use Planning Constraints - An area of Green Belt is located to the east of Gravesend.
Canvey Island and Southend on the north shore of the Thames are also surrounded by Green
Belt. The coastlines along the south shore of the Thames, the north shore of the Medway and
islands within the Medway Estuary are largely covered by the district designation of
Undeveloped Coast.
Contamination (Figure 11.19)
11.6.9 There are 14 sites with potential for contamination that have been identified in the study area.
Of these 3 are considered to have potential for a ‘great’ scale of contamination, all of which are
landfill sites. The presence on some of the mapping of a firing range/danger zone/battery north
west of Grain village and of other possible military structures north of Fenn Street on older
maps, may suggest the potential for buried ordnance along or close to the foreshore of the
Thames.
Ecology (Figure 11.20)
11.6.10 There are three Special Protection Areas (SPAs) and Ramsar sites in the study area (see
below) and a candidate Special Area of Conservation (cSAC). Such sites are of international
importance (very high ecological value). All four sites form part of a network of international
sites within Kent and Essex in the wider Thames Estuary. All areas covered by cSAC, SPA or
Ramsar designations are also designated as SSSI (national).
11.6.11 The Thames Estuary and Marshes Special Protection Area (SPA) and Ramsar site (of very high
ecological value) extends along the shores of the River Thames and includes land in the west,
north and east of the Hoo Peninsula. The majority of the site is designated as both SPA and
Ramsar site, however Shorne Marshes to the south west of the maximum option boundary and
Cooling Marshes (part of which are within the maximum option boundary) are designated as
Ramsar only. All of these areas are of international importance and comprise a wetland with a
mosaic of intertidal habitats, saltmarsh, coastal grazing marsh, saline lagoons and chalk pits.
The site provides wintering and breeding habitats for important assemblages of wetland bird
species and supports migratory birds on passage. The site regularly supports over 20,000
waterfowl in any one season. The Thames Estuary and Marshes site is also important for its

SERAS Stage Two: Appraisal Findings Report
FL1124000.RCE.RP.J03.020131.Appraisal Findings 394
plant assemblages, particularly in the grazing marsh dykes and fleets. The site also supports
endangered, vulnerable and rare invertebrates. There are large populations of water vole and
brown hare on the North Kent marshes. The site is considered to have low potential for
substitution due to its large area and the complex mixture of habitats present.
11.6.12 The Medway Estuary and Marshes SPA and Ramsar site (of very high ecological value)
extends along the River Medway and its shores, from south of Hoo St Werburgh in the west to
Grain container terminal in the east where it abuts the boundary of the River Thames estuary
and Marshes SPA. The majority of the site is designated as both SPA and Ramsar site,
however, Smithfield Marshes on the Isle of Grain is designated as Ramsar only. The site has a
complex arrangement of drainage channels, which drain around large islands of saltmarsh,
mudflats and peninsulas of grazing marsh. Grazing marshes are also located behind the sea
walls and are intersected by dykes and fleets. The Medway estuary and Marshes SPA provides
wintering and breeding habitats for important assemblages of wetland bird species and
supports migratory birds on passage. There is an outstanding assemblage of plant species on
the saltmarsh, sea walls, dykes and their margins, including several nationally scarce plants.
The site also supports at least 12 Red Data Book invertebrates. The site is considered to have
low potential for substitution due to its large area and the complex mixture of habitats present.
11.6.13 A small part of the nationally-designated Medway Estuary and Marshes SSSI (of high ecological
value) within the area of search is not covered by the SPA and Ramsar designation. This small
site is located on the eastern coast of the Isle of Grain (St James Park). The shell sand
beaches of the Isle of Grain are the only examples of such habitat remaining so far up the
Thames estuary and have a distinctive flora, including sand couch, sea holly, sea sandwort, sea
rocket and prickly saltwort. The site also comprises woodland/ scrub and grassland. This
habitat has a medium-low potential for substitution.
11.6.14 A further internationally-designated SPA and Ramsar site (Southend and Benfleet Marshes) (of
very high ecological value) is located along the north shore of the Thames, east of Canvey
Island. The site comprises a large area of intertidal mudflats in addition to saltmarsh, scrub and
grassland. Benfleet and Southend marshes have been designated because they regularly
support over 20,000 waterfowl in winter and support internationally or nationally important
wintering populations of migratory waterfowl including dark-bellied brent geese, grey plover,
knot, ringed plover and dunlin. These habitats are considered to have a low potential for
substitution.
11.6.15 The internationally designated Essex Estuaries candidate Special Area of Conservation (of very
high ecological value) is located immediately east of Benfleet and Southend Marshes SPA and
Ramsar site, covering an extensive area to the north (including the Blackwater Estuary, the
Colne Estuary, the Crouch and Roach Estuaries, Dengie and Foulness). The site has been
recommended for SAC status as it supports 7 habitats of European importance (including upper
and lower saltmarsh, saltmarsh supporting cord-grass swards, saltmarsh scrub, estuaries,
intertidal mud and sandflats and subtidal sandbanks).

SERAS Stage Two: Appraisal Findings Report
FL1124000.RCE.RP.J03.020131.Appraisal Findings 395
11.6.16 Two nationally-designated SSSIs (of high ecological value) are located within the area of
search:
• Northward Hill SSSI and NNR are located within the centre of the proposed airport
site. The site comprises ancient woodland and grazing marsh and is owned and
managed by the RSPB.; and
• Chattenden Wood SSSI is located approximately 2km south of the proposed
airport site and east of Cliffe Woods. The woodland is ppredominantly coppice-
with-standards (a scarce habitat in Kent) and includes neutral grassland with
scattered scrub.
11.6.17 There are a number of undesignated areas of nature conservation importance (predominantly of
low ecological value unless otherwise specified) which include:
• An extensive network of drainage ditches and dykes across arable land that is
likely to be of value for plants and invertebrates as well as waterfowl (including
herons) and water voles. This network provides valuable wildlife corridors
between areas of neutral grassland and grazing marsh and has a low potential for
substitution due to the large number of ditches and dykes across a wide area.
The network of ditches is considered to be of medium ecological value; and
• Nine small copses which are poorly connected by hedgerows although well-connected by ditches.
Heritage (Figure 11.21)
11.6.18 Archaeology – The proposed airport site is located in an area of high archaeological value,
containing a range of multi-period sites. The North Kent Marshes, within which the site lies, has
been the subject of a number of recent detailed surveys. These suggest that the area of coastal
marshes and the area of higher ground to the south represent areas of significant archaeological
interest, containing areas of waterlogged, palaeo-environmental deposits of potentially national or
international importance.
11.6.19 The area’s particular value results from its potential to contain well preserved and
stratigraphically complex waterlogged deposits providing evidence relating to climatic and
hydrological change during the Palaeolithic period. The area is also likely to be of interest for its
potential to contain important sites providing evidence of Neolithic and Bronze Age activity,
including well preserved settlement sites and buried land surfaces which may have been sealed
and protected by later alluvial layers associated with a rise in sea level. In addition it could
contain important sites associated with later prehistoric (Iron Age), Roman and medieval
SERAS Stage Two: Appraisal Findings Report
FL1124000.RCE.RP.J03.020131.Appraisal Findings 396
utilisation of the inter-tidal (marshland) zone, primarily in the form of salt making or pottery kiln
sites, which are fairly common within this area. Previous surveys have noted the considerable
potential of the marshland areas to contain well preserved, multi-period waterlogged deposits
and artefacts such as boats, wooden objects and palaeo-environmental deposits which would
not have survived in more aerobic circumstances. Generally, therefore, it can be demonstrated
that the area of marshland and the land to its south is likely to represent an area of potentially
significant archaeological interest. The area of proposed development contains 34
archaeological sites or groups of sites with an additional 21 lying within the 500m study corridor
around the site.
11.6.20 Listed Buildings - The study area for the proposed development contains 23 Listed Buildings.
These include five designated Grade I/II* (national value) of which four are Grade I Listed and
one is a Grade II* Listed (national value). The Grade I buildings are Cooling Castle Gatehouse,
the inner ward to Cooling Castle, the Church of St. Margaret, High Halstow, and the Church of
All Saints, All Hallows while the Grade II* Listed Building is the Church of St. Mary St Mary Hoo
(when last surveyed this building was redundant and being converted into a house).
11.6.21 Of the identified Listed Buildings, 10 are contained within the area of proposed development,
including the Church of All Saints (Grade I) and the Church of St. Mary (Grade II*). The
remaining 13 Listed buildings, including the three Grade I/II* buildings, fall within the 500m
corridor surrounding the area of proposed development (a small concentration (seven) of these
are located at Cooling and includes the two Grade I Listed Buildings of Cooling Castle
Gatehouse and the inner ward to Cooling Castle).
11.6.22 Conservation Areas - The area of proposed development includes one Conservation Area, at
St. Mary Hoo (national).
Landscape and Visual (Figure 11.22)
11.6.23 Landscape/Townscape - The landscape in the vicinity of Cliffe is defined by the broad,
expansive, openness of the Greater Thames Estuary (regional character area identified by the
Countryside Agency) which is distinctive for its huge scale, general absence of trees and high
levels of intervisibility over considerable distances. The flat areas of marshland and mudflats
create a strong estuarine/coastal character that, despite the presence of many large scale
industrial facilities, means that the area retains a sense of wildness and remoteness in many
places. At Cliffe, this openness is offset by the low ridge of the Hoo Peninsula which extends
from the north Kent Downs (a nationally designated Area of Outstanding Natural Beauty that
lies beyond the 5km study area and without visual links to the site) into the estuary landscape to
separate the Rivers Thames and Medway and create a low backdrop to local views. The
landscape within 5km of the site at Cliffe has been divided into four areas of distinct landscape
and townscape character.

SERAS Stage Two: Appraisal Findings Report
FL1124000.RCE.RP.J03.020131.Appraisal Findings 397
• Greater Thames Estuary (South Essex) is located on the northern banks of the Thames
and extends inland over the flat marshes of Vange and Benfleet Creeks. The character
area is enclosed by the hills of South Benfleet, Hadleigh and Southend on Sea. Much of
the coastline of the more urbanised northern side of the estuary is developed with power
stations and oil refineries forming prominent features. Although some natural areas remain
(such as the ancient landscape of Fobbing Marshes), the general value of the landscape is
assessed as low.
• Eastern Thames Marshes are bounded by the River Thames to the north and the low ridge
of the Hoo Peninsula to the south. This character area comprises an extensive area of
semi-natural mudflats, marshland and grazed pasture and a considerable length of
accessible undeveloped river frontage/coastline. Buildings are almost entirely absent and,
despite views across the estuary to distant detractors, the landscape provides a valuable
sense of wildness and remoteness. The eastern part of this area includes a section of the
North Kent Marshes which are designated at a county level as a Special Landscape Area
(with additional local designations to the west of Cliffe). The value of this area is assessed
as medium/high.
• Hoo Peninsula forms a low ridge of open, rolling arable fields that gently dip towards the
sea at Allhallows. The Peninsula generally has few trees, but occasional landmark woods
(such as at High Halstow), occasional fruit growing areas and lanes (including several
designated rural lanes) enclosed by hedgerows do occur. Although the landscape
character lacks distinction, the value of this landscape is assessed as medium due to its
historic associations and its importance as a backdrop to surrounding views.
• Medway Marshes are enclosed to the south east of the Hoo Peninsula. This extensive
system of low islands and creeks retains a sense of naturalness and wildness despite
surrounding towns and the visibility of other developments. Parts of the Medway estuary
are within the county designated Special Landscape Areas and the value of this landscape
is assessed as medium.
11.6.24 Visual - The extensive area covered by the indicative zone of potential visual impact (ZVI) of the
maximum extent of Airport Options boundaries is defined by the flat, openness of the estuarine
landscape, limited only by the visibility ‘shadow’ caused by the ridge of the Hoo Peninsula. The
landscape contains few trees, woodlands, hedgerows or other landcover to reduce visibility of
large structures from within this area.
11.6.25 Key visual receptors within 5km of the site would include residents in the villages, hamlets and
other settlements of the Hoo Peninsula not directly affected by the landtake of the proposed
development. These include the Conservation Area at Cliffe and the elevated town of Higham.
Although these receptors’ views are already affected by distant detractors, the airport
development would be significantly closer with little to filter views of potential large structures.

SERAS Stage Two: Appraisal Findings Report
FL1124000.RCE.RP.J03.020131.Appraisal Findings 398
Other sensitive receptors would include walkers using the Saxon Shore Way and the present
coastal footpath.
11.6.26 Owing to the exceptionally open character of the landscape around Cliffe, a selective number of
major visual receptors beyond the 5km study area have been identified which are likely be
affected by the development. These include the elevated towns of South Essex, the seaside
resort of Southend and the villages and Riverside Country Park located on the southern shores
of the Medway and which face the distant ridgeline of the Hoo Peninsula. The sensitivity of
these visual receptors is limited by the exceptional openness of the Thames Estuary landscape
and the presence of many detractors.
Community
11.6.27 Community Infrastructure – There are three tiers of settlement in the immediate vicinity of the
site: sizeable villages such as Cliffe, High Halstow, Lower Stoke and Allhallows; small villages
or hamlets, such as Cooling, St Mary Hoo, Fenn Street and Stoke; and scattered farmsteads
and other properties. The IMD ranking of the two baseline wards is 2,616 for All Saints and
6,156 for Thames Side. This represents a range of 3,540 places, or about 42% of the national
spectrum, which suggests that levels of deprivation are relatively polarised.
11.6.28 Community Structure/Distinctiveness – The population of the Core Catchment Area, as defined
in Stage One of the study (ie the districts of Medway, Gravesham, Basildon, Castle Point and
Southend) is 878,000. Much of the study area comprises the Thames Side marshes, which are
largely uninhabited. The nearest urban communities are the Medway towns, Gravesend,
Sheerness, Canvey Island and Southend-on-Sea.
11.6.29 Work undertaken in Stage One of SERAS indicates that the long-term housing capacity of the
Core Catchment Area is probably around 25,000 dwellings within the relevant Structure Plan
periods. It is assumed that such an increase could be accommodated by intensification of
existing built-up areas, development of brownfield sites, a degree of urban fringe expansion and
new “village” settlements.
11.6.30 The area is not known to be subject to intrusive levels of aircraft noise.
11.6.31 Employment – At 4.4%, unemployment levels within the Core Catchment Area are below the
national average.
High * Adverse Impacts: Option A2(2)
11.6.32 The High* adverse impacts of Option A2(2) at Cliffe Marshes are summarised below.

SERAS Stage Two: Appraisal Findings Report
FL1124000.RCE.RP.J03.020131.Appraisal Findings 399
11.6.33 Option A2(2) would result in the loss of 1,968 ha of agricultural land and a significant proportion
of this total would be Grade 1. It is estimated that approximately 75% of the land lost is BMV
land (i.e. 1476 ha) and effects would consequently be HA*.
11.6.34 There would be landtake from the Thames Estuary and Marshes SPA of very high ecological
value (also designated as Ramsar and SSSI), including part of St Mary’s Marshes, Salt Fleet,
and Blyth sands in the north and part of Allhallows Marshes in the east. In addition, a
percentage of Cooling Marshes, part of the Thames Estuary and Marshes Ramsar site, would
be lost due to Option A2(2) (this area is also designated as SSSI but not SPA). The loss of this
substantial area from an international site is considered to cause HA* effects.
11.6.35 In addition, 100% of the nationally important Northward Hill SSSI and NNR (of high ecological
value) would be lost, resulting in HA-HA* effects due to the inability to substitute ancient
woodland.
11.6.36 The cumulative effect on the Heritage resource is considered to be at least HA as a result of the
loss of one Grade I, one Grade II* and seven Grade II listed buildings, the destruction of St.
Mary Hoo Conservation area, the loss of 26 known archaeological sites and significant landtake
from an area of proven high archaeological potential, all of which would contribute to a HA
effect. This could, however, rise to HA* through the loss of a large area of former or existing
marshland containing possibly nationally or internationally significant palaeo-environmental
deposits. The precise determination of this level of severity would require further detailed
research of the marshland within this area, to establish the nature of the deposits present, their
likely level of preservation and hence their value.
11.6.37 Both the Thames Estuary and Marshes SPA and the Medway Estuary and Marshes SPA are
located within 50m of the Option A2(2) boundary (to the north and east). Disturbance of birds in
all seasons would be likely to constitute the most severe construction effects and such
disturbance could be critical in the winter. Construction effects on these international sites
could consequently be HA- HA*.
High Adverse Impacts: Option A2(2)
11.6.38 It is anticipated that noise and visual effects on the Thames Estuary and Marshes SPA and
Ramsar site could be at least HA due to sensitivity of wetland bird populations on the site. In
particular, feeding waders on the mudflats would suffer noise disturbance due to their location 1
km from the side of a runway and 1 km from the end of a runway.
11.6.39 Both the Thames Estuary and Marshes and the Medway Estuary and Marshes SPAs may be
affected by changes in water levels and/or quality due to raising of the airport site to 18m above
sea level and consequent changes in drainage. Although detailed studies on water balance
within and around the site have not been undertaken, these effects are provisionally estimated
at MA-HA.

SERAS Stage Two: Appraisal Findings Report
FL1124000.RCE.RP.J03.020131.Appraisal Findings 400
11.6.40 The overall impact of Option A2(2) upon the landscape would be HA due to the loss of a large
area of County designated Special Landscape Area (and presently undeveloped coastline) and
the impact on the highly visible landform and ridgeline of the Hoo Peninsula. Effects resulting
from direct loss of specific heritage resources, including Conservation Areas and designated
rural lanes, are addressed in the Heritage Topic above.
11.6.41 The housing demand could be met only by substantial change in the settlement pattern (e.g.
excisions from the Green Belt or consolidation of existing communities). This degree of change
would represent an MA effect on the structure and distinctiveness of communities within the
Core Catchment Area. However, the effect within the immediate vicinity of the new airport
would be HA if substantial new urban development were to be permitted, since the Hoo
Peninsula is at present predominantly rural in character. Extensive development would be likely
to subsume the existing settlement pattern of small and medium-sized villages.
High* Adverse Impacts: Option A2(3)
11.6.42 The High* adverse impacts of Option A2(3) are as for A2(2) with:
• Additional loss of agricultural land
• Greater area of Cooling Marshes within the Thames Estuary and Marches
Ramsar site lost
• Further loss of archaeological sites and historic marshland
• Reduced buffer zone around the Scheduled Ancient Monument at Cooling Castle
High Adverse Impacts: Option A2(3)
11.6.43 The High Adverse impacts of Option A2(3) are as for A2(2) with:
• Additional loss of a Grade II Listed Building – a 16th century barn
• Greater visual intrusion
High* Adverse Impacts: Option A2(4)
11.6.44 The High* Adverse impacts of Option A2(4) are as for A2 (2) with:
• Additional loss of agricultural land

SERAS Stage Two: Appraisal Findings Report
FL1124000.RCE.RP.J03.020131.Appraisal Findings 401
• Greater potential for disturbance of birds on the mudflats of the Thames Estuary
and Marshes SPA and Ramsar site due to proximity of additional parallel runway
• Greater loss of archaeological sites and historic marshland
High Adverse Impacts: Option A2(4)
11.6.45 The High Adverse impacts of Option A2(4) are as for Option A2(2) but with:
• Greater visual intrusion
High* Adverse Impact: Option A2(5)
11.6.46 The High* Adverse impacts of Option A2(5) are as per option A2 (2) with:
• Additional loss of agricultural land
• Greater loss of Cooling Marshes
• Greater potential for disturbance of birds on the mudflats of the Thames Estuary
and Marshes SPA and Ramsar site due to proximity of additional parallel runway
• Greater loss of archaeological sites and historic marshland
High Adverse Impacts: Option A2(5)
11.6.47 The High Adverse impacts of Option A2(5) are as per Option A2 (2) with:
• Greater visual intrusion
• Greater impact from construction
Potential Strategy for Mitigating Ecological Impacts
11.6.48 Following Stage One, Scott Wilson were commissioned to investigate further the ecological
value of the area, to outline potential impacts and to identify potential mitigation/compensationmeasures. The findings of this study are presented in a separate report SERAS North Kent
Marshes Ecological Study: Phase 1 Repor” and are summarised here.

SERAS Stage Two: Appraisal Findings Report
FL1124000.RCE.RP.J03.020131.Appraisal Findings 402
11.6.49 The site for the proposed airport is mainly agricultural land. However, surrounding the proposed
site is a suite of internationally recognised wetland sites of outstanding importance associated
with the wider Thames Estuary. The three statutory sites of importance for nature conservation
on the Hoo Peninsula are:
• Thames Estuary and Marshes SPA and Ramsar site. The SPA is a wetland of
European importance comprising a mosaic of intertidal habitats, saltmarsh, coastal
grazing marshes, saline lagoons and chalk pits. The marshes extend for
approximately 15 km along the south side of the Thames Estuary (South Thames
Estuary and Marshes SSSI) and also include intertidal areas on the north side of the
Estuary (Mucking Flats and Marshes SSSI). To the south of the river, much of the
area is brackish grazing marsh, although some of this has been converted to arable
use. At Cliffe, there are flooded clay and chalk pits, some of which have been infilled
with dredgings. Saline lagoons are found at Cliffe and Allhallows. Outside the sea
wall, there is a small extent of saltmarsh and broad intertidal mudflats covering over
2,250 ha on the south bank of the Thames. The estuary and adjacent grazing marsh
areas support an important assemblage of wintering waterbirds, including grebes,
geese, ducks and waders. The site is also important during the spring and autumn
migration periods. The designation as a Ramsar site is due to the international
importance of the wetland for supporting vulnerable, endangered or critically
endangered species or threatened ecological communities. It is also used regularly by
over 20,000 wintering waterfowl.
• Medway Estuary and Marshes SPA and Ramsar site. The SPA is a wetland of
international importance comprising grazing marshes, intertidal flats and saltmarshes.
The site boundary reflects that of the Medway Estuary and Marshes SSSI. The SPA
has a complex arrangement of tidal channels, which drain around large islands of
saltmarsh and peninsulas of grazing marsh. The mudflats are rich in invertebrates and
also support beds of algae and eelgrass. Small shell beaches are found, particularly in
the outer part of the estuary. Grazing marshes are present inside the sea walls around
the estuary. The complex and diverse mixes of coastal habitats support important
numbers of waterbirds throughout the year. In summer, the estuary supports breeding
waders and terns, whilst in winter it holds important numbers of geese, ducks, grebes
and waders. The site is also of importance during spring and autumn migration
periods, especially for waders. The designation as a Ramsar site is as noted above for
the Thames Estuary and Marshes SPA and Ramsar site.
• Northward Hill SSSI/NNR. This site comprises 53 ha of ancient woodland. It is owned
and managed by the Royal Society for the Protection of Birds (RSPB) and forms part
of the Northward Hill RSPB Nature Reserve. The RSPB Reserve covers 249 hectares
of woodland and grazing marsh. The 54 ha woodland is being almost doubled in size
by natural regeneration from arable farmland. It supports a wide variety of birds

SERAS Stage Two: Appraisal Findings Report
FL1124000.RCE.RP.J03.020131.Appraisal Findings 403
through the year and includes the largest heronry in Great Britain, which has been the
subject of one of the longest-running monitoring programmes seen in the United
Kingdom.
11.6.50 Other designated sites in the vicinity of the proposed development include Benfleet and
Southend Marshes Special Protection Area (SPA)/Ramsar site to the north-east of the Hoo
Peninsula, and The Swale SPA/Ramsar site to the south-east.
11.6.51 It is currently not possible to predict accurately all potential impacts. A comprehensive
assessment of all existing data available for the affected areas, in conjunction with detailed
surveys, would be required before an accurate understanding of impacts could be gained. The
following briefly describes potential impacts.
11.6.52 While various options are still under consideration, given the size of the proposed airport, there
is likely to be landtake to the following areas as a consequence of their location: Cooling,
Whalebone, Halstow and St Mary’s Marshes; part of Allhallows Marshes; Hope, Buckland and
Decoy Fleets; and Northward Hill SSSI/NNR. Whalebone Marshes and part of Cooling Marshes
lie within the Thames Estuary and Marshes Ramsar site but outside the SPA. The Fleets lie
within the SPA, as does Allhallows Marshes. One option causes minor encroachment to the
mudflats, just to the west of Allhallows-on-Sea.
11.6.53 The area of landtake includes grazing marshes, creeks and ancient woodland; it is likely to
include almost all of Northward Hill RSPB Nature Reserve. These impacts are likely to cause
highly significant effects, which it will be difficult to mitigate. Northward Hill SSSI/NNR, an area
of ancient woodland, will, by the very nature of the age of the habitat being lost, prove
impossible to replace. The loss of this site is of particular concern because of its historic, social
and educational role as a National and RSPB Nature Reserve. During the development of the
airport options, serious consideration was given to the retention of the Nature Reserve but it
became clear that from a topographic and, more importantly, birdstrike viewpoint, retention of
the wooded slope was incompatible with the establishment of an airport on the Peninsula.
11.6.54 As well as direct landtake, there will be issues of ‘indirect landtake’, where sites lose their value
for wildlife as a result of changed management. The immediate surrounds of the runways etc.
(i.e. airside areas) will need to be managed in accordance with CAA Guidelines as set out in
CAP 680. As the Thames Estuary attracts large numbers of many of the key birdstrike species
(e.g. gulls, crows, lapwings, waders, starlings etc.), it will be essential for the airport operating
authority to have an active bird control policy on the site and this could extend outside
operational areas if the need arises.
11.6.55 Given that the Thames Estuary is a major migratory pathway for birds (both for long and short
distance movements), it is likely that the surrounding SPAs will pose a significant risk to aircraft

SERAS Stage Two: Appraisal Findings Report
FL1124000.RCE.RP.J03.020131.Appraisal Findings 404
using the site, e.g. the current flight paths cross (probably at 1000-2000ft) the lagoons at Cliffe,
which hold large numbers of wintering and breeding birds. The birdstrike issue could potentially
directly conflict with management within the SPA, as the UK Government is committed to
maintain and enhance the area for the important species it protects.
11.6.56 Outside the zone where bird use is actively discouraged by land management and bird scaring
techniques, birds will be subject to disturbance during both the construction and operational
phases of the airport project.
11.6.57 All bird species using the site are highly sensitive to disturbance, particularly during severe
weather. Disturbance can have the effect of displacing birds, thus reducing their feeding
efficiency while increasing their energy requirements. This factor is a particular concern during
prolonged periods of cold weather. Disturbance may be caused by sudden movements and
increases in noise over and adjacent to feeding and roosting areas. Sensitivity to noise and
visual disturbance is particularly high on open areas such as mudflats. The potential for
disturbance to both SPAs is considerable, the severity being determined by proximity, season
and the precise nature of the ecological attributes at any one location.
11.6.58 Location of the airport within the peninsula will have a significant effect upon the SPAs (and
NNR). Indeed, the construction and operation of the airport is likely to adversely affect the
integrity of the site. As a consequence, under its obligations under the Habitat Directive, the
Government can only grant permission for the development if it is accepted that:
• There are no alternative solutions (locations).
• There are imperative reasons of over-riding public interest.
11.6.59 In this case, compensatory measures must be taken to ensure that the overall coherence of the
Community-wide network of SPAs (and SACs) known as Natura 2000 is protected.
11.6.60 Refining the layout of the airport may enable direct landtake to internationally important sites to
be reduced. To some extent, it may also be possible to minimise disturbance to birds, although
the need to reduce the risk of birdstrike is also a critical factor in siting the airport and its
component elements. It is a recognised if regrettable fact that the design of the airport must
focus upon reducing the risk of birdstrike even if this is likely to increase the ecological impact of
the airport. It is also clear that compensation for the effect upon the Thames Estuary and
Marshes SPA/Ramsar site and the Northward Hill SSSI/NNR/RSPB Nature Reserve should
take place away from the immediate surroundings of the airport in order to avoid exacerbating
the risk of birdstrike.

SERAS Stage Two: Appraisal Findings Report
FL1124000.RCE.RP.J03.020131.Appraisal Findings 405
11.6.61 In order to ensure that the populations of species supported by the Thames Estuary and
Marshes SPA/Ramsar site are maintained elsewhere, further detailed information on the use of
the different components of the SPA/Ramsar site and of adjacent sites will be required. There
is also a question as to how far habitat enhancement (e.g. of adjacent SPAs) represents
compensation for habitat loss; there are those who believe that habitat loss can be balancedonly by habitat creation. Certainly under Article 6 of the Habitats Directive (which applies to
both SACs and SPAs), Member States are already obliged to ‘take appropriate steps to avoid
the deterioration of natural habitats and the habitats of species’. Thus, as the Government
already has a legal obligation to protect and, to a certain extent, enhance existing SACs and
SPAs, habitat enhancement within these areas may not be seen as adequate compensation for
the development. The creation of significant areas of new habitat (off-site compensation) is
likely to be the only accepted form of compensation.
11.6.62 To identify existing suitable areas where the necessary habitats could be created or re-created,
a major desk study of coastal sites has been undertaken. All designated areas (including
SPAs, SACs, Ramsar sites, SSSIs and NNRs) have been plotted, from the Harwich/Felixstowe
area on the Essex/Suffolk border to Hastings on the East Sussex coast. A brief review of the
French coast from the Somme Estuary northwards across the Belgium and southern Dutch
coasts has also been carried out. From this review process an area in north Kent has been
identified which could potentially be managed to create grazing marshes, freshwater and
brackish water ditches, lagoons and reed-beds. It would also be possible to create inter-tidal
mudflats (and possibly saltmarshes) on its northern edge if a managed retreat option were
implemented.
11.6.63 The costs of such a scheme, which have only been developed at a conceptual level, are difficult
to estimate. In making a broad assessment of costs it has been assumed that most of the
habitat creation could be achieved without disturbing or altering the existing infrastructure in this
area. The following very preliminary costings for this scheme alone have been prepared by
Scott Wilson.
• The area (roughly 35km2 or 8,500 acres) could be purchased for approximately £21
million (this is assuming a land value of around £2500/acre). There would also need to
be compensation in some areas for the loss of properties and/or livelihoods, which
could double this figure (say to £40 million).
• The coastal defence works necessary to create the coastal lagoons/inter-tidal mudflats
would cost approximately £75 million.
• The hard and soft landscaping works across the whole area that would be needed to
create freshwater lagoons, pools and reedbeds would cost in the region of £50 million.
In addition it is estimated that approximately £30-40 million would need to be set aside
for the long-term management of this area and to assist in fundamentally altering the
farming practices on this area (e.g. bringing in herds of beef cattle). New sluice gates

SERAS Stage Two: Appraisal Findings Report
FL1124000.RCE.RP.J03.020131.Appraisal Findings 406
and other water management infrastructure would be required, costing around £10
million.
11.6.64 Totalling the above figures, it appears that this area could be turned into a wetland complex for
around £230 million.
11.7 Environment: Water
Existing Conditions
11.7.1 Cliffe Marshes is situated adjacent to the southern coast of the Thames Estuary. The study
area is typified by a number of relatively short drains and creeks that feed into the estuaries
from the spring line between the Chalk/Lower London Tertiaries and the London Clay. The
grazing marshes of the Hoo Peninsula are notable for their value for wildlife. The long drought
intervals of recent years have had their effect here in reduced spring flows and depleted
wetland levels.
11.7.2 There are no classified fresh surface watercourses within the study area. Additionally, at
present the Agency has no nationally agreed system for assessing water quality in estuaries.
There are 33 licensed surface water abstractions within the study area.
11.7.3 The north Kent coastline is particularly vulnerable to tidal surges from the North Sea. A large
extent of the study area falls within the Environment Agency 1 in 1000 year flood level.
Additionally, the soils overlying the London Clay are heavy and poorly drained, resulting in any
excess water being held up at the surface, thereby exacerbating any flooding problem.
11.7.4 The Chalk, a major aquifer, underlies the study area and is at outcrop in the western part of the
site. Towards the centre of the site the Woolwich and Reading Beds (sands and clays) and the
Thanet Sands (which comprise minor aquifers) overlie the Chalk, and these are in turn overlain
by London Clay in the eastern part of the site (non-aquifer). Those areas that border the
estuary also have a thick sequence of alluvium overlying the solid geology. A high water table
may be expected in the study area due to the generally low lying, marshy nature of the ground.
There are 30 licensed groundwater abstractions within the study area.
11.7.5 From a regional perspective, the available water resources are virtually fully committed. The
majority of the area around Cliffe is currently over-licensed. This means that if abstraction
reaches full licensed volumes it will be unsustainable with respect to the environment.
SERAS Stage Two: Appraisal Findings Report
FL1124000.RCE.RP.J03.020131.Appraisal Findings 407
Impact of Options
11.7.6 The options have been assessed against a base case, which is the current land use planning
system, and therefore only considers impacts that are additional to those assessed under the
base case. The assessments consider the sensitivity of the water environment and the
potential to cause harm, which includes scope for mitigation. Table 11.17 summarises the
assessments for each of the water objectives, for each of the options.
11.7.7 All of the options at Cliffe Marshes present a potential impact of either High or High* Adverse on
all of the water objectives, except for groundwater.
11.7.8 Options A2(3) and A2(5) present a potential impact of ‘High Adverse’ on groundwater. The NE-
SW runway within these options overlies the Chalk outcrop, which is highly vulnerable to
contamination.
11.7.9 Due to the topography of the site it is anticipated that it would need to be raised to produce a
level platform area approximately 18 m above sea level. This would require up to 15 m of fill
over the low lying marshes. A number of marshes and creeks, which are noted for their wildlife,
would effectively be destroyed.
11.7.10 Although the raised platform would essentially solve any flooding problems at the Airport itself, it
is likely to increase the risk of flooding elsewhere on the Peninsula. The existing area is largely
rural, and by converting it to hardstanding it not only removes land previously used for valuable
flood storage, but also increases the rate of runoff. Given that a large proportion of the area is
already designated as flood risk, the potential impact is regarded as high.
11.7.11 There would be a large increase in demand for water corresponding to the new airport
development. Without any further water resource development or effort to manage demand,
the water resource zone that would supply the new airport would have a deficit. However,
assuming that water companies maximise existing strategic links and their use of existing and
planned licensed resources between resource zones, the resource zone that supplies the Cliffe
area would have a surplus. This assumes the development of the Bewl-Darwell reservoir
system in East Sussex, which will be essential for resources within the region as a whole. This
also assumes that companies will achieve their leakage reduction targets, and also allows for
environmental demands. Locally, the Medway Estuary and Marshes Special Protection Areas
are being investigated to determine whether existing licences are having an adverse effect.
The outcome of these investigations may have an impact upon future abstractions within the
immediate area.
11.7.12 Given the large increase in demand for water imposed by the development and the pressures
described above, it may be difficult to meet this demand, even assuming that appropriate supply
and demand management techniques are put into place, and other water users within the
region are water efficient.
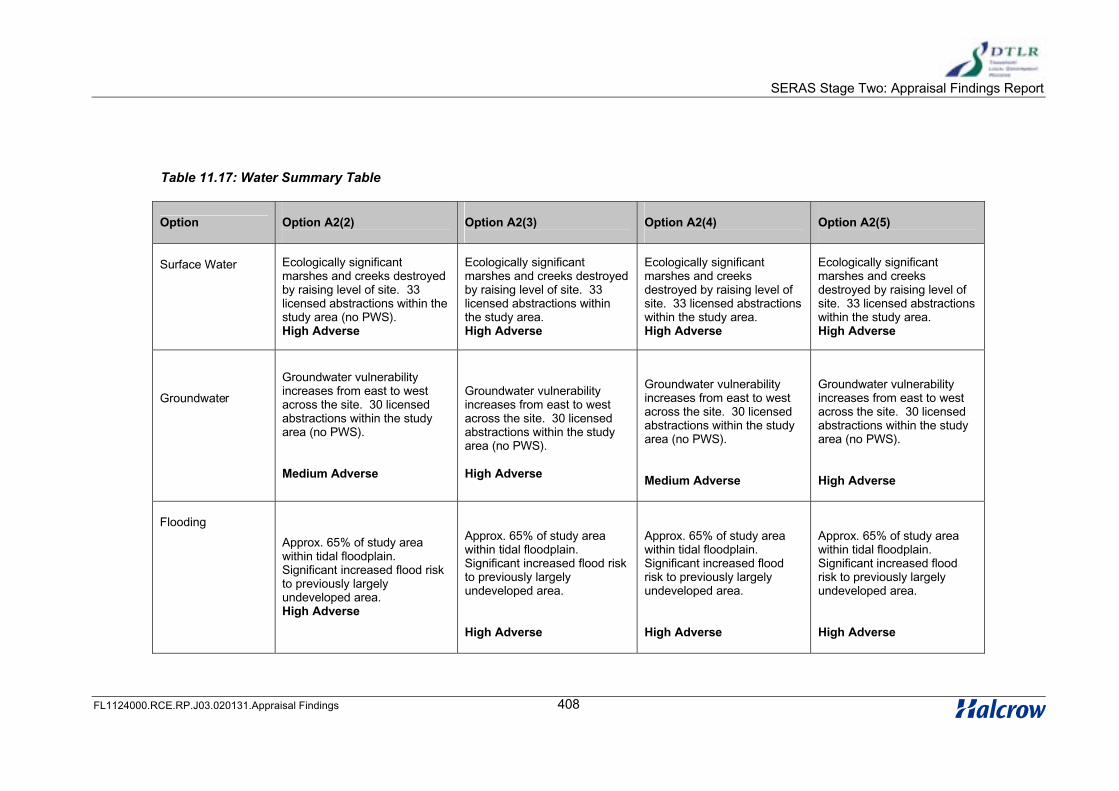
SERAS Stage Two: Appraisal Findings Report
FL1124000.RCE.RP.J03.020131.Appraisal Findings 408
Table 11.17: Water Summary Table
Option Option A2(2) Option A2(3) Option A2(4) Option A2(5)
Surface Water Ecologically significant marshes and creeks destroyed by raising level of site. 33 licensed abstractions within the study area (no PWS).High Adverse
Ecologically significant marshes and creeks destroyed by raising level of site. 33 licensed abstractions within the study area.High Adverse
Ecologically significant marshes and creeksdestroyed by raising level of site. 33 licensed abstractions within the study area.High Adverse
Ecologically significant marshes and creeks destroyed by raising level of site. 33 licensed abstractions within the study area.High Adverse
Groundwater
Groundwater vulnerability increases from east to west across the site. 30 licensed abstractions within the study area (no PWS).
Medium Adverse
Groundwater vulnerability increases from east to west across the site. 30 licensed abstractions within the study area (no PWS).
High Adverse
Groundwater vulnerability increases from east to west across the site. 30 licensed abstractions within the study area (no PWS).
Medium Adverse
Groundwater vulnerability increases from east to west across the site. 30 licensed abstractions within the study area (no PWS).
High Adverse
Flooding
Approx. 65% of study area within tidal floodplain.Significant increased flood risk to previously largely undeveloped area.High Adverse
Approx. 65% of study area within tidal floodplain.Significant increased flood risk to previously largely undeveloped area.
High Adverse
Approx. 65% of study area within tidal floodplain.Significant increased flood risk to previously largely undeveloped area.
High Adverse
Approx. 65% of study area within tidal floodplain.Significant increased flood risk to previously largely undeveloped area.
High Adverse
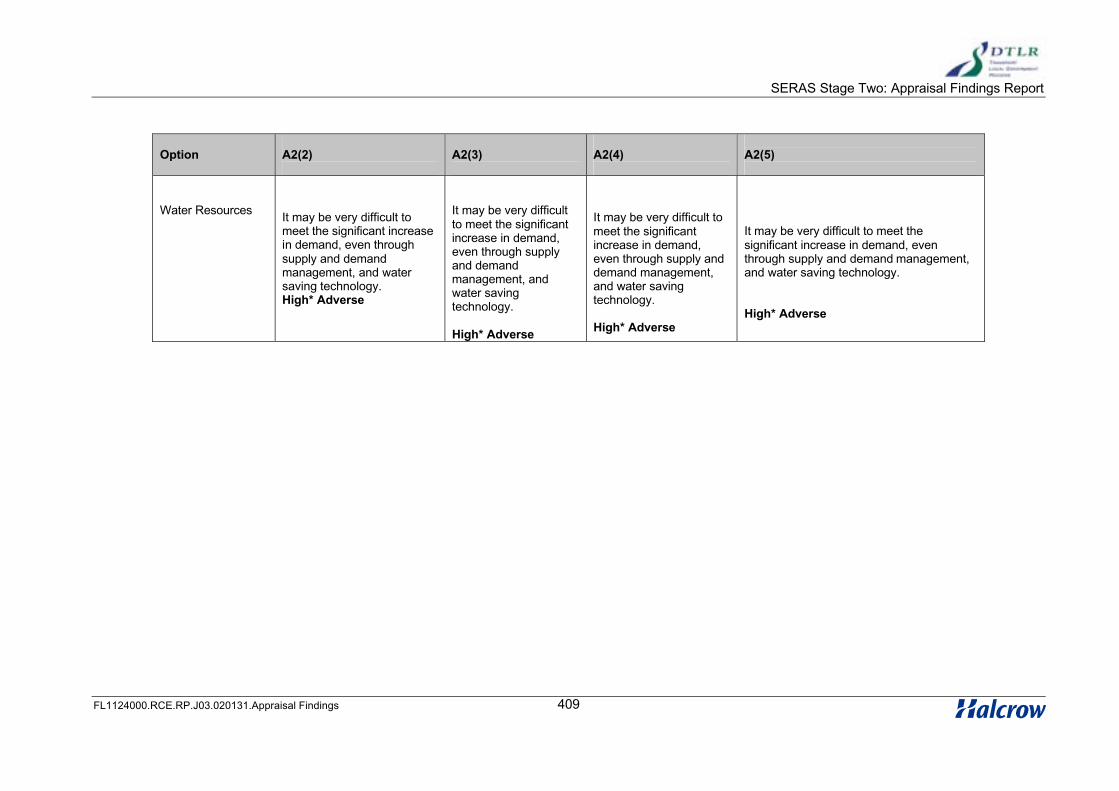
SERAS Stage Two: Appraisal Findings Report
FL1124000.RCE.RP.J03.020131.Appraisal Findings 409
Option A2(2) A2(3) A2(4) A2(5)
Water Resources It may be very difficult to meet the significant increase in demand, even through supply and demand management, and water saving technology.High* Adverse
It may be very difficult to meet the significant increase in demand, even through supply and demand management, and water saving technology.
High* Adverse
It may be very difficult to meet the significant increase in demand, even through supply and demand management, and water saving technology.
High* Adverse
It may be very difficult to meet the significant increase in demand, even through supply and demand management, and water saving technology.
High* Adverse

SERAS Stage Two: Appraisal Findings Report
FL1124000.RCE.RP.J03.020131.Appraisal Findings 410
11.8 Environment: Noise Impacts
Aircraft Noise: Daytime
11.8.1 The Cliffe Marshes contours for the Options in 2015 or 2030 as appropriate are shown on
Figures 11.24 to 11.27. Tables 11.18 and 11.19 give the areas and estimated populations under
the daytime LAeq,16h noise contours for each of these scenarios with changes against the Base
Case. Cliffe Marshes is the proposed site for a new airport and the area in this vicinity is
currently not subject to any significant levels of aircraft noise. The site has been selected, and
runways and flight paths have been designed, to minimise noise impact on people. Cliffe
Marshes itself is an area which is only sparsely populated and flight paths to the east of the
proposed airport will overfly the Thames Estuary
Options in 2015
11.8.2 Option A2(2) is the Base Case and this proposed development comprises a pair of wide spaced
4000m runways. With this scenario the population under the 57 dB contour will only be 4,900
despite the contour covering an area of 94 sq km (part of which is the Thames estuary). The
population within the 69 dB threshold is estimated at 200. The part of the 54 dB contour
associated with northbound departures does extend northwards over East Tilbury, Linford and
Southfields on the north side of the Thames Estuary. Lower Higham and Grain are the only
other significant settlements within the 54 dB contour.
11.8.3 Option A2(3) adds a cross-wind runway to the Base Case. However, this would only normally
be used during the night. Therefore, comparing Option A2(3) with A2(2), there are no
differences for the daytime noise contours.
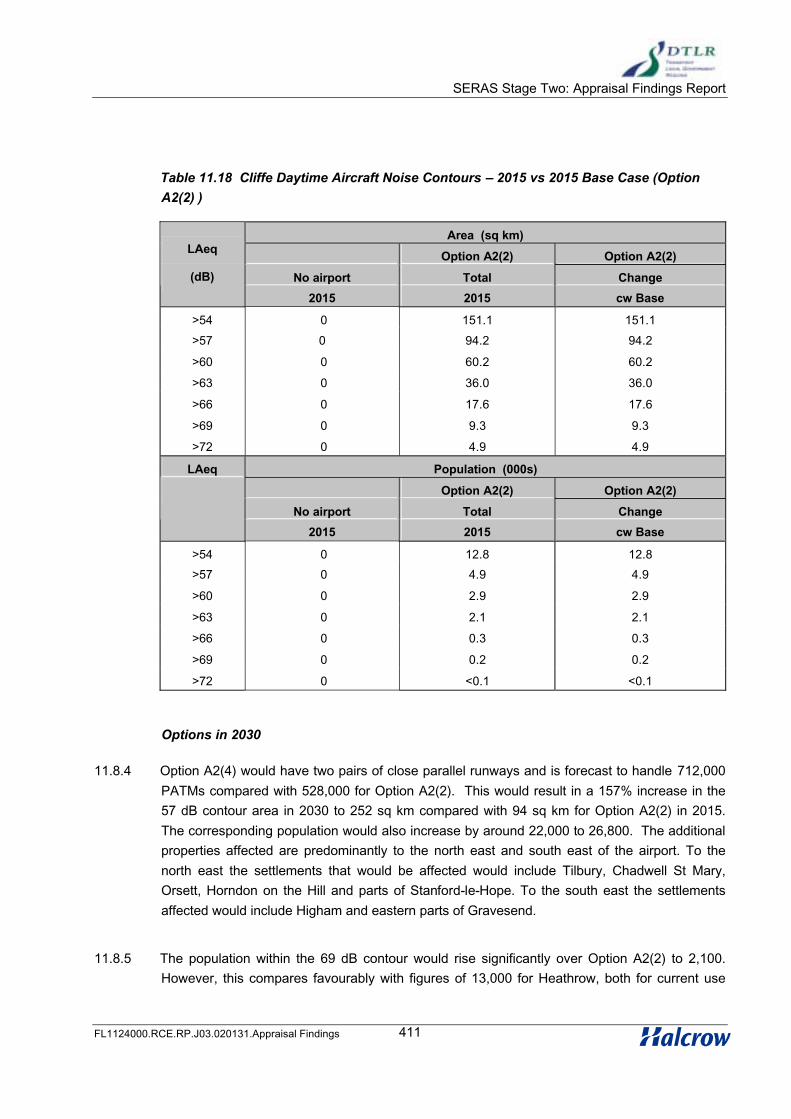
SERAS Stage Two: Appraisal Findings Report
FL1124000.RCE.RP.J03.020131.Appraisal Findings 411
Table 11.18 Cliffe Daytime Aircraft Noise Contours – 2015 vs 2015 Base Case (Option A2(2) )
Area (sq km)
Option A2(2) Option A2(2)
No airport Total Change
LAeq
(dB)
2015 2015 cw Base
>54 0 151.1 151.1
>57 0 94.2 94.2
>60 0 60.2 60.2
>63 0 36.0 36.0
>66 0 17.6 17.6
>69 0 9.3 9.3
>72 0 4.9 4.9
LAeq Population (000s)
Option A2(2) Option A2(2)
No airport Total Change
2015 2015 cw Base
>54 0 12.8 12.8
>57 0 4.9 4.9
>60 0 2.9 2.9
>63 0 2.1 2.1
>66 0 0.3 0.3
>69 0 0.2 0.2
>72 0 <0.1 <0.1
Options in 2030
11.8.4 Option A2(4) would have two pairs of close parallel runways and is forecast to handle 712,000
PATMs compared with 528,000 for Option A2(2). This would result in a 157% increase in the
57 dB contour area in 2030 to 252 sq km compared with 94 sq km for Option A2(2) in 2015.
The corresponding population would also increase by around 22,000 to 26,800. The additional
properties affected are predominantly to the north east and south east of the airport. To the
north east the settlements that would be affected would include Tilbury, Chadwell St Mary,
Orsett, Horndon on the Hill and parts of Stanford-le-Hope. To the south east the settlements
affected would include Higham and eastern parts of Gravesend.
11.8.5 The population within the 69 dB contour would rise significantly over Option A2(2) to 2,100.
However, this compares favourably with figures of 13,000 for Heathrow, both for current use

SERAS Stage Two: Appraisal Findings Report
FL1124000.RCE.RP.J03.020131.Appraisal Findings 412
and the 2030 Base Case, especially given that in Option A2(4) the Cliffe Marshes runways
would be handling more flights.
11.8.6 Option A2(5) adds a cross-wind runway to Option A2(4). However, this would only normally be
used during the night. Therefore, comparing Option A2(5) with Option A2(4), there are no
differences for the daytime noise contours.
Table 11.19 Cliffe Daytime Aircraft Noise Contours – 2030
Area (sq km)
Option A2(4) Option A2(4)
No airport Total Change
LAeq
(dB)
2030 2030 cw Base
>54 0 421.1 421.1
>57 0 251.6 251.6
>60 0 151.4 151.4
>63 0 95.8 95.8
>66 0 60.6 60.6
>69 0 37 37
>72 0 18.9 18.9
Population (000s)
Option A2(4) Option A2(4)
No airport Total Change
LAeq
(dB)
2030 2030 cw Base
>54 0 65.9 65.9
>57 0 26.8 26.8
>60 0 12.8 12.8
>63 0 5.8 5.8
>66 0 3.8 3.8
>69 0 2.1 2.1
>72 0 0.3 0.3
Aircraft Noise: Night-time
11.8.7 Tables 11.20 and 11.21 below show the population numbers and associated house counts
within the departure and arrival 90 dBA SEL footprints for easterly and westerly operations
respectively. The footprints are shown in a supporting document and represent an ‘average
worst’ QC2 aircraft, applied to each departure track (SID) and each runway’s approach path for
arrivals.

SERAS Stage Two: Appraisal Findings Report
FL1124000.RCE.RP.J03.020131.Appraisal Findings 413
11.8.8 SID references are: BUZ – Buzad; WES - Wescott; CLN - Clacton; DVR – Dover; Lam -
Lambourne
Table 11.20: Night Noise Population and House Counts – Easterly Operations
All Options
Runway 09LL 09L 09R 09RR NE/SW
Popl’n
(000’s)
Hse
(000’s)
Popl’n
(000’s)
Hse
(000’s)
Popl’n
(000’s)
Hse
(000’s)
Popl’n
(000’s)
Hse
(000’s)
Popl’n
(000’s)
Hse
(000’s)
Departures
All 0.2 0.1 0.2 0.1 0.2 0.1 0.8 0.3 - -
Arrivals <0.1 <0.1 <0.1 <0.1 1.8 0.7 1.0 0.4 2.3 0.9
Table 11.21: Night Noise Population and House Counts – Westerly Operations
All Options
Runway 27RR 27R 27L 27LL
Popl’n
(000’s)
Hse
(000’s)
Popl’n
(000’s)
Hse
(000’s)
Popl’n
(000’s)
Hse
(000’s)
Popl’n
(000’s)
Hse
(000’s)
Departures
BPK/CLN <0.1 <0.1 <0.1 <0.1 0.8 0.3 2.0 0.8
DVR/SFD <0.1 <0.1 <0.1 <0.1 0.3 0.1 1.3 0.5
Average <0.1 <0.1 <0.1 <0.1 0.6 0.2 1.7 0.7
Arrivals <0.1 <0.1 0.2 0.1 <0.1 <0.1 1.2 0.4
11.8.9 SID references are: BPK – Brookmans Park; CLN - Clacton; DVR – Dover; SFD - Seaford
11.8.10 The most significant issue to note at Cliffe Marshes is that the numbers affected are small. The
number of people affected by easterly arrivals on the NE/SW runway is higher than numbers
affected in other scenarios. On easterly operations, these data suggest that noise impacts
would be minimised by using one of the northerly pair of runways (09LL or 09L) for arrivals and
one of the southern pair (09R or 09RR) for departures, thereby obviating the need for the
NE/SW runway.

SERAS Stage Two: Appraisal Findings Report
FL1124000.RCE.RP.J03.020131.Appraisal Findings 414
Surface Access Noise: Highways
11.8.11 Table 11.22 gives the overall results (total EPA) from the GOMMMS plan level assessment for
road traffic noise. The Surface Access Noise section of Appraisal Summary Table also includes
the EPA values split by noise contour bands.
Table 11.22 – Cliffe Marshes Surface Access Noise Assessment: Highways
Total change in Estimated Population Annoyed (EPA) by road traffic noise (000’s)
Option A2(2) Option A2(3) Option A2(4) Option A2(5)
2015 +13.4 +13.4 n/a N/a
2030 n/a n/a +18.6 +18.6
11.8.12 The noise impacts of changes in road traffic for the Options A2(2) and A2(3) in 2015 are
compared with the Base Case, which is the road network for Package 1. The roads around
Cliffe Marshes affected for these Options include parts of the A2 and much of the length of the
A13 east of the M25. Traffic would use a new tunnel linking the A2/M2 and A13, which would
surface near East Tilbury, on the north side of the Thames Estuary. The tunnel approach road
would give rise to increased noise impacts. The total increases in Estimated Population
Annoyed (EPA) by road traffic noise are 13,400 for Options A2(2) and A2(3).
11.8.13 For 2030, the Base Case is the road network for Package 2 and the traffic noise effects for
Options A2(4) and A2(5) have been assessed for this year. For these options a similar road
network to that for the 2015 assessment, but more extensive, would be affected. To the south,
the effects would extend to the M25 east of Junction 5. With a second Thames tunnel further
to the east, linking into the A130 at Canvey Island, traffic noise impacts would extend through
the Basildon area as far north as Chelmsford. The assessment results in increases in EPA of
18,600 people for Options A2(4) and A2(5).
Surface Access Noise: Railways
11.8.14 Table 11.23 gives the results (total EPA) from the GOMMMS strategy level assessment for
railway noise.

SERAS Stage Two: Appraisal Findings Report
FL1124000.RCE.RP.J03.020131.Appraisal Findings 415
Table 11.23 – Cliffe Marshes Surface Access Noise Assessment: Railways
Total change in Estimated Population Annoyed (EPA) by road traffic noise (000’s)
Year
Option A2(2) Option A2(3) Option A2(4) Option A2(5)
2015/2030 +3.4 +3.4 +3.4 +3.4
11.8.15 The railway noise impacts for the Options at Cliffe Marshes are compared against the Base
Case, which is the Do Minimum railway network. The impacts assessed apply to 2015 for
Options A2(2) and A2(3) and for 2030 for Options A2(4) and A2(5). The new rail services and
associated noise impacts for Options A2(2) and A2(3) would affect the railway line from the
airport to Strood, Maidstone and Ashford, a new high speed link from Hoo to Singlewell, the
CTRL through Ebbsfleet to Barking, from Southfleet through Bromley South to Waterloo and
through East Tilbury, Grays and Wennington. There would also be impacts between Southend
and Shoeburyness and between Faversham and Dover. The change in Estimated Population
Annoyed (EPA) by railway noise for both Option A(2) and A2(3) is an increase of 3,400 people.
The noise effects for Options A2(4) and A2(5) are largely similar to those for the two and three
runway options, also giving an increase in EPA of 3,400.
11.9 Environment: Local Air Quality Impacts
Introduction
11.9.1 Air quality results are provided for representative options at each airport, for 2015 and 2030 as
appropriate. The air quality statistics used as assessment criteria for defining poor air quality in
SERAS Stage Two are: annual mean Nitrogen Dioxide concentrations of 40µg/m3; and the 90th
percentile of running 24-hour mean PM10 concentrations of 50µg/m3. In practice, annual mean
PM10 compared to a statistic of 40µg/m3 are also reported, as the 90th percentile value are a
simple factor of these. The Air Quality Key Indicator for SERAS Stage 2 is 'the number of
people exposed to an exceedance of the air quality standard, weighted by the degree of
exceedance'. The higher the key indicator, the worse the air quality impact is.
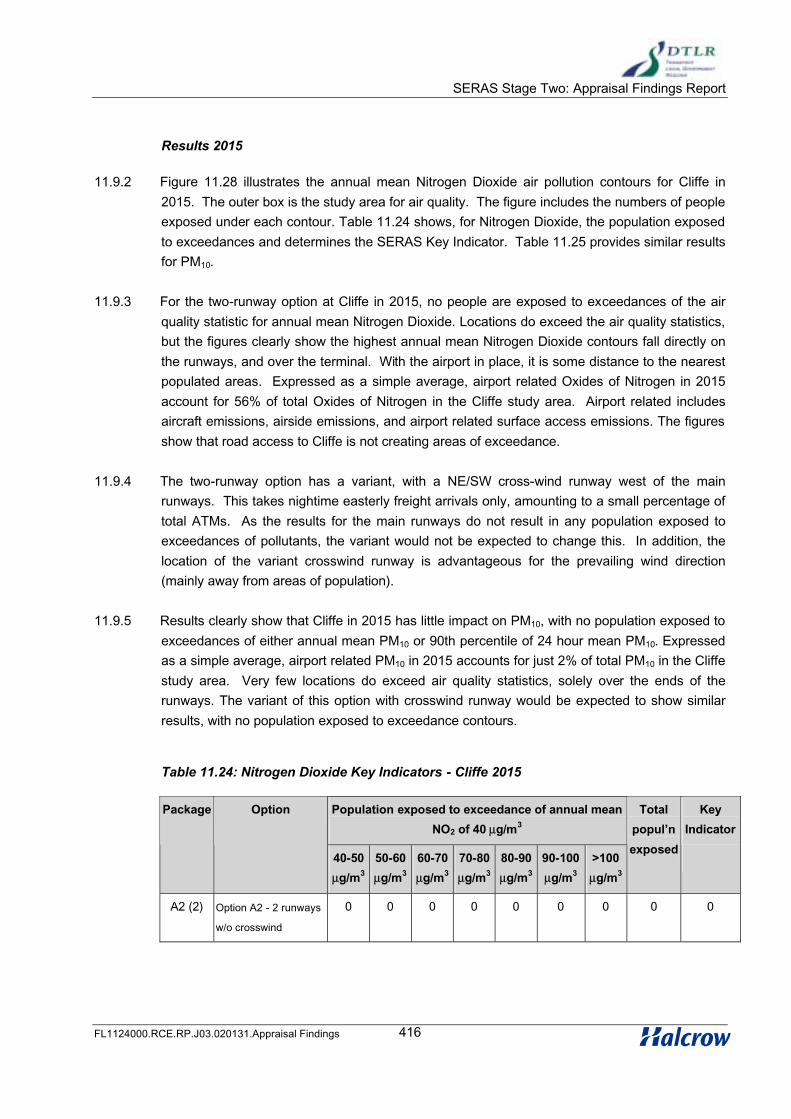
SERAS Stage Two: Appraisal Findings Report
FL1124000.RCE.RP.J03.020131.Appraisal Findings 416
Results 2015
11.9.2 Figure 11.28 illustrates the annual mean Nitrogen Dioxide air pollution contours for Cliffe in
2015. The outer box is the study area for air quality. The figure includes the numbers of people
exposed under each contour. Table 11.24 shows, for Nitrogen Dioxide, the population exposed
to exceedances and determines the SERAS Key Indicator. Table 11.25 provides similar results
for PM10.
11.9.3 For the two-runway option at Cliffe in 2015, no people are exposed to exceedances of the air
quality statistic for annual mean Nitrogen Dioxide. Locations do exceed the air quality statistics,
but the figures clearly show the highest annual mean Nitrogen Dioxide contours fall directly on
the runways, and over the terminal. With the airport in place, it is some distance to the nearest
populated areas. Expressed as a simple average, airport related Oxides of Nitrogen in 2015
account for 56% of total Oxides of Nitrogen in the Cliffe study area. Airport related includes
aircraft emissions, airside emissions, and airport related surface access emissions. The figures
show that road access to Cliffe is not creating areas of exceedance.
11.9.4 The two-runway option has a variant, with a NE/SW cross-wind runway west of the main
runways. This takes nightime easterly freight arrivals only, amounting to a small percentage of
total ATMs. As the results for the main runways do not result in any population exposed to
exceedances of pollutants, the variant would not be expected to change this. In addition, the
location of the variant crosswind runway is advantageous for the prevailing wind direction
(mainly away from areas of population).
11.9.5 Results clearly show that Cliffe in 2015 has little impact on PM10, with no population exposed to
exceedances of either annual mean PM10 or 90th percentile of 24 hour mean PM10. Expressed
as a simple average, airport related PM10 in 2015 accounts for just 2% of total PM10 in the Cliffe
study area. Very few locations do exceed air quality statistics, solely over the ends of the
runways. The variant of this option with crosswind runway would be expected to show similar
results, with no population exposed to exceedance contours.
Table 11.24: Nitrogen Dioxide Key Indicators - Cliffe 2015
Population exposed to exceedance of annual mean
NO2 of 40 µg/m3
Package Option
40-50
µg/m3
50-60
µg/m3
60-70
µg/m3
70-80
µg/m3
80-90
µg/m3
90-100
µg/m3
>100
µg/m3
Total
popul’n
exposed
Key
Indicator
A2 (2) Option A2 - 2 runways
w/o crosswind
0 0 0 0 0 0 0 0 0

SERAS Stage Two: Appraisal Findings Report
FL1124000.RCE.RP.J03.020131.Appraisal Findings 417
Table 11.25: PM10 Key Indicators - Cliffe 2015
Annual mean PM10 of
40 µg/m3
90th Percentile of 24hour
mean PM10 of 50 µg/m3
Package Option
Total
population
exposed
Key
Indicator
Total
population
exposed
Key
Indicator
A2 (2) Option A2 - 2 runways without crosswind 0 0 0 0
2030 results
11.9.6 Figures 11.29 to 11.31 illustrate the air pollution contours for Cliffe in 2030, for annual mean
Nitrogen Dioxide and the two PM10 measures respectively. The outer box is the study area for
air quality. The figures also include tables of the numbers of people exposed under each
contour. Table 11.26 summarises, for Nitrogen Dioxide, the population exposed to exceedances
and determines the SERAS Key Indicator. Table 11.27 provides similar results for PM10.
11.9.7 For the four-runway option at Cliffe in 2030, no people are exposed to exceedances of the air
quality statistic for annual mean Nitrogen Dioxide. The majority of the operational airport space
(rather than the airport boundary) exceeds the air quality statistics, with the highest contours fall
directly on the runways, and to some extent over the terminal. Expressed as a simple average,
airport related Oxides of Nitrogen in 2030 account for 77% of total Oxides of Nitrogen in the
Cliffe study area. ‘Airport related’ includes aircraft emissions, airside emissions, and airport
related surface access emissions. The figures show that road access to Cliffe is not creating
areas of exceedance.
11.9.8 As in 2015, the four-runway option has a variant, with a NE/SW cross-wind runway west of the
main runways, which takes nightime easterly freight arrivals only, amounting to a small
percentage of total ATMs. As the results for the main runways in 2030 do not result in any
population exposed to exceedances of pollutants, the variant would not be expected to change
this.
11.9.9 Results clearly show that the four-runway option at Cliffe in 2030 has little impact on PM10, with
no population exposed to exceedances of either annual mean PM10 or 90th percentile of 24
hour mean PM10. Expressed as a simple average, airport related PM10 in 2030 accounts for less
than 6% of total PM10 in the Cliffe study area. Very few locations do exceed air quality
statistics, solely over the ends of the runways. The variant of this option with crosswind runway
would be expected to show similar results, with no population exposed to exceedance contours.

SERAS Stage Two: Appraisal Findings Report
FL1124000.RCE.RP.J03.020131.Appraisal Findings 418
Table 11.26: Nitrogen Dioxide Key Indicators - Cliffe 2030
Population exposed to exceedance of annual mean
NO2 of 40 µg/m3
Package Option
40-50
µg/m3
50-60
µg/m3
60-70
µg/m3
70-80
µg/m3
80-90
µg/m3
90-100
µg/m3
>100
µg/m3
Total
popul’n
exposed
Key
Indicator
A2 (4) Option A2 - 4 runways
w/o crosswind
0 0 0 0 0 0 0 0 0
Table 11.27: PM10 Key Indicators - Cliffe 2030
Annual mean PM10 of
40 µg/m3
90th Percentile of 24hour
mean PM10 of 50 µg/m3
Package Option
Total
population
exposed
Key
Indicator
Total
population
exposed
Key Indicator
A2(4) Option A2 - 4 runways without crosswind 0 0 0 0
11.10 Employment
Employment Forecasts
11.10.1 It is assumed that Cliffe will perform similar functions to Heathrow in terms of the mix of traffic it
would accommodate. Employment forecasts for Cliffe are based on those of Heathrow, but
Cliffe is assumed to have a lower employee:passenger ratio than Heathrow as a new airport
should be able to adopt labour-saving technology. All other growth factors are similar to those
applied at other airports. Employment forecasts at Cliffe in 2015 and 2030 are presented in
Table 11.28.
11.10.2 Total direct on/off site employment at Cliffe is estimated at 41,000 employees in 2015 for Option
A2 (2)/(3) increasing to 61,000 employees by 2030 with Options A2 (4)/(5). 12,000 indirect jobs
are created in 2015 with an additional 6,000 indirect jobs by 2030.

SERAS Stage Two: Appraisal Findings Report
FL1124000.RCE.RP.J03.020131.Appraisal Findings 419
Table 11.28: Forecast employment at Cliffe by option – 2015 & 2030
Forecast Employment by
Option
Option A2(2)/(3)
2015
Option A2(4)/(5)
2030
Direct on-site 35,000 52,300
Direct off-site 5,800 9,000
Indirect 12,200 18,300
Total Employment 53,000 79,600
Passengers (mppa) 58 110
Direct employees/mppa 696 557
Total employee/mppa 905 724
11.11 Land Use/Urbanisation
Summary
11.11.1 A new airport at Cliffe Marshes would generate new economic development within that part of
south east England most in need of regeneration, namely the Thames Gateway. The Cliffe
Marshes site is located within the Thames Gateway sub-regional planning region, which
represents the main ‘opportunity for growth’ in the South East, with capacity for both significant
levels of housing and employment development up to 2030. The Thames Gateway sub-region
extends east and west beyond the catchment area. Its northern boundary extends along the
A13 corridor north of the estuary, with the southern boundary along the M2.
11.11.2 Historically, there has been under-achievement in the amount and types of new development
secured and employment opportunities offered in the Thames Gateway. Thames Gateway
authorities commonly experience a faster growth in available labour force than actual jobs,
resulting in high unemployment rates and high out-commuting rates. This is particularly the
case in Essex, with Basildon and Southend-on-Sea authorities experiencing congestion and

SERAS Stage Two: Appraisal Findings Report
FL1124000.RCE.RP.J03.020131.Appraisal Findings 420
shortages of sites for economic development. In North Kent in particular, the priority is to
recycle derelict and brownfield land, which provides opportunities for new employment and
housing sites.
11.11.3 The core catchment area for a new airport at Cliffe is taken to include boroughs on both sides of
the Thames estuary: Medway Towns, Gravesham and Dartford in Kent and Thurrock, Castle
Point, Southend-on-Sea, Basildon and Rochford in Essex. The housing provided for in RPG in
these districts amounts to 162,000 households in addition to the existing 776,000. By 2030,
RPG provision exceeds TEMPRO requirements, reflecting RPG policy to achieve a
redistribution of growth from the west to the east of the South East region. This housing growth,
together with higher rates of unemployment and out-commuting in relevant catchment areas,
suggests that the airport’s employment needs should be met with only limited additional housing
development. The location of any additional development will be strongly influenced by new
infrastructure routes.
11.11.4 The possible exception to accommodating labour requirements from current and planned
housing might arise from the rapid build up of employee requirements during the period to 2015
if the airport achieves a high level of patronage from its outset.
11.11.5 Large brownfield sites in Medway Towns District alone would be able to meet the airport’s
needs for off-site employment land. Further sites are available in other local districts.
Employment Land Requirements
11.11.6 The off-airport employment is forecast to require 103 hectares of off-site employment land in
2015 and 158 hectares in 2030 within reasonable proximity to the airport.
11.11.7 In terms of the share of forecast catchment area workforce, it is projected that the 2015 options
would generate a 7% share of the core and wider catchment area workforce, rising to around
10% by 2030 with further runway development.
Medway Towns District Council
11.11.8 Medway Towns District comprises several key towns, including Rochester, Chatham,
Gillingham, Rainham and Strood - a population of over 250,000, and over 4,000 companies. It
is the largest labour market in Kent, and one of the biggest communities in the South East
outside Greater London. The towns are linked together in a conurbation extending along the
northern edge of the A2/M2. The remainder of the district, south of the M2 and the Hoo
Peninsula is predominantly rural, and development plan policies seek to concentrate
development away from these areas, with the exception of identified strategic brownfield sites.
11.11.9 The Kent Structure Plan (Adopted 1996) provides for 130,000 m2 of A2/B1 space (26 ha)
between 2001 and 2011, and 170,000 sq m of B2/B8 space (34 ha) for the same period. The

SERAS Stage Two: Appraisal Findings Report
FL1124000.RCE.RP.J03.020131.Appraisal Findings 421
County and District Council are providing for significant growth in demand for employment land
up to 2011. Half of the employment land supply in the district is accounted for by four large
sites outside the urban area (Medway Towns Local Plan, Deposit, 1999), these are not
expected to come forward in the current plan period and therefore provide potential
opportunities to accommodate both airport generated employment and to a lesser extent
housing requirements. Key sites are described below:
• The former BP Oil Refinery site at Grain (630ha site). This includes the fastest
growing container port in the southeast at Thamesport. This site is the largest
economic development in the Thames Gateway and is of regional importance. It
is currently unoccupied and its proximity adjacent to the proposed airport site on
the Hoo Peninsula suggests it would be appropriate for indirect employment uses
generated by the airport.
• The Kingsnorth Power station site, comprising 219ha, is a large area of bad
neighbour industrial uses, earmarked for redevelopment in the longer term, once
development at Crossways at Dartford and Chatham Maritime are complete.
Medway Towns identify Kingsnorth as an ideal site for relocation from the existing
urban area, but recognise the potential of the site as a focus for inward
investment.
• The Rochester Airfield site (56.5ha) is appropriate for high technology related
employment due to the adjacency of the Marconi Avionics R & D facility. It is
anticipated that this site will come forward beyond the local plan period (2006)
and therefore it too could provide a location for employment generated by a new
airport.
• Strood Waterfront, bounded to the west by A228 and lying between Rochester
Bridge and the M2 Bridge. This is a predominantly industrial area of low quality.
A 73ha site is designated as an Action Area for redevelopment and improvement
up to 2011; potentially therefore part of the site could provide space for
employment uses generated by airport provision at the Cliffe Marshes site.
11.11.10 Together these sites alone provide scope to accommodate a significant proportion of the
indirect employment land take generated by a new airport at Cliffe Marshes, even at low
densities.
Housing Capacity
11.11.11 Meeting the employment needs of an airport at Cliffe Marshes is expected to require, at worst,
only a small increase over currently proposed additional dwellings in the period to 2030. It is
estimated that the 2015 options can be accommodated within existing RPG provisions. This
estimate is influenced by the high policy component of both RPG provision and TEMPRO,
which makes a high level of dwelling provision relative to projected household growth and

SERAS Stage Two: Appraisal Findings Report
FL1124000.RCE.RP.J03.020131.Appraisal Findings 422
employment forecasts. In other words a comparison of RPG and TEMPRO forecasts suggests
that the regeneration of Thames Gateway will be housing led.
11.11.12 It may, of course, be the case that the TEMPRO forecasts are unduly pessimistic with respect to
employment growth because they are trend based and additional employment opportunities
may arise as a consequence of economic development initiatives that may emerge in the future.
While the figures from the land use and urbanisation model suggest that up to 2015 no
additional housing will be required, it is conceivable that this development phase could place
more pressure on housing requirements due to the employee requirements during the period to
2015. This is because of the very rapid build up of the airport that is assumed in the option. A
summary assessment of the scope for future additional provision is provided below. This has
taken into account the possible requirement for additional dwellings in excess of our estimates.
11.11.13 All eight boroughs in the core catchment (Basildon, Castle Point, Dartford, Gravesham,
Medway, Rochford, Southend and Thurrock) identify in their development plans the desire to
accommodate future housing needs within the existing urban areas, and recognised increasing
dependency on windfall sites to meet allocations. Indeed, for many, the scale of allocations
was decreasing in the longer term due to the shortage of housing sites.
11.11.14 The main opportunities for large scale housing development as currently identified are found
within the southern boroughs, on the brownfield sites suggested for mixed use development,
and at the new settlement site on the Chattenden Engineering site on the Hoo Peninsula. It is
unlikely that this would proceed if a major new airport were developed at Cliffe. There are other
potential brownfield sites north of the Thames.
11.11.15 A possible alternative to offset the impact of both options on housing would involve taking into
account the resident labour force, and the very high incidence of out-commuting. More of the
new airport employment, both direct and indirect, could be staffed by existing residents of the
study area, i.e. those currently commuting long distances to work out of the study area.
11.11.16 These potential local workers could be attracted to the new airport using a variety of incentives,
including training and various subsidies. If additional out-commuting residents are attracted to
the new site, there could be significantly less demand for housing as a result of new airport
development, and therefore less pressure to fundamentally alter the existing settlement
hierarchy in the study region.
SERAS Stage Two: Appraisal Findings Report
FL1124000.RCE.RP.J03.020131.Appraisal Findings 423
11.12 Integration Impacts
Regional/sub-regional policy
11.12.1 The proposed airport at Cliffe Marshes impacts upon the sub-regions of the Thames Gateway
and East Kent/Ashford. The impacts of an expanded airport are discussed below under the
headings of employment/labour force, housing and transport infrastructure.
Employment / Labour Force
11.12.2 The major problem in the Thames Gateway, and to a lesser extent in East Kent, is a lack of
skills to access employment in the new service-based economy. With the development of a new
airport at Cliffe Marshes, the employment generated would be huge, and would cover the full
skills range. The Thames Gateway itself covers a very wide area with several different and
distinct sub-areas from Docklands in the west, with the focus on financial and business
services, through Barking Reach with the dominance of manufacturing, to Thurrock with its
logistics functions. As such, the skills necessary across the sub-region are wide-ranging and
this often causes shortages in certain areas. A new airport would amplify this situation
exponentially, particularly in a high growth scenario.
11.12.3 A further inevitable effect of airport development near the Thames Gateway and East Kent
would be to go some way towards diversifying the employment base. As stated, the sub-region
has many different areas which will be able to develop their own business profiles, such as
Ashford developing as an intermediate hub which could benefit from through trade on the
CTRL. The airport would help to consolidate these. Also, it would assist people entering the job
market, especially if their skills profile matched the shortages in the area. The sheer number of
jobs created would clearly allow new entrants to the job market to successfully find
employment. For many there would be the need for training and skills development. Despite the
current lack of skills in the sub-region, the scope is there for change with the large numbers of
higher and further education institutions in the area, particularly in the Thames Gateway. As
more businesses and people are attracted to the area, these institutions will gain in importance
as feeders of skills and knowledge to the business base.
11.12.4 Many of the major employment areas identified in RPG for the Thames Gateway are close to
residential areas and on brownfield land. The pattern of employment development created by a
new airport is likely to follow a similar pattern, particularly given the infrastructural strength of
the Thames Gateway and East Kent corridors. Furthermore, it would have the effect of
consolidating business development, and would give the sub-region greater chance of attracting
high profile inward investment and developing business clusters. On the latter point, there are a
range of key clusters already present in the sub-region, in particular the financial and business
services in Docklands and logistics in Thurrock, that will inevitably be strengthened further by
the development of a new airport. As stated, Ashford could act as a major growth pole in East

SERAS Stage Two: Appraisal Findings Report
FL1124000.RCE.RP.J03.020131.Appraisal Findings 424
Kent. A new airport would automatically increase market confidence in the area, one of its major
existing weaknesses.
11.12.5 Inevitably however, in a high growth scenario there would generally be more of a squeeze
created on land, and sustainable locations would be more difficult to find. Despite the availability
of considerable areas of brownfield land which are capable of supporting a range of business
accommodation, such a large increase in businesses and employment created in a high growth
scenario would put an extremely high degree of pressure not only on the sub-region, but on the
wider region itself. This is particularly the case in the Thames Gateway.
Housing
11.12.6 RPG 9a allocates a housing provision level in the Thames Gateway up to 2006 in excess of the
capacity for housing that has been identified. As a result, it is likely that the Thames Gateway
will have difficulty housing the additional numbers of people that are forecast for the sub-region.
The development of an airport will significantly worsen this situation by bringing large numbers
of new workers into the sub-region, particularly given the skills deficit in evidence. In East Kent
however, further development of housing is a stated objective, and the levels of land available
for this purpose should assist greatly in reaching the targets.
11.12.7 The housing that will be developed, will mostly be achievable on brownfield land, thus assisting
to achieve the targets. Targets will also be reached for affordable housing, particularly as a
result of the influx of lower skill workers that will move into the area to take advantage of the job
opportunities stemming from airport development.
11.12.8 With this profile of housing development being created, it is likely that sustainable objectives
with regard to housing being located near to employment areas will be enhanced, certainly
under a low growth scenario. However, it is recognised that without sufficient provision of
housing in the sub-region, economic competitiveness may be impaired. In addition to the
housing need created by a new airport, sustainable principles may be compromised as the
employment need is filled by workers from further afield. The chances of this increase
considerably under a high growth scenario.
Transportation / Infrastructure Improvements
11.12.9 Both the Thames Gateway and East Kent are located in a highly important strategic area with
regard to major hubs. This particularly applies to port access, with several major ports including
Tilbury, Thamesmead, Folkestone and Dover providing key access points to continental Europe
and beyond. An airport will have the effect of consolidating and improving linkages to these
ports by a variety of modes, particularly rail.
11.12.10 Strengthening of the Thames Gateway transport corridors that will stem from airport
development, will also have the effect of reducing the flows away from the corridor. The multi-
SERAS Stage Two: Appraisal Findings Report
FL1124000.RCE.RP.J03.020131.Appraisal Findings 425
modal linkages between the Thames Gateway and East Kent and their major air and sea hubs,
and Central London will reduce the need for business or commuting journeys to be made away
from the area. As such, there will be a reduction in the need to travel and also a reduction in
long distance commuting. This latter point will be consolidated if adequate housing is provided
and skill mismatches are resolved, a situation that, as explained earlier, could be difficult under
a high growth scenario.
11.12.11 Clearly central to the transport strategy is the package of river crossings. A crossing in the
Gallions Reach area is important in achieving the proposed level of development at the Royals.
Similarly, a Woolwich Rail Crossing would link the Royals with a wider labour market. In
addition, the airport would necessitate a freight crossing in the vicinity which would dramatically
improve freight journey times across the rest of the country and also into Europe. This would
add a new function to an already strong logistics sector. Without the development of an airport,
it is extremely unlikely that this type of development could be justified.
Social Impacts
Low Growth Scenario
11.12.12 Under a low-growth scenario (up to 2015), some 53,000 jobs could be generated in total. Of
these, up to 18,000 are likely to be low skill in nature, with 12,000 possibly located on-site and
6,000 off-site.
11.12.13 In 1998, there was a shortage of jobs in the four deprived districts totalling well over 13,000.
This is forecast to increase further by almost 400 jobs by 2016. Then, from 2016-2031, this
could contract by as much as 6,500 workers, leaving a worker surplus of less than 7,000
people. As such, it appears that it may be possible for these districts to accommodate up to half
of the jobs that could be generated at Cliffe Marshes.
11.12.14 The biggest recipient (possibly of up to 3,000 jobs would be Medway Towns due to their
proximity to the airport site and location on the ‘right side’ of the river. In addition, Medway
Towns in 1998 had over 8,000 commuters to other areas which could potentially be clawed
back with such high numbers of available jobs. The other deprived districts would rely greatly on
transport improvements.
11.12.15 What would be required is a combination of strong regeneration policy and considerable
transport improvements. The regeneration policy is already largely in place through the
identification of the Thames Gateway and the focus of renewal in the South East on this area.
Of particular importance for these levels to be achieved would be cross-river links between
North Kent and South Essex. This would link up the airport to Basildon, Thurrock and
Southend-on-Sea. Without this, these districts would realistically provide minimal labour for the
airport, both in terms of on-site jobs and off-site jobs that would cluster on the main transport
routes south of the river. Clearly, with Medway Towns the primary recipient of the majority of

SERAS Stage Two: Appraisal Findings Report
FL1124000.RCE.RP.J03.020131.Appraisal Findings 426
jobs, there is also a need for improved road and rail links for local workers – not just fast links
provided by CTRL, but improved bus and local train services.
High Growth Scenario
11.12.16 Under a high growth scenario (also up to 2030), around 80,000 jobs could be generated. Of
these, towards 26,000 could be low skill in nature, with potentially up to 16,500 being located
on-site and 9,500 off-site.
11.12.17 As stated above, by 2031 there would be a maximum worker surplus of just under 7,000 people.
Clearly not all of these jobs could be accommodated by the four deprived districts, but the
labour market surplus in each district could certainly be eliminated. Again, the nature of
transport improvements would be essential to whether this is achieved.
11.13 Attracting Airlines to a New Site
11.13.1 It is to be expected that, capacity and environmental considerations permitting, airlines will
continue to provide and expand current types of services at existing airports as demand grows.
The large-scale development of a full range of services at a major new site could not, however,
be taken for granted, even if further expansion of Heathrow and Gatwick were constrained.
DTLR therefore commissioned Booz Allen & Hamilton to undertake an examination of whatwould be necessary to attract airlines to a new site, having regard to a number of factors (New
South East of England Airport – Airline Development Strategy Study, October 2001).
11.13.2 Two new multi-runway sites were taken as the basis for that examination: Cliffe Marshes and a
major redevelopment of Stansted. The factors taken into account in assessing the conditions
under which airlines would be attracted to such sites included:
• The impact of airline strategy and economics, individually and through
alliances, on the appeal of a new facility within the London airport system,
taking a range of system capacity scenarios into consideration.
• The market position a new facility might be able to achieve within the UK and
European airport networks.
• The impact of a new facility on the other London airports in terms of such
parameters as market share (passengers and freight) and changes in market
segmentation (eg, business, leisure and low cost passengers, general and
express freight).
• The need for and effects of policy, regulatory or fiscal instruments to promote
best use of all the capacity available in different scenarios.
SERAS Stage Two: Appraisal Findings Report
FL1124000.RCE.RP.J03.020131.Appraisal Findings 427
Hub Airports
11.13.3 The study assessed what might be required to support a second hub airport, alongside
Heathrow, in the South East airports system. Hub airports were shown to provide benefits to
airlines, passengers and the economy. Advantages of hub and spoke operations to airlines
include allowing airlines or, significantly in recent times, alliances to construct their route
networks in the most yield-efficient way, using connecting passengers to increase load factors
and effectively subsidise routes that would otherwise be uneconomic to operate. Hubbing also
allows higher utilisation of the aircraft fleet.
11.13.4 Advantages to passengers and the economy include an increase in the number of destinations
served directly from the hub airport (or, with one transfer, from the spoke airports) and higher
service frequencies than would otherwise be provided. Lower fares may result from the
efficiency gains to airlines. Additional traffic flow through a hub airport will also contribute to
local economic activity.
11.13.5 Requirements to support the functioning of an airport as a hub include:
• A suitable geographic location,
• A sufficiently large catchment to generate necessary levels of traffic,
• Infrastructure to support the level of demand and to provide operational
flexibility, and
• The presence of one or two major airlines or alliances providing services
through a co-ordinated and coherent network, to maximise connectivity.
11.13.6 Other relevant features of the operation and evolution of hub airports are that they are scale-
dependent, requiring a ‘critical mass’ of services, which may be built up over a period of time,
and that they represent long-term, strategic investments, that are not easy to move and
uneconomic to divide between sites.
London Airport System
11.13.7 The study’s analysis of the London airport system, focusing on Heathrow as the only London
airport with significant hubbing activity, drew the following conclusions.
11.13.8 There is evidence of operations at Heathrow being severely constrained, with fewer destinations
served, lower service frequencies and lower hub connectivity than would be expected from an
airport with Heathrow’s throughput.

SERAS Stage Two: Appraisal Findings Report
FL1124000.RCE.RP.J03.020131.Appraisal Findings 428
11.13.9 Despite the constraints at Heathrow, airlines appear reluctant to establish additional point-to-
point services at other airports within the London system that do presently have unused
capacity, for example Stansted.
11.13.10 Heathrow has a high level of direct long haul services, but lower levels of short haul and
domestic services than, for example, Paris Charles de Gaulle. This is despite the greater
availability of direct high speed rail services to major European hubs.
11.13.11 There is a considerable threat to Heathrow’s position as the predominant hub in established
markets, principally from Schiphol and Paris CDG, with some evidence that passengers from
regional UK airports are already hubbing through Schiphol, rather than Heathrow. There is a
further risk that secondary hubs, such as Copenhagen and Munich, will compete in emerging
markets, for example to Central and Eastern Europe. Heathrow has limited capability to react
to this competition and will have even less as constraints there limit its ability to react to
increases in demand.
11.13.12 One possible response would be to expand Heathrow to provide sufficient capacity to meet
unconstrained demand, but more than one additional runway would be required. An alternative
would be to provide a large increment of new capacity at a single site, such as Cliffe Marshes or
Stansted, to enable London to maintain its predominant position in European and world air
transport.
Criteria for Two Hub Airports
11.13.13 Criteria to be fulfilled for two major hub facilities to be simultaneously viable and successful
include the following.
11.13.14 Airline economics. Given the inefficiencies (if not the impracticality) of operating split hubs, it is
likely that each hub will have to be ‘home’ to a dominant alliance to generate a critical mass of
services. In London, the presence of both the oneworld and Star alliances makes this a
possibility, as long as one alliance could be persuaded to consolidate its operations at the new
site and the other to consolidate at Heathrow.
11.13.15 Sufficient demand. The London and South East market generates a very high level of point-to-
point traffic and is ideally located to act as a hub for the largest international air transport
market, that between Western Europe and North America.
11.13.16 Surface access. Surface access from the major demand centres must be at least equivalent to
and preferably better than that to Heathrow, in order to persuade travellers to use the facility,
and to give airlines confidence that a move will not result in their being disadvantaged in terms
of access to key markets.

SERAS Stage Two: Appraisal Findings Report
FL1124000.RCE.RP.J03.020131.Appraisal Findings 429
Need for Policy, Regulatory and Fiscal Incentives
11.13.17 Airlines and passengers who did elect to move to a new hub might expect to receive some or all
of the following benefits:
• Decreased delays,
• Consolidated airline/alliance operations and associated efficiency savings,
• Relaxed night-time operations constraints, enabling full 24 hour scheduling,
• Airport development with the airport-airline interface as a priority, maximising
operational efficiency, reducing costs and minimising conflicts.
11.13.18 The first two of these benefits could also be expected to accrue to airlines/alliances that chose
to stay at Heathrow rather than move to a new site, but most of the risks and costs would be
borne by those that move to the new site. It would be necessary, therefore, to create an
environment where incentives are provided to those who move, to balance these costs and
risks.
11.13.19 Even if a mechanism could be devised that ensured that costs and risks were distributed among
those using the London airports system consistently with the benefits received, there would still
be impediments to an airline or alliance moving to a new site:
• Reluctance to be the first to move, in part driven by a tendency for each player
to follow the actions of others thereby minimising any differentiation,
• The fragile and unstable nature of alliances, with airlines rather than alliances
being the legal, decision-making entities,
• The high cost associated with failure of any move, and
• The risk of giving advantage to competitors by relinquishing valuable slots at
Heathrow.
11.13.20 Mechanisms for balancing costs and risks with the benefits obtained in different locations could
include regulatory instruments or slot trading mechanisms.
11.13.21 Regulatory instruments that might be needed as part of a balanced package of constraints and
incentives to encourage the development of a pair of alliance hubs are as follows. The key
question is whether these could be accepted as components of a package designed to serve
the interests of consumers:
• Noise and emission controls at Heathrow,
SERAS Stage Two: Appraisal Findings Report
FL1124000.RCE.RP.J03.020131.Appraisal Findings 430
• A commitment not to provide enhanced capacity at Heathrow or the other
London airports so as not to undermine the viability of the new facility,
• A commitment to provide the necessary supporting infrastructure at the new
facility in a timely manner, particularly surface access, as a ‘confidence
builder’, and
• A mechanism for facilitating investment in the new facility, which would be
expensive to build and is only likely to achieve an attractive rate of return if
airport charges are set above current charges.
11.13.22 A slot-trading mechanism could offer relevant benefits to the process of establishing a second
hub, by:
• Facilitating a fair distribution of costs and risks across the London airports
system. The costs and risks of staying at Heathrow are low so the price of slots
will be high: the reverse would be expected to be true of a new facility.
• Leaving a moving airline the (costly) option of returning to Heathrow or any other
airport.
• Providing a mechanism through which funds could be raised and hypothecated
to the new facility.
• Multi-annual or continuous trading could allow new entrants access to the
airports, thereby satisfying competition requirements. Trading in futures or
options and secondary trading might allow airlines the additional flexibility they
would need to create workable timetables.
11.13.23 Impediments to a slot-trading scheme would need to be overcome:
• Legislation: Changes to existing legislation would be needed to enable any slot-
trading mechanism at all.
• Title: The European Commission has proposed that slots be designated as
public goods, not entailing any property rights to airports or airlines.
• Definition: Just what entitlement a slot confers on its user, in terms, for example,
of its duration and the grouping of slots into series to facilitate practical
operations would need to be agreed.
• The control of the overall slot allocation system and control of the trading
process will be an important issue.

SERAS Stage Two: Appraisal Findings Report
FL1124000.RCE.RP>Jo3.020131.Appraisal Findings 431
12 Appraisal of Options at Main Sites: Alconbury
12.1 Option Appraised in Stage Two
12.1.1 As detailed in Chapter 4, three options were appraised in Stage One of SERAS. For Stage
Two, Options 1 and 2 were rejected in favour of Option 3, which envisages a specialised low
cost passenger airport with substantial air freight capabilities, an express parcel hub and a
major 3rd-party aircraft maintenance operation. Figure 12.2 shows the Option 3 layout.
12.1.2 Alconbury’s geographical location (Figure 12.1) and good surface access connections afford it
the potential to become a low-cost passenger airport with an annual throughput of 5 and,
possibly, up to 10mppa. However, with the other facilities envisaged in this option, land and
airside frontage limitations are likely to restrict throughput to a level in the order of 5mppa.
Facility planning assumes a typical passenger aircraft of B737-700 size, with a seating capacity
of approximately 125, operating at an average load factor of 85%, giving an average aircraft
load of 107. Annual movements of about 47,000 PATM would be required for this throughput.
For such a single market sector operation a relatively peaked traffic profile is assumed, allowing
also for movements generated by freight and maintenance activity. This indicates a sustainable
hourly movement rate of less than 20 (excluding GA and Business Aviation movements) which
is well within the capacity of the existing runway.
12.1.3 Passenger facilities, a Business Aviation area and some ancillary sites are located to the south
of the runway with a 700m apron frontage providing space for 20 stands, based on a utilisation
rate of 3 to 4 turnarounds per day. To the north of the runway are the freight facilities, express
parcel hub and the aircraft maintenance facility.
12.1.4 With a capacity of about 1 million tonnes annually, the freight facility consists of two main
elements; a main terminal fronting on to the aircraft parking apron and a Freight Forwarders’
complex on its landward side. The main building accommodates the storage, make-up,
breakdown and handling of loads to and from the aircraft. The Forwarders’ facility houses the
receipt, consolidation and dispatch of consignments, plus office space. Truck docks and parking
areas are provided to serve both facilities. Analysis of payload and range data indicates that
most freighter aircraft types could operate from Alconbury’s 2,743m long runway, at or close to
maximum payload/range. A sorting and distribution centre for conventional mail is also
provided, adjacent to the freight terminal, together with adequate truck parking.
12.1.5 The size of the parcels hub is assumed to be similar to that at East Midlands Airport, which can
handle up to 1,100 tonnes of express parcels per night or approximately 350,000 tonnes per
year. A large area for truck docking and parking is provided, as a large proportion of parcels

SERAS Stage Two: Appraisal Findings Report
FL1124000.RCE.RP>Jo3.020131.Appraisal Findings 432
tonnage will be collected and distributed by road. 18 aircraft parking stands of various size are
provided with a stand frontage of approximately 1,100m.
12.1.6 An aircraft maintenance facility is sited to the rear of the freight forwarders’ complex and is
equivalent in size to the Marshall Aerospace facility at Cambridge Airport. It is capable of
handling up to six B747-type aircraft or a variety of smaller types, on a frontage of 600m.
Access is via a single taxiway running between the parcels and freight complexes.
12.1.7 The appraisal presented in this section draws to a large extent on that completed during Stage
One. No further detailed appraisal work was carried out in the areas of surface access, land
take, water resources, local air quality impacts, employment, land use and urbanisation or
integration. The level of detail in these areas was considered sufficient to draw significant
conclusions for Stage Two purposes. Capital costs have been re-worked to be consistent with
the approach adopted at the other SERAS sites, actual passenger forecasts arising from
SPASM are presented and detailed noise modelling, similar to that done for other sites, has
also been undertaken.
12.2 Capital Costs
12.2.1 Table 12.1 gives the estimated capital costs for the option taken forward in Stage Two.
Table 12.1 Estimated Capital Costs for Option 3 at Alconbury (£ million)
Item Option 3
Capacity 5 mppa (+ 1 M Tonnes freight)
Terminals & Satellites
Passenger Terminal
GA & Business Terminal
Satellite Buildings
Baggage Handling/conveyors
Total
61
5
0
0
66
Aircraft Pavements
Runways (resurfacing)
Taxiways (resurfacing & new)
Passenger Aprons / Stands
Total
11
7
15
32
Enabling Works & Infrastructure
Demolition, Earthworks, etc 22
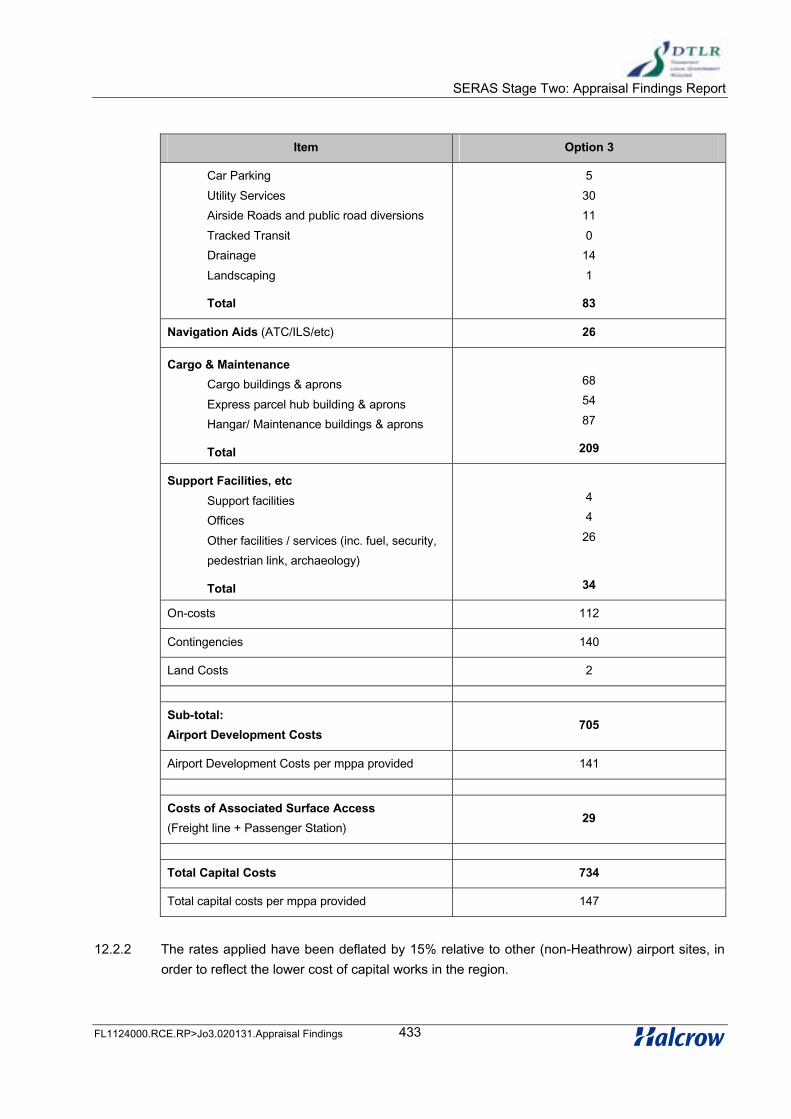
SERAS Stage Two: Appraisal Findings Report
FL1124000.RCE.RP>Jo3.020131.Appraisal Findings 433
Item Option 3
Car Parking
Utility Services
Airside Roads and public road diversions
Tracked Transit
Drainage
Landscaping
Total
5
30
11
0
14
1
83
Navigation Aids (ATC/ILS/etc) 26
Cargo & Maintenance
Cargo buildings & aprons
Express parcel hub building & aprons
Hangar/ Maintenance buildings & aprons
Total
68
54
87
209
Support Facilities, etc
Support facilities
Offices
Other facilities / services (inc. fuel, security,
pedestrian link, archaeology)
Total
4
4
26
34
On-costs 112
Contingencies 140
Land Costs 2
Sub-total:
Airport Development Costs705
Airport Development Costs per mppa provided 141
Costs of Associated Surface Access
(Freight line + Passenger Station)29
Total Capital Costs 734
Total capital costs per mppa provided 147
12.2.2 The rates applied have been deflated by 15% relative to other (non-Heathrow) airport sites, in
order to reflect the lower cost of capital works in the region.

SERAS Stage Two: Appraisal Findings Report
FL1124000.RCE.RP>Jo3.020131.Appraisal Findings 434
12.3 Demand Forecasts
Passengers
12.3.1 Forecast passenger movements, ATMs and passengers per passenger ATM are summarised
at 5 year intervals between 2000 and 2030 in Table 12.2
12.3.2 In the forecasting, Alconbury is assumed to open in 2011, with a small number of Low-Cost
routes assumed to be in place from the beginning.
12.3.3 Alconbury is assumed to have a runway capacity of 200,000 ATMs and a terminal capacity of 5
mppa. This terminal capacity is reached within 2 years of opening, through the development of
short haul routes. Although seeded with Low-Cost routes, these account for less than 5% of
opening year passenger numbers. This proportion declines further with time. The average load
per ATM rises over time, flattening out at around 76 passengers per ATM.
Table 12.2: Alconbury Option 3
2000 2005 2010 2015 2020 2025 2030
Passengers, mppa
Scheduled Domestic 0 0 0 0 0 0 0
Short haul 0 0 0 4.9 5.4 4.7 5.5
USA 0 0 0 0 0 0 0
Long haul 0 0 0 0 0 0 0
Total 0 0 0 4.9 5.4 4.7 5.5
Charter 0 0 0 0 0 0 0
Low cost 0 0 0 0.02 0.01 0 0
Total 0 0 0 4.9 5.4 4.7 5.5
ATMs, ‘000
Scheduled Domestic 0 0 0 0 0 0 0
Short haul 0 0 0 68 71 61 72
USA 0 0 0 0 0 0 0
Long haul 0 0 0 0 0 0 0
Total 0 0 0 68 71 61 72

SERAS Stage Two: Appraisal Findings Report
FL1124000.RCE.RP>Jo3.020131.Appraisal Findings 435
2000 2005 2010 2015 2020 2025 2030
Charter 0 0 0 0 0 0 0
Low cost 0 0 0 0.2 0.2 0 0
Total 0 0 0 68 71 61 72
Passengers/PATM
Scheduled 0 0 0 72 76 77 76
Charter 0 0 0 0 0 0 0
Low cost 0 0 0 79 85 0 0
Average 0 0 0 72 76 77 76
Note: ‘Other’ categories, not shown, are included in totals
Freight
12.3.4 Together with the envisaged specialised low-cost services Alconbury is intended as a significant
freight airport. However, it is assumed that its limited catchment would constrain freight demand
to a level lower than at other airports in the South East and Midlands, in some cases to a level
of only 10% of demand elsewhere (i.e. at Stansted and Cliffe Marshes). Nevertheless the
airport is well positioned to receive overspill traffic from the South East. By 2015 Alconbury is
forecast to handle 0.2 million tonnes, nearly all of which would be freighter traffic. As constraints
in the South East become tighter more freight traffic is likely to travel through Alconbury with
eventual demand being possibly much higher. By 2020 it could reach 1.3 million tonnes.
Summary
12.3.5 These forecasts differ from the assumptions underlying Option 3 in the following respects:
• The 5 million passengers per year are carried on scheduled short haul services
rather than the low cost services assumed in the optioneering
• average number of passengers per ATM is around 80, requiring 70,000 ATMs per
year, not the 47,000 assumed in the optioneering
• the freight forecasts for Alconbury are heavily influenced by the capacity for
freighter traffic at other South East airports, but could reach 1.3 million tonnes in
a heavily constrained scenario, compared with the 1 million tonnes assumed in
the optioneering.

SERAS Stage Two: Appraisal Findings Report
FL1124000.RCE.RP>Jo3.020131.Appraisal Findings 436
12.3.6 If realised, these differences in traffic volume and type would require a different configuration of
ultimate facilities from that developed as Option 3. In that layout, a business park occupied the
available land south of the runway not required for the passenger terminal. The park area is
substantial and would readily accommodate a larger terminal area without substantial impact on
commercial viability. This could be combined with a reconfiguration of support facilities to free
the additional airside frontage needed for increased (and probably more peaked) aircraft
movements.
12.3.7 The creation of more freight handling capacity may be more problematic, as the freight aprons
in Option 3 occupy all the airside frontage north of the runway. If the additional demand was to
be concentrated at peak times, particularly in the express freight sector, more apron space
would be necessary. Additional warehousing and handling space can be absorbed, again by
reducing other commercial land content, but increasing apron frontage would require the
acquisition of some further land. The most likely area for this would be between the airfield and
the East Coast Main Line railway.
12.4 Safety Risk
12.4.1 The extent of the 1:10,000 and 1:100,000 designated risk areas are shown on Figure 12.3. The
runway and origins of the 1:1,000,000 contours are also shown but extend beyond the limits of
the drawing.
12.4.2 Stage Two calculation of PSZ contours, based on 2030 forecast demand, indicates that the
safety risk within the 1:100,000 contours would be low. The 1:10,000 contours are largely
within the developed airport boundary whilst the 1:100,000 contours extend over areas that are
primarily rural. There would be some risk to surface access infrastructure; at the western end
where the 1:100,000 contour extends across the A1(M), just north of its junction with A604, and
to the east where the same contour crosses the East Coast Main Line. Current PSZ guidelines
would indicate that this would not be a case for re-alignment of these routes, but that measures
should be taken where practical to prevent vehicles routinely coming to a stand on the sections
within the 1:100,000 contour. New infrastructure, such as the rail spur or access roads, should
be aligned to avoid the 1:10,000 contour.
12.5 Surface Access
12.5.1 No further detailed assessment of surface access impacts were appraised beyond Stage One,
where impacts were examined through a series of estimates that allowed for: the airport option
capacity; the relationship between airport capacity (in mppa and tonnes) and airport
employment; the distribution of cargo-related surface access traffic; alternative air passenger
SERAS Stage Two: Appraisal Findings Report
FL1124000.RCE.RP>Jo3.020131.Appraisal Findings 437
distributions; the proportion of passenger and freight surface access movements assumed to
take place in peak hours
12.5.2 Consideration was also given to the potential use of rail for either passenger or freight surface
access. The principal objective was to assess what surface access schemes might be required
to provide adequate capacity and an appropriate level of service.
12.5.3 The A1(M), between Peterborough, some 20km to the north of the airfield, and its junction with
the A14 adjacent to the airfield has recently been upgraded to dual 4-lane standard. The
A1(M)/A14 junction needs to be revised with an elevated roundabout to allow movements in all
directions at that junction, including movements to/from the A14 which would provide the
principal access into the airport, and a road running to the north east which provides access to
the facilities north of the runway. No further improvements to the strategic network beyond this
junction are required.
12.5.4 Optioneering work assumes a spur from the East Coast Main Line (ECML) into the airfield
cargo terminal, and a new passenger station on the ECML, 1 km east of the runway. It is
unlikely, however, that the construction of the rail freight facilities could be justified without a
shift from road access to rail access being dictated by government policy.
12.5.5 Future passenger services on ECML are uncertain. The planned re-franchising of GNER’s
express services between London and the North East of England and Scotland is on-hold, but
the potential competing bidders have plans to further develop the line as a 140 mph railway, or
replace it with a new high speed line which could remove most express passenger services
from the existing line. West Anglia Great Northern’s (WAGN) current 1 to 2 local services per
hour between Peterborough and King’s Cross were to become part of Thameslink 2000
services, increasing in frequency to 2 to 4 trains per hour and extended via Farringdon and
London Bridge to Brighton and East Grinstead. These plans await the result of a Public Inquiry
expected in 2002.
12.5.6 The potential rail demand generated by airport development would be sufficient to support 2
Thameslink services per hour, 1 Inter City service per hour and an hourly Rail-Air coach linking
with Midland Main Line services at Wellingborough.
12.5.7 Rail freight access to Alconbury could be provided in one of two ways. Rail freight vehicles
might be attached to the Inter City services calling at the airport, although this would leave them
remote from the air freight facilities. Alternatively, air freight might be carried on cargo-sprinters
(if this German idea is embraced in the UK in the future) direct to the air freight facility via the
dedicated spurs.

SERAS Stage Two: Appraisal Findings Report
FL1124000.RCE.RP>Jo3.020131.Appraisal Findings 438
12.6 Environmental: Land Take
12.6.1 The references below to classification of impact, i.e. LA for low adverse, etc, are in accordance
with the system of classification developed and presented in Stage One.
12.6.2 No residential properties are lost, resulting in Neutral effects. A small area (<20 ha) of factories,
workshops and offices within the current airport boundary are lost, of LA significance. There is
no loss of public buildings or recreational areas, of Neutral significance. The loss of 61 ha of
agricultural land represents a LA effect. There would be no loss of Green Belt or other similarly
designated areas. Agricultural land is taken north east of the current airport perimeter,
increasing agricultural land take to 85 ha but with a LA effect.
12.7 Environment: Water Resources
12.7.1 The impact on water resources is summarised as Medium, as a result of the potential impact on
rivers. The lack of flying activity at the airfield currently gives a Low score in all of its impacts on
water resources. Two watercourses – Alconbury Brook and Ripton Brook – receive surface
runoff from the airfield; the airfield footprint does not coincide with the 1 in 100 year floodplain;
and the study area consists of Oxford Clay, which has low permeability and helps protect the
groundwater from contamination.
12.7.2 The risk of increased surface runoff contaminating Alconbury Brook and Ripton Brook raises the
score for the potential impact on rivers from Low to Medium. The score for the potential impact
on floodplain and aquifers remains Low.
12.8 Environment: Noise Impacts
Aircraft Noise: Daytime
12.8.1 The 2015 daytime LAeq,16h noise contours for Option 3 are shown on Figure 12.4. Table 12.3
below gives the areas, estimated populations and numbers of houses under each contour. The
minimal level of current flying activity and absence of existing contours prevents meaningful
conclusions about relative noise impacts.

SERAS Stage Two: Appraisal Findings Report
FL1124000.RCE.RP>Jo3.020131.Appraisal Findings 439
Table 12.3 Alconbury Daytime Aircraft Noise Contours – 2015
LAeq (dB) Area (sq km) Population (000’s) Houses (000’s)
>54 24.1 2.5 0.8
>57 14.0 0.9 0.1
>60 7.8 0.6 0.1
>63 4.2 <0.1 <0.1
>66 2.2 <0.1 <0.1
>69 1.2 <0.1 <0.1
>72 0.7 <0.1 <0.1
12.8.2 The relatively low population and numbers of houses affected reflect the rural nature of the
surrounding areas. It is reasonable to surmise, however, that with low levels of current activity
and despite the surrounding areas being sparsely populated, the relative impact, due to a
significant increase in activity, will be high. Optioneering allows for the installation of a noise
screen to protect Little Stukeley and the former military housing areas to the south east of the
site from ground manoeuvring noise. Maintenance activity to the north of this site is away from
local settlements.
Aircraft Noise: Night-time
12.8.3 Tables 12.4 and 12.5 below show the population numbers and associated house counts within
the departure and arrival 90 dB SEL footprints for easterly and westerly operations respectively.
The footprints are shown in a supporting document and represent an ‘average worst’ Quota
Count 2 aircraft, applied to each departure track and the approach path.
Table 12.4 Night Noise Population and House Counts – Easterly Operations
Existing
Runway 12
Population (000’s) Houses (000’s)
Departures
All tracks 0.3 <0.1
Arrivals 0.3 0.1

SERAS Stage Two: Appraisal Findings Report
FL1124000.RCE.RP>Jo3.020131.Appraisal Findings 440
Table 12.5 Night Noise Population and House Counts – Westerly Operations
Existing
Runway 30
Population (000’s) Houses (000’s)
Departures
All tracks 0.6 0.1
Arrivals 10.6 4.3
12.8.4 Night time operations with the greatest impact are westerly arrivals, reflecting exposure of the
western edge of the town of St Ives. This is some 8 km from the end of the runway and it is
probable that flight paths that avoided overflying St Ives could be developed.
Surface Access Noise: Highways
12.8.5 The increased traffic volumes associated with Option 3 are likely to cause a change in noise
level of at least 1 dB to a significant urban area. Some 4.4 km2 of urban area are likely to be so
affected.
Surface Access Noise: Railways
12.8.6 A spur into the airport from the East Coast Main Line would not result in any significant noise
effects on the scattered population in the area. There would be no significant change in the
number of train movements on the main line.
12.9 Environment: Local Air Quality Impacts
12.9.1 Background levels are expected to fall within National Air Quality Standards, with none of the
grid squares over which measurements are made likely to have Nitrogen Dioxide levels in 2005
or PM10 levels in 2004 in excess of 30 micrograms per cubic metre.
12.9.2 A more informed view might be derived by comparing potential pollutant levels arising from the
scale of activity envisaged at Alconbury with a regional airport elsewhere in the country where a
similar scale of activity is predicted. East Midlands Airport (EMA) was one of 23 UK regional
airports studied under RASCO, within which an air quality assessment was made using a two
stage appraisal technique. If Alconbury can be likened to EMA then it is not unreasonable to

SERAS Stage Two: Appraisal Findings Report
FL1124000.RCE.RP>Jo3.020131.Appraisal Findings 441
postulate that air quality conclusions drawn about EMA may also be broadly applicable to
Alconbury.
12.9.3 Both airports are sited close to major highway corridors, both are in predominantly rural areas
and, although the scale of operation at EMA in 2015 is likely to be larger (7.5 mppa passenger
capacity against 5 mppa and approximately 120,000 annual ATMs against 70,000 forecast at
Alconbury), both are likely to have a broadly similar mix of passenger and freight operations.
12.9.4 Stage A of the RASCO air quality appraisal was a screening process identifying, without using
full dispersal modelling, those airport scenarios that would not generate exceedances of air
quality objectives. For NO2, EMA failed at least one of the Stage A criteria and was tested
further in Stage B using dispersion modelling. This found that the exceedance contour did not
enclose any residential properties. The conclusion can therefore be drawn that, although
Alconbury would need to be examined for the precise location of surrounding properties, it is
unlikely that there will be an exceedance problem of any significance.
12.9.5 PM10 analysis at EMA concluded that there was no predicted off-airport exceedances of the
current objective for the 90th percentile of 24-hour mean PM10 concentrations. It is reasonable
to assume that Alconbury would also meet this criterion.
12.10 Employment, Land Use and Urbanisation and Integration
12.10.1 The relatively coarse assumptions made at Stage One appraisal have been refined for Stage
Two. For a mature mix of services, employee numbers per passenger have been confirmed at
1,000 per 1mppa, whilst for the low cost operations envisaged at Alconbury a number of 800
per mppa is assumed.
12.10.2 Employment rates associated with air freight have been amended since Stage One, from 1
employee per 100 tonnes of freight to 1 employee per 150 tonnes of freight.
12.10.3 On the basis of the above, the direct employment associated with Option 3 development at
Alconbury (in 2015) is:
• Low-cost passenger employees – 5mppa x 800 per mppa = 4,000
• Air freight employees – 1 million tonnes / 150 tonnes = 6,700
• Maintenance activities and others - say 1,000
• Total = 11,700 (Say 12,000)
SERAS Stage Two: Appraisal Findings Report
FL1124000.RCE.RP>Jo3.020131.Appraisal Findings 442
12.10.4 These figures show a reduction from the numbers calculated in Stage One, down from 14,000
employees. The difference, however, is not such as to invalidate the implications derived,
which are restated below. Further, the SPASM forecasts for Alconbury suggest that demand
might be on scheduled short haul services rather than low cost services and the volume of
freight handled could, in some circumstances, eventually exceed 1 million tonnes per year.
Both of these factors might push employment levels higher, towards the number assumed in
Stage One.
12.10.5 A review of the potential employment impact of development shows that much of the potential
direct and indirect employment could be met from local labour markets, in particular the District
of Huntingdonshire and the City of Peterborough which lies about 15 km to the north. The
assumed unemployment proxy (those claiming unemployment benefit plus latent
unemployment) is almost 4%. This means that airport jobs could be filled from the existing
labour supply and additional housing already planned for, without necessarily resulting in in-
migration and additional housing.
12.10.6 The Cambridgeshire Structure Plan made provision for 18,600 new dwellings in the
Peterborough sub-area between 1986 and 2001. This consists of 15,600 dwellings in
Peterborough City and 3,000 in Huntingdonshire. Of the new dwellings in Peterborough, some
5,200 were proposed for the new southern township. The plan assumes that, given expected
rates of development, only half of these would be complete by 2001.
12.10.7 In terms of employment land, the Peterborough Local Plan (Adopted January 1996) made
provision for an additional 206 hectares which, when combined with unused allocations from
previous plan periods, resulted in a total allocation of some 364 hectares for the period 1986-
2001. This is a generous provision which reflects the designations made in the Greater
Peterborough Master Plan, which was based on the needs of a New Town with a population
significantly greater than that which has been achieved to date. The Local Plan also notes that
while all of this provision could have been made in the period to 2001, in practice development
of all sites is unlikely and the overall provision is designed to allow a choice of sites.
12.10.8 The 1995 Adopted Huntingdonshire Local Plan identifies sites for employment totalling 80
hectares, of which 18 hectares are in the immediate vicinity of the airfield. The Local Plan also
identifies pressures for employment sites arising from ‘Cambridge-related’ high technology
activities, and suggests there may be difficulties in accommodating these pressures.
12.10.9 Nevertheless, the identified employment land in the two relevant local plans is such that the off-
site, airport-related employment could probably be accommodated within the core catchment
area.

SERAS Stage Two: Appraisal Findings Report
FL1124000.RCE.RP.J03.020131.Appraisal Findings443
13. Small Sites Summary
13.1 Introduction
13.1.1 Chapter 4 explains the background to the inclusion of the small sites in Stage One of SERAS
and gives a brief overview of the options addressed and the principal constraints at each site.
For further detail, the two reports referenced in that Chapter should be consulted.
13.1.2 This Chapter presents the conclusions drawn in the Demand and Impact Appraisal report, and
sets them in the context of the Stage Two findings. The small sites examined are; Biggin Hill,
Cambridge, Farnborough, Lydd, Manston, Norwich, Shoreham, Southampton and Southend.
13.1.3 The options appraised at London City Airport in Stage One have also been summarised in
Chapter 4.. That Chapter indicated that the airport is one of the most constrained sites in
respect of future development potential, and therefore for completeness of analysis it has been
included here.
13.2 Development Potential
13.2.1 All of the sites studied have the potential for a degree of capacity development. Equally, all are
constrained in one way or another; by physical limitations such as land availability and
surrounding development, or by the potential impact of increased capacity and activity on their
surroundings.
13.2.2 In physical terms, Lydd and Manston are probably the least constrained. Manston has a long
runway and a sizeable land holding. There is sufficient undeveloped land around Lydd, if it
could be acquired, for substantial development. At the other end of the spectrum, the sites at
Shoreham and Southend are strongly constrained by surrounding development, roads, rail lines
or environmentally sensitive areas.
13.2.3 The potential for capacity development at London City and Southampton Airports was assessed
at the Stage One optioneering work, to a similar level of detail as applied to the major airports.
In both cases a number of development options were examined, yielding various amounts of
additional capacity, within existing or expanded site boundaries.
13.2.4 At Southampton, existing site boundaries are strongly defined by a main rail line, a motorway, a
river and a country park. Runway length is constrained by the motorway and commercial and
residential development. While the runway may not be a constraint on the domestic and short

SERAS Stage Two: Appraisal Findings Report
FL1124000.RCE.RP.J03.020131.Appraisal Findings444
haul traffic likely to favour the airport, a limit would be set by the amount of land available for
terminal, apron and supporting development. With the runway on its present alignment, the
only practical axis of site expansion would be eastwards across the River Itchen and into the
adjacent Itchen Valley Country Park. An option for runway realignment and extension, with
greatly expanded terminal and apron capacity was also considered. None of the options for
major expansion beyond the existing site boundaries was considered viable, mainly due to their
potential impact on environmentally sensitive areas and features.
13.2.5 Similarly detailed study was applied to London City Airport. Options were examined for runway
extension on the existing alignment and revised alignments designed to avoid limits imposed by
aeronautical obstacles in the area. Various locations and layouts for expanded terminal, apron
and access facilities were also examined. A significant increase in runway length is severely
constrained by tall buildings and other structures on approach and departure paths. These
cannot be entirely avoided, even with major changes of runway orientation or location. Land for
facility expansion is limited by surrounding residential and commercial development, and by the
extent of the tidal dock basin in which the airport is located. It was concluded that a degree of
expansion is feasible, given some additional land and further extension over the dock, to enable
passenger and aircraft handling capacity to better match the potential capacity of the existing
runway.
13.2.6 In practice, as the following discussion of demand indicates, the viability of development at all
the small sites, and at London City and Southampton, is likely to be determined, in the first
instance, more by their ability to attract traffic than by their physical potential for expansion.
13.3 Likely Demand
13.3.1 Different approaches to forecasting the demand for commercial air services at these sites have
been followed. Consultants were appointed to give an initial estimate of the maximum potential
market demand for services at these airports (excluding London City) and the potential interest
of airlines in providing different services at these airports respectively. This advice had to
recognise the principal constraints surrounding increased activity and development at these
sites and deal with the difficulties imposed by:
• the long, 30-year SERAS planning period;
• alternative scenarios of constraint at the major South East airports, ranging from highly
constrained (no new capacity of any sort) to making maximum use of existing runways
in the South East and to relatively unconstrained scenarios with additional runways,
with the small airports making a greater contribution to meeting demand the greater the
constraint at the main airports;

SERAS Stage Two: Appraisal Findings Report
FL1124000.RCE.RP.J03.020131.Appraisal Findings445
• estimating the ability of the smaller airports to generate their own services serving local
catchments, and the destinations, aircraft types and frequencies of these services; and
• estimating the ability of these airports to compete for overspill traffic from the main
south east airports with larger, more distant, regional airports (eg, Bristol, Birmingham,
East Midlands) which would have a wider range of higher frequency services.
13.3.2 The broad findings from this initial assessment are summarised in Table 13.1 for passenger
forecasts, and Table 13.2 for ATM forecasts. The great majority of traffic envisaged as being
displaced from the major airports to the small sites is on domestic and EU area routes, mainly
scheduled services but including some charter. Some long haul charter and low cost airline
operations were forecast. The total passenger forecast at all of these sites taken together
(excluding Farnborough, which is assumed not to cater for commercial aviation, and London
City) was in the range of 6 to 9 mppa in 2015 and 11 to 15 mppa in 2030.
13.3.3 Three of these airports – London City, Southampton and Norwich – are included in the SPASM
model, and forecast use of these airports has therefore been made within all the SPASM runs
undertaken for SERAS. In this chapter, forecasts at these three airports are summarised for
two scenarios: one of constraint (no new runways) at the principal South East airports and one
scenario which includes new runway provision at Heathrow, Gatwick and Stansted.
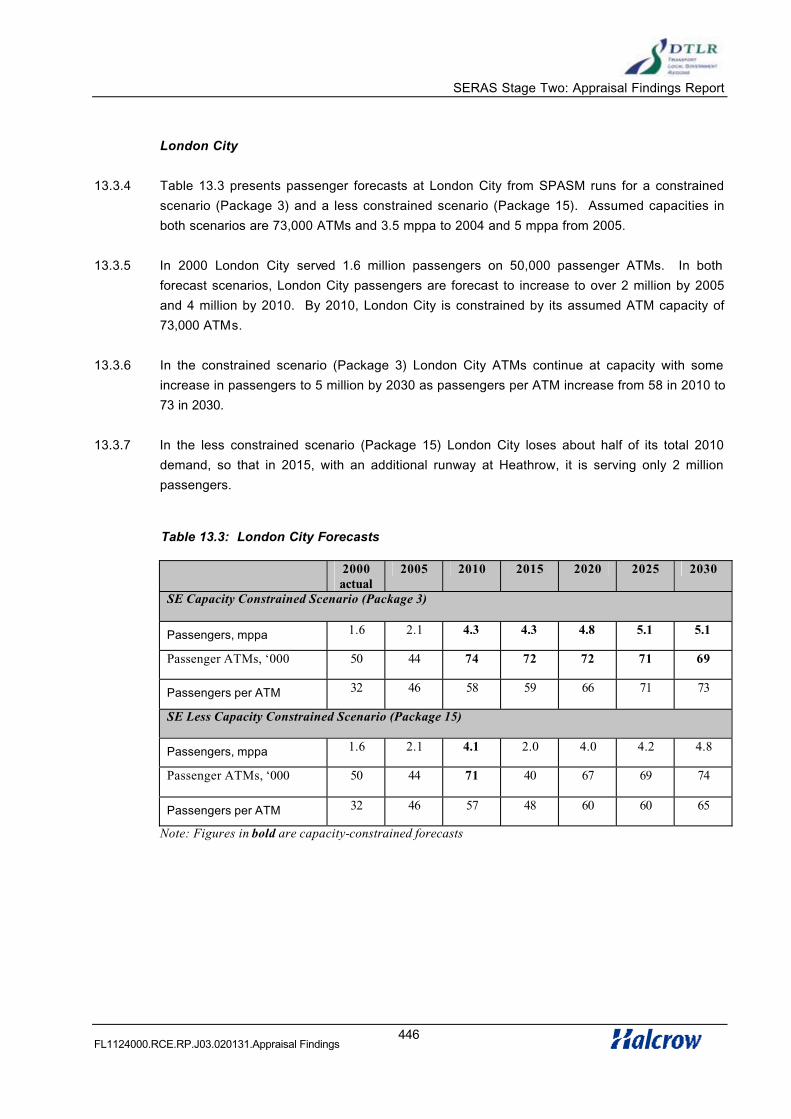
SERAS Stage Two: Appraisal Findings Report
FL1124000.RCE.RP.J03.020131.Appraisal Findings446
London City
13.3.4 Table 13.3 presents passenger forecasts at London City from SPASM runs for a constrained
scenario (Package 3) and a less constrained scenario (Package 15). Assumed capacities in
both scenarios are 73,000 ATMs and 3.5 mppa to 2004 and 5 mppa from 2005.
13.3.5 In 2000 London City served 1.6 million passengers on 50,000 passenger ATMs. In both
forecast scenarios, London City passengers are forecast to increase to over 2 million by 2005
and 4 million by 2010. By 2010, London City is constrained by its assumed ATM capacity of
73,000 ATMs.
13.3.6 In the constrained scenario (Package 3) London City ATMs continue at capacity with some
increase in passengers to 5 million by 2030 as passengers per ATM increase from 58 in 2010 to
73 in 2030.
13.3.7 In the less constrained scenario (Package 15) London City loses about half of its total 2010
demand, so that in 2015, with an additional runway at Heathrow, it is serving only 2 million
passengers.
Table 13.3: London City Forecasts
2000actual
2005 2010 2015 2020 2025 2030
SE Capacity Constrained Scenario (Package 3)
Passengers, mppa 1.6 2.1 4.3 4.3 4.8 5.1 5.1
Passenger ATMs, ‘000 50 44 74 72 72 71 69
Passengers per ATM 32 46 58 59 66 71 73
SE Less Capacity Constrained Scenario (Package 15)
Passengers, mppa 1.6 2.1 4.1 2.0 4.0 4.2 4.8
Passenger ATMs, ‘000 50 44 71 40 67 69 74
Passengers per ATM 32 46 57 48 60 60 65
Note: Figures in bold are capacity-constrained forecasts

SERAS Stage Two: Appraisal Findings Report
FL1124000.RCE.RP.J03.020131.Appraisal Findings447
Southampton
13.3.8 Forecasts for Southampton in a constrained scenario (Package 3) and a less constrained
scenario (Package 15) are summarised in Table 13.4. Assumed capacities in both scenarios
are 150,000 ATMs per year and 2 mppa to 2003 and 6 mppa from 2004.
13.3.9 In the constrained scenario (Package 3) growth is forecast in mainly short haul passengers to
2.8 mppa by 2015. After 2015 there is more growth in short haul scheduled services increasing
total passengers to 6.3 mppa by 2020 and 7.1 mppa by 2030. After 2020, forecasts are
constrained by the assumed ATM capacity.
13.3.10 In the less constrained scenario (Package 15), growth in short haul services is altogether
slower. Total passengers increase to 2.2 mppa by 2020 and 3.0 mppa by 2030. Capacity
constraints do not come into play.
Table 13.4: Southampton Forecasts
2000actual
2005 2010 2015 2020 2025 2030
SE Capacity Constrained Scenario (Package 3)
Passengers, mppa 0.9 1.2 1.7 2.8 6.3 7.2 7.1
Passenger ATMs, ‘000 28 37 49 70 134 150 146
Passengers per ATM 30 32 34 40 47 48 49
SE Less Capacity Constrained Scenario (Package 15)
Passengers, mppa 0.9 1.2 1.6 1.6 2.2 2.5 3.0
Passenger ATMs, ‘000 28 37 48 45 55 60 70
Passengers per ATM 30 32 34 35 39 42 44
Note: Figures in bold are capacity-constrained forecasts
Norwich
13.3.11 Table 13.5 summarises forecasts at Norwich in constrained (Package 3) and less constrained
(Package 15) scenarios. ATM capacities are assumed to increase from 150,000 to 225,000 by
2020. Passenger capacities are assumed to be 1 mppa to 2010 and 12 mppa from 2011.
13.3.12 In the constrained scenario (Package 3), forecast demands increase from 0.4 mppa in 2000
only to 0.7 mppa by 2015, equally split between scheduled and charter. After 2015 there is a
forecast increase particularly in short haul scheduled traffic pushing the passenger total up to
1.6 mppa by 2020 and 4.4 mppa by 2030.

SERAS Stage Two: Appraisal Findings Report
FL1124000.RCE.RP.J03.020131.Appraisal Findings448
13.3.13 In the less constrained scenario (Package 15), this post-2015 growth does not happen and
there are only 0.7 mppa by 2030.
Table 13.5: Norwich Forecasts
2000actual
2005 2010 2015 2020 2025 2030
SE Capacity Constrained Scenario (Package 3)
Passengers, mppa 0.4 0.5 0.6 0.7 1.6 1.8 4.4
Passenger ATMs, ‘000 17 6 8 8 20 21 54
Passengers per ATM 22 76 80 83 77 84 80
SE Less Capacity Constrained Scenario (Package 15)
Passengers, mppa 0.4 0.5 0.6 0.5 0.6 0.6 0.7
Passenger ATMs, ‘000 17 6 6 6 7 8 8
Passengers per ATM 22 76 79 73 78 72 77
Summary
13.3.14 The SPASM forecasts for Southampton and Norwich differ considerably between the
constrained and less constrained scenarios. The London City forecasts are more robust to
alternative assumptions about runway development at the principal airports. It was concluded
for the SPASM modelling that the potential contribution of London City, Norwich and
Southampton to meeting demand in the South East is of the order of 15 mppa or somewhat
more in a capacity constrained scenario in the South East, even though much the larger part of
traffic spilled over from capacity-constrained South East airports is forecast to use regional
airports. In addition, there may be some contribution from other sites.
13.3.15 From an airport capacity viewpoint, it should be possible to continue to accommodate GA and
Business Aviation activity at these sites, even with anticipated growth in these sectors. At the
busiest sites it might prove necessary, in time, to reduce the recreational flying element during
peak periods.

SERAS Stage Two: Appraisal Findings Report
FL1124000.RCE.RP.J03.020131.Appraisal Findings449
13.4 Air Freight
13.4.1 A total of about a quarter of a million tonnes of air cargo may be carried to and from the nine
small sites by 2030. About 70% of this is anticipated as being carried on freighter aircraft at
Manston, mainly on long-haul routes. Freighter traffic is also anticipated at Lydd, but on a
smaller scale. The remainder is expected to fly predominantly as belly cargo on passenger
services at the other six airports (excluding Farnborough). The freight throughput at the small
sites is unlikely to be greatly affected by spill from major South East airports due to poor
accessibility and environmental concerns.
13.4.2 Table 13.6 shows demand forecasts for freight.
13.5 Impacts and Constraints
13.5.1 The impacts of development to support the anticipated levels of demand vary widely across the
nine sites, reflecting the differences in their situations. Following are the key points arising from
the qualitative impact appraisal.
Local planning
13.5.2 Development in strategic planning ‘gaps’ would be an issue of concern at four sites; Biggin Hill,
Cambridge, Norwich and Shoreham. Impact on heritage property or valuable landscape areas
is potentially an issue at Manston and Southend. London City development options would have
relatively low impacts on heritage and townscape, but medium to high impacts on land-use.
Safety
13.5.3 Third party risk arising from aircraft operations, as represented by the extent of Public Safety
Zones, is unlikely to be a significant concern at the anticipated levels of activity, except possibly
at Shoreham, Southend, and for a reorientated runway at London City (Option 3), where impact
is assessed as medium.
Noise
13.5.4 Aircraft noise can be expected to be a significant factor potentially constraining development at
Biggin Hill, Cambridge, Manston, Southend, and for any reorientation of the runway at London
City. It would be of moderate concern at Shoreham and Southampton, and could become an
issue at Norwich if residential development is allowed to continue close to the airport. Concerns
over noise have already resulted in a constraint on future aircraft movements at Farnborough.

SERAS Stage Two: Appraisal Findings Report
FL1124000.RCE.RP.J03.020131.Appraisal Findings450
Air quality
13.5.5 Moderate to high air quality impacts of capacity development may be expected at three sites;
Cambridge, Norwich and Southampton. These arise from a combination of proximity to
residential areas and probable increased congestion on local roads. At London City,
Development Options 1A & 1B have the least impact in terms of air quality, whereas Option 3
has the most impact.
Surface access
13.5.6 Quality of surface access to these sites varies widely, as does the practicality of improvement
measures. Good access to high-capacity roads is available at all except Biggin Hill, Lydd and
Norwich. Upgrading of local roads or a new link from the M25 to Biggin Hill would be costly.
Lydd is remote from the regional road network and extensive upgrading of existing routes would
be required to make access times attractive. Norwich suffers from its main access being via a
City Ring Road that is very congested at peak times; upgrading would be a far-reaching and
costly process.
13.5.7 London City has no direct rail access, but an extension of the DLR to the airport has recently
received planning consent. The airport has also benefited from the Jubilee Line extension.
Southampton has a very well located rail station and Southend has imminent plans to construct
a station close to the terminal area. A station on the South Coast line immediately adjacent to
Shoreham Airport is feasible but there are no firm proposals for such a development at present.
Rail access could be provided at Cambridge, either by dedicated bus link to the nearby city
centre station on the main line, or by construction of a new station on an adjacent, connecting
line. The remaining sites, Biggin Hill, Farnborough, Lydd, Manston and Norwich have no rail
access point. Provision of a direct rail link would be very costly at all except Farnborough.
There however, due to the nature of the air market served, a rail connection would be of
significant value only to the airport workforce.
13.5.8 Table 13.7 shows the principal impacts and constraints at each of the sites.
13.6 Airspace
13.6.1 Impact in relation to airspace needs to be considered from two standpoints; the effect of
increased traffic at the small sites, and the effect on operations at the small sites if there was to
be significant development of capacity at any of the major airports.
13.6.2 In the first case, some changes to existing airspace structure and management may be
anticipated to efficiently accommodate increased numbers of Instrument Flight Rules (IFR)
movements. The degree of change would depend on the specific configuration of local airspace
and level of interaction with other traffic streams. Although detailed analysis of each case would

SERAS Stage Two: Appraisal Findings Report
FL1124000.RCE.RP.J03.020131.Appraisal Findings
451
be required to define the necessary measures precisely, and significant changes would be
needed in some cases, it is not anticipated that the requirements would be a major obstacle to
the scale of operations envisaged at any one site.
13.6.3 An initial review of the potential impact on the small sites of capacity development at the major
airports indicates that airspace capacity could be a significant issue in a number of cases. Sites
most peripheral to the London Terminal Area are least likely to be affected in this way, including
Lydd, Norwich, Shoreham and Southampton. Cambridge is likely to be significantly affected
only by development at Stansted. IFR operations at Manston would be constrained significantly
by development at Cliffe. Continued operations of any sort at Southend would probably be
impractical if Cliffe was developed and, because of the airport’s proximity to very busy airways
into Europe, it would also be constrained by substantial growth at any of the existing major
airports. Because of its proximity to the central area, Farnborough would be impacted by
development at any of the major sites, and severely affected if that development was to be at
either Heathrow or Gatwick. Similarly, Biggin Hill is almost certain to be severely affected by
traffic growth at any major site, and particularly so by development at either Gatwick or Cliffe.
13.6.4 Table 13.8 shows the airspace related impacts on small sites of major airport development.
13.7 Summary
13.7.1 The nine small sites reviewed in these studies have the potential to make a contribution to
meeting future commercial air service demand in the South East and East in circumstances
where capacity at the main South East airports is heavily constrained, and to support the GA
and business aviation sectors. London City’s demand is more robust to alternative assumptions
about runway development at the principal airports.
13.7.2 Capacity development to meet anticipated traffic levels at any of the sites would have varying
degrees and types of local impact, which could constrain their ability to accept the forecast
traffic. Aircraft noise, surface access or land-related impacts are the key constraints in many
cases.
13.7.3 Airspace capacity is likely to be a major factor affecting the ability of those small airports closest
to the London area to realise the traffic levels anticipated in this study.
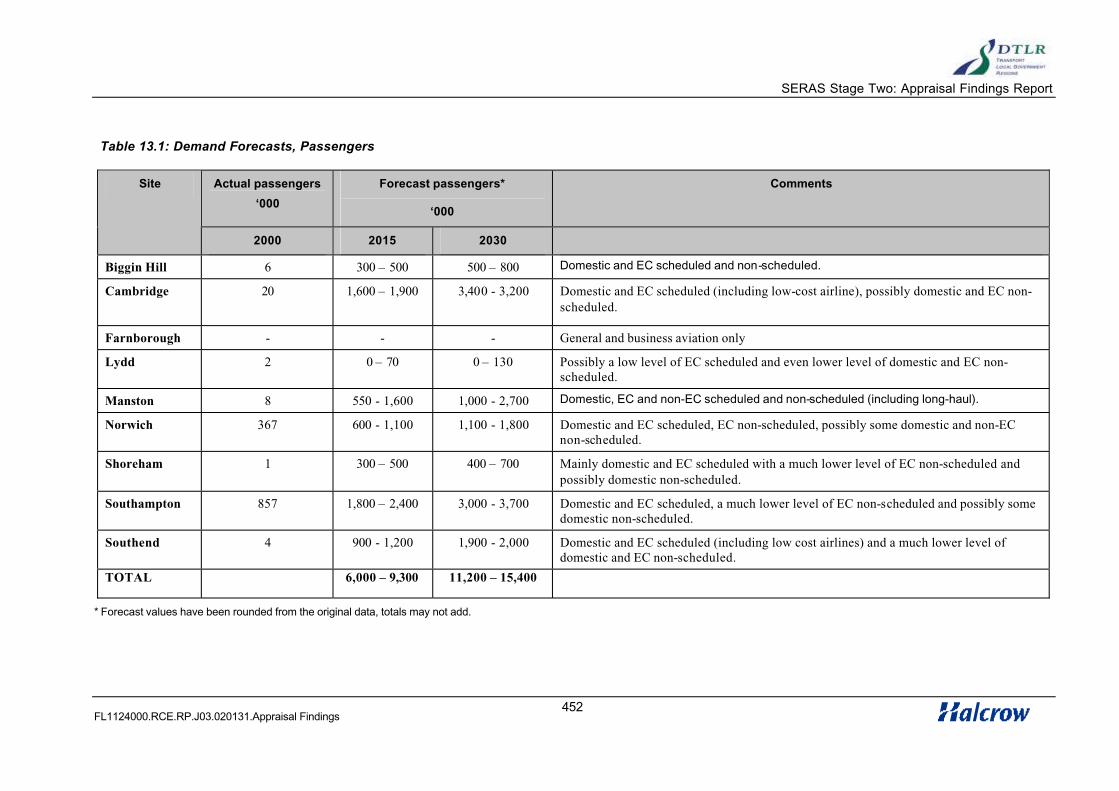
SERAS Stage Two: Appraisal Findings Report
FL1124000.RCE.RP.J03.020131.Appraisal Findings452
Table 13.1: Demand Forecasts, Passengers
Actual passengers
‘000
Forecast passengers*
‘000
CommentsSite
2000 2015 2030
Biggin Hill 6 300 – 500 500 – 800 Domestic and EC scheduled and non-scheduled.
Cambridge 20 1,600 – 1,900 3,400 - 3,200 Domestic and EC scheduled (including low-cost airline), possibly domestic and EC non-scheduled.
Farnborough - - - General and business aviation only
Lydd 2 0 – 70 0 – 130 Possibly a low level of EC scheduled and even lower level of domestic and EC non-scheduled.
Manston 8 550 - 1,600 1,000 - 2,700 Domestic, EC and non-EC scheduled and non-scheduled (including long-haul).
Norwich 367 600 - 1,100 1,100 - 1,800 Domestic and EC scheduled, EC non-scheduled, possibly some domestic and non-ECnon-scheduled.
Shoreham 1 300 – 500 400 – 700 Mainly domestic and EC scheduled with a much lower level of EC non-scheduled and possibly domestic non-scheduled.
Southampton 857 1,800 – 2,400 3,000 - 3,700 Domestic and EC scheduled, a much lower level of EC non-scheduled and possibly some domestic non-scheduled.
Southend 4 900 - 1,200 1,900 - 2,000 Domestic and EC scheduled (including low cost airlines) and a much lower level of domestic and EC non-scheduled.
TOTAL 6,000 – 9,300 11,200 – 15,400
* Forecast values have been rounded from the original data, totals may not add.
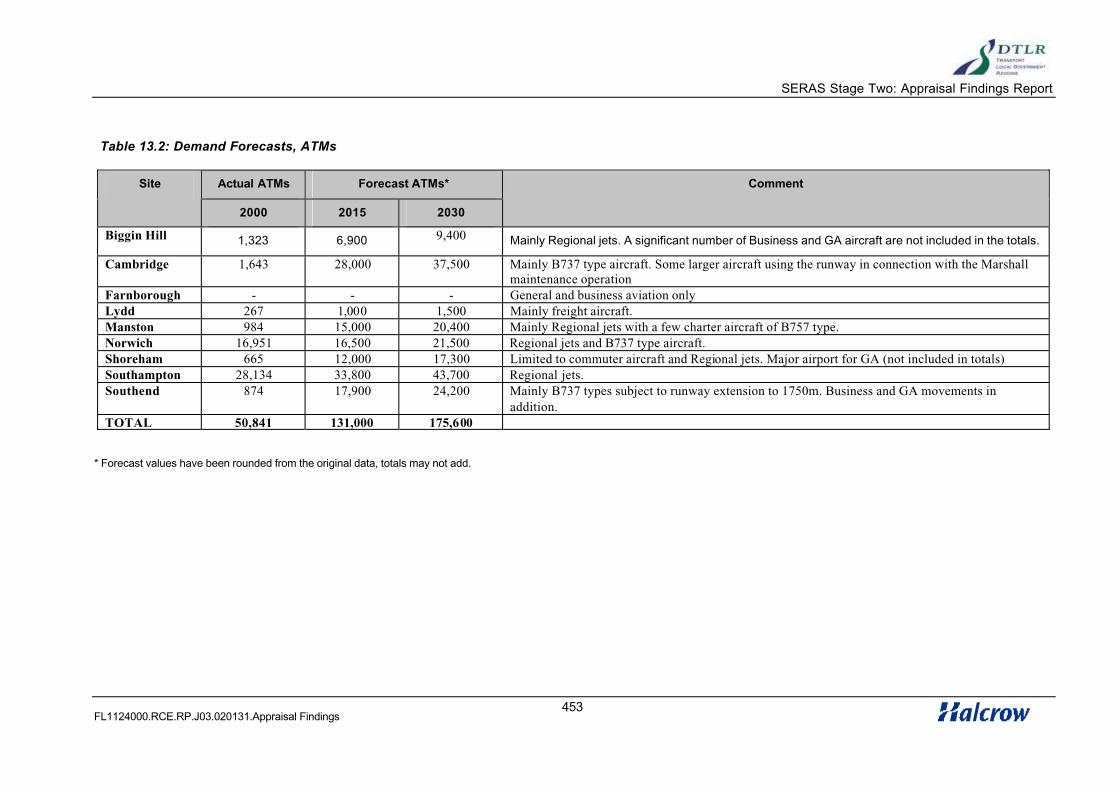
SERAS Stage Two: Appraisal Findings Report
FL1124000.RCE.RP.J03.020131.Appraisal Findings453
Table 13.2: Demand Forecasts, ATMs
Actual ATMs Forecast ATMs*Site
2000 2015 2030
Comment
Biggin Hill 1,323 6,900 9,400 Mainly Regional jets. A significant number of Business and GA aircraft are not included in the totals.
Cambridge 1,643 28,000 37,500 Mainly B737 type aircraft. Some larger aircraft using the runway in connection with the Marshall maintenance operation
Farnborough - - - General and business aviation onlyLydd 267 1,000 1,500 Mainly freight aircraft.Manston 984 15,000 20,400 Mainly Regional jets with a few charter aircraft of B757 type.Norwich 16,951 16,500 21,500 Regional jets and B737 type aircraft.Shoreham 665 12,000 17,300 Limited to commuter aircraft and Regional jets. Major airport for GA (not included in totals)Southampton 28,134 33,800 43,700 Regional jets.Southend 874 17,900 24,200 Mainly B737 types subject to runway extension to 1750m. Business and GA movements in
addition.TOTAL 50,841 131,000 175,600
* Forecast values have been rounded from the original data, totals may not add.

SERAS Stage Two: Appraisal Findings Report
FL1124000.RCE.RP.J03.020131.Appraisal Findings454
Table 13.6: Demand Forecasts, Freight
Actual freight
Tonne
Forecast freight
Tonne
Site
2000 2015 2030
Comment
Biggin Hill 1 2,500 3,500 Carried on passenger aircraft.
Cambridge 43 12,500 18,500 Carried on passenger aircraft.Farnborough - - - General and business aviation onlyLondon City _ - - Passenger aviation onlyLydd 6 9,500 15,500 To and from NW Europe on freighter aircraft.Manston 32,239 118,000 168,000 Mainly on long-haul freighter aircraft.Norwich 144 11,000 15,500 Carried on passenger aircraft.Shoreham 13 1,000 1,500 Carried on passenger aircraft.Southampton 260 11,000 16,500 Carried on passenger aircraft.Southend 780 5,000 8,000 Carried on passenger aircraft.TOTAL 33,486 170,500 247,000

SERAS Stage Two: Appraisal Findings Report
FL1124000.RCE.RP.J03.020131.Appraisal Findings455
Table 13.7: Impacts and Constraints
Site Planning Impact 3rd Party
Risk
Noise Rail Access Road Access Air Quality Airspace Principal
Constraints
Biggin Hill
Development in Strategic Gap. LA strongly opposed on noise and road access grounds
LowHigh
ImpactPoor. No direct rail
link
Poor. Current access roads of low standard: upgrading would be difficult. Improved
access to M25 would be required
Low to mediumimpact
Major interaction with LHR, LGW, STN and potential
new site
AirspaceSurface Access
Noise
CambridgeDevelopment in Strategic Gap. None
HighImpact
Reasonable access could be provided
Good access via ring road. Some would
access through Cambridge City
Medium to high impact Interaction with STN Noise
Farnborough
Recent agreement on number of movements for GA and BusAv
NoneMediumImpact
No direct rail link Good access Low impactMajor interaction with LHR, LGW
AirspaceRecent agreement on
role of airfield
London City
Parts surrounding area to NE & W classified as Metropolitan Open Land, Green Space
LowLow/Med
Impact
No direct rail link, but DLR branch
planned.
Good access to Canary Wharf and City of
London
Low to mediumimpact
Major interaction with LHR, LGW
Surrounding physical contraints
LyddLA in favour from employmentperspective
None Low ImpactRemote.
Unreasonable cost to provide a service
Remote from market.Higher quality road
access neededLow impact None
Location relative to market
ManstonLandscape impact but LA generally in favour
None
HighImpact on housing to
east of runway
Rail access difficult and costly
Good but fairly remote from market
Low tomediumimpact
Interaction with potential new site
NoiseDistance from market

SERAS Stage Two: Appraisal Findings Report
FL1124000.RCE.RP.J03.020131.Appraisal Findings456
Site Planning Impact 3rd Party
Risk
Noise Rail Access Road Access Air Quality Airspace Principal
Constraints
Norwich
LA in favour of additional jobs but concerned if developmentrequired in Strategic Gap
None
Impact on housing
being built at east end
of site
No direct rail linkRoad access poor. Ring
road conges tedMedium to high impact None
Surface AccessLimited catchment
Shoreham
Development in Strategic Gap. LA not in favour of development
Low to MediumImpact
MediumImpact Rail access possible
Good access to south coast towns
Low to moderateimpact
None Runway length
SouthamptonDevelopment within airport boundary not an issue
Notsignificant
MediumImpact Good
Good except for local congestion
Medium to high impact
No significant problems Runway length
Southend
Runway extension needed for low cost services would take listed church and other properties
MediumImpact
HighImpact
Good. Airport station planned
Good except for immediate access
Mediumimpact
Major interaction with potential new
site
NoiseProperty take for runway extension

SERAS Stage Two: Appraisal Findings Report
FL1124000.RCE.RP.J03.020131.Appraisal Findings457
Table 13.8 Airspace related effects on operations at small sites due to development at the major airports
Site Major airport development scenario
Type of Activity*
No new runways, ex. Capacity maximised
Additionalrunway at
LHR
Additionalrunway at
LGW
Additionalrunway at
STN
Cliffe site developed
VFR ! ! limited ! limitedBiggin Hill
IFR Limited limited " limited "
VFR ! ! ! ! !Cambridge
IFR ! ! ! limited !
VFR ! limited limited ! !
* VFR (Visual Flight Rules) is intended to denote GA and most Business Aviation; IFR (Instrument Flight Rules) denotes commercial scheduled and large-scalecharter traffic. London City traffic is assumed to be all IFR
FarnboroughIFR Limited " " limited limited
London City IFR ! limited limited ! limited
VFR ! ! ! ! !
�limited�, indicates that this category of activity at the small airport would be limited by competing demands for available airspace capacity
LyddIFR ! ! ! ! !
VFR ! ! ! ! !
! indicates little or no restriction beyond that seen today
ManstonIFR ! ! ! ! limited
VFR ! ! ! ! !
" indicates that this category of activity would not be viable to any significant level
NorwichIFR ! ! ! ! !
VFR ! ! ! ! !
Table excludes Southampton, where no significant interaction is envisaged.
ShorehamIFR ! ! ! ! !
VFR ! ! ! ! "Southend
IFR Limited limited limited limited "

SERAS Stage Two: Appraisal Findings Report
FL11124000.RCE.RP.J03.020131.Appraisal Findings 458
14 Appraisal of Packages
14.1 Introduction
14.1.1 Chapters 5 and 6 indicated how the options at different airports to be appraised at Stage Two
were to be combined into packages, and the potential timing of the implementation of options
within packages. Chapters 7 to 11 have summarised the appraisal findings for those options at
the five major airports. Those option-related impacts which can be aggregated into package-
wide impacts are summarised in the package ASTs which accompany this report. This chapter
presents the system-wide impacts which can only be addressed on a package basis and not on
an option basis. Principal among these are: demand forecasts and the performance of
packages at a system-wide level, the economic and financial impacts of different packages and
the impacts of packages on global air quality, proxied here by their impacts on CO2. These
impacts are presented in this chapter.
14.1.2 It is appropriate to appraise how well packages perform, in terms of accommodating demand,
according to the time periods by which they might be in place. We have assumed that there
will not be a new runway in place before 2011. By 2010, therefore, the additional capacity that
can be in place will be limited primarily to terminal capacity and increased ATM capacity to
enable better use to be made of available runways. The first time period of interest is therefore
from 2000 to 2010.
14.1.3 We are assuming that by 2015 a single new runway (or the wide-spaced pair of runways at
Cliffe) might be in place. 2015 is also one of the SERAS appraisal years. The second time
period of interest is therefore from 2011 to 2015.
14.1.4 The third time period of interest will be from 2016 to 2030, when combinations of new runways
are assumed to be feasible. 2030 is also one of the SERAS appraisal years.
Core Appraisals and Sensitivity Tests
14.1.5 There is a core appraisal for each of the 21 packages identified in Chapter 5. There are
variations within some of these packages, the principal of which are:
• Packages 5A, 5B and 5C include different runway options or ways of using additional
runways at Heathrow – options E6, E4 and E8 respectively. They have different costs
and capacities, different traffic forecasts and different economic and financial impacts.
They are effectively three different packages.

SERAS Stage Two: Appraisal Findings Report
FL11124000.RCE.RP.J03.020131.Appraisal Findings 459
• Packages 8(1) and 8(2) differ only in that 8(1) omits the crosswind runway at Cliffe and
8(2) includes it. These packages therefore have different costs and economic and
financial impacts but the same traffic forecasts.
• Packages 21(1) and 21(2) similarly differ in that 21(1) omits the crosswind runway from
the four east – west runways at Cliffe, while 21(2) adds it.
14.1.6 These variations are included in the core appraisals. The core appraisals are supplemented by
sensitivity tests, which consider the following variations:
• Runway size variations: the incorporation of different Heathrow runway options in multi-
runway packages,
• Opening year variations: variations in the years in which runways are assumed to open
or variations in the order in which runways open,
• Additional runways: adding additional runways to multi-runway packages,
• Seeding variations: the implications of not seeding options at Cliffe or the larger options
at Stansted, and
• Environmental policy tests, which consider the implications of air travel demand being
reduced by environmental taxes.
14.1.7 This chapter deals with the core model runs first, then the different sensitivity tests. The
structure of the chapter is as follows:
• Section 14.2: core package demand forecasts,
• Section 14.3: economic appraisal of core packages,
• Section 14.4: financial appraisal of core packages,
• Section 14.5: wider economic impacts,
• Section 14.6: CO2 impacts,
• Section 14.7: runway size sensitivity tests,
• Section 14.8: opening year sensitivity tests,
• Section 14.9: additional runway sensitivity tests,
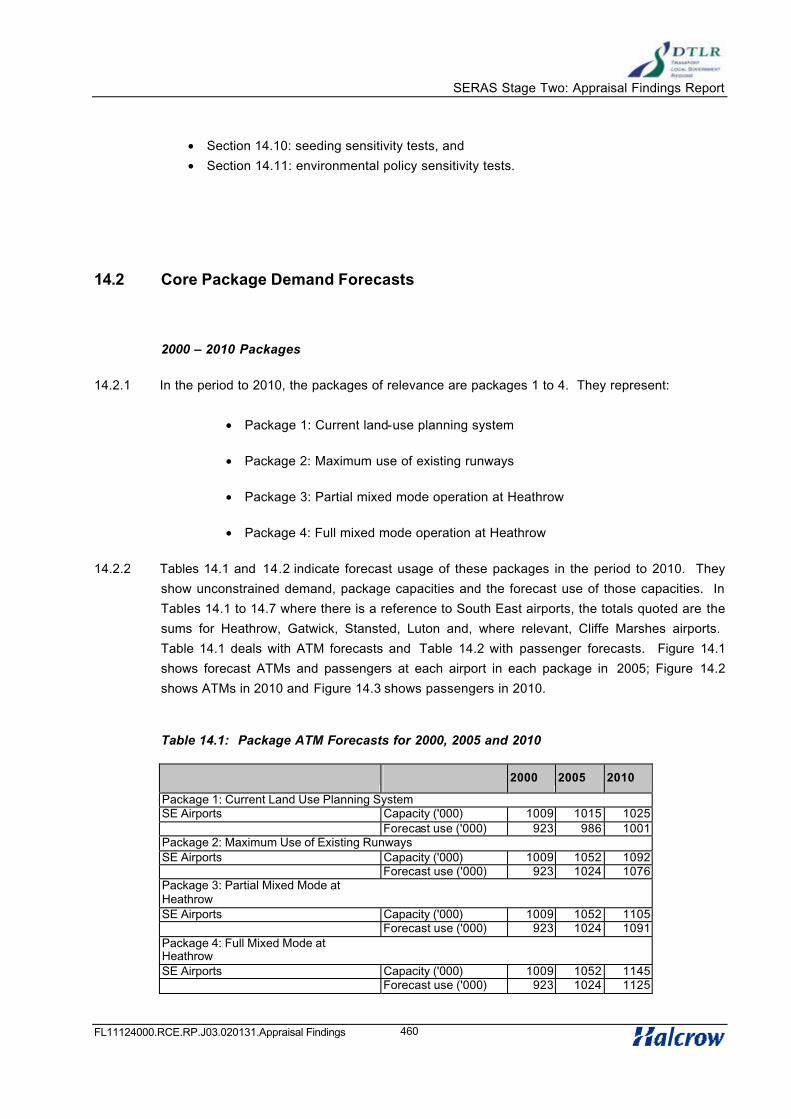
SERAS Stage Two: Appraisal Findings Report
FL11124000.RCE.RP.J03.020131.Appraisal Findings 460
• Section 14.10: seeding sensitivity tests, and
• Section 14.11: environmental policy sensitivity tests.
14.2 Core Package Demand Forecasts
2000 – 2010 Packages
14.2.1 In the period to 2010, the packages of relevance are packages 1 to 4. They represent:
• Package 1: Current land-use planning system
• Package 2: Maximum use of existing runways
• Package 3: Partial mixed mode operation at Heathrow
• Package 4: Full mixed mode operation at Heathrow
14.2.2 Tables 14.1 and 14.2 indicate forecast usage of these packages in the period to 2010. They
show unconstrained demand, package capacities and the forecast use of those capacities. In
Tables 14.1 to 14.7 where there is a reference to South East airports, the totals quoted are the
sums for Heathrow, Gatwick, Stansted, Luton and, where relevant, Cliffe Marshes airports.
Table 14.1 deals with ATM forecasts and Table 14.2 with passenger forecasts. Figure 14.1
shows forecast ATMs and passengers at each airport in each package in 2005; Figure 14.2
shows ATMs in 2010 and Figure 14.3 shows passengers in 2010.
Table 14.1: Package ATM Forecasts for 2000, 2005 and 2010
2000 2005 2010
Package 1: Current Land Use Planning SystemSE Airports Capacity ('000) 1009 1015 1025
Forecast use ('000) 923 986 1001Package 2: Maximum Use of Existing RunwaysSE Airports Capacity ('000) 1009 1052 1092
Forecast use ('000) 923 1024 1076Package 3: Partial Mixed Mode at HeathrowSE Airports Capacity ('000) 1009 1052 1105
Forecast use ('000) 923 1024 1091Package 4: Full Mixed Mode at HeathrowSE Airports Capacity ('000) 1009 1052 1145
Forecast use ('000) 923 1024 1125
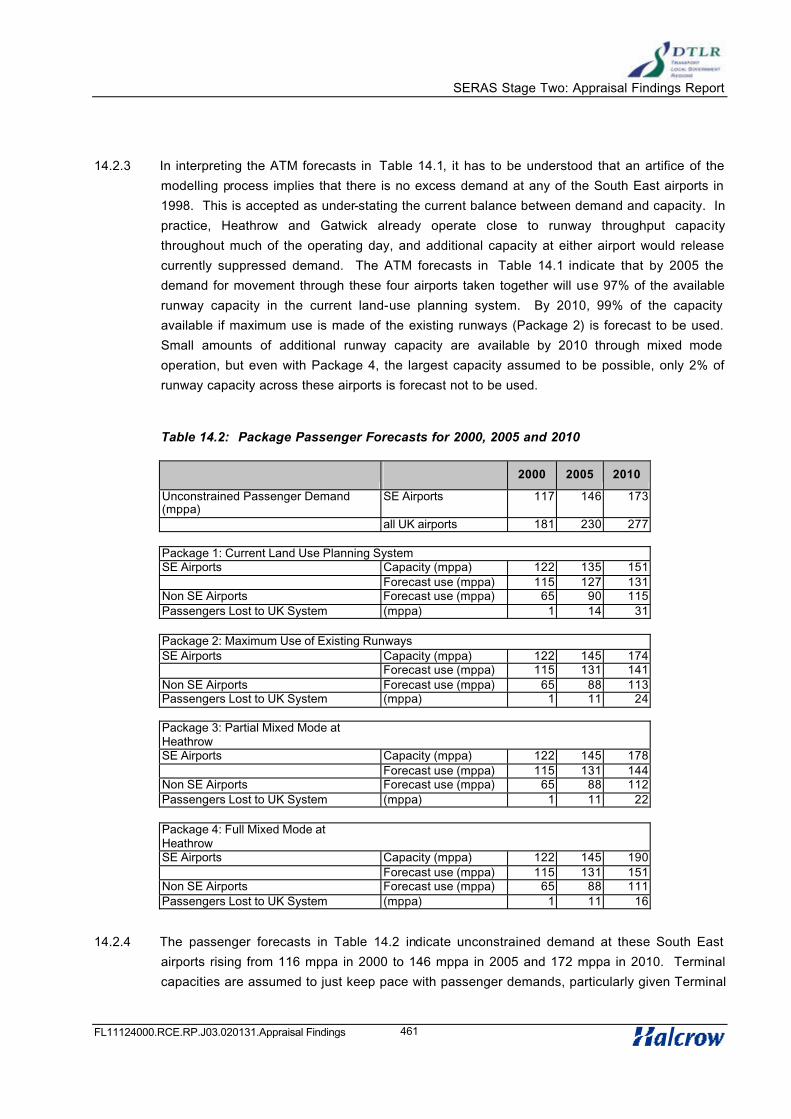
SERAS Stage Two: Appraisal Findings Report
FL11124000.RCE.RP.J03.020131.Appraisal Findings 461
14.2.3 In interpreting the ATM forecasts in Table 14.1, it has to be understood that an artifice of the
modelling process implies that there is no excess demand at any of the South East airports in
1998. This is accepted as under-stating the current balance between demand and capacity. In
practice, Heathrow and Gatwick already operate close to runway throughput capacity
throughout much of the operating day, and additional capacity at either airport would release
currently suppressed demand. The ATM forecasts in Table 14.1 indicate that by 2005 the
demand for movement through these four airports taken together will use 97% of the available
runway capacity in the current land-use planning system. By 2010, 99% of the capacity
available if maximum use is made of the existing runways (Package 2) is forecast to be used.
Small amounts of additional runway capacity are available by 2010 through mixed mode
operation, but even with Package 4, the largest capacity assumed to be possible, only 2% of
runway capacity across these airports is forecast not to be used.
Table 14.2: Package Passenger Forecasts for 2000, 2005 and 2010
2000 2005 2010
Unconstrained Passenger Demand (mppa)
SE Airports 117 146 173
all UK airports 181 230 277
Package 1: Current Land Use Planning SystemSE Airports Capacity (mppa) 122 135 151
Forecast use (mppa) 115 127 131Non SE Airports Forecast use (mppa) 65 90 115Passengers Lost to UK System (mppa) 1 14 31
Package 2: Maximum Use of Existing RunwaysSE Airports Capacity (mppa) 122 145 174
Forecast use (mppa) 115 131 141Non SE Airports Forecast use (mppa) 65 88 113Passengers Lost to UK System (mppa) 1 11 24
Package 3: Partial Mixed Mode at HeathrowSE Airports Capacity (mppa) 122 145 178
Forecast use (mppa) 115 131 144Non SE Airports Forecast use (mppa) 65 88 112Passengers Lost to UK System (mppa) 1 11 22
Package 4: Full Mixed Mode at HeathrowSE Airports Capacity (mppa) 122 145 190
Forecast use (mppa) 115 131 151Non SE Airports Forecast use (mppa) 65 88 111Passengers Lost to UK System (mppa) 1 11 16
14.2.4 The passenger forecasts in Table 14.2 indicate unconstrained demand at these South East
airports rising from 116 mppa in 2000 to 146 mppa in 2005 and 172 mppa in 2010. Terminal
capacities are assumed to just keep pace with passenger demands, particularly given Terminal

SERAS Stage Two: Appraisal Findings Report
FL11124000.RCE.RP.J03.020131.Appraisal Findings 462
5 at Heathrow. Realised demand at the South East airports, however, falls short of
unconstrained demand because of the lack of runway capacity.
14.2.5 At best, in 2010, with Package 4, some 21 million passengers, (12% of the passenger demand
at South East airports), will not use South East airports, in addition to the current un-modelled
suppressed demand. There will be additional use of UK airports outside the South East, but
some 16 million passengers (6% of national demand) will be lost to the UK airport system.
Without mixed mode operation at Heathrow, some 24 million passengers, almost 10% of
national air passenger demand, will be lost to the UK airport system.
14.2.6 Figure 14.1 shows forecast ATMs and passengers at each airport in 2005. Additional runway
capacity is assumed in Packages 2 to 4 at Stansted. There is virtually no unused runway
capacity at any airport, but some unused terminal capacity at Gatwick and Stansted, which are
assumed to have capacities of 40 mppa and 25 mppa respectively.
14.2.7 Figures 14.2 and 14.3 illustrate forecast ATMs and passengers respectively at each airport in
2010. Packages 2, 3 and 4 are all heavily constrained. All ATM capacity at Heathrow and
Gatwick is taken and there are only very small amounts of unused capacity at Stansted (where
the ATM capacity is assumed to be 252,000) and Luton (assumed capacity of 100,000). Figure
14.3 illustrates that the restricted ATM capacity creates some unused terminal capacity at all
airports. Full mixed mode operation at Heathrow (Package 4) brings passenger forecasts
above 80 mppa, close to the 86 mppa terminal capacity with T5.
14.2.8 Through the decade to 2010, therefore, the major South East airports will be characterised by
their operation at runway throughputs very close to physical runway capacities. The intensive
use of the airports throughout the operating day masks the excess demand for slots that cannot
be satisfied, particularly at peak times of the day, which are important to long haul schedule
curfew windows and to the preferences of short haul business travellers.
14.2.9 The forecast growth in excess demand will require a tighter slot management system than that
already applied at the major South East and other UK airports approaching capacity limits. The
implications of an increasing scarcity of slots will be widespread. Air services will be affected:
• The priority allocation of slots to the most profitable routes by the airlines restricts
the range of services.
• The inability to introduce new routes, or to increase frequencies on existing
routes, restricts otherwise viable services.
• The predominance of ‘grandfather rights’ to slots restricts competition by new
entrants.

SERAS Stage Two: Appraisal Findings Report
FL11124000.RCE.RP.J03.020131.Appraisal Findings 463
• The use of larger aircraft on lower frequencies restricts service convenience,
limiting the realisation of passenger preferences for departure and arrival times
and interline connections.
14.2.10 Operating inefficiencies are likely to worsen. The pressure of demand for slots has already led
to the progressive lowering of delay standards to maximise throughput. Further lowering of
standards cannot be ruled out. Block times have been increased as a consequence, to allow
for probable delay. Delay imposes additional costs on airlines, through a less effective use of
the aircraft fleet and airline staff, and through increased fuel consumption. Additional airport
infrastructure and facilities are required to cope with delay and passengers suffer, adding to the
overall economic cost of a lack of capacity.
2011 - 2015 Packages
14.2.11 In the period from 2011 to 2015, the packages of relevance are as set out in Ta ble 14.3.
Package 1 is the capacity currently envisaged in the land-use planning system and Package 2
is the maximum use of existing runways. Each subsequent package contains a development
option at one airport and assumes that at the other airports there is the capability to make
maximum use of the existing runways. Packages 3 and 4 are the continued operation of the
existing runways at Heathrow in mixed mode. Packages 5 to 8 are additional runways at
Heathrow, Gatwick, Stansted and Cliffe Marshes respectively. There are three alternatives at
Heathrow.
Table 14.3: Packages and Options of Relevance, 2011 to 2015
Package Airport Option
1 All Current land-use planning system
2 All Maximum use of existing runways
3 Heathrow Partial mixed mode operation on existing runways (0700-
1200)
4 Heathrow Full mixed mode operation on existing runways
5A Heathrow New 2000m runway. Mixed mode operation on existing
runways
5B Heathrow New 2000m runway. Segregated mode operation on
existing runways
5C Heathrow New 4000m runway. One of three runways in mixed
mode operation
6 Gatwick New close-parallel runway
7 Stansted New wide spaced runway
8(1) and
8(2)
Cliffe Marshes Wide spaced pair of parallel runways (package 8(1)) with
NE:SW runway (package 8(2))

SERAS Stage Two: Appraisal Findings Report
FL11124000.RCE.RP.J03.020131.Appraisal Findings 464
14.2.12 Tables 14.4 and 14.5 give key performance indicators for these packages between 2011 and
2015. The totals quoted are the sums for Heathrow, Gatwick, Stansted and Luton airports.
Table 14.4 deals with ATM forecasts and Table 14.5 with passenger forecasts. Figures 14.4
and 14.5 show ATMs and passengers at each airport in each package in 2011: Figures 14.6
and 14.7 show ATMs and passengers at each airport in each package for 2015.

SERAS Stage Two: Appraisal Findings Report
FL11124000.RCE.RP.J03.020131.Appraisal Findings 465
Table 14.4: Package ATM Forecasts for 2011 to 2015
2011 2015
Package 1SE Airports Capacity ('000) 1025 1025
Forecast use ('000) 1006 988Package 2SE Airports Capacity ('000) 1239 1239
Forecast use ('000) 1095 1142Package 3SE Airports Capacity ('000) 1256 1256
Forecast use ('000) 1111 1131Package 4SE Airports Capacity ('000) 1310 1310
Forecast use ('000) 1146 1168Package 5aSE Airports Capacity ('000) 1513 1513
Forecast use ('000) 1202 1314Package 5bSE Airports Capacity ('000) 1414 1414
Forecast use ('000) 1217 1261Package 5cSE Airports Capacity ('000) 1397 1397
Forecast use ('000) 1200 1246Package 6SE Airports Capacity ('000) 1357 1357
Forecast use ('000) 1169 1219Package 7SE Airports Capacity ('000) 1493 1493
Forecast use ('000) 1215 1346Package 8(1/2)SE Airports Capacity ('000) 1769 1769
Forecast use ('000) 1264 1476
14.2.13 In 2011, it is assumed that additional runway capacity is introduced at Luton in all packages and
maximum use of the Stansted runway is assumed. Additional runways are assumed at other
airports from package to package. Table 14.4 indicates that, other than in Package 1, there is
some spare runway capacity. Figure 14.4 indicates that this is principally at Luton and at
Stansted or Cliffe Marshes if additional runways are provided there (Packages 7 and 8). The
new runways at Heathrow (packages 5A/5B/5C) attract over 600,000 ATMs in 2011, filling the
additional runway capacity as it opens in packages 5B and 5C. In the case of package 5A,
which assumes mixed mode operation on the existing runways as well as the new runway,
there is some runway capacity available to 2015. The additional runway capacity at Heathrow
does not significantly reduce the pressure on runway capacity at Gatwick or Stansted.
14.2.14 By 2015, Table 14.4 indicates that forecast ATMs are around 90% of runway capacity across
these airports, when additional runway capacity is provided at Heathrow, Gatwick or Stansted,
and around 83% of capacity when two runways are added at Cliffe Marshes. Figure 14.6
indicates that the spare runway capacity is invariably at Luton, with a little at Cliffe Marshes in
Package 8.

SERAS Stage Two: Appraisal Findings Report
FL11124000.RCE.RP.J03.020131.Appraisal Findings 466
Table 14.5: Package Passenger Forecasts for 2011 to 2015
2011 2015
Unconstrained Passenger Demand (mppa)SE Airports 178 202all UK airports 288 335
Package 1: Current Land Use Planning SystemSE Airports Capacity (mppa) 151 151
Forecast use (mppa) 134 136Non SE Airports Forecast use (mppa) 126 155Passengers Lost to UK System
(mppa) 29 43
Package 2: Maximum Use of Existing RunwaysSE Airports Capacity (mppa) 199 199
Forecast use (mppa) 145 154Non SE Airports Forecast use (mppa) 120 144Passengers Lost to UK System
(mppa) 23 37
Package 3: Partial Mixed Mode at HeathrowSE Airports Capacity (mppa) 204 204
Forecast use (mppa) 148 155Non SE Airports Forecast use (mppa) 119 146Passengers Lost to UK System (mppa) 21 34
Package 4: Full Mixed Mode at HeathrowSE Airports Capacity (mppa) 218 218
Forecast use (mppa) 155 162Non SE Airports Forecast use (mppa) 116 148Passengers Lost to UK System
(mppa) 17 24
Package 5a: New 2000m Runway and Mixed Mode at HeathrowSE Airports Capacity (mppa) 241 241
Forecast use (mppa) 170 198Non SE Airports Forecast use (mppa) 111 129Passengers Lost to UK System
(mppa) 7 7
Package 5b: New 2000m Runway at HeathrowSE Airports Capacity (mppa) 225 225
Forecast use (mppa) 173 184Non SE Airports Forecast use (mppa) 109 132
Passengers Lost to UK System
(mppa) 6 18
Package 5c: New 4000m Runway at HeathrowSE Airports Capacity (mppa) 234 234
Forecast use (mppa) 169 181Non SE Airports Forecast use (mppa) 111 135Passengers Lost to UK System
(mppa) 8 20
Package 6: New Runway at GatwickSE Airports Capacity (mppa) 214 214

SERAS Stage Two: Appraisal Findings Report
FL11124000.RCE.RP.J03.020131.Appraisal Findings 467
2011 2015
Forecast use (mppa) 154 165Non SE Airports Forecast use (mppa) 117 145Passengers Lost to UK System (mppa) 18 25
Package 7: New Runway at StanstedSE Airports Capacity (mppa) 246 246
Forecast use (mppa) 162 182Non SE Airports Forecast use (mppa) 114 134Passengers Lost to UK System
(mppa) 12 19
Package 8(1/2): Two New Runways at Cliffe Marshes SE Airports Capacity (mppa) 276 276
Forecast use (mppa) 168 195Non SE Airports Forecast use (mppa) 112 130Passengers Lost to UK System
(mppa) 9 10
14.2.15 Table 14.5 indicates that the provision of a new runway at Heathrow in 2011 leads to a big
reduction in the number of passengers lost to the UK airports system, from 23 mppa (8% of
national air travel demand), with maximum use made of existing runways, to 6 mppa (2%).
With all packages in 2011, the limited ATM capacities mean that passenger forecasts at each
airport fall short of terminal capacities (Figure 14.5).
14.2.16 The provision of a new runway at Heathrow in 2011 allows all but 6 to 8 mppa (3 to 4%) of
unconstrained passenger demand for South East airports to be met. Additional runways in
other locations leave more unmet. The additional close-parallel runway at Gatwick (Package 6)
leaves 24 mppa (13%) unmet; the Stansted runway (Package 7) leaves 16 mppa (9%) unmet;
and two runways at Cliffe Marshes leave 10 mppa (6%) unmet.
14.2.17 By 2015, it is Package 5A that comes closest to satisfying unconstrained demand for South
East airports, followed by the Cliffe Marshes runways (Package 8 has the highest runway
capacity), then an additional runway at Stansted and the other Heathrow runway options.
14.2.18 Figure 14.7 illustrates that with the new runways at Heathrow in packages 5A and 5B, terminal
capacity as well as runway capacity is fully utilised. Elsewhere, there is spare terminal capacity.
2016 to 2030 Packages
14.2.19 The packages appraised for the period to 2030 are all those with one or more new runways,
Packages 5 to 21. These can be grouped according to the number of new runways introduced,
In the tables that follow they are grouped into 1-runway packages, 5 to 7, and into 2 or 3-
runway packages, 8 to 21. Figures 14.8a-c show ATMs at each airport in each package in

SERAS Stage Two: Appraisal Findings Report
FL11124000.RCE.RP.J03.020131.Appraisal Findings 468
2021: Figures 14.9a-c show passengers at each airport in each package. Figures 14.10a-c and
14.11a-c present the same information for 2025, and Figures 14.12 a-c and 14.13a-c present
the same information for 2030.
Table 14.6a: ATM Forecasts for One Runway Packages - 2016 to 2030
2016 2020 2025 2030
Package 5a
SE Airports Capacity ('000) 1513 1513 1513 1513
Forecas t use ('000) 1319 1320 1331 1356
Package 5b
SE Airports Capacity ('000) 1414 1414 1414 1414Forecast use ('000) 1266 1279 1329 1339
Package 5c
SE Airports Capacity ('000) 1397 1397 1397 1397Forecast use ('000) 1250 1286 1341 1383
Package 6
SE Airports Capacity ('000) 1357 1357 1357 1357Forecast use ('000) 1234 1308 1333 1306
Package 7
SE Airports Capacity ('000) 1493 1493 1493 1493Forecast use ('000) 1346 1391 1432 1458
14.2.20 Table 14.6a indicates that the addition of just one new runway will not provide adequate runway
capacity much beyond 2015. With Package 5A, 87% of runway capacity is used in 2020 and, in
all other cases, 90% and more of runway capacity is used. Figure 14.8a demonstrates that by
2021, the only runway capacity available in these scenarios is at Luton.
Table 14.6b: ATM Forecasts for Two and Three Runway Packages - 2016 to 2030
2016 2020 2025 2030
Package 8(1/2)SE Airports Capacity ('000) 1769 1769 1769 1769
Forecast use ('000) 1518 1595 1622 1626Package 9SE Airports Capacity ('000) 1465 1465 1654 1654
Forecast use ('000) 1324 1358 1554 1572Package 10SE Airports Capacity ('000) 1493 1493 1617 1617
Forecast use ('000) 1351 1381 1531 1564Package 11SE Airports Capacity ('000) 1513 1513 1631 1631
Forecast use ('000) 1319 1320 1423 1430Package 12SE Airports Capacity ('000) 1513 1513 1767 1767
Forecast use ('000) 1319 1320 1559 1594Package 13SE Airports Capacity ('000) 1357 1357 1611 1611

SERAS Stage Two: Appraisal Findings Report
FL11124000.RCE.RP.J03.020131.Appraisal Findings 469
2016 2020 2025 2030
Forecast use ('000) 1234 1308 1556 1590Package 14SE Airports Capacity ('000) 1493 1617 1736 1736
Forecast use ('000) 1348 1498 1582 1635Package 15
SE Airports Capacity ('000) 1513 1631 1885 1885
Forecast use ('000) 1319 1422 1577 1695Package 16SE Airports Capacity ('000) 1513 1767 1891 1891
Forecast use ('000) 1319 1471 1572 1640
Package 17
SE Airports Capacity ('000) 1357 1611 1735 1735Forecast use ('000) 1234 1483 1616 1646
Package 18
SE Airports Capacity ('000) 1513 1739 1928 1928Forecast use ('000) 1319 1458 1608 1703
Package 19
SE Airports Capacity ('000) 1465 1654 1908 1908
Forecast use ('000) 1324 1522 1664 1740Package 20SE Airports Capacity ('000) 1769 1769 1887 1887
Forecast use ('000) 1518 1595 1713 1733Package 21 (1/2)
SE Airports Capacity ('000) 1769 1769 2020 2020
Forecast use ('000) 1518 1595 1764 1792
14.2.21 Table 14.6b indicates that with two new runways, Packages 8 to 13, by 2020, forecast runway
use ranges between 87% and 96% of runway capacity. In the forecasting it has typically been
assumed that third runways will be introduced in 2024. With the propensity for new runway
capacity to be taken up very soon after its introduction, the new runways assumed do not
provide significant amounts of spare capacity. By 2025, with three or more new runways in
Packages 14 to 21, the proportion of runway capacity used ranges between 83% and 93%,
indicating an airport system continuing to operate close to its physical capacity. Figure 14.10c
indicates that, other than at Luton, there is very little spare runway capacity by 2025 with any
package appraised.
Table 14.7a: Passenger Forecasts for One Runway Packages - 2016 to 2030
2016 2020 2025 2030
Unconstrained Passenger Demand (mppa)
SE Airports 210 242 273 301
all UK airports 347 402 454 501
Package 5aSE Airports Capacity (mppa) 241 241 241 241
Forecast use (mppa) 201 208 215 223

SERAS Stage Two: Appraisal Findings Report
FL11124000.RCE.RP.J03.020131.Appraisal Findings 470
2016 2020 2025 2030
Non SE Airports Forecast use (mppa) 135 162 198 217Passengers Lost to UK System (mppa) 11 32 41 61
Package 5b
SE Airports Capacity (mppa) 225 225 225 225Forecast use (mppa) 187 195 208 215
Non SE Airports Forecast use (mppa) 139 166 199 223Passengers Lost to UK System (mppa) 21 41 47 63
Package 5c
SE Airports Capacity (mppa) 234 234 234 234
Forecast use (mppa) 184 197 211 224Non SE Airports Forecast use (mppa) 142 166 197 222Passengers Lost to UK System (mppa) 22 40 46 55
Package 6SE Airports Capacity (mppa) 214 214 214 214
Forecast use (mppa) 169 187 197 201Non SE Airports Forecast use (mppa) 146 170 204 234Passengers Lost to UK System (mppa) 32 45 52 66
Package 7SE Airports Capacity (mppa) 246 246 246 246
Forecast use (mppa) 185 201 214 225Non SE Airports Forecast use (mppa) 140 164 208 222Passengers Lost to UK System (mppa) 22 37 31 53
14.2.22 Table 14.7a indicates that, by 2020, the unconstrained demand for use of South East airports is
241 mppa, while the forecast use of all packages appraised lies in the range between 187 mppa
and 208 mppa. This indicates that the addition of only one new runway by 2020 will leave a
large part of the demand for South East airports unsatisfied. Between 32 and 45 mppa (8% to
11% of national air travel demand) will be lost to the airport system.

SERAS Stage Two: Appraisal Findings Report
FL11124000.RCE.RP.J03.020131.Appraisal Findings 471
Table 14.7b: Passenger Forecasts for Two and Three Runway Packages – 2016 to 2030
2016 2020 2025 2030
Package 8(1/2)SE Airports Capacity (mppa) 276 276 276 276
Forecast use (mppa) 202 222 237 245Non SE Airports Forecast use (mppa) 135 156 190 226Passengers Lost to UK System (mppa) 10 23 27 30
Package 9SE Airports Capacity (mppa) 235 235 267 267
Forecast use (mppa) 180 194 232 243Non SE Airports Forecast use (mppa) 144 167 195 229Passengers Lost to UK System (mppa) 23 41 26 29
Package 10SE Airports Capacity (mppa) 246 246 266 266
Forecast use (mppa) 185 200 231 243Non SE Airports Forecast use (mppa) 140 164 196 226Passengers Lost to UK System (mppa) 22 38 27 32
Package 11SE Airports Capacity (mppa) 241 241 256 256
Forecast use (mppa) 201 208 230 235Non SE Airports Forecast use (mppa) 135 162 197 212Passengers Lost to UK System (mppa) 11 32 26 53
Package 12SE Airports Capacity (mppa) 241 241 288 288
Forecast use (mppa) 201 208 253 264Non SE Airports Forecast use (mppa) 135 162 182 210Passengers Lost to UK System (mppa) 11 32 18 26
Package 13SE Airports Capacity (mppa) 214 214 261 261
Forecast use (mppa) 169 187 230 242Non SE Airports Forecast use (mppa) 146 170 196 228Passengers Lost to UK System (mppa) 32 45 28 31
Package 14SE Airports Capacity (mppa) 246 266 293 293
Forecast use (mppa) 185 217 242 257Non SE Airports Forecast use (mppa) 140 162 190 216Passengers Lost to UK System (mppa) 22 24 21 27
Package 15SE Airports Capacity (mppa) 241 256 303 303
Forecast use (mppa) 201 223 254 279Non SE Airports Forecast use (mppa) 135 158 182 202Passengers Lost to UK System (mppa) 11 21 18 20
Package 16SE Airports Capacity (mppa) 241 288 308 308
Forecast use (mppa) 201 232 256 274Non SE Airports Forecast use (mppa) 135 155 180 206Passengers Lost to UK System (mppa) 11 15 18 21

SERAS Stage Two: Appraisal Findings Report
FL11124000.RCE.RP.J03.020131.Appraisal Findings 472
2016 2020 2025 2030
Package 17SE Airports Capacity (mppa) 214 261 281 281
Forecast use (mppa) 169 214 244 255Non SE Airports Forecast use (mppa) 146 160 186 213Passengers Lost to UK System (mppa) 32 27 24 32
Package 18SE Airports Capacity (mppa) 241 277 309 309
Forecast use (mppa) 201 227 257 279Non SE Airports Forecast use (mppa) 135 158 182 205Passengers Lost to UK System (mppa) 11 17 15 16
Package 19SE Airports Capacity (mppa) 235 267 314 314
Forecast use (mppa) 180 218 251 273Non SE Airports Forecast use (mppa) 144 160 185 207Passengers Lost to UK System (mppa) 23 24 18 20
Package 20SE Airports Capacity (mppa) 276 276 291 291
Forecast use (mppa) 202 222 251 262Non SE Airports Forecast use (mppa) 135 156 182 211Passengers Lost to UK System (mppa) 10 23 21 28
Package 21 (1/2)SE Airports Capacity (mppa) 276 276 312 312
Forecast use (mppa) 202 222 260 271Non SE Airports Forecast use (mppa) 135 156 182 205Passengers Lost to UK System (mppa) 10 23 11 24
14.2.23 The addition of second and third new runways by 2021 and 2024, in Packages 14 to 21, allows
between 242 mppa and 260 mppa out of the unconstrained demand of 272 mppa to be
accommodated at South East airports. By 2030, the highest number of passengers
accommodated at the major South East airports in any package appraised is 279 mppa, out of
the unconstrained demand of 300 mppa, ie, 93% of demand is being accommodated. The
number of passengers lost to the UK airports system is, in the best case, 16 mppa, out of
national unconstrained demand of around 500 mppa.
14.3 Economic Appraisal of Core Packages
14.3.1 The results of the economic appraisal of all the core packages are set out in Table 14.8.
Appraisals have been made against Package 2 (Maximum use of existing runways). Benefits
are broken down into categories of beneficiary: user benefits (generated and existing
passengers, UK and foreign residents, freight), producer surpluses (effectively to airport
operators) and additional Government revenue from Air Passenger Duty. Total benefits are set
against the sum of the capital costs and additional refurbishment costs associated with each
package. All costs and benefits are in £ million at 2000 values discounted back to 2000 using

SERAS Stage Two: Appraisal Findings Report
FL11124000.RCE.RP.J03.020131.Appraisal Findings 473
the Government’s current test discount rate of 6% per annum in real terms. Two measures of
Net Benefit (discounted benefits minus discounted costs) are given: Net Benefits which includes
all benefits, and Net Benefits Only Counting Benefits to UK Users, which excludes benefits to
foreign passengers. Two other indicators are given: Benefit:Cost ratio and Net Benefit per
mppa of additional capacity.

SERAS Stage Two: Appraisal Findings Report
FL11124000.RCE.RP.J03.020131.Appraisal Findings 474
Table 14.8: Core Economic Appraisal Results
UK
Fo
reig
n
UK
Fo
reig
n
3 LHR partial mixed mode 5 £224 £29 £140 £18 -£6 £238 £139 £783 -£858 -£75 -£123 0.91 -£15.054 LHR full mixed mode 19 £577 £323 £347 £227 £15 £722 £325 £2,536 -£833 £1,703 £1,153 3.04 £89.625A LHR 2000m r/w, all in mixed mode 42 £3,607 £1,532 £641 £519 £128 £1,832 £349 £8,609 -£3,168 £5,442 £3,390 2.72 £129.565B LHR 2000m r/w in mixed mode 26 £2,112 £764 £530 £414 £128 £1,156 £218 £5,321 -£2,406 £2,916 £1,738 2.21 £112.145C LHR 4000m r/w, one in mixed mode 35 £2,131 £1,152 £614 £445 £78 £1,429 £406 £6,254 -£3,101 £3,154 £1,557 2.02 £90.116 LGW close parallel r/w 15.5 £376 £148 £395 £318 £26 £501 £151 £1,915 -£982 £933 £467 1.95 £60.187 STN wide spaced r/w 47 £1,732 £889 £417 £134 £26 £677 £431 £4,307 -£2,149 £2,158 £1,135 2.00 £45.918 (i) Cliffe, 2 new r/ws 77 £2,524 £328 £88 -£216 £151 £3,577 £459 £6,912 -£5,916 £996 £884 1.17 £12.938 (ii) Cliffe, 2 new r/ws plus crosswind 77 £2,524 £328 £88 -£216 £151 £3,577 £459 £6,912 -£6,128 £784 £672 1.13 £10.189 LGW 2 new r/ws 68.5 £3,775 £1,814 £1,066 £549 £62 £1,652 £460 £9,377 -£2,775 £6,602 £4,239 3.38 £96.3810 STN 2 new r/ws 67 £3,244 £2,014 £478 £142 £2 £1,025 £435 £7,340 -£2,791 £4,549 £2,393 2.63 £67.8911 LHR & LGW, 1 new r/w each 57.5 £4,861 £1,952 £1,046 £789 £158 £2,096 £463 £11,364 -£3,837 £7,527 £4,786 2.96 £130.9112 LHR & STN, 1 new r/w each 89 £7,040 £3,447 £1,072 £671 £125 £2,406 £567 £15,327 -£4,415 £10,912 £6,794 3.47 £122.6113 LGW & STN, 1 new r/w each 62.5 £2,652 £1,421 £920 £571 £7 £1,093 £338 £7,003 -£2,153 £4,850 £2,858 3.25 £77.6114 STN, 3 new r/ws 94 £5,412 £2,961 £620 £138 £34 £1,279 £660 £11,104 -£3,437 £7,667 £4,568 3.23 £81.5615 LHR, LGW, STN, 1 new r/w each 104.5 £7,926 £3,616 £1,542 £954 £127 £2,601 £661 £17,428 -£4,966 £12,463 £7,893 3.51 £119.2616 LHR, 1 new r/w, STN, 2 new r/ws 109 £7,876 £4,007 £1,205 £732 £345 £2,635 £728 £17,528 -£5,103 £12,425 £7,687 3.44 £113.9917 LGW, 1 new r/w, STN, 2 new r/ws 82.5 £4,438 £2,323 £944 £543 £15 £1,264 £606 £10,133 -£2,998 £7,134 £4,268 3.38 £86.4818 LHR, 1 new r/w, LGW, 2 new r/ws 110.5 £8,458 £3,706 £1,614 £1,022 £214 £2,952 £572 £18,537 -£5,155 £13,382 £8,655 3.60 £121.1119 LGW, 2 new r/ws, STN, 1 new r/w 115.5 £6,950 £3,444 £1,567 £791 £276 £2,078 £778 £15,884 -£3,980 £11,904 £7,669 3.99 £103.0620 Cliffe, 2 new r/ws, LGW, 1 new r/w 92.5 £4,265 £1,203 £416 -£10 £226 £3,845 £551 £10,495 -£6,579 £3,917 £2,724 1.60 £42.3421 (i) Cliffe, 4 new r/ws 113 £4,344 £1,082 £12 -£359 £307 £4,492 £718 £10,595 -£7,059 £3,537 £2,814 1.50 £31.3021 (ii) Cliffe, 4 new r/ws, plus crosswind r/w 113 £4,344 £1,082 £12 -£359 £307 £4,492 £718 £10,595 -£7,270 £3,325 £2,602 1.46 £29.43
Net
Ben
efits
: B
enef
its t
o U
K
Use
rs O
nly
Ben
efit:
Co
st
Rat
io
NP
V p
er m
pp
a o
f ad
dit
ion
al
cap
acit
y
Pac
kag
e
Description MP
PA
of
Ad
dit
ion
alC
apac
ity
Generated Existing
Go
vern
men
tR
even
ue
To
tal B
enef
its
Co
sts
Net
Ben
efits
(2000-2060, £m, 2000 values, discounted @ 6% p.a.) Benefits to Users
Ben
efit
s to
F
reig
ht
Use
rs
Ben
efit
s to
P
rod
uce
rs
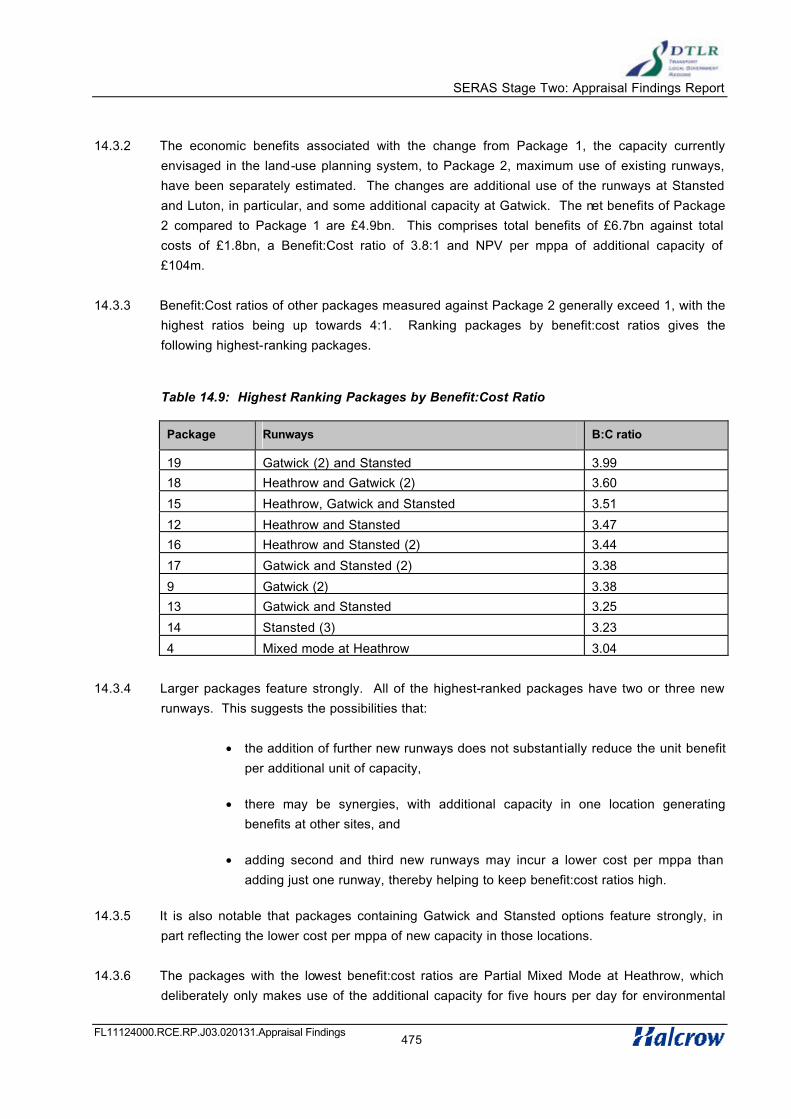
SERAS Stage Two: Appraisal Findings Report
FL11124000.RCE.RP.J03.020131.Appraisal Findings475
14.3.2 The economic benefits associated with the change from Package 1, the capacity currently
envisaged in the land-use planning system, to Package 2, maximum use of existing runways,
have been separately estimated. The changes are additional use of the runways at Stansted
and Luton, in particular, and some additional capacity at Gatwick. The net benefits of Package
2 compared to Package 1 are £4.9bn. This comprises total benefits of £6.7bn against total
costs of £1.8bn, a Benefit:Cost ratio of 3.8:1 and NPV per mppa of additional capacity of
£104m.
14.3.3 Benefit:Cost ratios of other packages measured against Package 2 generally exceed 1, with the
highest ratios being up towards 4:1. Ranking packages by benefit:cost ratios gives the
following highest-ranking packages.
Table 14.9: Highest Ranking Packages by Benefit:Cost Ratio
Package Runways B:C ratio
19 Gatwick (2) and Stansted 3.99
18 Heathrow and Gatwick (2) 3.60
15 Heathrow, Gatwick and Stansted 3.51
12 Heathrow and Stansted 3.47
16 Heathrow and Stansted (2) 3.44
17 Gatwick and Stansted (2) 3.38
9 Gatwick (2) 3.38
13 Gatwick and Stansted 3.25
14 Stansted (3) 3.23
4 Mixed mode at Heathrow 3.04
14.3.4 Larger packages feature strongly. All of the highest-ranked packages have two or three new
runways. This suggests the possibilities that:
• the addition of further new runways does not substantially reduce the unit benefit
per additional unit of capacity,
• there may be synergies, with additional capacity in one location generating
benefits at other sites, and
• adding second and third new runways may incur a lower cost per mppa than
adding just one runway, thereby helping to keep benefit:cost ratios high.
14.3.5 It is also notable that packages containing Gatwick and Stansted options feature strongly, in
part reflecting the lower cost per mppa of new capacity in those locations.
14.3.6 The packages with the lowest benefit:cost ratios are Partial Mixed Mode at Heathrow, which
deliberately only makes use of the additional capacity for five hours per day for environmental

SERAS Stage Two: Appraisal Findings Report
FL11124000.RCE.RP.J03.020131.Appraisal Findings476
reasons, and the packages containing options at Cliffe Marshes, which incur relatively high site
preparation costs. This is particularly true of Package 8 which includes some costs in
preparation for future runways that only materialise in Package 21.
14.3.7 Ranking packages by their Net Benefit per mppa of additional capacity gives the following
highest-ranked packages.
Table 14.10: Highest Ranking Packages by Net Benefit per mppa
Package Runways Net benefit per mppa, £
million
11 Heathrow and Gatwick 131
5A Heathrow 130
12 Heathrow and Stansted 123
18 Heathrow and Gatwick (2) 121
15 Heathrow, Gatwick and Stansted 119
16 Heathrow and Stansted (2) 114
5B Heathrow 112
19 Gatwick (2) and Stansted 103
9 Gatwick (2) 96
14.3.8 Heathrow features in all of the highest ranked packages, clearly pointing to the economic value
of additional capacity at Heathrow. With all the packages appraised, there remain high shadow
costs at Heathrow. In 2030 they are equivalent to £70 per passenger with package 2 and to
£37 per passenger with Package 5A, which contains the largest capacity Heathrow option
appraised. This indicates that there remain substantial economic benefits to be obtained from a
fourth runway at Heathrow.
14.3.9 Again, multiple-runway packages feature strongly suggesting that the addition of second and
third new runways does not substantially dilute net benefits. Of the five packages with net
benefits in excess of £10 billion, four have three runways and one has two runways. Packages
with more than three new runways would be likely to emerge if the objective were to maximise
net benefits.
14.3.10 In the appraisal of packages it was assumed that a first runway would be implemented in 2011
and a second runway in 2021, or in 2018 if a third runway were to be implemented in 2024.
There is sufficient evidence from the passenger and ATM forecasting, the persistent lack of
runway capacity in many packages, and the take-up of new runway capacity as it emerges to
suggest that, if the objective were to maximise economic returns, additional runways ought to
be brought forward from these assumed implementation dates.

SERAS Stage Two: Appraisal Findings Report
FL11124000.RCE.RP.J03.020131.Appraisal Findings477
Delay
14.3.11 In the foregoing calculations, no account has been taken of the costs associated with delay at
capacity-constrained airports, or the possible reduction in delay costs in those scenarios that
provide sufficient capacity to allow higher level of service standards to be applied.
14.3.12 At runway-constrained airports in the UK, the delay standards currently applied are:
• 10 minutes average delay in all half hours in the operating day, and
• 20/25 minutes peak delay for arrivals and departures respectively.
14.3.13 These delays impose costs on airports, airlines and passengers, not just because they
encompass a higher average delay than the industry norm of 5 minutes, but because the higher
average delay is associated with greater variability in delay and general unreliability in airport
and airline operations. The costs imposed include the following items: the values quoted are
the costs estimated to be currently incurred annually at Heathrow and Gatwick from an average
10-minute rather than 5-minute delay:
• Passengers – average delay time cost (£120 million),
• Airlines – increased aircraft and crew time costs from increased block-timeallowances for delay; fuel costs for air delays; larger aircraft fleets to allow for fewer rotations; schedule disruption and recovery associated with extreme delays; missed flight compensation (£220 million),
• Airports – extended gate times require additional terminal facilities and aircraft stands (estimated capital value of £250 million), and
• Economic and social costs – restricted slot availability restricts air services and competition between airlines.
14.3.14 Thus total costs to airlines are of the order of £220 million per year and to passengers £120
million. There are additional costs to airport operators too. It is not possible to predict how
these delay costs will vary between packages. In those packages with less runway capacity,
there will be a tendency for delay standards to be reduced still further at the expense of
throughput. In larger capacity packages, with spare runway capacity, it is more likely that
tighter delay standards could be imposed. It may be that the probability of tighter standards
being imposed is higher with development at new sites – Cliffe Marshes and the large Stansted
options – than at Heathrow and Gatwick where reduced standards already apply.
14.3.15 The sums involved can be considerable. Taking account of costs to passengers and airlines
and making no allowance for growth in either the numbers affected or the values of the different
costs, a current annual value of £340 million, assumed to be saved from 2011 (when new
runway capacity might be available allowing higher standards to be imposed) onwards, has a
Present Value of around £3 billion. If passenger time costs were omitted and only airline

SERAS Stage Two: Appraisal Findings Report
FL11124000.RCE.RP.J03.020131.Appraisal Findings478
resource costs were allowed for, the Present Value is £1.9 billion. In the context of the larger
capacity packages, with Present Values of Benefits up to a highest estimated value of £17
billion, an additional £3 billion would add approaching 20% to benefits and would increase the
benefit:cost ratios of the three runway packages variously by 0.4 to 1.0.
14.4 Financial Appraisal of Core Packages
14.4.1 The principal results of the financial appraisal, IRRs and NPVs of different airport options in
each core package, are given in Table 14.11. This table also gives some indication of the
sensitivity of IRRs to additional revenues from other sources. IRRs and NPVs for each package
are calculated from the incremental costs and revenues generated by the options in a package
over a Base Case of making maximum use of existing runway capacity.
14.4.2 Scheme costs include the costs of necessary surface access schemes. Base Estimates of
NPVs and IRRs take account only of the surpluses generated by the additional capacity of an
option within a package. Also shown are the effects on IRR of additional revenues from two
sources: from a levy on departing passengers, either just at the airport where additional
capacity is provided or at the major airports in the South East airports system; or from a
different value of x in an RPI - x regulatory formula. Since the base assumption is that x is
zero, the alternative IRRs reported in Table 14.11 imply a formula of RPI + x. Again the impacts
of applying a different regulatory formula, either just at the airport where capacity is increased or
at the major South East airports, are shown. It is assumed these additional revenue sources
are in place only from 2008 to 2030.
14.4.3 The financial IRRs vary much less from one option/package to another than the economic
returns. This is largely attributable to the similarity of revenues and costs per passenger (and
certainly the similarity of financial surpluses per passenger) in contrast to the variation in
shadow costs from airport option to option, which is a major contributor to differences in
economic benefits. However, the assumed financial surplus per passenger does differ between
the cases. At existing airports, the financial surplus per passenger is extrapolated from recent
historic data. In the financial results reported below, Cliffe is assumed to enjoy Heathrow’s
revenue per passenger but to incur lower operating costs than Heathrow. A multi-runway
Stansted, however, is assumed to have the same financial surplus per passenger as at present.
14.4.4 None of the new runway options reaches the target IRR of 12.5% nominal, even when the
additional runway and terminal capacity is effectively fully utilised from its introduction. The
highest IRR of any option is the 10.1% generated by mixed mode operation (Package 4) at
Heathrow, which gains from the additional capacity without the costs of a new runway. Of the
new single runway options, Option 5A, which also includes mixed mode operation on the
existing Heathrow runways, has the highest IRR at 7.1%, but all single-runway packages have
IRRs in the range from 5.8% to 7.1%.

SERAS Stage Two: Appraisal Findings Report
FL11124000.RCE.RP.J03.020131.Appraisal Findings479
14.4.5 In the larger packages, IRRs for the first runway to be built tend to be little changed from the
IRRs of the same runway built on its own, principally because the demand forecasting has
indicated no significant effect of subsequent runways on the demand for the first runway to be
built in a package. The IRRs of second or third runways to be built, however, are often lower.
14.4.6 Levies charged on departing passengers, either at the airport where capacity is enhanced, or at
all of the major South East airports will raise IRRs. A £2 levy charged at all South East airports
will bring the IRRs of most options/packages up to or over 10%, as would allowing aeronautical
charges to rise by 1% per year in real terms.

SERAS Stage Two: Appraisal Findings Report
FL11124000.RCE.RP.J03.020131.Appraisal Findings480
Table 14.11: Principal Financial Appraisal Results
Package Airport Runway BASE BASE Levy @
airport
Levy @ all
airports
RPI + x% @
airport
RPI + x% @
all airports
60y 60y (IRR) (IRR) (IRR) (IRR)
Order NPV IRR £2 £4 £1 £2 1% 2% 0.5% 1%
3 LHR Terminal -466 1.5 8.1 14.1 8.2 13.8 9.1 13.2 8.6 12.2
4 LHR Terminal -117 10.1 16.5 24.1 15.9 22.5 14.9 18.7 14.2 17.4
5A LHR 1st -1,080 7.1 9.2 11.1 8.9 10.5 9.5 11.5 9.0 10.5
5B LHR 1st -887 6.3 8.9 11.4 8.6 10.8 9.3 11.7 8.8 10.7
5C LHR 1st -1,304 5.9 7.9 9.7 7.6 9.3 8.4 10.5 7.9 9.6
6 LGW 1st -392 6.1 9.1 11.8 11.0 15.7 9.2 11.5 10.7 13.7
7 STN 1st -873 5.8 7.5 9.0 8.4 10.8 7.8 9.5 8.6 10.7
8(1) Cliffe 1st & 2nd -2,202 6.8 7.8 8.8 8.0 9.1 8.3 9.8 8.3 9.6
8(2) Cliffe 1st, 2nd & 3rd -2,350 6.6 7.6 8.5 7.7 8.8 8.1 9.5 8.1 9.3
9 LGW 1st & 2nd -851 6.9 8.6 10.2 9.0 11.1 8.9 10.7 9.2 11.1
10 STN 1st -873 5.8 7.5 9.0 8.4 10.8 7.8 9.5 8.6 10.7
10 STN 2nd -200 4.5 9.6 14.2 10.9 16.9 9.2 12.3 10.2 13.6
11 LHR 1st -1,086 7.1 9.1 11.1 8.9 10.5 9.5 11.5 9.0 10.6
11 LGW 2nd -192 5.0 8.3 11.1 11.1 16.8 8.2 10.7 10.5 13.8
12 LHR 1st -1,084 7.1 9.1 11.1 9.0 10.7 9.5 11.5 9.1 10.8
12 STN 2nd -359 5.2 7.1 8.8 8.6 11.9 7.3 9.2 8.7 11.2
13 LGW 1st -333 6.6 9.8 12.7 12.3 17.6 9.7 12.1 11.7 14.9
13 STN 2nd -363 5.3 7.2 9.0 8.5 11.5 7.4 9.2 8.5 10.8
14 STN 1st -873 5.8 7.5 9.0 8.4 10.8 7.8 9.5 8.6 10.7
14 STN 2nd & 3rd -405 5.3 8.5 11.6 9.0 12.7 8.6 11.3 9.0 11.7
15 LHR 1st -1,085 7.1 9.1 11.1 9.0 10.7 9.5 11.5 9.2 10.9
15 LGW 2nd -218 5.7 8.9 11.8 12.2 18.4 8.9 11.3 11.4 14.9
15 STN 3rd -294 4.7 6.7 8.4 8.3 11.6 6.8 8.7 8.2 10.8
16 LHR 1st -1,084 7.1 9.1 11.1 9.0 10.8 9.5 11.5 9.2 10.9
16 STN 2nd & 3rd -629 4.6 6.2 7.7 7.3 10.0 6.6 8.5 7.6 10.0
17 LGW 1st -353 6.4 9.5 12.4 12.1 17.3 9.5 11.9 11.7 14.9
17 STN 2nd & 3rd -644 5.1 6.7 8.3 7.5 9.8 7.1 8.8 7.7 9.8
18 LHR 1st -1,084 7.1 9.1 11.1 9.0 10.7 9.5 11.5 9.2 10.9
18 LGW 2nd & 3rd -520 6.2 7.9 9.6 8.7 11.4 8.2 10.1 8.8 11.1
19 LGW 1st & 2nd -932 6.8 8.4 10.0 8.9 11.0 8.7 10.5 9.1 11.1
19 STN 3rd -283 4.7 6.7 8.4 8.6 12.2 6.9 8.8 8.4 11.1
20 Cliffe 1st & 2nd -222 4.1 7.1 9.6 10.6 16.7 7.4 9.8 10.1 13.7
20 LGW 3rd -2,218 6.7 7.8 8.7 8.0 9.1 8.3 9.7 8.3 9.6
21(1) Cliffe 3rd & 4th -223 8.3 13.3 18.7 12.8 17.7 12.8 16.4 12.2 15.1
21(1) Cliffe All -2,435 7.0 8.1 9.0 8.1 9.1 8.7 10.2 8.4 9.7

SERAS Stage Two: Appraisal Findings Report
FL11124000.RCE.RP.J03.020131.Appraisal Findings481
14.5 Wider Economic Impacts
Introduction
14.5.1 The estimation of the economic costs and benefits of packages described above incorporates
the principal direct economic benefits from additional airport capacity. Benefits to air
passengers, both business and leisure travellers, and air freight users from the greater range of
services available, increased surpluses to airport operators arising from increased passenger
and freight volumes, and additional Government revenues from Air Passenger Duty have been
included alongside any offsetting costs.
14.5.2 In addition to these direct benefits, increased airport capacity is expected to have wider, indirect
economic impacts for the economy as a whole, or for those parts of the economy most closely
linked to aviation and air transport. Recent investigations of the potential wider economic
impacts of aviation have identified the following as the principal potential impacts.
• Increased airport capacity and improved air services may contribute to
productivity growth across the economy as a whole;
• Foreign direct investment and trade may be enhanced by increased airport
capacity and improved air services; and
• There may be benefits to or costs imposed on individual industries, tourism, for example, closely associated with aviation.
14.5.3 The focus in this study has been on the estimation of the direct impacts of increased airport
capacity, as being the most tangible, most certain and most measurable indicators of the
economic benefits of increased airport capacity and the enhanced air services thereby made
possible. In addressing the wider economic impacts, the intention has been to explore the
issues and to present an order of magnitude estimate of their potential. It is important to avoid
double counting benefits: the value of improved services to business travellers themselves, for
example, is already recognised in the direct user benefits. Any wider benefits have to be
additional to those already estimated.
14.5.4 The starting point in the estimation of wider economic impacts is a recognition of the importance
of air transport as a necessary factor of production in a modern economy, and, that if air
transport is made less convenient or more costly, if passengers and freight cannot get in and
out of the country easily, there will be wider economic ramifications. Among the effects of less
convenient and more costly travel are passengers having to use airports other than their
preferred airports or not travelling by air at all. Table 14.12 indicates for a number of packages
wiith different capacities, and for an unconstrained passenger allocation, the numbers of foreign
and UK business and leisure passengers in 2030 at South East airports (Heathrow, Gatwick,
Stansted, Luton and London City Airport).

SERAS Stage Two: Appraisal Findings Report
FL11124000.RCE.RP.J03.020131.Appraisal Findings482
Table 14.12: Effects of Capacity Constraints on Trips through SE Airports
Package Foreign Business
Trips via SE
Airports (millions)
UK Business Trips
via SE Airports
(millions)
Foreign Leisure
Trips via SE
Airports
(millions)
UK Leisure Trips
via SE Airports
(millions)
2000 11.4 12.5 22.0 39.0
2030 packages
2 33.8 32.5 37.3 41.3
5A 36.3 36.7 47.4 52.5
5B 35.6 35.8 45.5 51.2
6 34.8 33.9 43.1 46.6
7 35.7 35.7 47.4 53.2
11 36.9 37.7 50.3 56.2
12 38.5 41.0 56.9 64.1
15 39.0 40.8 58.4 66.9
Unconstrained 38.8 40.6 59.9 67.6
South East airports are Heathrow, Gatwick, Stansted, Luton and London City airports.
14.5.5 Domestic flights and international to international interliners are not included in the figures
above as they are less relevant in that they will make less contribution to the national economy
in terms of productivity, investment or consumer expenditure.
14.5.6 In the case of no new runways - Package 2 - 20% of UK business trips are lost from these
airports compared to package 15, a less constrained scenario, and 38% of UK leisure trips are
lost. 13% of foreign business trips and 36% of foreign leisure trips are lost.
Productivity Growth Across the Economy as a Whole
14.5.7 The potential effect of increased airport investment and air services on productivity across the
economy can be gauged from the additional business travel facilitated, which may lead to wider
productivity gains.
14.5.8 Business travel through South East airports grows at an average rate of about 4% per year for
most packages, slightly more for those packages adding more capacity, with less growth in the
constrained package 2. The business travel through South East airports lost with different
constrained packages is summarised in Table 14.13. In the worst case, some 16% of business
travel through South East airports are lost.

SERAS Stage Two: Appraisal Findings Report
FL11124000.RCE.RP.J03.020131.Appraisal Findings483
Table 14.13: Business Travel at Constrained South East Airports
Package Number of
Additional
Runways
Business Trips through
SE Airports (millions in
2030)
% of Unconstrained
Business Demand Through
SE Airports in 2030
2 (Base) 0 66.3 84%
5A 1 73.0 92%
5B 1 71.4 90%
6 1 68.7 87%
7 1 71.4 90%
11 2 74.6 94%
12 2 79.5 100%
15 3 79.8 100%
Unconstrained 79.4 100%
South East airports are Heathrow, Gatwick, Stansted, Luton and London City airports.
Foreign Direct Investment
14.5.9 The appropriate proxy for the effects of constrained airport capacity on foreign direct investment
is the effect on the number of business trips by foreign residents through South East airports.
Table 14.14 indicates the loss of these trips for the same range of packages. In the worst case,
13% of business trips by foreign residents are lost.
Table 14.14: Foreign Business Travel at Constrained South East Airports
Package Number of
Additional
Runways
Foreign Business Trips
through SE Airports
(millions in 2030)
% of Unconstrained Foreign
Business Demand Through
the SE Airports in 2030
2 (Base) 0 33.8 87%
5A 1 36.3 94%
5B 1 35.6 92%
6 1 34.8 90%
7 1 35.7 92%
11 2 36.9 95%
12 2 38.5 99%
15 3 39.0 100%
Unconstrained 38.8 100%
South East airports are Heathrow, Gatwick, Stansted, Luton and London City airports
14.5.10 Foreign direct investment in 1999 has been estimated to be almost 50% of total investment,
although this is a higher proportion than in previous years. Thus, there is the potential for a
reasonably significant loss of investment if business travel is suppressed by a lack of runway
capacity.

SERAS Stage Two: Appraisal Findings Report
FL11124000.RCE.RP.J03.020131.Appraisal Findings484
Impacts on Individual Industries
14.5.11 The tourism industry, both in the UK and abroad is a particular industry that would be affected
by increased airport capacity. There are two elements to be considered: changes in the
numbers of trips made overseas by UK residents and by overseas visitors to the UK, and their
relative tourism expenditure levels.
14.5.12 The nature of leisure travel and tourism by air is changing:
• there are more short breaks,
• the average number of nights stayed per trip is coming down;
• visiting friends/relatives is becoming a larger share of the total;
• tourism is taking a smaller share; and
• there are more repeat visits.
14.5.13 These factors mean that tourism trips, and pressure on tourist facilities, will grow less quickly
than leisure trips. Leisure trips by both UK and foreign residents are quite heavily suppressed
(approaching 40% of trips being lost to South East airports) in capacity-constrained airport
scenarios.
14.5.14 Table 14.15 shows the increase in foreign leisure travel into the South East Airports and UK
leisure travel out of the South East Airports compared to the base case (package 2) in 2030 for
a representative selection of packages. Note that the totals are airport terminal movements,
rather than trips.
Table 14.15: Leisure Travel at Constrained South East Airports
Package Foreign Leisure Trips UK Leisure Trips
2030 trips
mppa
Reduction from unconstrained 2030 trips
mppa
Reduction from unconstrained
Mppa % Mppa %
2 (base) 37.3 22.6 38 41.3 26.3 39
5A 47.4 12.5 21 52.5 15.1 22
5B 45.5 14.4 24 51.2 16.4 24
6 43.1 16,8 28 46.6 21.0 31
7 47.4 12.5 21 53.2 14.4 21
11 50.3 9.6 16 56.2 11.4 17
12 56.9 3.0 5 64.1 3.5 5
15 58.4 1.5 3 66.9 0.7 1
Unconstrained 59.9 67.6
South East airports are Heathrow, Gatwick, Stansted, Luton and London City airports
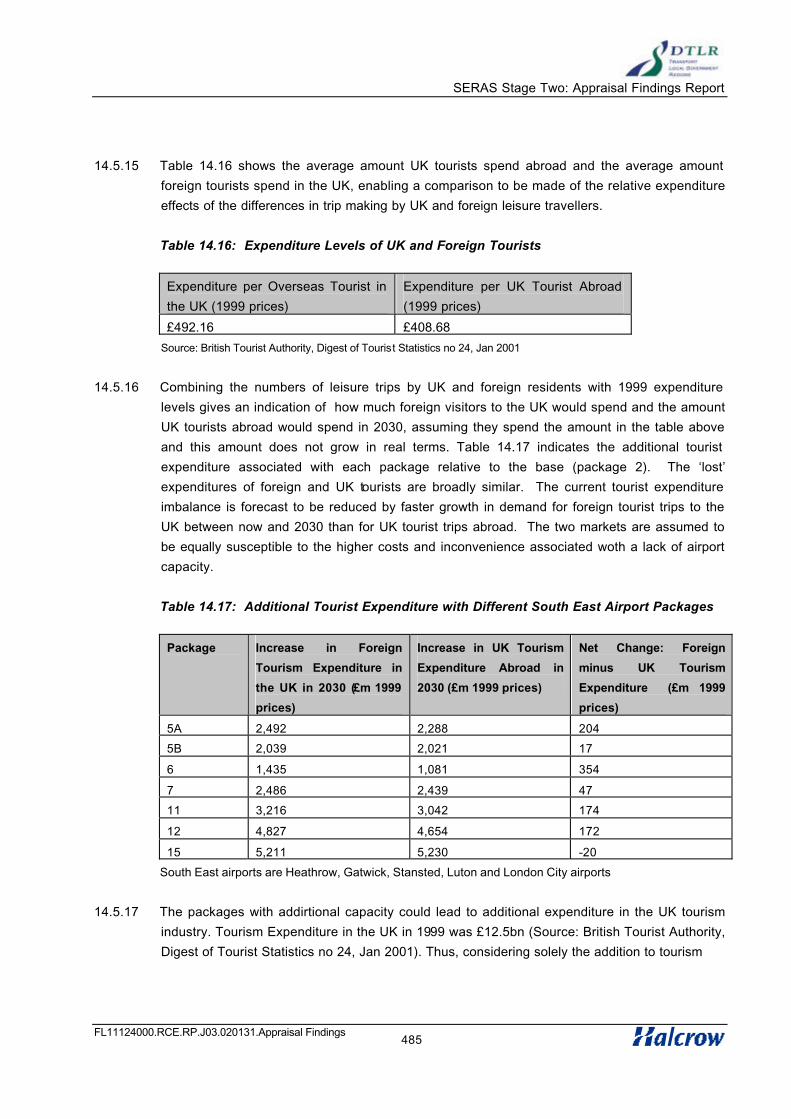
SERAS Stage Two: Appraisal Findings Report
FL11124000.RCE.RP.J03.020131.Appraisal Findings485
14.5.15 Table 14.16 shows the average amount UK tourists spend abroad and the average amount
foreign tourists spend in the UK, enabling a comparison to be made of the relative expenditure
effects of the differences in trip making by UK and foreign leisure travellers.
Table 14.16: Expenditure Levels of UK and Foreign Tourists
Expenditure per Overseas Tourist in
the UK (1999 prices)
Expenditure per UK Tourist Abroad
(1999 prices)
£492.16 £408.68
Source: British Tourist Authority, Digest of Tourist Statistics no 24, Jan 2001
14.5.16 Combining the numbers of leisure trips by UK and foreign residents with 1999 expenditure
levels gives an indication of how much foreign visitors to the UK would spend and the amount
UK tourists abroad would spend in 2030, assuming they spend the amount in the table above
and this amount does not grow in real terms. Table 14.17 indicates the additional tourist
expenditure associated with each package relative to the base (package 2). The ‘lost’
expenditures of foreign and UK tourists are broadly similar. The current tourist expenditure
imbalance is forecast to be reduced by faster growth in demand for foreign tourist trips to the
UK between now and 2030 than for UK tourist trips abroad. The two markets are assumed to
be equally susceptible to the higher costs and inconvenience associated woth a lack of airport
capacity.
Table 14.17: Additional Tourist Expenditure with Different South East Airport Packages
Package Increase in Foreign
Tourism Expenditure in
the UK in 2030 (£m 1999
prices)
Increase in UK Tourism
Expenditure Abroad in
2030 (£m 1999 prices)
Net Change: Foreign
minus UK Tourism
Expenditure (£m 1999
prices)
5A 2,492 2,288 204
5B 2,039 2,021 17
6 1,435 1,081 354
7 2,486 2,439 47
11 3,216 3,042 174
12 4,827 4,654 172
15 5,211 5,230 -20
South East airports are Heathrow, Gatwick, Stansted, Luton and London City airports
14.5.17 The packages with addirtional capacity could lead to additional expenditure in the UK tourism
industry. Tourism Expenditure in the UK in 1999 was £12.5bn (Source: British Tourist Authority,
Digest of Tourist Statistics no 24, Jan 2001). Thus, considering solely the addition to tourism
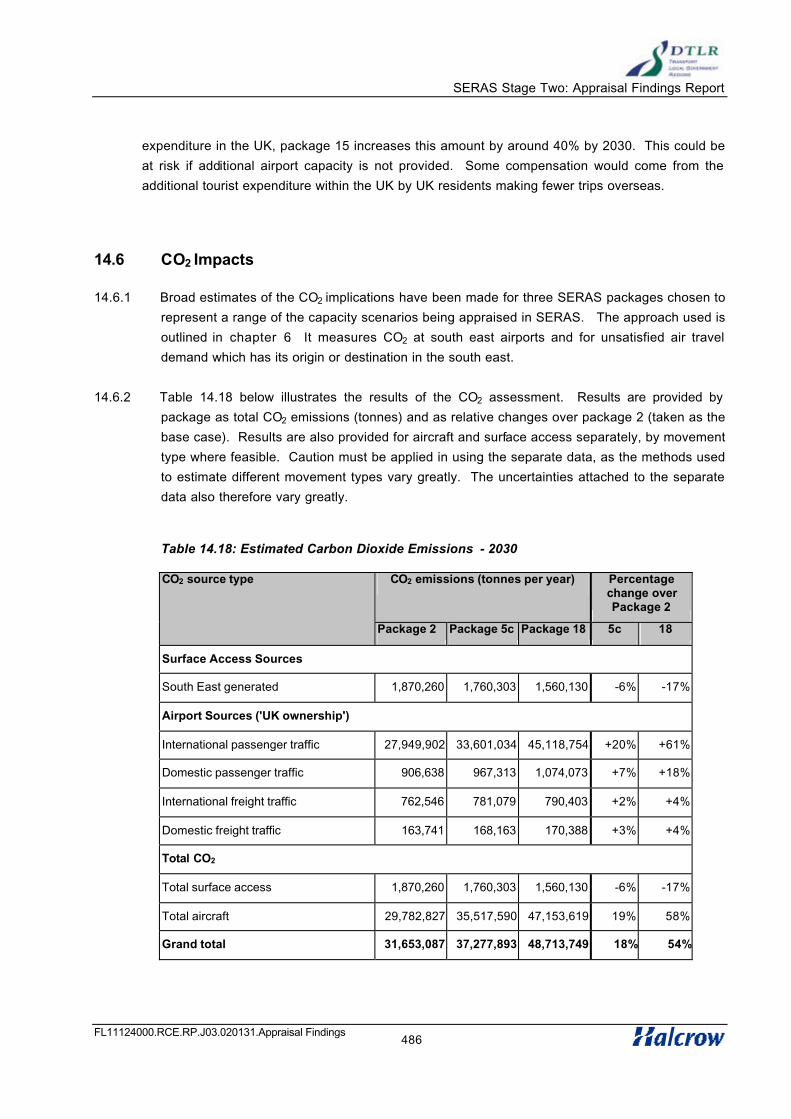
SERAS Stage Two: Appraisal Findings Report
FL11124000.RCE.RP.J03.020131.Appraisal Findings486
expenditure in the UK, package 15 increases this amount by around 40% by 2030. This could be
at risk if additional airport capacity is not provided. Some compensation would come from the
additional tourist expenditure within the UK by UK residents making fewer trips overseas.
14.6 CO2 Impacts
14.6.1 Broad estimates of the CO2 implications have been made for three SERAS packages chosen to
represent a range of the capacity scenarios being appraised in SERAS. The approach used is
outlined in chapter 6. It measures CO2 at south east airports and for unsatisfied air travel
demand which has its origin or destination in the south east.
14.6.2 Table 14.18 below illustrates the results of the CO2 assessment. Results are provided by
package as total CO2 emissions (tonnes) and as relative changes over package 2 (taken as the
base case). Results are also provided for aircraft and surface access separately, by movement
type where feasible. Caution must be applied in using the separate data, as the methods used
to estimate different movement types vary greatly. The uncertainties attached to the separate
data also therefore vary greatly.
Table 14.18: Estimated Carbon Dioxide Emissions - 2030
CO2 emissions (tonnes per year) Percentagechange over Package 2
CO2 source type
Package 2 Package 5c Package 18 5c 18
Surface Access Sources
South East generated 1,870,260 1,760,303 1,560,130 -6% -17%
Airport Sources ('UK ownership')
International passenger traffic 27,949,902 33,601,034 45,118,754 +20% +61%
Domestic passenger traffic 906,638 967,313 1,074,073 +7% +18%
International freight traffic 762,546 781,079 790,403 +2% +4%
Domestic freight traffic 163,741 168,163 170,388 +3% +4%
Total CO2
Total surface access 1,870,260 1,760,303 1,560,130 -6% -17%
Total aircraft 29,782,827 35,517,590 47,153,619 19% 58%
Grand total 31,653,087 37,277,893 48,713,749 18% 54%

SERAS Stage Two: Appraisal Findings Report
FL11124000.RCE.RP.J03.020131.Appraisal Findings487
14.6.3 Package 2 is the base case with maximum use of the existing runways, but no new runways.
Package 5C adds a new runway at Heathrow and is a middle range capacity scenario. Package
18 is a large capacity scenario adding a new runway at Heathrow and two new runways at
Gatwick.
14.6.4 Results show that as airport capacity increases, the overall CO2 burden from SERAS increases.
This effect is dominated by aircraft emissions (including ground-based emissions). For aircraft
emissions freight remains a very small proportion of the total CO2 emissions. For passenger
aircraft, domestic and international-related CO2 increases with capacity. Emissions from
international passenger aircraft are larger (primarily because of cruise distance emissions), and
also exhibit larger relative increases of 20% to over 60% compared to the base. Only 50% of
total emissions from international flights from SERAS airports have been counted as being
attributable to UK policy.
14.6.5 Overall, surface access impacts reduce as capacity increases. This is because surface access
CO2 is dominated by displaced movements. In capacity-constrained scenarios, more
passengers would travel between the South East and regional airports rather than flying direct
from the South East. CO2 results for such displaced movements must be interpreted with
caution given the limited data available to gauge displacement -related emissions. Leaving
displaced movements aside, surface access emissions of CO2 exhibit little change between
packages.
14.7 Runway Size Sensitivity Tests
Options E4, E6 and E8 at Heathrow
14.7.1 Options E4, E6 and E8 each add an additional runway at Heathrow (modelled as single
additional runways in packages 5B, 5A and 5C respectively). The new runways and the way in
which new and existing runways are used differ between options, giving different capacities.
The costs of the options differ. The key characteristics of the options are summarised in Table
14.19.
Table 14.19: Key Characteristics of Runway Options E4, E6 and E8 at Heathrow
Option E4 Option E6 Option E8
ATM capacity 655,000 754,000 638,000
Passenger capacity, mppa 112 128 121
Capital cost, £ billion 4.0 5.1 5.1
Capital cost per mppa of additional
capacity, £ million
153 123 146

SERAS Stage Two: Appraisal Findings Report
FL11124000.RCE.RP.J03.020131.Appraisal Findings488
14.7.2 Option E4 has the lowest capacity and is the cheapest to build. Option E6 has the lowest cost
per unit of additional capacity since it maximises capacity through full mixed mode operation on
the exisiting runways.
14.7.3 The principal demand forecasts associated with these options, in packages 5A, 5B and 5C, are
summarised in Table 14.20.
Table 14.20: Demand Forecasts for Packages 5A, 5B and 5C, mppa
2011 2015 2020 2025 2030
Option E6 (Package 5A)SE Airports Heathrow 106 131 131 130 130
Other SE airports1 69 72 85 94 105Regional Airports 106 125 154 189 205Passengers Lost to UK System
7 7 32 41 61
Option E4 (Package 5B)SE Airports Heathrow 109 114 116 115 115
Other SE airports1 69 75 88 105 112Regional Airports 104 128 157 187 211Passengers Lost to UK System
6 18 41 47 63
Option E8 (Package 5C)SE Airports Heathrow 105 110 118 121 125
Other SE airports1 69 77 89 101 113Regional Airports 106 128 155 186 208Passengers Lost to UK System
8 20 40 46 55
1 Other south east airports are Gatwick, Stansted, Luton, London City, Southampton and Norwich
14.7.4 Package 5A (Option E6) has the highest capacity at Heathrow and that capacity is fully utilised.
There is more use made of other south east airports, principally Luton, with the lower capacity
Heathrow options and more passengers are lost to the UK airport system. A little more use is
made of regional airportsTowards the end of the forecasting period the differences between
options are less clear-cut as unconstrained demand for south east airports exceeds the
capacity provided in any package.
14.7.5 The economic performance of the three packages is summarised in Table 14.21.
Table 14.21: Economic Impacts of Packages 5A, 5B and 5C, £ million
Package PV costs PV benefits Net
benefits
Benefit:cost
ratio
Net benefit per
mppa of additional
capacity
5A 3,168 8,609 5,442 2.72 130
5B 2,406 5,321 2,916 2.21 112

SERAS Stage Two: Appraisal Findings Report
FL11124000.RCE.RP.J03.020131.Appraisal Findings489
5C 3,101 6,254 3,154 2.02 90
14.7.6 Package 5A (Option E6) generates the highest net benefit, the highest benefit:cost ratio and the
highest net benefit per mppa of additional capacity provided. It does this in part by maximising
the use of the existing and new runways at little extra cost through mixed mode operation and
by the provision of a lower-cost short runway.
14.7.7 The principal indicators of the financial performance of the three options are summarised in
Table 14.22. Package 5A (Option E6) has the highest IRR, at 7.1% assuming no increase in
real terms in charges at Heathrow.
Table 14.22: Principal Financial Indicators for Packages 5A, 5B and 5C
Package NPV IRR
5A -1,080 7.1
5B -887 6.3
5C -1,304 5.9
Packages 15 and 16 with Options E4 and E6 at Heathrow
14.7.8 The core tests of packages 15 and 16 include Option E6 at Heathrow: tests have been run that
substitute Option E4 for E6. The effects on demand met at south east airports is summarised in
Table 14.23.
Table 14.23: Packages 15 and 16 with Option E4: Demand Forecasts
2016 2020 2025 2030
Package 15 (Option E6)SE Airports Heathrow 132 132 126 131
Other SE airports1 74 96 134 156Regional Airports 130 153 176 194Passengers Lost to UK System 11 21 18 20
Package 15 (Option E4)SE Airports Heathrow 116 115 116 116
Other SE airports1 77 100 141 160Regional Airports 134 154 177 199Passengers Lost to UK System 20 33 20 26
Package 16 (Option E6)SE Airports Heathrow 132 130 132 132
Other SE airports1 74 106 129 149Regional Airports 130 151 175 198Passengers Lost to UK System 11 15 18 22
Package 16 (Option E4)SE Airports Heathrow 116 116 116 116
Other SE airports1 77 118 142 159

SERAS Stage Two: Appraisal Findings Report
FL11124000.RCE.RP.J03.020131.Appraisal Findings490
2016 2020 2025 2030
Regional Airports 134 151 178 200Passengers Lost to UK System 20 17 18 26
1 Other south east airports are Gatwick, Stansted, Luton, London City, Southampton and Norwich
14.7.9 The lower capacity available with Option E4 rather than Option E6 leads to more use of other
south east airports, more use of regional airports and more passengers being lost to the UK
airports system. By 2030, with Package 15, when additional runways are also provided at
Gatwick and Stansted, these three responses are are similar: there are 4 mppa more using
other south east airports, 5 mppa more using regional airports and 6 mppa more lost to the UK
airports system. With Package 16, which adds more capacity at other south east airports than
Package 15, 10 mppa more use other south east airports, only 2 mppa more use regional
airports and 4 mppa more are lost to the UK airports system.
14.7.10 The economic results of these packages are summarised in Table 14.24.
Table 14.24: Economic Results of Packages with Options E4 and E6 at Heathrow , £
million
Package PV costs PV benefits Net
benefits
Benefit:cost
ratio
Net benefit per
mppa of additional
capacity
15 (E6) 4,966 17,428 12,463 3.51 119
15 (E4) 4,302 14,305 10,004 3.33 113
16 (E6) 5,103 17,528 12,425 3.44 114
16 (E4) 4,432 14,177 9,745 3.20 105
14.7.11 Option E4 reduces costs by approaching £700 million compared to E6, but the lower capacity
means that benefits are reduced substantially, by over £3,000 million. The versions with Option
E4 therefore have lower benefit:cost ratios and lower benefits per unit of capacity provided than
the E6 versions.
14.7.12 The principal financial indicators of incorporating Option E4 rather than E6 in packages are
summarised in Table 14.25. Option E6 generates a higher IRR than Option E4. There is no
clear, sigificant effect on the IRRs of subsequent runways of substituting one Heathrow runway
for another.
Table 14.25: Financial Results of Packages with Options E4 and E6 at Heathrow, £ million
Package Option E6 Option E4
NPV IRR % NPV IRR %
15 LHR E6 -1,085 7.1 LHR E4 -891 6.3
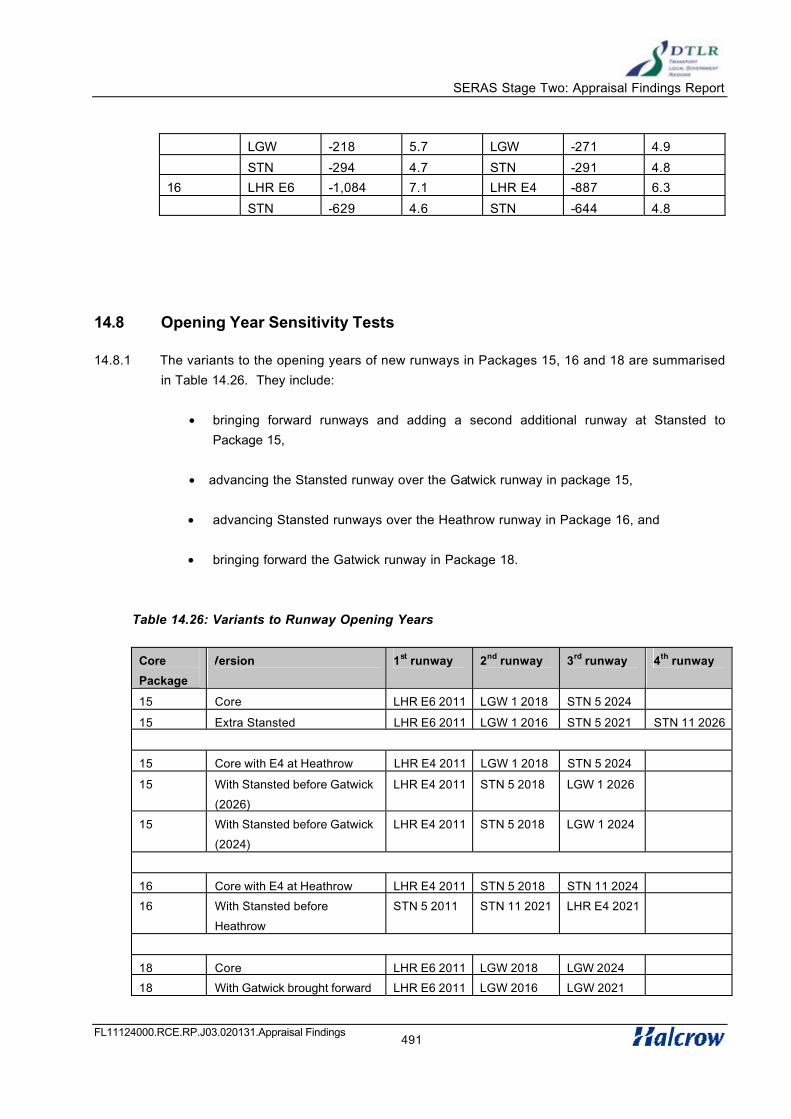
SERAS Stage Two: Appraisal Findings Report
FL11124000.RCE.RP.J03.020131.Appraisal Findings491
LGW -218 5.7 LGW -271 4.9
STN -294 4.7 STN -291 4.8
16 LHR E6 -1,084 7.1 LHR E4 -887 6.3
STN -629 4.6 STN -644 4.8
14.8 Opening Year Sensitivity Tests
14.8.1 The variants to the opening years of new runways in Packages 15, 16 and 18 are summarised
in Table 14.26. They include:
• bringing forward runways and adding a second additional runway at Stansted to
Package 15,
• advancing the Stansted runway over the Gatwick runway in package 15,
• advancing Stansted runways over the Heathrow runway in Package 16, and
• bringing forward the Gatwick runway in Package 18.
Table 14.26: Variants to Runway Opening Years
Core
Package
Version 1st runway 2nd runway 3rd runway 4th runway
15 Core LHR E6 2011 LGW 1 2018 STN 5 2024
15 Extra Stansted LHR E6 2011 LGW 1 2016 STN 5 2021 STN 11 2026
15 Core with E4 at Heathrow LHR E4 2011 LGW 1 2018 STN 5 2024
15 With Stansted before Gatwick
(2026)
LHR E4 2011 STN 5 2018 LGW 1 2026
15 With Stansted before Gatwick
(2024)
LHR E4 2011 STN 5 2018 LGW 1 2024
16 Core with E4 at Heathrow LHR E4 2011 STN 5 2018 STN 11 2024
16 With Stansted before
Heathrow
STN 5 2011 STN 11 2021 LHR E4 2021
18 Core LHR E6 2011 LGW 2018 LGW 2024
18 With Gatwick brought forward LHR E6 2011 LGW 2016 LGW 2021
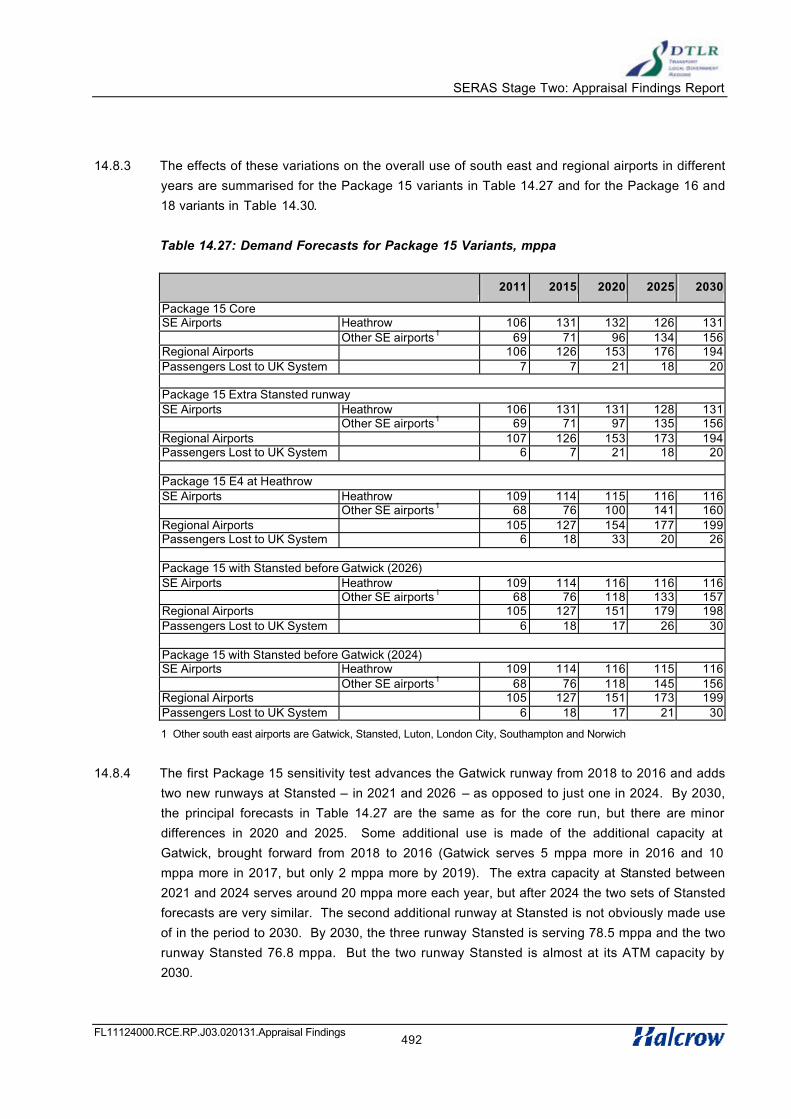
SERAS Stage Two: Appraisal Findings Report
FL11124000.RCE.RP.J03.020131.Appraisal Findings492
14.8.3 The effects of these variations on the overall use of south east and regional airports in different
years are summarised for the Package 15 variants in Table 14.27 and for the Package 16 and
18 variants in Table 14.30.
Table 14.27: Demand Forecasts for Package 15 Variants, mppa
2011 2015 2020 2025 2030
Package 15 CoreSE Airports Heathrow 106 131 132 126 131
Other SE airports1 69 71 96 134 156Regional Airports 106 126 153 176 194Passengers Lost to UK System 7 7 21 18 20
Package 15 Extra Stansted runwaySE Airports Heathrow 106 131 131 128 131
Other SE airports1 69 71 97 135 156Regional Airports 107 126 153 173 194Passengers Lost to UK System 6 7 21 18 20
Package 15 E4 at Heathrow SE Airports Heathrow 109 114 115 116 116
Other SE airports1 68 76 100 141 160Regional Airports 105 127 154 177 199Passengers Lost to UK System 6 18 33 20 26
Package 15 with Stansted before Gatwick (2026)SE Airports Heathrow 109 114 116 116 116
Other SE airports1 68 76 118 133 157Regional Airports 105 127 151 179 198Passengers Lost to UK System 6 18 17 26 30
Package 15 with Stansted before Gatwick (2024)SE Airports Heathrow 109 114 116 115 116
Other SE airports1 68 76 118 145 156Regional Airports 105 127 151 173 199Passengers Lost to UK System 6 18 17 21 30
1 Other south east airports are Gatwick, Stansted, Luton, London City, Southampton and Norwich
14.8.4 The first Package 15 sensitivity test advances the Gatwick runway from 2018 to 2016 and adds
two new runways at Stansted – in 2021 and 2026 – as opposed to just one in 2024. By 2030,
the principal forecasts in Table 14.27 are the same as for the core run, but there are minor
differences in 2020 and 2025. Some additional use is made of the additional capacity at
Gatwick, brought forward from 2018 to 2016 (Gatwick serves 5 mppa more in 2016 and 10
mppa more in 2017, but only 2 mppa more by 2019). The extra capacity at Stansted between
2021 and 2024 serves around 20 mppa more each year, but after 2024 the two sets of Stansted
forecasts are very similar. The second additional runway at Stansted is not obviously made use
of in the period to 2030. By 2030, the three runway Stansted is serving 78.5 mppa and the two
runway Stansted 76.8 mppa. But the two runway Stansted is almost at its ATM capacity by
2030.

SERAS Stage Two: Appraisal Findings Report
FL11124000.RCE.RP.J03.020131.Appraisal Findings493
14.8.5 The economic results are summarised in Table 14.28. Advancing runway capacity adds more
to benefits than it does to costs. Costs increase by around £700 million and benefits by around
£1,700 million, so net benefits increase by around £1,000 million.
Table 14.28: Economic Results of Package 15 with Additional Stansted Runway, £
million
Package PV costs PV
benefits
Net
benefits
Benefit:cost
ratio
Net benefit per mppa
of additional capacity
15 4,966 17,428 12,463 3.51 119
15 extra STN
runway
5,682 19,106 13,424 3.36 108
14.8.6 The second Package 15 sensitivity test adds a runway at Stansted rather than Gatwick as the
second runway in 2018 and defers the Gatwick runway to either 2026 or 2024. The same
runways are included in each test but at different times. By 2030, the major forecasts are very
similar, with 272 to 276 mppa using Heathrow and other south east airports and 198 to 199
mppa using regional airports. The second Stansted runway adds more capacity than the
second Gatwick runway so that, in 2020, 234 mppa are using south east airports in the
sensitivity test compared with 215 mppa in the core version.
14.8.7 The economic results are summarised in Table 14.29. Net benefits are highest with the
Stansted runway brought forward to 2018 and the Gatwick runway introduced in 2024.
Table 14.29: Economic Results of Package 15 (Option E4 at Heathrow) with Stansted
Runway Advanced, £ million
Package PV costs PV
benefits
Net
benefits
Benefit:cost
ratio
Net benefit per mppa
of additional capacity
Package 15 (E4)
4,302 14,305 10,004 3.33 113
Package 15 (E4) with STN runway advanced to 2018 and LGW runway in 2026
4,353 13,854 9,501 3.18 107
Package 15 (E4) with STN runway advanced to 2018 and LGW runway in 2024
4,409 14,574 10,165 3.31 115
14.8.8 The Package 16 variant brings forward the Stansted runways (from 2018 and 2024 to 2011 and
2021) and defers the Heathrow runway (Option E4) from 2011 to 2021, to allow airlines and the
airport operator more time to achieve the noise and air quality measures that may be needed to
support an additional runway at Heathrow. The Package 18 variant brings forward the two
Gatwick runways, from 2018 and 2014 to 2016 and 2021. The forecasts are summarised in
Table 14.30.

SERAS Stage Two: Appraisal Findings Report
FL11124000.RCE.RP.J03.020131.Appraisal Findings494
Table 14.30: Demand Forecasts for Package 16 and 18 Variants, mppa
2011 2015 2020 2025 2030
Package 16 E4 at HeathrowSE Airports Heathrow 109 114 116 116 116
Other SE airports1 68 76 118 142 159Regional Airports 105 127 151 178 200Passengers Lost to UK System 6 18 17 18 26
Package 16 Stansted before HeathrowSE Airports Heathrow 72 73 87 115 116
Other SE airports1 95 115 129 152 163Regional Airports 108 126 152 171 193Passengers Lost to UK System 13 21 34 16 29
Package 18 Core SE Airports Heathrow 106 131 128 131 131
Other SE airports1 69 71 105 131 155Regional Airports 106 126 152 177 199Passengers Lost to UK System 7 7 17 15 16
Package 18 with Gatwick brought forwardSE Airports Heathrow 106 131 132 128 131
Other SE airports1 69 71 105 134 155Regional Airports 107 126 151 177 199Passengers Lost to UK System 6 7 14 15 16
1 Other south east airports are Gatwick, Stansted, Luton, London City, Southampton and Norwich
14.8.9 Bringing forward the Stansted runway instead of the Heathrow runway in Package 16 leads to
fewer passengers using south east airports 2011, 2015 and 2020. The numbers of passengers
using regional airports does not increase, but more passengers are lost to the UK airports
system. More use is made of the advanced Gatwick runways in Package 18, particularly
between 2016 and 2018. In 2017, there are some 10 mppa more passengers at Gatwick, modt
of whom would either use other south east airports or not travel by air without this extra
capacity.
14.8.10 The economic results of these tests are summarised in Table 14.31. Deferring the Heathrow
runway and advancing the Stansted runways in Package 16 reduces benefit but reduces costs
by a greater amount, thereby increasing net benefit. Advancing the Gatwick runways in
Package 18 also increases net benefit.
Table 14.31: Economic Results of Variants to Packages 16 and 18, £ million
Package PV costs PV
benefits
Net
benefits
Benefit:cost
ratio
Net benefit per mppa
of additional capacity
Package 16
4,432 14,177 9,745 3.20 105
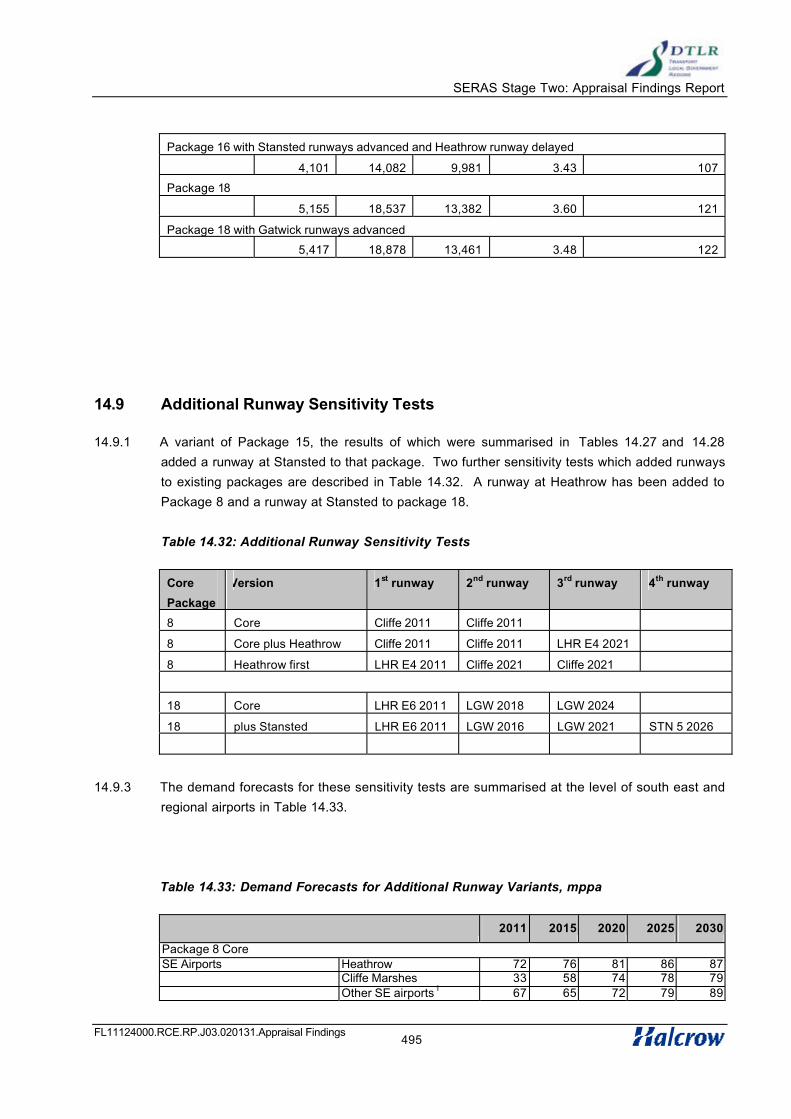
SERAS Stage Two: Appraisal Findings Report
FL11124000.RCE.RP.J03.020131.Appraisal Findings495
Package 16 with Stansted runways advanced and Heathrow runway delayed
4,101 14,082 9,981 3.43 107
Package 18
5,155 18,537 13,382 3.60 121
Package 18 with Gatwick runways advanced
5,417 18,878 13,461 3.48 122
14.9 Additional Runway Sensitivity Tests
14.9.1 A variant of Package 15, the results of which were summarised in Tables 14.27 and 14.28
added a runway at Stansted to that package. Two further sensitivity tests which added runways
to existing packages are described in Table 14.32. A runway at Heathrow has been added to
Package 8 and a runway at Stansted to package 18.
Table 14.32: Additional Runway Sensitivity Tests
Core
Package
Version 1st runway 2nd runway 3rd runway 4th runway
8 Core Cliffe 2011 Cliffe 2011
8 Core plus Heathrow Cliffe 2011 Cliffe 2011 LHR E4 2021
8 Heathrow first LHR E4 2011 Cliffe 2021 Cliffe 2021
18 Core LHR E6 2011 LGW 2018 LGW 2024
18 plus Stansted LHR E6 2011 LGW 2016 LGW 2021 STN 5 2026
14.9.3 The demand forecasts for these sensitivity tests are summarised at the level of south east and
regional airports in Table 14.33.
Table 14.33: Demand Forecasts for Additional Runway Variants, mppa
2011 2015 2020 2025 2030
Package 8 CoreSE Airports Heathrow 72 76 81 86 87
Cliffe Marshes 33 58 74 78 79Other SE airports1 67 65 72 79 89
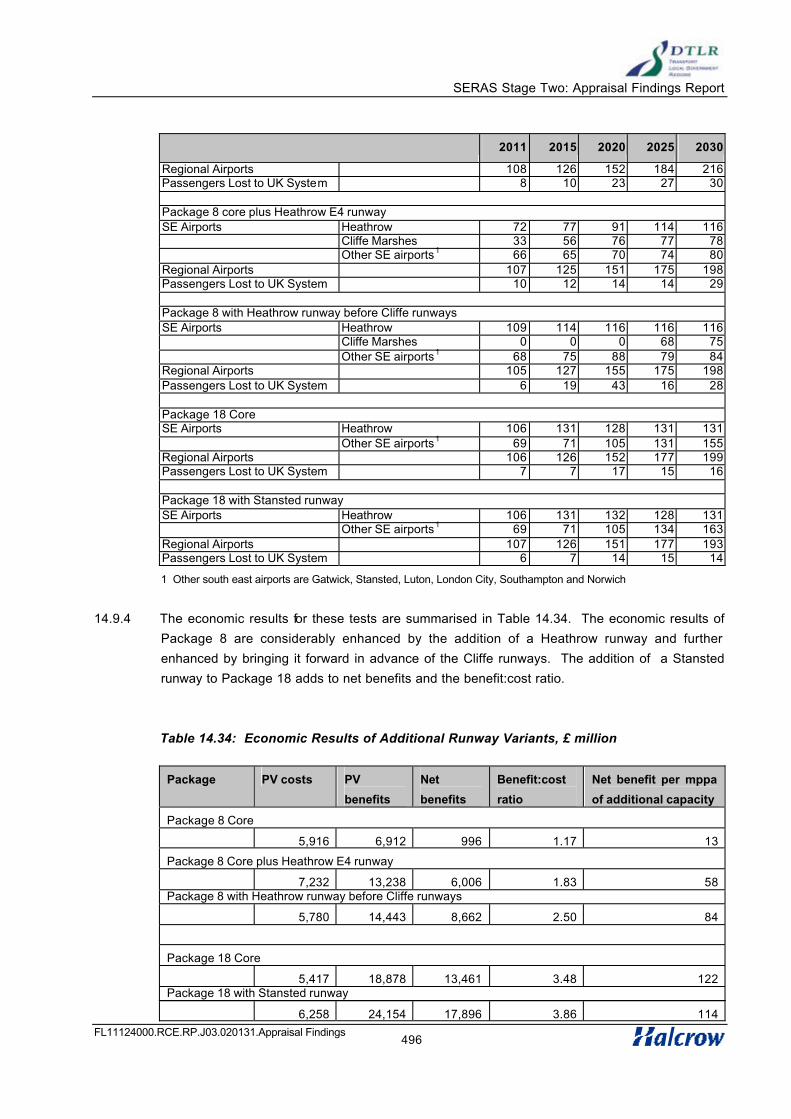
SERAS Stage Two: Appraisal Findings Report
FL11124000.RCE.RP.J03.020131.Appraisal Findings496
2011 2015 2020 2025 2030
Regional Airports 108 126 152 184 216Passengers Lost to UK System 8 10 23 27 30
Package 8 core plus Heathrow E4 runwaySE Airports Heathrow 72 77 91 114 116
Cliffe Marshes 33 56 76 77 78Other SE airports1 66 65 70 74 80
Regional Airports 107 125 151 175 198Passengers Lost to UK System 10 12 14 14 29
Package 8 with Heathrow runway before Cliffe runways SE Airports Heathrow 109 114 116 116 116
Cliffe Marshes 0 0 0 68 75Other SE airports1 68 75 88 79 84
Regional Airports 105 127 155 175 198Passengers Lost to UK System 6 19 43 16 28
Package 18 CoreSE Airports Heathrow 106 131 128 131 131
Other SE airports1 69 71 105 131 155Regional Airports 106 126 152 177 199Passengers Lost to UK System 7 7 17 15 16
Package 18 with Stansted runwaySE Airports Heathrow 106 131 132 128 131
Other SE airports1 69 71 105 134 163Regional Airports 107 126 151 177 193Passengers Lost to UK System 6 7 14 15 14
1 Other south east airports are Gatwick, Stansted, Luton, London City, Southampton and Norwich
14.9.4 The economic results for these tests are summarised in Table 14.34. The economic results of
Package 8 are considerably enhanced by the addition of a Heathrow runway and further
enhanced by bringing it forward in advance of the Cliffe runways. The addition of a Stansted
runway to Package 18 adds to net benefits and the benefit:cost ratio.
Table 14.34: Economic Results of Additional Runway Variants, £ million
Package PV costs PV
benefits
Net
benefits
Benefit:cost
ratio
Net benefit per mppa
of additional capacity
Package 8 Core
5,916 6,912 996 1.17 13
Package 8 Core plus Heathrow E4 runway
7,232 13,238 6,006 1.83 58Package 8 with Heathrow runway before Cliffe runways
5,780 14,443 8,662 2.50 84
Package 18 Core
5,417 18,878 13,461 3.48 122Package 18 with Stansted runway
6,258 24,154 17,896 3.86 114

SERAS Stage Two: Appraisal Findings Report
FL11124000.RCE.RP.J03.020131.Appraisal Findings497
14.10 Seeding Sensitivity Tests
14.10.1 The core versions of the forecasting model runs for packages containing options at Cliffe or
large developments at Stansted were seeded with air services as described in Chapter 6 and in
the relevant airport chapters – 9 and 11. As indicated in Table 14.35, the practice of seeding
encourages the build-up of forecast traffic at the seeded airport to be faster than it otherwise be.
Unseeded Cliffe options reach around 72 mppa by 2030, but with seeding the forecast
increases to 110 mppa. At Stansted, where the seeding was less, the effect of seeding the
largest option in Package 14 is to increase use of the aiport from 115 mppa to 122 mppa.
Table 14.35: Comparison of Seeded and Unseeded Passenger Forecasts, mppa
Year Stansted Cliffe
Package 7 Package 14 Package 8 Package 21
Unseeded Seeded Unseeded Seeded Unseeded Seeded Unseeded Seeded
2011 30.3 47.4 30.7 47.8 8.0 33.0 8.0 33.0
2015 45.7 64.3 46.0 64.2 31.0 58.4 31.1 58.4
2020 57.0 68.8 78.3 90.0 46.7 74.0 46.9 74.0
2025 60.8 71.7 99.6 115.4 58.7 78.1 60.5 104.2
2030 62.8 74.4 114.9 121.5 70.4 79.4 71.8 109.7
14.10.2 The wider effects of seeding forecasts, on forecast use of south east airports and regional
airports is summarised in Table 14.36.
Table 14.36: Effects of Seeding on Demand Forecasts, mppa
2011 2015 2020 2025 2030
Package 7 UnseededSE Airports 157 179 206 221 235Regional Airports 112 132 157 187 210Passengers Lost to UK System 19 24 39 46 56
Package 7 SeededSE Airports 168 189 210 225 240Regional Airports 108 127 155 197 207Passengers Lost to UK System 12 19 37 32 54
Package 8 Unseeded
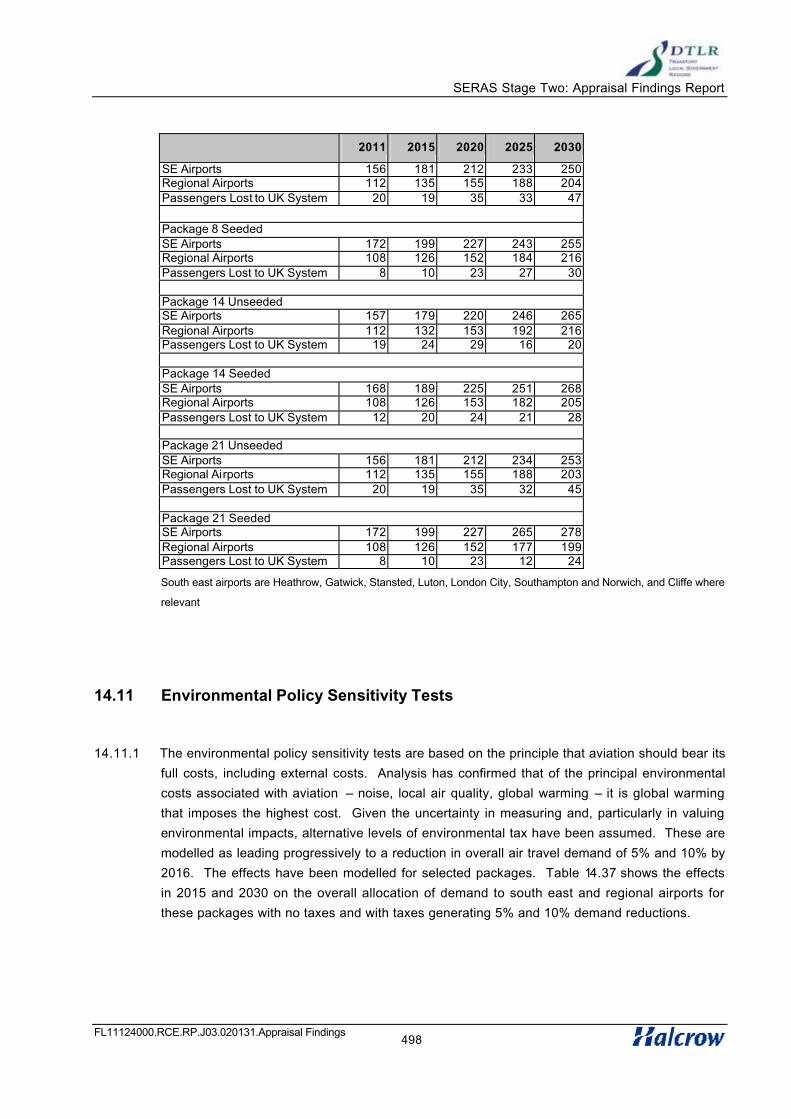
SERAS Stage Two: Appraisal Findings Report
FL11124000.RCE.RP.J03.020131.Appraisal Findings498
2011 2015 2020 2025 2030
SE Airports 156 181 212 233 250Regional Airports 112 135 155 188 204Passengers Lost to UK System 20 19 35 33 47
Package 8 SeededSE Airports 172 199 227 243 255Regional Airports 108 126 152 184 216Passengers Lost to UK System 8 10 23 27 30
Package 14 UnseededSE Airports 157 179 220 246 265Regional Airports 112 132 153 192 216Passengers Lost to UK System 19 24 29 16 20
Package 14 SeededSE Airports 168 189 225 251 268Regional Airports 108 126 153 182 205Passengers Lost to UK System 12 20 24 21 28
Package 21 UnseededSE Airports 156 181 212 234 253Regional Airports 112 135 155 188 203Passengers Lost to UK System 20 19 35 32 45
Package 21 SeededSE Airports 172 199 227 265 278Regional Airports 108 126 152 177 199Passengers Lost to UK System 8 10 23 12 24
South east airports are Heathrow, Gatwick, Stansted, Luton, London City, Southampton and Norwich, and Cliffe where
relevant
14.11 Environmental Policy Sensitivity Tests
14.11.1 The environmental policy sensitivity tests are based on the principle that aviation should bear its
full costs, including external costs. Analysis has confirmed that of the principal environmental
costs associated with aviation – noise, local air quality, global warming – it is global warming
that imposes the highest cost. Given the uncertainty in measuring and, particularly in valuing
environmental impacts, alternative levels of environmental tax have been assumed. These are
modelled as leading progressively to a reduction in overall air travel demand of 5% and 10% by
2016. The effects have been modelled for selected packages. Table 14.37 shows the effects
in 2015 and 2030 on the overall allocation of demand to south east and regional airports for
these packages with no taxes and with taxes generating 5% and 10% demand reductions.

SERAS Stage Two: Appraisal Findings Report
FL11124000.RCE.RP.J03.020131.Appraisal Findings499
Table 14.37: Effects of Environmental Policy Tests on Demand Forecasts, mppa
2015 2030
0% 5% 10% 0% 5% 10%
Unconstrained demandSE Airports 206 196 186 306 291 276Regional Airports 129 122 115 195 185 175Total unconstrained demand 335 318 301 501 476 451
Package 2SE Airports 163 158 155 198 198 198Regional Airports 134 128 126 230 211 195Passengers Lost to UK System 38 32 20 73 67 58
Package 14SE Airports 189 178 268 257Regional Airports 126 114 205 180Passengers Lost to UK System 20 9 28 14
Package 15 (with Option E4 at Heathrow)SE Airports 190 186 276 267Regional Airports 127 120 199 185Passengers Lost to UK System 18 12 26 24
Package 15 (with Option E6 at Heathrow)SE Airports 202 193 287 274Regional Airports 125 119 194 183Passengers Lost to UK System 7 6 20 19
Package 15 (with Stansted in 2018)SE Airports 190 180 286 268Regional Airports 127 114 192 171Passengers Lost to UK System 18 7 23 12
Package 16 (with Option E4 at Heathrow)SE Airports 190 186 180 275 269 255Regional Airports 127 120 114 200 189 178Passengers Lost to UK System 18 12 7 26 18 18
Package 19SE Airports 183 181 282 272Regional Airports 131 122 198 186Passengers Lost to UK System 21 15 21 18
Package 21SE Airports 199 189 178 278 275 256Regional Airports 126 120 114 198 188 182Passengers Lost to UK System 10 9 9 25 13 13
South east airports are Heathrow, Gatwick, Stansted, Luton, London City, Southampton and Norwich, and Cliffe where
relevant
14.11.2 The results for the constrained Package 2 are that in 2030 south east airports are operating at
capacity and serve 198 mppa whether there is no demand reduction, or 5% or 10% demand
reduction. In this constrained south east scenario, the 10% demand reduction causes a

SERAS Stage Two: Appraisal Findings Report
FL11124000.RCE.RP.J03.020131.Appraisal Findings500
reduction of 35 mppa (15%) in the use of regional airports, of which 13 mppa is accounted for
by reduced overspill from London, the east and south east. There is also a reduction of 15
mppa (21%) in the number of passengers lost to the UK airport system.
14.11.3 In the higher capacity packages (Packages 14, 15, 16 and 21), the 10% demand reduction in
2030 causes a reduction of 11 – 22 mppa in the use of south east airports, a larger reduction of
16 – 25 mppa in the use of regional airports and a reduction of 8 – 14 mppa in the number of
passengers lost to the UK airport system. In percentage terms, the reduction in use of south
east airports in 2030 when overall demand is reduced by 10% ranges between 0% (Package 2),
4% (Package 14) and 8% (Package 21).
14.11.4 Economic appraisal results for a number of the environmental tests are summarised in Table
14.38. The reduction in demand associated with environmental taxes causes a reduction in
benefits and typically a small reduction in costs, as the costs of terminal capacity are pushed
further into the future. Benefit:cost ratios fall with environmental taxes, typically by 0.2 – 0.3
percentage points with a 5% reduction in demand and by 0.4 – 0.5 percentage points with a
10% reduction in demand.
Table 14.38: Economic Results of Environmental Tests, £ million
Package PV costs PV
benefits
Net
benefits
Benefit:cost
ratio
Net benefit per mppa
of additional capacity
Package 14
3,437 11,104 7,667 3.23 82
Package 14: 10% demand reduction
3,380 9,613 6,233 2.84 66
Package 15 (E4 at Heathrow)
4,302 14,305 10,004 3.33 113
Package 15 (E4 at Heathrow): 5% demand reduction
4,137 12,965 8,828 3.13 100
Package 15 (E6 at Heathrow)
4,966 17,428 12,463 3.51 119
Package 15 (E6 at Heathrow): 5% demand reduction
4,975 16,262 11,288 3.27 108
Package 16 (E4 at Heathrow)
4,432 14,177 9,745 3.20 105
Package 16 (E4 at Heathrow): 5% demand reduction
4,382 12,693 8,312 2.90 76
Package 16 (E4 at Heathrow): 10% demand reduction
4,212 11,479 7,267 2.73 78

SERAS Stage Two: Appraisal Findings Report
FL11124000.RCE.RP.J03.020131.Appraisal Findings501
Package 21
7,059 10,595 3,537 1.50 31
Package 21: 5% demand reduction
6,931 9,618 2,687 1.39 24
Package 21: 10% demand reduction
6,732 9,335 2,603 1.39 23

SERAS Stage Two: Appraisal Findings Report
FL11124000.RCE.RP.JO3.020131.AppraisalFindings 527
15 Air Freight
15.1 Introduction
15.1.1 The South East handled 80% of UK air freight in 2000, around 80% of which was carried in the
hold of passenger aircraft. Heathrow is the UK’s largest freight airport, with Gatwick the second
largest. Together these two airports handled 70% of total UK tonnage in 2000. Over 90% of
the freight throughput at Heathrow and Gatwick is carried on passenger aircraft. This proportion
has increased over the last decade as dedicated freighters have been pushed out of Heathrow
and Gatwick due to capacity constraints (freighters tend to be seen as secondary traffic at
capacity-constrained airports as they generate less revenue per movement than passenger
flights). The growth in bellyhold freight, freight carried in the hold of a passenger aircraft, has
followed the growth in long haul passenger traffic, increasing by 85% over the last decade.
Stansted and Luton have few long haul passenger services and so carry very little bellyhold
traffic.
15.1.2 The growth in South East freighter traffic, freight carried on dedicated freighters, has been
concentrated at Stansted, which has experienced a four-fold increase in traffic since 1990. This
reflects the development of a hub for the rapidly developing express parcels market at the
airport. Historic bellyhold and freighter traffic at the main South East airports is shown in Table
15.1.
15.1.3 The remainder of this chapter details the freight forecasts for the development options at each
airport and draws some conclusions. The forecasts are taken from DTLR’s Freight Forecasting
Model. The base year for the freight forecasts is 1998. 2000 actual figures are included in the
text for context. Forecasts are presented separately for bellyhold and freighter traffic and for
2015 and 2030. Further details on the forecasting approach are given in Chapter 6. The
implications of the forecast growth in freight traffic for runway capacity and night-time movement
restrictions in the South East are discussed at the end of the chapter.
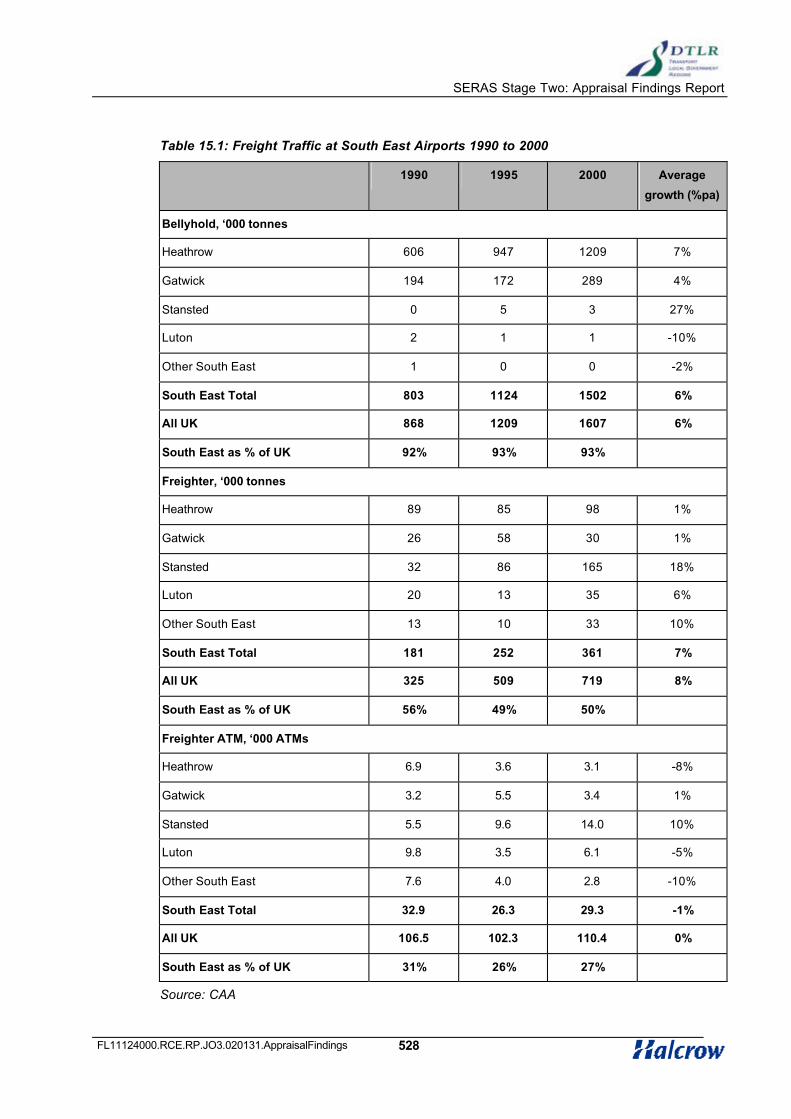
SERAS Stage Two: Appraisal Findings Report
FL11124000.RCE.RP.JO3.020131.AppraisalFindings 528
Table 15.1: Freight Traffic at South East Airports 1990 to 2000
1990 1995 2000 Average
growth (%pa)
Bellyhold, ‘000 tonnes
Heathrow 606 947 1209 7%
Gatwick 194 172 289 4%
Stansted 0 5 3 27%
Luton 2 1 1 -10%
Other South East 1 0 0 -2%
South East Total 803 1124 1502 6%
All UK 868 1209 1607 6%
South East as % of UK 92% 93% 93%
Freighter, ‘000 tonnes
Heathrow 89 85 98 1%
Gatwick 26 58 30 1%
Stansted 32 86 165 18%
Luton 20 13 35 6%
Other South East 13 10 33 10%
South East Total 181 252 361 7%
All UK 325 509 719 8%
South East as % of UK 56% 49% 50%
Freighter ATM, ‘000 ATMs
Heathrow 6.9 3.6 3.1 -8%
Gatwick 3.2 5.5 3.4 1%
Stansted 5.5 9.6 14.0 10%
Luton 9.8 3.5 6.1 -5%
Other South East 7.6 4.0 2.8 -10%
South East Total 32.9 26.3 29.3 -1%
All UK 106.5 102.3 110.4 0%
South East as % of UK 31% 26% 27%
Source: CAA

SERAS Stage Two: Appraisal Findings Report
FL11124000.RCE.RP.JO3.020131.AppraisalFindings 529
15.2 Heathrow
15.2.1 Heathrow handled 1.2 million tonnes of freight in 1998, 1.1 million tonnes of which were
bellyhold. The remaining 100,000 tonnes were carried by 3,300 freighters. By 2000 there has
been a slight increase in total freight throughput to 1.3 million tonnes, but a decline in freighters
to 3,100 movements.
15.2.2 A cap of 3,000 freighter movements has been placed on freighter ATM forecasts to reflect the
increasing marginalisation of freighter traffic at Heathrow.
15.2.3 Under the maximum use of existing runways scenario, freight traffic growth is forecast to
continue, with total freight traffic increasing in line with passenger volumes to 1.7 million tonnes
in 2015 and 2.0 million tonnes in 2030. Freighter traffic is forecast to fall to 2,200 movements in
2015 and 900 movements in 2030 as runway constraints become tighter. A further small
increase in freight traffic is forecast under both partial and full mixed mode operation.
15.2.4 The introduction of a new runway at Heathrow would provide an increase in freight traffic to 2.2
million tonnes in 2015. The growth in freight traffic after 2015 would be less marked. Under
Options E6 and E4 passenger traffic in 2030 would be constrained by terminal capacity, limiting
the growth in bellyhold freight. Under Option E8, passenger traffic would not be terminal-
constrained, allowing bellyhold traffic to increase to 2.4 million tonnes.
15.2.5 Freight forecasts for Heathrow are shown in Table 15.2 and Figure 15.1.
Table 15. 2: Heathrow Freight Traffic Forecasts (‘000 tonnes) and Freighter ATMs (000)
Option Max Use E1 (Partial
mixed
mode)
1 (Full
mixed
mode)
E6 E4 E8
2015 2030 2015 2030 2015 2030 2015 2030 2015 2030 2015 2030
Bellyhold freight (‘000
tonnes)
1541 2004 1602 2105 1729 2206 2111 2204 1941 1985 1894 2403
Freighter (‘000 tonnes) 153 60 177 60 209 64 210 210 210 210 210 84
Total (‘000 tonnes) 1694 2064 1779 2165 1938 2270 2321 2414 2151 2195 2104 2487
Freighter ATMs (‘000) 2.2 0.9 2.5 0.9 3.0 0.9 3.0 3.0 3.0 3.0 3.0 1.2

SERAS Stage Two: Appraisal Findings Report
FL11124000.RCE.RP.JO3.020131.AppraisalFindings 530
Figure 15.1: Heathrow Freight Traffic Forecasts
15.3 Gatwick
15.3.1 Gatwick handled 320,000 tonnes of freight in 2000, 90% of which was bellyhold. The
predominance of bellyhold traffic is expected to continue in the future with freight growing in line
with passenger traffic. By 2015, under the maximum use of the existing runway scenario, freight
traffic at Gatwick is forecast to grow to 380,000 tonnes, 340,000 tonnes of which would be
bellyhold traffic.
15.3.2 Both the new runway options are forecast to increase freight traffic, again driven by growth in
long haul passenger movements. Under Option 1, with close parallel runways, freight traffic is
forecast to grow to 0.4 and 0.6 million tonnes in 2015 and 2030, respectively. The provision of
two new runways under Option E1, is forecast to lead to a further increase in freight to 0.9
million tonnes in 2030, a threefold increase on existing volumes.
15.3.3 A cap of 3,500 ATMs has been assumed on freighter movements at Gatwick to reflect the
impact of increasing passenger movements on available runway capacity. Freighter movements
are not forecast to reach this cap under any of the development options.
0
500
1,000
1,500
2,000
2,500
2015 2030 2015 2015 2015 2030 2015 2030 2015 2030
Tho
usan
d T
onne
s
Freighter
Bellyhold
Max Use Partial Full Option E6 Option E4 Option E8

SERAS Stage Two: Appraisal Findings Report
FL11124000.RCE.RP.JO3.020131.AppraisalFindings 531
15.3.4 Freight forecast for Gatwick are shown in Table 15.3 below. Figure 15.2 illustrates the freight
data graphically.
Table 15.3: Gatwick Freight Traffic Forecasts (‘000 Tonnes) and Freighter ATMs (000)
Option Max Use 1 E1
2015 2030 2015 2030 2030
Bellyhold freight (‘000 tonnes) 339 468 393 564 876
Freighter (‘000 tonnes) 41 62 47 70 70
Total (‘000 tonnes) 380 530 440 634 946
Freighter ATMs (‘000) 0.8 0.9 1.0 1.0 1.0

SERAS Stage Two: Appraisal Findings Report
FL11124000.RCE.RP.JO3.020131.AppraisalFindings 532
Figure 15.2: Gatwick Freight Traffic Forecasts
0
200
400
600
800
1,000
1,200
2015 2030 2015 2030 2030
Tho
usan
d T
onne
s
FreighterBellyhold
Max Use Option 1 Option E1
15.4 Stansted
15.4.1 Stansted is the third largest freight airport in the UK, after Heathrow and Gatwick. Unlike these
two airports the majority of traffic at Stansted is carried on dedicated freighter aircraft. In 2000
Stansted handled 170,000 tonnes of freight, 98% of which was on freighter aircraft.
15.4.2 The freighter movement capacity of Stansted will be a combination of available day and night-
time capacity. Available daytime capacity has been taken from SPASM. SPASM, however,
does not explicitly include night-time movements, when freighter traffic is more prevalent. To
reflect this, the current level of 12,000 night movements a year at Stansted has been added
onto the daytime capacity to give an all day freighter capacity. This has been assumed to
continue into the future.
15.4.3 With the maximum use of the existing runway, Stansted is forecast to handle 0.7 million tonnes
in 2015, overtaking Gatwick as the 2nd largest freight airport in the UK. This growth is forecast to
continue after 2015, with freight traffic reaching 2.2 million tonnes in 2030. The majority of the
traffic growth at Stansted is expected to come from the express freight sector.

SERAS Stage Two: Appraisal Findings Report
FL11124000.RCE.RP.JO3.020131.AppraisalFindings 533
15.4.4 The construction of new runways at Stansted would not only provide additional space for
freighters but is forecast to lead to the development of a number of scheduled long haul
services. This would lead to a large increas e in bellyhold traffic. Under Option 5, freight traffic is
forecast to grow to 1.8 and 2.8 million tonnes in 2015 and 2030, around a third of which would
be bellyhold. Bellyhold and total freight traffic is forecast to increase still further, to around 3
million tonnes under the 3 and 4 runway option scenarios.
15.4.5 Stansted freight forecasts are shown in Table 15.4 below. Figure 15.3 illustrates the forecasts
graphically.
Table 15.4: Stansted Freight Traffic Forecasts (‘000 Tonnes) and Freighter ATMs (‘000)
Option Max Use 5 7 11
2015 2030 2015 2030 2030 2030
Bellyhold freight (‘000
tonnes)
5 4 674 911 1377 1093
Freighter (‘000 tonnes) 664 2274 1142 1848 1814 1718
Total (‘000 tonnes) 669 2278 1816 2759 3191 2811
Freighter ATMs (‘000) 18.2 40.0 31.3 32.5 31.9 30.2
Figure 15.3: Stansted Freight Traffic Forecasts
0
500
1,000
1,500
2,000
2,500
3,000
3,500
2015 2030 2015 2030 2030 2030
Thou
sand
Ton
nes
Freighter
Bellyhold
Max Use Option 5 Option 7 Option 11
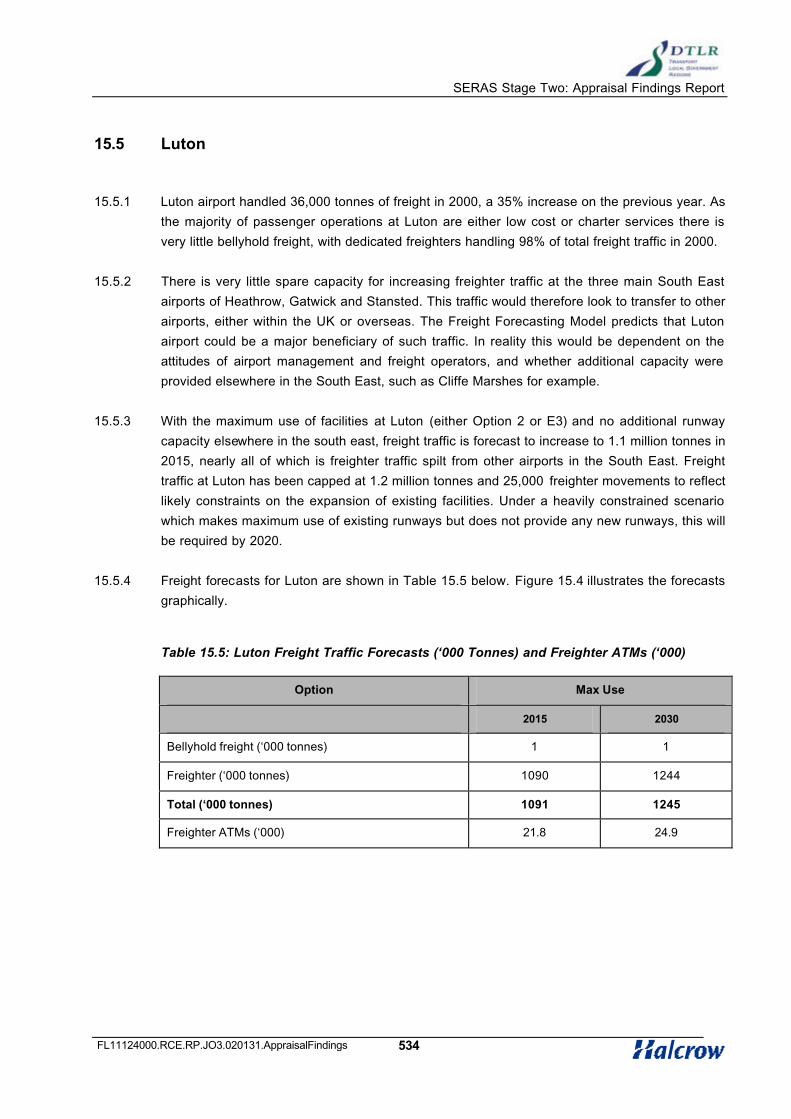
SERAS Stage Two: Appraisal Findings Report
FL11124000.RCE.RP.JO3.020131.AppraisalFindings 534
15.5 Luton
15.5.1 Luton airport handled 36,000 tonnes of freight in 2000, a 35% increase on the previous year. As
the majority of passenger operations at Luton are either low cost or charter services there is
very little bellyhold freight, with dedicated freighters handling 98% of total freight traffic in 2000.
15.5.2 There is very little spare capacity for increasing freighter traffic at the three main South East
airports of Heathrow, Gatwick and Stansted. This traffic would therefore look to transfer to other
airports, either within the UK or overseas. The Freight Forecasting Model predicts that Luton
airport could be a major beneficiary of such traffic. In reality this would be dependent on the
attitudes of airport management and freight operators, and whether additional capacity were
provided elsewhere in the South East, such as Cliffe Marshes for example.
15.5.3 With the maximum use of facilities at Luton (either Option 2 or E3) and no additional runway
capacity elsewhere in the south east, freight traffic is forecast to increase to 1.1 million tonnes in
2015, nearly all of which is freighter traffic spilt from other airports in the South East. Freight
traffic at Luton has been capped at 1.2 million tonnes and 25,000 freighter movements to reflect
likely constraints on the expansion of existing facilities. Under a heavily constrained scenario
which makes maximum use of existing runways but does not provide any new runways, this will
be required by 2020.
15.5.4 Freight forecasts for Luton are shown in Table 15.5 below. Figure 15.4 illustrates the forecasts
graphically.
Table 15.5: Luton Freight Traffic Forecasts (‘000 Tonnes) and Freighter ATMs (‘000)
Option Max Use
2015 2030
Bellyhold freight (‘000 tonnes) 1 1
Freighter (‘000 tonnes) 1090 1244
Total (‘000 tonnes) 1091 1245
Freighter ATMs (‘000) 21.8 24.9
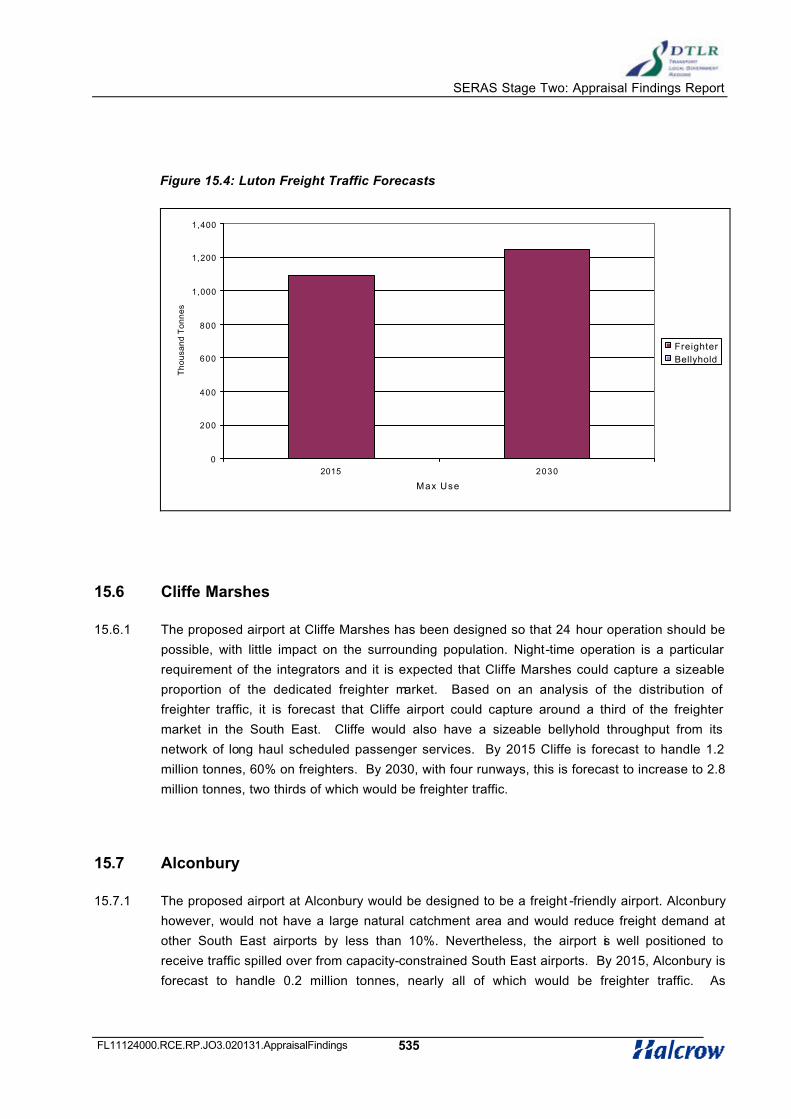
SERAS Stage Two: Appraisal Findings Report
FL11124000.RCE.RP.JO3.020131.AppraisalFindings 535
Figure 15.4: Luton Freight Traffic Forecasts
0
200
400
600
800
1,000
1,200
1,400
2015 2030
Tho
usan
d T
onne
s
FreighterBellyhold
Max Use
15.6 Cliffe Marshes
15.6.1 The proposed airport at Cliffe Marshes has been designed so that 24 hour operation should be
possible, with little impact on the surrounding population. Night-time operation is a particular
requirement of the integrators and it is expected that Cliffe Marshes could capture a sizeable
proportion of the dedicated freighter market. Based on an analysis of the distribution of
freighter traffic, it is forecast that Cliffe airport could capture around a third of the freighter
market in the South East. Cliffe would also have a sizeable bellyhold throughput from its
network of long haul scheduled passenger services. By 2015 Cliffe is forecast to handle 1.2
million tonnes, 60% on freighters. By 2030, with four runways, this is forecast to increase to 2.8
million tonnes, two thirds of which would be freighter traffic.
15.7 Alconbury
15.7.1 The proposed airport at Alconbury would be designed to be a freight -friendly airport. Alconbury
however, would not have a large natural catchment area and would reduce freight demand at
other South East airports by less than 10%. Nevertheless, the airport is well positioned to
receive traffic spilled over from capacity-constrained South East airports. By 2015, Alconbury is
forecast to handle 0.2 million tonnes, nearly all of which would be freighter traffic. As

SERAS Stage Two: Appraisal Findings Report
FL11124000.RCE.RP.JO3.020131.AppraisalFindings 536
constraints in the South East become tighter, more freight traffic would travel through
Alconbury. By 2030 freight traffic at Alconbury could reach as much as 1.3 million tonnes.
15.8 Interpretation of Forecasts
Overall Growth
15.8.1 The overall forecast growth in air freight at South East airports to 2015 and 2030 is summarised
in Table 15.6 for capacity-constrained scenarios and in Table 15.7 for selected larger capacity
packages. These forecasts have been derived from an allocation to airports of a high forecast
of national growth in air freight, from 2.1 million tonnes in 1998 and 2.5 million tonnes in 2000 to
13.6 million tonnes in 2030.
15.8.2 In the more constrained scenarios presented in Table 15.6, total tonnes at the major South East
airports increase from 1.8 million in 2000 to around 4 million in 2015 and over 6 million in 2030.
Some increase is forecast in bellyhold traffic (from 1.5 million tonnes in 2000 to around 2.5
million tonnes in 2030), but much more growth is forecast in freighter freight, from 0.3 million
tonnes in 2030 to over 3 million tonnes in 2030. This growth in freighter traffic would be
accommodated through an increase in freighter ATMs and a substantial increase in average
tonnes carried per freighter ATM.
15.8.3 The forecast number of freighter ATMs at major South East airports increases from 26,600 in
2000 to 43,000 in 2015 and to 66,600 in 2030, with no new runway provision (Package 2). The
assumption is that the growth in freighter ATMs will be accommodated at Stansted and Luton.
Potential freighter ATMs at Heathrow and Gatwick are assumed to be limited to current totals of
around 3,000 and 3,500 respectively. The introduction of additional runway capacity at
Alconbury diverts some freighter ATMs away from Luton and Stansted and increases the total
at South East airports.
15.8.4 The provision of additional runway capacity in the larger packages reported in Table 15.7 adds
to forecast tonnes carried, to 4 – 4.5 million tonnes in 2015 and 6.2 – 7.6 million tonnes in 2030.
In 2030, over 4 million tonnes are forecast at Stansted with packages 16 and 19 (2 additional
runways in Package 16 and 1 in Package 19). Cliffe Marshes is forecast to handle 2.8 million
tonnes in Package 21 in 2030, with Stansted handling a further 1.9 million tonnes as it is more
accessible to the northern part of the SERAS region than Cliffe Marshes.. The number of
freighter ATMs, allowing for further increases in tonnes per ATM, increases to almost 80,000,
largely at Stansted and, in Package 21, Cliffe Marshes.
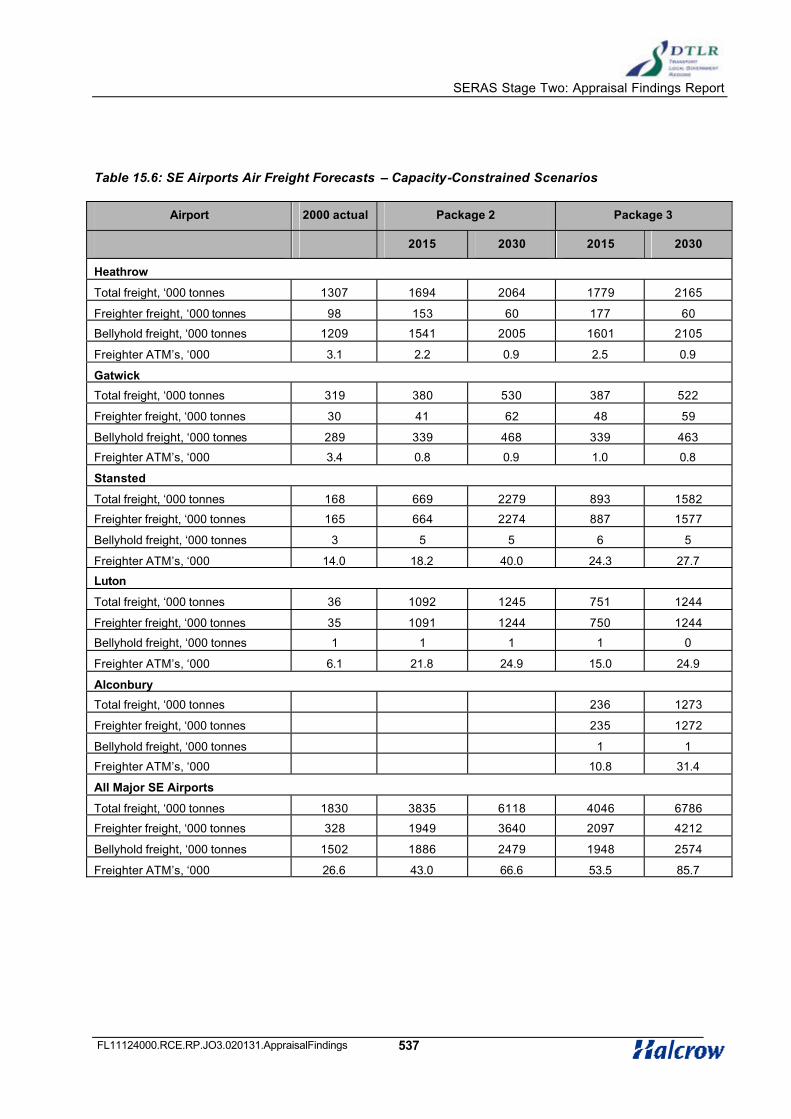
SERAS Stage Two: Appraisal Findings Report
FL11124000.RCE.RP.JO3.020131.AppraisalFindings 537
Table 15.6: SE Airports Air Freight Forecasts – Capacity-Constrained Scenarios
Airport 2000 actual Package 2 Package 3
2015 2030 2015 2030
Heathrow
Total freight, ‘000 tonnes 1307 1694 2064 1779 2165
Freighter freight, ‘000 tonnes 98 153 60 177 60
Bellyhold freight, ‘000 tonnes 1209 1541 2005 1601 2105
Freighter ATM’s, ‘000 3.1 2.2 0.9 2.5 0.9
Gatwick
Total freight, ‘000 tonnes 319 380 530 387 522
Freighter freight, ‘000 tonnes 30 41 62 48 59
Bellyhold freight, ‘000 tonnes 289 339 468 339 463
Freighter ATM’s, ‘000 3.4 0.8 0.9 1.0 0.8
Stansted
Total freight, ‘000 tonnes 168 669 2279 893 1582
Freighter freight, ‘000 tonnes 165 664 2274 887 1577
Bellyhold freight, ‘000 tonnes 3 5 5 6 5
Freighter ATM’s, ‘000 14.0 18.2 40.0 24.3 27.7
Luton
Total freight, ‘000 tonnes 36 1092 1245 751 1244
Freighter freight, ‘000 tonnes 35 1091 1244 750 1244
Bellyhold freight, ‘000 tonnes 1 1 1 1 0
Freighter ATM’s, ‘000 6.1 21.8 24.9 15.0 24.9
Alconbury
Total freight, ‘000 tonnes 236 1273
Freighter freight, ‘000 tonnes 235 1272
Bellyhold freight, ‘000 tonnes 1 1
Freighter ATM’s, ‘000 10.8 31.4
All Major SE Airports
Total freight, ‘000 tonnes 1830 3835 6118 4046 6786
Freighter freight, ‘000 tonnes 328 1949 3640 2097 4212
Bellyhold freight, ‘000 tonnes 1502 1886 2479 1948 2574
Freighter ATM’s, ‘000 26.6 43.0 66.6 53.5 85.7

SERAS Stage Two: Appraisal Findings Report
FL11124000.RCE.RP.JO3.020131.AppraisalFindings 538
Table 15.7: SE Airports Air Freight Forecasts – Larger Packages
2000
Actual
Package 15 Package 16 Package 19 Package 21
2015 2030 2015 2030 2015 2030 2015 2030
Heathrow
Total freight, ‘000 tonnes 1307 2322 2260 2322 2188 1720 1894 1684 2085
Freighter freight, ‘000 tonnes 98 210 210 210 210 210 209 200 209
Bellyhold freight, ‘000 tonnes 1209 2112 2050 2112 1978 1510 1685 1484 1876
Freighter ATM’s, ‘000 3.1 3.0 3.0 3.0 3.0 3.0 3.0 2.9 3.0
Gatwick
Total freight, ‘000 tonnes 319 401 649 401 518 594 878 281 424
Freighter freight, ‘000 tonnes 30 111 187 111 144 43 107 53 110
Bellyhold freight, ‘000 tonnes 289 291 462 291 374 552 771 228 314
Freighter ATM’s, ‘000 3.4 2.2 2.7 2.2 2.1 0.9 1.5 1.1 1.6
Stansted
Total freight, ‘000 tonnes 168 1494 2838 1494 4401 1155 4114 1100 1914
Freighter freight, ‘000 tonnes 165 1487 1971 1487 3404 1149 3348 1095 1909
Bellyhold freight, ‘000 tonnes 3 7 867 7 996 6 765 6 5
Freighter ATM’s, ‘000 14.0 40.7 34.6 40.7 59.8 31.5 58.8 30.0 33.5
Luton
Total freight, ‘000 tonnes 36 313 494 313 422 594 723 262 386
Freighter freight, ‘000 tonnes 35 313 494 313 422 594 723 262 386
Bellyhold freight, ‘000 tonnes 1 0 0 0 0 0 0 0 0
Freighter ATM’s, ‘000 6.1 6.3 9.9 6.3 8.4 11.9 14.5 5.2 7.7
Cliffe Marshes
Total freight, ‘000 tonnes 1208 2787
Freighter freight, ‘000 tonnes 729 1887
Bellyhold freight, ‘000 tonnes 479 899
Freighter ATM’s, ‘000 20.0 33.2
All Major SE Airports
Total freight, ‘000 tonnes 1830 4530 6241 4530 7529 4063 7609 4535 7596
Freighter freight, ‘000 tonnes 328 2121 2862 2121 4180 1996 4387 2339 4501
Bellyhold freight, ‘000 tonnes 1502 2410 3379 2410 3348 2068 3221 2197 3094
Freighter ATM’s, ‘000 26.6 52.2 50.2 52.2 73.3 47.2 77.8 59.1 79.0

SERAS Stage Two: Appraisal Findings Report
FL11124000.RCE.RP.JO3.020131.AppraisalFindings 539
Express Freight and Night-time ATMs
15.8.5 The forecasts of total air freight divide into forecasts of time-sensitive express freight and
general cargo. While general cargo dominates current air freight in tonnage terms, by 2030
express freight is forecast to be 52% of the national air freight market. A consequence of the
rapid growth in express freight is likely to be an increased demand for night -time freight ATMs
to meet ‘next day delivery’ requirements. More than half of forecast freighter ATMs (ie, 40,000
plus) would prefer to be night-time movements.
15.8.6 In 2000, at Heathrow, Gatwick and Stansted, there were 9,600 night-time (between 2200 and
0600 UTC) cargo ATMs out of 64,000 total night-time ATMs. These night-time ATMs
accounted for just under half of all cargo ATMs. 6,500 of them were at Stansted.
15.8.7 Although night -time flight policies are under review, it is unrealistic to expect any increase in
night-time freight ATMs at Heathrow or Gatwick. In 2000, these two airports between them
accounted for 3,100 night-time freight ATMs. The 6,500 at Stansted were at the night
movement cap. At Luton, the airport is in discussions to introduce a new night noise regime
which might allow for some increase in night-time ATMs, but currently around 55% of Luton’s
freighter ATMs (around 3,500) are at night. In total, therefore, these four airports accommodate
around 13,000 night-time freighter ATMs.
Accommodating Forecast Demand
15.8.8 The conclusion, however, seems to be that, if the forecasts of air freight are realised, the
demand for night-time freighter ATMs is likely to exceed substantially current capacity, ie,
demand of 40,000 plus against current capacity of 13,000. Possible ways of meeting forecast
demand might be:
• Relaxation of night -time movement caps at existing airports, notably Stansted
and Luton,
• A new 24-hour runway to serve the South East, with Alconbury and Cliffe
Marshes the possible locations,
• Additional use of existing or new 24-hour runways outside the South East,
perhaps at East Midlands Airport, but this would be less well located in relation to
the market, or
• A change in the way in which air freight markets, and particularly express air
freight, operate, so they make more use of daytime runway capacity and fewer
night-time movements.
• Substantial trip suppression, use of continental airports, or use of other, less
preferred modes.

SERAS Stage Two: Appraisal Findings Report
FL11124000.RCE.RP.JO3.020131.AppraisalFindings 540
15.8.9 If additional night-time movements were contemplated, a key consideration would be the
potential noise impact. Table 15.8 summarises numbers of people falling within 90dB SEL
footprints based on ‘average worst’ (QC2) aircraft likely to operate at night at airports other than
East Midlands, where the footprint is based on a B747-400.
Table 15.8: Populations Within 90dB SEL Footprints, ‘000
Stansted:
Appraised
Runways
Luton:
Appraised
Runways
Cliffe
Marshes:
Appraised
Runways
Alconbury:
Appraised
Runway
East
Midlands:
Existing
Runway:
B747-400
Westerly Operations
Departures 0.3 – 2.0 0.4 – 3.7 <0.1 – 1.7 0.6 3.0
Arrivals 0.3 – 1.7 0.9 – 6.0 <0.1 – 1.2 10.6 1.3
Easterly Operations
Departures 0.2 – 0.5 0.6 – 0.9 0.2 – 0.8 0.3 4.2
Arrivals 0.6 – 1.8 0.2 – 7.2 <0.1 – 2.3 0.3 2.2
15.8.10 Cliffe Marshes, followed by Stansted, offers the potential for minimising noise impacts,
depending on which of the appraised runways were built in each location. At Cliffe Marshes, if
only one east – west pair of runways were built, no more than 0.2 thousand (200) need be
affected by arrivals or departures in either operating mode. Even if four runways were to be
constructed at Cliffe, a maximum of 2,300 people would be under the arrival or departure
footprint. At Alconbury, the 10,600 people under the arrivals footprint on westerly operations
are largely in St Ives, some 8 km from the end of the runway (the single footprint scores all
people within it equally, irrespective of their location in relation to the runway) though it is
probable that there is scope for modifying arrival routes to avoid overflying St Ives.
SERAS Stage One: Methodology Report
FL1124000 RCE.RP.CO2.010904 Methodology 541
16 Airspace
16.1 Airspace Modelling in SERAS
Capacity
16.1.1 The addition of runway capacity at any of the London area airports would have to be
matched by capacity in the airspace system. In practice, airports and airspace have to be
regarded as one system. Balanced capacity must be available at all stages (incoming
airways, holding points, approach and departure routes, runways) if unacceptable levels of
delay are to be avoided. It was therefore necessary to attempt to assess the likely capacity
of South East airspace to handle the future traffic flows implied by the runway development
options under consideration.
16.1.2 Experience from previous studies, such as RUCATSE, indicated that a precise definition of
long-term airspace capacity would be an unrealistic target. Airspace structure and ATC
operations are very complex and the technology that supports them is constantly evolving.
Capacity is highly sensitive to traffic make-up, patterns of activity, runway location and
other factors, so precise assessment of the effects of change requires precise and detailed
inputs. The inevitable lack of such precision and detail when considering possible future
scenarios means that any assessment should have clear objectives and that findings be
interpreted with care.
Airspace Modelling
16.1.3 The assessment of airspace and airport system capacities requires the application of
computer-based simulation modelling. Well established techniques are in regular use in
the planning and implementation of changes to the structure and management of existing
airspace. DTLR commissioned CAA-DAP (Directorate of Airspace Policy) and NATS to
undertake the simulation of a number of future airport capacity development scenarios.
The primary objective was to assess whether the system would be likely to have adequate
capacity to accommodate runway capacities of the order envisaged by the development
options.
16.1.4 The simulations were conducted by the CAA and NATS using the TAAM (Total Airport and
Airspace Modeller) fast-time simulation software package. Given the time and resources

SERAS Stage One: Methodology Report
FL1124000 RCE.RP.CO2.010904 Methodology 542
necessary to set up and run different scenarios through TAAM, only four cases could be
modelled. Also due to time constraints, those cases had to be defined before Ministerial
decisions had been made, at the end of Stage One, on the packages to be taken forward
to Stage Two, and before detailed demand forecasts were available. The development
scenarios simulated do not, therefore, necessarily correspond to actual development
packages subsequently explored in Stage Two.
16.1.5 The cases modelled were selected by DTLR as possible future scenarios that would
provide reasonable tests of the adequacy of future airspace to accommodate additional
runway throughputs in different locations. The four scenarios modelled were:
• Scenario 1: A new airport at Cliffe
• Scenario 2: Additional runways at both Gatwick and Stansted
• Scenario 3: An additional runway at Heathrow
• Scenario 4: An additional runway at Stansted plus the re-alignment of the
runway at Luton in line with the Stansted runways (as in Luton Option E3).
16.1.6 The TAAM methodologies used by CAA and NATS differ in some respects, as they have
been developed for various purposes. As the starting point for the SERAS work, both
NATS and DAP simulated a common baseline scenario, to confirm that their models
produced the same output. Each organisation then undertook modelling of two of the four
future scenarios.
16.1.7 Scenarios were modelled using the then available forecast traffic profiles for 2010, 2020
and 2030. Simulation encompassed the whole of the London Terminal Control Area
(LTMA), plus areas outside this to ensure proper boundary conditions. Airports included in
the simulation were Heathrow, Gatwick, Stansted, Luton, London City and Cliffe. The daily
number of flights in each sample reflected both forecast growth in demand and the effects
of limited runway capacity. Because of the different numbers of runways and their differing
capacities, the daily total number of flights varies between scenarios. In the baseline
scenario, the number of fl ights per day barely exceeded 4,000 by 2030. For scenarios 1
and 2 there were around 6,000 daily movements in 2030, and for scenarios 3 and 4 just
under 5,000.
16.1.8 The modelling was intended as a preliminary, high-level investigation of possible future
scenarios. To reflect the continuing development of airspace management techniques, it
was assumed that the following ATC tools and working practices would be in place by
2010;

SERAS Stage One: Methodology Report
FL1124000 RCE.RP.CO2.010904 Methodology 543
• A combination of Arrivals Manager (AMAN) and Departures Manager (DMAN)
tools, which assist controllers in optimally sequencing traffic
• Application of ‘gate to gate’ management of flights, and collaborative decision
making, both optimising use of available capacity
• Area Navigation (RNAV) used on Standard Instrument Departure routes
(SIDs), allowing more precise tracking and separation of aircraft
• Track keeping to improved tolerances through application of Requested
Navigation Performance (RNP)
• Use of multiple close-track departure procedures, increasing capacity on a
given departure routing.
16.1.9 Without the incorporation of multiple, close-track RNAV SIDs, it was doubtful whether the
simulation would have been able to process the traffic volumes incorporated in some of the
scenarios. Since it is expected that RNAV will be in use by 2010, it was considered
appropriate to include them in all the simulations.
16.1.10 Apart from these technological changes, which are expected to be in place in the next 10
years, the modelling otherwise assumed that current air traffic management practices
apply. By 2030, however, operating techniques can be expected to have evolved further.
Tools to assist controllers in the decision making process will be available, dynamic
information on an aircraft’s position and intended route will provide advance data on traffic
flows, and navigational equipment will allow control in time as well as position.
16.1.11 TAAM incorporates an automated conflict resolution system, which replicates controller
intervention should conflicts be detected. In this high-level simulation, the models were run
with conflict resolution switched off, so that aircraft flew the routes defined in the traffic
samples. Any conflicts therefore remain uncorrected, so the reported number of conflicts is
greater than it would be in real operations with controller intervention.
16.1.12 In order to achieve forecast movement totals, it was also necessary to adopt a ‘free flow’
methodology, in which the usual departure time intervals between consecutive departures
on the same SID are not enforced. This, also, means that more conflicts are reported than
would occur in actual operations.
16.1.13 In the main, only westerly operations were simulated (aircraft landing from the east and
departing towards the west). These account for 70 to 80% of operations at South East
airports over the past 20 years. Easterly operations (aircraft landing from the west and
taking off towards the east) may lead to particular conflict between the potential new site at
Cliffe and London City and Heathrow traffic. Scenario 1 was therefore also modelled under
easterly operating conditions.
SERAS Stage One: Methodology Report
FL1124000 RCE.RP.CO2.010904 Methodology 544
16.1.14 The modelling produced two standard graphical outputs for each scenario: a combined
track and traffic density plot and a proximity plot. The track and density plot provides a
graphical representation of the routes flown in the simulation in conjunction with traffic
density. Areas with different traffic densities have different colour codes. The proximity
plot provides a graphical representation of the airspace that would require controller
intervention to resolve conflicts. Potential problem areas highlighted by the colour coding
system, in terms of traffic density or proximity events, were addressed by CAA/NATS in
formulating their conclusions on the potential for airspace to accommodate forecast traffic
levels.
16.2 Principal Findings
16.2.1 The principal findings for each scenario modelled are set out below. Among the general
conclusions reached it was stated that a detailed safety analysis of all proposed
procedures and changes would be required at an early stage. Also, that contingency
measures would need to be incorporated to cope with non-routine events, such as adverse
weather or a blocked runway) when operating at or near airspace capacity.
16.2.2 Extensive re-alignments of all routes to all airports may be required together with
associated reconfiguration of control sectors within the LTMA and its surrounds. The
numbers of holding points or ‘stacks’ per airport and their positions may need to be
modified. Such extensive changes would require substantial time and resources for
design, simulation and phased implementation.
Scenario 1: New Airport at Cliffe Marshes
16.2.3 Airspace to the west of the site appears to be extremely congested, with potentially
complex interactions between the new site, London City and Heathrow traffic. Operations
to and from Southend, Biggin Hill and Manston airports could also be significantly affected.
16.2.4 Westerly operations appear to be workable, although vectoring of inbound traffic to Cliffe
may position aircraft close to Belgian or Dutch airspace. The modelling of easterly
operations identified the main area of interactions as the final vectoring area west of the
new site. A large number of Cliffe arrivals would interact with London City and Biggin Hill
traffic, and with Gatwick northerly departures. These in turn are constrained by Heathrow
departures.

SERAS Stage One: Methodology Report
FL1124000 RCE.RP.CO2.010904 Methodology 545
16.2.5 Consideration would need to be given to reducing Heathrow holds to two, and their
possible repositioning.
Scenario 2: Additional Runways at Gatwick and Stansted
16.2.6 Additional controlled airspace would be required to the north of the LTMA. Dedicated
holding points for Stansted (two points) and Luton (one) would probably be required. This
represents one additional hold in comparison with the current situation. Adjustment of
routes, possibly extensive, would be needed for both Gatwick and Stansted to cater for
increased departing traffic.
Scenario 3: Additional Runway at Heathrow
16.2.7 The third runway was assumed to operate almost independently of the other runways.
This would largely eliminate the difficulties of managing the ground movement of aircraft
using three runways, which would otherwise constrain runway capacity. It is likely that
operations into and out of Northolt would need to be severely restricted.
Scenario 4: Additional Runway at Stansted and Re-alignment of Luton Runway
16.2.8 Initial findings suggest that little additional airspace capacity was to be gained by realigning
the Luton runway. A realigned Luton on easterly operations could cause conflict with
flights inbound to Heathrow via the Bovingdon hold. The additional Stansted runway would
require additional airspace to the north, plus inbound holding facilities.
Overall Conclusion
16.2.9 In conclusion, and with regard for the assumptions made in the simulation work, it was
considered that the additional ATMs in all scenarios could be accommodated, with the
changes envisaged to the structure and management of airspace within the LTMA. Other
than the particular need identified for a thorough review of routes and procedures in the
final vectoring areas of an airport at Cliffe, no serious impediments to implementation were
anticipated as a result of these studies.