
Southern Africa's Muslims: Emergence Development and Transformation
V7.1-ES
Potential
of East Africa's
Jonathan Demierre, Morgan Bazilian, Jonathan Carbajal,
Sustainable Engineering Lab
1
Potential for Regional Use
of East Africa's Natural G
han Demierre, Morgan Bazilian, Jonathan Carbajal,
Shaky Sherpa, Vijay Modi
Sustainable Engineering Lab (SEL), The Earth Institute, Columbia
University, New York, NY
November 2014
Regional Use
Natural Gas
han Demierre, Morgan Bazilian, Jonathan Carbajal,
Earth Institute, Columbia
V7.1-ES
2
Table of Contents Executive Summary ....................................................................................................................................3
1. Introduction ........................................................................................................................................5
2. Current State of Natural Gas Sector in Sub-Saharan Africa ................................................................8
3. Potential Uses of Natural Gas .............................................................................................................9
3.1. Cooking .................................................................................................................................... 10
3.2. Power Generation .................................................................................................................... 12
3.3. Transportation ......................................................................................................................... 13
3.4. Fertilizer Production ................................................................................................................ 14
3.5. Maximum Natural Gas Price by Applications .......................................................................... 15
4. Estimation of Potential Natural Gas Demand .................................................................................. 16
5. Costs of Supplying Natural Gas ........................................................................................................ 20
5.1. Pipeline Cost model ................................................................................................................. 21
5.2. Methodology for Network Generation .................................................................................... 23
5.3. Impact of Network Size ............................................................................................................ 23
5.4. Detailed Analysis for a Set of Eight Countries.......................................................................... 25
5.4.1. Baseline Scenario ............................................................................................................. 25
5.4.2. High-Cost Scenario ........................................................................................................... 27
5.4.3. Sensitivity Analyses .......................................................................................................... 29
5.4.4. Estimates of Natural Gas Consumption and Needed Investment by Sector ................... 32
5.4.5. Comparison of Infrastructure Investment: Pipeline Network vs. LNG ............................ 34
5.4.6. Comparison of Potential Profit: Pipeline Network vs. LNG ............................................. 35
6. Discussion ........................................................................................................................................ 37
7. Conclusion ........................................................................................................................................ 39
Acknowledgment ..................................................................................................................................... 40
Bibliography ............................................................................................................................................. 41
Appendix A ............................................................................................................................................... 44
Appendix B ............................................................................................................................................... 45
Estimation of Electric Power Consumption in 2050 ............................................................................ 45
Estimation of CNG Consumption for Transportation in 2050 ............................................................. 46
Estimation of Nitrogenous Fertilizer Consumption in 2050 ................................................................ 46
V7.1-ES
3
Executive Summary
1. Large offshore natural gas finds in East Africa have the possibility of addressing two
major underpinnings of economic development: energy access, for both electricity and
for clean cooking as well as affordable energy for transport, economic growth and
industry, including fertilizers.
2. If one starts planning now, in an optimistic scenario, detailed project preparation can
be carried out by 2020. Execution of the first phase of a large pipeline project could
take five years. So the first gas might flow by 2025 with full execution by 2035 with
appropriate downstream distribution networks in place. With a minimum of planning
horizon of 15 years, we are looking at 2050. Hence the paper considers projections to
2050.
3. Both a “ bottom up and top down estimate of the energy demands” are made at
national level and have been projected down to the urban level.
4. One has to anticipate the impact of urbanization, the air quality issues of densely
populated areas, especially transportation and cooking as well as the larger power and
food requirements. Extrapolating current primary energy resource trajectories cannot
predict transformative change that is needed.
5. Large offshore natural gas finds in East Africa have the possibility of achieving such a
transformative change “affordably”, even without accounting for co-benefits to
regional economic growth, jobs, environment and health.
6. The paper shows that a trunk gas pipeline network originating in Tanzania and
Mozambique and spanning from Ethiopia to South Africa could become a backbone of
a regional clean energy system.
7. Demand projections, estimates of infrastructure cost, and consumption estimates
suggest market opportunities for gas at prices competitive to LNG exports, which is
how the bulk of the gas will be currently monetized.
8. One scenario of the modeled infrastructure system, that includes investments to bring
gas to city gates, reaching 263 major urban areas within eight countries (Mozambique,
Malawi, Tanzania, Kenya, Uganda, Rwanda, Burundi and Ethiopia) would be $57
Billion. The benefits of this infrastructure would reach 185 million in urban areas
where in addition to power, gas would also allow clean cooking and clean fuel for
public transport vehicles. The wider benefits of power and industry would reach up to
600 million people in East and Southern Africa (not including the benefits to South
Africa itself from the bulk supply).
9. Such a system would take time to fully develop. It is shown however that even at a
25% penetration of gas as a primary resource in the energy system, it can be
affordable and have a transformative impact on power, food, urban transport and
cooking in urban areas.
10. The system when fully deployed would annually deliver 2.9 tcf of gas to the 8 countries
and an added 1.3 tcf to South Africa. At this macro level, the cost of bringing gas to
urban centers would be roughly about $5/MMBTU in addition to the upstream costs.
The costs would be lower or higher for countries closer or further to the gas source
respectively.
V7.1-ES
4
11. Many cities in the region are in a “chicken and egg” situation faced earlier in other
Asian cities. A city-wide distribution pipeline and CNG stations cannot be built without
ensuring supply at citygate. Trunk networks to the city gate cannot be built without
monetized urban demand. The paper demonstrates that this logjam can indeed be
broken.
12. Lessons from India for PNG and CNG programs suggest that in-city infrastructure for
distribution needs to leverage both cooking and transportation demands as well as
wider use of gas for industry and power. Such intra-city distribution systems might add
another $5/MMBTU to the cost of gas. Taking into account all costs including those for
bulk gas, transmission and last mile distribution, would nevertheless make the gas
supply available to a home at $15/MMBTU with cities closer to the source being lower.
13. It is possible to build the infrastructure outwards one country at time, and keep overall
initial investments low, however the longer term total costs of building out
incrementally would be higher and the gas producers would not be assured long term
bulk markets.
14. At the time of the final investment decision for the upstream project, long-term supply
agreements will be put in place between field developer and gas buyers (e.g.
liquefaction plant, transmission pipeline operator). After this phase, there is no
flexibility to change significantly where the gas is supplied. With good coordination of
the activities between the different stakeholders, the development of the domestic
market at large scale together with LNG development will be possible. Also, a part of
the revenues generated with LNG exports may be used to partially finance the
domestic gas infrastructure.
15. While in the longer term a sustainable world would rely exclusively on renewable
resources, in the transition towards a low-carbon future, natural gas could play a
major role in sub-Saharan Africa to support a rapid development of the economies in a
sustainable way. For transportation and power generation, natural gas has the
advantage of producing less CO2 emissions than other conventional fossil fuels (diesel,
gasoline and coal). Moreover for electricity production, natural gas-fired power plants
can be efficiently and economically used as balancing power generation, facilitating
the integration of intermittent renewable sources (like wind and solar).
V7.1-ES
1. Introduction With increasing population, urbanization and economic growth expected, the energy demand in sub
Saharan Africa will likely drastically increase over the ne
demand in a sustainable manner and provide reliable and affordable energy services to support the
economic development is a foundational challenge for the sub
natural gas, which might play a significant role in sub
Recently, significant recoverable resources of natural gas have been identified in Mozambique and
Tanzania (Ledesma 2013). Large reserves of natural
Libya and Egypt (see Figure 1) (BP 2013
In East Africa, the recent gas finds in Mozambiq
region by using domestically a significant
host of different applications such as cooking, power generation, transportation and fertilizer
production. For cooking, natural gas would be a great alternative to wood fuels, which causes indoor
air pollution and health problems (Foell, et al. 2011
generation and transport, natural gas could represent an
products.
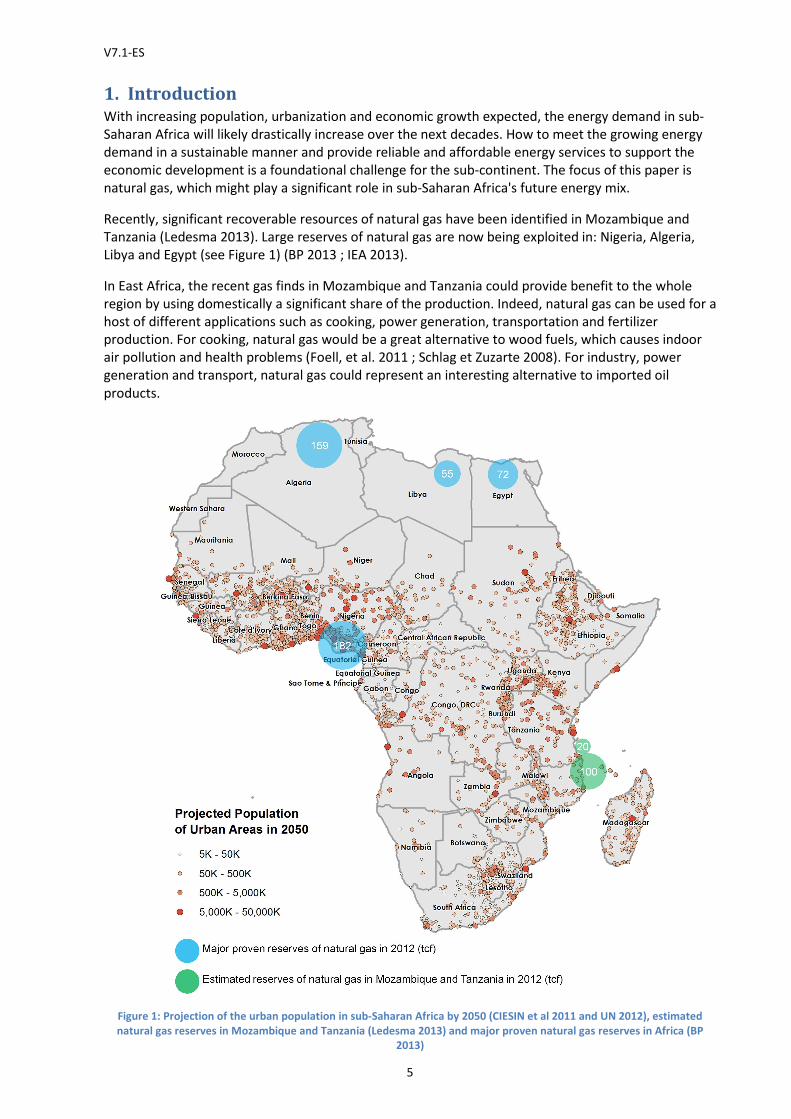
Figure 1: Projection of the urban population in sub
natural gas reserves in Mozambique and Tanzania (Ledesma
5
With increasing population, urbanization and economic growth expected, the energy demand in sub
Saharan Africa will likely drastically increase over the next decades. How to meet the growing energy
demand in a sustainable manner and provide reliable and affordable energy services to support the
economic development is a foundational challenge for the sub-continent. The focus of this paper is
ch might play a significant role in sub-Saharan Africa's future energy mix.
Recently, significant recoverable resources of natural gas have been identified in Mozambique and
Large reserves of natural gas are now being exploited in: Nigeria, Algeria,
(BP 2013 ; IEA 2013).
he recent gas finds in Mozambique and Tanzania could provide benefit to the whole
significant share of the production. Indeed, natural gas can be used for a
host of different applications such as cooking, power generation, transportation and fertilizer
duction. For cooking, natural gas would be a great alternative to wood fuels, which causes indoor
air pollution and health problems (Foell, et al. 2011 ; Schlag et Zuzarte 2008). For industry, power
generation and transport, natural gas could represent an interesting alternative to imported oil
: Projection of the urban population in sub-Saharan Africa by 2050 (CIESIN et al 2011 and UN 2012), estimated
natural gas reserves in Mozambique and Tanzania (Ledesma 2013) and major proven natural gas reserves in Africa (BP
2013)
With increasing population, urbanization and economic growth expected, the energy demand in sub-
xt decades. How to meet the growing energy
demand in a sustainable manner and provide reliable and affordable energy services to support the
continent. The focus of this paper is
Saharan Africa's future energy mix.
Recently, significant recoverable resources of natural gas have been identified in Mozambique and
gas are now being exploited in: Nigeria, Algeria,
ue and Tanzania could provide benefit to the whole
, natural gas can be used for a
host of different applications such as cooking, power generation, transportation and fertilizer
duction. For cooking, natural gas would be a great alternative to wood fuels, which causes indoor
; Schlag et Zuzarte 2008). For industry, power
interesting alternative to imported oil
Saharan Africa by 2050 (CIESIN et al 2011 and UN 2012), estimated
2013) and major proven natural gas reserves in Africa (BP
V7.1-ES
While in Sub-Saharan countries the share of population living in rural areas is amongst the highest in
the world, the high rate of urbanization (UN 2012) is changing the demographics at a rap
Because it is generally more cost
in rural areas, the growing share of urban population tends to help increase the proportion of the
population with access to modern energy serv
is often sporadic, and definitions of “access” vary tremendously). A projection of the urban population
in sub-Saharan Africa in 2050 is shown in
high densities of urban centers, which suggests that natural gas transmission networks could be
economically viable in these regions.
centers of Eastern Africa in 2050. In this paper we focus on Eastern Africa, because the question of
how to best take advantage of the large potential recoverable resources of gas is still largely pending.
In Western Africa, major gas producers, Nigeria and Equatorial Guinea, have long
contracts already in place for the largest part of their productio
drastically increasing the internal regional supply unlikely in the medium term.
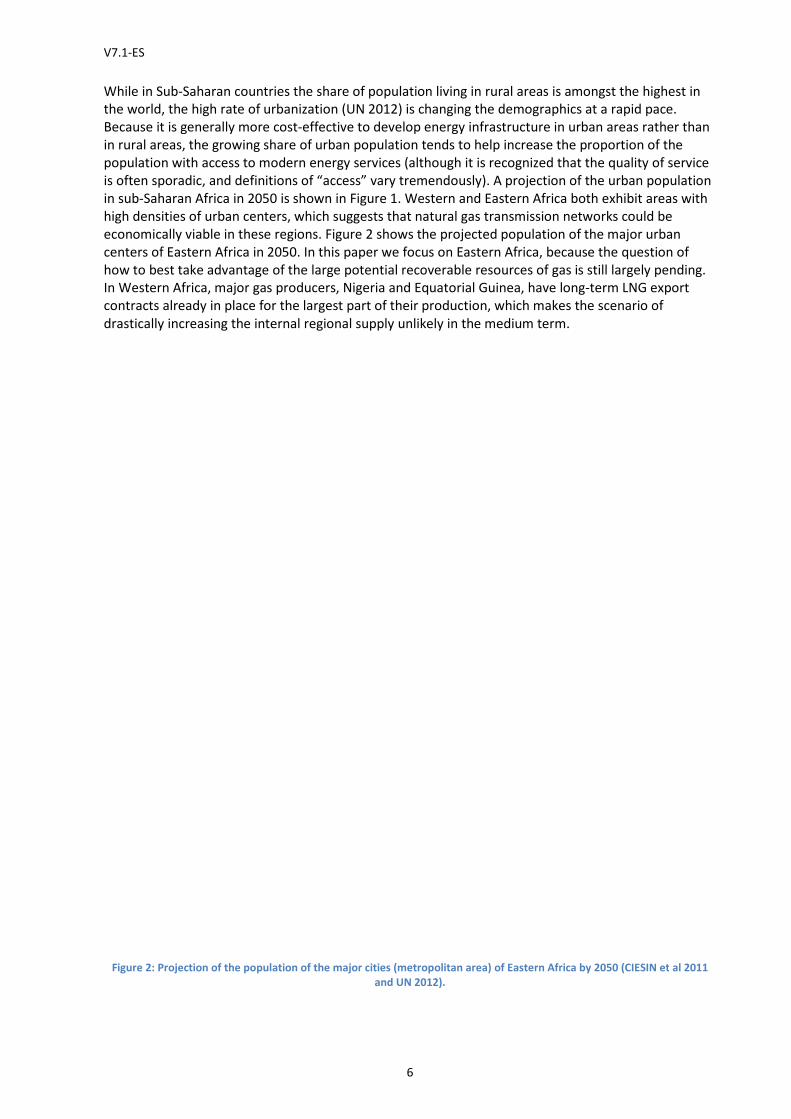
Figure 2: Projection of the population of the major
6
Saharan countries the share of population living in rural areas is amongst the highest in
the world, the high rate of urbanization (UN 2012) is changing the demographics at a rap
Because it is generally more cost-effective to develop energy infrastructure in urban areas rather than
in rural areas, the growing share of urban population tends to help increase the proportion of the
population with access to modern energy services (although it is recognized that the quality of service
is often sporadic, and definitions of “access” vary tremendously). A projection of the urban population
Saharan Africa in 2050 is shown in Figure 1. Western and Eastern Africa both exhibit areas with
high densities of urban centers, which suggests that natural gas transmission networks could be
economically viable in these regions. Figure 2 shows the projected population of the major urban
centers of Eastern Africa in 2050. In this paper we focus on Eastern Africa, because the question of
take advantage of the large potential recoverable resources of gas is still largely pending.
In Western Africa, major gas producers, Nigeria and Equatorial Guinea, have long
contracts already in place for the largest part of their production, which makes the scenario of
drastically increasing the internal regional supply unlikely in the medium term.
: Projection of the population of the major cities (metropolitan area) of Eastern Africa by 2050 (CIESIN et
and UN 2012).
Saharan countries the share of population living in rural areas is amongst the highest in
the world, the high rate of urbanization (UN 2012) is changing the demographics at a rapid pace.
effective to develop energy infrastructure in urban areas rather than
in rural areas, the growing share of urban population tends to help increase the proportion of the
ices (although it is recognized that the quality of service
is often sporadic, and definitions of “access” vary tremendously). A projection of the urban population
. Western and Eastern Africa both exhibit areas with
high densities of urban centers, which suggests that natural gas transmission networks could be
shows the projected population of the major urban
centers of Eastern Africa in 2050. In this paper we focus on Eastern Africa, because the question of
take advantage of the large potential recoverable resources of gas is still largely pending.
In Western Africa, major gas producers, Nigeria and Equatorial Guinea, have long-term LNG export
n, which makes the scenario of
drastically increasing the internal regional supply unlikely in the medium term.
Africa by 2050 (CIESIN et al 2011
V7.1-ES
7
The aim of this paper is to provide a preliminary analysis of the economic viability of a new regional
gas pipeline network in Eastern Africa considering the potential future demand for natural gas. The
issues related to infrastructure financing are not addressed here, however it has to be noted that they
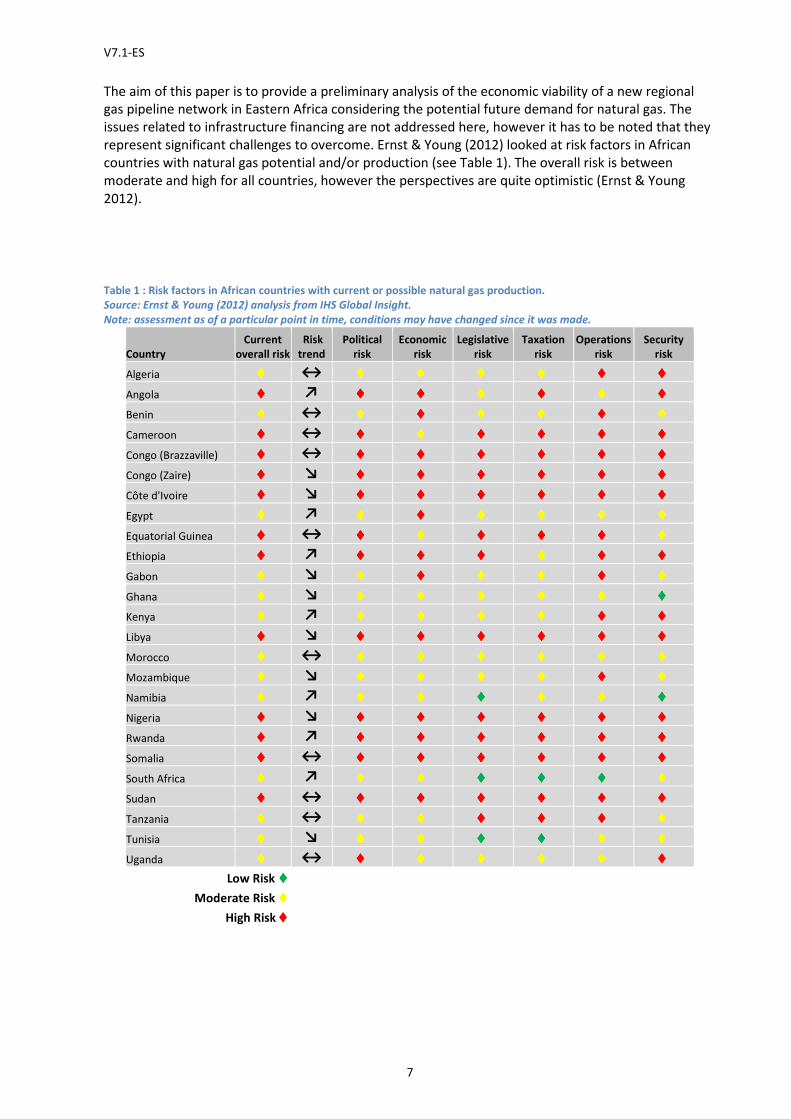
represent significant challenges to overcome. Ernst & Young (2012) looked at risk factors in African
countries with natural gas potential and/or production (see Table 1). The overall risk is between
moderate and high for all countries, however the perspectives are quite optimistic (Ernst & Young
2012).
Table 1 : Risk factors in African countries with current or possible natural gas production.
Source: Ernst & Young (2012) analysis from IHS Global Insight.
Note: assessment as of a particular point in time, conditions may have changed since it was made.
Country
Current
overall risk
Risk
trend
Political
risk
Economic
risk
Legislative
risk
Taxation
risk
Operations
risk
Security
risk
Algeria ♦♦♦♦ ↔ ♦♦♦♦ ♦♦♦♦ ♦♦♦♦ ♦♦♦♦ ♦♦♦♦ ♦♦♦♦ Angola ♦♦♦♦ ↗ ♦♦♦♦ ♦♦♦♦ ♦♦♦♦ ♦♦♦♦ ♦♦♦♦ ♦♦♦♦ Benin ♦♦♦♦ ↔ ♦♦♦♦ ♦♦♦♦ ♦♦♦♦ ♦♦♦♦ ♦♦♦♦ ♦♦♦♦ Cameroon ♦♦♦♦ ↔ ♦♦♦♦ ♦♦♦♦ ♦♦♦♦ ♦♦♦♦ ♦♦♦♦ ♦♦♦♦ Congo (Brazzaville) ♦♦♦♦ ↔ ♦♦♦♦ ♦♦♦♦ ♦♦♦♦ ♦♦♦♦ ♦♦♦♦ ♦♦♦♦ Congo (Zaire) ♦♦♦♦ ↘ ♦♦♦♦ ♦♦♦♦ ♦♦♦♦ ♦♦♦♦ ♦♦♦♦ ♦♦♦♦ Côte d'Ivoire ♦♦♦♦ ↘ ♦♦♦♦ ♦♦♦♦ ♦♦♦♦ ♦♦♦♦ ♦♦♦♦ ♦♦♦♦ Egypt ♦♦♦♦ ↗ ♦♦♦♦ ♦♦♦♦ ♦♦♦♦ ♦♦♦♦ ♦♦♦♦ ♦♦♦♦ Equatorial Guinea ♦♦♦♦ ↔ ♦♦♦♦ ♦♦♦♦ ♦♦♦♦ ♦♦♦♦ ♦♦♦♦ ♦♦♦♦ Ethiopia ♦♦♦♦ ↗ ♦♦♦♦ ♦♦♦♦ ♦♦♦♦ ♦♦♦♦ ♦♦♦♦ ♦♦♦♦ Gabon ♦♦♦♦ ↘ ♦♦♦♦ ♦♦♦♦ ♦♦♦♦ ♦♦♦♦ ♦♦♦♦ ♦♦♦♦ Ghana ♦♦♦♦ ↘ ♦♦♦♦ ♦♦♦♦ ♦♦♦♦ ♦♦♦♦ ♦♦♦♦ ♦♦♦♦ Kenya ♦♦♦♦ ↗ ♦♦♦♦ ♦♦♦♦ ♦♦♦♦ ♦♦♦♦ ♦♦♦♦ ♦♦♦♦ Libya ♦♦♦♦ ↘ ♦♦♦♦ ♦♦♦♦ ♦♦♦♦ ♦♦♦♦ ♦♦♦♦ ♦♦♦♦ Morocco ♦♦♦♦ ↔ ♦♦♦♦ ♦♦♦♦ ♦♦♦♦ ♦♦♦♦ ♦♦♦♦ ♦♦♦♦ Mozambique ♦♦♦♦ ↘ ♦♦♦♦ ♦♦♦♦ ♦♦♦♦ ♦♦♦♦ ♦♦♦♦ ♦♦♦♦ Namibia ♦♦♦♦ ↗ ♦♦♦♦ ♦♦♦♦ ♦♦♦♦ ♦♦♦♦ ♦♦♦♦ ♦♦♦♦ Nigeria ♦♦♦♦ ↘ ♦♦♦♦ ♦♦♦♦ ♦♦♦♦ ♦♦♦♦ ♦♦♦♦ ♦♦♦♦ Rwanda ♦♦♦♦ ↗ ♦♦♦♦ ♦♦♦♦ ♦♦♦♦ ♦♦♦♦ ♦♦♦♦ ♦♦♦♦ Somalia ♦♦♦♦ ↔ ♦♦♦♦ ♦♦♦♦ ♦♦♦♦ ♦♦♦♦ ♦♦♦♦ ♦♦♦♦ South Africa ♦♦♦♦ ↗ ♦♦♦♦ ♦♦♦♦ ♦♦♦♦ ♦♦♦♦ ♦♦♦♦ ♦♦♦♦ Sudan ♦♦♦♦ ↔ ♦♦♦♦ ♦♦♦♦ ♦♦♦♦ ♦♦♦♦ ♦♦♦♦ ♦♦♦♦ Tanzania ♦♦♦♦ ↔ ♦♦♦♦ ♦♦♦♦ ♦♦♦♦ ♦♦♦♦ ♦♦♦♦ ♦♦♦♦ Tunisia ♦♦♦♦ ↘ ♦♦♦♦ ♦♦♦♦ ♦♦♦♦ ♦♦♦♦ ♦♦♦♦ ♦♦♦♦ Uganda ♦♦♦♦ ↔ ♦♦♦♦ ♦♦♦♦ ♦♦♦♦ ♦♦♦♦ ♦♦♦♦ ♦♦♦♦
Low Risk ♦♦♦♦Moderate Risk ♦ ♦ ♦ ♦
High Risk ♦♦♦♦
V7.1-ES
8
2. Current State of Natural Gas Sector in Sub-Saharan Africa In 2011, the total production of natural gas in sub-Saharan Africa was approximately 1,690 Bcf; the top
gas producers were Nigeria (66%), Equatorial Guinea (14%), Mozambique (8%), Ivory Coast (3%) and
South Africa (3%) (EIA 2013c). For comparison, in 2011 the two largest natural gas producers, the U.S.
and the Russian Federation, produced 22,902 Bcf and 21,436 Bcf respectively, and the world total
production was 116,230 Bcf (BP 2013).
The largest part of Nigeria’s production is exported as LNG. The remainder is used domestically and
exported to Benin, Togo and Ghana via the West African Gas Pipeline (WAGP) (EIA 2013a). The WAGP
was the first regional natural gas transmission infrastructure developed in sub-Saharan Africa and was
opened in 2010 (Ernst & Young 2012). In Equatorial Guinea, most of the production is exported as LNG.
In 2011, Equatorial Guinea’s domestic consumption represented about 23% of its total production (EIA
2013a). The natural gas produced in Ivory Coast and South Africa is primarily used domestically (EIA
2013a). Angola has also significant proved natural gas reserves, around 9.7 tcf (ENI 2013). Most of its
gas production is flared or re-injected into oil fields. However, in 2013 Angola has started to export
LNG after the completion of its first facility (EIA 2013a).
In Eastern Africa, Mozambique and Tanzania have produced natural gas for several years. In
Mozambique, the current production is located onshore in the regions of Pande and Temane. In 2011,
135 Bcf of gas was produced in Mozambique, of which 117 Bcf was exported to South Africa (Secunda)
via a pipeline of 860 km (EIA 2013a). The Matola Gas Company (MGC) exploits a pipeline of
approximately 70 km, which connects Matola to the bigger pipeline between Pande/Temane and
Secunda (South Africa) (MGC 2013). This pipeline allows to supply around 9 Bcf/year of natural gas for
industrial activities. MGC also delivers Compressed Natural Gas (CNG) by truck to customers in remote
areas and provides gas to two refueling stations for natural gas vehicles. A new project in the region
will allow to supply gas consumers in Maputo and Marracuene (AllAfrica 2013). In a first stage, gas will
be delivered to large consumers (e.g., hospitals, hotels) and then private houses will be connected. The
first costumers should receive gas from May 2014. The pipeline extension from Matola will cost
approximately $38 million, for a total length of about 60 km ($0.63 million per km).
Tanzania currently produces natural gas in two locations, Songo Songo Island and Mnazi Bay. The
Songo Songo gas field delivers gas to Dar es Salaam via a pipeline of about 250 km. In 2011, the gas
production was about 30 Bcf (EIA 2013a). The gas produced at Mnazi Bay is used to supply the Mtwara
Power Plant via a pipeline of about 27 km. The current production is about 0.7 Bcf. A pipeline that will
allow gas deliveries from Mnazi Bay to Dar es Salam is being constructed, and expected to be
completed by 2014. Once the pipeline is commissioned, the production at Mnazi Bay should be
increased to around 30 Bcf/year.
In sub-Saharan countries, except South Africa, natural gas is predominantly used for power generation.
In South Africa, it is primarily used for GTL production, however the consumption for power generation
there may grow in the medium term, if natural gas is preferred over coal and nuclear power.
Recently, significant offshore gas resources have been indentified in Northern Mozambique and
Southern Tanzania. The estimated recoverable reserves in 2012 were around 100 tcf for Mozambique
and 20 tcf for Tanzania (Ledesma 2013). The majority of the projects that have been proposed so far
by the actors of the natural gas industry are associated with development of LNG export facilities. As
the domestic demand is at this stage quite limited, LNG projects are seen to be able to generate
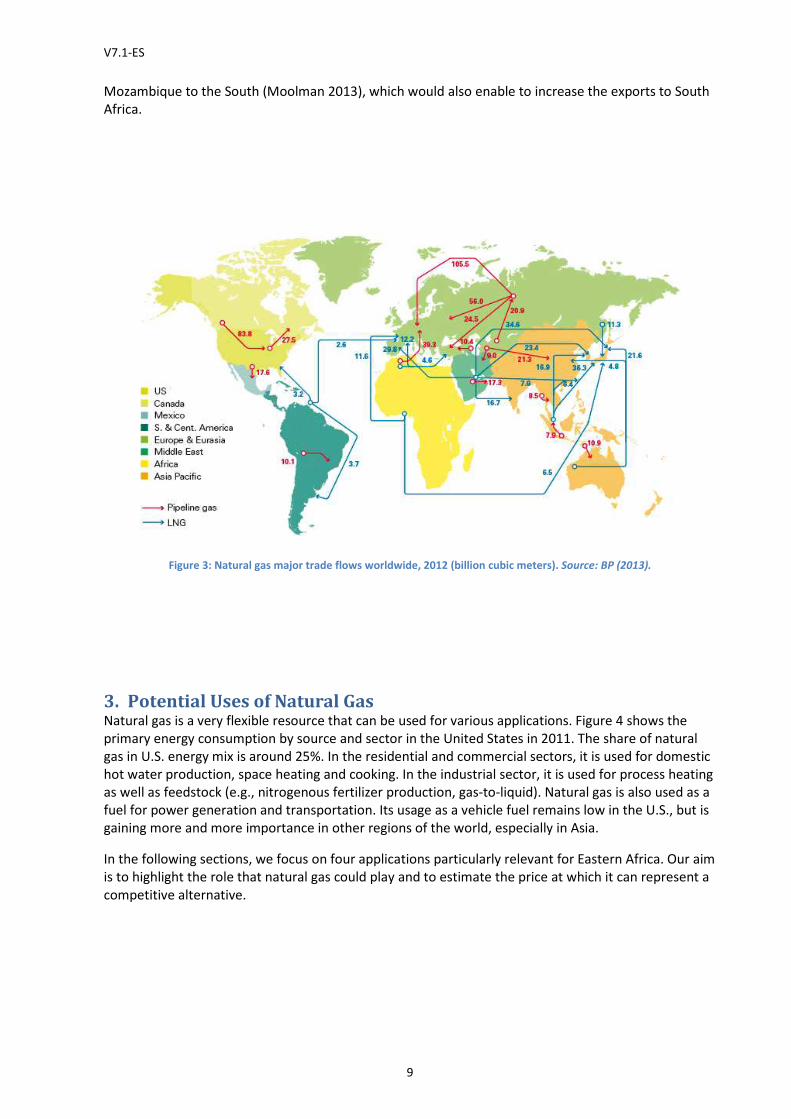
revenues more rapidly. Looking at the trade flows of natural gas worldwide (see Figure 3), one can
naturally expect that East Africa’s LNG exports would be intended to feed the Asian market. A
comparison of delivered costs to Japan by Ledesma (2013) shows that the price of East African gas
would be very close to the ones of competitors (e.g., USA and Australia). ICF International (2012) has
studied several scenarios for Mozambique’s natural gas, which include LNG export facilities as well as
domestic fertilizer, GTL and Power plants in various amounts and locations. Currently, a feasibility
study is also underway for a pipeline of 2600 km (estimated at $5 Billion) from the North of
V7.1-ES
9
Mozambique to the South (Moolman 2013), which would also enable to increase the exports to South
Africa.
Figure 3: Natural gas major trade flows worldwide, 2012 (billion cubic meters). Source: BP (2013).
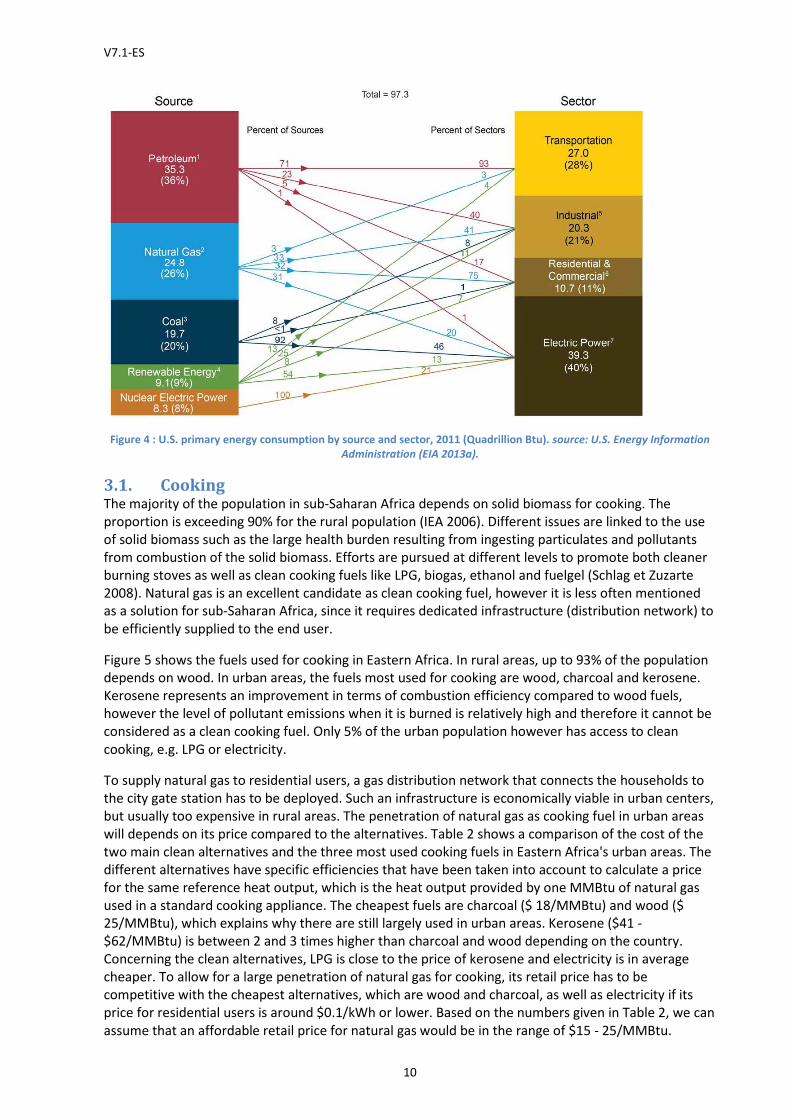
3. Potential Uses of Natural Gas Natural gas is a very flexible resource that can be used for various applications. Figure 4 shows the
primary energy consumption by source and sector in the United States in 2011. The share of natural
gas in U.S. energy mix is around 25%. In the residential and commercial sectors, it is used for domestic
hot water production, space heating and cooking. In the industrial sector, it is used for process heating
as well as feedstock (e.g., nitrogenous fertilizer production, gas-to-liquid). Natural gas is also used as a
fuel for power generation and transportation. Its usage as a vehicle fuel remains low in the U.S., but is
gaining more and more importance in other regions of the world, especially in Asia.
In the following sections, we focus on four applications particularly relevant for Eastern Africa. Our aim
is to highlight the role that natural gas could play and to estimate the price at which it can represent a
competitive alternative.
V7.1-ES
10
Figure 4 : U.S. primary energy consumption by source and sector, 2011 (Quadrillion Btu). source: U.S. Energy Information
Administration (EIA 2013a).
3.1. Cooking The majority of the population in sub-Saharan Africa depends on solid biomass for cooking. The
proportion is exceeding 90% for the rural population (IEA 2006). Different issues are linked to the use
of solid biomass such as the large health burden resulting from ingesting particulates and pollutants
from combustion of the solid biomass. Efforts are pursued at different levels to promote both cleaner
burning stoves as well as clean cooking fuels like LPG, biogas, ethanol and fuelgel (Schlag et Zuzarte
2008). Natural gas is an excellent candidate as clean cooking fuel, however it is less often mentioned
as a solution for sub-Saharan Africa, since it requires dedicated infrastructure (distribution network) to
be efficiently supplied to the end user.
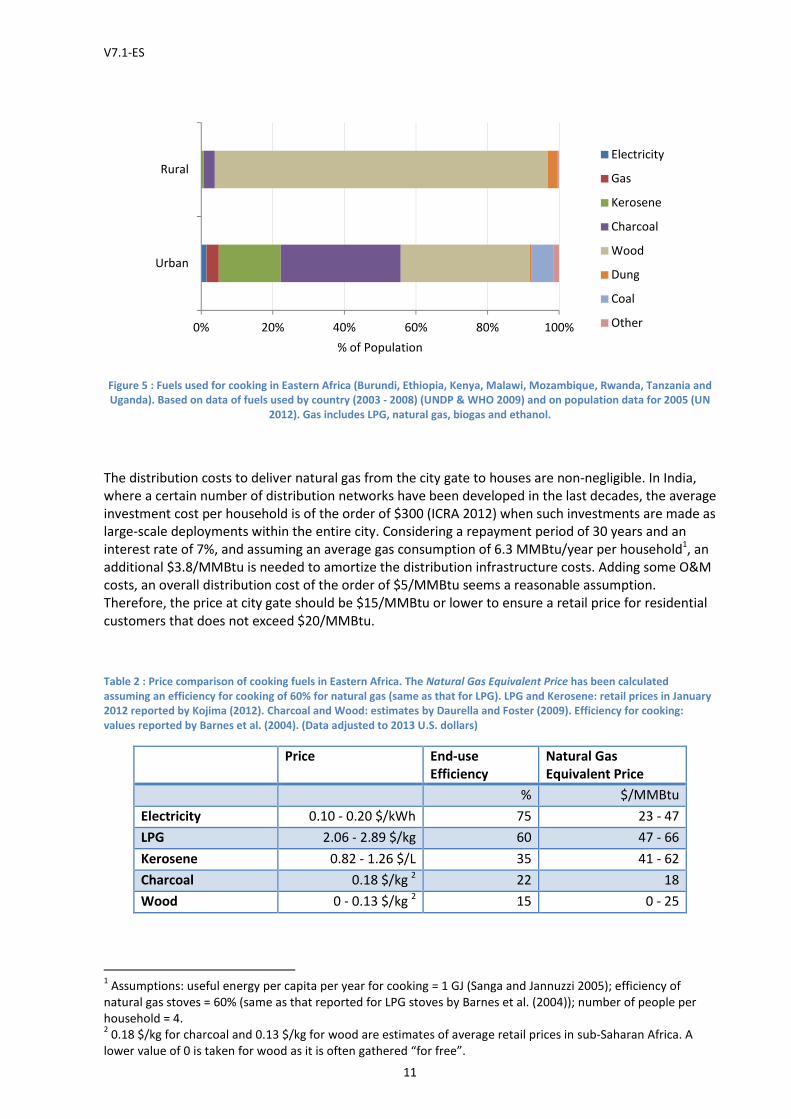
Figure 5 shows the fuels used for cooking in Eastern Africa. In rural areas, up to 93% of the population
depends on wood. In urban areas, the fuels most used for cooking are wood, charcoal and kerosene.
Kerosene represents an improvement in terms of combustion efficiency compared to wood fuels,
however the level of pollutant emissions when it is burned is relatively high and therefore it cannot be
considered as a clean cooking fuel. Only 5% of the urban population however has access to clean
cooking, e.g. LPG or electricity.
To supply natural gas to residential users, a gas distribution network that connects the households to
the city gate station has to be deployed. Such an infrastructure is economically viable in urban centers,
but usually too expensive in rural areas. The penetration of natural gas as cooking fuel in urban areas
will depends on its price compared to the alternatives. Table 2 shows a comparison of the cost of the
two main clean alternatives and the three most used cooking fuels in Eastern Africa's urban areas. The
different alternatives have specific efficiencies that have been taken into account to calculate a price
for the same reference heat output, which is the heat output provided by one MMBtu of natural gas
used in a standard cooking appliance. The cheapest fuels are charcoal ($ 18/MMBtu) and wood ($
25/MMBtu), which explains why there are still largely used in urban areas. Kerosene ($41 -
$62/MMBtu) is between 2 and 3 times higher than charcoal and wood depending on the country.
Concerning the clean alternatives, LPG is close to the price of kerosene and electricity is in average
cheaper. To allow for a large penetration of natural gas for cooking, its retail price has to be
competitive with the cheapest alternatives, which are wood and charcoal, as well as electricity if its
price for residential users is around $0.1/kWh or lower. Based on the numbers given in Table 2, we can
assume that an affordable retail price for natural gas would be in the range of $15 - 25/MMBtu.
V7.1-ES
11
Figure 5 : Fuels used for cooking in Eastern Africa (Burundi, Ethiopia, Kenya, Malawi, Mozambique, Rwanda, Tanzania and
Uganda). Based on data of fuels used by country (2003 - 2008) (UNDP & WHO 2009) and on population data for 2005 (UN
2012). Gas includes LPG, natural gas, biogas and ethanol.
The distribution costs to deliver natural gas from the city gate to houses are non-negligible. In India,
where a certain number of distribution networks have been developed in the last decades, the average
investment cost per household is of the order of $300 (ICRA 2012) when such investments are made as
large-scale deployments within the entire city. Considering a repayment period of 30 years and an
interest rate of 7%, and assuming an average gas consumption of 6.3 MMBtu/year per household1, an
additional $3.8/MMBtu is needed to amortize the distribution infrastructure costs. Adding some O&M
costs, an overall distribution cost of the order of $5/MMBtu seems a reasonable assumption.
Therefore, the price at city gate should be $15/MMBtu or lower to ensure a retail price for residential
customers that does not exceed $20/MMBtu.
Table 2 : Price comparison of cooking fuels in Eastern Africa. The Natural Gas Equivalent Price has been calculated
assuming an efficiency for cooking of 60% for natural gas (same as that for LPG). LPG and Kerosene: retail prices in January
2012 reported by Kojima (2012). Charcoal and Wood: estimates by Daurella and Foster (2009). Efficiency for cooking:
values reported by Barnes et al. (2004). (Data adjusted to 2013 U.S. dollars)
Price End-use
Efficiency
Natural Gas
Equivalent Price
% $/MMBtu
Electricity 0.10 - 0.20 $/kWh 75 23 - 47
LPG 2.06 - 2.89 $/kg 60 47 - 66
Kerosene 0.82 - 1.26 $/L 35 41 - 62
Charcoal 0.18 $/kg 2 22 18
Wood 0 - 0.13 $/kg 2 15 0 - 25
1 Assumptions: useful energy per capita per year for cooking = 1 GJ (Sanga and Jannuzzi 2005); efficiency of
natural gas stoves = 60% (same as that reported for LPG stoves by Barnes et al. (2004)); number of people per
household = 4. 2 0.18 $/kg for charcoal and 0.13 $/kg for wood are estimates of average retail prices in sub-Saharan Africa. A
lower value of 0 is taken for wood as it is often gathered “for free”.
0% 20% 40% 60% 80% 100%
Urban
Rural
% of Population
Electricity
Gas
Kerosene
Charcoal
Wood
Dung
Coal
Other

V7.1-ES
12
3.2. Power Generation In sub-Saharan Africa the production cost of electricity is highly variable. Except South Africa, the
power generation is essentially based on hydroelectricity and diesel generators. In general, where
hydropower is predominant, the average cost of electricity is lower and where diesel has a large share,
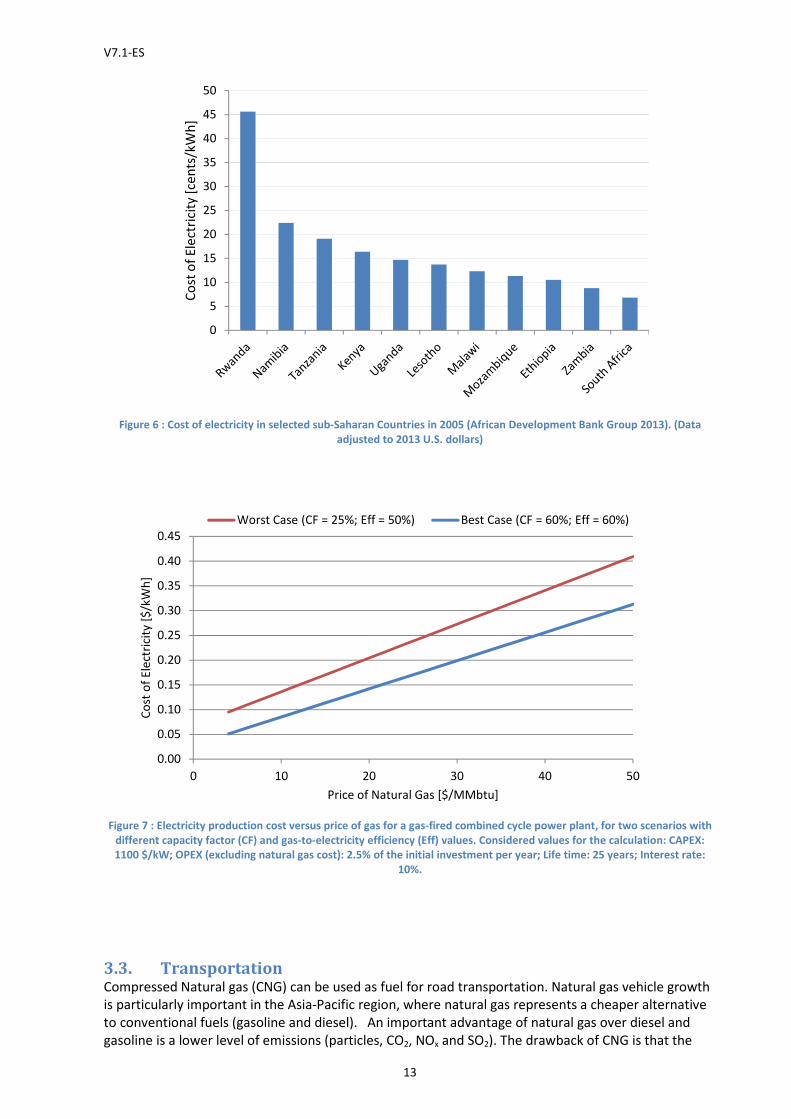
the average production cost is higher (Eberhard, et al. 2008). Figure 6 shows the average cost of
electricity production in 2005 for selected countries of Eastern and Southern Africa.
With high economic and population growths, the electricity consumption in sub-Saharan countries is
expected to increase drastically. Meeting this growing demand in a sustainable and affordable manner
is an important challenge. Solar generation has a great potential in Africa with an average daily solar
irradiation of 5 - 6 kWh/m2, however it is still negligible in the overall electricity mix. With the aim of
meeting the demand in a sustainable way, solar power should play a significant role in the future
energy portfolio of sub-Saharan Africa. At the continental level, the possibilities of development of
hydro power are important, with the advantage of low electricity production costs (around $0.03 -
0.05/kWh). However, hydro resources are not equally distributed across the continent and long-
distance transmission lines are required to fully exploit the sites with the largest potential. To integrate
a large share of fluctuating resources, like solar and wind generation, a significant dispatchable power
capacity must be available. Indeed, to maximize the profitability of the power generation portfolio, the
intermittent renewable resources have to be used as much as possible. This implies that when these
resources are available, the power generation by other power sources must be decreased. On the
contrary, when fluctuating renewable resources are not available, other power sources must
compensate for the deficit. Diesel engines, gas-fired power plants and hydro power if available can be
ideally used as dispatchable power generation. The disadvantages of diesel engines are the high O&M
costs and emissions. When natural gas is available, gas-fired combined cycle power plants represent an
interesting solution. The gas-fired combined cycle power plant is the most efficient (in terms of energy
and emissions) technology to convert a fossil fuel into electricity.
Figure 7 shows the estimated electricity production cost (operating cost + capital cost) for a gas-fired
Combined Cycle Power Plant (CCPP) as a function of the natural gas price. For comparison, in countries
where power is generated predominantly with diesel engines, Eberhard, et al. (2008) report an
average operating cost of about $0.32/kWh3. Assuming an overall electricity production cost for diesel
generators of around $0.35/kWh and considering an average case (between « Worst Case » and « Best
Case » of Figure 7) for gas-to-power, a gas price below $48/MMBtu would allow to produce electricity
with a CCPP at a lower cost than from diesel. It has to be noted that $0.35/kWh is an extrem case. In
its analysis, ICF International (2012) has considered a market price of $0.12/kWh for electricity from
natural gas in Mozambique; based on Figure 7 and considering an average case, this corresponds to a
gas price of $12/MMBtu.
3 Based on 2005 data from Africa Infrastructure Country Diagnostic (AICD Power Sector Database), 2008. (Value
adjusted to 2013 U.S. dollars)
V7.1-ES
13
Figure 6 : Cost of electricity in selected sub-Saharan Countries in 2005 (African Development Bank Group 2013). (Data
adjusted to 2013 U.S. dollars)
Figure 7 : Electricity production cost versus price of gas for a gas-fired combined cycle power plant, for two scenarios with
different capacity factor (CF) and gas-to-electricity efficiency (Eff) values. Considered values for the calculation: CAPEX:
1100 $/kW; OPEX (excluding natural gas cost): 2.5% of the initial investment per year; Life time: 25 years; Interest rate:
10%.
3.3. Transportation Compressed Natural gas (CNG) can be used as fuel for road transportation. Natural gas vehicle growth
is particularly important in the Asia-Pacific region, where natural gas represents a cheaper alternative
to conventional fuels (gasoline and diesel). An important advantage of natural gas over diesel and
gasoline is a lower level of emissions (particles, CO2, NOx and SO2). The drawback of CNG is that the
0
5
10
15
20
25
30
35
40
45
50
Co
st o
f E
lect
rici
ty [
cen
ts/k
Wh
]
0.00
0.05
0.10
0.15
0.20
0.25
0.30
0.35
0.40
0.45
0 10 20 30 40 50
Co
st o
f E
lect
rici
ty [
$/k
Wh
]
Price of Natural Gas [$/MMbtu]
Worst Case (CF = 25%; Eff = 50%) Best Case (CF = 60%; Eff = 60%)
V7.1-ES
14
range is about 3.5 times shorter when compared to gasoline or diesel for the same tank volume. The
CNG vehicle requires a cylindrical tank pressurized at about ~3500 psi (240 bar).
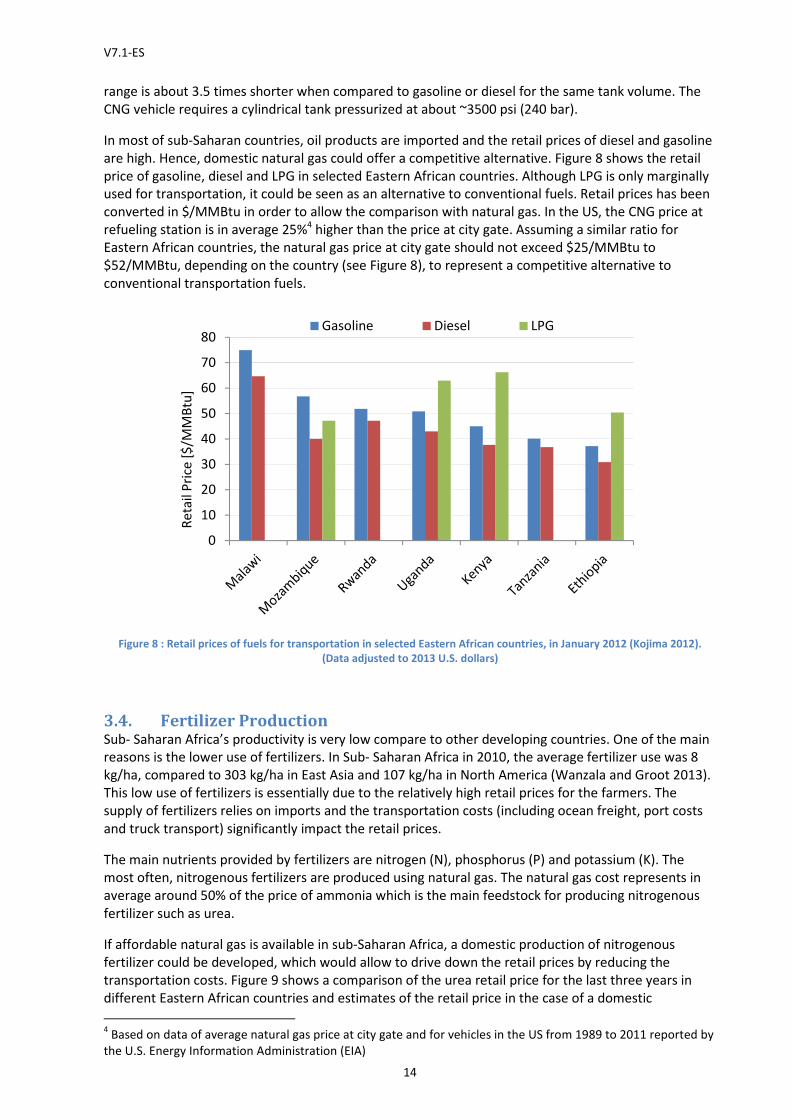
In most of sub-Saharan countries, oil products are imported and the retail prices of diesel and gasoline
are high. Hence, domestic natural gas could offer a competitive alternative. Figure 8 shows the retail
price of gasoline, diesel and LPG in selected Eastern African countries. Although LPG is only marginally
used for transportation, it could be seen as an alternative to conventional fuels. Retail prices has been
converted in $/MMBtu in order to allow the comparison with natural gas. In the US, the CNG price at
refueling station is in average 25%4 higher than the price at city gate. Assuming a similar ratio for
Eastern African countries, the natural gas price at city gate should not exceed $25/MMBtu to
$52/MMBtu, depending on the country (see Figure 8), to represent a competitive alternative to
conventional transportation fuels.
Figure 8 : Retail prices of fuels for transportation in selected Eastern African countries, in January 2012 (Kojima 2012).
(Data adjusted to 2013 U.S. dollars)
3.4. Fertilizer Production Sub- Saharan Africa’s productivity is very low compare to other developing countries. One of the main
reasons is the lower use of fertilizers. In Sub- Saharan Africa in 2010, the average fertilizer use was 8
kg/ha, compared to 303 kg/ha in East Asia and 107 kg/ha in North America (Wanzala and Groot 2013).
This low use of fertilizers is essentially due to the relatively high retail prices for the farmers. The
supply of fertilizers relies on imports and the transportation costs (including ocean freight, port costs
and truck transport) significantly impact the retail prices.
The main nutrients provided by fertilizers are nitrogen (N), phosphorus (P) and potassium (K). The
most often, nitrogenous fertilizers are produced using natural gas. The natural gas cost represents in
average around 50% of the price of ammonia which is the main feedstock for producing nitrogenous
fertilizer such as urea.
If affordable natural gas is available in sub-Saharan Africa, a domestic production of nitrogenous
fertilizer could be developed, which would allow to drive down the retail prices by reducing the
transportation costs. Figure 9 shows a comparison of the urea retail price for the last three years in
different Eastern African countries and estimates of the retail price in the case of a domestic
4 Based on data of average natural gas price at city gate and for vehicles in the US from 1989 to 2011 reported by
the U.S. Energy Information Administration (EIA)
0
10
20
30
40
50
60
70
80
Re
tail
Pri
ce [
$/M
MB
tu]
Gasoline Diesel LPG

V7.1-ES
15
production for three different natural gas prices. For the domestic production, the distribution costs
(from manufacturer to farmer) have been estimated based on the analysis of Wanzala and Groot
(2013), and Gregory and Bumb (2006), and considering that the ocean freight and port costs are
avoided and assuming that in average the domestic transport costs can be divided by 2 compared to
the usual fertilizer supply chain (procurement from overseas fertilizer manufacturers). This results in
distribution costs of around $115/ton. It appears that a domestic production with a natural gas price as
high as $15/MMBtu could supply urea at a very competitive cost ($570/ton) compared to imports.
Figure 9 shows a large variation in yearly average price for urea between 2010 and 2012. In 2010 – the
most favorable year – the average price of urea was between $549/ton and $808/ton depending on
the country. Considering these values and according to our assumptions for domestic production and
distribution, the price of natural gas should be in the range of $14 – 24/MMBtu or lower to produce
locally fertilizer that would be competitive with imports.
Figure 9 : Nitrogenous fertilizer (urea) retail price in Eastern Africa (Africafertilizer.org 2013) and retail price estimates in
case of domestic production for various natural gas (NG) prices. Urea production cost estimates based on a model from
Yara (2013) and data from Maung et al (2012) and Budidarmo (2007). Distribution cost estimates based on the analysis of
Wanzala and Groot (2013), and Gregory and Bumb (2006). (Data adjusted to 2013 U.S. dollars)
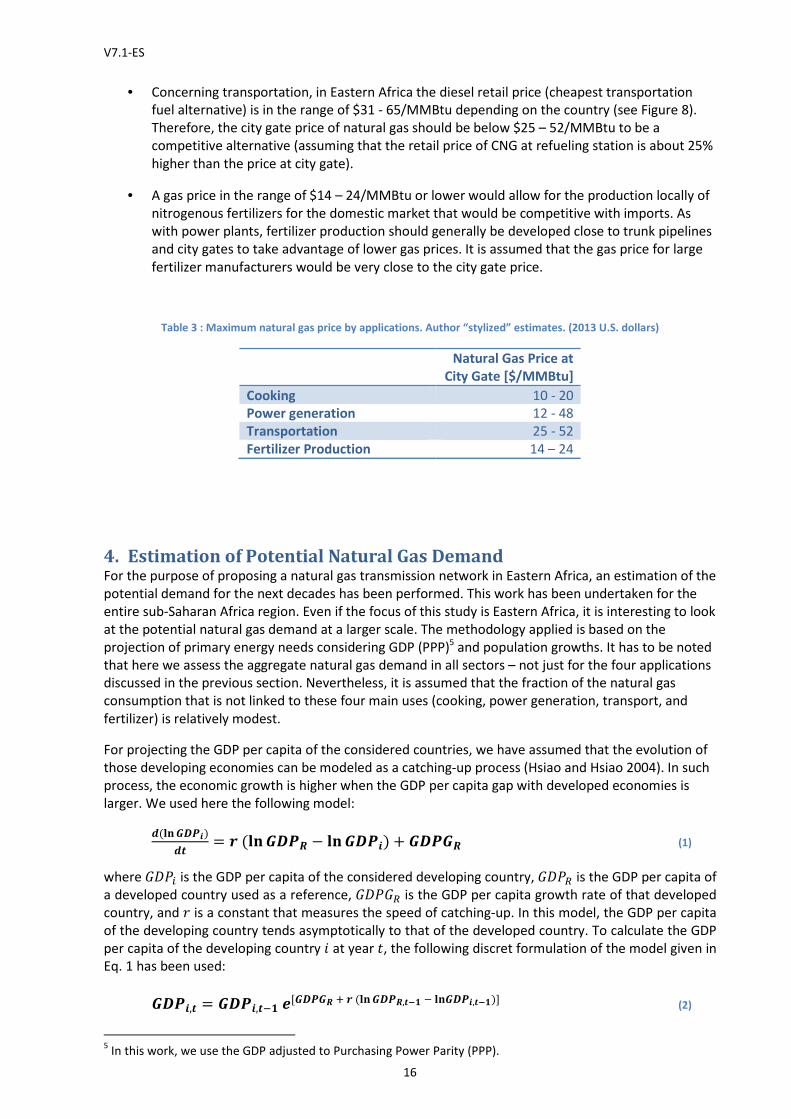
3.5. Maximum Natural Gas Price by Applications Table 3 gives our estimates of the maximum natural gas price at city gate for the four applications we
consider for Eastern Africa, based on the discussions of Sections 3.1 to 3.4.
• For cooking, with a price at city gate in the range of $10 - 20/MMBtu, the retail price for a
residential user, including distribution costs, will reach about $15 -25/MMBtu, which would be
competitive with the cheapest alternative, such as charcoal or wood.
• Concerning power generation, if gas-to-power has to compete with diesel generators currently
in use in sub-Saharan Africa, our estimates shows that the price of natural gas should be below
$48/MMBtu (it corresponds to an electricity production cost of $0.35/kWh). We will consider
here this value as an upper limit. As lower limit, we will use $12/MMBtu, which corresponds to
the market price for electricity ($0.12/kWh) considered by ICF International (2012) for its
analysis. It has to be noted that power plants could be built near trunk pipelines to take
advantage of a low natural gas price. As a large consumer and ideally located close to the city
gate, it is assumed that a power plant would buy gas at the city gate price.
0
200
400
600
800
1000
1200
1400
Pri
ce o
f U
rea
[$
/to
n]
Average 2010
Average 2011
Average 2012
NG: $5/MMBtu
NG: $10/MMBtu
NG: $15/MMBtu
V7.1-ES
16
• Concerning transportation, in Eastern Africa the diesel retail price (cheapest transportation
fuel alternative) is in the range of $31 - 65/MMBtu depending on the country (see Figure 8).
Therefore, the city gate price of natural gas should be below $25 – 52/MMBtu to be a
competitive alternative (assuming that the retail price of CNG at refueling station is about 25%
higher than the price at city gate).
• A gas price in the range of $14 – 24/MMBtu or lower would allow for the production locally of
nitrogenous fertilizers for the domestic market that would be competitive with imports. As
with power plants, fertilizer production should generally be developed close to trunk pipelines
and city gates to take advantage of lower gas prices. It is assumed that the gas price for large
fertilizer manufacturers would be very close to the city gate price.
Table 3 : Maximum natural gas price by applications. Author “stylized” estimates. (2013 U.S. dollars)
Natural Gas Price at
City Gate [$/MMBtu]
Cooking 10 - 20
Power generation 12 - 48
Transportation 25 - 52
Fertilizer Production 14 – 24
4. Estimation of Potential Natural Gas Demand For the purpose of proposing a natural gas transmission network in Eastern Africa, an estimation of the
potential demand for the next decades has been performed. This work has been undertaken for the
entire sub-Saharan Africa region. Even if the focus of this study is Eastern Africa, it is interesting to look
at the potential natural gas demand at a larger scale. The methodology applied is based on the
projection of primary energy needs considering GDP (PPP)5 and population growths. It has to be noted
that here we assess the aggregate natural gas demand in all sectors – not just for the four applications
discussed in the previous section. Nevertheless, it is assumed that the fraction of the natural gas
consumption that is not linked to these four main uses (cooking, power generation, transport, and
fertilizer) is relatively modest.
For projecting the GDP per capita of the considered countries, we have assumed that the evolution of
those developing economies can be modeled as a catching-up process (Hsiao and Hsiao 2004). In such
process, the economic growth is higher when the GDP per capita gap with developed economies is
larger. We used here the following model: �(������)
� = �(������ − ������) + ����� (1)
where ���� is the GDP per capita of the considered developing country, ���� is the GDP per capita of
a developed country used as a reference, ����� is the GDP per capita growth rate of that developed
country, and � is a constant that measures the speed of catching-up. In this model, the GDP per capita
of the developing country tends asymptotically to that of the developed country. To calculate the GDP
per capita of the developing country � at year �, the following discret formulation of the model given in
Eq. 1 has been used:
����, = ����,���[�������(������,���������,��)] (2)
5 In this work, we use the GDP adjusted to Purchasing Power Parity (PPP).
V7.1-ES
17
In our calculations, � has been set to 0.014 and we used the USA as reference with a GDP per capita
growth rate (�����) equal to 1.5% per annum (Sanoh, et al. 2014).
The primary energy needs per capita (!�") for the country � at year � is calculated using the following
relation: #�$�, = ����, % (3)
where &' is the energy intensity of GDP [kgoe/$] at year t. In our calculations, we assume that, in 2011
for the studied region, 1 kgoe corresponds to $5 of GDP (PPP) (Suehiro 2007) and that the energy
intensity is expected to improve due to efficiency measures. The energy intensity at year � is thus
calculated as follows:
% = �� − ( %�� (4)
where ϵ is the annual rate of improvement of the energy intensity, assumed to be equal to 1.14% in
our calculations.
In our scenario, it is assumed that apriori natural gas cannot be economically supplied to rural areas or
small urban centers (< 5000 inhabitants in 2000). Therefore, only the energy demands of bigger urban
centers are considered. The population of each urban center has been projected using national growth
rates reported by the United Nations (UN 2012). Finally, the projected natural gas demand (*��) of a
urban center + in a country � at year � is given by ,��-, = .,� #�$�, �/�-, (5)
where �0�1,' is the projected population of the urban center + at year � and 234 is the share of
primary energy needs that can be met with natural gas. In our calculations, we assume that 234 is
equal to 25%. For comparison, IEA is projecting the share of natural gas in the world’s energy mix
between 22% and 25% by 2035 (IEA 2011).
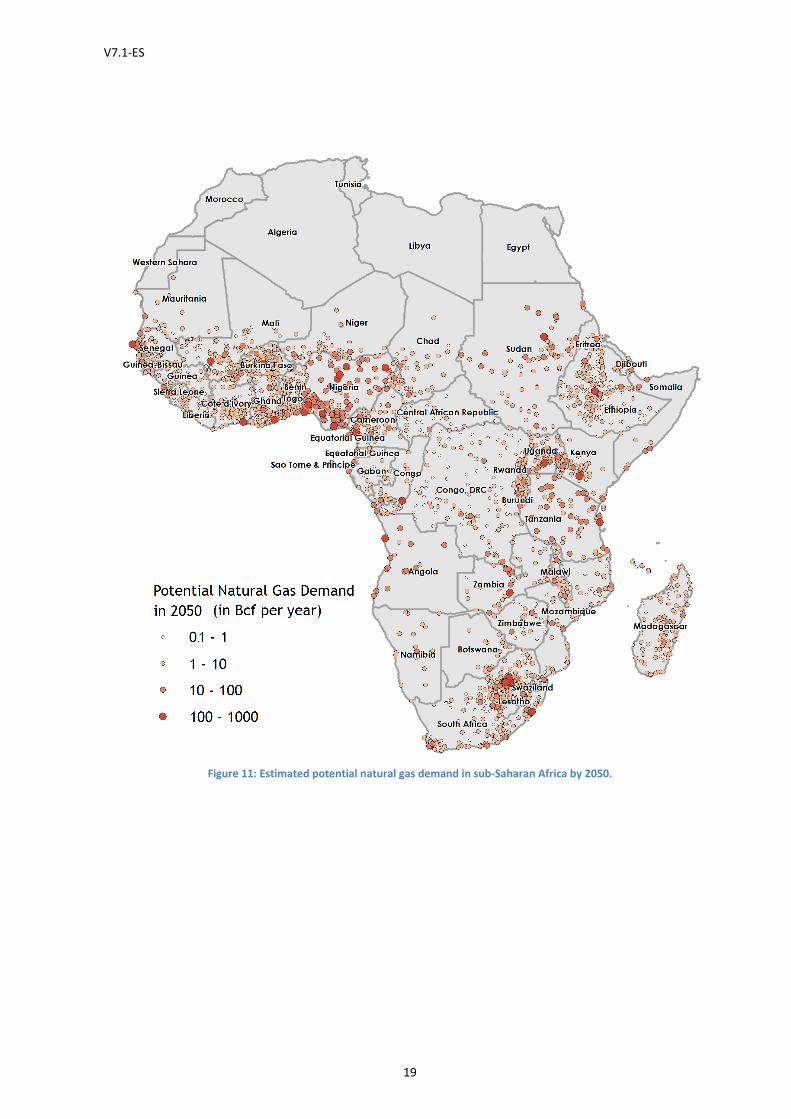
The potential natural gas demand that is obtained with the methodology described here should be
interpreted as the demand that might be reached if natural gas could be supplied to all urban centers
at a competitive price. Using this methodology, the projected potential natural gas demand for sub-
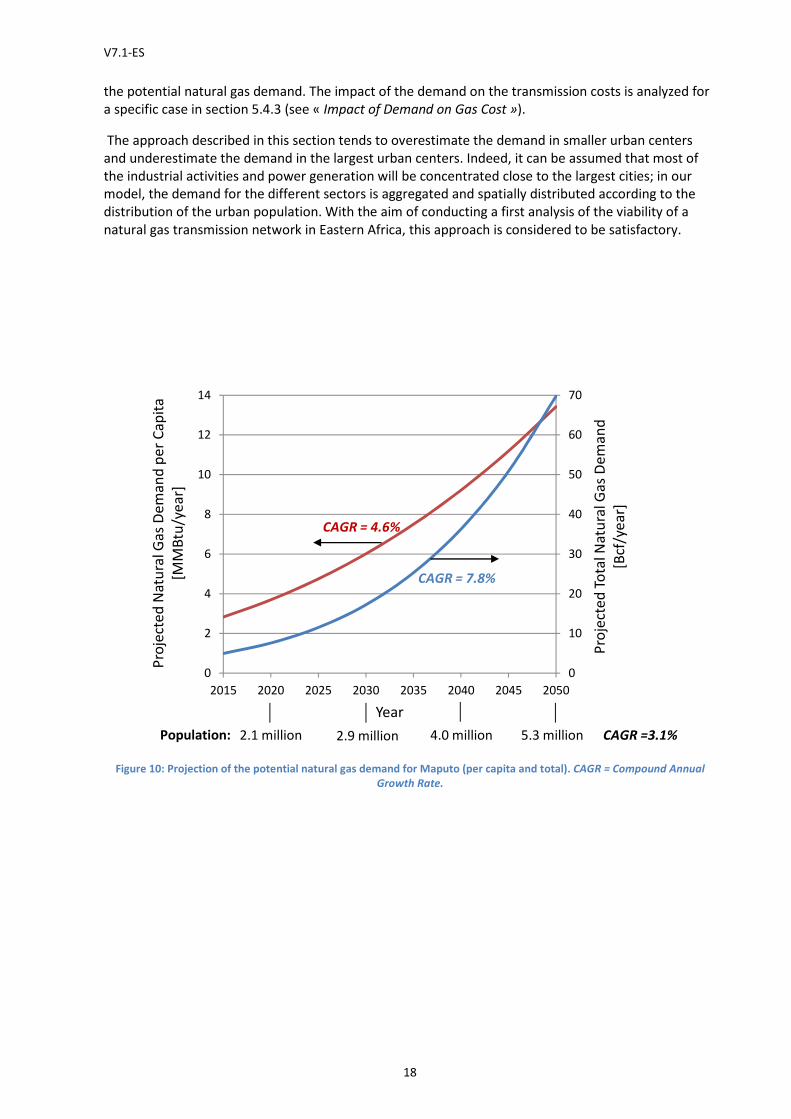
Saharan Africa is 6.5 tcf in 2030, 11.4 tcf in 2040 and 19.2 tcf in 2050. Figure 10 shows, as an example,
the projection of the potential natural gas demand for Maputo for the period 2015 – 2050. Due to the
rapid population growth combined with high GDP growth, the projected potential demand exhibits an
exponential trend. Figure 11 and 12 show maps of the potential natural gas demand by 2050 for all
urban areas of sub-Saharan Africa and for the major cities of Eastern Africa, respectively. The total
potential demand in 2050 in Western Africa is about 8.4 tcf/year, and in Eastern and Southern Africa
(together) it is about 8.1 tcf/year. Those numbers can appear very high compared to most of the
current projections of natural gas consumption in Africa. For example, EIA (2013b) reports a projected
consumption of natural gas for whole Africa (including large consumers like Algeria and Egypt) of 5.9
tcf in 2030 and 8.8 tcf in 2040, corresponding to 23% and 27% respectively of the projected total
energy consumption. The discrepancy with our projection is essentially due to the difference in the
projected primary energy demand. The model used here for projecting the primary energy demand,
which takes into account population and economic growths, predicts an exponential trend, while most
of the current projections assume a more linear growth. Our projection for the primary energy
demand of urban areas of sub-Saharan Africa by 2040 is 1073 Mtoe/year, about 5.8 times the
consumption in 2010. Although this energy demand growth may seem very high, it is in the same
range as the consumption growths that have been observed during the last three decades in China and
India. In the following, we will consider the projection presented here as the baseline assumption for
V7.1-ES
18
the potential natural gas demand. The impact of the demand on the transmission costs is analyzed for
a specific case in section 5.4.3 (see « Impact of Demand on Gas Cost »).
The approach described in this section tends to overestimate the demand in smaller urban centers
and underestimate the demand in the largest urban centers. Indeed, it can be assumed that most of
the industrial activities and power generation will be concentrated close to the largest cities; in our
model, the demand for the different sectors is aggregated and spatially distributed according to the
distribution of the urban population. With the aim of conducting a first analysis of the viability of a
natural gas transmission network in Eastern Africa, this approach is considered to be satisfactory.
Figure 10: Projection of the potential natural gas demand for Maputo (per capita and total). CAGR = Compound Annual
Growth Rate.
0
10
20
30
40
50
60
70
0
2
4
6
8
10
12
14
2015 2020 2025 2030 2035 2040 2045 2050
Pro
ject
ed
To
tal N
atu
ral G
as
De
ma
nd
[Bcf
/ye
ar]
Pro
ject
ed
Na
tura
l Ga
s D
em
an
d p
er
Ca
pit
a
[MM
Btu
/ye
ar]
Year
CAGR = 4.6%
CAGR = 7.8%
2.1 million 2.9 million 4.0 million 5.3 million CAGR =3.1%Population:
V7.1-ES
Figure 11: Estimated potential na
19
: Estimated potential natural gas demand in sub-Saharan Africa by 2050.
Africa by 2050.
V7.1-ES
Figure 12: Estimated potential natural gas demand of the
5. Costs of Supplying Natural GasThe costs of supplying natural gas to consumers can be divided in
transmission cost and distribution cost
In this work, we do not discuss
exploration and processing). For the
supply agreements with bulk consumers (e.g. LNG plant,
economic viability of his investment.
infrastructure are met and that
is available for the domestic market
Transmission refers to the transport of natural gas over long distances from prod
consumption centers. Onshore, natural gas is usually transported through pipelines, which requires a
significant infrastructure. The transmission cost highly depends on the distance
field and the transported volume.
Distribution is the transport of gas
the distribution costs ($/MMBtu)
roughly the same in all urban area
cost for residential users would be around $5/MMBtu (see section
20
potential natural gas demand of the major cities (metropolitan area) of Eastern Africa in 2050
Costs of Supplying Natural Gas The costs of supplying natural gas to consumers can be divided into three categories:
cost and distribution cost.
the conditions and the cost for developing the production (including
. For the final investment decision, the gas field developer
supply agreements with bulk consumers (e.g. LNG plant, transmission pipeline operator
economic viability of his investment. Here, we assume that the conditions to develop the upstream
infrastructure are met and that, for all scenarios discussed in the following, a sufficient volume of gas
is available for the domestic market at a production cost of $3/MMBtu (Ledesma 2013)
Transmission refers to the transport of natural gas over long distances from prod
consumption centers. Onshore, natural gas is usually transported through pipelines, which requires a
significant infrastructure. The transmission cost highly depends on the distance
field and the transported volume.
of gas from the transmission system to the end user
($/MMBtu) for residential end users and for CNG (transportation)
in all urban areas of the considered region. We have estimated that the distribution
for residential users would be around $5/MMBtu (see section 3.1) and the one for CNG would be
(metropolitan area) of Eastern Africa in 2050.
three categories: production cost,
the cost for developing the production (including
cision, the gas field developer needs long-term
transmission pipeline operator) to ensure the
that the conditions to develop the upstream
rios discussed in the following, a sufficient volume of gas
(Ledesma 2013).
Transmission refers to the transport of natural gas over long distances from production fields to
consumption centers. Onshore, natural gas is usually transported through pipelines, which requires a
significant infrastructure. The transmission cost highly depends on the distance from the production
users. We suppose that
(transportation) would be
estimated that the distribution
) and the one for CNG would be
V7.1-ES
21
approximately equal to 25% of the price at city gate (see section 3.3). For big consumers like power
plants or fertilizer plants, we assume that the distribution cost is negligible.
In the following, we focus on the economics of developing a transmission system across Eastern Africa.
5.1. Pipeline Cost model The following simple model has been used to estimates the capital cost for natural gas transmission
pipeline:
5% = 67 + 6�877.: + 6;87 (6)
with
<= : Unit capital cost of the pipeline [million $/km]
>? : Pipeline capacity [Bcf/year]
@?, @A, @B: Empirical coefficients to be tuned
The unit capital cost <= includes all components (pipes, compressor stations, city gate stations). It has
to be noted that this model is very simple and that the capital cost can significantly vary from a project
to another, for similar capacity and length, depending on topographic and terrain conditions. Also, it is
difficult to obtain costing data for recent gas pipeline projects and to project future costs. In the last
decades, the pipeline infrastructure costs were quite volatile and tripled between 1993 and 2007 (ICF
International 2009). Based on our research, we assumed the following values for the empirical
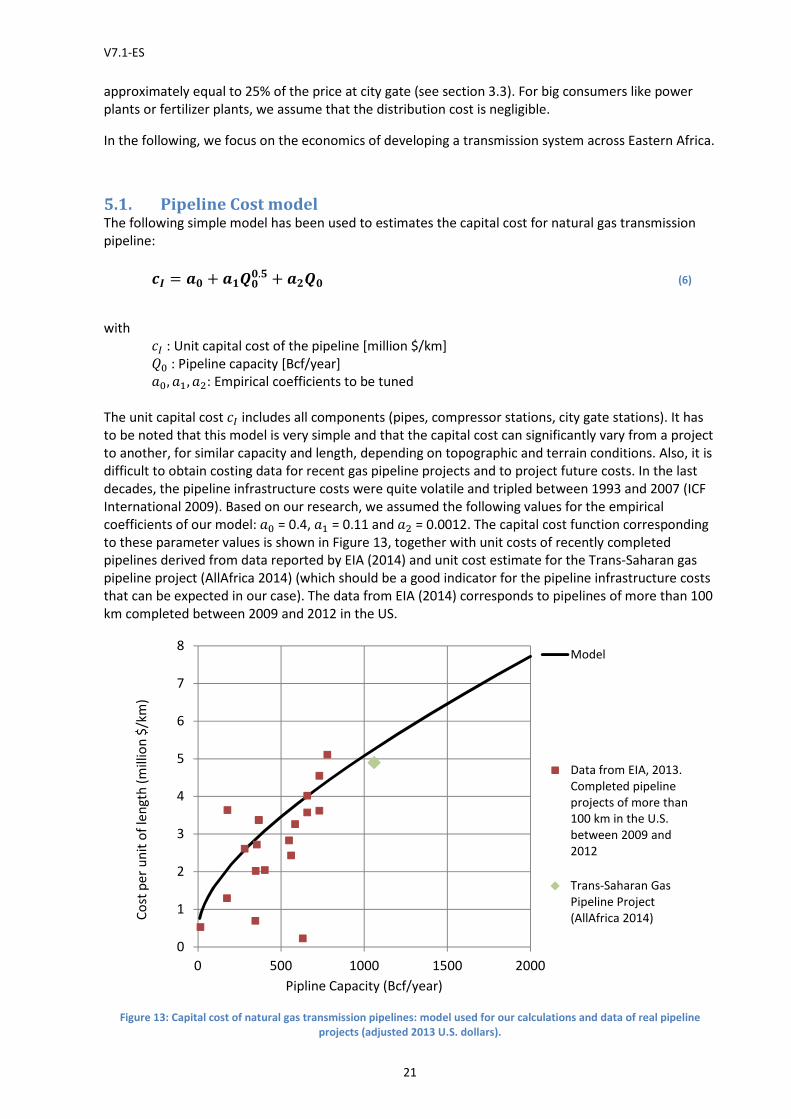
coefficients of our model: @? = 0.4, @A = 0.11 and @B = 0.0012. The capital cost function corresponding
to these parameter values is shown in Figure 13, together with unit costs of recently completed
pipelines derived from data reported by EIA (2014) and unit cost estimate for the Trans-Saharan gas
pipeline project (AllAfrica 2014) (which should be a good indicator for the pipeline infrastructure costs
that can be expected in our case). The data from EIA (2014) corresponds to pipelines of more than 100
km completed between 2009 and 2012 in the US.
Figure 13: Capital cost of natural gas transmission pipelines: model used for our calculations and data of real pipeline
projects (adjusted 2013 U.S. dollars).
0
1
2
3
4
5
6
7
8
0 500 1000 1500 2000
Co
st p
er
un
it o
f le
ng
th (
mill
ion
$/k
m)
Pipline Capacity (Bcf/year)
Model
Data from EIA, 2013.
Completed pipeline
projects of more than
100 km in the U.S.
between 2009 and
2012
Trans-Saharan Gas
Pipeline Project
(AllAfrica 2014)
V7.1-ES
22
The used transmission cost model is expressed as follows:
5C = DE�$�F�G$5%8 + F$HIJ �. 7;K × �7M⁄ (7)
with
<O: Transmission cost [$/MMBtu]
"PQ: Capital Recovery Factor [1/year]
R": Ratio of annual maintenance cost to initial investment [1/year]
Q": Fuel cost for compression [$/Bcf/km]
<= : Pipeline unit capital cost calculated with Eq. 6 [$/km]
> : Average gas volume flow [Bcf/year]
S : Pipeline length [km]
The unit capital cost <= is calculated using Eq. 6 with
87 = (� + T)8 (8)
where U is the pipeline capacity margin. The capital recovery factor is calculated as follows:
$�F = �(���)V(���)V�� (9)
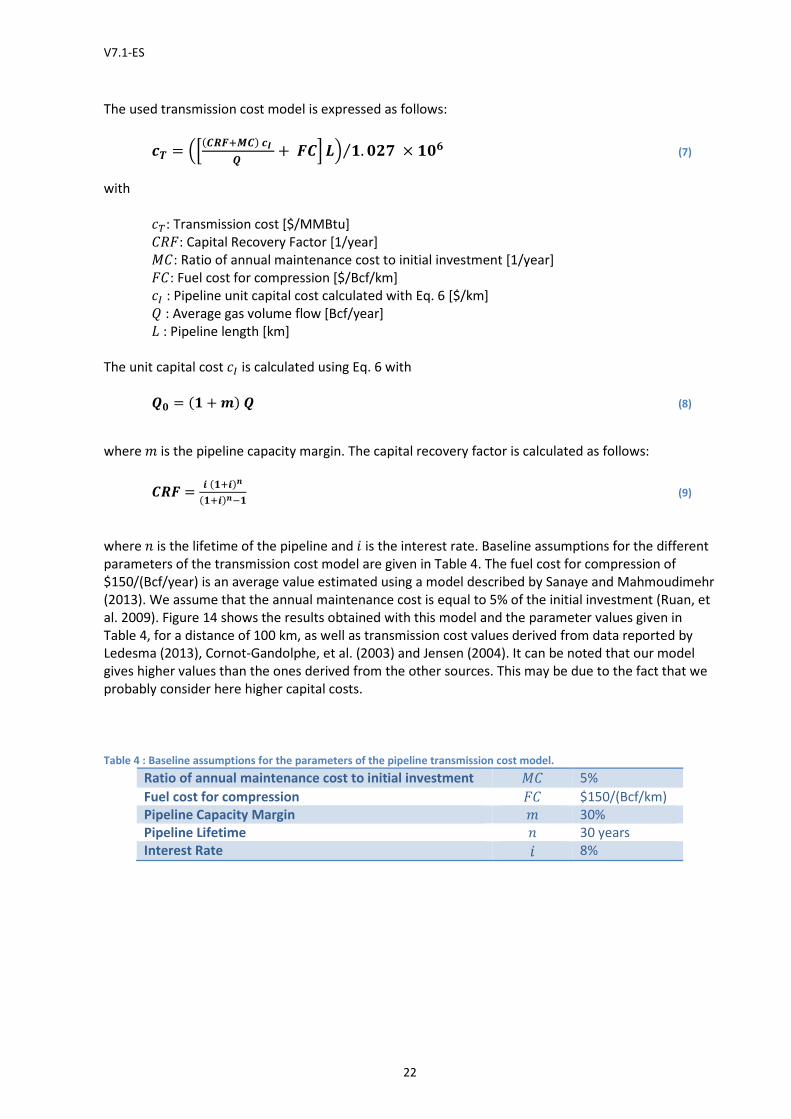
where W is the lifetime of the pipeline and � is the interest rate. Baseline assumptions for the different
parameters of the transmission cost model are given in Table 4. The fuel cost for compression of
$150/(Bcf/year) is an average value estimated using a model described by Sanaye and Mahmoudimehr
(2013). We assume that the annual maintenance cost is equal to 5% of the initial investment (Ruan, et
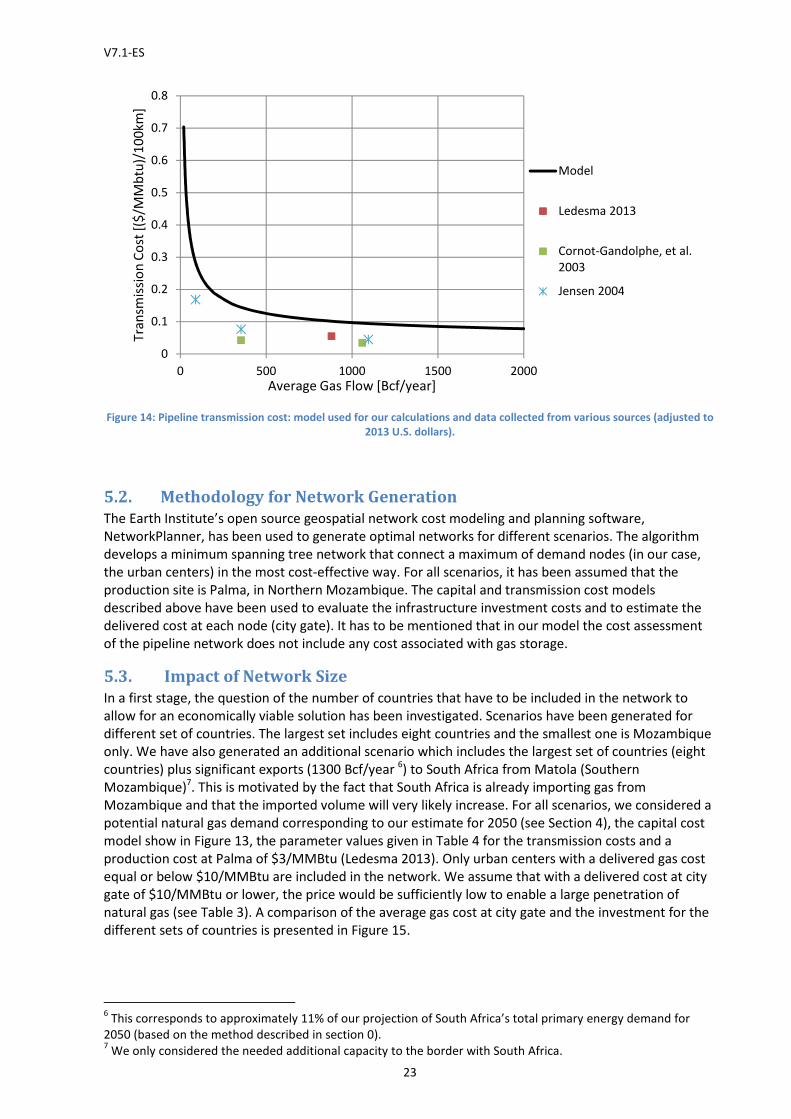
al. 2009). Figure 14 shows the results obtained with this model and the parameter values given in
Table 4, for a distance of 100 km, as well as transmission cost values derived from data reported by
Ledesma (2013), Cornot-Gandolphe, et al. (2003) and Jensen (2004). It can be noted that our model
gives higher values than the ones derived from the other sources. This may be due to the fact that we
probably consider here higher capital costs.
Table 4 : Baseline assumptions for the parameters of the pipeline transmission cost model.
Ratio of annual maintenance cost to initial investment R" 5%
Fuel cost for compression Q" $150/(Bcf/km)
Pipeline Capacity Margin U 30%
Pipeline Lifetime W 30 years
Interest Rate � 8%
V7.1-ES
23
Figure 14: Pipeline transmission cost: model used for our calculations and data collected from various sources (adjusted to
2013 U.S. dollars).
5.2. Methodology for Network Generation
The Earth Institute’s open source geospatial network cost modeling and planning software,
NetworkPlanner, has been used to generate optimal networks for different scenarios. The algorithm
develops a minimum spanning tree network that connect a maximum of demand nodes (in our case,
the urban centers) in the most cost-effective way. For all scenarios, it has been assumed that the
production site is Palma, in Northern Mozambique. The capital and transmission cost models
described above have been used to evaluate the infrastructure investment costs and to estimate the
delivered cost at each node (city gate). It has to be mentioned that in our model the cost assessment
of the pipeline network does not include any cost associated with gas storage.
5.3. Impact of Network Size
In a first stage, the question of the number of countries that have to be included in the network to
allow for an economically viable solution has been investigated. Scenarios have been generated for
different set of countries. The largest set includes eight countries and the smallest one is Mozambique
only. We have also generated an additional scenario which includes the largest set of countries (eight
countries) plus significant exports (1300 Bcf/year 6) to South Africa from Matola (Southern
Mozambique)7. This is motivated by the fact that South Africa is already importing gas from
Mozambique and that the imported volume will very likely increase. For all scenarios, we considered a
potential natural gas demand corresponding to our estimate for 2050 (see Section 4), the capital cost
model show in Figure 13, the parameter values given in Table 4 for the transmission costs and a
production cost at Palma of $3/MMBtu (Ledesma 2013). Only urban centers with a delivered gas cost
equal or below $10/MMBtu are included in the network. We assume that with a delivered cost at city
gate of $10/MMBtu or lower, the price would be sufficiently low to enable a large penetration of
natural gas (see Table 3). A comparison of the average gas cost at city gate and the investment for the
different sets of countries is presented in Figure 15.
6 This corresponds to approximately 11% of our projection of South Africa’s total primary energy demand for
2050 (based on the method described in section 0). 7 We only considered the needed additional capacity to the border with South Africa.
0
0.1
0.2
0.3
0.4
0.5
0.6
0.7
0.8
0 500 1000 1500 2000
Tra
nsm
issi
on
Co
st [
($/M
Mb
tu)/
10
0km
]
Average Gas Flow [Bcf/year]
Model
Ledesma 2013
Cornot-Gandolphe, et al.
2003
Jensen 2004
24
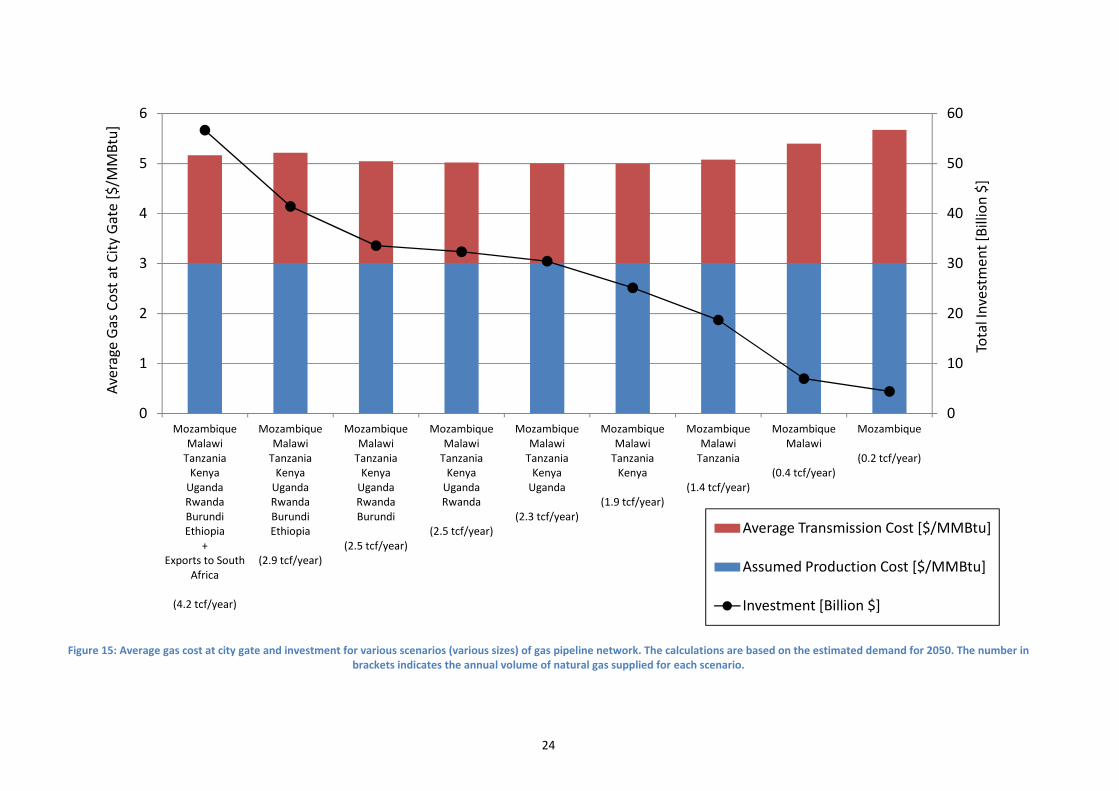
Figure 15: Average gas cost at city gate and investment for various scenarios (various sizes) of gas pipeline network. The calculations are based on the estimated demand for 2050. The number in
brackets indicates the annual volume of natural gas supplied for each scenario.
0
10
20
30
40
50
60
0
1
2
3
4
5
6
Mozambique
Malawi
Tanzania
Kenya
Uganda
Rwanda
Burundi
Ethiopia
+
Exports to South
Africa
(4.2 tcf/year)
Mozambique
Malawi
Tanzania
Kenya
Uganda
Rwanda
Burundi
Ethiopia
(2.9 tcf/year)
Mozambique
Malawi
Tanzania
Kenya
Uganda
Rwanda
Burundi
(2.5 tcf/year)
Mozambique
Malawi
Tanzania
Kenya
Uganda
Rwanda
(2.5 tcf/year)
Mozambique
Malawi
Tanzania
Kenya
Uganda
(2.3 tcf/year)
Mozambique
Malawi
Tanzania
Kenya
(1.9 tcf/year)
Mozambique
Malawi
Tanzania
(1.4 tcf/year)
Mozambique
Malawi
(0.4 tcf/year)
Mozambique
(0.2 tcf/year)
Tota
l In
vest
me
nt
[Bill
ion
$]
Ave
rage
Ga
s C
ost
at
Cit
y G
ate
[$
/MM
Btu
]
Average Transmission Cost [$/MMBtu]
Assumed Production Cost [$/MMBtu]
Investment [Billion $]
25
To develop a transmission network for the largest considered set of countries (8 countries) and with a
significant export capacity to South Africa, an investment of about $ 57 Billion would be required and
the average gas cost at city gate would be around $5.2/MMBtu. It can be noted that the average gas
cost does not vary widely (only, between $5.0/MMBtu and $5.7/MMBtu) between the different
scenarios. Therefore, the number of participating countries does not seem to be a significant criterion
to determine the economic viability of a pipeline network. However, having an important consumer
downstream in the network could have locally an important (positive) impact on the delivered gas
cost. For example, when exports to South Africa are included (first scenario of Figure 15), the gas cost
in Maputo (Southern Mozambique) is relatively low - $5.5/MMBtu -,because Mozambique’s capital
city takes advantage of being located on a high-capacity pipeline segment which is highly cost-
effective. When exports to South Africa are not included (2nd scenario of Figure 15), the gas cost in
Maputo increases to $8.2/MMBtu, because the infrastructure is developed for a lower gas supply,
which is less cost-effective.
5.4. Detailed Analysis for a Set of Eight Countries
In the following, we have undertaken a detailed analysis for a set of eight countries (Mozambique,
Malawi, Tanzania, Kenya, Uganda, Burundi, Rwanda and Ethiopia) with significant exports to South
Africa8 (first configuration in Figure 15).
5.4.1. Baseline Scenario
The baseline scenario (already briefly discussed above in section 5.3) is based on our estimate of the
potential natural gas demand for 2050 (see Section 4), the capital cost model show in Figure 13, the
parameter values given in Table 4 for the transmission costs and a production cost at Palma of
$3/MMBtu (Ledesma 2013). The volume of natural gas that is exported from Matola to South Africa is
assumed to be 1300 Bcf/year 9. Only urban centers with a delivered gas cost equal or below
$10/MMBtu are included in the network. As previously mentioned, with a delivered cost at city gate
lower than $10/MMBtu, we assume that the gas price would be sufficiently low to ensure a large
demand (see Table 3).
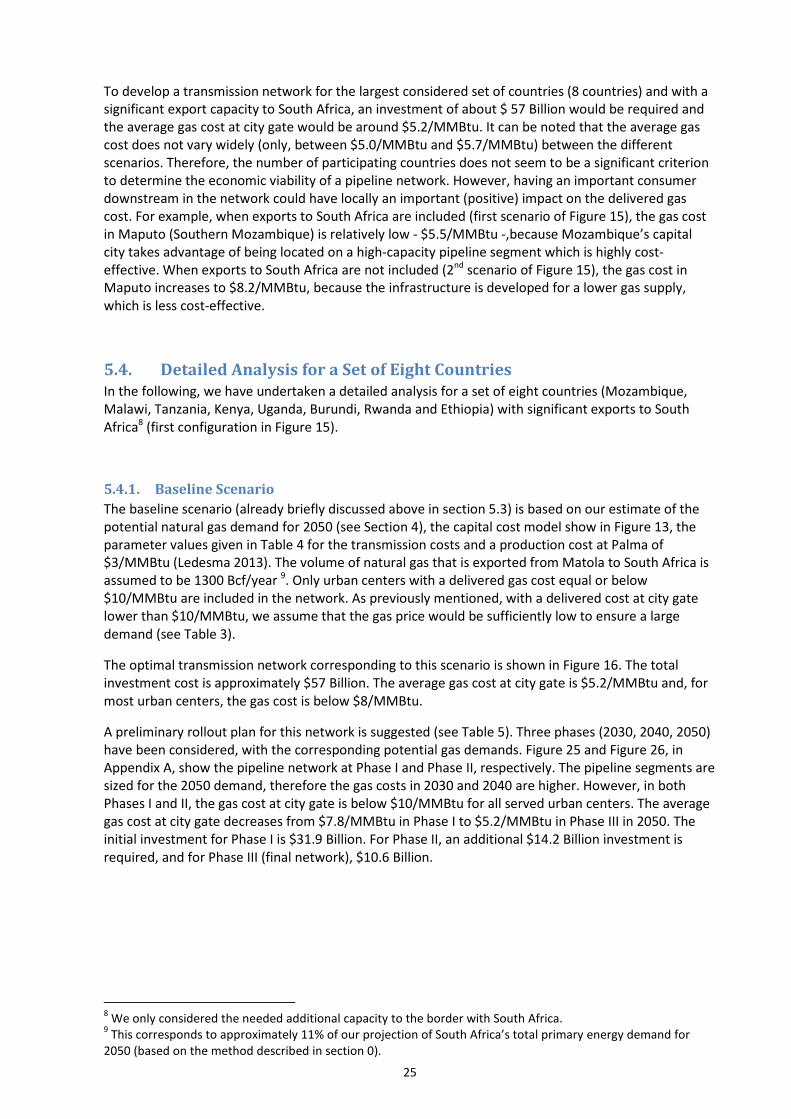
The optimal transmission network corresponding to this scenario is shown in Figure 16. The total
investment cost is approximately $57 Billion. The average gas cost at city gate is $5.2/MMBtu and, for
most urban centers, the gas cost is below $8/MMBtu.
A preliminary rollout plan for this network is suggested (see Table 5). Three phases (2030, 2040, 2050)
have been considered, with the corresponding potential gas demands. Figure 25 and Figure 26, in
Appendix A, show the pipeline network at Phase I and Phase II, respectively. The pipeline segments are
sized for the 2050 demand, therefore the gas costs in 2030 and 2040 are higher. However, in both
Phases I and II, the gas cost at city gate is below $10/MMBtu for all served urban centers. The average
gas cost at city gate decreases from $7.8/MMBtu in Phase I to $5.2/MMBtu in Phase III in 2050. The
initial investment for Phase I is $31.9 Billion. For Phase II, an additional $14.2 Billion investment is
required, and for Phase III (final network), $10.6 Billion.
8 We only considered the needed additional capacity to the border with South Africa.
9 This corresponds to approximately 11% of our projection of South Africa’s total primary energy demand for
2050 (based on the method described in section 0).
V7.1-ES
26
Figure 16 : Optimal transmission pipeline network and gas cost at city gate for the baseline scenario. Based on the
estimated gas demand for 2050 and a gas production cost of $3/MMBtu. It is assumed that 1300 Bcf/year is exported from
Matola (Southern Mozambique) to South Africa. The required investment is estimated at $56.7 Billion.
Table 5 : Construction phases for the optimal transmission pipeline network shown in Figure 16 (see Appendix A for maps
of Phases I and II). Phase III corresponds to the final network in 2050.
Phase I – 2030 Phase II – 2040 Phase III – 2050
Participating Countries Mozambique (part.) Mozambique (part.) Mozambique
Malawi Malawi Malawi
Tanzania (part.) Tanzania (part.) Tanzania
Kenya (part.) Kenya
Uganda (part.) Uganda
Rwanda
Burundi
Ethiopia
Investment [Billion $] 31.9 +14.2 +10.6
Cumulative Length [km] 4080 +3992 +6992
Average Gas Cost at City Gate
[$/MMBtu]
7.8 6.4 5.2
Gas Consumption [Bcf/year]
Mozambique 47 101 259
Malawi 28 72 166
Tanzania 113 436 955
Kenya 282 571
Uganda 139 416
Rwanda 130
Burundi 39
Ethiopia 360
Exports to South Africa 800 1000 1300
Total 987 2029 4197
Gas Source
V7.1-ES
27
5.4.2. High-Cost Scenario
In our model, a number of assumptions have to be made for the various parameters affecting the
delivered gas cost. In this section, we present a high-cost scenario generated by considering less
favorable values for the various parameters. Table 6 summarizes the differences with the baseline
scenario. In the high-cost scenario, a lower natural gas demand is considered (60% of the baseline
scenario). The pipeline sizing is however kept the same as for the baseline scenario, leading to a lower
pipeline utilization rate. Capital costs 40% higher are considered. For the baseline scenario, an interest
rate of 8% has been assumed, which corresponds to a relatively low rate that would be applied by
development finance institutions. In the high-cost scenario, an interest rate of 15% is considered,
which is close to what can be expected in case of private financing. Finally, a maintenance cost 40%
higher (7% of the initial investment) and a fuel cost for compression 33% higher ($200/Bcf/km) are
considered for the high-cost scenario.
Table 6 : Differences between the baseline scenario and the high-cost scenario.
Baseline Scenario High-Cost Scenario
Demand 25% of the projected primary
energy demand in 2050
+ 1300 Bcf/year exported to
South Africa
60% of the baseline scenario
Investment Costs
Capital Cost Model Model shown in Figure 13 140% of the baseline scenario
Pipeline Sizing Based on projected gas
demand (25% projected
primary energy) + 30%
capacity margin (pipeline
utilization = 77%)
Same size as baseline
scenario (pipeline utilization
= 46%)
Transmission Costs
Annual Interest Rate 8% 15%
Annual Maintenance Cost 5% of the initial investment 7% of the initial investment
Fuel Cost for Compression $150/Bcf/km $200/Bcf/km
The pipeline network of the high-cost scenario is based on the network generated for the baseline
scenario. The nodes for which the delivered gas cost is higher than $15/MMBtu are not taken into
account; we assume that with a delivered cost at city gate higher than $15/MMBtu, the gas price
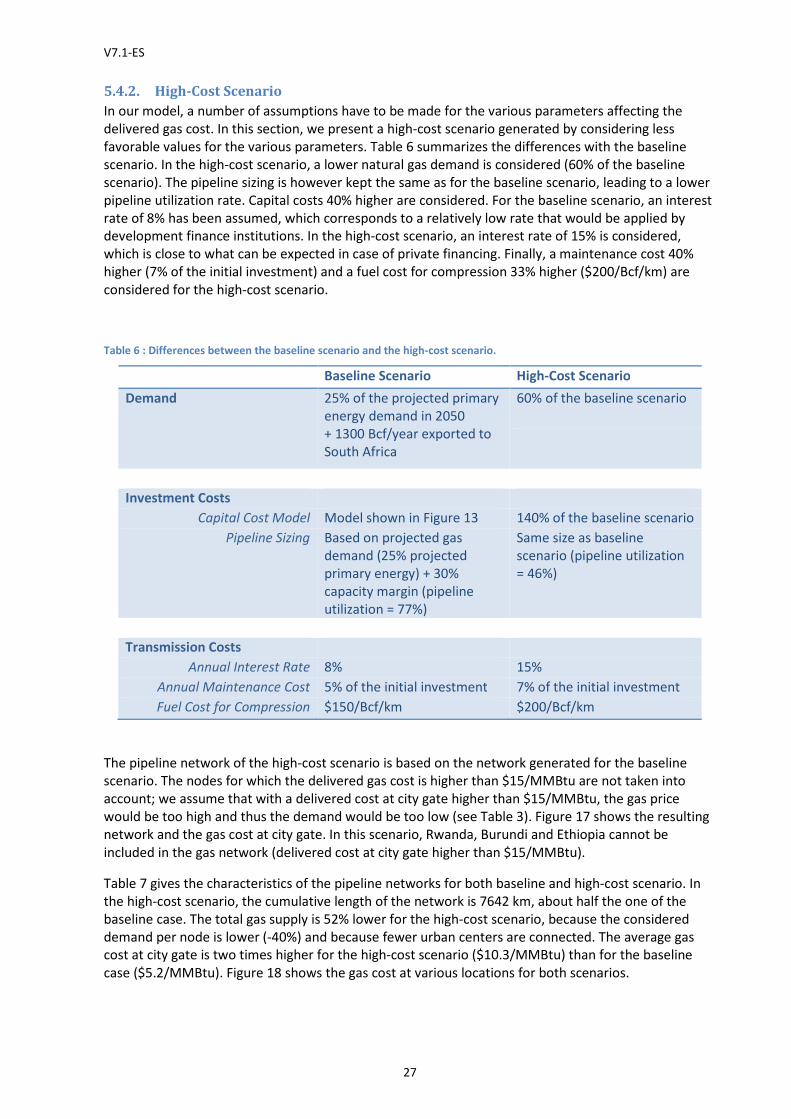
would be too high and thus the demand would be too low (see Table 3). Figure 17 shows the resulting
network and the gas cost at city gate. In this scenario, Rwanda, Burundi and Ethiopia cannot be
included in the gas network (delivered cost at city gate higher than $15/MMBtu).
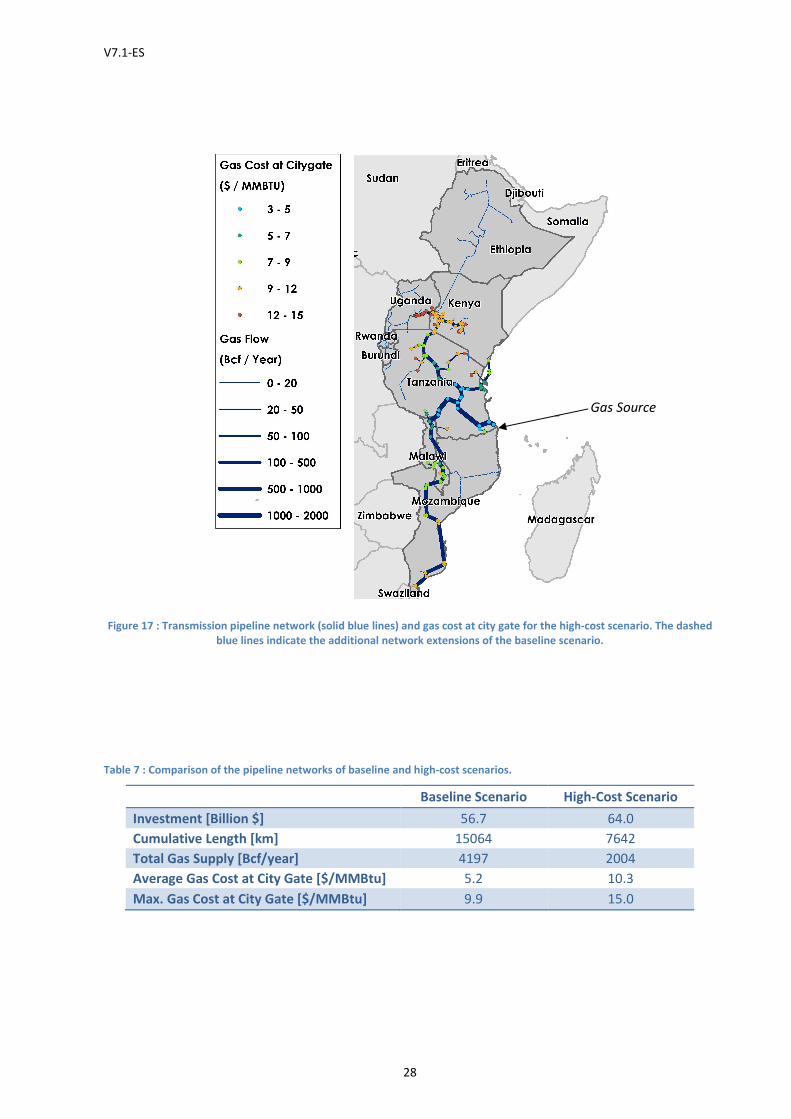
Table 7 gives the characteristics of the pipeline networks for both baseline and high-cost scenario. In
the high-cost scenario, the cumulative length of the network is 7642 km, about half the one of the
baseline case. The total gas supply is 52% lower for the high-cost scenario, because the considered
demand per node is lower (-40%) and because fewer urban centers are connected. The average gas
cost at city gate is two times higher for the high-cost scenario ($10.3/MMBtu) than for the baseline
case ($5.2/MMBtu). Figure 18 shows the gas cost at various locations for both scenarios.
V7.1-ES
28
Figure 17 : Transmission pipeline network (solid blue lines) and gas cost at city gate for the high-cost scenario. The dashed
blue lines indicate the additional network extensions of the baseline scenario.
Table 7 : Comparison of the pipeline networks of baseline and high-cost scenarios.
Baseline Scenario High-Cost Scenario
Investment [Billion $] 56.7 64.0
Cumulative Length [km] 15064 7642
Total Gas Supply [Bcf/year] 4197 2004
Average Gas Cost at City Gate [$/MMBtu] 5.2 10.3
Max. Gas Cost at City Gate [$/MMBtu] 9.9 15.0
Gas Source
V7.1-ES
29
Figure 18 : Comparison of gas cost at city gate for the baseline and high-cost scenarios.
5.4.3. Sensitivity Analyses
The aim here is to assess how the delivered gas cost is affected by the different parameters. Based on
the baseline scenario presented in section 5.4.1 various scenarios have been calculated for different
gas demands, capital costs, operating costs and planned capacities.
Impact of Demand on Gas Cost
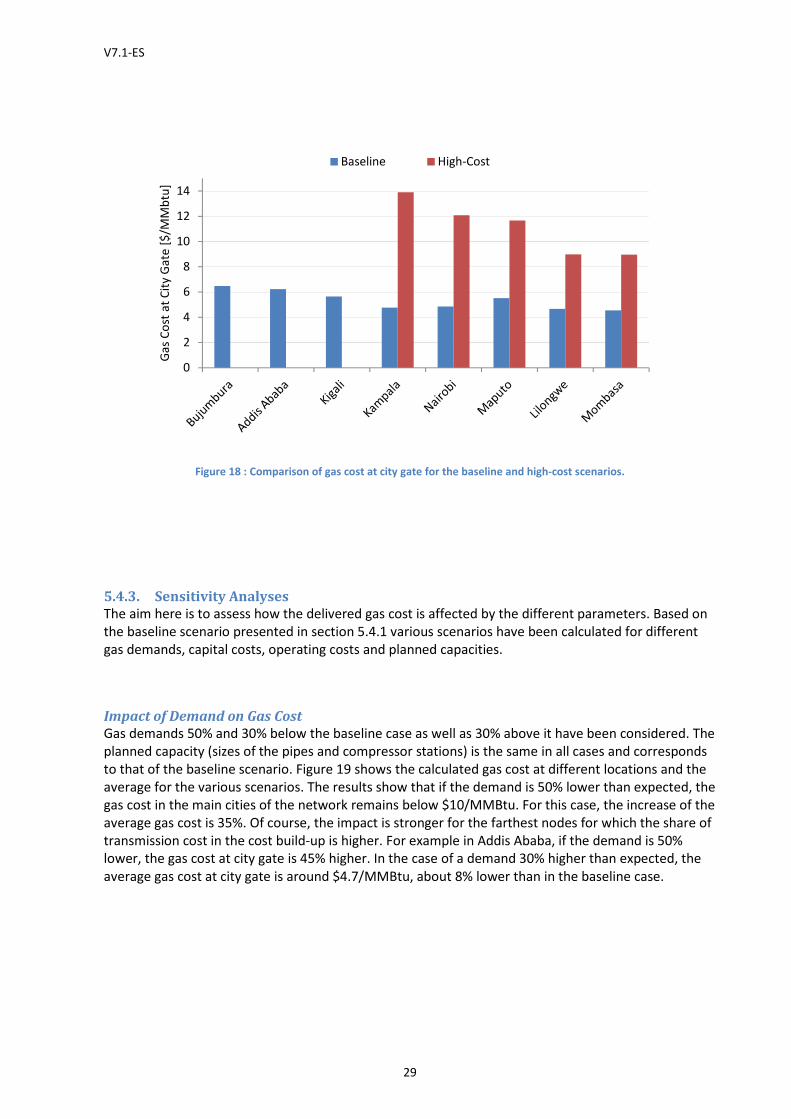
Gas demands 50% and 30% below the baseline case as well as 30% above it have been considered. The
planned capacity (sizes of the pipes and compressor stations) is the same in all cases and corresponds
to that of the baseline scenario. Figure 19 shows the calculated gas cost at different locations and the
average for the various scenarios. The results show that if the demand is 50% lower than expected, the
gas cost in the main cities of the network remains below $10/MMBtu. For this case, the increase of the
average gas cost is 35%. Of course, the impact is stronger for the farthest nodes for which the share of
transmission cost in the cost build-up is higher. For example in Addis Ababa, if the demand is 50%
lower, the gas cost at city gate is 45% higher. In the case of a demand 30% higher than expected, the
average gas cost at city gate is around $4.7/MMBtu, about 8% lower than in the baseline case.
0
2
4
6
8
10
12
14
Ga
s C
ost
at
Cit
y G
ate
[$
/MM
btu
]Baseline High-Cost
V7.1-ES
30
Figure 19 : Comparison of gas cost at city gate for various demand scenarios. In the baseline scenario, the overall gas
demand is equal to 4197 Bcf/year. The additional scenarios correspond to gas demands 50% and 30% below the baseline
case as well as 30% above it.
Impact of Capital Cost on Gas Cost
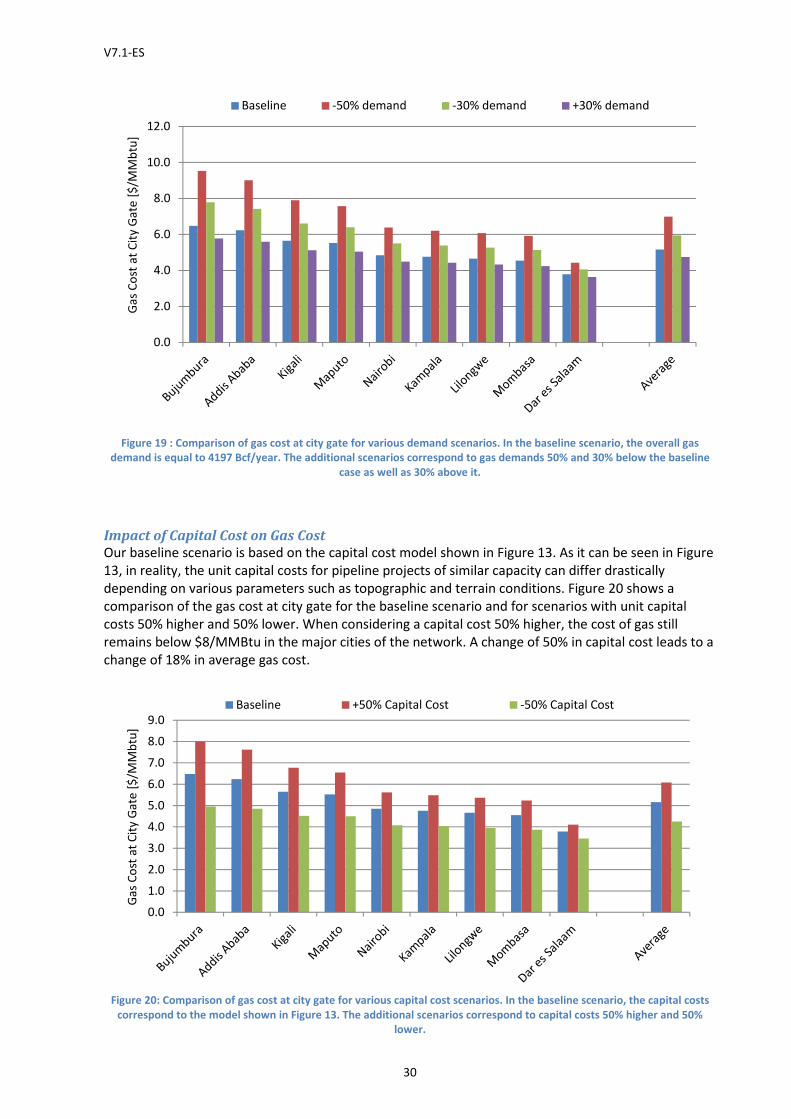
Our baseline scenario is based on the capital cost model shown in Figure 13. As it can be seen in Figure
13, in reality, the unit capital costs for pipeline projects of similar capacity can differ drastically
depending on various parameters such as topographic and terrain conditions. Figure 20 shows a
comparison of the gas cost at city gate for the baseline scenario and for scenarios with unit capital
costs 50% higher and 50% lower. When considering a capital cost 50% higher, the cost of gas still
remains below $8/MMBtu in the major cities of the network. A change of 50% in capital cost leads to a
change of 18% in average gas cost.
Figure 20: Comparison of gas cost at city gate for various capital cost scenarios. In the baseline scenario, the capital costs
correspond to the model shown in Figure 13. The additional scenarios correspond to capital costs 50% higher and 50%
lower.
0.0
2.0
4.0
6.0
8.0
10.0
12.0G
as
Co
st a
t C
ity
Ga
te [
$/M
Mb
tu]
Baseline -50% demand -30% demand +30% demand
0.0
1.0
2.0
3.0
4.0
5.0
6.0
7.0
8.0
9.0
Ga
s C
ost
at
Cit
y G
ate
[$
/MM
btu
]
Baseline +50% Capital Cost -50% Capital Cost

V7.1-ES
31
Impact of Operating Costs on Gas Cost
For the baseline scenario, we assumed that the annual maintenance cost is equal to 5% of the initial
investment and that the fuel cost for compression is $150/Bcf/km. At this stage it is difficult to have
accurate estimates of those costs, which depend on various parameters (price of energy, cost of labor,
…) specific to the location of the pipeline. Figure 21 shows a comparison of the gas cost at city gate for
various operating costs scenarios. A change of 50% in overall operating costs (maintenance and fuel
costs) leads to a change of 10% in average gas cost.
Figure 21: Comparison of gas cost at city gate for various operating costs scenarios. In the baseline scenario, the annual
maintenance cost is equal to 5% of the initial investment and the fuel cost is equal to $150/Bcf/km. The additional
scenarios assume overall operating costs 50% higher (maintenance cost = 7.5% of initial investment and fuel cost =
$225/Bcf/km) and 50% lower (maintenance cost = 2.5% of initial investment and fuel cost = $75/Bcf/km).
Impact of Planned Capacity on Gas Cost
Three additional scenarios have been computed assuming that the network shown in Figure 16 is
developed for lower capacities. We considered capacities equal to 25%, 50% and 75% of that of our
baseline case (total gas supply = 4197 Bcf/year). In each case, we assumed an average pipeline
utilization of 77%.
The four scenarios are compared in Figure 22. The results show that when the network is developed
for a capacity 75% lower than that of the baseline scenario, the needed investment is reduced by 51%.
Because of economies of scale, when the planned capacity (and accordingly the demand, since we
assumed the same pipeline utilization rate in all scenarios) decreases, the delivered gas cost increases.
For example, with a capacity 75% lower than that of the baseline scenario, the average gas cost at city
gate is 33% higher.
0.0
1.0
2.0
3.0
4.0
5.0
6.0
7.0
8.0
Ga
s C
ost
at
Cit
y G
ate
[$
/MM
btu
]
Baseline +50% Overall Operating Costs -50% Overall Operating Costs
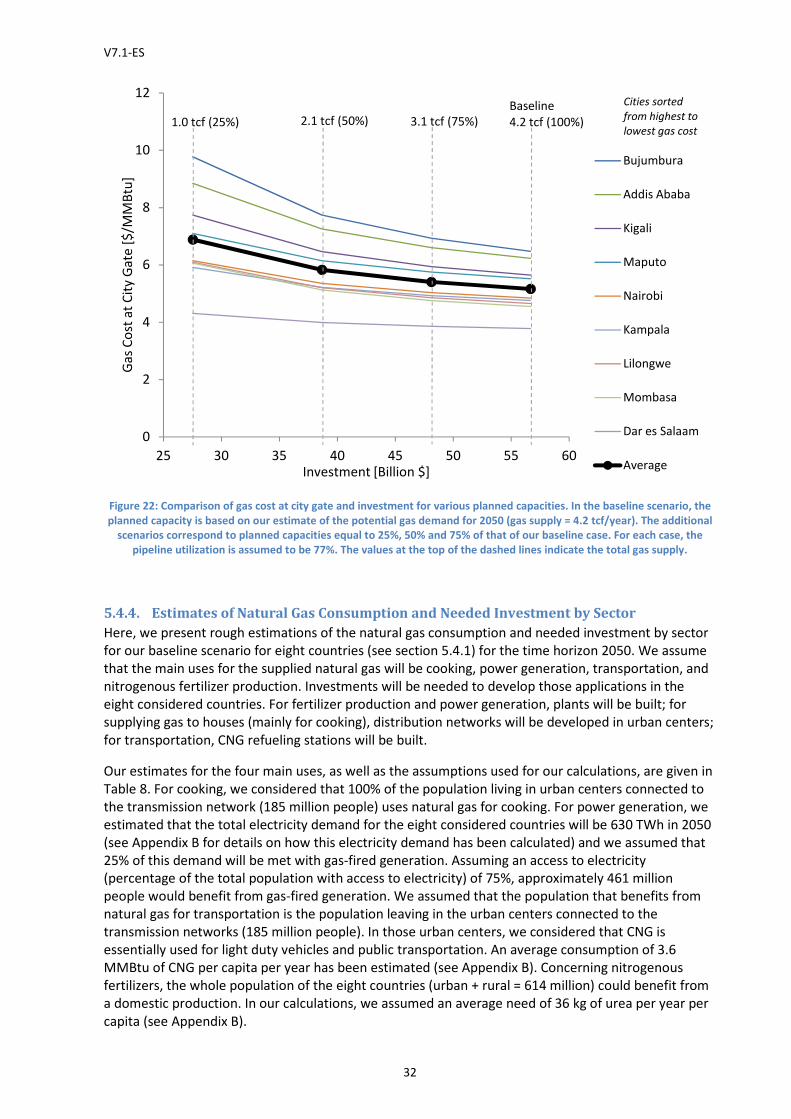
V7.1-ES
32
Figure 22: Comparison of gas cost at city gate and investment for various planned capacities. In the baseline scenario, the
planned capacity is based on our estimate of the potential gas demand for 2050 (gas supply = 4.2 tcf/year). The additional
scenarios correspond to planned capacities equal to 25%, 50% and 75% of that of our baseline case. For each case, the
pipeline utilization is assumed to be 77%. The values at the top of the dashed lines indicate the total gas supply.
5.4.4. Estimates of Natural Gas Consumption and Needed Investment by Sector
Here, we present rough estimations of the natural gas consumption and needed investment by sector
for our baseline scenario for eight countries (see section 5.4.1) for the time horizon 2050. We assume
that the main uses for the supplied natural gas will be cooking, power generation, transportation, and
nitrogenous fertilizer production. Investments will be needed to develop those applications in the
eight considered countries. For fertilizer production and power generation, plants will be built; for
supplying gas to houses (mainly for cooking), distribution networks will be developed in urban centers;
for transportation, CNG refueling stations will be built.
Our estimates for the four main uses, as well as the assumptions used for our calculations, are given in
Table 8. For cooking, we considered that 100% of the population living in urban centers connected to
the transmission network (185 million people) uses natural gas for cooking. For power generation, we
estimated that the total electricity demand for the eight considered countries will be 630 TWh in 2050
(see Appendix B for details on how this electricity demand has been calculated) and we assumed that
25% of this demand will be met with gas-fired generation. Assuming an access to electricity
(percentage of the total population with access to electricity) of 75%, approximately 461 million
people would benefit from gas-fired generation. We assumed that the population that benefits from
natural gas for transportation is the population leaving in the urban centers connected to the
transmission networks (185 million people). In those urban centers, we considered that CNG is
essentially used for light duty vehicles and public transportation. An average consumption of 3.6
MMBtu of CNG per capita per year has been estimated (see Appendix B). Concerning nitrogenous
fertilizers, the whole population of the eight countries (urban + rural = 614 million) could benefit from
a domestic production. In our calculations, we assumed an average need of 36 kg of urea per year per
capita (see Appendix B).
0
2
4
6
8
10
12
25 30 35 40 45 50 55 60
Ga
s C
ost
at
Cit
y G
ate
[$
/MM
Btu
]
Investment [Billion $]
Bujumbura
Addis Ababa
Kigali
Maputo
Nairobi
Kampala
Lilongwe
Mombasa
Dar es Salaam
Average
Baseline
4.2 tcf (100%)3.1 tcf (75%)2.1 tcf (50%)1.0 tcf (25%)
Cities sorted
from highest to
lowest gas cost

33
Table 8: Estimates of natural gas consumption and needed investment by sector for the baseline scenario for eight countries (Mozambique, Malawi, Tanzania, Kenya, Uganda, Burundi, Rwanda and
Ethiopia) for the time horizon 2050.
Assumptions Population Affected
[Million]
Consumption
[Bcf/year]
(% of total
consumption)
Total Investments
[Billion $]
Cooking -
Distribution
Networks within
Urban Centers
• 100% of the population of the urban centers served by the transmission network
uses natural gas for cooking
• Average consumption per capita (in urban centers connected to natural gas):
1.58 MMBtu/year 10
• Average number of people per household: 4 (-> 46.3 million households)
• Capital cost: $300/household 11
185 285
(12%) 13.9
Power Generation
• Total electric power consumption: 630 TWh/year 12
• Share of gas-fired generation: 25% (-> 157.5 TWh/year)
• Average efficiency of gas-fired power plants: 55%
• Average capacity factor of gas-fired power plants: 45% (-> 40 GW)
• Capital cost: $1100/kW
46113
951
(39%) 43.9
Transportation -
CNG Refueling
Stations
• Average consumption per capita (in urban centers connected to natural gas):
3.6 MMBtu/year 12
• One CNG stations per 30,000 inhabitants (-> 6,167 CNG stations)
• Capital cost: $1.5 million/Station
185 648
(27%) 9.3
Fertilizer Production
• Considered population: 100% (rural + urban)
• 36 kg of urea per year per capita 12
(-> 22,104,000 t/years)
• 26 MMBtu of natural gas per tonne of urea 14
• Capital cost: $1500/(t/year)
614 560
(23%) 33.2
Total 2444 Bcf/year $100 Billion
10
Assumptions: useful energy per capita per year for cooking = 1 GJ (Sanga and Jannuzzi 2005); efficiency of natural gas stoves = 60% (same as that reported for LPG stoves by
Barnes et al. (2004)). 11
Based on ICRA (2012). 12
See Appendix B for details on how these values have been estimated. 13
Assumed access to electricity = 75%. 14
Based on Yara (2013).
34
Power generation is the sector with the largest consumption of natural gas (39%). Transportation and
nitrogenous fertilizer production have similar shares, with 27% and 23% respectively. Cooking
accounts for 12%. The total natural gas consumption for these four applications is 2444 Bcf/year. This
is equal to 84% of the consumption obtained previously (see Table 5, 4197 [total supply] – 1300
[exports to South Africa] = 2897 Bcf/year) with our assumption that natural gas consumption is equal
to 25% of the projected primary energy demand of the connected urban centers (see section 4). This
shows that our initial assumption for the gas demand (25% of the primary energy demand of the
connected urban centers) is consistent with a bottom-up approach by sector as presented here. Also,
besides the consumption for the four uses discussed in this analysis, one can expect an additional
consumption for other industrial and manufacturing activities.
The sectors that need the most important investments are power generation and fertilizer production,
with $43.9 Billion and $33.2 Billion respectively. The development of distribution networks in 263
cities/towns to connect a total of about 46 million households would cost around $13.9 Billion. The
needed investment to build 6,167 CNG refueling stations is of the order of $9.3 Billion.
It has to be mentioned that besides the investments given in Table 8, additional investments will have
to be made by final consumers. This includes, for example, gas cook stoves, CNG vehicles or industrial
gas boilers/burners. A part of the investments will be related to energy consumers who will switch to
natural gas. However, taking into account the current economic growth and increase in access to
modern energy services, we can assume that a significant part will be also linked to new “modern
energy” consumers who will invest in appliances and equipment independently of the availability of
natural gas (e.g. a household who switch from charcoal to an electric stove for cooking or a family who
buys a diesel car). It is therefore difficult to assess the part of the investments made by final
consumers that is directly linked to natural gas and it is beyond the scope of this paper.
5.4.5. Comparison of Infrastructure Investment: Pipeline Network vs. LNG
Our aim here is to give a point of comparison for the needed investments calculated for our pipeline
scenarios. Most of the big projects for exploiting East Africa’s natural gas resources currently under
study concern the development of LNG export facilities. ICF International (2012) discusses various
scenarios including between 6 and 8 LNG trains of 5 million tonnes per annum (MMtpa) each. For its
analysis, ICF International (2012) assumed a capital cost of $5,380 million per train (including interest
during construction). In the last decade, the average liquefaction unit costs for greenfield projects have
increased drastically, from around $380/tonne for facilities completed between 2000 and 2004 to
$690/tonne for facilities completed between 2005 and 2009, and are expected to be around
$1300/tonne for the next ten years (IGU 2013).
Table 9 gives the estimated capital costs for the pipeline network of the baseline scenario discussed
above and for six LNG trains (according to scenario #1 proposed by ICF International (2012)). Only the
capital costs for liquefaction plants have been considered; it is assumed that LNG tankers and
regasification facilities are or will be available to transport and process this LNG supply. In our
calculations, a unit capital cost of $1000/tonne for the liquefaction facilities has been considered. The
results show that the needed investment for the pipeline network corresponds approximately to two
times the one for a liquefaction facility of six trains (5 MMtpa each). It is interesting to compare the
ratios of needed investment to volume of gas supplied/processed. For the regional pipeline network,
this ratio is equal to $13.5 million/(Bcf/year), about two thirds of the one for the liquefaction facility
($20.5 million/(Bcf/year)). When taking into account the costs for developing the different sectors
(power generation, fertilizer production, distribution network within cities and CNG refueling stations),
the investment-supply ratio for the regional pipeline network scenario ($37.4 million/(Bcf/year)) is
around 1.8 times higher than for the LNG facility.

V7.1-ES
Table 9: Comparison of capital costs between pipeline network and liquefaction facility. For the liquefaction facility, a unit
capital cost of $1000/tonne is assumed. The numbers in brackets correspond to the investment for building the pipeline
network ($56.7 Billion) plus the needed investments to develop the different sectors ($
Pipeline Network (8 countries
+ exports to South Africa)
Baseline Scenario
6 LNG trains, 5 MMtpa each
(Scenario #1 of ICF
International 2012)
5.4.6. Comparison of Potential Profit: Pipeline Network vs. LNG
As previously mentioned, the projects that have been proposed so far by the actors of the natural gas
industry are predominantly associated with LNG exports. The advantage of LNG exports is that the
market is already developed. Moreover, the export infrast
consumers, which allows to conclude short
prices. Currently, Asia is the region of the world with the highest LNG demand, followed by Europe. In
2012, Japan, South Korea, China, India and Taiwan imported a
of the world LNG imports (BP 2013)
East Africa’s LNG exports would primarily
in East Asia have been varying between $
Figure 23). However, it is not certain that LNG prices in Asia will remain such high in the
Before Fukushima disaster in 2011, the LNG prices in East Asia were close to the ones of the European
market (see Figure 23).
Figure 23 : Landed LNG prices in Europe and East Asia.
While LNG gives flexibility in terms of serve
revenues, the risks associated with global price volatility are much more important than in the case of
a regional gas pipeline network. With the development of sha
significant LNG exporter, which could drive down prices. Using existing LNG import infrastructure, the
U.S. would be able to develop a number of export facilities at lower costs than in the case of greenfield
projects, and thus could be a serious competitor f
longer-term, China’s shale gas might also have a significant impact on gas pricing in Asia. Technically
recoverable shale gas resources in China are estimated at 1,115 tcf
2013d). If these resources can be exploited at sufficiently low costs, gas prices in Asia might drop
35
: Comparison of capital costs between pipeline network and liquefaction facility. For the liquefaction facility, a unit
is assumed. The numbers in brackets correspond to the investment for building the pipeline
network ($56.7 Billion) plus the needed investments to develop the different sectors ($100 Billion) (see section
Investment
[Billion $]
Gas
Supplied/Processed
[Bcf/year]
Investment
Pipeline Network (8 countries
+ exports to South Africa) - 56.7 (157) 4197
6 LNG trains, 5 MMtpa each
30.0 1461
Comparison of Potential Profit: Pipeline Network vs. LNG
As previously mentioned, the projects that have been proposed so far by the actors of the natural gas
industry are predominantly associated with LNG exports. The advantage of LNG exports is that the
market is already developed. Moreover, the export infrastructure can be used to serve different
consumers, which allows to conclude short-term contracts and take advantage of the highest market
prices. Currently, Asia is the region of the world with the highest LNG demand, followed by Europe. In
th Korea, China, India and Taiwan imported a total of 8 tcf of LNG, representing 69%
(BP 2013). Given the relative proximity and the high market price
s LNG exports would primarily be intended to feed the Asian market. L
between $13/MMBtu and $20/MMBtu since the end of 2011
However, it is not certain that LNG prices in Asia will remain such high in the
in 2011, the LNG prices in East Asia were close to the ones of the European
: Landed LNG prices in Europe and East Asia. Source: U.S. Energy Information Administration (EIA 2013e).
While LNG gives flexibility in terms of served markets and might allow to generate more rapidly large
revenues, the risks associated with global price volatility are much more important than in the case of
a regional gas pipeline network. With the development of shale gas, the U.S. might become a
nificant LNG exporter, which could drive down prices. Using existing LNG import infrastructure, the
U.S. would be able to develop a number of export facilities at lower costs than in the case of greenfield
projects, and thus could be a serious competitor for the Asian market (Ernst & Young 2013)
term, China’s shale gas might also have a significant impact on gas pricing in Asia. Technically
recoverable shale gas resources in China are estimated at 1,115 tcf, the largest in the world (EIA
). If these resources can be exploited at sufficiently low costs, gas prices in Asia might drop
: Comparison of capital costs between pipeline network and liquefaction facility. For the liquefaction facility, a unit
is assumed. The numbers in brackets correspond to the investment for building the pipeline
Billion) (see section 5.4.4).
Investment-Supply
Ratio [Million
$/(Bcf/year)]
13.5 (37.4)
20.5
As previously mentioned, the projects that have been proposed so far by the actors of the natural gas
industry are predominantly associated with LNG exports. The advantage of LNG exports is that the
ructure can be used to serve different
term contracts and take advantage of the highest market
prices. Currently, Asia is the region of the world with the highest LNG demand, followed by Europe. In
cf of LNG, representing 69%
high market prices there,
d the Asian market. Landed prices of LNG
since the end of 2011 (see
However, it is not certain that LNG prices in Asia will remain such high in the long term.
in 2011, the LNG prices in East Asia were close to the ones of the European
Source: U.S. Energy Information Administration (EIA 2013e).
d markets and might allow to generate more rapidly large
revenues, the risks associated with global price volatility are much more important than in the case of
le gas, the U.S. might become a
nificant LNG exporter, which could drive down prices. Using existing LNG import infrastructure, the
U.S. would be able to develop a number of export facilities at lower costs than in the case of greenfield
(Ernst & Young 2013). In the
term, China’s shale gas might also have a significant impact on gas pricing in Asia. Technically
, the largest in the world (EIA
). If these resources can be exploited at sufficiently low costs, gas prices in Asia might drop. The
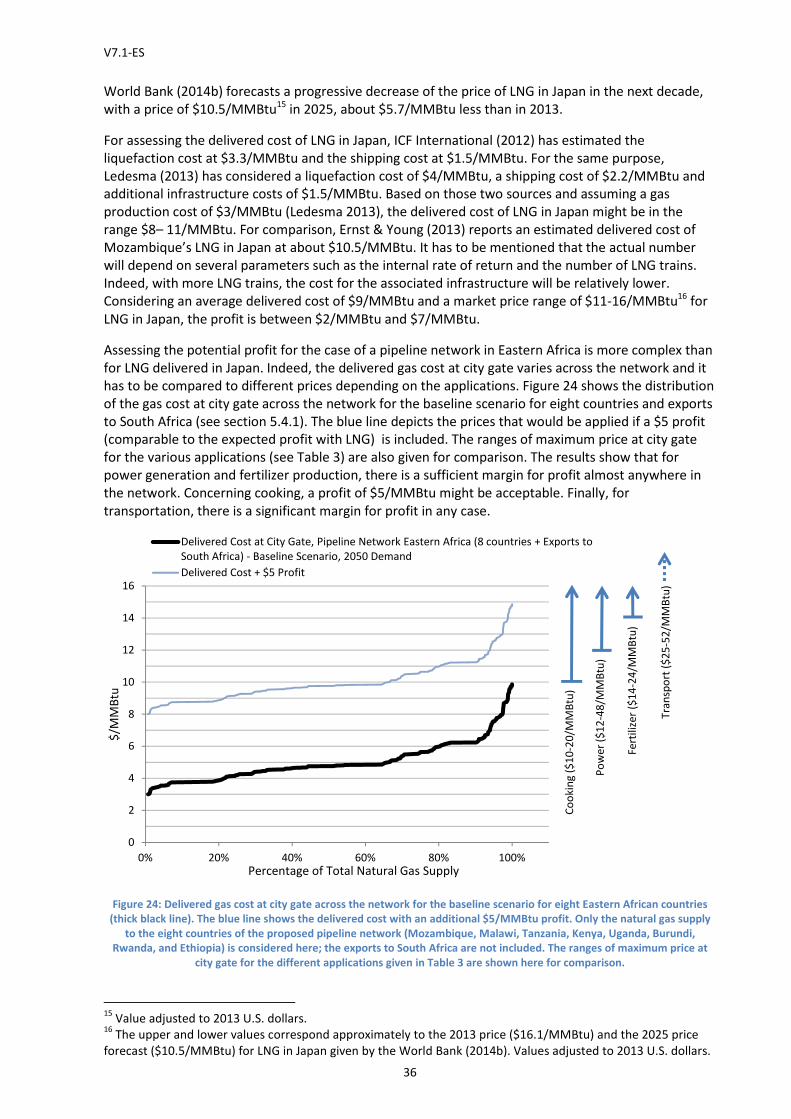
V7.1-ES
36
World Bank (2014b) forecasts a progressive decrease of the price of LNG in Japan in the next decade,
with a price of $10.5/MMBtu15 in 2025, about $5.7/MMBtu less than in 2013.
For assessing the delivered cost of LNG in Japan, ICF International (2012) has estimated the
liquefaction cost at $3.3/MMBtu and the shipping cost at $1.5/MMBtu. For the same purpose,
Ledesma (2013) has considered a liquefaction cost of $4/MMBtu, a shipping cost of $2.2/MMBtu and
additional infrastructure costs of $1.5/MMBtu. Based on those two sources and assuming a gas
production cost of $3/MMBtu (Ledesma 2013), the delivered cost of LNG in Japan might be in the
range $8– 11/MMBtu. For comparison, Ernst & Young (2013) reports an estimated delivered cost of
Mozambique’s LNG in Japan at about $10.5/MMBtu. It has to be mentioned that the actual number
will depend on several parameters such as the internal rate of return and the number of LNG trains.
Indeed, with more LNG trains, the cost for the associated infrastructure will be relatively lower.
Considering an average delivered cost of $9/MMBtu and a market price range of $11-16/MMBtu16 for
LNG in Japan, the profit is between $2/MMBtu and $7/MMBtu.
Assessing the potential profit for the case of a pipeline network in Eastern Africa is more complex than
for LNG delivered in Japan. Indeed, the delivered gas cost at city gate varies across the network and it
has to be compared to different prices depending on the applications. Figure 24 shows the distribution
of the gas cost at city gate across the network for the baseline scenario for eight countries and exports
to South Africa (see section 5.4.1). The blue line depicts the prices that would be applied if a $5 profit
(comparable to the expected profit with LNG) is included. The ranges of maximum price at city gate
for the various applications (see Table 3) are also given for comparison. The results show that for
power generation and fertilizer production, there is a sufficient margin for profit almost anywhere in
the network. Concerning cooking, a profit of $5/MMBtu might be acceptable. Finally, for
transportation, there is a significant margin for profit in any case.
Figure 24: Delivered gas cost at city gate across the network for the baseline scenario for eight Eastern African countries
(thick black line). The blue line shows the delivered cost with an additional $5/MMBtu profit. Only the natural gas supply
to the eight countries of the proposed pipeline network (Mozambique, Malawi, Tanzania, Kenya, Uganda, Burundi,
Rwanda, and Ethiopia) is considered here; the exports to South Africa are not included. The ranges of maximum price at
city gate for the different applications given in Table 3 are shown here for comparison.
15
Value adjusted to 2013 U.S. dollars. 16
The upper and lower values correspond approximately to the 2013 price ($16.1/MMBtu) and the 2025 price
forecast ($10.5/MMBtu) for LNG in Japan given by the World Bank (2014b). Values adjusted to 2013 U.S. dollars.
0
2
4
6
8
10
12
14
16
0% 20% 40% 60% 80% 100%
$/M
MB
tu
Percentage of Total Natural Gas Supply
Delivered Cost at City Gate, Pipeline Network Eastern Africa (8 countries + Exports to
South Africa) - Baseline Scenario, 2050 Demand
Delivered Cost + $5 Profit
Fert
ilize
r ($
14
-24
/MM
Btu
)
Po
we
r ($
12
-48
/MM
Btu
)
Co
oki
ng
($
10
-20
/MM
Btu
)
Tra
nsp
ort
($
25
-52
/MM
Btu
)
V7.1-ES
37
6. Discussion
A Challenge for Regional Cooperation
Above, we discussed in details a scenario that includes eight countries of Eastern Africa. Obviously,
such a project with an international scope will not come without risks and important challenges. To
ensure its success, there must be a strong cooperation between the involved countries. Indeed, during
the beginning of the project till the start of the operation, they will have to coordinate their spending
and activities. After completion of the infrastructure, there will be also important challenges related to
the operation of the network. Energy security issues will arise, since some countries will largely
depend on other ones for their energy supply. A solid regulatory framework will have to be in place.
The West African Gas Pipeline - involving Nigeria, Benin, Togo and Ghana - or the gas pipeline from
Mozambique (Temane/Pande) to South Africa (Secunda) are smaller projects but still very encouraging
examples of successful international cooperation in the field of natural gas infrastructure in sub-
Saharan Africa.
Timing Issues for Supply and Demand
In our approach, we analyze the delivered gas cost assuming a nominal gas supply. In reality, once the
transmission network is completed, some time is needed for the demand to reach its nominal level.
The consumptions of bulk consumers like fertilizer manufacturers and power plants can be relatively
easily predicted and planned. On the contrary, the aggregated demand within urban centers for
residential uses and transportation is much more difficult to predict and may increase relatively slowly.
During this time period when the transmission pipeline network does not operates at full load, the
transmission costs are higher than the ones calculated for the nominal capacity; the rollout plan
discussed in section 5.4.1 and the sensitivity analysis to gas demand of section 5.4.3 give a sense of
this effect. It is important to assess the pace at which the demand will increase and the time period
needed to reach full pipeline capacity, and the impact of those parameters on the transmission costs
and the economic viability of the pipeline network, however it is beyond the scope of this paper. A
strong collaboration between the different players and a careful planning may allow to optimize the
timing, and thus minimize the levelized transmission costs and ensure the success of the project.
Governance
To develop and operate a large gas pipeline network, governance issues will have to be addressed.
What kind of entities (private or state owned companies) will own and operate the pipeline network?
Will there be one entity for all countries or several entities? Who should benefit from purchase
agreements?
Network Layout
In our approach, the gas transmission network is optimized in terms of cost-effectiveness. Political
aspects might very likely influence the network layout. For example, in the scenario shown in Figure
16, Mozambique’s capital city is not directly connected to his gas fields in Palma; the gas supplied in
Maputo transits first via Tanzania and Malawi. Mozambique might prefer a pipeline route that allows
to supply the whole country without depending on any other country.
Renewable Energy and Natural Gas
Gas is a flexible fuel allowing more rapid ramping of electricity generation thus allowing greater
penetration of renewables when compared to coal fired power plants. Hence the overall mix of
generation will be at a lower carbon footprint than a mix that might evolve in the absence of gas for
electric power. While electric power is just one energy carrier for which gas is a potential feedstock,
rapid demand growth in sub-Saharan Africa has forced utilities to rely on prohibitively expensive liquid
fuels to rapidly meet their power generation demands. Moreover as solar PV costs continue down the
attractive learning rates (~20%), and the “discovery” of otherwise unmapped wind resources in East
Africa emerge, the potential for leveraging high penetration for solar and wind could be exploited with
complementary gas powered generation. Thus natural gas has the potential of playing an important
role in delivering of cost-effective affordable electric power.
V7.1-ES
38
LNG for Regional Supply
While rough estimations prove that costs favor a pipeline-based supply for most urban centers of the
considered region, one can raise the question of an LNG-based supply for Addis Ababa, the farthest big
city in our proposed network. For LNG, based on liquefaction costs (+ associated infrastructure costs)
reported by ICF International (2012) ($3.3/MMBtu) and Ledesma (2013) ($6.5/MMBtu), and assuming
a shipping cost of about $0.5/MMBtu and a regasification cost of about $0.5/MMBtu, the total
transmission costs to Djibouti may be in the range of $4.3-7.5/MMBtu; then, additional pipeline
transmission costs (around $0.7/MMBtu) have to be taken into account from Djibouti, which gives
total transmission costs to Addis Ababa of $5.0-8.2/MMBtu for an LNG-based supply. For a pipeline-
based supply, we have calculated a transmission cost to Addis Ababa of $3.2/MMBtu in our baseline
scenario and in the high-cost scenario it exceeds $12/MMBtu. If the actual pipeline transmission costs
are significantly higher than in our baseline scenario, LNG will very likely be a more cost-effective
option for Ethiopia.
Development of the Upstream Infrastructure
The new gas resources identified in Tanzania and Mozambique are deepwater fields. To exploit such
fields, large investments are required for the development of the upstream infrastructure (well,
gathering lines, processing plant). This implies that a field developer will look for long-term supply
agreements at an early stage of the project to ensure the economic viability of its investment, i.e.
there is almost no possibility to change where the produced gas is supplied over the whole project
lifetime.
The advantage of a scenario that is predominantly based on LNG exports is that the market is already
well developed, and thus the liquefaction plant and the production facility can rapidly reach their
nominal capacity. In the scenario of regional supply, the demand has to be developed and therefore
the infrastructure will reach its nominal capacity after a much longer time. In our analysis, we partially
considered this issue for the transmission infrastructure (see rollout plan in Table 5), but not for the
upstream infrastructure.
To ensure a sufficient supply to the regional network in the longer term, the upstream infrastructure
might be developed for a significantly larger capacity than initially needed, which would affect the
economics of field development. This implies that in the first phases the production costs might be
higher than $3/MMBtu (the production cost that we considered in our calculations which is in the
range of the production costs reported by ICF International (2012) and Ledesma (2013) for scenarios
predominantly based on LNG exports).
Financing
In our baseline scenario for eight countries the total capital cost of the transmission infrastructure is
approximately $57 Billion, which is a huge investment. Even if the total investment will be spread out
over 20 to 30 years, the concerned countries will have significant difficulties to raise the needed capital
themselves – at least in the first phase. Multilateral development banks, like the World Bank and the
African Development Bank, will have a key role to play. Revenues generated from LNG exports might
be an additional source of financing for the domestic infrastructure. Also, transportation agreements
for a significant volume of gas would help improve financing conditions and limit investment risk.
Gas Supply for Remote Areas
In remote areas for which it is not cost-effective to extend the pipeline network, Compressed Natural
Gas (CNG) could be delivered by truck. This alternative is already proposed by the Matola Gas
Company in the Maputo region.
Industry Sector Development
Concerning the industry sector, we focused here on nitrogenous fertilizer production. Firstly, because
fertilizer plants needs large amount of natural gas and thus represent anchor consumers that could
ease the development of gas infrastructure. Secondly, because the demand for fertilizer already exists
and would most likely grow rapidly, if a domestic production can offer lower price than the imports.
V7.1-ES
39
Other industrial developments could include methanol and GTL plants. They are large consumers of
natural gas and would represent anchor loads. However, these sectors should be very probably less
profitable, as local demand should remain limited and exports would have to compete on the global
market. Other industries, such as cement or steel, could take advantage of a low gas price to develop
activities in the region.
7. Conclusion The recent large natural gas finds in Mozambique and Tanzania could indeed be a great asset for the
economic development of Eastern Africa. Currently, in Eastern Africa, natural gas is used almost
exclusively for power generation and the gas transmission/distribution infrastructure is very limited.
Most of the big projects mentioned so far to exploit the large gas resources in Mozambique and
Tanzania relates to LNG exports.
Natural gas is a flexible resource that can be used for various applications. While a large share of the
rural and urban population in Eastern Africa depends on solid biomass for cooking, which causes
deforestation and health problems, natural gas could represent a clean and affordable alternative.
Natural gas – as a fuel for combined cycle power plant – allows to generate electricity at an affordable
price and can be efficiently used for balancing fluctuating renewable resources, like wind or solar. CNG
could also represent a cheaper fuel alternative for road transportation than gasoline or diesel. Finally,
the agricultural sector could also benefit from the cheap domestic natural gas, since it could allow to
produce locally more affordable nitrogenous fertilizers than the current imports. For these four
different applications, we estimated ranges for the maximum price at city gate below which natural
gas would represent an affordable alternative. The lowest prices are for cooking ($10 – 20/MMBtu)
and the highest prices are for transportation ($25 – 52/MMBtu).
The potential natural gas demand across sub-Saharan Africa has been estimated based on a projection
of the primary energy demand. Different scenarios of gas transmission networks have been generated
based on the potential natural gas demand by 2050. For the different scenarios, the corresponding
investment and transmission costs have been assessed using simple models. First, scenarios with a
various number of participating countries have been compared. It appears that the number of
participating countries does not affect significantly the average delivered gas cost at city gate (in the
range of $5.0-5.7/MMBtu). This first analysis shows that independently of its size, a transmission
network to supply gas from the North of Mozambique to the urban areas of the region seems an
economically viable solution.
A detailed analysis has been undertaken for a gas transmission network across eight countries
(Mozambique, Malawi, Tanzania, Kenya, Uganda, Burundi, Rwanda and Ethiopia), including significant
gas exports to South Africa. For the baseline scenario, based on our estimates of the potential demand
in 2050 (25% of the projected primary energy needs of urban areas), the required investment for the
transmission network is estimated at about $57 Billion and most of the urban centers of the eight
considered countries can be supplied for a cost at city gate below $8/MMBtu (assuming a production
cost of $3/MMBtu at the source). This indicates that natural gas delivered by pipeline could be very
attractive for most of the urban population of Eastern Africa. A rollout plan has been suggested for this
scenario. A high-cost scenario has been also generated for the same set of eight countries. Less
favorable parameters values, compared to the baseline scenario, have been considered: lower natural
gas demand, higher capital and operating costs, and higher interest rate for the project financing.
Assuming that it is not economically viable to connect urban centers if the gas cost at city gate is in
excess of $15/MMBtu, the pipeline network is reduced compared to the baseline scenario; Ethiopia,
Burundi and Rwanda are no more connected. For this high-cost scenario, the average gas cost at city
gate is $10.3/MMBtu and the projected gas supply in 2050 is 2004 Bcf/year, 52% lower than in the
baseline scenario. Sensitivity analyses have been done to highlight the impact of the gas demand, the
capital cost, the operating costs and the planned capacity on the delivered cost of gas.
V7.1-ES
40
The natural gas consumption and needed investment by sector (fertilizer production, cooking/city gas
distribution networks, power generation, transportation/CNG refueling stations) have been estimated
for our baseline scenario for eight countries. Power generation is the sector with the largest
consumption of natural gas (39%). Transportation and nitrogenous fertilizer production have similar
shares, with 27% and 23% respectively, and cooking accounts for 12%. The total needed investment to
develop the four sectors reaches approximately $100 Billion.
A comparison between LNG facility and pipeline network, regarding the needed investment, is briefly
discussed. The needed investment for the pipeline network of our baseline scenario for eight countries
is about two times the one for a liquefaction facility of 30 MMtpa (same liquefaction capacity as in
scenario #1 proposed by ICF International (2012)). Finally, a brief analysis of the potential profits that
can be expected with LNG exports to Japan and in the case of a regional pipeline network has been
carried out. The results show that similar profits than with LNG exports may be generated with the
regional pipeline network.
Acknowledgment Partial support for this study was received from Eni S.p.A. and is gratefully acknowledged by the
authors. The authors would like to thank the sustainability and technical teams at Eni S.p.A., the
sustainability team at Statoil, Mr. Thomas Mitro, Prof. Albert Bressand and Mr. Nicolas Maennling for
their very helpful comments.
V7.1-ES
41
Bibliography AfricaFertilizer.org. 2013. http://Africafertilizer.org.
African Development Bank Group. Africa Infrastructure Knowledge Program. 2013.
http://infrastructureafrica.org/.
Alexandratos, N., and J. Bruinsma. World agriculture towards 2030/2050: the 2012 revision. FAO
Agricultural Development Economics Division, 2012.
AllAfrica. «Mozambique: Maputo Consumers to Receive Natural Gas By May.» 2 September 2013.
—. «Nigeria Mobilises U.S.$700 Million for Trans-Sahara Gas Project - Jonathan.» 29 January 2014.
Barnes, Douglas F., Kerry Krutilla, and William Hyde. The Urban Household Energy Transition: Energy,
Poverty, and the Environment in the Developing World. 2004.
BP. Statistical Review of World Energy 2013. BP p.l.c, 2013.
Budidarmo, Sutarto. “Natural Gas and Nitrogen Fertilizer Production in Indonesia - Current Situation
and Prospect.” IFA Crossroads Asia-Pacific. Bali, Indonesia, 2007.
CIESIN [Center for International Earth Science Information Network] - Columbia University, IFPRI
[International Food Policy Research Institute], The World Bank, and CIAT [Centro Internacional de
Agricultura Tropical]. Global Rural-Urban Mapping Project, Version 1 (GRUMPv1): Urban Extents Grid.
Palisades, NY: NASA Socioeconomic Data and Applications Center (SEDAC).
http://sedac.ciesin.columbia.edu/data/set/grump-v1-urban-extents. Accessed 10/02/2013. 2011.
Cornot-Gandolphe, S., O. Appert, R Dickel, M.-F. Chabrelie, et A Rojey. «THE CHALLENGES OF FURTHER
COST REDUCTIONS FOR NEW SUPPLY OPTIONS (PIPELINE, LNG, GTL).» 22nd World Gas Conference.
Tokyo, 2003.
Daurella, Daniel Camós, and Vivien Foster. What can we learn from household surveys on inequalities
in cooking fuels in sub-Saharan Africa ? 2009.
Eberhard, A., V. Foster, C. Briceño-Garmendia, F. Ouedraogo, D. Camos, and M. Shkaratan. AFRICA
INFRASTRUCTURE COUNTRY DIAGNOSTIC - Underpowered: The State of the Power Sector in Sub-
Saharan Africa. World Bank, 2008.
EIA [U.S. Energy Information Administration]. 2013a. http://www.eia.gov.
—. International Energy Outlook 2013. 2013b.
—. "Natural Gas, Pipelines Projects." 2014. http://www.eia.gov/naturalgas/data.cfm.
—. Oil and Natural Gas in Sub-Saharan Africa. 2013c.
—. "Technically Recoverable Shale Oil and Shale Gas Resources: An Assessment of 137 Shale
Formations in 41 Countries Outside the United States." June 13, 2013d.
http://www.eia.gov/analysis/studies/worldshalegas/.
—. "Today in Energy." September 27, 2013e. http://www.eia.gov/todayinenergy/detail.cfm?id=13151.
ENI. World Oil and Gas Review. 2013.
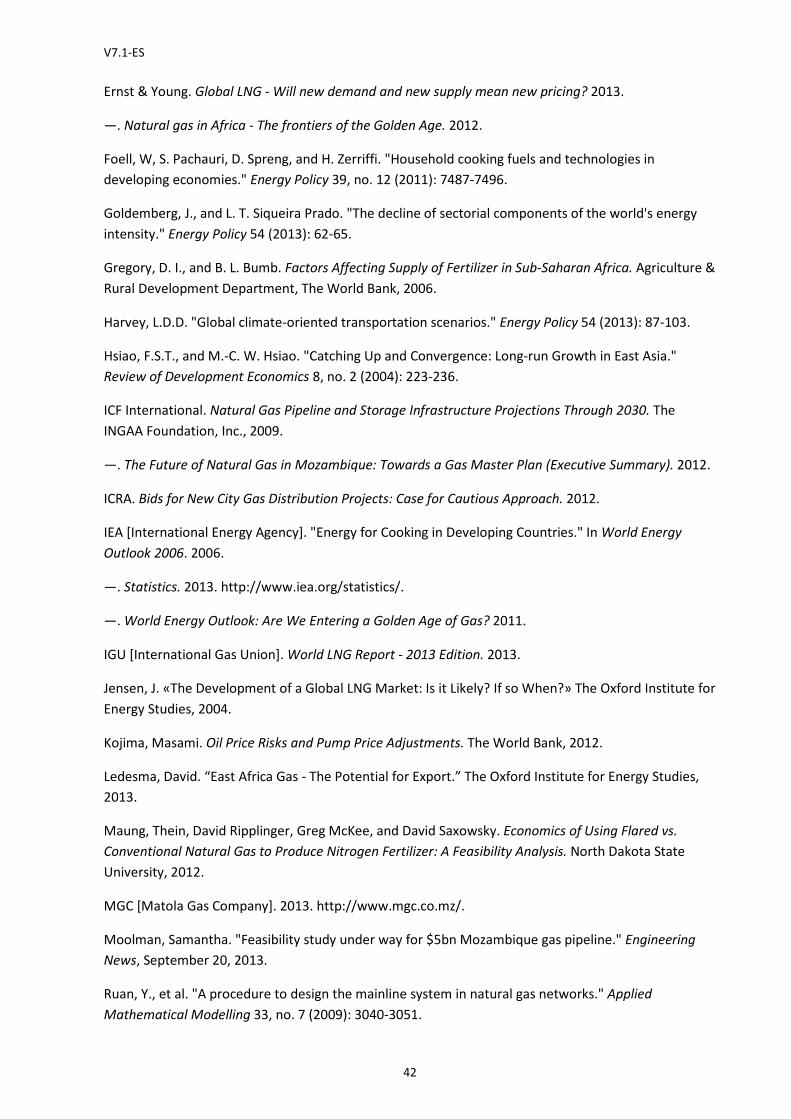
V7.1-ES
42
Ernst & Young. Global LNG - Will new demand and new supply mean new pricing? 2013.
—. Natural gas in Africa - The frontiers of the Golden Age. 2012.
Foell, W, S. Pachauri, D. Spreng, and H. Zerriffi. "Household cooking fuels and technologies in
developing economies." Energy Policy 39, no. 12 (2011): 7487-7496.
Goldemberg, J., and L. T. Siqueira Prado. "The decline of sectorial components of the world's energy
intensity." Energy Policy 54 (2013): 62-65.
Gregory, D. I., and B. L. Bumb. Factors Affecting Supply of Fertilizer in Sub-Saharan Africa. Agriculture &
Rural Development Department, The World Bank, 2006.
Harvey, L.D.D. "Global climate-oriented transportation scenarios." Energy Policy 54 (2013): 87-103.
Hsiao, F.S.T., and M.-C. W. Hsiao. "Catching Up and Convergence: Long-run Growth in East Asia."
Review of Development Economics 8, no. 2 (2004): 223-236.
ICF International. Natural Gas Pipeline and Storage Infrastructure Projections Through 2030. The
INGAA Foundation, Inc., 2009.
—. The Future of Natural Gas in Mozambique: Towards a Gas Master Plan (Executive Summary). 2012.
ICRA. Bids for New City Gas Distribution Projects: Case for Cautious Approach. 2012.
IEA [International Energy Agency]. "Energy for Cooking in Developing Countries." In World Energy
Outlook 2006. 2006.
—. Statistics. 2013. http://www.iea.org/statistics/.
—. World Energy Outlook: Are We Entering a Golden Age of Gas? 2011.
IGU [International Gas Union]. World LNG Report - 2013 Edition. 2013.
Jensen, J. «The Development of a Global LNG Market: Is it Likely? If so When?» The Oxford Institute for
Energy Studies, 2004.
Kojima, Masami. Oil Price Risks and Pump Price Adjustments. The World Bank, 2012.
Ledesma, David. “East Africa Gas - The Potential for Export.” The Oxford Institute for Energy Studies,
2013.
Maung, Thein, David Ripplinger, Greg McKee, and David Saxowsky. Economics of Using Flared vs.
Conventional Natural Gas to Produce Nitrogen Fertilizer: A Feasibility Analysis. North Dakota State
University, 2012.
MGC [Matola Gas Company]. 2013. http://www.mgc.co.mz/.
Moolman, Samantha. "Feasibility study under way for $5bn Mozambique gas pipeline." Engineering
News, September 20, 2013.
Ruan, Y., et al. "A procedure to design the mainline system in natural gas networks." Applied
Mathematical Modelling 33, no. 7 (2009): 3040-3051.
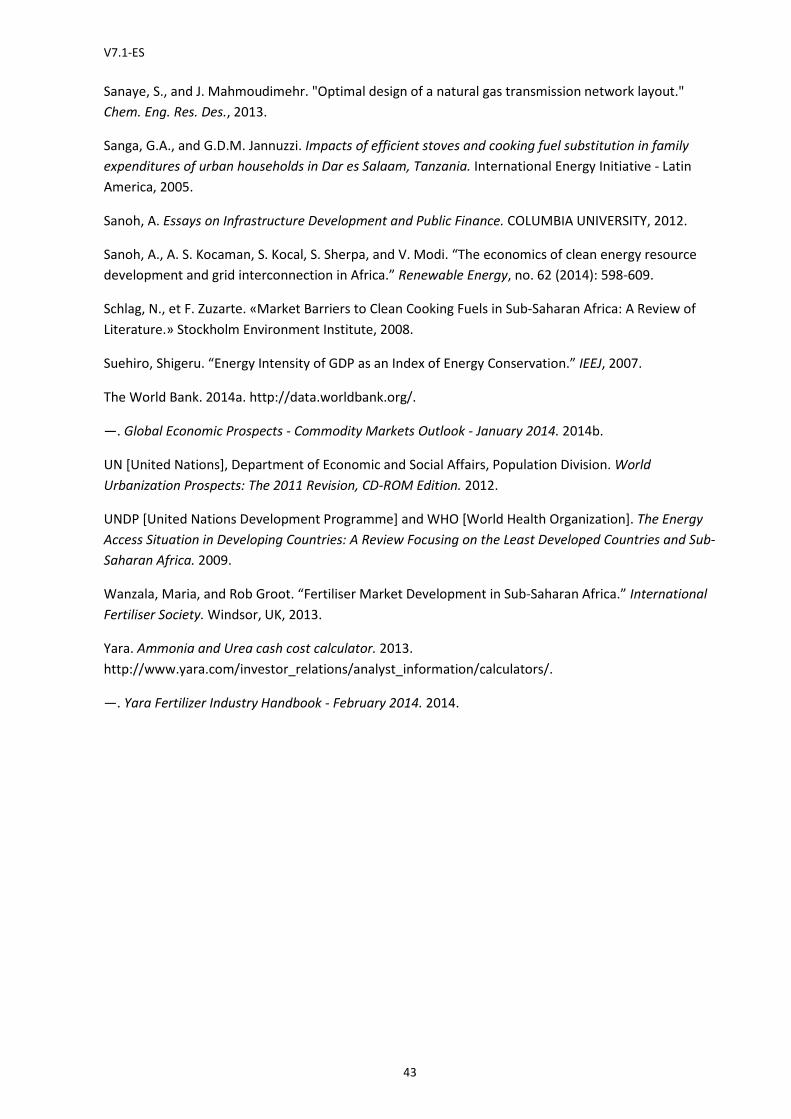
V7.1-ES
43
Sanaye, S., and J. Mahmoudimehr. "Optimal design of a natural gas transmission network layout."
Chem. Eng. Res. Des., 2013.
Sanga, G.A., and G.D.M. Jannuzzi. Impacts of efficient stoves and cooking fuel substitution in family
expenditures of urban households in Dar es Salaam, Tanzania. International Energy Initiative - Latin
America, 2005.
Sanoh, A. Essays on Infrastructure Development and Public Finance. COLUMBIA UNIVERSITY, 2012.
Sanoh, A., A. S. Kocaman, S. Kocal, S. Sherpa, and V. Modi. “The economics of clean energy resource
development and grid interconnection in Africa.” Renewable Energy, no. 62 (2014): 598-609.
Schlag, N., et F. Zuzarte. «Market Barriers to Clean Cooking Fuels in Sub-Saharan Africa: A Review of
Literature.» Stockholm Environment Institute, 2008.
Suehiro, Shigeru. “Energy Intensity of GDP as an Index of Energy Conservation.” IEEJ, 2007.
The World Bank. 2014a. http://data.worldbank.org/.
—. Global Economic Prospects - Commodity Markets Outlook - January 2014. 2014b.
UN [United Nations], Department of Economic and Social Affairs, Population Division. World
Urbanization Prospects: The 2011 Revision, CD-ROM Edition. 2012.
UNDP [United Nations Development Programme] and WHO [World Health Organization]. The Energy
Access Situation in Developing Countries: A Review Focusing on the Least Developed Countries and Sub-
Saharan Africa. 2009.
Wanzala, Maria, and Rob Groot. “Fertiliser Market Development in Sub-Saharan Africa.” International
Fertiliser Society. Windsor, UK, 2013.
Yara. Ammonia and Urea cash cost calculator. 2013.
http://www.yara.com/investor_relations/analyst_information/calculators/.
—. Yara Fertilizer Industry Handbook - February 2014. 2014.
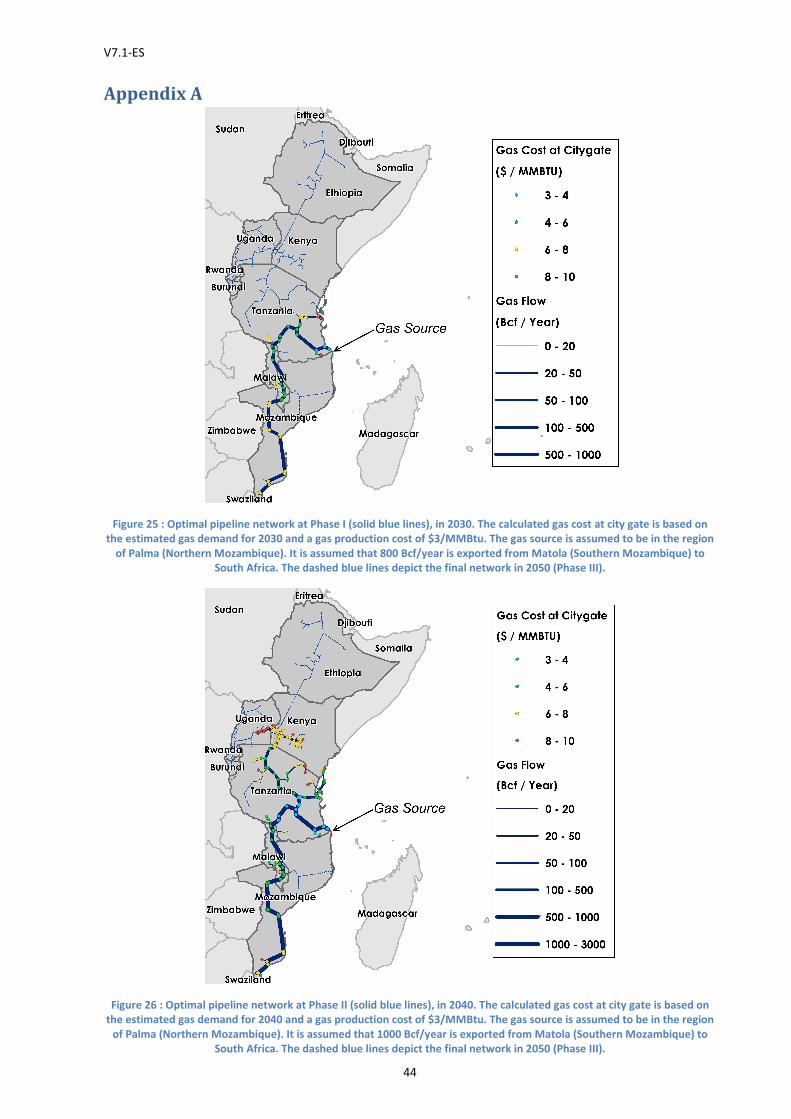
V7.1-ES
44
Appendix A
Figure 25 : Optimal pipeline network at Phase I (solid blue lines), in 2030. The calculated gas cost at city gate is based on
the estimated gas demand for 2030 and a gas production cost of $3/MMBtu. The gas source is assumed to be in the region
of Palma (Northern Mozambique). It is assumed that 800 Bcf/year is exported from Matola (Southern Mozambique) to
South Africa. The dashed blue lines depict the final network in 2050 (Phase III).
Figure 26 : Optimal pipeline network at Phase II (solid blue lines), in 2040. The calculated gas cost at city gate is based on
the estimated gas demand for 2040 and a gas production cost of $3/MMBtu. The gas source is assumed to be in the region
of Palma (Northern Mozambique). It is assumed that 1000 Bcf/year is exported from Matola (Southern Mozambique) to
South Africa. The dashed blue lines depict the final network in 2050 (Phase III).
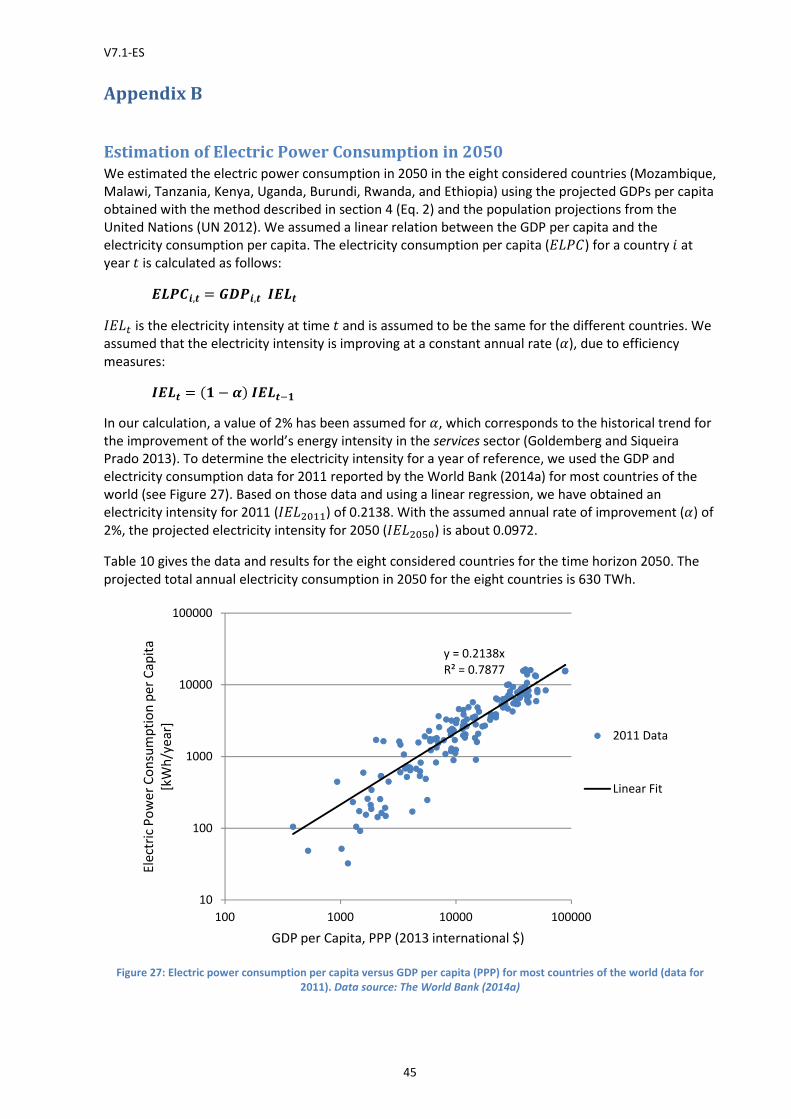
V7.1-ES
45
Appendix B
Estimation of Electric Power Consumption in 2050
We estimated the electric power consumption in 2050 in the eight considered countries (Mozambique,
Malawi, Tanzania, Kenya, Uganda, Burundi, Rwanda, and Ethiopia) using the projected GDPs per capita
obtained with the method described in section 4 (Eq. 2) and the population projections from the
United Nations (UN 2012). We assumed a linear relation between the GDP per capita and the
electricity consumption per capita. The electricity consumption per capita (!S�") for a country � at
year � is calculated as follows:
#I�$�, = ����,%#I
&!S' is the electricity intensity at time � and is assumed to be the same for the different countries. We
assumed that the electricity intensity is improving at a constant annual rate (X), due to efficiency
measures:
%#I = (� − Y)%#I��
In our calculation, a value of 2% has been assumed for X, which corresponds to the historical trend for
the improvement of the world’s energy intensity in the services sector (Goldemberg and Siqueira
Prado 2013). To determine the electricity intensity for a year of reference, we used the GDP and
electricity consumption data for 2011 reported by the World Bank (2014a) for most countries of the
world (see Figure 27). Based on those data and using a linear regression, we have obtained an
electricity intensity for 2011 (&!SB?AA) of 0.2138. With the assumed annual rate of improvement (X) of
2%, the projected electricity intensity for 2050 (&!SB?Z?) is about 0.0972.
Table 10 gives the data and results for the eight considered countries for the time horizon 2050. The
projected total annual electricity consumption in 2050 for the eight countries is 630 TWh.
Figure 27: Electric power consumption per capita versus GDP per capita (PPP) for most countries of the world (data for
2011). Data source: The World Bank (2014a)
y = 0.2138x
R² = 0.7877
10
100
1000
10000
100000
100 1000 10000 100000
Ele
ctri
c P
ow
er
Co
nsu
mp
tio
n p
er
Ca
pit
a
[kW
h/y
ea
r]
GDP per Capita, PPP (2013 international $)
2011 Data
Linear Fit
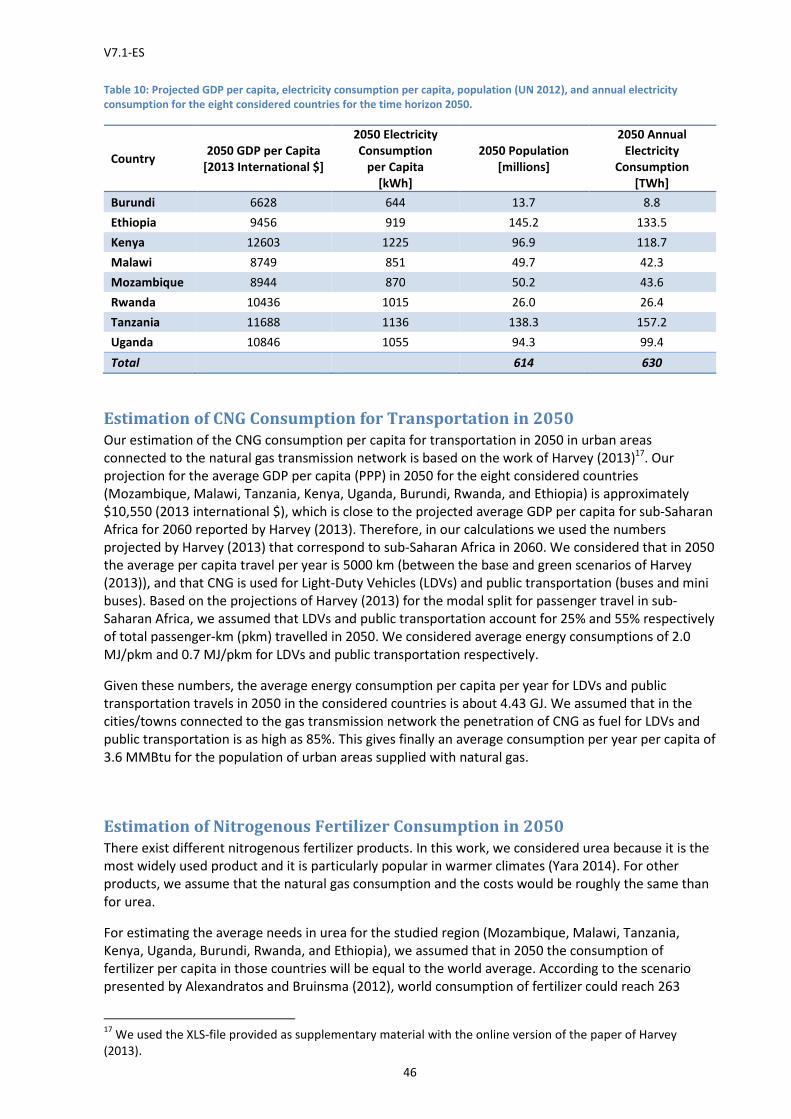
V7.1-ES
46
Table 10: Projected GDP per capita, electricity consumption per capita, population (UN 2012), and annual electricity
consumption for the eight considered countries for the time horizon 2050.
Country 2050 GDP per Capita
[2013 International $]
2050 Electricity
Consumption
per Capita
[kWh]
2050 Population
[millions]
2050 Annual
Electricity
Consumption
[TWh]
Burundi 6628 644 13.7 8.8
Ethiopia 9456 919 145.2 133.5
Kenya 12603 1225 96.9 118.7
Malawi 8749 851 49.7 42.3
Mozambique 8944 870 50.2 43.6
Rwanda 10436 1015 26.0 26.4
Tanzania 11688 1136 138.3 157.2
Uganda 10846 1055 94.3 99.4
Total
614 630
Estimation of CNG Consumption for Transportation in 2050
Our estimation of the CNG consumption per capita for transportation in 2050 in urban areas
connected to the natural gas transmission network is based on the work of Harvey (2013)17. Our
projection for the average GDP per capita (PPP) in 2050 for the eight considered countries
(Mozambique, Malawi, Tanzania, Kenya, Uganda, Burundi, Rwanda, and Ethiopia) is approximately
$10,550 (2013 international $), which is close to the projected average GDP per capita for sub-Saharan
Africa for 2060 reported by Harvey (2013). Therefore, in our calculations we used the numbers
projected by Harvey (2013) that correspond to sub-Saharan Africa in 2060. We considered that in 2050
the average per capita travel per year is 5000 km (between the base and green scenarios of Harvey
(2013)), and that CNG is used for Light-Duty Vehicles (LDVs) and public transportation (buses and mini
buses). Based on the projections of Harvey (2013) for the modal split for passenger travel in sub-
Saharan Africa, we assumed that LDVs and public transportation account for 25% and 55% respectively
of total passenger-km (pkm) travelled in 2050. We considered average energy consumptions of 2.0
MJ/pkm and 0.7 MJ/pkm for LDVs and public transportation respectively.
Given these numbers, the average energy consumption per capita per year for LDVs and public
transportation travels in 2050 in the considered countries is about 4.43 GJ. We assumed that in the
cities/towns connected to the gas transmission network the penetration of CNG as fuel for LDVs and
public transportation is as high as 85%. This gives finally an average consumption per year per capita of
3.6 MMBtu for the population of urban areas supplied with natural gas.
Estimation of Nitrogenous Fertilizer Consumption in 2050
There exist different nitrogenous fertilizer products. In this work, we considered urea because it is the
most widely used product and it is particularly popular in warmer climates (Yara 2014). For other
products, we assume that the natural gas consumption and the costs would be roughly the same than
for urea.
For estimating the average needs in urea for the studied region (Mozambique, Malawi, Tanzania,
Kenya, Uganda, Burundi, Rwanda, and Ethiopia), we assumed that in 2050 the consumption of
fertilizer per capita in those countries will be equal to the world average. According to the scenario
presented by Alexandratos and Bruinsma (2012), world consumption of fertilizer could reach 263
17
We used the XLS-file provided as supplementary material with the online version of the paper of Harvey
(2013).

V7.1-ES
47
million tonnes in 2050, for a total population of 9.15 billion. This gives an average of 28.7 kg of nutrient
(NPK) per capita per year. Considering a share of nitrogen in total nutrient consumption equal to 57%
(Alexandratos and Bruinsma 2012), the average consumption of urea (mass fraction of nitrogen = 46%)
per capita per year in 2050 would be equal to 36 kg.
It may seem too optimistic to assume that the fertilizer consumption per capita in the eight considered
countries in 2050 will be equal to world average. However, one can expect that those countries will
export a fraction of their production to neighboring countries that are not connected to natural gas
and that have no nitrogenous fertilizer production capacity. In that case, the calculated 36 kg of urea
per capita per year should be interpreted as a production average (instead of a consumption average)
for the eight considered countries and the average consumption of urea per capita per year for the
wider region (the eight countries connected to natural gas + neighboring countries) would be actually
lower than this 36 kg.
Copyright © 2022 FDOKUMEN