South Africa's International Competitiveness: A Product Level Analysis
Upload
khangminh22Category
view
3download
0
National Income Dynamics Study (NIDS) – Coronavirus
Rapid Mobile Survey (CRAM)
WAVE 5
7
8 July 2021Timothy Köhler - University of Cape Town
Robert Hill - University of Cape Town
The distribution and dynamics of South Africa’s TERS policy:Results from NIDS-CRAM Waves 1 to 5
1 | The distribution and dynamics of South Africa’s TERS policy
The distribution and dynamics of South Africa’s TERS policy:
Results from NIDS-CRAM Waves 1 to 5
Timothy Köhler1
Robert Hill2
1 Junior Researcher and PhD candidate, Development Policy Research Unit, School of Economics, University of Cape Town. Email: [email protected]
2 Junior Researcher, Junior Lecturer, and PhD candidate, Development Policy Research Unit, School of Economics, University of Cape Town. Email: [email protected]
2 | The distribution and dynamics of South Africa’s TERS policy
Executive summary
IntroductionJob retention policy – which aims to preserve jobs at firms experiencing a temporary reduction in activity by alleviating labour costs and supporting the incomes of workers – has served as one of the main tools used by governments across the world to mitigate job losses in response to the COVID-19 pandemic, particularly in the form of wage subsidies. In South Africa, the government’s Temporary Employer-Employee Relief Scheme (TERS), introduced in April 2020, served as a core component of the country’s economic policy response benefiting millions of vulnerable workers. In this paper, we provide a detailed, quantitative, descriptive analysis of TERS receipt over time by making use of representative, longitudinal survey data collected over the course of 2020 and 2021: all fives waves of the National Income Dynamics Study: Coronavirus Rapid Mobile Survey (NIDS-CRAM).
The TERS reached the highest number of workers during the beginning of the national lockdown, with relatively few benefiting in 2021 so far. On aggregate, we estimate that over 4 million unique workers (95% CI: 3 204 669 - 4 883 867) received TERS at least once over the period. We find that the number of recipients was highest during the most stringent lockdown level 5 in April 2020 (1.8 million) and level 3 in June 2020 (2 million), representing about 13.5% of all workers. More than half of all April 2020 recipients continued to receive TERS in June 2020, but most recipients during this month (76%) did not receive it in October 2020. Although many workers continued to benefit throughout the year as the economy re-opened (1.5 million during level 1 in October 2020), the scheme has reached far fewer workers during 2021 so far (675 000 in January and 970 000 in March) – a statistically significant difference. This reduction is likely partially attributable to payment backlogs but additionally to recovering economic activity and changes in the policy’s eligibility criteria.
Although TERS recipients were largely male over the period, individuals from other more vulnerable demographic and socio-economic groups became more likely to receive TERS benefits as the programme continued. Amongst these groups, we find that the share of African/Black TERS recipients increased significantly by 16 percentage points from April 2020 to March 2021, representing 91% of recipients in March 2021. Furthermore, lower-wage workers were more prevalent amongst March 2021 recipients, as were less-skilled individuals. Finally, an overwhelming majority of recipients (between 81 and 94%) were unable to work from home at all, suggesting that the TERS was successful in acting as a cash subsidy specifically to establishments that were struggling to continue operations during the lockdown. Notably, these rates of receipt are generally above the group’s incidence of employment in the labour market, indicating a more-than-proportional benefit as a result of the TERS policy. This is in line with our multivariate analysis which highlights, all else equal, statistically significantly higher probabilities of receipt among workers who cannot work from home and those who have a written contract.
The average recipient received a benefit of nearly R4 100 per month, but lower-wage workers benefitted significantly more in relative terms. By making use of the TERS benefit formula and data on pre-pandemic wages, we approximate the average TERS benefit for workers who ever reported receipt to be just under R4 100 per worker per month (95% CI: R3 792.84 - R4 392.47). Receipt is distribution-neutral (for instance, the poorest 40% of workers account for 40% of recipients) in every month considered. However, conditional on receipt, TERS benefits are higher in relative terms for lower-wage workers, despite being higher in absolute terms for higher-wage workers: the average benefit among the poorest 20% of workers (R3 500 per month) is more than 7 times higher than the group’s average wage, in contrast to a ratio of less than 0.60 for the richest 40% of workers. This is due to the policy’s progressive sliding-scale design as well as its lower-
3 | The distribution and dynamics of South Africa’s TERS policy
bound benefit amount equivalent to the National Minimum Wage which a large share of workers earns below. Due to data limitations, however, we encourage the reader to interpret these benefit estimates as rough approximations.
TERS receipt is significantly associated with job retention, but only prior to the re-opening of the economy. Using a multivariate model and matching technique, we estimate that TERS receipt during lockdown level 5 in April 2020 was associated with an 18.1 percentage point increase in the probability of remaining employed in the same job during lockdown level 3 in June 2020, relative to all other individuals in the labour market. This positive effect is robust to the removal of those individuals who remained employed in general, however, the size of the TERS ‘effect’ shrinks to only 8.5 percentage points when analysing this subgroup, which speaks to the high levels of job churn present in the South African economy between April and June 2020. Both these findings are significant at the 1% level after controlling for several differences in demographic and labour market variables between recipients and non-recipients. However, we find no such association for the remainder of the lockdown period. This suggests that the policy may indeed have succeeded in its primary aim of minimizing job loss, but only when the lockdown regulations were most stringent.
The TERS provided much needed assistance to many vulnerable workers, but administrative inefficiencies threaten labour market recovery. The TERS was implemented relatively quickly following the onset of the national lockdown and has provided an important source of income relief for many vulnerable firms and workers. However, following the Adjusted Alert Level 4 regulations as of 28 June 2021, the economic activity of several industries has been significantly restricted, yet at the time of writing, economic relief measures to assist vulnerable industries had yet to be announced. First, policymakers ought to consider extending the availability of the TERS beyond the October 2020 to March 2021 claim period. Second, although going forward, support needs to be prioritised for sectors whose activity remains legally restricted, the use of Standard Industrial Classification (SIC) codes to identify the eligible, coupled with discrepancies between claim and payment periods and poor communication support channels, may jeopardize the welfare of vulnerable workers by denying or delaying support. Policymakers ought to consider that more restrictive eligibility criteria and its accompanying administrative burden may ultimately threaten the recovery of the labour market. An approach which simplifies access, lowers the administrative burden, and reduces exclusion error should be considered.
4 | The distribution and dynamics of South Africa’s TERS policy
1. IntroductionJob retention policy has served as one of the main tools used by governments across the world to mitigate job losses in response to the COVID-19 pandemic. These policies aim to preserve jobs at firms experiencing a temporary reduction in activity by alleviating labour costs and supporting the incomes of workers (OECD, 2020). By subsidising incomes and firm liquidity, these policies help employers retain their workers and avoid the potentially costly process of hiring and training new workers as economic activity recovers (Keenan and Lydon, 2020). Indeed, job retention policy is argued to be an important tool for speeding up economic recoveries due to labour market frictions which prevent quick re-hiring (Giupponi and Landais, 2020). Additionally, these policies can benefit workers in the long run by helping them avoid labour market scarring effects associated with periods of unemployment (OECD, 2020).
Near the beginning of the crisis in May 2020, for several countries, this type of active labour market policy supported ten times as many jobs as during the financial crisis of 2008/09 (OECD, 2020). One year later, over 800 active labour market policies were in place in nearly 180 countries in response to the pandemic (Gentilini et al., 2021). Job retention policies typically take one of two forms: short-time work schemes (which subsidise hours not worked) or wage subsidy schemes (which subsidise hours worked, but which can also be used to top up wages). The latter form has been particularly prevalent during the pandemic. As of May 2021, wage subsidies represent nearly one third (31%) of all active labour market programs in place globally in response to the pandemic, with most countries (52%) having implemented at least one (Gentilini et al., 2021).
Job retention policy in the form of a wage subsidy served as a core component of the South African government’s economic policy response to the pandemic. Initially, R40 billion (or 8%) of the government’s R500 billion fiscal package was accounted for by the expansion of the Unemployment Insurance Fund (UIF) to provide wage support to affected workers (Bhorat et al., 2020), both through existing benefits (such as Illness, Reduced Work Time, and Unemployment) as well as a new scheme: the Temporary Employer-Employee Relief Scheme (TERS). Although financed by the UIF, the TERS is technically a wage subsidy which aims to prevent retrenchments amongst the employed by providing wage support to employers who have fully or partially closed their operations in response to the pandemic. The TERS was introduced relatively quickly after the onset of South Africa’s national lockdown in March 2020 and was the largest UIF component during the lockdown period – by March 2021, nearly R59 billion had been dispensed to 5.4 million individual workers.
In this paper, we seek to provide a detailed, quantitative, descriptive analysis of TERS receipt over time by making use of representative, longitudinal survey data collected over the course of 2020 and 2021: all fives waves of the National Income Dynamics Study: Coronavirus Rapid Mobile Survey (NIDS-CRAM). We seek to understand trends in aggregate and between-group variation in receipt (including several demographic and labour market variables), receipt across the wage distribution, variation in TERS benefit amounts, the correlates of receipt, and the relationship between receipt and job retention. The remainder of the paper proceeds as follows. Section 2 provides an overview of the design, introduction, and evolution of the TERS. In Section 3 we describe the data and methodology. In Section 4 we present our results, and in Section 5 we discuss and conclude.
2. Overview of the COVID-19 Temporary Employer-Employee Relief Scheme
As discussed above, the TERS aims to prevent retrenchments amongst the employed – that is, it is not applicable to cases where employment relationships are completely terminated – and provide wage support to employers who have fully or partially closed their operations by covering a proportion of firm wage expenses. Recognising that allowing each worker to apply for benefits may be inefficient, workers therefore do not receive benefits from the UIF directly, but rather from
5 | The distribution and dynamics of South Africa’s TERS policy
their employer (or the applicable bargaining council).3 Upon receipt of payment from the UIF, the employer must, within two days, pay their workers the relevant benefit and, within five days, submit proof of payment to the UIF. TERS has clearly been the largest UIF component during the lockdown period. Despite initial pay-out delays owing to large backlogs of applications and infrastructure breakdowns (Jain et al., 2020), by March 2021 nearly R59 billion had been dispensed to 5.4 million individual employees4 – equivalent to nearly half of all workers employed in the formal sector, or two thirds of all UIF contributors.5 For other UIF benefits, the Fund paid out R7.5 billion in 1.3 million payments during 2020.
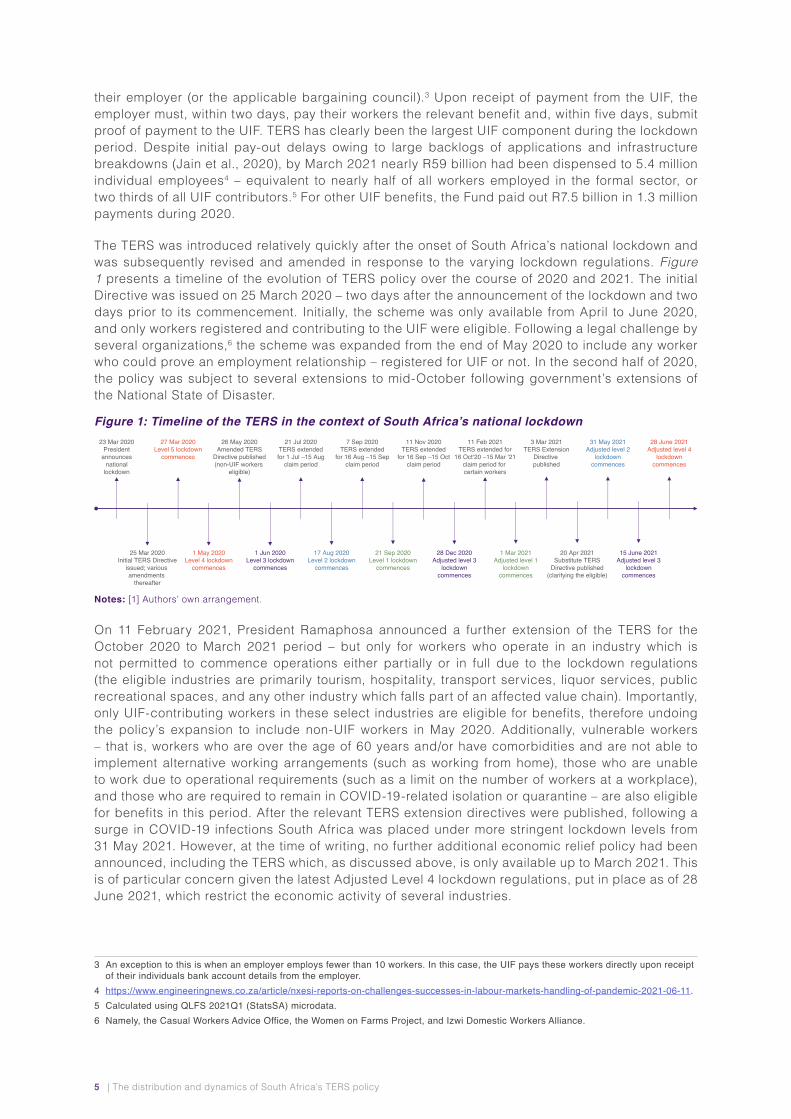
The TERS was introduced relatively quickly after the onset of South Africa’s national lockdown and was subsequently revised and amended in response to the varying lockdown regulations. Figure 1 presents a timeline of the evolution of TERS policy over the course of 2020 and 2021. The initial Directive was issued on 25 March 2020 – two days after the announcement of the lockdown and two days prior to its commencement. Initially, the scheme was only available from April to June 2020, and only workers registered and contributing to the UIF were eligible. Following a legal challenge by several organizations,6 the scheme was expanded from the end of May 2020 to include any worker who could prove an employment relationship – registered for UIF or not. In the second half of 2020, the policy was subject to several extensions to mid-October following government’s extensions of the National State of Disaster.
Figure 1: Timeline of the TERS in the context of South Africa’s national lockdown
25 Mar 2020Initial TERS Directive
issued; various amendments
thereafter
23 Mar 2020President
announcesnational
lockdown
27 Mar 2020Level 5 lockdown
commences
1 May 2020Level 4 lockdown
commences
26 May 2020Amended TERS
Directive published(non-UIF workers
eligible)
1 Jun 2020Level 3 lockdown
commences
21 Jul 2020TERS extendedfor 1 Jul –15 Aug
claim period
17 Aug 2020Level 2 lockdown
commences
7 Sep 2020TERS extended
for 16 Aug –15 Sepclaim period
21 Sep 2020Level 1 lockdown
commences
11 Nov 2020TERS extended
for 16 Sep –15 Octclaim period
1 Mar 2021Adjusted level 1
lockdowncommences
3 Mar 2021TERS Extension
Directive published
11 Feb 2021TERS extended for
16 Oct‘20 –15 Mar ‘21claim period for certain workers
20 Apr 2021Substitute TERS
Directive published(clarifying the eligible)
28 Dec 2020Adjusted level 3
lockdowncommences
31 May 2021Adjusted level 2
lockdowncommences
15 June 2021Adjusted level 3
lockdowncommences
28 June 2021Adjusted level 4
lockdowncommences
Notes: [1] Authors’ own arrangement.
On 11 February 2021, President Ramaphosa announced a further extension of the TERS for the October 2020 to March 2021 period – but only for workers who operate in an industry which is not permitted to commence operations either partially or in full due to the lockdown regulations (the eligible industries are primarily tourism, hospitality, transport services, liquor services, public recreational spaces, and any other industry which falls part of an affected value chain). Importantly, only UIF-contributing workers in these select industries are eligible for benefits, therefore undoing the policy’s expansion to include non-UIF workers in May 2020. Additionally, vulnerable workers – that is, workers who are over the age of 60 years and/or have comorbidities and are not able to implement alternative working arrangements (such as working from home), those who are unable to work due to operational requirements (such as a limit on the number of workers at a workplace), and those who are required to remain in COVID-19-related isolation or quarantine – are also eligible for benefits in this period. After the relevant TERS extension directives were published, following a surge in COVID-19 infections South Africa was placed under more stringent lockdown levels from 31 May 2021. However, at the time of writing, no further additional economic relief policy had been announced, including the TERS which, as discussed above, is only available up to March 2021. This is of particular concern given the latest Adjusted Level 4 lockdown regulations, put in place as of 28 June 2021, which restrict the economic activity of several industries.
3 An exception to this is when an employer employs fewer than 10 workers. In this case, the UIF pays these workers directly upon receipt of their individuals bank account details from the employer.
4 https://www.engineeringnews.co.za/article/nxesi-reports-on-challenges-successes-in-labour-markets-handling-of-pandemic-2021-06-11. 5 Calculated using QLFS 2021Q1 (StatsSA) microdata.6 Namely, the Casual Workers Advice Office, the Women on Farms Project, and Izwi Domestic Workers Alliance.
6 | The distribution and dynamics of South Africa’s TERS policy
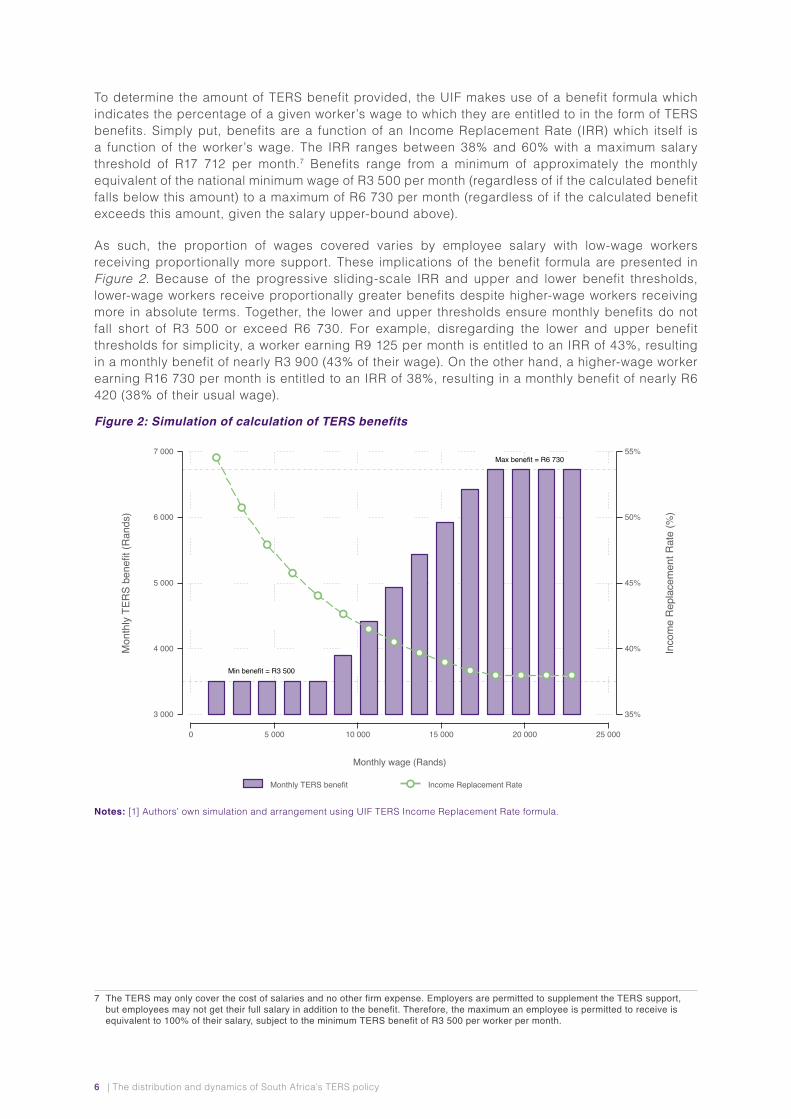
To determine the amount of TERS benefit provided, the UIF makes use of a benefit formula which indicates the percentage of a given worker’s wage to which they are entitled to in the form of TERS benefits. Simply put, benefits are a function of an Income Replacement Rate (IRR) which itself is a function of the worker’s wage. The IRR ranges between 38% and 60% with a maximum salary threshold of R17 712 per month.7 Benefits range from a minimum of approximately the monthly equivalent of the national minimum wage of R3 500 per month (regardless of if the calculated benefit falls below this amount) to a maximum of R6 730 per month (regardless of if the calculated benefit exceeds this amount, given the salary upper-bound above).
As such, the proportion of wages covered varies by employee salary with low-wage workers receiving proportionally more support. These implications of the benefit formula are presented in Figure 2. Because of the progressive sliding-scale IRR and upper and lower benefit thresholds, lower-wage workers receive proportionally greater benefits despite higher-wage workers receiving more in absolute terms. Together, the lower and upper thresholds ensure monthly benefits do not fall short of R3 500 or exceed R6 730. For example, disregarding the lower and upper benefit thresholds for simplicity, a worker earning R9 125 per month is entitled to an IRR of 43%, resulting in a monthly benefit of nearly R3 900 (43% of their wage). On the other hand, a higher-wage worker earning R16 730 per month is entitled to an IRR of 38%, resulting in a monthly benefit of nearly R6 420 (38% of their usual wage).
Figure 2: Simulation of calculation of TERS benefits
Min benefit = R3 500
Max benefit = R6 730
35%
40%
45%
50%
55%
Inco
me
Rep
lace
men
t Rat
e (%
)
3 000
4 000
5 000
6 000
7 000
Mon
thly
TER
S be
nefit
(Ran
ds)
0 5 000 10 000 15 000 20 000 25 000
Monthly wage (Rands)
Monthly TERS benefit Income Replacement Rate
Notes: [1] Authors’ own simulation and arrangement using UIF TERS Income Replacement Rate formula.
7 The TERS may only cover the cost of salaries and no other firm expense. Employers are permitted to supplement the TERS support, but employees may not get their full salary in addition to the benefit. Therefore, the maximum an employee is permitted to receive is equivalent to 100% of their salary, subject to the minimum TERS benefit of R3 500 per worker per month.

7 | The distribution and dynamics of South Africa’s TERS policy
3. Data and methodology
3.1. The National Income Dynamics: Coronavirus Rapid Mobile Survey (NIDS-CRAM)This study makes use of individual-level microdata from all fives waves of the National Income Dynamics: Coronavirus Rapid Mobile Survey (NIDS-CRAM) conducted between May 2020 and May 2021. The NIDS-CRAM is a broadly8 representative, longitudinal telephone survey designed as a ‘barometer’ for assessing the socio-economic impact of the COVID-19 pandemic on South African individuals and households. The survey is based on a subsample of adults who were previously surveyed as part of Wave 5 of the National Income Dynamics Study (NIDS) in 2017. The survey instrument includes a wide array of questions on several topics including income and employment, household welfare, and COVID-19-related knowledge and behaviour. The data collection periods for each wave are as follows: Wave 1 from 7 May - 27 June 2020 (when approximately 7 000 individuals were successfully interviewed), Wave 2 from 13 July - 13 August 2020 (5 700 individuals), Wave 3 from 2 November - 13 December 2020 (6 100 individuals inclusive of a top-up sample9), Wave 4 from 2 February to 10 March 2021 (5 600 individuals), and Wave 5 from 6 April to 11 May 2021 (5 900 individuals). Unless specified otherwise, all of our estimates are weighted using the relevant sampling weights after accounting for the complex survey design to adjust for non-random non-response and attrition. We employ the weights which include the top-up sample for any cross-sectional analysis and the weights which exclude the top-up sample for any longitudinal analysis. For more information on the NIDS-CRAM sampling design, the interested reader is referred to Ingle et al. (2021).
With the exception of Wave 1,10 two questions with respect to TERS receipt were included in the questionnaire – one for the regular and casual workers subsample (“Did you receive any money from the UIF’s TERS in the reference month?” ) and the other for those running a business and the self-employed subsample (“Did you receive any money from the UIF’s TERS for yourself or any staff in this business in the reference month?” ). A given respondent only answered one of the two questions and considering only the employed were eligible for the TERS, these questions were only asked of the employed subsample. Respondents could report “Yes”, “No”, “No, I’ve applied but still waiting”, or “Don’t know”. For the question relating to those running a business and the self-employed, respondents could additionally answer “No because my company is not eligible”, “No because I do not know where or how to apply”, or “No because I get support from other private institutions”. To identify TERS recipients in our analysis here, we code a binary TERS receipt variable equal to one for any respondent who reported TERS receipt and zero otherwise, irrespective of employment type. Our coding here therefore results in all reasons related to TERS non-receipt (for example, “No because I do not know where or how to apply”) being collapsed into zero in our binary TERS receipt variable. This does not significantly affect our estimates given that the sample sizes for each relevant “No” response (1 to 30 observations in a given wave) are too small for any reliable statistical inference. All reports of “Don’t know” and refusals to answer the relevant question were coded as missing. The coding of reports of “Don’t know” and refusals to answer the relevant question does not significantly affect our estimates given the very small subsample affected (1 to 36 observations in a given wave).
It is important however to consider TERS payment delays here; specifically, our estimates represent the number of workers who received a TERS benefit in a particular month, but not necessarily for a
8 BecauseoftheNIDS-CRAMsamplingdesign,thesampleisregardedas‘broadly’representativeoftheadultSouthAfricanpopulationin 2020. Specifically, the weighted NIDS-CRAM estimates are only representative of the outcomes in 2020 of those aged 15 years and older who were surveyed as part of the NIDS in 2017 and were followed up 3 years later.
9 In NIDS-CRAM Wave 3, a top-up sample of approximately 1 100 individuals was included to increase the sample size due to attrition across the panel.
10 Wave 1 included only the relevant TERS question for regular and causal workers. One possible implication of this may be that the Wave 1 estimate of the number of recipients is underestimated. However, the magnitude of such an underestimate is not expected to be large given that in Waves 2 to 5, the weighted estimate of TERS receipt among those who run a business and the self-employed is between just 2.3 and 5.2% of TERS recipients.

8 | The distribution and dynamics of South Africa’s TERS policy
particular month.11 This is a crucial distinction as it pertains to the findings presented in this paper. In particular, administrative inefficiencies in the implementation of the TERS that result in delayed payments to individuals will lead to some extent of exclusion error; that is, eligible individuals reporting non-receipt. While this issue may be rectified to a certain extent in earlier waves as individuals were followed up on, any delays in payment from the most recent TERS extension are likely to reduce the number of reported TERS recipients in the more recent waves of the NIDS-CRAM data, and thus under-report TERS receipt in the most recent waves. To this end, we advise caution in interpreting the figures presented below, and stress that – particularly for more recent waves of data – the reported figures are likely to underestimate the true reach and benefits provided by the TERS programme.
3.2. Wage data adjustmentsIn our analysis here, we make use of the wage data collected in the NIDS-CRAM. In each wave, the survey instrument asked respondents to report the actual monetary (Rand) amount of their take-home pay (after deductions) in a given reference month. If they were not willing, they were asked to report which bracket their labour market income lies in. Simply ignoring bracket responses incorrectly ignores responses that may come from the top end of the income distribution. For instance, in an analysis of South African household survey data, Wittenberg (2017) shows that individuals who do so tend to have higher incomes. Any wage analysis which does not address these concerns beforehand may produce biased estimates. We adopt several statistical techniques to address these issues by following our approach in earlier NIDS-CRAM work (Hill and Köhler, 2020) and adjust the raw wage data as follows.
First, outlier values are identified and coded as missing by using the “extreme studentised regression residuals” approach as advised by Wittenberg (2017).12 Second, we address selection into responding with bracket information by constructing bracket weights, calculated as the inverse of the probability of an actual monetary (Rand) response in a particular bracket in a particular wave, multiplied by the sampling weight for each individual. This process weights up individuals in brackets where the proportion of actual monetary responses are lower, relative to brackets where such response is high.13 All our wage estimates for all periods are weighted using these computed bracket weights. Lastly, it is important to note that this reweighting approach does not do anything about those who refuse to answer or who otherwise have missing data – it only corrects for bracket responses. Despite this, Ardington (2020) shows that the weighted distribution of wages in the NIDS-CRAM is plausible given its similarity to distributions in other surveys (such as the NIDS Wave 5 and General Household Survey 2018). All wage estimates are expressed in specified monthly or hourly frequencies and in real terms, with all wage data being inflated to April 2021 Rands.
11 For instance, due to payment delays, a worker may report receiving a TERS payment in June 2020, but this payment may have been intended to cover the worker for May 2020. We are unable to identify the extent of this discrepancy given data limitations.
12 Using this method, the following number of values per wave were identified as outliers: 3 for February 2020 wages in Wave 1, 2 for April 2020 wages in Wave 1, 2 for June 2020 wages in Wave 2, 5 for October 2020 wages in Wave 3, 1 for January 2021 wages in Wave 4, and 4 for March 2021 wages in Wave 5.
13 For example, if we observe 95% of individuals within the bracket R1 000 - R2 000 gave actual Rand responses, then these individuals will get revised weights equal the sampling weight divided by 0.95. On the other hand, individuals within the bracket R20 000 – R30 000 where 35% gave actual Rand responses will get revised weights equal the sampling weight divided by 0.35. The latter will be weighted up relative to individuals in the lower bracket.

9 | The distribution and dynamics of South Africa’s TERS policy
4. Results
4.1. Aggregate trends in receiptOn aggregate, we estimate that just over 4 million unique workers (95% CI: 3 204 669 - 4 883 867) received TERS at least once during the period considered (either in April 2020, June 2020, October 2020, January 2021, or March 2021).14 This is in line with the government’s announcement that 4.5 million individual workers had received benefits as of February 2021 (Ramaphosa, 2021). As shown in Figure 3, the TERS reached the highest number of workers during the beginning of the national lockdown, with relatively few benefiting in 2021 so far. We find that receipt was highest during the most stringent lockdown level 5 in April 2020 (1.8 million, or 13.56% of all workers) and level 3 in June 2020 (2 million, or 13.63% of all workers). Although many workers continued to benefit throughout the year as the economy re-opened (1.5 million during level 1 in October 2020, or 9.2% of all workers), the scheme has reached far fewer workers during 2021 so far (675 000 or 4.5% of workers in January and 970 000 or 6.1% of workers in March) – a statistically significant difference relative to the number of recipients in a given reference month in 2020. This reduction in the number of recipients is likely partially attributable to payment delays and backlogs, but additionally to recovering economic activity which reduces the number of workers eligible, as well as actual changes to the policy’s eligibility criteria for the October 2020 to March 2021 claim period.
Figure 3: Trends in aggregate TERS receipt, April 2020 – March 2021
4%
6%
8%
10%
12%
14%
Perc
enta
ge o
f em
ploy
ed
500 000
1 000 000
1 500 000
2 000 000
2 500 000
Num
ber o
f rec
ipie
nts
April 2020(L5)
June 2020(L3)
October 2020(L1)
January 2021(Adjusted L3)
March 2021(L1)
Number of recipients Recipients as % of employed 95% CI for total TERS recipients
Authors’ own calculations. Source: NIDS-CRAM Waves 1 to 5.Notes: [1] Estimates weighted using sampling weights after accounting for complex survey design.
By exploiting the panel nature of the data, we estimate transition matrices which show the probability of a worker receiving TERS in a future period conditional on receiving (or not receiving) TERS in a past period. As shown in Table 1, we find that more than half (53.4%) of all TERS recipients in April 2020 continued to receive TERS in June 2020. This relatively high proportion did not persist however into the remainder of the year. Most recipients in June 2020 (76.4%) did not receive it in October 2020. Similarly, close to 90% of October 2020 recipients did not continue to receive TERS in January 2021, with a similar proportion of workers experiencing this transition for the January – March 2021 period. Considering these transition matrices model TERS receipt in a given month, it is possible that they underestimate the true number of individuals who applied and were approved for
14 However, it should be noted that the NIDS-CRAM data does not permit us to estimate TERS receipt across the whole period (that is, in every month) but only in given reference months. As such, the aggregate estimate of 4.5 million is likely underestimated.

10 | The distribution and dynamics of South Africa’s TERS policy
TERS benefits in each period. Furthermore, since only the employed are eligible for TERS receipt, it is possible that some degree of this variation in receipt over time can be explained by job loss. We explore this in more detail in the section to follow.
Table 1: Transition matrices of TERS receipt, April 2020 – March 2021
TERS receipt, Jun 2020 (%) TERS receipt, Oct 2020 (%)
No Yes Total No Yes Total
TERS receipt Apr 2020 (%)
No 92.4 7.6 100.0
TERS receipt June 2020 (%)
No 93.4 6.6 100.0
Yes 46.6 53.4 100.0 Yes 76.4 23.6 100.0
Total 85.7 14.3 100.0 Total 91.3 8.7 100.0
TERS receipt, Jan 2021 (%) TERS receipt, Mar 2021 (%)
No Yes Total No Yes Total
TERS receipt Oct 2020 (%)
No 96.1 3.9 100.0
TERS receipt Jan 2021 (%)
No 96.5 3.5 100.0
Yes 89.9 10.1 100.0 Yes 89.6 10.5 100.0
Total 95.6 4.4 100.0 Total 96.2 3.8 100.0
Authors’ own calculations. Source: NIDS-CRAM Waves 1 to 5.Notes: [1] Estimates weighted using relevant balanced panel sampling weights after accounting for complex survey design.
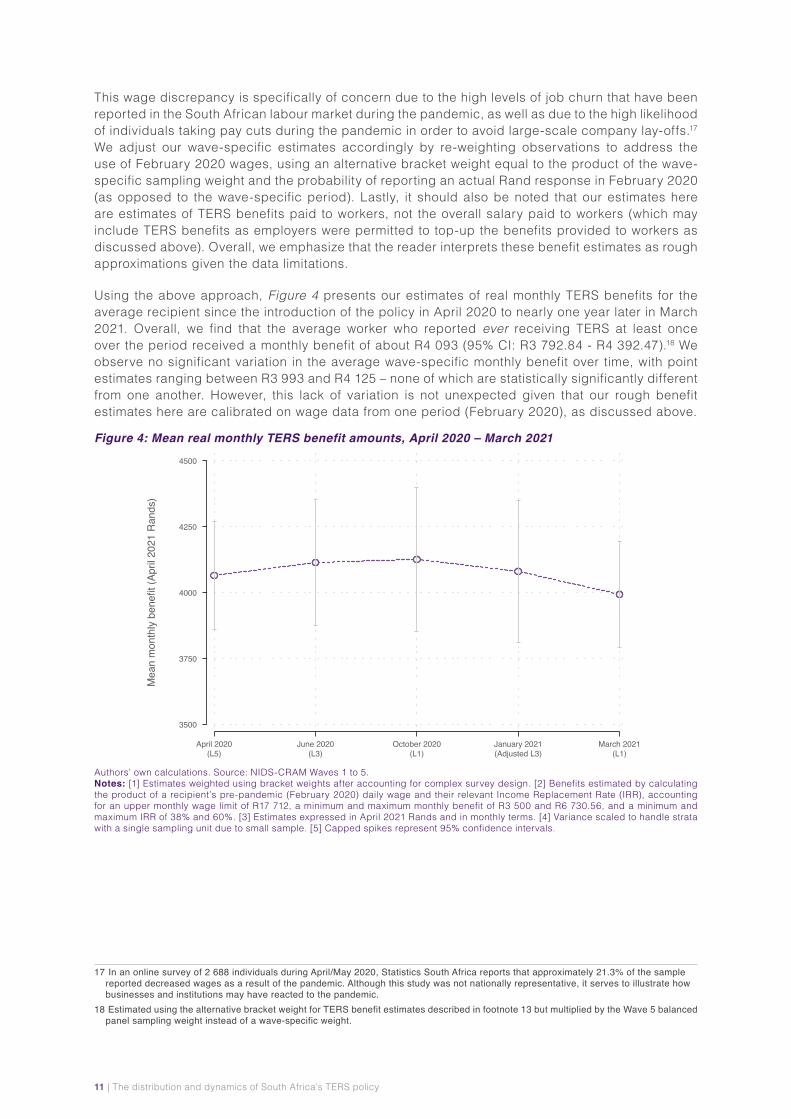
To analyse the value of TERS benefits received by the average recipient over time, we would of course require data on TERS benefits. Unfortunately, recipients in the NIDS-CRAM were not directly asked the monetary value of any TERS benefits received. However, we are able to estimate rough magnitudes of these benefits by making use of pre-pandemic (February 2020) wage data in the survey and the UIF’s TERS benefit formula, which indicates the percentage of worker’s daily wage to which they would be entitled in the form of TERS benefits had their wages remained the same as their February 2020 wages, adjusted for inflation.15 Specifically, accounting for an upper monthly wage threshold of R17 712, a minimum and maximum monthly benefit of R3 500 and R6 730.56, and a minimum and maximum IRR of 38% and 60%, as per the relevant legislation, our procedure to estimate monthly TERS benefits is outlined as follows:
1. Calculate recipient ’s daily equivalent wage in February 2020
2. Calculate expressed in percentage terms
3. Calculate recipient ’s daily TERS benefit and convert to a monthly equivalent16
Although our estimates using this approach are useful, it should be noted that our estimates could be biased to some extent for several reasons. First, we are only able to produce estimates for individuals who (i) were at least in Wave 1 of the panel so that February 2020 wage data could be used and (ii) reported both TERS receipt and February 2020 wage data. Second, it is possible that recall bias owing to reporting February 2020 wages at the time of the Wave 1 survey in May/June 2020 may exist, which could result in a degree of measurement error in our TERS benefit estimates. Third, wages in February 2020 may not be equivalent to wages declared in TERS applications.
15 We choose to use pre-pandemic (February 2020) wage data in this calculation given that self-reported wages in every period thereafter in the NIDS-CRAM likely includes any benefit received among TERS recipients.
16 Monthly TERS benefit equivalent to daily benefit multiplied by 365 and divided by 12.
11 | The distribution and dynamics of South Africa’s TERS policy
This wage discrepancy is specifically of concern due to the high levels of job churn that have been reported in the South African labour market during the pandemic, as well as due to the high likelihood of individuals taking pay cuts during the pandemic in order to avoid large-scale company lay-offs.17 We adjust our wave-specific estimates accordingly by re-weighting observations to address the use of February 2020 wages, using an alternative bracket weight equal to the product of the wave-specific sampling weight and the probability of reporting an actual Rand response in February 2020 (as opposed to the wave-specific period). Lastly, it should also be noted that our estimates here are estimates of TERS benefits paid to workers, not the overall salary paid to workers (which may include TERS benefits as employers were permitted to top-up the benefits provided to workers as discussed above). Overall, we emphasize that the reader interprets these benefit estimates as rough approximations given the data limitations.
Using the above approach, Figure 4 presents our estimates of real monthly TERS benefits for the average recipient since the introduction of the policy in April 2020 to nearly one year later in March 2021. Overall, we find that the average worker who reported ever receiving TERS at least once over the period received a monthly benefit of about R4 093 (95% CI: R3 792.84 - R4 392.47).18 We observe no significant variation in the average wave-specific monthly benefit over time, with point estimates ranging between R3 993 and R4 125 – none of which are statistically significantly different from one another. However, this lack of variation is not unexpected given that our rough benefit estimates here are calibrated on wage data from one period (February 2020), as discussed above.
Figure 4: Mean real monthly TERS benefit amounts, April 2020 – March 2021
3500
3750
4000
4250
4500
Mea
n m
onth
ly b
enef
it (A
pril
2021
Ran
ds)
April 2020(L5)
June 2020(L3)
October 2020(L1)
January 2021(Adjusted L3)
March 2021(L1)
Authors’ own calculations. Source: NIDS-CRAM Waves 1 to 5.Notes: [1] Estimates weighted using bracket weights after accounting for complex survey design. [2] Benefits estimated by calculating the product of a recipient’s pre-pandemic (February 2020) daily wage and their relevant Income Replacement Rate (IRR), accounting for an upper monthly wage limit of R17 712, a minimum and maximum monthly benefit of R3 500 and R6 730.56, and a minimum and maximum IRR of 38% and 60%. [3] Estimates expressed in April 2021 Rands and in monthly terms. [4] Variance scaled to handle strata with a single sampling unit due to small sample. [5] Capped spikes represent 95% confidence intervals.
17 In an online survey of 2 688 individuals during April/May 2020, Statistics South Africa reports that approximately 21.3% of the sample reported decreased wages as a result of the pandemic. Although this study was not nationally representative, it serves to illustrate how businesses and institutions may have reacted to the pandemic.
18 Estimated using the alternative bracket weight for TERS benefit estimates described in footnote 13 but multiplied by the Wave 5 balanced panel sampling weight instead of a wave-specific weight.

12 | The distribution and dynamics of South Africa’s TERS policy
4.2. Between-group trends in receiptResearchers who have analysed employment patterns during the South African lockdown have found that the incidence of job loss has not been felt equally across groups (see, for example, previous NIDS-CRAM working papers by Ranchhod and Daniels (2021); Jain et al. (2020); Bassier, Budlender and Zizzamia (2021); and Casale and Shepherd (2020a; 2020b; 2021a; 2021b), amongst others). Given that the TERS benefit could only be claimed by those who were employed, disproportionate job loss amongst any one demographic group would necessarily impact on that group’s ability to claim TERS benefits. To this end, it is interesting to examine trends in TERS receipt between groups to understand which groups benefited most from the policy. Table 2 represents univariate proportions of TERS recipients made up by different demographic groups across the five waves of the NIDS-CRAM survey. All figures represent the proportion of TERS recipients who were part of a specific socio-economic or demographic group.
Table 2: Distribution of TERS receipt by demographic and socio-economic characteristics, Wave 1-5
Wave 1 Wave 2 Wave 3 Wave 4 Wave 5
(April 2020) (June 2020) (October 2020)
(January 2021)
(March 2021)
Gender
Male 0.61 0.60 0.63 0.65 0.64
[0.52; 0.70] [0.50; 0.71] [0.51; 0.75] [0.50; 0.81] [0.50; 0.78]
Female 0.39 0.40 0.37 0.35 0.36
[0.30; 0.48] [0.29; 0.50] [0.25; 0.49] [0.19; 0.50] [0.22; 0.50]
Race
African/Black 0.75 0.69 0.77 0.79 0.91
[0.64; 0.85] [0.58; 0.80] [0.66; 0.88] [0.63; 0.95] [0.84; 0.98]
Coloured 0.13 0.10 0.14 0.09 0.05
[0.04; 0.22] [0.03; 0.18] [0.04; 0.24] [0.06; 0.11] [0.01; 0.09]
Asian/Indian 0.02 0.06 0.01 0.08 0.01
[-0.01; 0.05] [-0.01; 0.13] [-0.01; 0.03] [-0.09; 0.24] [-0.01; 0.03]
White 0.10 0.15 0.08 0.04 0.03
[0.04; 0.16] [0.06; 0.23] [0.01; 0.15] [-0.01; 0.10] [-0.02; 0.08]
Age
18-34 years 0.42 0.41 0.41 0.40 0.35
[0.33; 0.51] [0.31; 0.51] [0.30; 0.52] [0.19; 0.62] [0.15; 0.56]
35-59 years 0.55 0.53 0.55 0.59 0.63
[0.45; 0.64] [0.43; 0.63] [0.44; 0.66] [0.38; 0.81] [0.43; 0.84]
60+ years 0.03 0.06 0.04 0.00 0.01
[0.00; 0.06] [0.00; 0.13] [0.00; 0.09] [-0.01; 0.02] [-0.01; 0.04]

13 | The distribution and dynamics of South Africa’s TERS policy
Pre-pandemic real hourly wage quintile
Quintile 1 (R0 to R7.76 per hour) 0.12 0.06 0.08 0.06 0.08
[0.03; 0.21] [0.01; 0.10] [0.00; 0.16] [-0.06; 0.17] [-0.04; 0.19]
Quintile 2 (R7.76 to R17.06 per hour) 0.15 0.19 0.22 0.30 0.18
[0.07; 0.23] [0.08; 0.30] [0.10; 0.34] [0.14; 0.47] [0.03; 0.33]
Quintile 3 (R17.06 to R29.09 per hour) 0.31 0.35 0.25 0.35 0.16
[0.21; 0.40] [0.22; 0.48] [0.09; 0.41] [0.11; 0.60] [0.01; 0.32]
Quintile 4 (R29.09 to R72.73 per hour) 0.30 0.27 0.32 0.24 0.55
[0.18; 0.42] [0.15; 0.38] [0.12; 0.52] [-0.04; 0.52] [0.26; 0.83]
Quintile 5 (R72.73+ per hour) 0.13 0.14 0.13 0.05 0.04
[0.03; 0.22] [0.05; 0.22] [-0.01; 0.26] [-0.07; 0.17] [0.00; 0.07]
Area
Traditional 0.11 0.10 0.12 0.13 0.10
[0.05; 0.17] [0.05; 0.15] [0.06; 0.18] [0.04; 0.22] [0.02; 0.17]
Urban 0.82 0.88 0.87 0.86 0.86
[0.73; 0.90] [0.82; 0.93] [0.81; 0.93] [0.77; 0.95] [0.74; 0.97]
Farms 0.08 0.02 0.01 0.01 0.05
[0.01; 0.14] [0.00; 0.04] [0.00; 0.03] [0.01; 0.02] [-0.04; 0.13]
Skill level
High-skilled 0.16 0.16 0.12 0.12 0.10
[0.08; 0.24] [0.09; 0.24] [0.05; 0.19] [0.03; 0.20] [-0.03; 0.23]
Semi-skilled 0.68 0.63 0.61 0.50 0.64
[0.59; 0.77] [0.53; 0.74] [0.50; 0.71] [0.28; 0.72] [0.50; 0.79]
Less-skilled 0.16 0.20 0.28 0.38 0.26
[0.09; 0.24] [0.11; 0.29] [0.17; 0.38] [0.16; 0.60] [0.14; 0.38]
Sector
Primary 0.15 0.09 0.10 0.04 0.05
[0.06; 0.24] [0.03; 0.14] [0.03; 0.17] [-0.01; 0.09] [0.01; 0.08]
Secondary 0.28 0.31 0.20 0.40 0.30
[0.17; 0.40] [0.22; 0.40] [0.13; 0.27] [0.26; 0.54] [0.15; 0.44]
Tertiary 0.57 0.60 0.70 0.56 0.66
[0.44; 0.70] [0.51; 0.70] [0.61; 0.79] [0.41; 0.71] [0.52; 0.79]
14 | The distribution and dynamics of South Africa’s TERS policy
Written contract
No written contract 0.19 0.25 0.19 0.27 0.15
[0.11; 0.27] [0.14; 0.35] [0.09; 0.29] [0.05; 0.50] [0.04; 0.27]
Written contract 0.81 0.75 0.81 0.73 0.85
[0.73; 0.89] [0.65; 0.86] [0.71; 0.91] [0.50; 0.95] [0.73; 0.96]
Ability to work from home
No . 0.81 0.81 0.91 0.94
[0.72; 0.91] [0.72; 0.91] [0.85; 0.98] [0.89; 0.99]
Sometimes . 0.12 0.14 0.05 0.03
[0.04; 0.19] [0.05; 0.22] [0.00; 0.11] [-0.01; 0.07]
Yes . 0.07 0.05 0.04 0.03
[0.01; 0.13] [0.01; 0.09] [0.00; 0.07] [0.00; 0.06]
Weekly working hours
0-9 0.23 0.03 0.04 0.01 0.05
[0.16; 0.30] [0.00; 0.06] [0.00; 0.08] [0.00; 0.03] [-0.03; 0.14]
10-19 0.07 0.05 0.06 0.05 0.05
[0.02; 0.12] [-0.01; 0.10] [0.00; 0.12] [-0.01; 0.12] [0.00; 0.09]
20-29 0.06 0.06 0.15 0.06 0.04
[0.01; 0.10] [0.02; 0.10] [0.05; 0.25] [0.00; 0.12] [0.01; 0.06]
30-39 0.04 0.12 0.07 0.15 0.07
[0.01; 0.07] [0.05; 0.19] [0.02; 0.12] [-0.01; 0.31] [0.01; 0.12]
40-49 0.23 0.30 0.42 0.32 0.40
[0.13; 0.32] [0.21; 0.38] [0.29; 0.56] [0.11; 0.52] [0.21; 0.59]
50+ 0.38 0.45 0.26 0.40 0.40
[0.29; 0.46] [0.34; 0.55] [0.16; 0.35] [0.19; 0.62] [0.20; 0.60]
Highest level of education
Up to primary 0.08 0.11 0.11 0.04 0.20
[0.04; 0.13] [0.04; 0.18] [0.04; 0.18] [-0.01; 0.09] [0.03; 0.38]
Incomplete secondary 0.29 0.35 0.27 0.46 0.30
[0.20; 0.37] [0.26; 0.45] [0.19; 0.35] [0.25; 0.67] [0.16; 0.45]
Complete secondary 0.29 0.22 0.26 0.16 0.20
[0.20; 0.37] [0.13; 0.31] [0.14; 0.37] [-0.03; 0.36] [0.07; 0.32]
Tertiary 0.34 0.32 0.37 0.34 0.30
[0.25; 0.44] [0.22; 0.41] [0.26; 0.47] [0.17; 0.51] [0.14; 0.46]
15 | The distribution and dynamics of South Africa’s TERS policy
Employment type
Regular worker 0.77 0.70 0.59 0.71 0.63
[0.68; 0.86] [0.61; 0.79] [0.48; 0.71] [0.57; 0.85] [0.45; 0.80]
Casual worker 0.23 0.24 0.38 0.23 0.35
[0.14; 0.32] [0.16; 0.33] [0.27; 0.50] [0.11; 0.35] [0.17; 0.53]
Own account worker . 0.05 0.02 0.06 0.02
. [0.02; 0.09] [0.00; 0.05] [-0.02; 0.13] [0.00; 0.05]
Authors’ own calculations. Source: NIDS-CRAM Waves 1 to 5.Note: [1] Estimates weighted using sampling weights after accounting for complex survey design. Variances have been scaled to account for strata with single observations. [2] Working from home data only available from Wave 2 onwards. Relevant question phrased as: “Are you able to work from home? If yes, some or most of the time?” [3] Own account workers defined as those who report being self-employed or running their own business. [4] 95% confidence intervals included in square parentheses below point estimates. [5] Skill level of individuals defined according to 1-digit occupation code: Managers and professionals classified as high-skilled; technicians, clerical staff, service and sales workers, skilled agricultural workers, craft and machine operators, and plant and machine operators classified as semi-skilled; and elementary occupations classified as less-skilled. [6] Sector data for Wave 1 imputed from Wave 2 responses and are defined according to 1-digit SIC code classification: Agriculture, hunting, fishing, mining and quarrying classified as primary; manufacturing, electricity and gas, and construction classified as secondary; remainder classified as tertiary.
The first striking finding emerging from this table is that the majority of TERS recipients are men, and that this figure has not drastically changed across the period under observation. In April 2020 (Wave 1), approximately 61% of TERS recipients were men. This is slightly higher than the proportion of men amongst the employed population, which lies between 53 and 56% throughout all NIDS-CRAM waves, however, it is not statistically significantly different. Nearly one year later in March 2021 (Wave 5), the proportion of TERS recipients that were men had increased – albeit insignificantly – to 64%. This increase in male representation amongst TERS recipients coupled with a fairly stable rate of representation amongst the employed in general suggests that TERS benefits disproportionately accrued to men during the lockdown period, even if only slightly.
Over the period under investigation, there has been a remarkable shift in the racial composition of TERS recipients, with African/Black individuals increasing from 75% to 91% of recipients, while Coloured and White individuals decreased from 13% to 5%, and 10% to 3% of recipients, respectively. Most notably, however, is that the increase in proportion of African/Black individuals is statistically significant at the 10% level. One possible explanation for this shift is greater accessibility to the TERS benefits, and greater support of vulnerable groups in the labour market, particularly when considered in conjunction with the sharp increases in recipients who are less skilled, those who fell into the second quintile of the February 2020 wage distribution, those with education levels up to primary school, and casual workers. However, these increases cannot be solely attributed to expansion of the TERS policy to be more inclusive and supportive. Given that vulnerable groups were more likely to lose their jobs in the early stages of the lockdown, it is possible that increased proportions of vulnerable groups claiming TERS benefits in later waves is the result of job recovery and a subsequent ability to prove an existing employment relationship amongst members of this socio-economic group.19 Although this explanation also supports the argument that TERS benefits supported vulnerable groups more strongly as time went on, it should not be solely attributed to increases in information dissemination or accessibility of the programme. In fact, based on the rather smaller absolute number and proportion of TERS recipients in 2021, it is unlikely that the changes seen are due to expanded public accessibility of the programme.
We note that the age distribution of TERS receipt is relatively consistent with the distribution of employees in the labour market. Approximately 40% of the employed are between 18 and 34 years of age, and they account for approximately 42% of TERS receipt, while those aged between 35- and 59-years account for approximately 53% of the employed and around the same proportion of TERS
19 Although the data exists to investigate this hypothesis within the context of the NIDS-CRAM, we leave this for future research. Very preliminary results found by the authors suggest that this may not be the case, however, more research is needed to conclude with certainty.
16 | The distribution and dynamics of South Africa’s TERS policy
recipients. However, the decline in the proportion of 18- to 34-year-old TERS recipients over time, although insignificant, is potentially of concern, and may indicate that the youth – a vulnerable group in and of themselves – may have been less than proportionally supported by the TERS programme.
Unsurprisingly, given the nature of the TERS benefits, those employees who had a written contract made up a much larger proportion of TERS recipients (between 73 and 85%) than those who did not have a written contract (between 15 and 27%). This likely speaks to the ease of proving an employment relationship with a written contract; however, it is encouraging to note that even when a written contract of employment is not in effect, the TERS programme was still able to support employees. Although limited, this is evidence that the TERS programme may have been able to reach employees in the informal sector, who were particularly vulnerable to the effects of the lockdown (Köhler et al., 2021).
Furthermore, it is clear that the TERS benefit scheme particularly benefited individuals who were not able to work from home during the lockdown. Between 81 and 94% of TERS recipients were unable to work from home at various points during South Africa’s lockdown, which indicates that the TERS was fairly well-targeted to those individuals who were employed in establishments that likely had to cease operations. This indicates that the TERS programme likely did act as a form of support to these businesses and potentially acted as a form of cash subsidy that would have potentially mitigated job losses in these firms.
This finding is supported when looking at the distribution of TERS recipients across the distribution of weekly working hours. In April 2020, at the start of the lockdown, almost a quarter of all TERS recipients reported working between 0 and 9 hours per week. Most of this group (88%) reported working 0 hours per week during April of 2020, indicating that the TERS supported those individuals who were in so-called “furloughed” work. As time progressed and the severity of the lockdown regulations began to wane, the proportion of TERS claimants working 0 to 9 hours per week dropped significantly, with only 5% of TERS recipients falling in this bracket by March 2021. The majority of TERS recipients, however, were those who reported working 40 hours per week or more. In April 2020, these individuals represented two in every three recipients, which since increased to approximately 80% by March 2021. The observation that most TERS recipients typically work full working weeks suggests that the policy indeed acted as a wage subsidy.
TERS receipt seems to have been clustered amongst those who are more highly educated, particularly those with completed secondary or tertiary qualifications. In April 2020, nearly two thirds of TERS recipients had at least a completed secondary qualification, and this number shrank to approximately half of TERS recipients by March 2021. Although coupled with increases in the proportion of TERS recipients with primary education or less, this distribution of recipients possibly speaks to frictions in accessibility and information dissemination. If the more educated are more likely to make use of the TERS, then perhaps this is indicative of a lack of awareness amongst those with lower education levels, or difficulty in applying for and qualifying for programme benefits. A full analysis of the TERS claim rate within groups is necessary to understand whether this is the case; however, this lies beyond the scope of this paper. It should be noted, however, that those with lower education levels are also more likely to earn lower wages in general and thus be more vulnerable to the adverse effects of the COVID-19 pandemic recession. Thus, low uptake of TERS amongst those with low levels of education could raise concerns for policymakers regarding the optimal targeting of this programme.
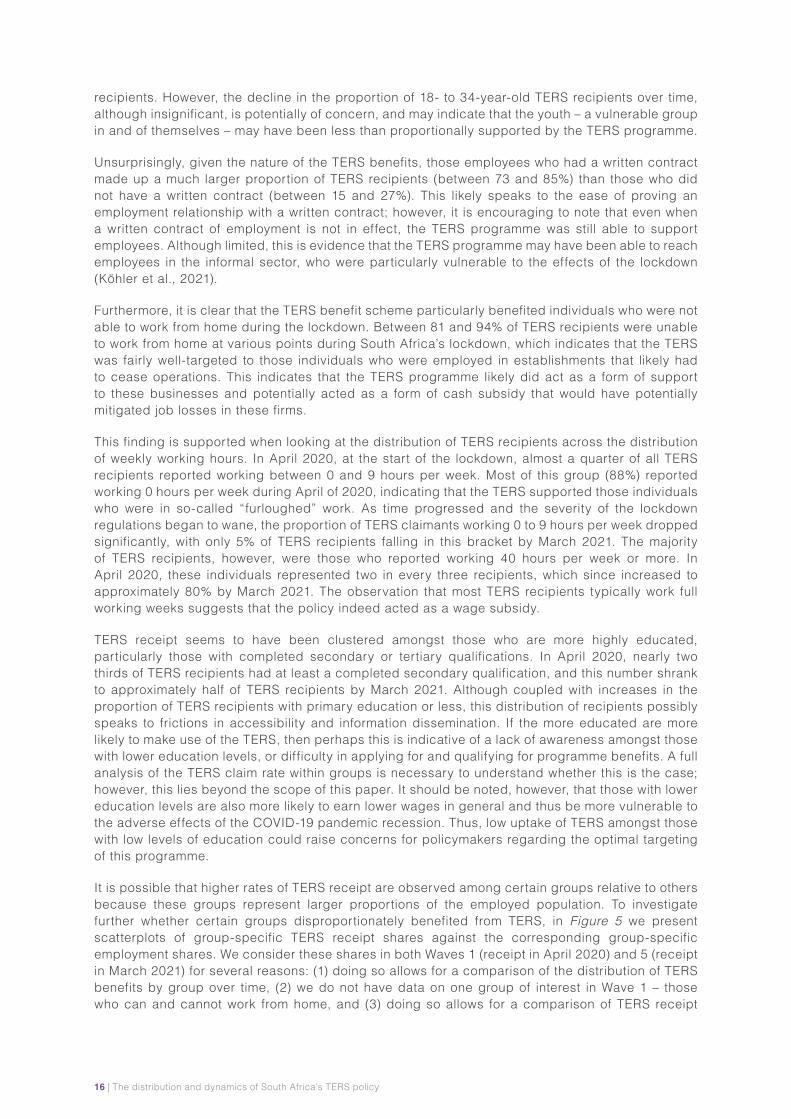
It is possible that higher rates of TERS receipt are observed among certain groups relative to others because these groups represent larger proportions of the employed population. To investigate further whether certain groups disproportionately benefited from TERS, in Figure 5 we present scatterplots of group-specific TERS receipt shares against the corresponding group-specific employment shares. We consider these shares in both Waves 1 (receipt in April 2020) and 5 (receipt in March 2021) for several reasons: (1) doing so allows for a comparison of the distribution of TERS benefits by group over time, (2) we do not have data on one group of interest in Wave 1 – those who can and cannot work from home, and (3) doing so allows for a comparison of TERS receipt
17 | The distribution and dynamics of South Africa’s TERS policy
in the initial period where every (UIF-contributing) worker was eligible, and in the extended period when eligibility was restricted to certain sectors. On (3) however, as previously discussed, it should be emphasized that the NIDS-CRAM data only contains information on when a worker received a TERS benefit but not for which period. Considering gaps in claims and payments, some recipients in March 2021 may therefore be receiving the benefit for either the initial or extended programme, but due to data limitations we are unable to identify the claim period.
Figure 5: Scatterplots of TERS receipt shares and employment shares, by group and wave
35-59
60+
18-34
Urban
Rural
Written
Non-written
Complete secondary
Up to primary
Tertiary
Incomplete secondary
Male
Female
Asian/Indian
WhiteColoured
African/Black
Primary
Tertiary
Secondary
Semi-skilled
High-skilledLess-skilled
0%
20%
40%
60%
80%
100%
TER
S re
ceip
t sha
re (%
)
0% 20% 40% 60% 80% 100% 0% 20% 40% 60% 80% 100%Employment share (%)
Wave 1 (receipt in April 2020)
60+
35-59
18-34
Urban
Rural Non-written
Written
Incomplete secondary
Up to primary
Tertiary
Complete secondary
Male
Female
African/Black
WhiteAsian/Indian
Coloured
Secondary
Primary
TertiarySemi-skilled
High-skilled
Less-skilled
Sometimes WFH Mostly can WFH
Cannot WFH
0%
20%
40%
60%
80%
100%
TER
S re
ceip
t sha
re (%
)
Employment share (%)
Wave 5 (receipt in March 2021)
Age Area Contract type Education Gender Race Sector Skill level Ability to WFH
Authors’ own calculations. Source: NIDS-CRAM Waves 1 and 5.Note: [1] Estimates weighted using sampling weights after accounting for complex survey design. Variances have been scaled to account for strata with single observations. [2] Working from home data only available from Wave 2 onwards. Relevant question phrased as: “Are you able to work from home? If yes, some or most of the time?” [3] Skill level of individuals defined according to 1-digit occupation code: Managers and professionals classified as high-skilled; technicians, clerical staff, service and sales workers, skilled agricultural workers, craft and machine operators, and plant and machine operators classified as semi-skilled; and elementary occupations classified as less-skilled. [4] Sector data for Wave 1 imputed from Wave 2 responses and are defined according to 1-digit SIC code classification: Agriculture, hunting, fishing, mining and quarrying classified as primary; manufacturing, electricity and gas and construction classified as secondary; remainder classified as tertiary.
Overall, we find that certain groups of workers indeed disproportionately benefited with respect to TERS receipt, and that most who disproportionately benefited continued to do so over time. For instance, in April 2020, workers with written contracts accounted for 81% of TERS recipients but only 68% of the employed. A similar gap exists in March 2021. Other workers who disproportionately benefited by this definition over time include men, the semi-skilled, and those working in the secondary sector. Those who disproportionately benefited in March 2021 but not April 2020 additionally includes workers who were African/Black, those who reside in urban areas, are aged 35 – 59 years, and have low levels of formal education (up to primary). When considering workers who are unable to work from home, we find that these workers, too, disproportionately benefited in March 2021, representing 91% of TERS recipients but just 78% of the employed. Although we do not have data on this group in April 2020, for all other waves (as shown in Figure A1 in the appendix) this group disproportionately persistently benefited for all periods for which data is available.
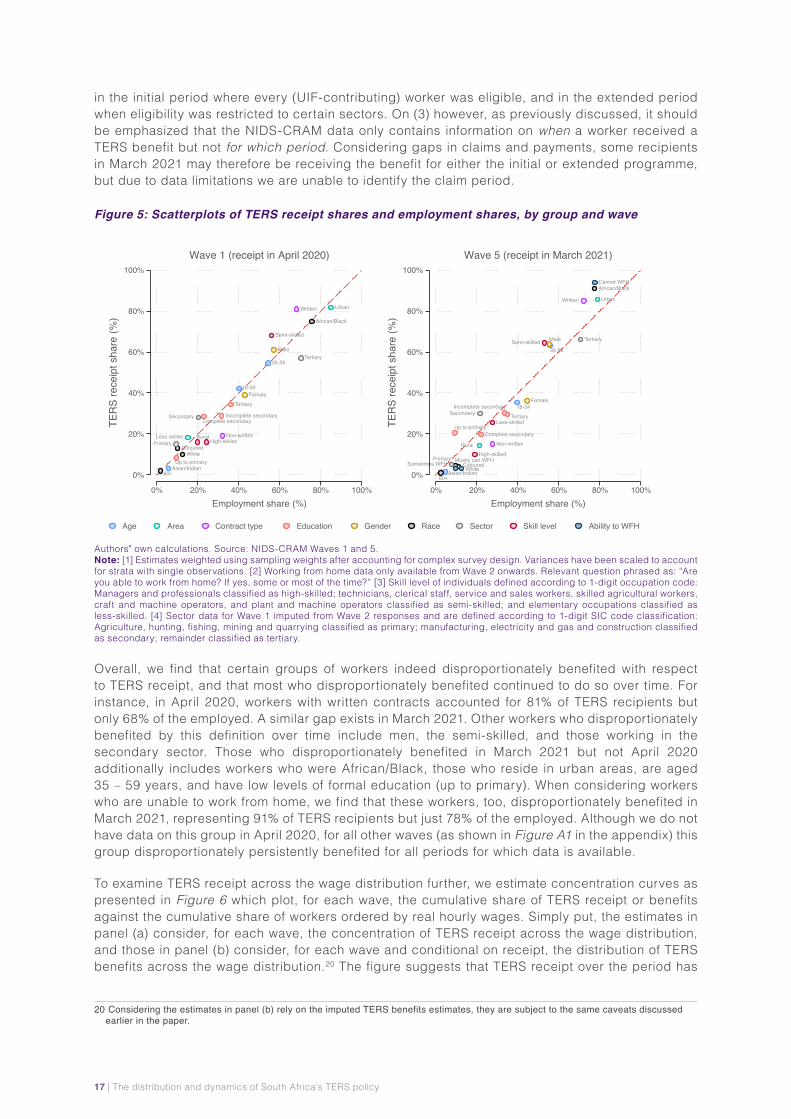
To examine TERS receipt across the wage distribution further, we estimate concentration curves as presented in Figure 6 which plot, for each wave, the cumulative share of TERS receipt or benefits against the cumulative share of workers ordered by real hourly wages. Simply put, the estimates in panel (a) consider, for each wave, the concentration of TERS receipt across the wage distribution, and those in panel (b) consider, for each wave and conditional on receipt, the distribution of TERS benefits across the wage distribution.20 The figure suggests that TERS receipt over the period has
20 Considering the estimates in panel (b) rely on the imputed TERS benefits estimates, they are subject to the same caveats discussed earlier in the paper.
18 | The distribution and dynamics of South Africa’s TERS policy
been relatively distribution-neutral (that is, neither pro-poor nor pro-rich). The 95% confidence intervals of the curves all overlap the diagonal, and this holds for all periods considered. For example, in April 2020 the poorest 40% of workers accounted for about 40% of recipients. Conditional on receiving TERS, however, the distribution of TERS benefits is marginally regressive in every period. For example, in April 2020 the richest 20% of workers accounted for about 25% of benefits received. This is arguably less likely due to higher-wage workers being more eligible or having greater access to the policy, but rather due to the progressive, sliding-scale design of the TERS benefit formula. As outlined above, the formula ensures that benefits higher for higher-wage workers in absolute terms, but only up to an upper threshold of R6 730 per worker per month. However, this upper threshold, together with the lower threshold of R3 500 per worker per month, ensures higher benefits for lower-wage workers in relative terms. This is outlined further below.
Figure 6: Concentration curves of TERS receipt and benefits, April 2020 – March 2021
Cum
ulat
ive
TER
S re
ceip
t sha
re (%
)
0% 20% 40% 60% 80% 100% 0% 20% 40% 60% 80% 100%Cumulative population share
(ordered by real hourly wage) (%)
(a) TERS receipt incidence
Cum
ulat
ive
TER
S be
nefit
sha
re (%
)
Cumulative population share(ordered by real hourly wage) (%)
(b) TERS benefit incidence
April 2020 June 2020 October 2020 January 2021 March 2021
0%
20%
40%
60%
80%
100%
Authors’ own calculations. Source: NIDS-CRAM Waves 1 to 5.Notes: [1] Estimates weighted using computed bracket weights. [2] Wage data adjusted for outliers and selection into bracket responses and are expressed in real values (April 2021 Rands). [3] Weekly working hours for zero-hour workers replaced with mean weekly working hours within each period. [4] Shaded areas represent 95% confidence intervals.
As discussed above, the TERS benefit formula ensures that benefits are higher in relative terms for lower-wage workers, despite being higher in absolute terms for higher-wage workers. To highlight why this is, Table 3 presents average TERS benefits relative to the average wage for each wage quintile.21 We estimate that the average TERS recipient within the poorest 20% of workers received a monthly benefit of R3 500 per month, despite a pre-pandemic wage of just over R474 per month for the average worker within this quintile. In other words, the average TERS benefit among the poorest 20% of workers is nearly 7.4 times higher than the group’s average pre-pandemic wage. This contrasts with a ratio of less than 0.60 for the richest 40% of workers.
21 We compare TERS benefit amounts to pre-pandemic (February 2020) wages here because, as outlined above, we make use of this data to estimate TERS benefit amounts.

19 | The distribution and dynamics of South Africa’s TERS policy
Table 3: TERS benefits relative to wages across the wage distribution
Pre-pandemic hourly wage quintile
Mean monthly pre-pandemic wage (Rands)
Mean monthly TERS benefit (Rands)
Benefit ratio
Poorest 20%474.01 3 500.00
7.3836.64 (0.00)
22100.46 3 500.00
1.6775.89 (0.00)
33755.39 3 500.00
0.93121.46 (0.00)
47129.79 4 142.36
0.58310.42 (188.94)
Richest 20%25716.64 6 457.49
0.251650.34 (119.36)
Authors’ own calculations. Source: NIDS-CRAM Waves 1 to 5.Notes: [1] Estimates weighted using computed bracket weights after accounting for complex survey design. [2] Wage data adjusted for outliers and selection into bracket responses and are expressed in real values (April 2021 Rands). [3] Weekly working hours for zero-hour workers replaced with mean weekly working hours within each period. [4] TERS benefit calculated using the UIF TERS benefit formula and NIDS-CRAM data on pre-pandemic (February 2020) wages. [5] Benefit ratio defined as the mean monthly TERS benefit as a proportion of the mean monthly pre-pandemic wage for a given quintile.
4.3. Modelling the correlates of TERS receipt In the previous section, we analysed how the distribution of TERS receipt varied across several socio-economic characteristics in a bivariate setting. However, it is also interesting to consider the confluence of these factors, and as a result, we estimate a multivariate model to predict the likelihood of TERS receipt as a function of multiple socio-economic characteristics. Figure 7, below, presents these estimates for the two end periods of the TERS programme: namely, April 2020 and March 2021. A full table of results for all five waves is presented in Table A1 in the Appendix.

20 | The distribution and dynamics of South Africa’s TERS policy
Figure 7: Coefficient plot of the conditional correlates of TERS receipt estimated via linear probability model, April 2020 versus March 2021
Secondary sectorSemi-skilled
Cannot WFHWritten contract
Tertiary sectorSocial grant recipient
Can WFH some of the timeLess-skilled
Urban35-59 years
Weekly working hoursFemale
WhiteAsian/Indian
MarriedCasual work
Coloured60+ years
MatricUp to secondary education
Tertiary education
-20% -10% 0 10% 20% 30%
Coefficient
April 2020 March 2021
Authors’ own calculations. Source: NIDS-CRAM Waves 1 and 5.Notes: [1] Estimates weighted using relevant sampling weights after accounting for complex survey design. [2] Coefficients obtained through the estimation of a linear probability model of the probability of reporting TERS receipt on a vector of observable covariates for each wave. [3] Work-from-home (WFH) data not available for Wave 1 (April 2020). [4] Reference groups for categorical variables as follows: 18-34 years, African/Black, highest level of education = up to primary, high-skilled as per the main current or past occupation, primary sector, can work-from-home all the time, type of employment = regular work, Western Cape. [5] Models additionally control for province, but coefficients suppressed for brevity. [6] Complete model results for all waves presented in Table A1 in the appendix.
In the multivariate context, we see that those who are semi-skilled, those who cannot work from home, and those who are in possession of a written contract are all, holding other factors constant, statistically significantly more likely to claim TERS benefits in both April 2020 and March 2021 than those who are high-skilled, those who are able to work from home all the time, and those who are not in possession of a written contract, respectively.22 These factors are also the only ones that remain regularly significant across the entire period of the TERS programme. The magnitude of all these coefficients shrank between April 2020 and March 2021, which is unsurprising given the reopening of the economy and the fact that most individuals were able to return to work under the level 1 lockdown regulations in place in March 2021.
It is interesting to note, however, that in general, the remainder of the covariates under analysis are not individually statistically significant in predicting the likelihood of TERS receipt. To an extent, this may provide evidence that the TERS programme was successful in acting as a subsidy to support individuals who were formally employed in an establishment that had to limit or cease operations during the lockdown.
4.4. Modelling the relationship between TERS receipt and job retentionThe TERS acted as a type of wage subsidy which provided some form of financial support to establishments that were struggling to continue operations under lockdown regulations. As a result, a key question to ask regarding the TERS programme is whether it assisted in supporting job retention during the lockdown. Theoretically, one would expect that an establishment that was able to claim TERS benefits for its employees would be more likely to be able to continue operations and would be under less financial strain relative to an establishment which did not claim, thus allowing
22The‘effect’sizesforbeingsemi-skilled,notabletoworkfromhomeandpossessionofawrittencontractare,respectively:8.9percentage points, inestimable and 8.0 percentage points for April 2020; and 4.7 percentage points, 4.1 percentage points, and 3.9 percentage points for March 2021.
21 | The distribution and dynamics of South Africa’s TERS policy
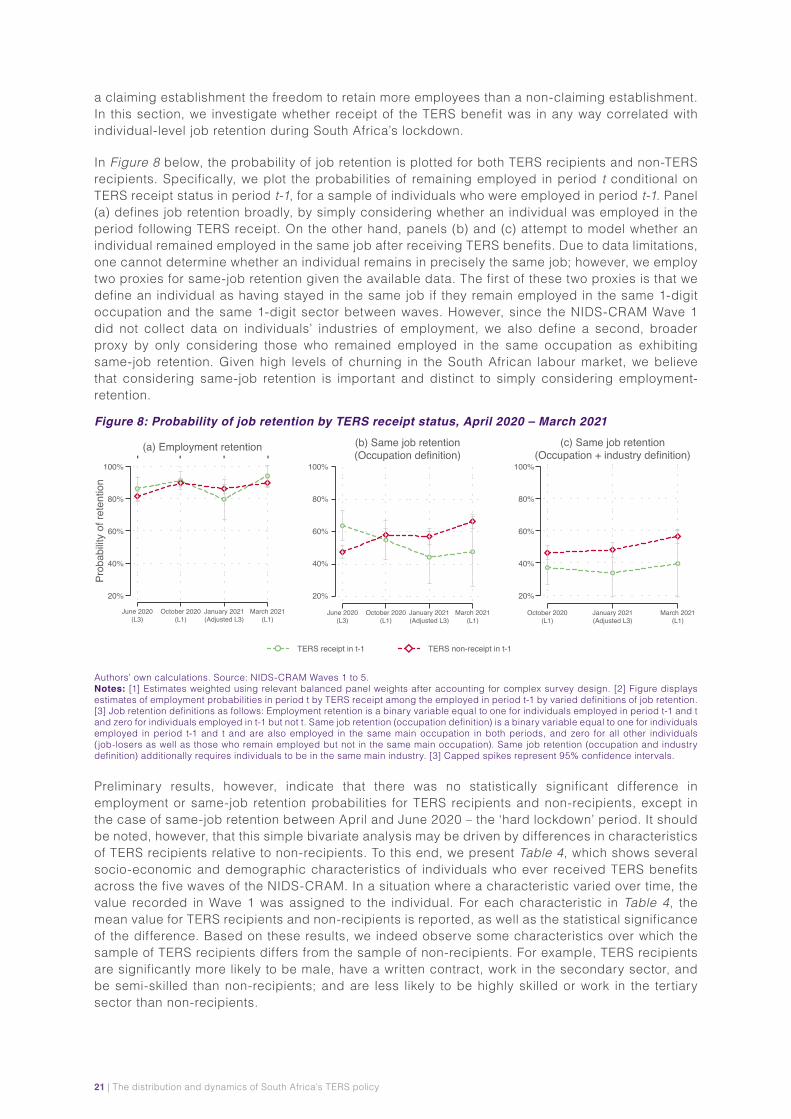
a claiming establishment the freedom to retain more employees than a non-claiming establishment. In this section, we investigate whether receipt of the TERS benefit was in any way correlated with individual-level job retention during South Africa’s lockdown.
In Figure 8 below, the probability of job retention is plotted for both TERS recipients and non-TERS recipients. Specifically, we plot the probabilities of remaining employed in period t conditional on TERS receipt status in period t-1, for a sample of individuals who were employed in period t-1. Panel (a) defines job retention broadly, by simply considering whether an individual was employed in the period following TERS receipt. On the other hand, panels (b) and (c) attempt to model whether an individual remained employed in the same job after receiving TERS benefits. Due to data limitations, one cannot determine whether an individual remains in precisely the same job; however, we employ two proxies for same-job retention given the available data. The first of these two proxies is that we define an individual as having stayed in the same job if they remain employed in the same 1-digit occupation and the same 1-digit sector between waves. However, since the NIDS-CRAM Wave 1 did not collect data on individuals’ industries of employment, we also define a second, broader proxy by only considering those who remained employed in the same occupation as exhibiting same-job retention. Given high levels of churning in the South African labour market, we believe that considering same-job retention is important and distinct to simply considering employment-retention.
Figure 8: Probability of job retention by TERS receipt status, April 2020 – March 2021
(a) Employment retention
Prob
abilit
y of
em
ploy
men
t
June 2020(L3)
October 2020(L1)
January 2021(Adjusted L3)
March 2021(L1)
(b) Same job retention(Occupation definition)
Prob
abilit
y of
em
ploy
men
t
October 2020(L1)
January 2021(Adjusted L3)
March 2021(L1)
(c) Same job retention(Occupation + industry definition)
TERS receipt in t-1 TERS non-receipt in t-1
20%
40%
60%
80%
100%
20%
40%
60%
80%
100%
20%
40%
60%
80%
100%
Prob
abilit
y of
rete
ntio
n
June 2020(L3)
October 2020(L1)
January 2021(Adjusted L3)
March 2021(L1)
Authors’ own calculations. Source: NIDS-CRAM Waves 1 to 5.Notes: [1] Estimates weighted using relevant balanced panel weights after accounting for complex survey design. [2] Figure displays estimates of employment probabilities in period t by TERS receipt among the employed in period t-1 by varied definitions of job retention. [3] Job retention definitions as follows: Employment retention is a binary variable equal to one for individuals employed in period t-1 and t and zero for individuals employed in t-1 but not t. Same job retention (occupation definition) is a binary variable equal to one for individuals employed in period t-1 and t and are also employed in the same main occupation in both periods, and zero for all other individuals (job-losers as well as those who remain employed but not in the same main occupation). Same job retention (occupation and industry definition) additionally requires individuals to be in the same main industry. [3] Capped spikes represent 95% confidence intervals.
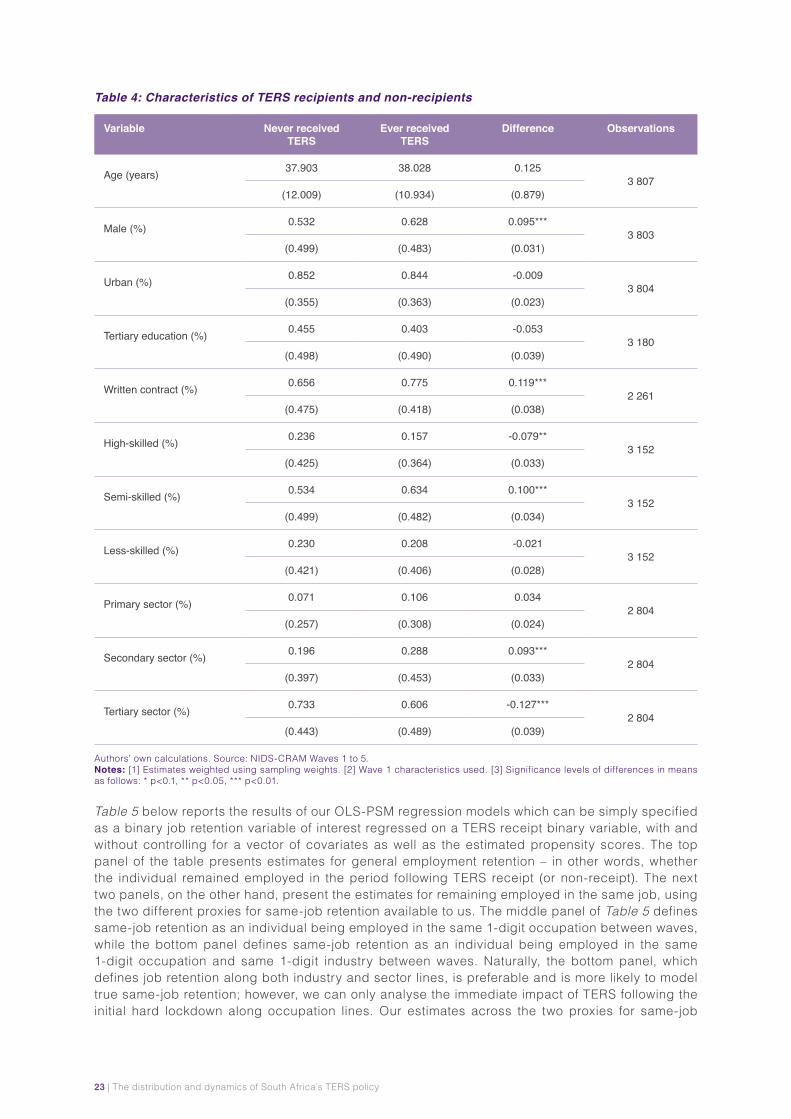
Preliminary results, however, indicate that there was no statistically significant difference in employment or same-job retention probabilities for TERS recipients and non-recipients, except in the case of same-job retention between April and June 2020 – the ‘hard lockdown’ period. It should be noted, however, that this simple bivariate analysis may be driven by differences in characteristics of TERS recipients relative to non-recipients. To this end, we present Table 4, which shows several socio-economic and demographic characteristics of individuals who ever received TERS benefits across the five waves of the NIDS-CRAM. In a situation where a characteristic varied over time, the value recorded in Wave 1 was assigned to the individual. For each characteristic in Table 4, the mean value for TERS recipients and non-recipients is reported, as well as the statistical significance of the difference. Based on these results, we indeed observe some characteristics over which the sample of TERS recipients differs from the sample of non-recipients. For example, TERS recipients are significantly more likely to be male, have a written contract, work in the secondary sector, and be semi-skilled than non-recipients; and are less likely to be highly skilled or work in the tertiary sector than non-recipients.
22 | The distribution and dynamics of South Africa’s TERS policy
All of these factors could influence the likelihood that individuals retain their jobs, particularly given the intricacies of the South African labour market in general, as well as the sector-specific restrictions that were put in place during different lockdown levels. As a result, to obtain a more detailed understanding of how TERS receipt impacted job retention probabilities, we opt to employ an Ordinary Least Squares (OLS) regression combined with a propensity score matching (PSM) technique so as to compare observationally similar individuals amongst recipient and non-recipient groups within a regression framework. In other words, recipients and non-recipients are considered a match if they exhibit similar estimated propensity scores (or probabilities of being a TERS recipient, regardless of actual receipt status). The choice to apply PSM is motivated in part due to the evidence that suggests that different groups of individuals were affected differently by South Africa’s lockdown. As a result, we employ PSM to compare observations that are as similar as possible, based on a single estimated score using a logit model, and in an attempt to avoid spurious results that may arise because of underlying differences in the sample of recipients and non-recipients. The histograms of estimated scores for each wave, presented in Figure A2 in the Appendix, are indicative of sufficient overlap and at least visually suggest that our PSM approach successfully balanced the sample – that is, conditional on our estimated propensity score, TERS recipients and non-recipients are observationally similar in each wave.
23 | The distribution and dynamics of South Africa’s TERS policy
Table 4: Characteristics of TERS recipients and non-recipients
Variable Never received TERS
Ever received TERS
Difference Observations
Age (years) 37.903 38.028 0.1253 807
(12.009) (10.934) (0.879)
Male (%) 0.532 0.628 0.095***3 803
(0.499) (0.483) (0.031)
Urban (%) 0.852 0.844 -0.0093 804
(0.355) (0.363) (0.023)
Tertiary education (%) 0.455 0.403 -0.0533 180
(0.498) (0.490) (0.039)
Written contract (%) 0.656 0.775 0.119***2 261
(0.475) (0.418) (0.038)
High-skilled (%) 0.236 0.157 -0.079**3 152
(0.425) (0.364) (0.033)
Semi-skilled (%) 0.534 0.634 0.100***3 152
(0.499) (0.482) (0.034)
Less-skilled (%) 0.230 0.208 -0.0213 152
(0.421) (0.406) (0.028)
Primary sector (%) 0.071 0.106 0.0342 804
(0.257) (0.308) (0.024)
Secondary sector (%) 0.196 0.288 0.093***2 804
(0.397) (0.453) (0.033)
Tertiary sector (%) 0.733 0.606 -0.127***2 804
(0.443) (0.489) (0.039)
Authors’ own calculations. Source: NIDS-CRAM Waves 1 to 5.Notes: [1] Estimates weighted using sampling weights. [2] Wave 1 characteristics used. [3] Significance levels of differences in means as follows: * p<0.1, ** p<0.05, *** p<0.01.
Table 5 below reports the results of our OLS-PSM regression models which can be simply specified as a binary job retention variable of interest regressed on a TERS receipt binary variable, with and without controlling for a vector of covariates as well as the estimated propensity scores. The top panel of the table presents estimates for general employment retention – in other words, whether the individual remained employed in the period following TERS receipt (or non-receipt). The next two panels, on the other hand, present the estimates for remaining employed in the same job, using the two different proxies for same-job retention available to us. The middle panel of Table 5 defines same-job retention as an individual being employed in the same 1-digit occupation between waves, while the bottom panel defines same-job retention as an individual being employed in the same 1-digit occupation and same 1-digit industry between waves. Naturally, the bottom panel, which defines job retention along both industry and sector lines, is preferable and is more likely to model true same-job retention; however, we can only analyse the immediate impact of TERS following the initial hard lockdown along occupation lines. Our estimates across the two proxies for same-job
24 | The distribution and dynamics of South Africa’s TERS policy
retention are broadly similar, however, and as such, we believe that measuring same-job retention across purely occupational lines is still valuable.
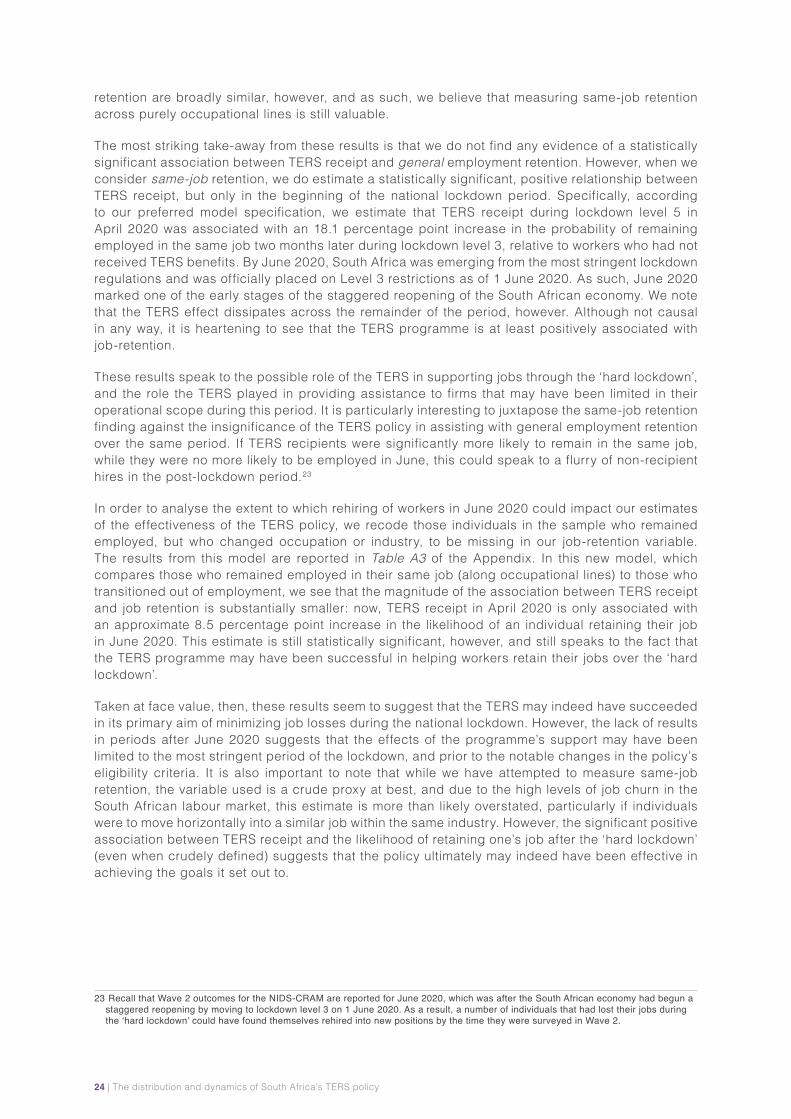
The most striking take-away from these results is that we do not find any evidence of a statistically significant association between TERS receipt and general employment retention. However, when we consider same-job retention, we do estimate a statistically significant, positive relationship between TERS receipt, but only in the beginning of the national lockdown period. Specifically, according to our preferred model specification, we estimate that TERS receipt during lockdown level 5 in April 2020 was associated with an 18.1 percentage point increase in the probability of remaining employed in the same job two months later during lockdown level 3, relative to workers who had not received TERS benefits. By June 2020, South Africa was emerging from the most stringent lockdown regulations and was officially placed on Level 3 restrictions as of 1 June 2020. As such, June 2020 marked one of the early stages of the staggered reopening of the South African economy. We note that the TERS effect dissipates across the remainder of the period, however. Although not causal in any way, it is heartening to see that the TERS programme is at least positively associated with job-retention.
These results speak to the possible role of the TERS in supporting jobs through the ‘hard lockdown’, and the role the TERS played in providing assistance to firms that may have been limited in their operational scope during this period. It is particularly interesting to juxtapose the same-job retention finding against the insignificance of the TERS policy in assisting with general employment retention over the same period. If TERS recipients were significantly more likely to remain in the same job, while they were no more likely to be employed in June, this could speak to a flurry of non-recipient hires in the post-lockdown period.23
In order to analyse the extent to which rehiring of workers in June 2020 could impact our estimates of the effectiveness of the TERS policy, we recode those individuals in the sample who remained employed, but who changed occupation or industry, to be missing in our job-retention variable. The results from this model are reported in Table A3 of the Appendix. In this new model, which compares those who remained employed in their same job (along occupational lines) to those who transitioned out of employment, we see that the magnitude of the association between TERS receipt and job retention is substantially smaller: now, TERS receipt in April 2020 is only associated with an approximate 8.5 percentage point increase in the likelihood of an individual retaining their job in June 2020. This estimate is still statistically significant, however, and still speaks to the fact that the TERS programme may have been successful in helping workers retain their jobs over the ‘hard lockdown’.
Taken at face value, then, these results seem to suggest that the TERS may indeed have succeeded in its primary aim of minimizing job losses during the national lockdown. However, the lack of results in periods after June 2020 suggests that the effects of the programme’s support may have been limited to the most stringent period of the lockdown, and prior to the notable changes in the policy’s eligibility criteria. It is also important to note that while we have attempted to measure same-job retention, the variable used is a crude proxy at best, and due to the high levels of job churn in the South African labour market, this estimate is more than likely overstated, particularly if individuals were to move horizontally into a similar job within the same industry. However, the significant positive association between TERS receipt and the likelihood of retaining one’s job after the ‘hard lockdown’ (even when crudely defined) suggests that the policy ultimately may indeed have been effective in achieving the goals it set out to.
23 Recall that Wave 2 outcomes for the NIDS-CRAM are reported for June 2020, which was after the South African economy had begun a staggered reopening by moving to lockdown level 3 on 1 June 2020. As a result, a number of individuals that had lost their jobs during the‘hardlockdown’couldhavefoundthemselvesrehiredintonewpositionsbythetimetheyweresurveyedinWave2.
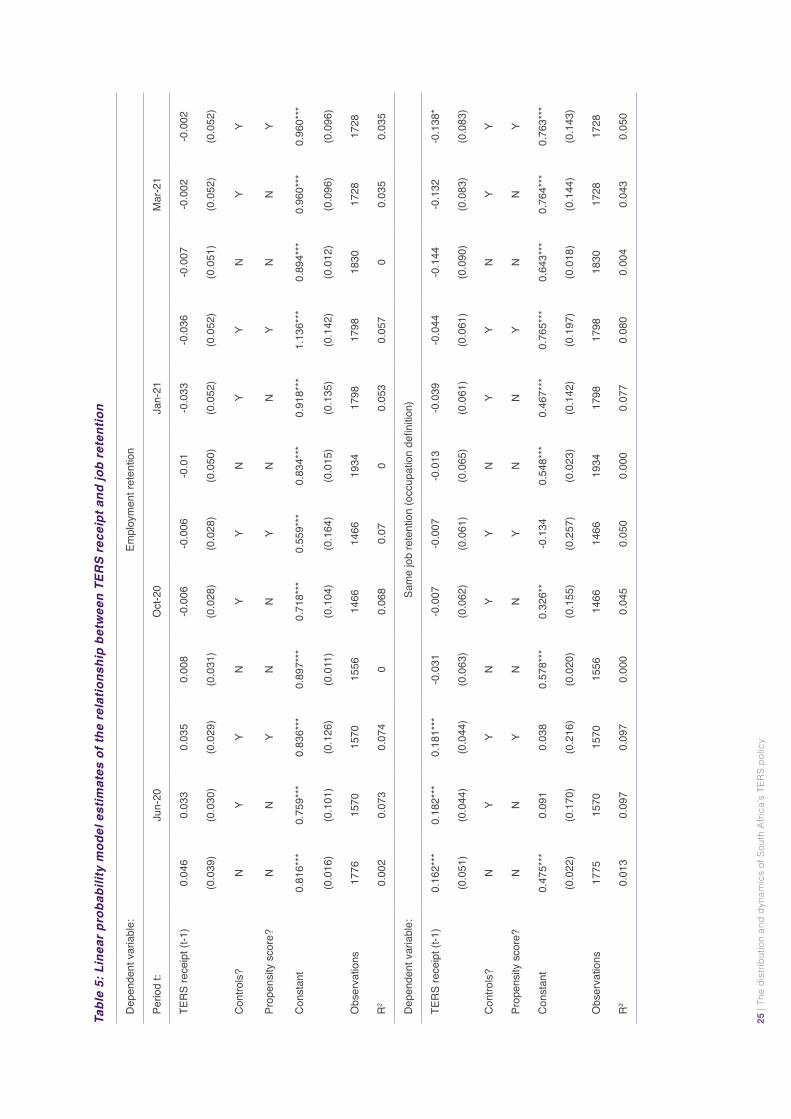
25 |
The
dist
ribut
ion
and
dyna
mic
s of
Sou
th A
frica
’s T
ERS
polic
y
Tabl
e 5:
Lin
ear p
roba
bilit
y m
odel
est
imat
es o
f the
rel
atio
nshi
p be
twee
n TE
RS
rece
ipt a
nd jo
b re
tent
ion
Dep
ende
nt v
aria
ble:
Empl
oym
ent r
eten
tion
Perio
d t:
Jun-
20O
ct-2
0Ja
n-21
Mar
-21
TER
S re
ceip
t (t-1
)0.
046
0.03
30.
035
0.00
8-0
.006
-0.0
06-0
.01
-0.0
33-0
.036
-0.0
07-0
.002
-0.0
02
(0.0
39)
(0.0
30)
(0.0
29)
(0.0
31)
(0.0
28)
(0.0
28)
(0.0
50)
(0.0
52)
(0.0
52)
(0.0
51)
(0.0
52)
(0.0
52)
Con
trols
?N
YY
NY
YN
YY
NY
Y
Prop
ensi
ty s
core
?N
NY
NN
YN
NY
NN
Y
Con
stan
t0.
816*
**0.
759*
**0.
836*
**0.
897*
**0.
718*
**0.
559*
**0.
834*
**0.
918*
**1.
136*
**0.
894*
**0.
960*
**0.
960*
**
(0.0
16)
(0.1
01)
(0.1
26)
(0.0
11)
(0.1
04)
(0.1
64)
(0.0
15)
(0.1
35)
(0.1
42)
(0.0
12)
(0.0
96)
(0.0
96)
Obs
erva
tions
1776
1570
1570
1556
1466
1466
1934
1798
1798
1830
1728
1728
R2
0.00
20.
073
0.07
40
0.06
80.
070
0.05
30.
057
00.
035
0.03
5
Dep
ende
nt v
aria
ble:
Samejobretention(occupationdefinition)
TER
S re
ceip
t (t-1
)0.
162*
**0.
182*
**0.
181*
**-0
.031
-0.0
07-0
.007
-0.0
13-0
.039
-0.0
44-0
.144
-0.1
32-0
.138
*
(0.0
51)
(0.0
44)
(0.0
44)
(0.0
63)
(0.0
62)
(0.0
61)
(0.0
65)
(0.0
61)
(0.0
61)
(0.0
90)
(0.0
83)
(0.0
83)
Con
trols
?N
YY
NY
YN
YY
NY
Y
Prop
ensi
ty s
core
?N
NY
NN
YN
NY
NN
Y
Con
stan
t0.
475*
**0.
091
0.03
80.
578*
**0.
326*
*-0
.134
0.54
8***
0.46
7***
0.76
5***
0.64
3***
0.76
4***
0.76
3***
(0.0
22)
(0.1
70)
(0.2
16)
(0.0
20)
(0.1
55)
(0.2
57)
(0.0
23)
(0.1
42)
(0.1
97)
(0.0
18)
(0.1
44)
(0.1
43)
Obs
erva
tions
1775
1570
1570
1556
1466
1466
1934
1798
1798
1830
1728
1728
R2
0.01
30.
097
0.09
70.
000
0.04
50.
050
0.00
00.
077
0.08
00.
004
0.04
30.
050
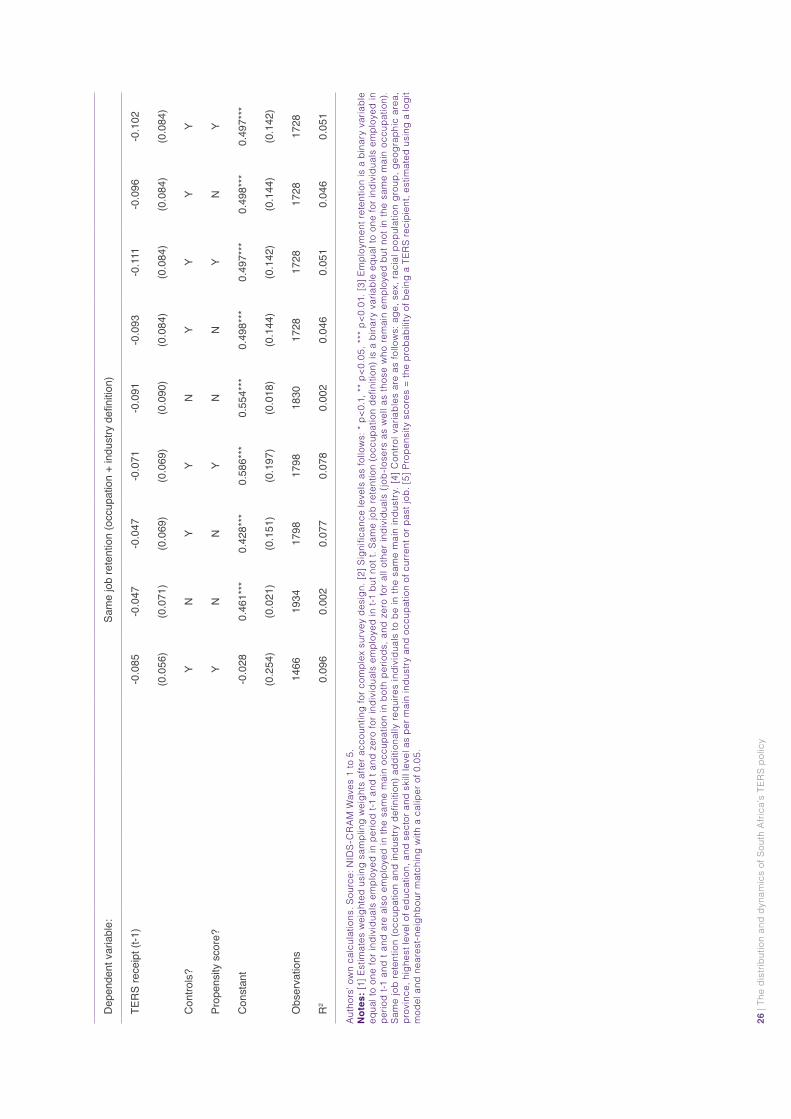
Dep
ende
nt v
aria
ble:
Samejobretention(occupation+industrydefinition)
TER
S re
ceip
t (t-1
)-0
.085
-0.0
47-0
.047
-0.0
71-0
.091
-0.0
93-0
.111
-0.0
96-0
.102
(0.0
56)
(0.0
71)
(0.0
69)
(0.0
69)
(0.0
90)
(0.0
84)
(0.0
84)
(0.0
84)
(0.0
84)
Con
trols
?Y
NY
YN
YY
YY
Prop
ensi
ty s
core
?Y
NN
YN
NY
NY
Con
stan
t-0
.028
0.46
1***
0.42
8***
0.58
6***
0.55
4***
0.49
8***
0.49
7***
0.49
8***
0.49
7***
(0.2
54)
(0.0
21)
(0.1
51)
(0.1
97)
(0.0
18)
(0.1
44)
(0.1
42)
(0.1
44)
(0.1
42)
Obs
erva
tions
1466
1934
1798
1798
1830
1728
1728
1728
1728
R2
0.09
60.
002
0.07
70.
078
0.00
20.
046
0.05
10.
046
0.05
1
Auth
ors’
ow
n ca
lcul
atio
ns. S
ourc
e: N
IDS-
CR
AM
Wav
es 1
to 5
.N
otes
: [1]
Est
imat
es w
eigh
ted
usin
g sa
mpl
ing
wei
ghts
afte
r acc
ount
ing
for c
ompl
ex s
urve
y de
sign
. [2]
Sig
nific
ance
leve
ls a
s fo
llow
s: *
p<0
.1, *
* p<
0.05
, ***
p<0
.01.
[3] E
mpl
oym
ent r
eten
tion
is a
bin
ary
varia
ble
equa
l to
one
for i
ndiv
idua
ls e
mpl
oyed
in p
erio
d t-1
and
t an
d ze
ro fo
r ind
ivid
uals
em
ploy
ed in
t-1
but n
ot t.
Sam
e jo
b re
tent
ion
(occ
upat
ion
defin
ition
) is
a bi
nary
var
iabl
e eq
ual t
o on
e fo
r ind
ivid
uals
em
ploy
ed in
pe
riod
t-1 a
nd t
and
are
also
em
ploy
ed in
the
sam
e m
ain
occu
patio
n in
bot
h pe
riods
, and
zer
o fo
r all
othe
r ind
ivid
uals
(jo
b-lo
sers
as
wel
l as
thos
e w
ho re
mai
n em
ploy
ed b
ut n
ot in
the
sam
e m
ain
occu
patio
n).
Sam
e jo
b re
tent
ion
(occ
upat
ion
and
indu
stry
def
initi
on) a
dditi
onal
ly re
quire
s in
divi
dual
s to
be
in th
e sa
me
mai
n in
dust
ry. [
4] C
ontro
l var
iabl
es a
re a
s fo
llow
s: a
ge, s
ex, r
acia
l pop
ulat
ion
grou
p, g
eogr
aphi
c ar
ea,
prov
ince
, hig
hest
leve
l of e
duca
tion,
and
sec
tor a
nd s
kill
leve
l as
per m
ain
indu
stry
and
occ
upat
ion
of c
urre
nt o
r pas
t job
. [5]
Pro
pens
ity s
core
s =
the
prob
abili
ty o
f bei
ng a
TER
S re
cipi
ent,
estim
ated
usi
ng a
logi
t m
odel
and
nea
rest
-nei
ghbo
ur m
atch
ing
with
a c
alip
er o
f 0.0
5.
26 |
The
dist
ribut
ion
and
dyna
mic
s of
Sou
th A
frica
’s T
ERS
polic
y
27 | The distribution and dynamics of South Africa’s TERS policy
5. Discussion and conclusionJob retention policy – which aims to preserve jobs at firms experiencing a temporary reduction in activity by alleviating labour costs and supporting the incomes of workers – has served as one of the main tools used by governments across the world to mitigate job losses in response to the COVID-19 pandemic, particularly in the form of wage subsidies. In South Africa, the government’s Temporary Employer-Employee Relief Scheme (TERS), introduced in April 2020, served as a core component of the country’s economic policy response benefiting millions of vulnerable workers. In this paper, we have sought to provide a detailed, quantitative, descriptive analysis of TERS receipt over time by making use of representative, longitudinal survey data collected over the course of 2020 and 2021: all fives waves of the NIDS-CRAM.
Several results stand out from our analysis. We find that over 4 million workers received TERS at least once over the period April 2020 to March 2021, with receipt being highest during the most stringent lockdown levels – benefitting 1 in every 7 workers. Using the available data, we approximate that the average recipient received a benefit of nearly R4 100 per month; however, due to the policy’s progressive sliding-scale design, lower-wage workers benefitted significantly more in relative terms, despite higher benefits for higher-wage workers in absolute terms. We document significant heterogeneity in the probability of receiving TERS benefits; namely, workers who are either male, African/Black, reside in urban areas, semi-skilled, work in the tertiary sector, and have a written contract with their employer were most likely to report receipt. Encouragingly, the share of receipt among several vulnerable workers increased over time – particularly African/Black workers and lower-wage workers. An overwhelming majority of TERS recipients (between 81% and 94%) were unable to work from home at all, suggesting that the policy was relatively successful in supporting establishments that were struggling to continue operations during the lockdown. This is in line with our multivariate analysis which highlights, all else equal, statistically significantly higher probabilities of receipt among workers who cannot work from home at all. Many groups – including men, the semi-skilled, those unable to work from home, and those with written contracts – persistently disproportionately benefited from the policy when accounting for their employment shares. Many workers continued to receive TERS benefits throughout 2020 as the economy re-opened, however, the scheme has reached relatively fewer workers during 2021 so far – likely partially attributable to payment backlogs, but additionally to recovering economic activity and changes in the policy’s eligibility criteria.
Considering the policy’s primary aim of minimizing job losses, we find some evidence of a significant, positive relationship between TERS receipt and job retention. Using a multivariate model and matching technique to account for characteristic differences between individual recipients and non-recipients, we estimate that TERS receipt during lockdown level 5 in April 2020 was associated with an 18.1 percentage point increase in the probability of remaining employed in the same job (defined as an individual employed in the same occupation) two months later during lockdown level 3. However, we find no significant relationship for the remainder of the period, even when alternative job retention definitions are used. Although these estimates are not necessarily causal, this suggests that the policy may indeed have succeeded in its primary aim of minimizing job losses, but only when lockdown regulations were most stringent and prior to notable changes in the policy’s eligibility criteria.
The TERS was implemented relatively quickly following the onset of the national lockdown in March 2020 and has provided an important source of income relief for many vulnerable firms and workers in South Africa. However, the policy’s limited extension period and administrative inefficiencies pose a threat to its efficacy. As of 28 June 2021, the economic activity of restaurants, bars, fitness centers, and several other industries has been significantly restricted by the more stringent lockdown levels – in particular, Adjusted Level 4. Policymakers ought to consider extending the availability of the TERS beyond the October 2020 to March 2021 claim period. Going forward, the right balance between ensuring support for temporarily restricted jobs and limiting the degree to which support reaches those that would be preserved anyway needs to be achieved (OECD, 2020). That is, to minimise inclusion error, support needs to be prioritised for sectors whose activity remains
28 | The distribution and dynamics of South Africa’s TERS policy
legally restricted. To achieve this, in the scheme’s second phase from October 2020 to March 2021, the South African government restricted the pool of eligible workers primarily by making use of Standard Industrial Classification (SIC) codes. However, many applicants are denied support due to an incorrect, outdated, or missing SIC code. Workers were unable to change the status of their SIC code and were thereafter directed to an appeals process which itself has been regarded as ineffective and inefficient. Coupled with discrepancies between claim and payment periods and poor communication support channels, policymakers ought to consider that more restrictive eligibility criteria and their accompanying administrative burden may jeopardize the welfare of vulnerable workers by denying or delaying their support, ultimately threatening the recovery of the labour market in general. One alternative may be to allow employers in all sectors access to the policy but, to ensure that support reaches the most vulnerable sectors, vary the benefit by the extent of restriction. Such an approach may simplify access, lower the administrative burden, and reduce exclusion error.
29 | The distribution and dynamics of South Africa’s TERS policy
R E F E R E N C E S
Ardington, C. (2020). NIDS-CRAM Wave 1 Data Quality. NIDS-CRAM Wave 1 Technical Document.
Bassier, I., Budlender, J. and Zizzamia, R. (2021). The labour market impacts of Covid-19 in South Africa: An update with NIDS-CRAM Wave 3. National Income Dynamics Study Coronavirus Rapid Mobile Survey (NIDS-CRAM) Working Paper, Wave 3(2).
Bhorat, H., Köhler, T., Oosthuizen, M., Stanwix, B., Steenkamp, F. and Thornton, A. (2020). The Economics of Covid-19 in South Africa: Early Impressions. Development Policy Research Unit Working Paper 202004, DPRU, University of Cape Town, Cape Town.
Casale, D. and Shepherd, D. (2020a). Gender and the early effects of the COVID-19 crisis in the paid and unpaid economies in South Africa. National Income Dynamics Study Coronavirus Rapid Mobile Survey (NIDS-CRAM) Working Paper, Wave 1(4).
Casale, D. and Shepherd, D. (2020b). The gendered effects of the ongoing lockdown and school closures in South Africa: Evidence from NIDS-CRAM Waves 1 and 2. National Income Dynamics Study Coronavirus Rapid Mobile Survey (NIDS-CRAM) Working Paper, Wave 2(5).
Casale, D. and Shepherd, D. (2021a). The gendered effects of the Covid-19 crisis and ongoing lockdown in South Africa: Evidence from NIDS-CRAM Waves 1-3.. National Income Dynamics Study Coronavirus Rapid Mobile Survey (NIDS-CRAM) Working Paper, Wave 3(4).
Casale, D. and Shepherd, D. (2021b). Gendered employment dynamics during the Covid-19 pandemic – Evidence from four waves of a South African longitudinal survey. National Income Dynamics Study Coronavirus Rapid Mobile Survey (NIDS-CRAM) Working Paper, Wave 4(4).
Gentilini, U., Almenfi, M., Orton, I. and Dale, P. (2021). Social Protection and Jobs Responses to COVID-19: A Real-Time Review of Country Measures. Version 15. World Bank, Washington, DC. World Bank.
Giupponi, G and Landais, C. (2020). Building effective short-time work schemes for the COVID-19 crisis, VoxEU.org, 01 April.
Hill, R. and Köhler, T. (2021). Mind the gap: The distributional effects of South Africa’s national lockdown on gender wage inequality. Development Policy Research Unit Working Paper 202101. DPRU, University of Cape Town.
Ingle, K., Brophy, T. and Daniels, R (2021). NIDS-CRAM Panel user manual. NIDS-CRAM Technical Document C1. Available: https://cramsurvey.org/reports/.
Jain, R., Budlender, J., Zizzamia, R., and Bassier, I. (2020). The labour market and poverty impacts of Covid-19 in South Africa. National Income Dynamics Study Coronavirus Rapid Mobile Survey (NIDS-CRAM) Working Paper, Wave 1(5).
Keenan, E. and Lydon, R. (2020). Wage subsidies and job retention. Central Bank of Ireland Economic Letter, 2020(11).
Köhler, T., Bhorat, H., Hill, R. and Stanwix, B. (2021). COVID-19 and the labour market: Estimating the employment effects of South Africa’s national lockdown. Development Policy Research Unit Working Paper 202107. DPRU, University of Cape Town.
National Income Dynamics Study-Coronavirus Rapid Mobile Survey (NIDS-CRAM) 2020, Wave 1 [dataset]. Version 2.0.0. Cape Town: Allan Gray Orbis Foundation [funding agency]. Cape Town: Southern Africa Labour and Development Research Unit [implementer], 2020. Cape Town: DataFirst [distributor], 2020.
30 | The distribution and dynamics of South Africa’s TERS policy
National Income Dynamics Study-Coronavirus Rapid Mobile Survey (NIDS-CRAM) 2020, Wave 2 [dataset]. Version 2.0.0. Cape Town: Allan Gray Orbis Foundation [funding agency]. Cape Town: Southern Africa Labour and Development Research Unit [implementer], 2020. Cape Town: DataFirst [distributor], 2020.
National Income Dynamics Study-Coronavirus Rapid Mobile Survey (NIDS-CRAM) 2020, Wave 3 [dataset]. Version 2.0.0. Cape Town: Allan Gray Orbis Foundation [funding agency]. Cape Town: Southern Africa Labour and Development Research Unit [implementer], 2020. Cape Town: DataFirst [distributor], 2021.
National Income Dynamics Study-Coronavirus Rapid Mobile Survey (NIDS-CRAM) 2020, Wave 4 [dataset]. Version 2.0.0. Cape Town: Allan Gray Orbis Foundation [funding agency]. Cape Town: Southern Africa Labour and Development Research Unit [implementer], 2020. Cape Town: DataFirst [distributor], 2021.
National Income Dynamics Study-Coronavirus Rapid Mobile Survey (NIDS-CRAM) 2020, Wave 5 [dataset]. Version 1.0.0. Cape Town: Allan Gray Orbis Foundation [funding agency]. Cape Town: Southern Africa Labour and Development Research Unit [implementer], 2020. Cape Town: DataFirst [distributor], 2021.
Organisation for Economic Co-operation and Development (OECD), 2020. Job retention schemes during the COVID-19 lockdown and beyond.
Ramaphosa, C. (2021). President Cyril Ramaphosa: 2021 State of the Nation Address. Government of South Africa.
Ranchhod, V. and Daniels, R.C. (2021). Labour Market Dynamics in South Africa at the Onset of the COVID‐19 Pandemic. South African Journal of Economics, 89(1): pp.44-62.
Statistics South Africa. (2020). Results from Wave 2 survey on the impact of the COVID-19 pandemic on employment and income in South Africa. Report 00-80-03. Available: http://www.statssa.gov.za/?page_id=1854&PPN=Report-00-80-03&SCH=72638
Wittenberg, M. (2017). Wages and wage inequality in South Africa 1994–2011: Part 1–Wage measurement and trends. South African Journal of Economics, 85(2): pp.279-297.

31 | The distribution and dynamics of South Africa’s TERS policy
AppendixFigure A1: Scatterplots of TERS receipt shares and employment shares, by group and wave
18-34
60+
35-59
Urban
Rural
Written
Non-writtenTertiary
Up to primary
Incomplete secondary
Complete secondary
Female
Male
White
African/Black
ColouredAsian/Indian
Tertiary
Primary
Secondary
Semi-skilled
Less-skilled
Cannot WFH
Sometimes WFH
0%
20%
40%
60%
80%
100%
TER
S re
ceip
t sha
re (%
)
0% 20% 40% 60% 80% 100%
Employment share (%)
Wave 2 (receipt in June 2020)
60+
18-34
35-59
rural
Urban
Non-written
Written
Incomplete secondaryTertiary
Up to primary
Complete secondary
Male
Female
African/Black
Coloured
Asian/IndianWhite
Tertiary
Secondary
Primary High-skilled
Less-skilled
Semi-skilled
Cannot WFH
Mostly can WFHSometimes WFH
TER
S re
ceip
t sha
re (%
)
0% 20% 40% 60% 80% 100%
Employment share (%)
Wave 3 (receipt in October 2020)
18-34
35-59
60+
Urban
Rural
Non-written
Written
Complete secondary
Up to primary
Tertiary
Incomplete secondary
Male
Female
Asian/Indian
African/Black
ColouredWhite
Tertiary
Primary
Secondary
Semi-skilled
High-skilled
Less-skilled
Mostly can WFH
Cannot WFH
Sometimes WFH
TER
S re
ceip
t sha
re (%
)
0% 20% 40% 60% 80% 100%
Wave 4 (receipt in January 2021)
Age Area Contract typeEducation Gender RaceSector Skill level Ability to WFH
0%
20%
40%
60%
80%
100%
0%
20%
40%
60%
80%
100%
Mostly can WFH
High-skilled
Employment share (%)
Authors’ own calculations. Source: NIDS-CRAM Waves 2 to 4.Note: [1] Estimates weighted using sampling weights after accounting for complex survey design. Variances have been scaled to account for strata with single observations. [2] Working from home data only available from Wave 2 onwards. Relevant question phrased as: “Are you able to work from home? If yes, some or most of the time?” [3] Skill level of individuals defined according to 1-digit occupation code: Managers and professionals classified as high-skilled; technicians, clerical staff, service and sales workers, skilled agricultural workers, craft and machine operators, and plant and machine operators classified as semi-skilled; and elementary occupations classified as less-skilled. [4] Sector defined according to 1-digit SIC code classification: Agriculture, hunting, fishing, mining and quarrying classified as primary; manufacturing, electricity and gas and construction classified as secondary; remainder classified as tertiary.

32 | The distribution and dynamics of South Africa’s TERS policy
Table A1: Linear probability model estimates of the correlates of TERS receipt, by wave
Wave 1 Wave 2 Wave 3 Wave 4 Wave 5
35-59 -0.001 -0.020 0.018 0.004 0.006
(0.038) (0.029) (0.020) (0.022) (0.019)
60+ -0.024 0.028 0.032 -0.031 -0.050**
(0.079) (0.098) (0.062) (0.022) (0.023)
Female 0.018 -0.019 -0.030 -0.018 -0.005
(0.030) (0.027) (0.027) (0.015) (0.014)
Married 0.001 -0.019 -0.031 0.017 -0.014
(0.033) (0.028) (0.026) (0.021) (0.020)
Coloured 0.004 0.064* 0.023 -0.007 -0.044*
(0.048) (0.036) (0.049) (0.022) (0.024)
Asian/Indian 0.012 0.254** -0.017 0.180 -0.013
(0.123) (0.124) (0.047) (0.152) (0.036)
White 0.059 0.129*** 0.024 -0.015 -0.009
(0.056) (0.049) (0.042) (0.019) (0.024)
Urban 0.051 0.018 0.020 -0.007 0.011
(0.049) (0.035) (0.026) (0.019) (0.021)
Up to Secondary -0.008 -0.029 -0.018 0.031 -0.107**
(0.047) (0.067) (0.041) (0.027) (0.051)
Matric 0.053 -0.129* 0.029 -0.012 -0.094*
(0.056) (0.068) (0.050) (0.028) (0.054)
Tertiary 0.002 -0.116* 0.023 0.019 -0.111**
(0.063) (0.070) (0.046) (0.025) (0.055)
Has written contract 0.080** 0.067* 0.083*** 0.005 0.039**
(0.033) (0.034) (0.031) (0.027) (0.019)
Semi-skilled 0.089** 0.034 0.059* 0.023 0.047***
(0.040) (0.035) (0.032) (0.019) (0.014)
Less-skilled 0.106* 0.011 0.121*** 0.068** 0.014
(0.055) (0.044) (0.043) (0.032) (0.019)
Secondary sector 0.022 0.124** -0.033 0.076*** 0.049*
(0.067) (0.048) (0.049) (0.029) (0.026)
Tertiary sector -0.088 0.015 -0.043 0.024 0.036*
(0.057) (0.040) (0.045) (0.017) (0.020)

33 | The distribution and dynamics of South Africa’s TERS policy
Weekly working hours -0.001* 0.000 -0.002*** 0.001 -0.000
(0.001) (0.001) (0.001) (0.001) (0.000)
Casual work -0.030 -0.047 0.017 -0.019 -0.019
(0.040) (0.032) (0.025) (0.018) (0.017)
Social grant recipient 0.007 0.144*** 0.002 0.008 0.017
(0.059) (0.045) (0.027) (0.022) (0.019)
Eastern Cape 0.042 0.044 -0.002 -0.017 -0.012
(0.058) (0.057) (0.057) (0.026) (0.029)
Northern Cape -0.088* 0.050 -0.021 -0.016 -0.010
(0.045) (0.051) (0.063) (0.023) (0.038)
Free State -0.072 0.017 -0.015 -0.010 -0.049
(0.070) (0.054) (0.058) (0.026) (0.033)
KwaZulu-Natal -0.038 0.026 -0.064 -0.003 -0.014
(0.055) (0.048) (0.055) (0.024) (0.035)
North West 0.143 0.144** -0.005 -0.041 -0.060**
(0.094) (0.070) (0.068) (0.026) (0.030)
Gauteng -0.020 0.064 -0.008 0.044* -0.011
(0.051) (0.039) (0.047) (0.024) (0.027)
Mpumalanga -0.083 0.005 -0.085* -0.017 -0.035
(0.058) (0.045) (0.048) (0.023) (0.036)
Limpopo 0.037 0.095 0.006 0.004 -0.016
(0.085) (0.058) (0.062) (0.030) (0.039)
Can WFH some of the time . 0.112** 0.037 0.010 0.015
. (0.056) (0.036) (0.015) (0.015)
Cannot WFH . 0.120*** 0.071*** 0.026* 0.041***
. (0.031) (0.023) (0.014) (0.012)
Constant 0.054 -0.071 0.027 -0.098* 0.066
(0.095) (0.109) (0.090) (0.053) (0.061)
Observations 1190 1390 1743 1567 1857
R2 0.075 0.110 0.056 0.073 0.049
Authors’ own calculations. Source: NIDS-CRAM Waves 1 to 5.Notes: [1] Estimates weighted using sampling weights after accounting for complex survey design. [2] Significance levels as follows: * p<0.1, ** p<0.05, *** p<0.01. [3] Work-from-home (WFH) data not available for Wave 1 (April 2020). [4] Reference groups for categorical variables as follows: 18-34 years, African/Black, highest level of education = up to primary, high-skilled as per the main current or past occupation, primary sector, can work-from-home all the time, type of employment = regular work, Western Cape.

34 | The distribution and dynamics of South Africa’s TERS policy
Figure A2: Histogram of estimated propensity scores, by TERS receipt status and wave
0 .1 .2 .3 .4
Propensity Score
Wave 1
0 .1 .2 .3
Propensity Score
Wave 2
0 .1 .2 .3 .4
Propensity Score
Wave 3
0 .1 .2 .3
Propensity Score
Wave 4
TERS non-receipt TERS receipt
Authors’ own calculations. Source: NIDS-CRAM Waves 1 to 4.Notes: [1] Propensity scores (the probability of being a TERS recipient conditional on employment) estimated using a logit model and nearest-neighbour matching with a caliper of 0.05, using the following observable variables: age, sex, racial population group, geographic area, province, highest level of education, and sector and skill level as per main industry and occupation.
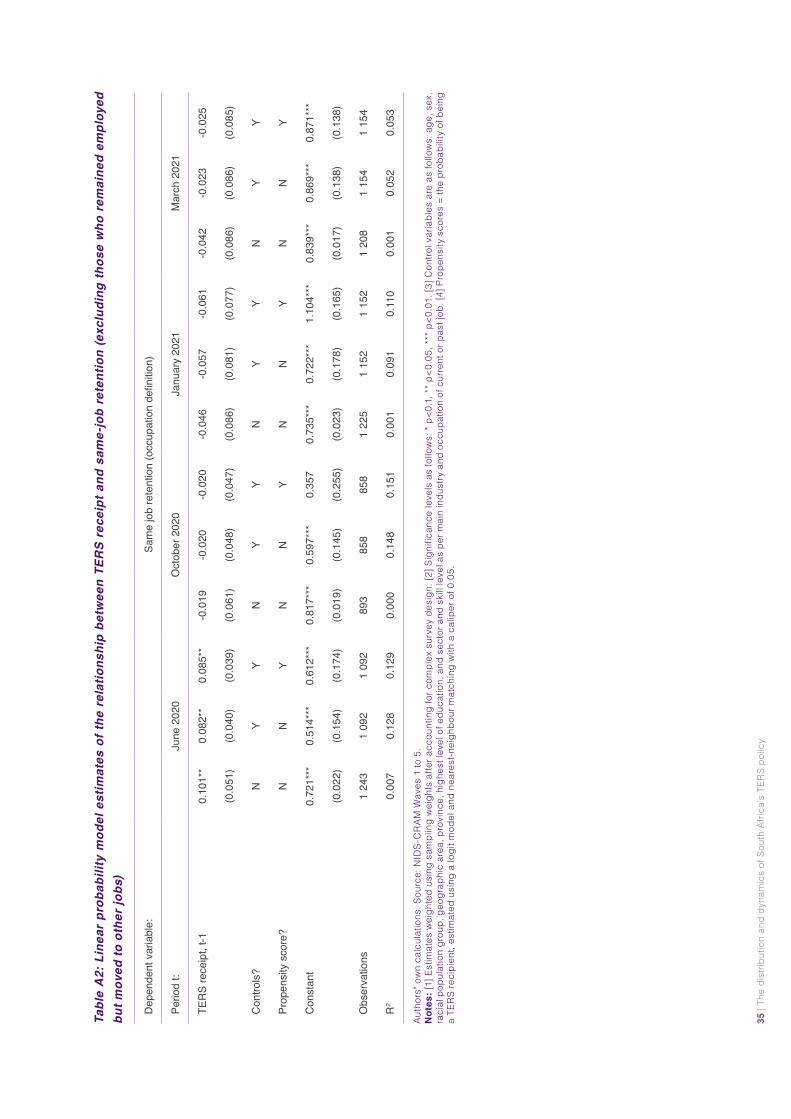
Tabl
e A
2: L
inea
r pr
obab
ility
mod
el e
stim
ates
of t
he r
elat
ions
hip
betw
een
TER
S re
ceip
t and
sam
e-jo
b re
tent
ion
(exc
ludi
ng th
ose
who
rem
aine
d em
ploy
ed
but m
oved
to o
ther
jobs
)
Dep
ende
nt v
aria
ble:
Samejobretention(occupationdefinition)
Perio
d t:
June
202
0O
ctob
er 2
020
Janu
ary
2021
Mar
ch 2
021
TER
S re
ceip
t, t-1
0.10
1**
0.08
2**
0.08
5**
-0.0
19-0
.020
-0.0
20-0
.046
-0.0
57-0
.061
-0.0
42-0
.023
-0.0
25
(0.0
51)
(0.0
40)
(0.0
39)
(0.0
61)
(0.0
48)
(0.0
47)
(0.0
86)
(0.0
81)
(0.0
77)
(0.0
86)
(0.0
86)
(0.0
85)
Con
trols
?N
YY
NY
YN
YY
NY
Y
Prop
ensi
ty s
core
?N
NY
NN
YN
NY
NN
Y
Con
stan
t0.
721*
**0.
514*
**0.
612*
**0.
817*
**0.
597*
**0.
357
0.73
5***
0.72
2***
1.10
4***
0.83
9***
0.86
9***
0.87
1***
(0.0
22)
(0.1
54)
(0.1
74)
(0.0
19)
(0.1
45)
(0.2
55)
(0.0
23)
(0.1
78)
(0.1
65)
(0.0
17)
(0.1
38)
(0.1
38)
Obs
erva
tions
1 24
31
092
1 09
289
385
885
81
225
1 15
21
152
1 20
81
154
1 15
4
R2
0.00
70.
128
0.12
90.
000
0.14
80.
151
0.00
10.
091
0.11
00.
001
0.05
20.
053
Auth
ors’
ow
n ca
lcul
atio
ns. S
ourc
e: N
IDS-
CR
AM
Wav
es 1
to 5
.N
otes
: [1]
Est
imat
es w
eigh
ted
usin
g sa
mpl
ing
wei
ghts
afte
r acc
ount
ing
for c
ompl
ex s
urve
y de
sign
. [2]
Sig
nific
ance
leve
ls a
s fo
llow
s: *
p<0.
1, *
* p<0
.05,
***
p<0
.01.
[3] C
ontro
l var
iabl
es a
re a
s fo
llow
s: a
ge, s
ex,
raci
al p
opul
atio
n gr
oup,
geo
grap
hic
area
, pro
vinc
e, h
ighe
st le
vel o
f edu
catio
n, a
nd s
ecto
r and
ski
ll le
vel a
s pe
r mai
n in
dust
ry a
nd o
ccup
atio
n of
cur
rent
or p
ast j
ob. [
4] P
rope
nsity
sco
res
= th
e pr
obab
ility
of b
eing
a
TER
S re
cipi
ent,
estim
ated
usi
ng a
logi
t mod
el a
nd n
eare
st-n
eigh
bour
mat
chin
g w
ith a
cal
iper
of 0
.05.
35 |
The
dist
ribut
ion
and
dyna
mic
s of
Sou
th A
frica
’s T
ERS
polic
y

For further information please see cramsurvey.org and nids.uct.ac.za
Copyright © 2022 FDOKUMEN