Dominance and the dynamics of phenotype-limited distribution in common cranes
8
Juan Carlos Alonso Æ Luis M. Bautista Æ Javier A. Alonso Dominance and the dynamics of phenotype-limited distribution in common cranes Received: 16 December 1996 / Accepted after revision: 22 February 1997 Abstract We studied the behavior of 13 radiotagged cranes dispersing from a communal roost over days when they changed their main daily foraging area be- tween consecutive days during two winter seasons. In- dividuals went to a new foraging zone when on the previous day their morning food intake had fallen below their mean morning food intake measured over the whole winter. Food intake on the day before a change in foraging area was positively correlated with dominance rank. Dominant cranes changed to new zones with higher numbers of birds and food density, while subor- dinate cranes went to new zones with lower numbers of birds. As a result, all birds increased their food intake over that of the previous day. Dominant cranes re- mained more faithful to their most preferred foraging zone, where they spent 69% of the mornings, while subordinate birds were more mobile, switching among zones frequently. Dominant birds left the roost later than subordinate birds on the days they changed to a new zone, which could be used to track the main de- parting flows. The results suggest that the dynamics that led to a truncated phenotype-limited distribution were determined by social dominance and food abundance, with dominant cranes shifting to a new zone to maintain their high intake levels and subordinates changing more frequently whenever their daily intake did not reach the minimum metabolic requirements. Key words Foraging Æ Dominance Æ Grus grus Æ Information center Æ Unequal competitors Introduction Parker and Sutherland (1986) developed a series of phenotype-limited ideal free models to explain the dis- tribution of animals among food patches when individ- uals dier in competitive ability. They showed that when there was interference among unequal competitors while foraging the predicted result was a truncated distribu- tion of phenotypes between patches so that the indi- viduals with the highest competitive abilities occurred in the best patches. The results of some field studies agreed with the predictions of these interference models, par- ticularly the study of Monaghan (1980) on herring gulls Larus argentatus feeding at two areas of a refuse tip, that of Goss-Custard et al. (1984) on oystercatchers Hae- matopus ostralegus feeding at two mussel Mytilus edulis beds, that of Milinski et al. (1995) on swans Cygnus olor feeding at two patches with dierent food densities, and a study on cranes Grus grus feeding on cereal fields of various qualities during winter (Bautista et al. 1995). In spite of the general agreement of the results of these studies with the phenotype-limited interference model, in all of them the distribution of phenotypes was imper- fectly truncated, i.e., the poorest zones were used occa- sionally by some dominant phenotypes and the richest zones were used by some subordinate phenotypes. Par- ker and Sutherland (1986) acknowledged that perfect truncation is probably never found in the real world for several reasons, such as imperfect knowledge of the habitat by some naive individuals who tend to disrupt the distribution, temporal changes in relative qualities of feeding patches, heterogeneous food distribution within patches, and kleptoparasitism leading to continuous switching of phenotypes between patches (see also Mil- inski and Parker 1991). Perfect truncation is unlikely to be obtained even in laboratory experiments, because animal distributions are state-dependent (McNamara and Houston 1990). In a previous paper (Bautista et al. 1995) we pre- sented results that indeed fulfilled the main predictions Behav Ecol Sociobiol (1997) 40: 401 – 408 Ó Springer-Verlag 1997 J.C. Alonso (&) Æ L.M. Bautista Departamento de Ecologı´a Evolutiva, Museo Nacional de Ciencias Naturales CSIC, Jose´ Gutie´rrez Abascal 2, E-28006 Madrid, Spain Tel.: 34-1-4111328; Fax: 34-1-5645078; e-mail: [email protected] J.A. Alonso Departamento de Biologı´a Animal, Facultad de Biologı´a, Universidad Complutense, E-28040 Madrid, Spain
-
Upload
independent -
Category
Documents
-
view
0 -
download
0
Transcript of Dominance and the dynamics of phenotype-limited distribution in common cranes

Juan Carlos Alonso áLuis M. Bautista á Javier A. Alonso
Dominance and the dynamics of phenotype-limited distributionin common cranes
Received: 16 December 1996 /Accepted after revision: 22 February 1997
Abstract We studied the behavior of 13 radiotaggedcranes dispersing from a communal roost over dayswhen they changed their main daily foraging area be-tween consecutive days during two winter seasons. In-dividuals went to a new foraging zone when on theprevious day their morning food intake had fallen belowtheir mean morning food intake measured over thewhole winter. Food intake on the day before a change inforaging area was positively correlated with dominancerank. Dominant cranes changed to new zones withhigher numbers of birds and food density, while subor-dinate cranes went to new zones with lower numbers ofbirds. As a result, all birds increased their food intakeover that of the previous day. Dominant cranes re-mained more faithful to their most preferred foragingzone, where they spent 69% of the mornings, whilesubordinate birds were more mobile, switching amongzones frequently. Dominant birds left the roost laterthan subordinate birds on the days they changed to anew zone, which could be used to track the main de-parting ¯ows. The results suggest that the dynamics thatled to a truncated phenotype-limited distribution weredetermined by social dominance and food abundance,with dominant cranes shifting to a new zone to maintaintheir high intake levels and subordinates changing morefrequently whenever their daily intake did not reach theminimum metabolic requirements.
Key words Foraging áDominance áGrus grus áInformation center áUnequal competitors
Introduction
Parker and Sutherland (1986) developed a series ofphenotype-limited ideal free models to explain the dis-tribution of animals among food patches when individ-uals di�er in competitive ability. They showed that whenthere was interference among unequal competitors whileforaging the predicted result was a truncated distribu-tion of phenotypes between patches so that the indi-viduals with the highest competitive abilities occurred inthe best patches. The results of some ®eld studies agreedwith the predictions of these interference models, par-ticularly the study of Monaghan (1980) on herring gullsLarus argentatus feeding at two areas of a refuse tip, thatof Goss-Custard et al. (1984) on oystercatchers Hae-matopus ostralegus feeding at two mussel Mytilus edulisbeds, that of Milinski et al. (1995) on swans Cygnus olorfeeding at two patches with di�erent food densities, anda study on cranes Grus grus feeding on cereal ®elds ofvarious qualities during winter (Bautista et al. 1995). Inspite of the general agreement of the results of thesestudies with the phenotype-limited interference model, inall of them the distribution of phenotypes was imper-fectly truncated, i.e., the poorest zones were used occa-sionally by some dominant phenotypes and the richestzones were used by some subordinate phenotypes. Par-ker and Sutherland (1986) acknowledged that perfecttruncation is probably never found in the real world forseveral reasons, such as imperfect knowledge of thehabitat by some naive individuals who tend to disruptthe distribution, temporal changes in relative qualities offeeding patches, heterogeneous food distribution withinpatches, and kleptoparasitism leading to continuousswitching of phenotypes between patches (see also Mil-inski and Parker 1991). Perfect truncation is unlikely tobe obtained even in laboratory experiments, becauseanimal distributions are state-dependent (McNamaraand Houston 1990).
In a previous paper (Bautista et al. 1995) we pre-sented results that indeed ful®lled the main predictions
Behav Ecol Sociobiol (1997) 40: 401 ± 408 Ó Springer-Verlag 1997
J.C. Alonso (&) áL.M. BautistaDepartamento de Ecologõ a Evolutiva,Museo Nacional de Ciencias Naturales CSIC,Jose Gutie rrez Abascal 2, E-28006 Madrid, SpainTel.: 34-1-4111328; Fax: 34-1-5645078;e-mail: [email protected]
J.A. AlonsoDepartamento de BiologõÂ a Animal, Facultad de BiologõÂ a,Universidad Complutense, E-28040 Madrid, Spain

of the interference phenotype-limited model: (a) therewas a correlation between the dominance rank of thecranes and the mean quality of the foraging zone se-lected among ten possible zones in the study area, and(b) the mean payo� to an individual correlated withboth foraging zone quality and dominance rank. How-ever, as stated above, the distribution of crane pheno-types among zones was not perfectly truncated. While allzones were occupied by variable numbers of cranesthroughout the period of study, each individual foragedon more than one of the ten zones de®ned, usuallychanging to a new zone after a few days spent foragingon the previous zone. These shifts in foraging zones byindividual cranes meant that the truncated distributionwas not completely stable, although it appeared to be sowhen we compared individual competitive abilities withthe average values of both zone qualities and payo�s ofthe various foraging zones used by each individual.Rather, the system studied could be better described as adynamic equilibrium distribution resulting from thesechanges of individuals between foraging zones. To un-ravel the rules governing such changes in foraging area itis necessary to look at the process of change itself, i.e., atthe immediate advantage of a shift in area betweenconsecutive days, instead of comparing average values atthe di�erent foraging zones.
In this paper we study the dynamics of this truncateddistribution in cranes. In particular, we measure thedi�erences in food density, crane numbers, and morningfood intake on each pair of consecutive days over whicha change of foraging zone occurred. An individualprobably decides to change to a new foraging area whenits food intake rate has decreased to some critical value(Stephens and Krebs 1986). This marginal food intakecould be equal for all individuals as predicted by theclassical marginal value theorem (Charnov 1976).Sutherland and Parker (1985) and Parker and Suther-land (1986) suggested that phenotype di�erences in¯u-ence the distribution of individuals among di�erentquality patches. We test an alternative prediction to theconstant giving-up intake rate, namely that di�erentphenotypes would decide to abandon a zone at di�erentintake rates. We also test the prediction derived fromsome studies of truncated phenotype distributions thatsubordinate birds should be more mobile between for-aging zones (Monaghan 1980, p. 524; Ens and Goss-Custard 1984, p. 226; Draulans and Van Vessem 1985,p. 774; reviewed in Sutherland and Parker 1985; Parkerand Sutherland 1986). Finally, a possible mechanismthat foragers could use to maximize intake when theyhave been unsuccessful on a given day and are going tochange foraging zone could be either (a) to leave theroost early to prolong their daily feeding time (e.g.,Summers and Feare 1995) or (b) to leave the roost late inorder to be able to follow preferred departing ¯ows anddirections, in accordance with the information centerhypothesis (Ward and Zahavi 1973). Wintering cranesdepart from a communal roost in continuous ¯ows thatcan be easily tracked by other roost members that have
not yet departed. Thus, an individual that has beenunsuccessful the previous day could delay its departureand so evaluate where most roost members are goingand choose its own departing route.
Methods
Study area and species
The study area was a lake basin of 53 637 ha, at Gallocanta,northeast Spain (40°580N, 1°300W), which is regularly used bycommon cranes as a staging and wintering area (Bautista et al.1992). The study was carried out from December to late February1989±1990 and 1990±1991. Cranes disperse daily from a communalroost in the lake to forage on the surrounding ®elds, most of whichare sown with winter wheat and barley, and a few with sun¯ower.A detailed description of the study area and its use by the cranes asa foraging area during winter is given in Alonso et al. (1994) andBautista et al. (1995).
Food availability and number of cranes
We divided the study area into ten zones approximately equivalentin the size of their respective surfaces that could be utilized asfeeding grounds. Every 2 weeks we estimated food availability by a76-km car transect throughout the study area, recording the type ofground at both sides of the route: cereal stubbles, sun¯ower stub-bles, ploughed ®elds, recently sown cereal ®elds, sprouted cereal®elds, pastures, and others. We estimated the total surface occupiedby each type of ground from frequency values obtained from thetransect. We also sampled the density of seeds on stubble ®eldseach fortnight, counting all seeds in 20 randomly selected quadrats,by throwing a square metal frame, measuring 25 ´ 25 cm on cerealstubbles and 50 ´ 50 cm on sun¯ower stubbles, while walking in astraight line along a diagonal across each ®eld. We calculatedoverall food abundance for each zone of the study site, multiplyingthe total area occupied by each type of ground by the mean densityof seeds lying on the surface in the case of stubble ®elds, and by 5%of the average amount of cereal in sown ®elds (180 kg ha)1; seeAlonso et al. 1994 for a detailed explanation of the procedures usedto estimate food availability).
Each fortnight we also established the distribution of cranes inthe study area, averaging the numbers of birds seen on each for-aging zone during weekly surveys of the whole area, completedwith additional information gathered during daily individual ra-diotracking (see below) and fortnightly counts of all cranes enteringthe roost at evening, from three or four observation points aroundthe lake so that we also knew the arrival directions and ¯ows.
Behavior of marked individuals
Between late December and early February we studied the behaviorof 13 individuals ®tted with color rings and radiotransmitters [5 in1989±1990 and 8 in 1990±1991; 9 were adults, 2 immatures, i.e.,2nd- or 3rd-year birds, according to their iris color and pattern ofwing feather moult (Glutz et al. 1973; Prange 1989) and two 1st-year birds already independent from their parents]. Since no in-terannual di�erences in the behavioral variables of the individualsstudied (see their de®nition below) were signi®cant (P > 0.05,Kruskall-Wallis test), and the patterns of general crane and fooddistribution in the study area were quite similar in both years (seeBautista et al. 1995), we pooled data from both years for analysis.The total number of radiotracking days was 137, with samples foreach individual ranging between 3 and 17 days, usually recorded ingroups of 3±4 consecutive days. Cranes departed from the com-munal roost daily between 0628 and 0715 hours GMT. Each daywe recorded the time when the ®rst crane, whether radiotagged or
402
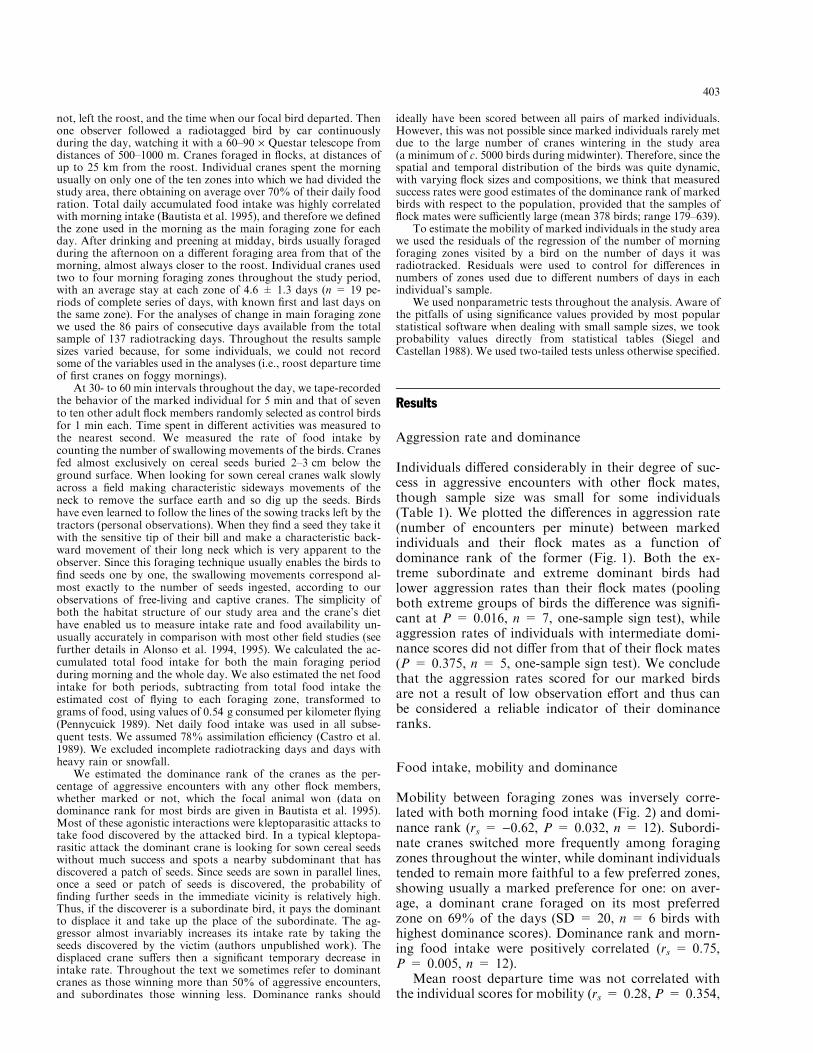
not, left the roost, and the time when our focal bird departed. Thenone observer followed a radiotagged bird by car continuouslyduring the day, watching it with a 60±90 ´ Questar telescope fromdistances of 500±1000 m. Cranes foraged in ¯ocks, at distances ofup to 25 km from the roost. Individual cranes spent the morningusually on only one of the ten zones into which we had divided thestudy area, there obtaining on average over 70% of their daily foodration. Total daily accumulated food intake was highly correlatedwith morning intake (Bautista et al. 1995), and therefore we de®nedthe zone used in the morning as the main foraging zone for eachday. After drinking and preening at midday, birds usually foragedduring the afternoon on a di�erent foraging area from that of themorning, almost always closer to the roost. Individual cranes usedtwo to four morning foraging zones throughout the study period,with an average stay at each zone of 4.6 � 1.3 days (n = 19 pe-riods of complete series of days, with known ®rst and last days onthe same zone). For the analyses of change in main foraging zonewe used the 86 pairs of consecutive days available from the totalsample of 137 radiotracking days. Throughout the results samplesizes varied because, for some individuals, we could not recordsome of the variables used in the analyses (i.e., roost departure timeof ®rst cranes on foggy mornings).
At 30- to 60 min intervals throughout the day, we tape-recordedthe behavior of the marked individual for 5 min and that of sevento ten other adult ¯ock members randomly selected as control birdsfor 1 min each. Time spent in di�erent activities was measured tothe nearest second. We measured the rate of food intake bycounting the number of swallowing movements of the birds. Cranesfed almost exclusively on cereal seeds buried 2±3 cm below theground surface. When looking for sown cereal cranes walk slowlyacross a ®eld making characteristic sideways movements of theneck to remove the surface earth and so dig up the seeds. Birdshave even learned to follow the lines of the sowing tracks left by thetractors (personal observations). When they ®nd a seed they take itwith the sensitive tip of their bill and make a characteristic back-ward movement of their long neck which is very apparent to theobserver. Since this foraging technique usually enables the birds to®nd seeds one by one, the swallowing movements correspond al-most exactly to the number of seeds ingested, according to ourobservations of free-living and captive cranes. The simplicity ofboth the habitat structure of our study area and the crane's diethave enabled us to measure intake rate and food availability un-usually accurately in comparison with most other ®eld studies (seefurther details in Alonso et al. 1994, 1995). We calculated the ac-cumulated total food intake for both the main foraging periodduring morning and the whole day. We also estimated the net foodintake for both periods, subtracting from total food intake theestimated cost of ¯ying to each foraging zone, transformed tograms of food, using values of 0.54 g consumed per kilometer ¯ying(Pennycuick 1989). Net daily food intake was used in all subse-quent tests. We assumed 78% assimilation e�ciency (Castro et al.1989). We excluded incomplete radiotracking days and days withheavy rain or snowfall.
We estimated the dominance rank of the cranes as the per-centage of aggressive encounters with any other ¯ock members,whether marked or not, which the focal animal won (data ondominance rank for most birds are given in Bautista et al. 1995).Most of these agonistic interactions were kleptoparasitic attacks totake food discovered by the attacked bird. In a typical kleptopa-rasitic attack the dominant crane is looking for sown cereal seedswithout much success and spots a nearby subdominant that hasdiscovered a patch of seeds. Since seeds are sown in parallel lines,once a seed or patch of seeds is discovered, the probability of®nding further seeds in the immediate vicinity is relatively high.Thus, if the discoverer is a subordinate bird, it pays the dominantto displace it and take up the place of the subordinate. The ag-gressor almost invariably increases its intake rate by taking theseeds discovered by the victim (authors unpublished work). Thedisplaced crane su�ers then a signi®cant temporary decrease inintake rate. Throughout the text we sometimes refer to dominantcranes as those winning more than 50% of aggressive encounters,and subordinates those winning less. Dominance ranks should
ideally have been scored between all pairs of marked individuals.However, this was not possible since marked individuals rarely metdue to the large number of cranes wintering in the study area(a minimum of c. 5000 birds during midwinter). Therefore, since thespatial and temporal distribution of the birds was quite dynamic,with varying ¯ock sizes and compositions, we think that measuredsuccess rates were good estimates of the dominance rank of markedbirds with respect to the population, provided that the samples of¯ock mates were su�ciently large (mean 378 birds; range 179±639).
To estimate the mobility of marked individuals in the study areawe used the residuals of the regression of the number of morningforaging zones visited by a bird on the number of days it wasradiotracked. Residuals were used to control for di�erences innumbers of zones used due to di�erent numbers of days in eachindividual's sample.
We used nonparametric tests throughout the analysis. Aware ofthe pitfalls of using signi®cance values provided by most popularstatistical software when dealing with small sample sizes, we tookprobability values directly from statistical tables (Siegel andCastellan 1988). We used two-tailed tests unless otherwise speci®ed.
Results
Aggression rate and dominance
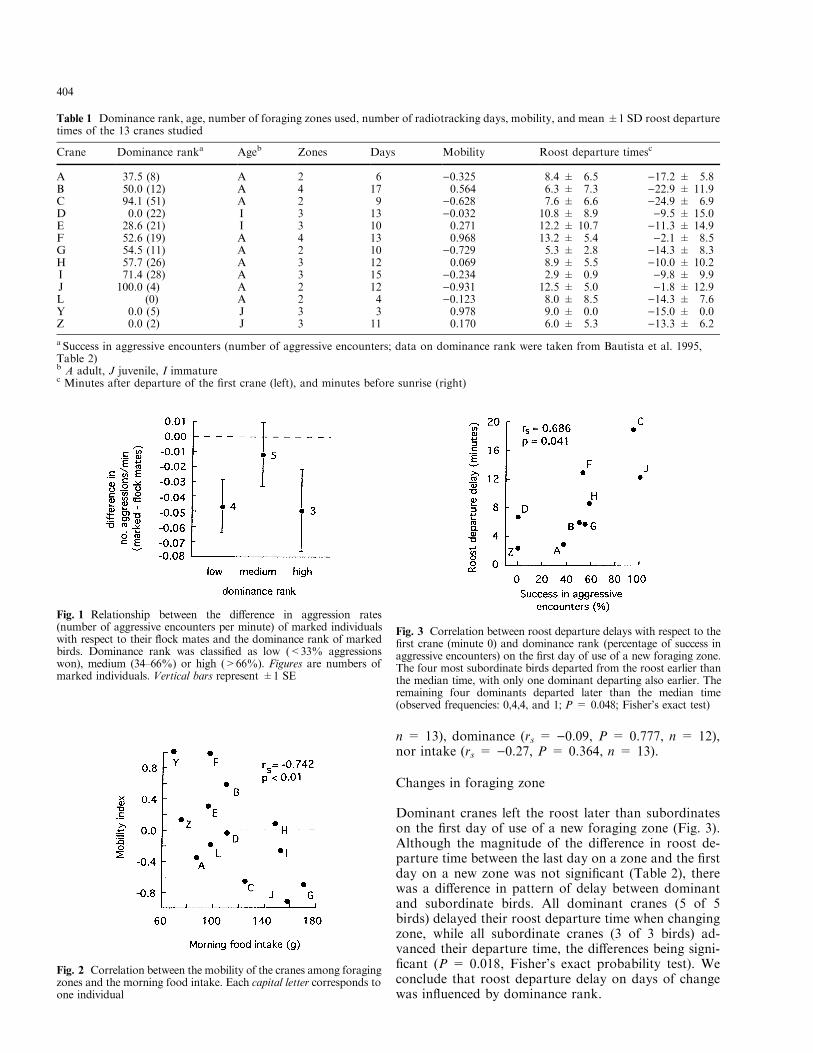
Individuals di�ered considerably in their degree of suc-cess in aggressive encounters with other ¯ock mates,though sample size was small for some individuals(Table 1). We plotted the di�erences in aggression rate(number of encounters per minute) between markedindividuals and their ¯ock mates as a function ofdominance rank of the former (Fig. 1). Both the ex-treme subordinate and extreme dominant birds hadlower aggression rates than their ¯ock mates (poolingboth extreme groups of birds the di�erence was signi®-cant at P = 0.016, n = 7, one-sample sign test), whileaggression rates of individuals with intermediate domi-nance scores did not di�er from that of their ¯ock mates(P = 0.375, n = 5, one-sample sign test). We concludethat the aggression rates scored for our marked birdsare not a result of low observation e�ort and thus canbe considered a reliable indicator of their dominanceranks.
Food intake, mobility and dominance
Mobility between foraging zones was inversely corre-lated with both morning food intake (Fig. 2) and domi-nance rank (rs = )0.62, P = 0.032, n = 12). Subordi-nate cranes switched more frequently among foragingzones throughout the winter, while dominant individualstended to remain more faithful to a few preferred zones,showing usually a marked preference for one: on aver-age, a dominant crane foraged on its most preferredzone on 69% of the days (SD = 20, n = 6 birds withhighest dominance scores). Dominance rank and morn-ing food intake were positively correlated (rs = 0.75,P = 0.005, n = 12).
Mean roost departure time was not correlated withthe individual scores for mobility (rs = 0.28, P = 0.354,
403
n = 13), dominance (rs = )0.09, P = 0.777, n = 12),nor intake (rs = )0.27, P = 0.364, n = 13).
Changes in foraging zone
Dominant cranes left the roost later than subordinateson the ®rst day of use of a new foraging zone (Fig. 3).Although the magnitude of the di�erence in roost de-parture time between the last day on a zone and the ®rstday on a new zone was not signi®cant (Table 2), therewas a di�erence in pattern of delay between dominantand subordinate birds. All dominant cranes (5 of 5birds) delayed their roost departure time when changingzone, while all subordinate cranes (3 of 3 birds) ad-vanced their departure time, the di�erences being signi-®cant (P = 0.018, Fisher's exact probability test). Weconclude that roost departure delay on days of changewas in¯uenced by dominance rank.
Table 1 Dominance rank, age, number of foraging zones used, number of radiotracking days, mobility, and mean �1 SD roost departuretimes of the 13 cranes studied
Crane Dominance ranka Ageb Zones Days Mobility Roost departure timesc
A 37.5 (8) A 2 6 )0.325 8.4 � 6.5 )17.2 � 5.8B 50.0 (12) A 4 17 0.564 6.3 � 7.3 )22.9 � 11.9C 94.1 (51) A 2 9 )0.628 7.6 � 6.6 )24.9 � 6.9D 0.0 (22) I 3 13 )0.032 10.8 � 8.9 )9.5 � 15.0E 28.6 (21) I 3 10 0.271 12.2 � 10.7 )11.3 � 14.9F 52.6 (19) A 4 13 0.968 13.2 � 5.4 )2.1 � 8.5G 54.5 (11) A 2 10 )0.729 5.3 � 2.8 )14.3 � 8.3H 57.7 (26) A 3 12 0.069 8.9 � 5.5 )10.0 � 10.2I 71.4 (28) A 3 15 )0.234 2.9 � 0.9 )9.8 � 9.9J 100.0 (4) A 2 12 )0.931 12.5 � 5.0 )1.8 � 12.9L (0) A 2 4 )0.123 8.0 � 8.5 )14.3 � 7.6Y 0.0 (5) J 3 3 0.978 9.0 � 0.0 )15.0 � 0.0Z 0.0 (2) J 3 11 0.170 6.0 � 5.3 )13.3 � 6.2
a Success in aggressive encounters (number of aggressive encounters; data on dominance rank were taken from Bautista et al. 1995,Table 2)b A adult, J juvenile, I immaturec Minutes after departure of the ®rst crane (left), and minutes before sunrise (right)
Fig. 1 Relationship between the di�erence in aggression rates(number of aggressive encounters per minute) of marked individualswith respect to their ¯ock mates and the dominance rank of markedbirds. Dominance rank was classi®ed as low (<33% aggressionswon), medium (34±66%) or high (>66%). Figures are numbers ofmarked individuals. Vertical bars represent �1 SE
Fig. 2 Correlation between the mobility of the cranes among foragingzones and the morning food intake. Each capital letter corresponds toone individual
Fig. 3 Correlation between roost departure delays with respect to the®rst crane (minute 0) and dominance rank (percentage of success inaggressive encounters) on the ®rst day of use of a new foraging zone.The four most subordinate birds departed from the roost earlier thanthe median time, with only one dominant departing also earlier. Theremaining four dominants departed later than the median time(observed frequencies: 0,4,4, and 1; P = 0.048; Fisher's exact test)
404

When cranes switched from a foraging zone to an-other, the sample of all birds and the sample of domi-nant birds selected a new zone with higher food densitythan the old one (Table 2), while our subsample ofsubordinates was insu�cient to test for a di�erence.Dominant cranes tended to change to new zones with ahigher number of birds than that they abandoned, whilesubordinate cranes tended to change to zones with lessbirds. Although these trends did not reach signi®cance(see Table 2), most dominant cranes (5 of 6 birds) se-lected a new zone with a higher number of cranes thanthat on the previous zone, while all subordinate cranes(5 of 5 birds) went to a new zone with a lower number ofbirds. Since the probability of the observed frequenciesis less than the signi®cance level (P = 0.015, n = 11,Fisher's exact probability test), we reject the hypothesisthat the proportion of cranes at the new zone selected byan individual was independent of its dominance rank.
Morning intake before a change was greater fordominants than for subordinates (Mann-Whitney test,U = 19, P = 0.05, Table 2). On the ®rst day at a newzone cranes increased signi®cantly their morning foodintake with respect to the last day at the previous zone(see sample of all birds in Table 2). This increase wasmarginally signi®cant in our subsample of subordinatebirds and did not reach signi®cance in dominant birds,but in all subordinate birds and ®ve of six dominantbirds there was indeed an increase, suggesting that theabsence of statistical signi®cance after splitting bothgroups of birds was due to small sample sizes.
The food intake of an individual on the day before achange was lower than its mean food intake measuredthroughout the whole winter (mean of individual dif-
ferences of )19.8 � 16.0 per cent, P = 0.012, n = 11birds, one-sample sign test), both measures of food in-take being correlated (Fig. 4). The food intake on theday before a change was also positively correlated withdominance rank (rs = 0.82, P < 0.005, n = 11).However, since dominants tended to select foragingzones with higher food density (Bautista et al. 1995), weagain tested the correlation between food intake on theday before a change and dominance rank excluding thee�ect of food density. The correlation was signi®cant(Txy,z = 0.65, P < 0.02, n = 9, Kendall partial rank-order correlation). We conclude that for equal zone
Table 2 Roost departure time, food density, proportion of cranes, and morning food intake on the foraging area used by cranes,respectively on days before and after a change in foraging zone. Values (�1 SD) for all individuals, dominants and subordinates are given.Sample sizes (no. of individuals) in parentheses. Two-tailed exact probabilities were calculated with paired Wilcoxon rank tests
Last day on p-revious zone (n)
First day onnew zone (n)
Di�erence%a P (n)
Roost departure delay with respectto departure initiation (minutes)All birds 9.41 � 4.85 (10) 8.61 � 5.35 (9) 90 0.999 (8)Dominants 6.97 � 4.21 (6) 11.86 � 4.92 (5) 177 0.063 (5)Subordinates 12.75 � 4.02 (3) 4.56 � 2.13 (4) )55 0.250 (3)
Mean food density (kg/ha) onforaging zone usedAll birds 2.57 � 1.18 (10) 3.01 � 1.50 (9) 16 0.039 (8)Dominants 2.40 � 0.98 (6) 2.93 � 1.40 (6) 20 0.031 (6)Subordinates 2.31 � 1.50 (3) 2.33 � 1.87 (2) 4 (2)b
Proportion of crane population onthe foraging zone usedAll birds 0.18 � 0.14 (12) 0.23 � 0.20 (12) 12 0.638 (11)Dominants 0.22 � 0.14 (6) 0.34 � 0.21 (6) 60 0.063 (6)Subordinates 0.17 � 0.13 (5) 0.09 � 0.06 (5) )45 0.063 (5)
Morning food intake (g)All birds 90.5 � 26.9 (11) 115.3 � 38.0 (12) 38 0.032 (11)Dominants 105.4 � 25.0 (6) 130.3 � 40.2 (6) 30 0.313 (6)Subordinates 72.7 � 17.1 (5) 104.2 � 34.0 (5) 47 0.063 (5)
aMean of individual di�erences between ®rst day on a new zone and last day on previous zone = {(®rst ) last)/last} ´ 100bNot enough sample size to calculate the Wilcoxon rank test
Fig. 4 Correlation between the food intake on the day before achange in foraging zone and the mean food intake throughout thewinter. All values except one lie below the isoline (discontinuous line),showing the magnitudes of the di�erences with respect to the averageintake rate for each individual on days prior to change
405

quality dominant cranes abandoned a zone at higherintake rate than subordinates.
When a crane changed, the food intake on the ®rst dayon the new zone was not signi®cantly higher than itsmean winter food intake (mean di�erence of 6.9 �42.2% P > 0.05, n = 12 birds, one-sample sign test).The correlation between these two measures of food in-take was not signi®cant (rs = 0.22, P = 0.484, n = 12).
Discussion
On the day before a change in foraging area the meanmorning food intake of marked cranes was signi®cantlylower than the food intake averaged over the study pe-riod. Moreover, the two variables were positively cor-related (Fig. 3). These results suggest that the decisionrule used by the cranes to change to a new foraging zonewas to abandon an area when their morning food intakedecreased below a critical value, probably representedby their own mean morning food intake. When wecontrolled for the di�erences in food density at the zonethrough partial correlation, the marginal intake before achange was positively correlated with dominance rank.Thus we conclude that for equal zone qualities, domi-nant individuals decided to change at higher marginalintake rates than subordinates. The fact that there werealmost always cranes still foraging on a zone alreadyabandoned by a focal individual supports that the foodintake of each individual was probably the most criticalparameter a�ecting the decision whether to change ornot on the next day. The alternative of a common foodintake amount for all individuals, given that winteringcommon cranes forage in ¯ocks, was rejected by ourresults.
The next decision a crane must take when changingto a new foraging zone is what new zone to chooseamong all possible zones. In relation to this decisionrule, we have two di�erent sets of results. First, the dataon food density measured directly in the ®eld indicatethat all birds combined selected a new zone with higherfood density than the old one. Splitting by dominancerank, the same was true for dominant cranes, while thesample size for subordinates was insu�cient to detect adi�erence. Second, while dominants changed to a newzone which was already used by a relatively high pro-portion of birds (on average, 34% of wintering cranes,see Table 2), subordinates went to a zone with lowerproportions of birds (9% on average). Thus, the com-bined results on food density and number of birds at thenew zone on the ®rst day after a change suggest thatdominant birds selected a higher-quality zone with morebirds, while subordinates switched to a zone that wasprobably not better in quality from that they used theday before, but with lower numbers of competitors.Whatever the decisions adopted by an individual, ourresults indicate that, overall, cranes increased their foodintake after a change. We suggest that this increase was
attained by di�erent strategies that depended on domi-nance rank. Although the sample size was probably notlarge enough to obtain signi®cant results separately fordominants and subordinates, the same trend was ob-served in both classes (5 of 6 dominants and 5 of 5subordinates increased their food intake after a change)and the intake increase for the pooled sample was sig-ni®cant (P = 0.032, see Table 2). In the case of subor-dinate birds, in which the increase in intake wasmarginally signi®cant, the average morning food intakeof 72.7 g on the day before that change (Table 2) wouldallow them to obtain an average total daily food intakeof only 117 g. This value was estimated from the cor-relation between morning and total daily food intakes(see Bautista et al. 1995), and is less than the 121 gcalculated as the minimum existence metabolic require-ments of a crane during winter (Alonso et al. 1995).Thus subordinate birds were in negative energy balanceon the days before a change and so were clearly forced toshift to cover their minimum daily requirements.
From a previous study we know that subordinatebirds could not increase signi®cantly their intake rate byforaging in high-quality zones because of their lowercompetitive ability (Bautista et al. 1995). This could bethe reason why it paid them to switch to a new zone notused by a high number of birds, rather than activelyselecting a zone with higher food density that wouldprobably be occupied by a large proportion of higher-ranked individuals according to the phenotype-limiteddistribution. The signi®cantly higher percentages ofcrane families and independent juveniles at the poorestzones and at the periphery of ¯ocks foraging at goodfood patches found in previous studies represent a fur-ther example of such subordinate strategy, based moreon competition avoidance than on selection of highestfood densities (Alonso et al. 1987; Alonso and Alonso1993). In a laboratory study on juncos (Junco hyemalis),subordinate individuals selected foraging zones withlower number of ¯ock mates (Caraco et al. 1989), a re-sult that was also interpreted as avoidance of competi-tion by subordinates.
Avoidance of competition is also supported by therelationship between aggression rate and dominancerank, i.e., lower in both extreme subordinates and ex-treme dominant birds, and not di�erent from their ¯ockmates for intermediate dominance ranks. Our interpre-tation of this result is that extreme subordinate birdsprobably avoid being involved in aggressive encountersbecause of their lower probabilities of winning, whileextreme dominants are avoided by other birds in the¯ock before an actual attack occurs. It is conceivablethat individuals in a ¯ock can recognize each other'srank by size, plumage design, and/or some behavioraltrait without necessarily being involved in an aggressiveencounter every time two birds approach. We have seenthat size di�erences are quite large (30% in weight be-tween birds Z and C, 45% in weight between D and C,and up to 26% in linear measurements between D and C;see Table 1 in Bautista et al. 1995).
406

Since the daily food intake increase after a change ofzone was not signi®cant with respect to the averagewinter daily food intake, it seems that the birds did nottry to maximize their food intake on the ®rst day at thenew zone, but simply remained in a new zone where theycould forage at their average winter rate. A similarconclusion was reached in a previous study of patch use,in which cranes abandoned high-quality patches earlierthan predicted by optimal patch use models, to trade o�rate-maximization with other bene®ts derived from re-maining in the ¯ock (Alonso et al. 1995). This strategy of``satis®cing'' as an alternative to maximizing (Stephensand Krebs 1986, p. 180) has been described for situa-tions where animals ``do well, but do not optimize''(Myers 1983; Krebs and McCleery 1984; Stephens andKrebs 1986). Previous results suggest that winteringcranes do not seem to follow simple optimal foragingrules, but rather trade o� the immediate food intake ratewith several other bene®ts (Alonso et al. 1995).
The observed delay in departure of dominant birdson days of change to a new foraging zone (Fig. 3) is inaccordance with the fact that on these days they went tozones with a higher proportion of birds. During roostdepartures ¯ight directions and the proportions of birdstaking each direction might be reasonable cues for anyindividual ignorant of how food is distributed in thestudy area. Roost departure lasts only about 20 min(authors' unpublished work), so even a small delay of afew minutes can be of high potential value. Thus it ispossible that dominant birds could be using roost de-parture ¯ows to decide where to go. Although this resultagrees with the information center hypothesis (Wardand Zahavi 1973), it is not enough to conclude thatcranes were using the communal roost as a source ofinformation. The delay observed in dominant birds ondays of change could also be simply due to the bettercondition of these birds, who would then not need todepart so early. These two explanations are not incom-patible. Dominants could depart later because they arein better condition, but also bene®t from the informa-tion gained on departure ¯ows. Assuming that roostdeparture ¯ows could serve as a source of information,subordinate birds did not seem to use it, since theytended to leave the roost earlier on days of change.These roost departure patterns contradict the ``two-strategies hypothesis'' (Weatherhead 1983), which sug-gests that information transfer would be mainly to theadvantage of subordinate birds, rather than to domi-nants. A plausible explanation for the early departuresof subordinates could be that, due to their worse con-dition on the days they decided to change, after one ormore previous days su�ering food intakes below or closeto their critical minimum threshold, they ®nally tried tomaximize their feeding time by leaving the roost as soonas possible. Dominant cranes would be playing a war ofattrition with other individuals at the roost by leavingafter them, and so gaining information about the mostpreferred directions to go to forage. Cranes try tomaximize feeding time on short winter days, as shown in
a previous study at the same area (Alonso et al. 1985).Early roost departure has frequently been interpreted asa way of compensating for lower food intake rate inother studies (e.g., Schoener 1971; Eiserer 1984).
As for mobility between foraging areas throughoutthe winter, dominant birds remained more faithful toone or two zones, while subordinate cranes switchedmore frequently between zones. Since they used on av-erage lower-quality zones than dominants (Bautista etal. 1995), they had higher probabilities of failing toachieve the minimum acceptable daily food intake, thusbeing probably forced to be more mobile. Higher mo-bility of subordinate birds between foraging sites hasalso been observed in other ®eld and laboratory studieswith unequal competitors (Monaghan 1980; Ens andGoss-Custard 1984; Milinski 1984; Draulans and VanVessem 1985; Catteral et al. 1989; Summers and Feare1995). The interpretation given in most of these studiesthat the observed higher mobility of subordinate phe-notypes is an e�ect of their competitive exclusion fromthe best zones, is also a plausible one in our case.
Acknowledgements This is a contribution to project PB91-0081 ofthe Direccio n General de Investigacio n CientõÁ ®ca y Te cnica. Wethank Luc-Alain Giraldeau and two anonymous referees for theiruseful suggestions and comments, which helped to improve earlierversions of the manuscript.
References
Alonso JA, Alonso JC (1993) Age-related di�erences in timebudgets and parental care in wintering common cranes. Auk110:78±88
Alonso JA, Alonso JC, Veiga JP (1985) The in¯uence of moon lighton the timing of roosting ¯ights in common cranes Grus grus.Ornis Scand 16:314±318
Alonso JC, Alonso JA, Veiga JP (1987) Flocking in winteringcommon cranes Grus grus: in¯uence of population size, foodabundance and habitat patchiness. Ornis Scand 18:53±60
Alonso JC, Alonso JA, Bautista LM (1994) Carrying capacity ofstaging areas and facultative migration extension in commoncranes. J Appl Ecol 31:212±222
Alonso JC, Alonso JA, Bautista LM, MunÄ oz-Pulido R (1995)Patch use in cranes: a ®eld test of optimal foraging predictions.Anim Behav 49:1367±1379
Bautista LM, Alonso JC, Alonso JA (1992) A 20-year study ofwintering common cranes ¯uctuations using time series analy-sis. J Wildlife Manage 56:563±572
Bautista LM, Alonso JC, Alonso JA (1995) A ®eld test of ideal freedistribution in ¯ock-feeding common cranes. J Anim Ecol64:747±757
Caraco T, Barkan C, Beacham JL, Brisbin L, Lima S, Mohan A,Newman JA, Webb W, Withiam ML (1989) Dominance andsocial foraging: a laboratory study. Anim Behav 38:41±58
Castro G, Stoyan N, Myers JP (1989) Assimilation e�ciency inbirds: a function of taxon or food type? Comp Biochem Physiol92:271±278
Catteral CP, Kikkawa J, Gray C (1989) Inter-related age-depen-dent patterns of ecology and behaviour in a population of sil-vereyes (Aves: Zosteropidae). J Anim Ecol 58:557±570
Charnov EL (1976) Optimal foraging: the marginal value theorem.Theor Popul Biol 9:129±136
Draulans D, Van Vessem J (1985) Age-related di�erences in the useof time and space by radio-tagged grey herons (Ardea cinerea)in winter. J Anim Ecol 54:771±780
407

Eiserer LA (1984) Communal roosting in birds. Bird Behav 5:61±80Ens BJ, Goss-Custard JD (1984) Interference among oystercatch-
ers, Haematopus ostralegus, feeding on mussels, Mytilus edulis,on the Exe estuary. J Anim Ecol 53:217±231
Glutz UN, Bauer KM, Bezzel E (1973) Handbuch der VoÈ gelMitteleuropas. Akademische Verlagsgesellschaft, Frankfurt
Goss-Custard JD, Clarke RT, Durell SEALV (1984) Rates of foodintake and aggression of oystercatchers Haematopus ostraleguson the most and the least preferred mussel Mytilus edulis bedsof the Exe estuary. J Anim Ecol 53:233±245
Krebs JR, McCleery RH (1984) Optimization in behaviouralecology. In: Krebs JR, Davies NB (eds) Behavioural ecology:an evolutionary approach. Sinauer, Sunderland, pp 91±121
McNamara J, Houston AI (1990) State-dependent ideal free dis-tributions. Evol Ecol 4:298±311
Milinski M (1984) Competitive resource sharing: an experimentaltest of a learning rule for ESSs. Anim Behav 32:233±242
Milinski M, Parker GA (1991) Competition for resources. In:Krebs JR, Davies NB (eds) Behavioural ecology. Blackwell,Oxford, pp 137±168
Milinski M, Boltshauser P, Buchi L, Buchwalder T, FrischknechtM, Hadermann T, KuÈ nzler R, Roden C, RuÈ etschi A, Strahm D,Tognola M (1995) Competition for food in swans: an experi-mental test of the truncated phenotype distribution. J AnimEcol 64:758±766
Monaghan P (1980) Dominance and dispersal between feedingsites in the herring gull (Larus argentatus). Anim Behav 28:521±527
Myers JP (1983) Commentary. In: Brush AH, Clark GA (eds)Perspectives in ornithology. Cambridge University Press, NewYork, pp 216±221
Parker GA, Sutherland WJ (1986) Ideal free distributions whenindividuals di�er in competitive ability: phenotype-limited idealfree models. Anim Behav 34:1222±1242
Pennycuick CJ (1989) Bird ¯ight performance: A practical calcu-lation manual. Oxford Science, Oxford
Prange H (1989) Der graue Kranich. Ziemsen, Wittenberg-Lu-therstadt
Schoener TW (1971) Theory of feeding strategies. Annu Rev EcolSyst 2:369±404
Siegel S, Castellan NJ (1988) Nonparametric statistics for the be-havioral sciences. McGraw-Hill, New York
Stephens DW, Krebs JR (1986) Foraging theory. Princeton Uni-versity Press, Princeton
Summers RW, Feare CJ (1995) Roost departure by Europeanstarlings Sturnus vulgaris: e�ects of competition and choice offeeding site. J Avian Biol 26:289±295
Sutherland WJ, Parker GA (1985) Distribution of unequal com-petitors. In: Sibly RM, Smith RH (eds) Behavioural ecology.Blackwell, Oxford, pp 255±274
Ward P, Zahavi A (1973) The importance of certain assemblages as``information centres'' for food-®nding. Ibis 115:517±534
Weatherhead P (1983) Two principal strategies in avian communalroosts. Am Nat 121:237±243
Communicated by N. Metcalfe
408