Africa's Cooperation with New and Emerging Development Partners: Options for Africa's Development
61
The International Development Centre Africa’s Cooperation with New and Emerging Development Partners: Options for Africa’s Development Raphael Kaplinsky and Masuma Farooki, with the assistance of Anne Terheggen and Julia Tijaja, Development Policy and Practice, The Open University, Milton Keynes, UK. International Development Centre Working Paper Series Paper No.5 October 2008
-
Upload
independent -
Category
Documents
-
view
4 -
download
0
Transcript of Africa's Cooperation with New and Emerging Development Partners: Options for Africa's Development

The International Development Centre
Africa’s Cooperation with New and Emerging Development Partners: Options for Africa’s
Development Raphael Kaplinsky and Masuma Farooki, with the assistance of Anne Terheggen and Julia
Tijaja, Development Policy and Practice, The Open University, Milton Keynes, UK.
International Development Centre Working Paper Series Paper No.5 October 2008

Abstract: The data presented in this Paper summarises the interaction of Africa with seven emerging economies on three vectors of integration – Aid, Trade and FDI. The emerging economies are China, India, Brazil, Korea, Malaysia, Russia and Turkey. It is drawn from a larger Report commissioned by The Office of Special Advisor on Africa (OSAA), Dept. of Economic and Social Affairs (DESA), the United Nations, New York.

“The problem is that China has a strategy for Africa, but Africa lacks a strategy for China” (Comment by Kenyan scholar, 2005) 1. PUNCTUATED EQUILIBRIUM: NEW OPPORTUNITIES Evolutionary biologists believe that species change does not always occur as a result of slow, smooth and gradual incremental change, but often as a result of “punctuated equilibria”. That is, after periods of relative stasis, change occurs in a discontinuous way, with a relatively sudden alteration in direction often initiated by an external event. Species which are able to adjust rapidly to this changing environment, thrive: others that do not, die out. This approach to the evolution of species applies with equal force to the evolution of institutions and societies. Decades, and sometimes centuries, of relative stability suddenly come to an end and social organisations either adapt and thus thrive, or carry on as if nothing had changed, and thus atrophy and decline. Africa is currently entering an era of disruptive change. Although SSA’s links with western powers go back to the early 16th century with the rise of the slave trade (and North African links go back even further), some two centuries ago this process of integration deepened and the continent’s political, economic and social institutions were increasingly influenced by western powers. The formal annexation of large tracts of land and people in Africa progressed through the colonial era of the 19th Century and were intensified during the 20th Century. This led to the increasingly deep and complex integration of African economies with the European and North American economies which had come to dominate the global economy. In the second half of the twentieth century, this integration took a post-colonial form, with deep integration occurring simultaneously with the untying of colonial links. The global economy and polity is now entering a period of disruptive change and punctuated equilibrium. Since 1979 China has grown at a compound growth rate of 9 percent p.a, and India at a similar rate since the early 1990s. This rapid growth is not unique – Botswana, Hong Kong, Japan, Korea, Singapore and Taiwan had all grown at similar rates for prolonged periods. But all of these rapidly growing economies were small, so that their growth could proceed without changing the basic parameters of production and exchange in other countries. However, China and India together account for almost 40 percent of the global population, so that when they grow very rapidly for prolonged periods, the “small country assumption” has to be suspended. China is likely to become the second biggest economy in the world by 2020, and India the third largest by 2035. Their size means that their expansion punctuates and disrupts the equilibrium path of incremental change which has dominated many societies for so long, not least the relatively weak and poor economies in Africa. It is for this reason that these newly emerging very large Asian economies are referred to as the “Asian Drivers”.0F
1 This Report summarises the major changes emerging in Africa’s intercourse with the external world arising in large part as a result of the disruptive entry of the Asian Driver economies into the global arena. Although China and India are the primary sources of disruptive change, they are not alone and their growing presence opens the space for other new economic and political actors. The Report therefore also considers the role played by other emerging economies in Africa. These are Brazil, Korea, Malaysia, Russia and Turkey. These economies have been chosen partly because of their size, but also
1 www.asiandrivers.open.ac.uk; see Special Issue of World Development, Vol. 36, No. 2, 2008.

because each in its own way represents a particular type of disruptive force. Brazil is large and has similar economic parameters to many African economies. Korea was once a low income economy such as those in Africa currently are (in the 1960s it had a lower per capita income than Ghana), but has become a dynamic knowledge intensive participant on the global stage; Malaysia and Turkey strive to emulate its path. Russia is not just very large, but also is rich in resources, as are many African economies. The central idea behind this focus on new emerging economies in Africa is that their growing emergence and deepening links are disruptive of the trajectory of social, political and economic change in Africa. They punctuate this past equilibrium of systemic orientation and thus pose a new and substantive challenge to Africa – how can African economies make the most of the opportunities offered by these new participants on the global economic stage, and how can African economies minimise the potentially negative impacts posed by their growing presence? In assessing the impact of these events, this Report takes the following form. Section 2 briefly lays out an architecture for assessing the impact of the new Emerging Development Partners on Africa, identifying three key vectors of integration – trade, aid and FDI. Section 3 addresses the strategic implications for policy in Africa. Section 4 provides a country by country profile of the growing presence in Africa of each of these key emerging economies. 2. TRADE, AID AND FDI: KEY VECTORS OF CHANGE1F
2 How might the impact of these rising powers on Africa be assessed? Three key variables are of importance:
• Their modes of interactions with Africa – this Report will focus on Trade, FDI and Aid
• The extent to which these interactions are complementary (that is, both Africa and the emerging economies gain) or competitive (emerging economies gain, Africa loses; or African economies gain and emerging countries lose)
• The extent to which these impacts are direct and occur a result of bilateral relations;
another set of impacts are those which are indirect in nature, for example, China’s trade with the rest of the world affecting relative prices, the terms of trade and thus the core development strategies of African countries. 2F
3 This Report will only focus on the direct impacts.
Although trade, aid and FDI are considered as independent vectors, this is to some extent an artificial separation. In the Colonial era they were fused and the imperial powers’ interests in Africa were closely coordinated. But as Africa was decolonised in the second half of the 20th Century, these vectors increasingly came to be separated, partly as a result of opposition from African countries, partly because new players were entering the field (notably the US and the multilateral agencies), and partly due to growing public opposition in the OECD economies. Current views on “best practice” are that the vectors should be separated. Aid should be untied, and although trade and FDI are often closely co-related,
2 For an extended discussion of these vectors of change, see Kaplinsky and Messner, 2008. 3 Kaplinsky (2008)

this is seen as reflecting an outcome of economic processes rather than of concerted government-led strategic agendas by source-countries of aid and investment. This separation of the trade-FDI-aid vectors characteristic of the latter stage of western dominance in Africa is now being challenged by some of the emerging economies. They are explicitly coordinating interventions in these vectors in a way which is reminiscent of the earlier periods of Colonial Rule. Africa countries need not only to be aware of these inter-linkages, but to understand the extent to which these linkages can be manipulated in Africa’s own interest. Africa will need to coordinate its response in the same way if it is to gain from the opportunities opened by the emergence of new actors on the global stage. The emerging economies in general, and China in particular, have a distinctive position by comparison with this emerging pattern of best-practice aid, trade and FDI from the OECD economies. They exercise a much close strategic integration of aid, trade and FDI. 3. MAKING THE MOST OF OPPORTUNITIES: HOW CAN AFRICA TAKE ADVANTAGE OF THE RISE OF THE EMERGING ECONOMIES? 3.1. Setting the Agenda How can Africa make the most of the opportunities provided by these new disruptive entrants? In what areas do the major opportunities arise? What strategies might be employed to ensure the most successful outcomes? And who are the main bargaining parties? These are the questions which need to be addressed if the most can be made for Africa in a rapidly-changing world. There are more than 50 countries in Africa, and this Report addresses their relations with seven emerging economies. Each of these economies has their own history. They have different endowments and are at different stages of development. Some African countries are landlocked and some have large desert tracts. Population densities vary enormously, and human skills are unevenly developed within and between countries. Perhaps most importantly, the different countries on the continent have very different political and governance systems, with varying capacities to focus and implement strategic choices. At the same time, although the seven emerging countries considered in this Report have in common their desire, as relatively new entrants, to deepen their links with Africa, they, too, differ enormously in their endowments, needs and strategic capabilities. For these and related reasons, it is neither feasible nor desirable to set out a single path in which individual African countries, or groups of African countries should interact with these new disruptive entrants into the global arena. Notwithstanding this cautionary note, Africa clearly has an enormous opportunity to restructure its external relations by capitalising on the entrance of these new economies. In Section 2 of this Report it was observed that in some respects there are similarities between the new phase of emerging economy activity in Africa and the pattern of interaction between Africa and the colonial powers in the colonial era. As in earlier years, to a greater or lesser extent, the newly emerging economies are coordinating their agendas in Africa in relation to the three primary vectors of interaction – trade, FDI and aid. They, as can be seen from Figure 1, increasingly “have a strategy for Africa”. But the

problem is that Africa “lacks a strategy for the emerging economies”. Three key agendas need to be addressed for this Strategic gap to be filled.

Figure 1 - The Emerging Economies and Africa
Africa’s importance to
emerging economy
Emerging economy’s importance for Africa
Export to Africa
Imports from Africa
FDI to Africa Aid to Africa Strategic integration by emerging economy
Strategic integration by
Africa
Brazil Energy (short term); minerals; market for goods and services
Technology, particularly in health; support for infrastructure
Food, transport, refined petroleum iron ore
Crude oil (formerly refined oil products)
Oil and iron ore and coal; infrastructure
Debt relief, infrastructure; AIDS projects; training; bio fuels
Weak. Brazil seeks African support in global arena African-South America Cooperative Forum established, coordinated by Brazil and Nigeria
Very little, apart from S Africa
China Energy, minerals; support in global fora
Wide range of products, of increasing technological content
Oil predominates, and is of growing importance. Some imports of minerals
Predominantly in resource sectors, but increasing flows to manufacturing and services
Coordinated through FOCAC; tied to Chinese firms and inputs; extensive technical assistance; prestige projects (parliament, sports stadiums) are important and widespread. Aid concentrated in oil exporting economies; debt-cancellation
Very high – initiator of numerous fora for coordinated discussions; close interlinking of aid and FDI to trade interests, particularly securing long-term access to Africa’s resources; China also seeks African support in global arena
Very little. Mainly through FOCAC fora organised by China
India Market (present); source of raw materials (future)
Source of cheap products; technical assistance
Refined petroleum products; pharmaceuticals
Oil; gold In clothing in order to gain AGOA access to US; oil in Sudan and elsewhere. Geographically concentrated in E Africa., but growing in Libya and Ivory Coast
Predominantly lines of credit tied to Indian goods. But recent years seen substantial increase, linked to access to minerals and oil
Indian government becoming more active in promoting a strategic focus, especially in minerals sector. More focused in its approach to Africa than China. India-Africa Summit (14 countries) established 2008.
Very little. Mainly through Indian-organised forum, which is less developed than that of FOCAC
Malaysia A source of oil, minerals, coca, oil
A source of vegetable oils, some machinery, and technical assistance
Vegetable oils Oils and minerals Little integration of vectors.
Historically concentrated in Mauritius and S Africa. Recent rise in investments in oil, gas, and energy by Petronas and investments in palm oil dominates all other flows
Mostly technical assistance. Africa features relatively highly in Malaysia’s external aid programme
Most links through multilateral forums (for example, the Commonwealth). Southern African International Dialogue established in 2005.
Only South Africa has had an explicit, albeit loose, strategy towards Malaysia

Africa’s
importance to emerging economy
Emerging economy’s importance for Africa
Export to Africa
Imports from Africa
FDI to Africa Aid to Africa Strategic integration by emerging economy
Strategic integration by
Africa
Russia Russia sees Africa as a partner and potential competitor in a range of natural resource sectors, particularly mining, oil and gas
Russia has a similar export profile to that of Africa – mainly resource-based products
Agricultural products, predominantly to North Africa
Raw materials - ores and unprocessed foodstuffs
Almost all FDI in Africa has been in the minerals sector, and much of it in Southern Africa
Russian aid to Africa has been limited and mostly channelled through multilateral agencies
There appear to be no signs of coordinated activity amongst the various vectors of interaction with Africa. The clearest signs of an emergent strategy towards Africa appears to be in relation to South Africa and in relation to investment by major Russian firms in the minerals and diamonds sectors
There are few signs of an emergent strategy from Africa towards Russia
South Korea
Korea has no oil of its own and is the world’s fifth largest consumer of oil.
Source of oil and minerals; market for manufactured exports
Shipping and automobiles, plus other manufactured goods.
Oil Mining, Hotels and Tourism, Manufacturing
Aid programme distinguishes between African partners with developmental needs, and strategic partners (oil and mineral assets)
Historically Korea has lacked a strategy for Africa. In recent years this has changed, with an increasing trend towards the integration of trade, FDI and aid, as well as the establishment of the Korea Initiative for African Development
Turkey Africa is an important market for its industrial outputs
Gold, gas. Metal products for construction sector
Gold and oil Historically in North Africa, but now spreading widely over Africa. Many investments are small in scale.
Aid has risen steadily, but from a low base. Africa receives only a small share of Turkey’s aid budget. In recent years, Sudan and Somalia have been the primary recipients of Turkish aid.
Turkey has begun to develop an African strategy, involving cooperation between the state and the business sectors. “Open Up Africa” policy initiated 1998
Turkey seeks African support in its quest to enter the EU. This may be turned to the advantage of African countries seeking aid and appropriate FDI
Source: Compiled from Annex

The first key issue is for African countries to adopt a similar strategy of integrating the vectors of integration to that which is being pursued most clearly by China, but increasingly also by India and the other emerging economies (Figure 1 above). Meeting the trade needs of the emerging economies – Africa as a source of primary commodities and, to a lesser extent, as a market for their exports – should be conditional upon their providing aid to exploit these commodities, as well as to meet Africa’s complementary developmental and infrastructural needs. Where appropriate, it should also incorporate FDI from the emerging countries, and participation in the emerging country firm value chains which serve global markets (for example, Chinese, Indian and Turkish firms providing their fabric to African countries for onward export, through the marketing channels of these emerging country firms, to the US and the EU). The second key strategic agenda is to develop a differentiated view of the different emerging economies, and of different stakeholders within them. Each of the emerging economies has distinct sets of interests. Turkey, for example, sees Africa as a market primarily, whereas for China and India, Africa’s importance stands out in terms of long-term access to primary commodities. Similarly, there are also different interest groups within each of the emerging economies. This is most notable in the case of the very large Chinese economy, where although the Beijing-controlled EXIM Bank provides the primary lines of credit for Chinese FDI-aid events in Africa, the primary drivers are the provincial governments in China. Some of these provincial governments are more active than others, and some concentrate on particular regions and countries within Africa. The third key strategic issue is who in Africa is going to drive this strategic agenda. At the most basic level, this must necessarily involve individual African governments. Although they do not generally directly control inward FDI and trade flows, they hold the key levers which determine access to their economies. Each of the governments needs to make a cool, informed assessment of its specific attractions to the emerging economies and then to coordinate an integrated strategic response to offer access to the emerging economies in a way which best meets the needs of their domestic economies.
4: COUNTRY PROFILES
4. Brazil
Brazil is reaching out to its immediate neighbours in Latin America and to the developing countries in general as it defines its place in the global arena. Its foreign policy objectives provide for growing opportunities for South-South Corporation. Both in economic and political circles, Brazil is seeking to expand its influence; from ambitions to head the WTO to securing a permanent seat at the UN Security Council. The votes of the African countries are important in this regard, and accordingly Brazil is seeking to expand its diplomatic and economic relations with its African counterparts.
Box 4.1: Brazil: Opportunities for Africa
Brazil and Africa share many common characteristics. Both are exporters of primary materials, both have large tracts of land, and they also share common problems (e.g. AIDS).
Brazil “lacks a strategy for Africa”. Similarly, there are few signs of a coordinated approach towards Brazil from any individual African countries, or from groups of African countries, with the exception of South Africa which actively cultivates its links with Brazil through a loosely defined BRICS consortium in global political arenas.
Brazil’s interest in Africa reflects its needs for energy (although in recent years Brazil has discovered significant oil deposits of its own) and commodities, and to some extent a market for its technology and exports. Brazil also sees Africa as a major partner in its desire to increase its influence in global economic and political fora.
Trade: The major opportunities for Africa in trade are in regard to a market for commodities. But value added in commodity exports to Brazil have fallen, and only South Africa shows signs of exporting a wider range of products to Brazil. There is thus scope for export diversification. On the import side, Africa has the capacity to benefit from Brazilian expertise in bio fuels and pharma products (including AIDS related products and services). For food-deficit African countries, Brazil may also be a source of animal feeds.
FDI: In Mining and Construction, Africa has many opportunities to gain from the expertise and market access provided by large Brazilian commodities firms, particularly in iron ore. Brazilian firms also have expertise in infrastructure, although (as in Angola), they find it hard to compete with Chinese firms.
Aid: There are many opportunities for African economies in Health and Agricultures; Opportunities to expand in soft commodities & Bio-Fuels.

4.1 Trade
In 1995, Brazil’s exports to Africa totalled $1.6bn., These began to rise rapidly after 2003, rising to $9.4bn. by 2007. Brazil’s imports from Africa rose more rapidly, and its trade deficit with Africa began in 1995, accelerating sharply in 2003. Since 1996, Africa has had an overall trade surplus with Brazil, reaching $1.6bn. in 2007 (Figure 4..1).
Figure 4.1: Brazils Trade with Africa (1990-2007) ($m)
0
2000
4000
6000
8000
10000
12000
1990 1991 1992 1993 1994 1995 1996 1997 1998 1999 2000 2001 2002 2003 2004 2005 2006 2007
Mill
ions
Brazil Exports Brazil Imports
Source: Calculated from Direction of Trade Statistics (IMF) database accessed via ESDS; June 2008.
Brazil’s trade with Africa is concentrated on a handful of countries (Table 4..1). Four countries dominate in both its imports and exports - South Africa, Nigeria, Angola and Algeria. The fifth country, Libya, is also an exporter of hydrocarbons. Nigeria and Algeria together account for 71 percent of Brazilian imports from Africa. Nigeria’s share has been increasing from 25 percent in 2000 to 47 percent in 2007.
Table 4.1: Percentage Share of Brazil’s Top Five African Export and Import Partners (2007)
Exports Percent Share
Imports Percent Share
South Africa 19 Nigeria 47 Nigeria 19 Algeria 24 Egypt 18 Angola 6 Angola 11 South Africa 5 Algeria 7 Libya 5
Source: Calculated from Direction of Trade Statistics (IMF) database accessed via ESDS; June 2008.
Brazil’s exports to Africa are agricultural materials (mainly Sugar and Meat products), accounting for 34 percent of exports in 2006 (Table 4..2). Parts and accessories of motor vehicles accounted for 5 percent of exports to Africa in 2006, mainly South Africa. Refined Petroleum products (9 percent) and Iron ore concentrates (5 percent) were the other major products.

Table 4.2 Percentage Share of Brazil’s Top Five Exports to Africa (1995-2006)
Product Name 1995 2000 2006 Sugar and honey 44 23 23Meat and edible meat offal, fresh, chilled or frozen 0 3 11Petroleum products, refined 2 2 9Iron ore and concentrates 4 9 5Parts & accessories of Motor Vehicles and Tractors 3 4 5
Source: Calculated from COMTRADE, accessed via WITS May 2008.
The import category is dominated by petroleum products; imports of which from Nigeria and Algeria together valued $0.46bn. in 2006. As Table 4..3 indicates, the share of processed petroleum products has decreased significantly over the past decade, while that of crude oil has increased.
Table 4.3: Percentage Share of Brazil’s Top Five Imports from Africa (1995-2006)
Product Name 1995 2000 2006Crude petroleum and oils obtained from bituminous minerals 6 22 80Petroleum products, refined 50 50 8Fertilizers, manufactured 1 2 3Gas, natural and manufactured 6 11 1Inorganic chemical elements, oxides and halogen salts 2 1 1
Source: Calculated from COMTRADE, accessed via WITS May 2008.
The largest component of Brazilian exports has remained resource based commodities (49 percent). This is led by Sugar and Honey, followed by refined petroleum products and iron ore concentrates. The share of medium technology products has increased in the past decade, largely made up by inputs for tractors and motor vehicles, and motor vehicles themselves. On the import side, primary and resource based sectors account for almost all of the Brazil’s imports from Africa (94 percent).
4.2 FDI.
Brazil’s total FDI flows increased from $ 624 m. In 1990 to $ 2.28 bn. in 2000, rising further to $28 bn. by 2006.3F
4 FDI flows from Brazil to Africa are concentrated in the few MNC’s associated with mining. Petrobas S.A invested $1.9bn in Nigeria in coal, oil and natural gas sectors in 2005 and in 2007 made further investments in the alternative energy sector. The other major investor in 2007 was Companhia Vale do Rio Doce (CVRD), in the coal, oil and natural gas sector in Mozambique, valued at around $700m.
Following the mining companies are other Brazilian firms investing in the non mining sectors. For example in Angola, Brazilian companies are exploring the telecommunication equipment as well as urban transport and the wood/timber sector. Brazilian firms were awarded a $150m. water supply project in 2003. In Mozambique, the agriculture, livestock and forestry sectors are also attracting interest from Brazilian Firms.
As many other investors head to Africa in search of oil and mineral resources, the infrastructure sector has taken on renewed importance. Increasing incomes in urban centres are opening up construction opportunities for FDI. Odebrecht; a Brazilian firm has projects (ongoing and concluded) in 7 African countries namely Angola, Botswana, Congo, Djibouti, Gabon, South Africa and Mozambique. 4 WIR data accessed in June 2008

4.3 Aid.
Brazil’s major focus of technical cooperation and development assistance is focused on South American countries, who received over half of the total aid budget. But aid to Africa, particularly Lusophone Africa, features strongly.
Since the mid 1970’s, Brazil’s efforts have been concentrated on the Portuguese speaking countries in Africa, namely Angola, Cape Verde, Guinea-Bissau, Mozambique and Sao Tome and Principle. Coincidentally, most of tehse economies are oil exporters, or have the potential to become oil exporters. Lusophone African received 34 percent of total aid in 2003 (Schläger, 2007). Angola (45 percent of African aid) and Sao Tome and Principe (32 percent of African aid) were the major beneficiaries. Of the 54 bilateral projects initiated by the Agência Brasileira de Cooperação (ABC), (the main monitoring body of technical cooperation projects and programs) in 2005, 35 were located in these countries. Between 2000 and 2005 Brazil’s debt cancellation under the HIPC initiative for African countries assisted Mozambique ($369m), Tanzania ($10m), Mauritania ($9m) and Guinea-Bissau ($5m)4F
5.
In 2003, Brazil agreed with Mozambique and Namibia to plan for the manufacture of generic anti-retroviral drugs; building from its own experience and success in the area. Table 4..4: lists some of the recent development assistance programs in Africa.
5 (Schläger, 2007)

Table 4.4: Brazil’s Development Assistance to Africa (various years)
Country Brazilian Assistance Amount ($million)
Angola Vocational training centres for ex-combatants Vocal agricultural research institute Institute to Fight Aids - through the Angolan Ministry of Health with
assistance from Brazilian technicians and doctors
Regional centre for business development Programme for Export Financing $750m. total
up to 2006 Botswana HIV/AIDS Burundi HIV/AIDS Burkina Faso HIV/AIDS Cape Verde HIV/AIDS Equatorial Guinea HIV/AIDS Guinea-Bissau Vocational training centres for ex-combatants Agricultural technology and know-how transfer HIV/AIDS Humanitarian assistance $120,170 Debt cancellation $5m. Ghana Agricultural technology and know-how transfer Emergency thermal energy plant Mauritania Debt cancellation $9m. Mozambique Vocational training centres for ex-combatants Local agricultural research institute HIV/AIDS Regional centre for public administration Creation of pharmaceutical plants to manufacture generic anti-
retroviral medicines (ARVs)
95 percent debt relief from Brazil $369m. Humanitarian assistance $120,170 Namibia Agricultural technology and know-how transfer Creation of pharmaceutical plants to manufacture generic anti-
retroviral medicines (ARVs)
Training of marine and air force personnel Sao Tome and Principe
Agricultural technical cooperation (research institutes and farming techniques)
HIV/AIDS Senegal Agricultural support (airplane to spray deterrent during the locust
invasion)
South Africa Cooperation in the development of air-to-air missile technology $52m. Tanzania Debt cancellation $10m. Unspecified Transfer of 'biodiesel' technology “Bolsa-Escola” programme Global Fund to Fight HIV/AIDS, Malaria and Tuberculosis
Source: Own compilation from (Schläger, 2007), (Harsch, 2004), and (Zanin & Sorbara, 2007)

4.4 Integration of vectors
There are few signs of integrated trade, FDI and aid activities in Brazil’s links with Africa. The major feature of these links are that imports are dominated by oil, exports by market access, FDI by opportunities in commodities and infrastructure and aid by cultural ties. Countries receiving the majority of aid are not the same as those receiving FDI, nor are there commonalities between major trade and FDI partners.
Firms in resource based African economies can look towards establishing FDI and business ventures with their Brazilian counterparts. Brazil’s economic growth is linked to its own natural resources, and it shares the advantages of the commodity boom with many of the resource rich African countries. Although Oil and petroleum products are the largest African exports, metal and mineral ores and concentrates are a close second. Brazil has experience in being a Commodity dependent economy and African partners can gain from these experiences.
Efforts also need to be made to offer a coherent forum for Africa to discuss business and trade relations with Brazil. In 2008, the Common wealth Business Council, with UNCTAD, organised the Africa Americas Asia Business Summit in Mauritius (formerly known as the China-India-Brazil-Africa (CIBA) conference). Other efforts include an Africa-South America Summit held in Nairobi in 2006, with the objective of increasing cooperation between the two regions. Further to this summit, an African-South America Cooperative Forum was set up, with Brazil and Nigeria set to coordinate its activities. The second summit is set to be held in Venezuela in 2009.
The non resource rich economies also have much to gain from increased relations with Brazil. The technical corporation and assistance provided to some African countries often involve agricultural projects. Brazil is also one of the leading countries in bio-fuel research, and is already providing assistance to some African countries in technology transfer. Efforts to increase such technical cooperation would be of benefit for African nations facing rising fuel costs.
5. China
Of the seven emerging economies considered in this Report, China engages with the most number of countries in Africa, often funding investment in regions that are considered politically risky by others. In terms of both trade and FDI, China’s main endeavours have been in the oil and mineral sectors and in infrastructure. But the range of activities is growing rapidly, including small scale businesses such as trading, restaurants, beauty saloons and Chinese medicine centres. China’s assistance to the continent has taken several shapes and forms, from health and education projects to the construction of official buildings, stadiums and roads. Trade is dominated by oil imports for China, and low to medium technology exports to Africa.
There has been a significant strategic integration by China in its approach to the African continent. FDI and aid have been concentrated in economies which either have large oil and commodity sectors (Angola, Nigeria and South Africa), or which offer potential as raw material suppliers in the future (DRC). In these and other African economies, aid and FDI are closely integrated making it difficult to disentangle these two vectors as separate realms of activity.
China’s strategic participation in Africa is to some extent coordinated by Beijing central government, particularly with regard to trade, aid and FDI credits. However, the drivers of active economic participation in Africa are often Provincial Governments in China, with their linked state-owned enterprises.

A distinctive feature of China’s presence in Africa is its reluctance to exert pressure on African governments with regard to patterns of governance (refusal to participate in Paris Club transparency initiative in Angola), internal politics (Darfur and Zimbabwe) or process standards in production (ethical trade, environmental standards). However, there are signs that this hands-off approach is changing, with China providing an increasing number of peace-keeping troops in Africa. China is also very sensitive to criticism of its profile in Africa, to some extent reflected in its recent Aid-FDI-Trade venture in the DRC which answers some of the criticisms made of its approach towards exploiting Africa’s abundant resources.
China has initiated a number of fora to enhance China Africa relationships. The largest of these was the Forum on China Africa Corporation (FOCAC). The first ministerial meeting for the Forum was held in Beijing in 2000, followed by the second in Addis Ababa in 2003. The third forum was held in 2006, also referred to as the China-Africa Summit, which was widely seen as China’s attempt to shift up gears in its engagement with Africa.
Non resource rich countries have opportunities to gain from engagement with Africa as well. The spread of Chinese FDI has become more dispersed in 2005 as compared to 1990. Assistance projects cover a wide range of countries, including the non mineral economies. Fabric and telecommunication equipment are some of the largest Chinese exports to the continent and can be a source of expansion of light manufacturing and the services sector. Apart from minerals and oil, China also imports cotton from Africa, which can help the agricultural sector gain from trade. From 1979 to 2000, China invested in 22 agriculture projects at a combined value of $48m. The challenge therefore is to build on these mineral and agricultural sectors and improve value addition for exports.
Of the emerging economies, China has the most resources at its disposal and is actively seeking markets and opportunities for engagement. Africa provides such a base, and well designed policies can help both regions gain from the experience.
Box: 5.1: China - Opportunities For Africa
Perhaps more than any other external actor in Africa, China’s approach to the continent reflects the strategic integration of trade, FDI and aid. This is driven by two major objectives:
- the need for resources to fuel China’s sustained growth
- the need for political support as China seeks to enhance its global profile in economic and political fora.
Trade: A large market for resource exports from Africa. China is a source of cheap consumption and intermediate goods, and cheap and appropriate capital goods, potential for growth in the agricultural sectors.
FDI: Hitherto, most Chinese FDI has been large projects in the oil and minerals sectors. This is changing rapidly and there are increasing FDI flows to Africa in manufacturing and services.
Aid: China offers abundant aid to Africa, often bundled with FDI in order to secure long term access to materials. This aid takes a variety of forms, including finance, concessional market entry, funds and technology for infrastructure, technical assistance and training.
Integration: China has a developed “strategy for Africa”. There is little sign of Africa responding with a “strategy for China” at the national, regional or continental level.

5.1 Trade.
China’s exports to Africa increased from $2.4bn. in 1995 to $36.8bn. in 2007. Imports also saw a significant rise from $1.4bn. to $35.8bn. over the same period. China’s $1bn. trade surplus with Africa in 1995 changed to a trade deficit of around $2.7bn. in 2005, moving back to a surplus of $0.96bn. in 2007. Trade grew rapidly after 2001, as China increasingly ran out of its own natural resources.
Figure 5.1: China’s trade with Africa (1990-2007) ($m)
0
5000
10000
15000
20000
25000
30000
35000
40000
1990 1991 1992 1993 1994 1995 1996 1997 1998 1999 2000 2001 2002 2003 2004 2005 2006 2007
Mill
ions
China Exports China Imports
Source: Calculated from Direction of Trade Statistics (IMF) database accessed via ESDS; June 2008.
In 2007 China’s largest export destination within Africa was South Africa (20 percent), followed by Egypt (12 percent) and Nigeria (10 percent). However both South Africa and Egypt having been losing share in Chinese exports; decreasing from 26 percent to 20 percent and 18 percent to 12 percent respectively over 1995-2007. Algeria and Nigeria on the other hand have been increasing their share of Chinese exports, rising from 2 percent to 7 percent and 6 percent to 10 percent respectively over 1995 to 2007.
With regard to China’s imports, Angola is emerging as the substantial partner for African exports to China, increasing its share from 10 percent in 1995 to 33 percent in 2007. South Africa on the other hand has lost substantial share, falling from 49 percent in 1995 to just 19 percent by 2007. Sudan (13 percent) Congo Republic (8 percent) and Equatorial Guinea (6 percent) are all emerging exporters to China.
Table 5.1 : Percentage Share of China’s Top Five African Export and Import Partners (2007)
Exports Imports South Africa 20 Angola 33Egypt 12 South Africa 19Nigeria 10 Sudan 13Algeria 7 Republic of Congo 8Morocco 6 Equatorial Guinea 6
Source: Calculated from Direction of Trade Statistics (IMF) database accessed via ESDS; June 2008.
China’s exports to Africa are fairly diverse products as Table 5.3 shows. The top five products account for only 22 percent of its total exports to Africa. Telecommunication

equipment (6 percent), Cotton Fabric and Garments (13 percent) were the major top Chinese exports in 2006. The Fabrics and Apparel exports are related to the use of African countries as a base to produce for the US under the AGOA preferential treatment.
Table 5.3: Percentage Share of China’s Top Five Exports to Africa (1995-2006)
1995 2000 2006 Telecommunication equipment, parts and accessories 1 1 6 Cotton fabrics, woven 10 6 5 Fabrics, woven, of man-made fibres 3 7 4 Outerwear knitted or crocheted 1 3 4 Motor vehicle parts and accessories 2 2 3
Source: Calculated from COMTRADE, accessed via WITS May 2008.
By contrast, China’s imports from Africa are much more concentrated by product (Table 5.4). Oil is the largest import from Africa, rising from 22 percent in 1995 to 78 percent by 2006. Ores and concentrates of base metals are the second largest and although their share has decreased from 11 percent in 1995 to just 5 percent in 2006, their value has increased from $0.12bn. to $1.28bn. over the same time.
Table 5.4: Percentage Share of China’s Top Five Imports from Africa (1995-2006)
Product 1995 2000 2006 Crude petroleum and oils obtained from bituminous minerals 22 68 74 Ores and concentrates of base metal 11 2 5 Iron ore and concentrates 11 4 3 Pearl, precious and semi-precious stones, un-worked or worked 4 3 3 Cotton 14 0 3
Source: Calculated from COMTRADE, accessed via WITS May 2008.
In 1995, most of the Chinese exports to Africa were in the Low technology (47 percent) and Medium Technology sectors (26 percent). By 2006, High technology products were taking a larger share of the exports (16 percent) as well as an increase in the Medium technology products (33 percent). Low technology products lost share and now account for 39 percent of Chinese exports to the continent.
On the import side, China’s imports from Africa were biased towards the Primary (42 percent) and Resource Based (39 percent) sectors, in 1995. Over time this bias has been accentuated with these two categories accounting fro 96 percent of total imports in 2006. China has granted GSP status to African exports; although it remains unclear how this will affect processed goods. As can be seen from Table 5.5, Chinese tariffs on African products are a little below its tariffs on global imports. It is significant that tariffs on ores and metal imports are considerably below those on manufactures and agricultural products. And although there has been a large increase in the number of product lines imports from Africa which are free from tariffs – much trumpeted “special concession to Africa”, this increase in tariff-free product lines is reflected in China’s total trade. In fact, in the manufacturing sectors, the number of dutiable trade lines on African exports increased sharply between 2000 and 2007.

Table 5.5: China’s Average Tariff Rate and No. of Tariff Lines for World and SSA (2000-2007)
Simple Average Tariff
Rate No. of Free
Lines No of Dutiable
Lines No of Total
Lines Trade Year World SSA World SSA World SSA World SSA
Total Trade 2000 17.0 15.2 160 45 6,852 1,373 7,012 1,4182007 10.0 9.2 500 257 6,582 1,856 7,129 2,114
Agricultural Materials 2000 23.5 22.2 85 17 1,128 270 1,213 2872007 14.0 12.6 162 63 1,163 315 1,332 379
Manufactures 2000 16.5 14.9 31 14 5,396 998 5,427 1,0122007 9.6 9.2 269 152 5,090 1,447 5,399 1,599
Ores and Metals 2000 5.3 4.8 40 14 269 79 309 932007 3.7 2.9 60 40 269 83 329 123
Source: Data from UNCTAD Trains database, accessed via WITS July 2008.
5.2. FDI.
As China began to emerge in the international global scene, its outward FDI flows remained small; equivalent to just $916m. in 2000, not much higher than the $830m. in 19905F
6. However, post 2000, FDI outflows have been rising, reaching $17.8bn. in 2006. The flows are expected to continue to increase, and reach an impressive $72bn. by 20116F
7.
UNCTAD estimates that China’s FDI in Africa has been increasing, rising from just $1.5m. in 1991 to $60.8m. by 2003. Besada, Wang and Whalley (2008) using various sources estimated Chinese FDI flows into Africa to be just above $500m. in 2006, rising from $400m. in 2005.
6 The reporting mechanism for FDI may have also changed after 2000, and therefore may account for change in reported figures. 7 EIU (2007)

Table 5.6: China’s FDI flows to Africa $million (1991-2003)
YEAR Total Africa Percent share
1991 913 1.5 0.16 1992 4,000 7.7 0.19 1993 4,400 14.5 0.33 1994 2,000 28.0 1.40 1995 2,000 17.7 0.89 1996 2,114 .. .. 1997 2,563 .. .. 1998 2,634 .. .. 1999 1,774 42.3 2.38 2000 916 85.0 9.28 2001 6,885 24.5 0.36 2002 2,518 30.1 1.20 2003 2,855 60.8 2.13
Source: UNCTAD (2007)
In 1995, Africa’s share of China’s FDI outflows was 0.89 percent, rising to 9.28 percent in 2000. But the continent’s importance has continued fluctuate since then. Cheng and Ma (2007) estimate Africa’s share in Chinese FDI flows rose from 2.6 percent in 2003 to 5.8 percent in 2004, falling back to 3.2 percent in 2005. The large recent investment in the DRC, as well as in other African countries, is likely to increase both the absolute magnitude of FDI flows to Africa, and Africa’s share in total outward Chinese FDI.
In 2005 Chinese FDI stock in 48 African countries reached a value of $1.6bn. (Table 5.7). Although China’s FDI in Africa is geographically dispersed, five countries (Sudan, Algeria, Zambia, Nigeria and South Africa) accounted for 56 percent of the FDI stock in 2005.

Table 5.7: Distribution of China’s Outward FDI Stock in Africa (1990 and 2005)
Country 1990 Country 2005 Zaire 18 Sudan 22 Nigeria 15 Algeria 11 Mauritius 14 Zambia 10 Guinea Bissau 9 South Africa 7 Zambia 7 Nigeria 6 Gabon 6 Tanzania 4 Rwanda 6 Kenya 4 Zimbabwe 6 Madagascar 3 Egypt 4 Guinea 3 Tanzania 4 Zimbabwe 3 Madagascar 4 Others 27 Central African Republic 3 Sierra Leone 2 Libya 2
Source: UNCTAD (2007)
China’s investment in Africa is fairly well divided over different sectors. Between 1979-2000, 46 percent of investment was in the manufacturing sector, textiles being the main category. Much of this manufacturing investment was in the clothing sector, taking advantage of Africa’s preferential access to US markets under the AGOA scheme. Services, mainly construction, accounted for 18 percent of the FDI inflows, with Resource Extraction accounting for 28 percent.7F
8 This is a dynamic picture however, and in 2007 the State-owned Industrial and Commercial Bank of China invested $ 5.4 bn. to acquire a 20% stake in Standard Bank, a South Africa based bank with extensive operations across the Continent8F
9.
China’s FDI in oil and gas exploration has been in Nigeria, Angola, Equatorial Guinea, Sudan and Gabon. Investments worth $757m. in Sudanese Oil and $2.7bn. in Nigerian oilfields have been made in the past few years by China.
The first Sino-African Business Conference in 2003 in Ethiopia resulted in agreements on 20 projects with a total value of $680m. The centre provides business consultation services, special funds, and simplified approval procedures. Today, about 700 Chinese enterprises are operating in Africa. China established three of its first eight overseas economic and trade cooperation zones in Africa: Nigeria, Mauritius and Zambia9F
10. A further $5bn. was made available under the China-Africa Development Fund to assist with development and investment related work in Africa.
8 UNCTAD (2007) 9http://www.moneymorning.com/2007/12/04/china-drills-into-africa-with-54-billion-investment/ 10 UNCTAD (2007b)
5.3 Aid.
China has extensive foreign economic cooperation programmes in Africa. The total value of these projects exceeds Chinese FDI flows into Africa; $18bn. have been invested in project finance from 2000 to 2006. These projects are more concentrated than Chinese FDI flows (Sudan 19 percent, Algeria 15 percent and Nigeria 11 percent), representing overseas projects financed by its government through the foreign cooperation programme, but also includes civil engineering projects financed by foreign investors.
Chinese assistance to Africa is coordinated by the State Council and three main ministries: The Ministry of Finance, the Ministry of Commerce, and the Ministry of Foreign Affairs. Other institutions such as the Export-Import Bank of China (EXIM Bank) and Chinese embassies in African countries also assist in finding and funding projects. EXIM Bank is key to the major infrastructural investments in Africa, providing a large fund for projects in Africa, but for which only pre-qualified Chinese firms can bid.
Between 2007 and 2009, the Forums on China Africa Corporation (FOCAC) aimed to provide preferential loans of $3bn. and trade credits of $2bn. They also promised to double aid to Africa by 2009. The China-Africa Development Fund amounting to $5bn. has also been established to support Chinese firms investing in Africa. In 2006, FOCAC also announced the establishment of three to five Special Economic Zones for focused Chinese investment in Africa. The zones are being set up in Zambia, Mauritius, Nigeria, Egypt and possibly Tanzania.
Other financial assistance includes debt cancellation usually taking the form of loans being turned into grants. Between 2000 and 2003, an estimated $1.27 to $1.38bn. was converted to grants. In 2005, a further commitment to reduce debts by $1.3bn. was made. Broadman (2008) reports concessional loans to Africa reached $800m. in 2005, covering 55 projects in 22 countries.
Between 1949-2006, Chinese aid to Africa was around $5.6bn.. Some of this aid takes the form of small or medium projects, such as a $8.6m. loan to construct administration buildings in Burkina Faso. Agricultural projects are also a favoured form of assistance with projects being funded in Niger, Nigeria, Uganda and Rwanda amongst others. Sugar refineries, paper mills, grain mills, forestry and irrigation have been common themes in projects10F
11. A number of projects related to health, education, agriculture and sports are also supported in Africa. Table 5.8 lists some of the projects carried out with financial assistance from the Chinese Export Import Bank and the China Africa Development Fund.
11 Brautigam (1998)

Table 5.8: Major Projects in Africa with assistance from China’s EX-IM Bank and
China Africa Development Fund
Year Country Main Project Amount Type of Funding Financier
2000 Congo Cement $24.15m. Concessional Loan EXIM
2000 DRC Telecommunications $9.66m. Concessional Loan EXIM
2000 Mali Cement $18.12m. Concessional Loan EXIM
2000 Mauritius Sewage $18.12m. Concessional Loan EXIM
2001 Sudan Power $110m. Loan EXIM
2001 Zimbabwe Infrastructure $7.45m. Concessional Loan EXIM
2002 Mauritius Housing Dam $12.07m. Concessional Loan EXIM
2002 Morocco Infrastructure $6.03m. Concessional Loan EXIM
2002 Sudan Power $150m. Loan EXIM
2003 Congo Dam Infrastructure $280m. Concessional Loan EXIM
2003 Djibouti Telecommunications $12m. Concessional Loan EXIM
2003 Ethiopia Dam Infrastructure Dam
$224m. (total) Loan EXIM
2003 Zambia Infrastructure $600m. Concessional Loan EXIM
2004 Angola Transport Infrastructure $2bn. Credit Line EXIM
2004 Botswana Housing $24.13m. Concessional Loan EXIM
2004 Sudan Dam Infrastructure $1.8bn. Loan EXIM
2004 Togo - - Concessional Loan EXIM
2004 Tunisia Telecommunications $16.89m. Concessional Loan EXIM
2005 Angola Energy $1-3bn. Loan EXIM
2005 Botswana Road $18.29m. Concessional Loan EXIM
2005 Egypt Plant Repair & Conference Repair
$16.3m. and $20m. Soft loans EXIM
2005 Egypt Textiles $15.85m. Concessional Loan EXIM
2005 Kenya - - Concessional Loan EXIM
2005/6 Mozambique Dam & Plant Infrastructure $2.3bn. Loan EXIM
2005/6 Mozambique Dam Infrastructure $300m. Loan EXIM
2005 Namibia Transport N$204m. Loan EXIM
2005 Togo - - Concessional Loan EXIM
2006 Benin Economic and technological cooperation
- Concessional Loan EXIM
2006 Cameroon Military $1.1bn. Material Assistance EXIM
2006 DRC - - Concessional Loan EXIM
2006 Eritrea Telecommunications $20.80m. Concessional Loan EXIM
2006 Kenya Electricity $20.17m. Concessional Loan EXIM
2006 Kenya Telecommunications $29.94m. Concessional Loan EXIM

Source: Davies, Edinger, Tay, & Naidu, 2008
Year Country Main Project Amount Type of Funding Financier
2006 Nigeria Dam & Power Infrastructure $2.5bn. Loan EXIM
2006 Tunisia Telecommunications $6.26m. Concessional Loan EXIM
2006 Zambia Tanzania-Zambia Railway - Concessional Loan EXIM
2006 Zimbabwe Agricultural Equipment $25.06m. Loan EXIM
2007 Angola Safe drinking water project $230m. Concessional Loan EXIM
2007 DRC Infrastructure & Mining $8.5bn. Loan EXIM
2007 Eritrea Mining $60m. Loan EXIM
2007 Eritrea Cement $45.28m. Concessional Loan EXIM
2007 Ethiopia Hydropower/Irrigation and Expansion of Cement factory
$208m. Concessional Loan EXIM
2007 Ghana Dam Infrastructure
$292m. (total committed over $600m.)
Export Credits EXIM
2007 Ghana Power $137.2m. (total cost) CADF
2007 Mozambique Infrastructure $40m. Soft loan EXIM
2007 Namibia Electronics N$1bn. Concessional Loan EXIM
2007 Nigeria Communications & Education Programme $100m. Loan EXIM
2007 Uganda ICT Backbone $106m. Loan EXIM
2007 Zambia Plant Infrastructure $206.55m. Loan EXIM
2007 Zimbabwe Agriculture $200m. Buyer’s Credit EXIM
2008 DRC Fiber Optic $33.6m. Preferential Loan EXIM
2008 Ethiopia Glass Factory
Part of a $90m. contribution to projects in 3 African countries
CADF
2008 Zimbabwe Mining
Part of a $90m. contribution to projects in 3 African countries
CADF

5.4 Integration of vectors
China has a clearly developed strategic approach towards Africa, involving multiple parties on the Chinese side. Aid and FDI are coordinated so closely that it is not clear what components of interaction with African countries can be classified as aid or FDI. The strategic objectives are twofold - to obtain long-term access to Africa’s abundant resources (oil and minerals) and to obtain Africa’s support in the global arena. Chinese aid to Africa is free of conditionality (subject to a proviso that recipient countries do not recognise Taiwan), although there have been recent signs that it is more willing to consider the quality of internal governance in some African countries (for example, providing peace-keeping forces, gentle pressures on Sudan with regard to Darfur). Insecurity in many parts of Africa is both a problem for Chinese operations and an opportunity. The opportunities are perhaps more evident, since it is the very insecurity of oil and mineral extraction in Africa (Sudan, Nigeria and the DRC) which provides the space for Chinese firms to enhance their presence.
There have been a wide range of forums designed to strengthen China Africa relationships. The largest of these was the Forum on China Africa Corporation (FOCAC). The first ministerial meeting for the Forum was held in Beijing in 2000, followed by the second in Addis Ababa in 2003. The third Forum was held in 2006, also referred to as the China-Africa Summit, which was widely seen as China’s attempt to shift up gears in its engagement with Africa.
In its engagement with Africa, China has used the three vectors of aid, trade and FDI effectively to establish relationships with governments. Chinese firms, aided by funding from the State, especially when they are investing in aid-recipient countries is just one example of how China effects relations using two vectors simultaneously.

6. India
India’s presence in Africa is distinctively different from that of its giant Asian neighbour. On the one hand, India’s presence in Africa has been built on an active diaspora community, particularly in East Africa, and the Indian Government has utilised this historical relationship to engage with Africa. On the other hand, it is only recently that India has begun to wake up to the impending shortage of many key minerals and to the energy which it requires for its sustained future economic progress.
It is one of the few countries in our case studies which has a coherent, focused strategy for key states in Africa. Financial assistance is often coupled with FDI, trade agreements, accessing markets and securing energy supplies.
The Indian government unveiled the ‘Indian Development Assistance Scheme’ in 2003. In seeking engagement with other developing companies, the promotion of Indian exports and strategic interests were given a priority. Development assistance would therefore be linked to the opening of new markets, and lines of credit would be extended where products from India are being used in the projects. India does still pursue ‘tied’ aid, but these are not tied to political or governance conditionality such as democracy or transparency, but to other FDI and Trade vectors.
Box 6.1: India - Opportunities for Africa
By comparison with China, India has woken late to the resource potential of Africa and its role as a market for Indian products. In recent years this has been rectified and India is now developing a concerted programme towards Africa, but concentrating on those countries with which it has clearly identifiable bilateral interests. This has led to a change in focus of India’s relations with Africa, away from a historic link with East Africa (with its Indian diaspora) towards West Africa and Sudan. It is now striving to integrate activities in the three vectors of trade, FDI and aid. This provides Africa with the opportunity to respond in kind, with its own focused and strategic integration of activities in these three vectors.
Trade: India is a source of demand for African products, particularly for oil and minerals, but also for some agricultural commodities such as nuts and fruit. India has the capacity to provide important inputs for Africa, including capital goods, low-price consumer goods and business services. Low cost pharmaceuticals, perhaps linked to incoming Indian FDI, represents a particular trading opportunity.
FDI: Indian firms have the capacity to assist Africa in the commodities sector, in agriculture and in the pharmaceuticals and telecommunications sectors.
Aid: Indian aid, linked to incoming FDI might contribute to enhancing infrastructure, developing mineral and oil deposits and particularly in health and pharmaceutical sectors. Technical assistance and training are also key areas for Indian technical assistance.
6.1 Trade.
India’s exports to Africa rose from $1.4bn in 1995 to $9.7bn by 2007. In 1995 imports stood at $1.7bn rising to $3.8bn by 2007. India moved from a trade deficit to a trade surplus in 2003 and has expanded that surplus to $5.9bn by 2007. India’s exports to Africa grew during the 1990s, but its imports from Africa only expanded rapidly after 2001 (Figure 6.1).

Figure 6.1: India’s trade with Africa (1990-2007) ($m)
0
2000
4000
6000
8000
10000
12000
1990 1991 1992 1993 1994 1995 1996 1997 1998 1999 2000 2001 2002 2003 2004 2005 2006 2007
Mill
ions
India Exports India Imports
Source: Calculated from Direction of Trade Statistics (IMF) database accessed via ESDS; June 2008.
The top five export destinations in Africa, accounted for 58 percent of Indian export to the continent in 2007 (Table 6.1). South Africa (20 percent) was the major destination followed by Nigeria (14 percent). South Africa, Nigeria and Egypt’s share in Indian exports has been more or less consistent over the past decade, showing little diversification into other African countries. Kenya on the other hand has lost half of its share, falling from 16 percent in 1995 to 8 percent by 2007.
Table 6.1 : Percentage Share of India’s Top Five African Export and Import Partners (2007)
Exports Imports South Africa 20 South Africa 28 Nigeria 14 Morocco 17 Egypt 10 Egypt 8 Kenya 8 Tanzania 5 Mauritius 6 Tunisia 4
Source: Calculated from Direction of Trade Statistics (IMF) database accessed via ESDS; June 2008.
South Africa is also the largest exporter in Africa to India, increasing its share from 10 percent to 28 percent between 1995 to 2007. Morocco (18-17 percent) and Egypt (5-8 percent) have held around the same share in Indian exports between 1995-2007.
Refined petroleum products were the largest Indian exports to Africa in 2006, even though their values were virtually non-existent in 2000 and before. Medication, motor vehicles and products of iron showed a modest increase over the decade, while rice exports fell from 20 percent in 1995 to 5 percent by 2006. Table 6.2 shows the share of these products over 1995-2006.

Table 6.2: Percentage Share of India’s Top Five Exports to Africa (1995-2006)
Product Category 1995 2000 2006Petroleum products, refined 0.01 0.01 25 Medicinal and pharmaceutical products 6 10 8 Rice 20 1 5 Passenger motor cars, for transport 1 0.4 4 Universals, plates, and sheets, of iron or steel 2 4 4
Source: Calculated from COMTRADE, accessed via WITS May 2008.
On the import side, as shown in table 3.5, crude petroleum and refined petroleum products were by far the largest imports from Africa, accounting for 66 percent of the imports in 2006. Gold is also an important import, worth nearly $1.5bn (10 percent) in 2006.
Table 6.3: Percentage Share of India’s Top Five Imports from Africa (1995-2006)
Product Category 1995 2000 2006 Crude petroleum and oils obtained from bituminous minerals 38 - 58 Gold, non-monetary (excluding gold ores and concentrates) 0 29 10 Petroleum products, refined 0 0 8 Inorganic chemical elements, oxides and halogen salts 21 23 5 Fruit and nuts, fresh, dried 10 10 2
Source: Calculated from COMTRADE, accessed via WITS May 2008.
India has seen significant rise in its exports to Africa of Resource Based goods. The share of Primary, Low Technology products exports have fallen over 1995-2006. The largest increase was seen in the Resource Base sector, with exports rising from 8 percent of total trade to 32 percent over 1995-2006.
The Southern African Customs Union (SACU) in 2004 began negotiating a trade agreement with India and in 2006 then Indian Prime Minister, Manmohan Singh, stated that the Indian cabinet had approved negotiations for a Preferential Trade Area (PTA)11F
12. The PTA was planned in two stages, the first beginning with specific tariff concessions on a limited list of products. The second stage would look at full free trade access. The Indian government in 2008 offered duty-free tariff preferences under the LDC preferences to 34 African nations. These preferences covered 94 percent of India's tariff lines and include products such as cotton, ready-made garments, cocoa, cashew nuts, and aluminium ore.12F
13
6.2 FDI.
India’s outward bound FDI flows rose from $6 m in 1990 to $1.4 bn. in 2002. Since then FDI outflows increased to $9.7bn by 2006. Indian FDI flows are expected to average around $13bn between 2007 and 2011, reaching $16bn by 2011.13F
14 Africa’s share in Indian total outward FDI flows is very volatile; the share of outbound Indian FDI flows to Africa was 47.8 percent in 2000, but just one percent in 200414F
15. Between 1996 and 2003, Mauritius and Sudan accounted for 9.2 percent of total FDI flows each, and were ranked 3rd and 4th for Indian FDI flow destinations respectively.
12 Mandigora (2006) 13 Vijian, P (2008) 14 EIU (2007) 15 UNCTAD FDI statistics

India FDI in Africa is concentrated in just a few countries, mainly in the East African region. However, there has been major restructuring in the past decade. In 1996, three quarter of its FDI stock in Africa was in Mauritius, followed by Morocco (11 percent), Senegal (7.5 percent) and South Africa (6.8 percent). In 2004 the absolute level of FDI stock in Senegal, South Africa and Morocco changed little, but their shares dropped to below two percent. Investment stock had moved into Sudan 46.3 percent ($912m), and Mauritius 48.2 percent ($948m).
Within Africa, between 2000 and 2004 Mauritius ($0.7bn), Sudan ($0.9bn), and Libya ($30m) were the major receivers of Indian FDI flows. Investment in Côte d’Ivoire is expected to grow to $1bn by 2011, which represents 10 percent of all Indian foreign investments over the past decade15F
16. In the case of Mauritius, it is possible that a significant proportion of this is round-tipping, encouraged further by the signing of double taxation avoidance treaty between the two countries (UNCTAD 2004).
India’s engagement strategy also seeks the creation of public private partnerships to jointly bid for projects in Africa. In April 2008 the state run export house MMTC Enterprises India announced that it would enter into a 26-74 joint venture with Tata Steel to bid for mining projects in Africa, and explore opportunities in diamond, gold, iron ore and coal mining16F
17.
Other Indian MNC’s are also having a growing presence in a number of African countries and sectors. KET International won two contracts in 2008 in Algeria ($61m) and in Namibia ($25m) for power transmission projects. Jyoti Structures, also in the power transmission sector has investments worth $24m (South Africa) and $40m (Uganda) in place17F
18.
In Sudan, Indian Oil and Natural Gas Corporation (ONGC) has invested $200m since 2007 for an oil pipeline project. In 2008 India agreed to establish a refinery in Nigeria, while buying stakes in Kenyan refineries. Furthermore Bharat Petroleum is currently investing $50m in the natural gas sector in Kenya.
One of India’s investment strategies in Africa has been the proposal of cutting out the ‘Western Middlemen’. Projects with Angola and Namibia in diamonds have agreed to trade directly with Indian companies, in return India has promised to set up upstream diamond facilities in the two countries.
India is currently looking at a $70bn merger between India's Reliance Communications and South Africa's MTN in the telecommunications sector.
ONGC has already invested $162m in the petroleum sector. A further $200m investment was made in 2006 in the Sudan Pipeline project. In 2005 the Indian government pledged $10m in subsidies and $100m in loans for Sudan. ONGC Videsh also operates in Libya, Egypt, and Congo.
6.3 Aid.
There are a variety of conflicting estimates of Indian aid to Africa. In February 2008, India announced it would increase its aid to Africa by 60 percent, amounting to $20m for 2008-09 (Bajpaee, 2008). On the other hand, the EU estimates a higher figure of around $100m per year (Altenburg and Weikert 2006:24). Others, such as Jobelius (2007), suggest even higher aid flows; around $300m per year and rising in the future. Broadman (2008) identifies $558m extended as line of credit to African countries by the Export-Import Bank of India in 2006.
16 India Frontier Advisory May 2008 17 India Frontier Advisory May 2008 18 India Frontier Advisory May 2008.

In May 2008, the Indian Prime Minister at the Africa India Summit pledged a very substantial increase in aid to the continent. This included over $500m in the next five to six years, as medium term assistance including the provision of development grants. India has already doubled the lines of credit it offers to African nations from $2.25 bn to $5.4 bn in the last five years. In 2004 India, together with eight energy and resource rich West African countries (including Senegal, Mali, Guinea-Bissau, Côte d’Ivoire, Ghana, and Burkina Faso) launched the Techno-Economic Approach for Africa–India Movement (TEAM–9). The aim was to provide assistance in low-cost technology together with investment related to infrastructure. A credit line of $500m was established under the initiative. However the utilisation of this credit by African partners is unclear.
India pledged $200m to the NEPAD process, as well as writing off debt to the value of $24m as part of the HIPC initiative. This included Mozambique, Tanzania, Uganda, Ghana and Zambia18F
19.
Much of Indian assistance takes the form of lines of credit, tied in some part to the use of Indian exports. Table 6.4 shows some of these projects in recent years and purchase of equipment from India is a common purpose of credit. The lines of credit are offered to governments and conditionalities involve supply contracts and project exports.
19 Jobelius (2007)

Table 6.4: Lines of Credit extended through the Export Import Bank of India to
African countries in recent years.
Sr. Borrower Amount of Credit (US $ Million)
Opening Date of Line of Credit
Tenor (No. of Years )
1 Sudan 350 - 12 2 Ethiopia 122 20 3 Ethiopia 65 - 20 4 Ghana 60 20 5 Sudan 52 12 6 Sudan 50 2008 11 7 Chad 50 - 20 8 Sudan 48 - 20 9 Mali 45 20
10 Sudan 42 13 11 Angola 40 2006 20 12 D. R. Congo 34 20 13 Burkina Faso 31 - 20 14 Mali 30 - 20 15 Malawi 30 To be made effective 20
16 Senegal & Mali (combined) 28 20
19 Ghana 27 2007 20 17 Cote d’Ivoire 27 - 20 18 Mali 27 - 20 20 Senegal 27 - 20 21 Cote d’Ivoire 26 To be made effective 20 22 Guinea Bissau 25 - 20 23 Mozambique 20 2008 20 24 Mozambique 20 - 20 25 Rwanda 20 To be made effective 20 26 Mozambique 20 To be made effective 20 27 Senegal 18 2007 20 28 Niger 17 - 20 29 Ghana 15 2006 7 30 Senegal 15 2007 20 31 Gabon 15 To be made effective 12 32 Equatorial Guinea 15 To be made effective 15 33 Angola 13 2010 5 34 Senegal 11 - 20
35 Central Bank of Djibouti. 10 2007 10
38 BMCE Bank, Morocco 10 2007 7
36 Zambia 10 2008 5 37 Mauritius 10 2008 10 39 Angola 10 2008 6 41 Djibouti 10 To be made effective 10 40 Senegal 10 20 42 Seychelles 8 2013 8 43 Gambia 7 20 47 Nigerian Exim Bank 5 2005 5
44 Seychelles Marketing Board 5 2006 5
45 Angola 5 2006 5 46 Lesotho 5 2007 15
Source: Adapted from 0Hhttp://www.eximbankindia.com/loc.asp, accessed July 2008.

In addition to financial assistance through lines of credit, India also provides technical assistance and training. Technical training in India has been provided to 1,000 African citizens. An estimated 15,000 students of African origin are currently studying in India (Thakurta, 2008). Technical assistance and expertise are also provided for projects and planning to many African countries. Table 6.5 lists some of the recent projects being carried out in Africa with assistance from India.
Table 6.5: African Projects Undertaken with Indian Assistance
Country Project Mozambique, Ethiopia Rural Electrification Senegal, Mali Railways Congo Cement Lesotho Computer Training Ghana National Assembly Building Sierra Leone Military Barracks Nigeria Nigeria Machine Tools Senegal Entrepreneurship Development Centre Ghana Kofi Annan IT Centre for Excellence Mauritius Ebene Cyber City Project Namibia Plastic Technology Centre Burkina Faso India Farmers Project Senegal Village Electrification Projects Ethiopia Gandhi Memorial Hospital Malawi Lilongwe Water Supply System
Source: Thakurta (2008) and India Ministry of External Affairs (2006)
6.4 Integration of vectors.
India’s forays into the continent have not received the same attention as those of China, but nonetheless India is fairly active in the continent. Benefitting from an Indian immigrant population that settled in Africa generations ago, the Diaspora effect on trade aid and FDI is likely to be strong.
Historically, there has been little integration of trade, FDI and aid by India in Africa. However, in very recent years this has changed significantly. As part of a broad strategic agenda, India has diversified outside of its diaspora base in East Africa and moved decisively into the oil and iron ore producing regions of West Africa, Sudan and Libya, and in transport in the Sudan and Senegal. In each case, aid and FDI have been bundled together in a package, and the Indian state has also played a role as an investor in collaboration with one of its largest firms. Indian firms, too, show a growing interest in Africa, in telecommunications in South Africa and in pharmaceuticals in Uganda, Kenya and Tanzania.
The use of the three vectors of aid, FDI and trade together is seen in the case of Senegal. The Indian automobile giant Tata has benefited from contracts arising from the restructuring of public transport facilities there. At the same time India is also one of the largest non western donors and the largest export destination for Senegal.19F
20 The Indian state-controlled oil company ONGC Videsh is also an example of the three vectors being used strategically by India. The company is a permanent participant in all interactions concerning Indian overseas petroleum business and the Joint Working Groups of the Government of India.20F
21 Therefore it has direct input in all policy matters related to trade and aid with Africa.
India also tends to have a more focused approach towards the countries it chooses to pursue than does China. For example, when India held its first India-Africa Forum summit in 2008, only 14 key countries were invited from Africa to New Delhi. This was the first summit of its nature in Indian African relations, but is expected to become a regular feature in times ahead, as India attempts to increase its access and engagement with the continent.
One of India’s concerns is the growing influence of China on the continent and some of the measures, such as the India-Africa forum are widely seen as an attempt to counteract that influence. Until 2003, India’s Foreign Ministry had a single African division. It has now expanded to one division each for West and Central Africa, East and Southern Africa and West Asia and North Africa. In 2008, Indian diplomatic missions will open in Burkina Faso, Gabon, Mali and Niger21F
22.
20 Jobelius(2007) 21 Company websites and Reuters 22 India Frontier Advisory May 2008
7. Malaysia
Malaysia’s engagement with Africa has largely been under the umbrella of South-South cooperation. Malaysia believes it can help others, especially those who share a colonial past, where cooperation can work for the benefit of both.
Most of the assistance provided to Africa has been on a technical level and has taken the form of training and guidance with matters of planning and finance. Bilateral engagement is now emerging – previously, engagement was mainly in multilateral fora.
Malaysia, traditionally a large oil producer is now seeking oil resources elsewhere as well. Its main engagement with Africa has been through FDI, and the main interest has remained oil . On the export side Malaysia is increasingly exporting medium technology products to Africa, to tap into the growing market
Box 7.1. Malaysia -Opportunities for Africa:
Malaysia is not a significant player in the African context, with historical links confined to Mauritius and South Africa. The major strategic opportunity for Africa is to use the Malaysian state-owned oil company as a bargaining chip in relations with oil firms from other countries, and to take advantage of Malaysian expertise in vegetable oils and timber.
Trade: Market opportunities for export diversification in sectors other than mineral resource based products.
FDI: Learning and finance in the Oil, palm-oil and timber sectors
Aid: Malaysia has competences in sectors which provide an opportunity for African to learn from, notably oil-extraction, palm-oil and timber. The uplifting of formerly disadvantaged groups has been an important role-model for South Africa and lends itself as an exemplar for other African countries.
7.1. Trade.
Malaysia’s exports to Africa grew from $0.8bn. in 1995 to $2.9bn. by 2007. Imports rose to a lesser degree, from $0.4bn. to $1.8bn. over 1995-2007. Increasing exports to Africa began in 2001, followed by an increase in imports from 2003.

Figure 7.1: Malaysia’s trade with Africa (1990-2007) ($m)
0
500
1000
1500
2000
2500
3000
3500
1990 1991 1992 1993 1994 1995 1996 1997 1998 1999 2000 2001 2002 2003 2004 2005 2006 2007
Mill
ions
Malaysia Exports Malaysia Imports
Source: Calculated from Direction of Trade Statistics (IMF) database accessed via ESDS; June 2008.
South Africa is the largest trading partner for Malaysia both in terms of exports and imports (Table 7.1). South Africa and Egypt, Malaysia’s primary markets in Africa have seen a declining share in its share in Malaysian exports, falling from 32 percent to 28 percent and 29 percent to 17 percent respectively between 2000 to 2007. Exports to South Africa are primarily manufactures and machinery and transport equipment, while those to Egypt are manufactures and agricultural materials. Malaysia’s exports to other African countries cover a diverse range of products (Table 7.2), within which Palm Oil (27 percent) has retained its share and position as the top export commodity over the decade. Apart from vegetable oils, there is no single product which has a significant share of exports, showing a diverse product structure for Malaysian exports to Africa. Benin has seen a recent increase, from having no share in 2000 to accounting for seven percent of Malaysian exports to Africa in 2007.

Table 7.1: Percentage Share of Malaysia’s Top Five African Export and Import Partners (2007)
Exports Imports South Africa 28 South Africa 27 Egypt 17 Gabon 23 Benin 7 Ghana 7 Tanzania 4 Egypt 5 Ghana 4 Côte d'Ivoire 4
Source: Calculated from Direction of Trade Statistics (IMF) database accessed via ESDS; June 2008.
In 2007, South Africa (27 percent) and Gabon (23 percent) together accounted for half Malaysia’s imports from Africa (Table 7.1). The bulk of Malaysian exports in 2006 were in the resource based sector (44 percent); which in this case comprises mainly of vegetable oil and wood related products (Table 7.2). . Medium Technology products are the second largest category, rising from 14 percent of exports in 1995 to 21 percent in 2006. Low technology products have also increased their share from 9 percent to 15 percent. (1995-2006).
Table: 7.2. Percentage Share of Malaysia’s Top Five Exports to Africa (1995-2006)
Product Category 1995 2000 2006 Other fixed vegetable oils, fluid or solid, crude, refined 29 27 27 Animal and vegetable oils and fats, processed, and waxes 15 10 7 Ships, boats and floating structures 3 0 3 Polymerization and copolymerization products 0 1 3 Furniture and parts thereof 0 2 3
Source: Calculated from COMTRADE, accessed via WITS May 2008.
There has been a significant change in the nature of Malaysia’s imports from Africa and four of the top five commodity imports from Africa in 2006 were not evidenced in the earlier half of the last decade (Table 7.3). Cocoa, Aluminium, Oil and Iron products rose from nearly nothing in 1995 to 24 percent, 11 percent, 11 percent and eight percent of African Exports to Malaysia respectively in 2006. Copper imports on the other hand have decreased, dropping from 16 percent in 1995 to 8 percent in 2006. For South Africa, Ores and Metals account for nearly half of Malaysia’s imports from the country.

Table 7.3 Percentage Share of Malaysia’s Top Five Imports from Africa (1995-2006)
Product Category 1995 2000 2006 Cocoa 1 1 24Aluminium 0 22 11Crude petroleum and oils obtained from bituminous minerals 0 0 11Universals, plates, and sheets, of iron or steel 0 1 8Copper 16 7 8
Source: Calculated from COMTRADE, accessed via WITS May 2008.
7.2 FDI.
In 2004, Total Malaysian outward FDI stocks was valued at $12.8bn.; $1.9bn. (14.7 percent) of this was in Africa (Table 7.4). The main destination for these stocks were concentrated Mauritius (33 percent) and South Africa (24 percent).
Table 7.4: Distribution of Malaysian Outward FDI Stock in Africa by Country (2004)
Country Percent Share
Mauritius 33South Africa 24Sudan 17Chad 10Egypt 5Namibia 5Ghana 3Other 3
Source: UNCTAD (2007)
Malaysia’s global FDI flows rose from $129m. in 1990 to $1.9bn in 2000 and to $6bn in 2006, but are expected to average around $3.4bn per year between 2007 and 201122F
23. Africa’s share in outbound Malaysian FDI flows is relatively high, rising from $1.1m. (1.1 percent of the total) in 1991 to $176m. (8.5 percent of the total) in 2004 (Table 7.5).
23 EIU (2007)
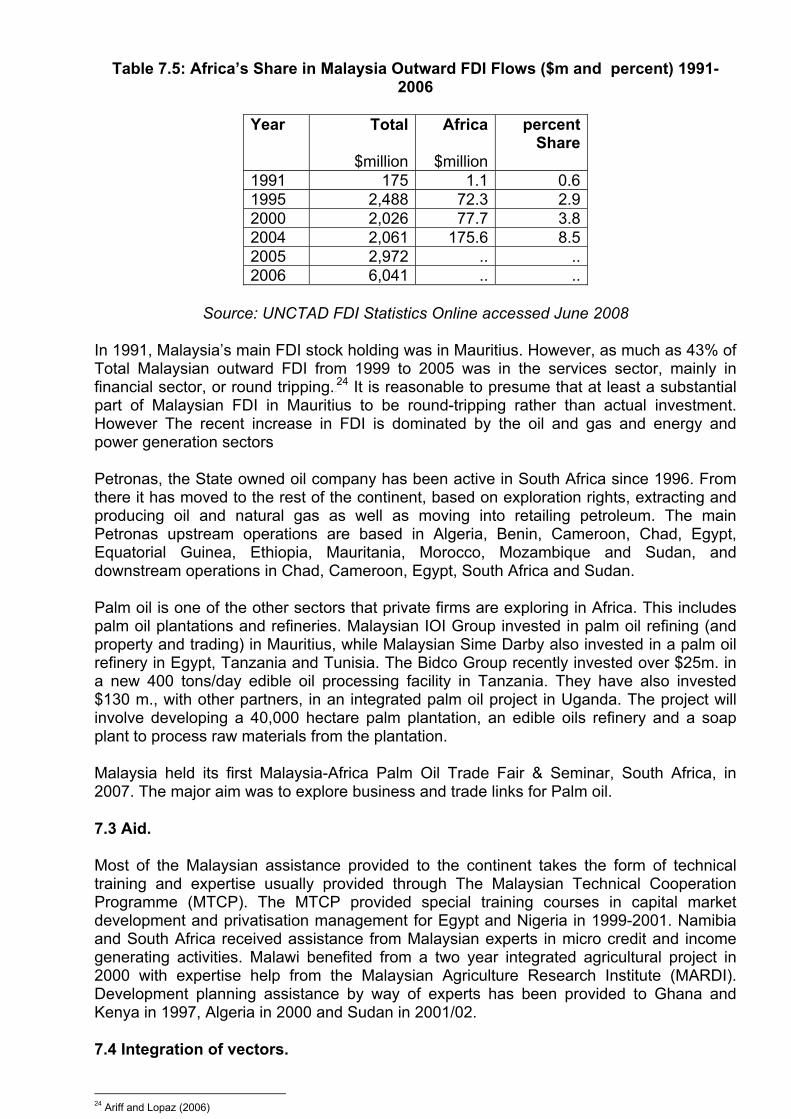
Table 7.5: Africa’s Share in Malaysia Outward FDI Flows ($m and percent) 1991-
2006
Year Total
$million
Africa
$million
percent Share
1991 175 1.1 0.6 1995 2,488 72.3 2.9 2000 2,026 77.7 3.8 2004 2,061 175.6 8.5 2005 2,972 .. .. 2006 6,041 .. ..
Source: UNCTAD FDI Statistics Online accessed June 2008
In 1991, Malaysia’s main FDI stock holding was in Mauritius. However, as much as 43% of Total Malaysian outward FDI from 1999 to 2005 was in the services sector, mainly in financial sector, or round tripping.23F
24 It is reasonable to presume that at least a substantial part of Malaysian FDI in Mauritius to be round-tripping rather than actual investment. However The recent increase in FDI is dominated by the oil and gas and energy and power generation sectors
Petronas, the State owned oil company has been active in South Africa since 1996. From there it has moved to the rest of the continent, based on exploration rights, extracting and producing oil and natural gas as well as moving into retailing petroleum. The main Petronas upstream operations are based in Algeria, Benin, Cameroon, Chad, Egypt, Equatorial Guinea, Ethiopia, Mauritania, Morocco, Mozambique and Sudan, and downstream operations in Chad, Cameroon, Egypt, South Africa and Sudan.
Palm oil is one of the other sectors that private firms are exploring in Africa. This includes palm oil plantations and refineries. Malaysian IOI Group invested in palm oil refining (and property and trading) in Mauritius, while Malaysian Sime Darby also invested in a palm oil refinery in Egypt, Tanzania and Tunisia. The Bidco Group recently invested over $25m. in a new 400 tons/day edible oil processing facility in Tanzania. They have also invested $130 m., with other partners, in an integrated palm oil project in Uganda. The project will involve developing a 40,000 hectare palm plantation, an edible oils refinery and a soap plant to process raw materials from the plantation.
Malaysia held its first Malaysia-Africa Palm Oil Trade Fair & Seminar, South Africa, in 2007. The major aim was to explore business and trade links for Palm oil.
7.3 Aid.
Most of the Malaysian assistance provided to the continent takes the form of technical training and expertise usually provided through The Malaysian Technical Cooperation Programme (MTCP). The MTCP provided special training courses in capital market development and privatisation management for Egypt and Nigeria in 1999-2001. Namibia and South Africa received assistance from Malaysian experts in micro credit and income generating activities. Malawi benefited from a two year integrated agricultural project in 2000 with expertise help from the Malaysian Agriculture Research Institute (MARDI). Development planning assistance by way of experts has been provided to Ghana and Kenya in 1997, Algeria in 2000 and Sudan in 2001/02.
7.4 Integration of vectors.
24 Ariff and Lopaz (2006)

Malaysian integration with Africa has been limited in the past decades. South Africa alone can account for a major share of Trade and FDI. Malaysia’s engagement with African countries has usually been through multilateral forums, such as the Asia-Africa summit, held in 2005. Malaysia has also initiated the Southern African International Dialogue in 2005, which focuses on building one-to-one relationships and networks under the wider SMART umbrella. SMART dialogues are an initiative of the Commonwealth focusing on approaches and innovations related to development. Such forums are important to allow for progress towards the formation of bilateral relations.
On the trade and FDI side, Malaysia and Africa share many commodities where the latter can learn from experiences of the former. For example, Malaysia is an oil producer and already has investments related to the oil sector in Africa, and Malaysia possesses a well-developed timber and associated products sector. The Malaysian MNC presence in Africa is by a state owned company, which may offer a different management perspective to the stock listed /private MNC’s operating in the oil sector in Africa.
Business relations can be explored and strengthened through forums such as The Malaysian South-South Corporation. Established in 1992, as a consortium comprising 85 Malaysian shareholders, it has established Malaysia-South Africa Business Council in Malaysia as well as the Malaysian Business Centre in Kampala, Uganda in August 2001. The organisation’s main aim is to explore and promote trade and investment opportunities in new markets, particularly the emerging markets. It also acts as a vehicle for trade promotions, exports and investments as well as the transfer of technical and management expertise to the host countries.

8. The Russian Federation
8.1 Trade.
Historically, in the period of the Soviet Union, trade was directed by the state. There were bilateral trade contracts between the Union and the countries, often based on barter trade. Since the emergence of Russian Federation, trade has moved more decisively towards firm and individual trade contracts. Russia’s exports and imports from Africa were fairly low until 2001, whereafter exports started to rise, with imports taking a little longer (2003) to follow suit.
Exports from Russia to the African continent have increased $0.67bn. in 1995 to $3.9bn. by 2007. Imports have risen from $0.18bn. to $1.5bn. over the same period. Russia’s trade surplus has grown over the years, increasing from $0.48bn. in 1995 to US 2.43bn. in 2007 (Figure 8.1). Russia’s exports to Africa grew steadily during the 1990s, and then expanded rapidly after 2001. Imports from Africa have only begun to grow in recent years.
Box 8.1: Opportunities for Africa – The Russian Federation The former Soviet Union’s relationship with Africa goes back to the Cold War, where aid and trade were often used as a means of political influence. With the collapse of the Soviet Union, the Russian Federation was facing economic recession and recovering from the loss of satellite states; Africa was largely ignored. However in the 2000’s Russia began to emerge, engage and reinforce its political influence. As Russia moves towards regaining its status, Africa again has come into focus. Increasing its influence, to balance power not only with the West, but the rising powers of China and India, Russia is again looking for allies to realize its Super Power status. Trade: There is scope for Africa to expand commodity exports to Russia, including both tropical agricultural commodities and minerals. Russia is one of the world’s major grain producers, and is a potential source of supply for Africa. FDI: Russian firms are keen to develop links with new producers in order to provide new power-bases against the major global resources MNCs. They are open to alliances with African partners, as occurs in the case of the global diamond cartel. Aid: Hitherto, Russia has mostly been a source of aid to Africa through multilateral agencies. There may be some scope for leveraging bilateral aid by resource-rich countries.

Figure 8.1: Russia’s trade with Africa (1990-2007) ($m).
0
500
1000
1500
2000
2500
3000
3500
4000
4500
1990 1991 1992 1993 1994 1995 1996 1997 1998 1999 2000 2001 2002 2003 2004 2005 2006 2007
Mill
ions
Russia Exports Russia Imports
Source: Calculated from Direction of Trade Statistics (IMF) database accessed via ESDS; June 2008.
Russia’s exports and imports from Africa have tended to remain concentrated in particular countries over the past decade, mostly in North Africa (Table 8.1). Egypt has been Russia’s largest export partner on the continent since 1997, and accounts for the majority of Russia’s exports to Africa in 2007 (37 percent). Most of the exports to Egypt are agricultural materials and food. On the other hand Algeria (24 percent), Tunisia (10 percent) and Morocco (9 percent) are all seeing increasing shares with manufactures as the major components of Russian exports.
Table 8.1: Percentage Share of Russia’s Top Five African Export and Import Partners (2007)
Exports Imports Egypt 37 Morocco 22Algeria 24 Guinea 14Tunisia 10 South Africa 13Morocco 9 Côte d'Ivoire 12Nigeria 5 Egypt 11
Source: Calculated from Direction of Trade Statistics (IMF) database accessed via ESDS; June 2008.
On the import side, the stronger partners in 1995, Egypt (20 percent) and South Africa (37 percent), have been losing share over the past decade. By 2007, they accounted for 11 percent and 13 percent respectively, of Russian imports from Africa. Morocco now accounts for the largest share, rising from just 3 percent in 1995 to 22 percent by 2007.
Russian Exports to Africa cover a wide range of products as shown in Table 8.2. The top five products are all resource-based goods, a similar (albeit somewhat more processed ) export structure to that of Africa. In 2006 Iron ingots (18 percent), wheat (18 percent) and wood products (11 percent) form nearly half of Russian exports to the continent.

Table 8.2: Percentage Share of Russia’s Top Five Exports to Africa (1995-2006)
Product Name 2000 2003 2006Ingots and other primary forms, of iron or steel 21 13 18Wheat and meslin, un-milled 0 15 18Wood, simply worked, and railway sleepers of wood 9 12 11Petroleum products refined 3 5 6Crude petroleum and oils obtained from bituminous minerals 1 5 5
Source: Calculated from COMTRADE, accessed via WITS May 2008.
Table 5.5 shows the major products imported from Africa by Russia. Ores and Concentrates of Base metals were one of the largest categories of product to be imported into Russia. However their share has decreased from 26 percent in 2000 to 15 percent in 2006. Fruits and nuts on the other hand have increased their share (from 16 percent to 29 percent) over the same time to become the largest imported product from Africa by 2006. Cocoa’s share has fallen from 24 percent to 14 percent in imports, while Tobacco (9 percent) has remained fairly stable over the 2000’s.
Table 8.3: Percentage Share of Russia’s Top Five Imports from Africa (1995-2006)
Product Name 2000 2003 2006Ores and concentrates of base metal 26 13 15Fruit and nuts, fresh, dried 16 25 29Cocoa 24 24 14Tobacco unmanufactured; tobacco refuse 10 11 9Inorganic chemical elements, oxides and halogen salts 0 0 2
Source: Calculated from COMTRADE, accessed via WITS May 2008.
8.2 FDI.
Russia’s outward FDI flows increased from $606m in 1995 to $3.2bn in 2000. In 2006 they were valued at $18bn. and are expected to rise further to $26bn. by 201124F
25. However it is widely recognised (Kalotay; 2005) that much of the initial outflow of funds during the 1990s reported as FDI was in fact capital flight. It is towards the 2000’s that capital flight declined and private investment flows abroad took the form of productive assets.
The majority of private FDI flows are from Russian mining and oil companies, and therefore most of the Russian-African ventures are also in the mining and exploration fields. This is supported by the instances of Russian FDI in Africa, which appear to be exclusively in these sectors (Table 8.4). Marks (2008) reports on Russian Metal companies investment to be over $5 bn. in SSA over the last three years. Russian oil companies have also signed contracts in Algeria, Nigeria, Angola and Egypt valued above $3 bn.
25 EIU (2007)
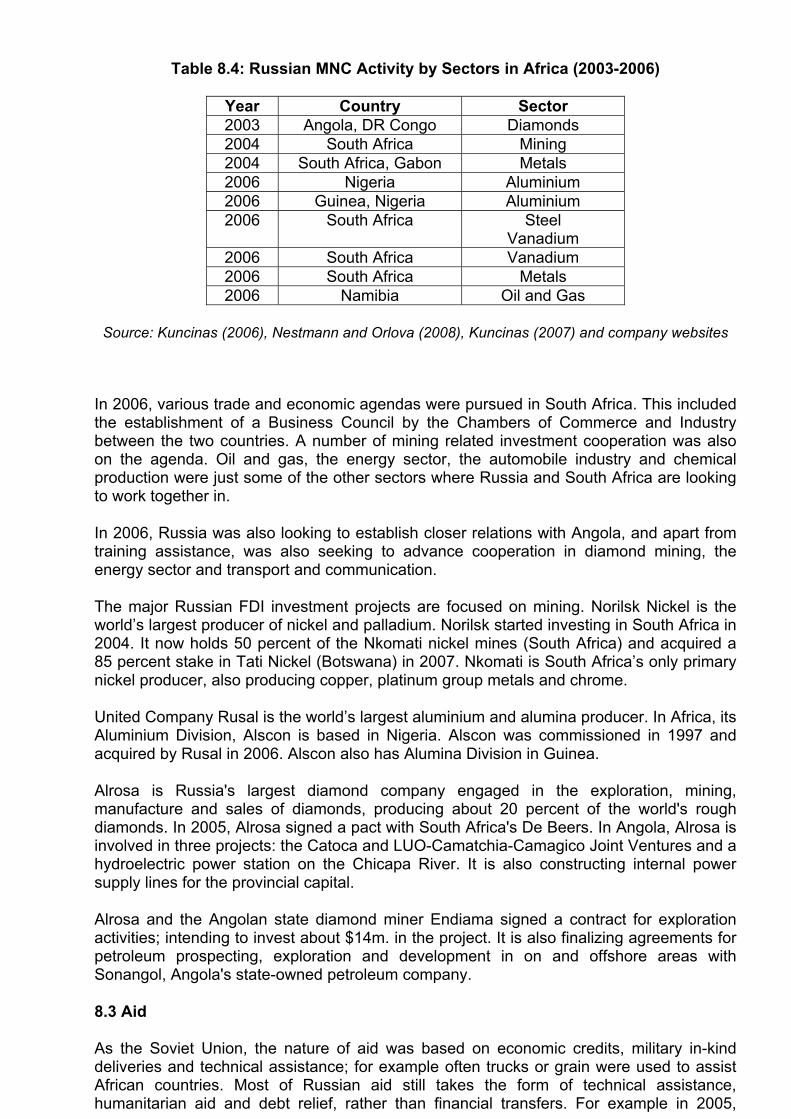
Table 8.4: Russian MNC Activity by Sectors in Africa (2003-2006)
Year Country Sector 2003 Angola, DR Congo Diamonds 2004 South Africa Mining 2004 South Africa, Gabon Metals 2006 Nigeria Aluminium 2006 Guinea, Nigeria Aluminium 2006 South Africa Steel
Vanadium 2006 South Africa Vanadium 2006 South Africa Metals 2006 Namibia Oil and Gas
Source: Kuncinas (2006), Nestmann and Orlova (2008), Kuncinas (2007) and company websites
In 2006, various trade and economic agendas were pursued in South Africa. This included the establishment of a Business Council by the Chambers of Commerce and Industry between the two countries. A number of mining related investment cooperation was also on the agenda. Oil and gas, the energy sector, the automobile industry and chemical production were just some of the other sectors where Russia and South Africa are looking to work together in.
In 2006, Russia was also looking to establish closer relations with Angola, and apart from training assistance, was also seeking to advance cooperation in diamond mining, the energy sector and transport and communication.
The major Russian FDI investment projects are focused on mining. Norilsk Nickel is the world’s largest producer of nickel and palladium. Norilsk started investing in South Africa in 2004. It now holds 50 percent of the Nkomati nickel mines (South Africa) and acquired a 85 percent stake in Tati Nickel (Botswana) in 2007. Nkomati is South Africa’s only primary nickel producer, also producing copper, platinum group metals and chrome.
United Company Rusal is the world’s largest aluminium and alumina producer. In Africa, its Aluminium Division, Alscon is based in Nigeria. Alscon was commissioned in 1997 and acquired by Rusal in 2006. Alscon also has Alumina Division in Guinea.
Alrosa is Russia's largest diamond company engaged in the exploration, mining, manufacture and sales of diamonds, producing about 20 percent of the world's rough diamonds. In 2005, Alrosa signed a pact with South Africa's De Beers. In Angola, Alrosa is involved in three projects: the Catoca and LUO-Camatchia-Camagico Joint Ventures and a hydroelectric power station on the Chicapa River. It is also constructing internal power supply lines for the provincial capital.
Alrosa and the Angolan state diamond miner Endiama signed a contract for exploration activities; intending to invest about $14m. in the project. It is also finalizing agreements for petroleum prospecting, exploration and development in on and offshore areas with Sonangol, Angola's state-owned petroleum company.
8.3 Aid
As the Soviet Union, the nature of aid was based on economic credits, military in-kind deliveries and technical assistance; for example often trucks or grain were used to assist African countries. Most of Russian aid still takes the form of technical assistance, humanitarian aid and debt relief, rather than financial transfers. For example in 2005,

Russia established a joint aircraft building venture with Egypt, as well as plans for a Russian Egypt University in Cairo.
Evidence of direct bilateral assistance is weak. It is in humanitarian assistance that we find evidence of direct transfers to African states, with Algeria receiving $7.6m. in 2002, and Ethiopia and Eritrea receiving $5.3m. in 2003. Libya benefited from a $ 4.5 bn. debt cancelation in 2006.
The majority of aid and assistance to Africa is provided through international organisations and funds including the UN. Russia cancelled $20 bn of African debt through the HIPC initiative. Assistance for health care was provided through a contribution of $30m. to The Global Fund to fight Aids Tuberculosis and Malaria in 2001-2006. In 2007 further contributions of nearly $86m. were made. In 2005, $8m. were pledged to the World Initiative to Liquidate Polio. As Table 8.5 shows, the majority of Aid was through multilateral agencies.

Table 8.5: Russian ODA to Africa 1996-2008 ($million)
Year Type of ODA Amount in $ Remark
1996 Training national humanitarian and rescue staff at Kavumu Polytechnic Centre (Rwanda) 1m. until 2000
1998 Debt-relief 7.8bn. until 2001 2001 Global Health Fund 20m. 2002 Training of 10 peacekeepers from Nigeria n.a. Training of 4 peacekeepers from Rwanda n.a. Global Fund for Aids Tuberculosis and Malaria 20m. until 2006 Humanitarian aid for emergency relief to Algeria 7.6m. Debt-relief 3.4bn.
2003 Shipment of automotive spare parts to Kavumu Polytechnic Centre (Rwanda)
HIPC trust contribution 10m.
IMF AFRITAC programme (regional technical assistance centres) 0.25m. until 2005
Humanitarian aid for emergency relief to Ethiopia and Eritrea 5.3m.
Humanitarian aid for emergency relief to Angola (WFP) 1m. UNHCR for Africa 2m. 2004 Humanitarian aid for emergency relief to Morocco 0.5m. 2005 Global Fund contribution 40m.
220 Russian peacekeeping staff are deployed in UN operations in Africa
training African peacekeepers HIPC Initiative 2.2bn. Debt-relief 9.1bn. HIPC trust contribution 15m. Global Fund for Aids Tuberculosis and Malaria 20m. until 2008 World Initiative to Liquidate Polio 8m. Regular contributions to UN WFP 2006 Global Fund reimbursement 270m. until 2010 Global Polio Eradication Initiative 18m. Advance Market Commitments 45m.
World Bank co-operation on 'debt-for-development' swap program 250m.
IDA (49 percent to SSA) 60m. until 2014
2007 Russia-World Bank-WHO initiative: World Bank Booster Program 15m.
Russia-World Bank-WHO initiative: WHO Global Malaria Program 4m.
Russia-World Bank-WHO initiative: Staff Development Program 1m.
Debt-relief for Afghanistan 10bn. Debt-relief for Iran* 10bn. 2008 Development assistance to Africa 500m. unknown
Russia-World Bank cooperation 'debt-for-development-swap' 250m.
World Bank Malaria Booster Program n.a. until 2010
Sources: Vasiliev, (2005), Ministry of Foreign Affairs of the Russian Federation and The Kremlin (accessed 2008)

8.4 Integration of vectors.
The Soviet Union’s relations with Africa were conditioned by the Cold War but as Russia’s re-emergence slowly gains momentum, the relationship with Africa is based on new directions and motivations.
There are few signs of integration between trade, FDI and aid vectors in Russia’s relations with Africa. Russia’s association with Africa has initially been negligible in Aid, FDI and Trade, though it is now beginning to change. Russian exports to the continent are focused primarily on the North African countries, and comprise mainly hard and soft commodities. FDI has been focused on the resource rich countries, and are all in the mining sector. Aid is mostly being directed through multilateral organisations, and Technical Corporation is being used to form bilateral relationships. There are few signs of integration between trade, FDI and aid vectors in Russia’s relations with Africa.
There are numerous opportunities for African countries that can be exploited. Given that Russia is an oil and metal rich country, its imports from Africa comprise mainly agricultural products. This provides an opportunity for the non-resource rich African countries to tap and expand into a larger Russian market. Whereas other countries have concentrated on the oil rich African countries, the non oil sector can gain from focusing on the Russian market.
The resource-rich African countries also have favourable opportunities. Russia is a large mineral economy itself and is looking to establish its presence as an energy and mineral resource leader in the world. Russian MNC’s emerging from a centrally controlled business environment are now looking to secure their long-term access to inputs. Heavy investment in the mining sector in Africa is largely seen as an attempt to secure such supply lines.
Russian Mining FDI is motivated by two major factors. First; Russian firms are now moving from a centrally planned economy where supply security was virtually guaranteed, to one where they have to secure their own production chain. Secondly, in a global environment of consolidation, the Russians are looking to expand their own business ventures to avoid being ‘eaten up’ by other larger firms.
Both these motivations can work in favour of the resource rich countries. Russian firms bring with them management experience of working in harsh environments, business and otherwise. This allows them to move into smaller African countries that other westerns companies may deem as too risky. The oil and metal price boom also allows them to bring much needed liquidity into their ventures. Small and medium mining firms in Africa can benefit from this; becoming part of larger more resourceful firms.
However much remains to be done on the Africa-Russia front. President Putin’s state visits to South Africa and Morocco in 2006, were steps in the right direction. Russia has recently granted GSP status to African imports. African goods are being exempted from quota limitations as well as anti-dumping, countervailing and special protective measures. This should encourage increased exports for Africa. FDI needs to diversify in non mining sectors, and attempts are already underway between South Africa and Russia to invest in the automobile sector.
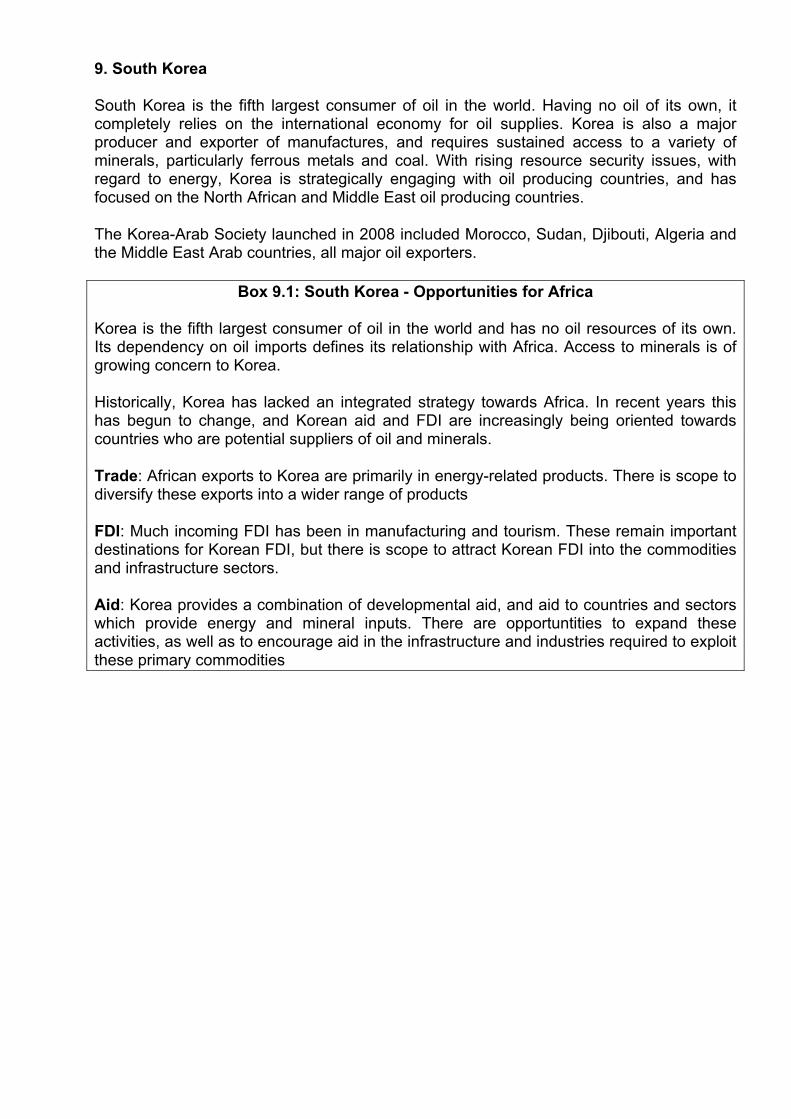
9. South Korea
South Korea is the fifth largest consumer of oil in the world. Having no oil of its own, it completely relies on the international economy for oil supplies. Korea is also a major producer and exporter of manufactures, and requires sustained access to a variety of minerals, particularly ferrous metals and coal. With rising resource security issues, with regard to energy, Korea is strategically engaging with oil producing countries, and has focused on the North African and Middle East oil producing countries.
The Korea-Arab Society launched in 2008 included Morocco, Sudan, Djibouti, Algeria and the Middle East Arab countries, all major oil exporters.
Box 9.1: South Korea - Opportunities for Africa
Korea is the fifth largest consumer of oil in the world and has no oil resources of its own. Its dependency on oil imports defines its relationship with Africa. Access to minerals is of growing concern to Korea.
Historically, Korea has lacked an integrated strategy towards Africa. In recent years this has begun to change, and Korean aid and FDI are increasingly being oriented towards countries who are potential suppliers of oil and minerals.
Trade: African exports to Korea are primarily in energy-related products. There is scope to diversify these exports into a wider range of products
FDI: Much incoming FDI has been in manufacturing and tourism. These remain important destinations for Korean FDI, but there is scope to attract Korean FDI into the commodities and infrastructure sectors.
Aid: Korea provides a combination of developmental aid, and aid to countries and sectors which provide energy and mineral inputs. There are opportuntities to expand these activities, as well as to encourage aid in the infrastructure and industries required to exploit these primary commodities

9.1 Trade
South Korea’s exports to Africa stood at $3.1bn in 1995, rising to $11.1bn by 2007. On the import side, 1995 imports rose from $2.3bn to $6.28bn in 2007. Korea has maintained a trade surplus with Africa, rising from $0.74bn in 1995 to $4.8bn in 2007 (Figure 9.1).
Figure 9.1: Korea’s trade with Africa (1990-2007) ($m)
0
2000
4000
6000
8000
10000
12000
1990 1991 1992 1993 1994 1995 1996 1997 1998 1999 2000 2001 2002 2003 2004 2005 2006 2007
Mill
ions
Korea Imports Korea Exports
Source: Calculated from Direction of Trade Statistics (IMF) database accessed via ESDS; June 2008.
Most of Korea’s “exports” to Africa comprise shipping products, and its largest export market in Africa is Liberia (Table 9.1), a flag of convenience for much of the world’s shipping fleet. Next to shipping in importance are exports of automobiles. South Africa is its second largest export partner in 2007 (18 percent), with the bulk of trade in Machinery and Transport equipment. Angola has increased its importance as a market, from one percent to 11 percent of exports, while Egypt has lost share from 16 percent to 6 percent over 2000 and 2007.
Table 9.1: Percentage Share of Korea’s Top Five African Export and Import Partners (2007)
Exports Imports Liberia 31 South Africa 25 South Africa 18 Congo, Republic of 14 Angola 11 Nigeria 11 Egypt 8 Algeria 10 Nigeria 8 Egypt 8
Source: Calculated from Direction of Trade Statistics (IMF) database accessed via ESDS; June 2008.
Although South Africa remains the largest African exporter to Korea, its share has decreased from 54 percent in 1995 to 25 percent in 2007 (Table 9.1). Ores and Metals are the largest category of exports from South Africa. In the case of the Congo (14 percent), although Ores and Minerals form a small part of Korean imports, the majority of the value is accounted for by Oil related products. Algeria (10 percent) and Nigeria (11 percent) were the other important African Exporters to South Korea in 2007.
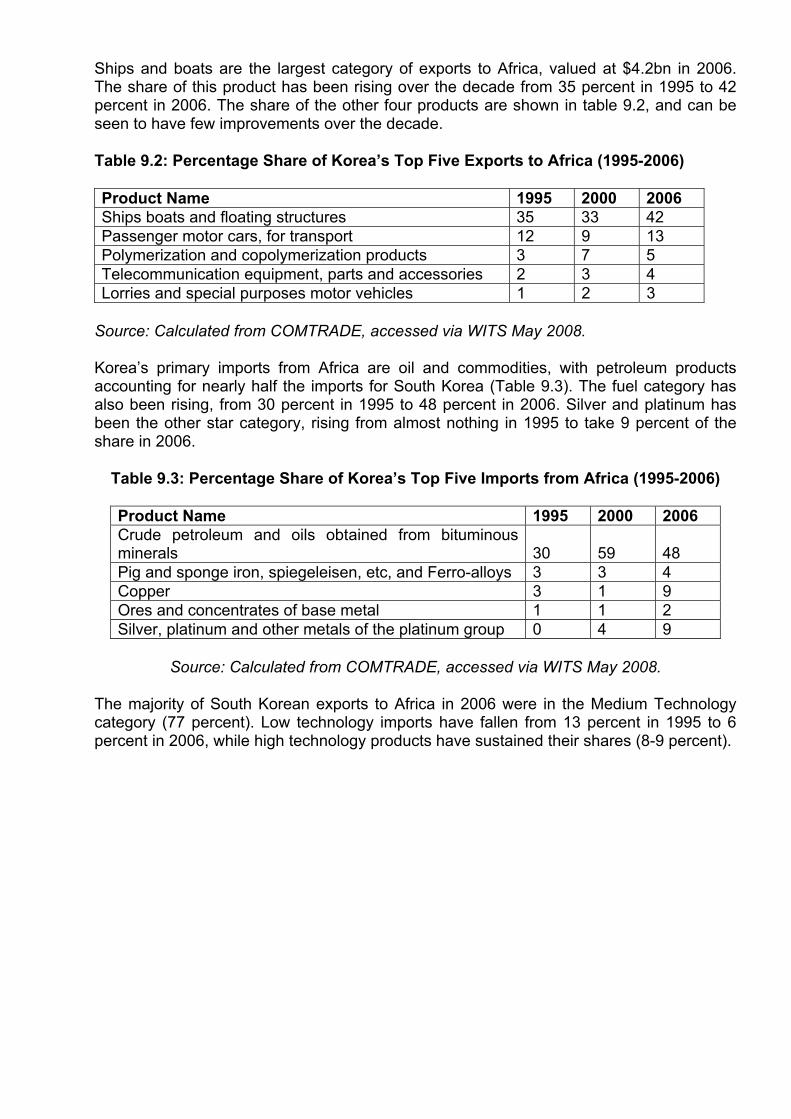
Ships and boats are the largest category of exports to Africa, valued at $4.2bn in 2006. The share of this product has been rising over the decade from 35 percent in 1995 to 42 percent in 2006. The share of the other four products are shown in table 9.2, and can be seen to have few improvements over the decade.
Table 9.2: Percentage Share of Korea’s Top Five Exports to Africa (1995-2006)
Product Name 1995 2000 2006 Ships boats and floating structures 35 33 42 Passenger motor cars, for transport 12 9 13 Polymerization and copolymerization products 3 7 5 Telecommunication equipment, parts and accessories 2 3 4 Lorries and special purposes motor vehicles 1 2 3
Source: Calculated from COMTRADE, accessed via WITS May 2008.
Korea’s primary imports from Africa are oil and commodities, with petroleum products accounting for nearly half the imports for South Korea (Table 9.3). The fuel category has also been rising, from 30 percent in 1995 to 48 percent in 2006. Silver and platinum has been the other star category, rising from almost nothing in 1995 to take 9 percent of the share in 2006.
Table 9.3: Percentage Share of Korea’s Top Five Imports from Africa (1995-2006)
Product Name 1995 2000 2006 Crude petroleum and oils obtained from bituminous minerals 30 59 48 Pig and sponge iron, spiegeleisen, etc, and Ferro-alloys 3 3 4 Copper 3 1 9 Ores and concentrates of base metal 1 1 2 Silver, platinum and other metals of the platinum group 0 4 9
Source: Calculated from COMTRADE, accessed via WITS May 2008.
The majority of South Korean exports to Africa in 2006 were in the Medium Technology category (77 percent). Low technology imports have fallen from 13 percent in 1995 to 6 percent in 2006, while high technology products have sustained their shares (8-9 percent).
9.2 FDI
South Korea’s FDI outflows increased from $1bn in 1990 to nearly $5bn in 2000 and $7bn in 2006. FDI outflows are expected to increase at an annual average by the same amount from 2007 to 201125F
26.
Korean FDI flows to Africa rose from $84m in 1993 to $249m in 2005. Africa’s share in Korean FDI flows has fluctuated over the years, from 4.2 percent in 1993 to 2.7 percent in 2005. In 2002, of the Korean FDI stock in Africa ($265m), the major shares were in Sudan (22 percent), Algeria (21 percent), Egypt (21 percent), South Africa (15 percent), Morocco (8 percent) and Cote d’Ivoire (7.6 percent)26F
27. Despite Korea’s focus on securing energy, most of Korean FDI into Africa in recent years has been in the minerals and tourism sectors. In 2006, the mining sector received 32 percent of Korean FDI in Africa, followed by the Hotel and Restaurant sector (27 percent). Manufacturing (20 percent) and Wholesale and Retail (12 percent) were the other major sectors. Construction FDI amounted to just 2.3 percent of total South Korean FDI in Africa. Table 9.4 shows the sectoral distribution of Korean FDI in Africa in 2006.
Between 2002 and 2005, Korea undertook 11 greenfield projects in Africa27F
28. Merger and Acquisition activity between Korean and African firms have occurred in Egypt, Morocco, Tanzania, Sudan and South Africa28F
29.
26 EIU (2007) 27 UNCTAD FDI Statistics 28 UNCTAD (2007) 29 UNCTAD M&A Statistics

Table 9.4: Korean FDI in Africa by Sector in 2006. (Number and Value $m)
Category Total FDI FDI in Africa
Share of Africa
(percent) Number 247 15 6.07
Mining Value 8,543 488 5.71Number 1710 8 0.47
Hotel and Restaurant Value 2,479 412 16.62Number 19500 87 0.45
Manufacturing Value 47,985 297 0.62Number 4873 43 0.88
Wholesale/Retail Value 15,728 185 1.18Number 238 4 1.68
Telecommunications Value 2,458 61 2.48Number 710 16 2.25
Construction Value 1,943 35 1.80Number 645 32 4.96
Agriculture Value 957 12 1.25Number 3570 20 0.56
Other Services Value 4,675 13 0.28Number 901 6 0.67
Others Sectors Value 4,774 11 0.23Number 32394 231 0.71
Total in Africa Value 89,634 1515 1.69
Source: The Korea Imports and Exports Bank quoted in Kim (2006)

9.3 Aid.
Most of the Korean aid is focused on its Asian neighbours. Aid to Africa was less than ten percent of overall Korean ODA for the 2000-2006 period; increasing from $15.2m in 1995 to nearly $50m by 2006. As Table 9.5 shows, Kenya and Angola were the major recipients in 2005 and 2006.
Table 9.1: Korean ODA to Africa ($m, net disbursements)
Country 1995 2000 2005 2006 Total; Africa 15.2 24.27 39.14 47.83 Kenya 3.37 -0.58 10.93 15.47 Angola 0.14 8.61 0.02 10.09 Egypt 0.23 0.66 4.40 5.64 Tanzania 0.34 0.26 2.37 3.84 Morocco 0.46 0.04 1.40 2.40 Ethiopia 0.53 0.49 2.37 2.29 Algeria 0.08 0.03 0.34 1.82 Cote d'Ivoire 0.47 .. 0.26 1.03
Source: 1Hwww.oecd.org/dac accessed in July 2008
Korea classifies aid to Africa into two categories; the Development Cooperation Countries (DCC) and the Strategic Cooperation countries (SCC). The DCC category focuses on the low income poorest African nations who are offered assistance in rural development, capacity building, training and skill development, basic infrastructure, health and education. Countries classified in this category are also likely to receive loans with a higher grant element than others. The SCC category is for countries that are resource rich and already have a significant trade value with Korea. The nature of assistance here takes the lines of cooperation in the development of energy and natural resources, promotion of export manufacturing and the expansion of ICT and infrastructure. Most of the project initiatives have been in resource rich countries such as Egypt, Nigeria, Algeria and Morocco.
The year 2006 saw the first visit by a Korean president to Africa in 25 years and it was here that plans for the Korea Initiative for African Development (KIAD) were announced. The proposal sought to increase ODA from $39.1m in 2005, to $100m by 2008.
9.4 Integration of vectors
Historically there has been little integration of the trade-FDI and aid vectors in Africa. With the exception of South Africa, the overlap between trade (Korea’s imports of energy are key) and FDI (in minerals and hotels/tourism) has been weak, and much aid has gone to countries with which Korea has weak trading links. However, in recent years this pattern has begun to change and Korea is beginning to seek for a closer integration of the trade-FDI-aid vectors. Aid is being focused on key strategic partners, and the mining sector is becoming a key sector for Korea FDI in Africa.

10. Turkey
Turkey has strong historical ties with the North African countries dating back to the Ottoman Empire. However, recently Turkey has made attempts to engage with Sub Sahara Africa, and in this regard initiated an ‘Africa Policy’ in 1998.
Box 10.1: Opportunities for Africa - Turkey
Turkey predominantly sees Africa as a market for its final products rather than as a source of energy and other primary materials. After many years of contact with North Africa, in recent years it has begun to develop a coordinated strategy to enter SSA.
Trade: A source for export diversification. Imports of textiles may assist Africa’s clothing sector
FDI: There is scope for joint ventures in Small and Medium sized ventures,
Aid: Aid may provide support for small scale business ventures, and in the construction and clothing and textile sectors where Turkey has distinct competences.
10.1 Trade.
Exports from Turkey to Africa rose from $1.06bn in 1995 to $5.92bn in 2007. Imports rose from $1.38bn to $6.78bn over the same period. Turkey has a trade deficit of $0.86bn with Africa in 2007. (Figure 10.1)
Figure 10.1: Turkey’s trade with Africa, 1990-2007 ($m)
0
1000
2000
3000
4000
5000
6000
7000
8000
1990 1991 1992 1993 1994 1995 1996 1997 1998 1999 2000 2001 2002 2003 2004 2005 2006 2007
Mill
ions
Turkey Exports Turkey Imports
Source: Calculated from Direction of Trade Statistics (IMF) database accessed via ESDS; June 2008.

Turkey’s trade with Africa is heavily concentrated. Five countries (Algeria, Egypt, Morocco, South Africa and Libya) account for 70 percent of its exports, and three countries (South Africa, Algeria and Egypt) for 74 percent of all its imports from Africa (Table 10.1). In recent years the importance of South Africa as an export market has fallen, and that of Morocco has increased. The share of Libya as a source of imports into Turkey has fallen sharply, from 29 percent to 6 percent between 2000 and 2007.
Table 10.1: Percentage Share of Turkeys’ Top Five African Export and Import Partners (2007)
Exports Imports Algeria 21 South Africa 32 Egypt 15 Algeria 31 Morocco 12 Egypt 10 South Africa 11 Nigeria 7 Libya 11 Libya 6
Source: Calculated from Direction of Trade Statistics (IMF) database accessed via ESDS; June 2008.
Although no sector dominates Turkey’s exports to Africa, the largest items are metal products used in the construction sector. In recent years, there has been a rise in the significance of clothing exports to Africa (Table 10.2). Gold accounted for 42 percent of all Turkish imports from Africa in 2006, with natural gas following in importance in 2006 (23 percent) (Table 10.3). This explains the importance of South Africa (gold) and the North African economies (gas) as suppliers to Turkey.
Table 10.2: Percentage Share of Turkey’s Top Five Exports to Africa (1995-2006)
Product Name 1995 2000 2006 Iron and steel bars, rods, shapes and sections 10 8 10 Tube, pipes and fittings, of iron or steel 3 2 10 Ingots and other primary forms, of iron or steel 2 1 5 Outerwear knitted or crocheted, not elastic nor rubberized garments 1 3 4 Household type electric and non-electric equipment 5 2 4
Source: Calculated from COMTRADE, accessed via WITS May 2008.
On the import side, non monetary gold accounted for 42% of all Turkish imports from Africa while natural gas took the second largest chunk in 2006 (23%). The rest of the products in the top five list tend to have fairly low shares and are listed in table 10.3.
Table 10.3: Percentage Share of Turkey’s Top Five Imports from Africa (1995-2006)
Product Category 1995 2000 2006 Gold, non-monetary (excluding gold ores and concentrates) - - 42 Gas natural and manufactured 15 30 23 Coal ,lignite and peat 4 4 6 Waste and scrap metal of iron or steel 0 0 6 Fertilizers manufactured 1 2 4 Cocoa 2 2 3
Source: Calculated from COMTRADE, accessed via WITS May 2008.

10.2 FDI.
Turkish outward FDI increased from $0.11bn in 1995 to $0.87bn in 2000. Thereafter it stabilised, and in 2006 ($0.93bn) there was little change over the flows for 2000. An outflow of $1bn on average per year is expected for 2007-2011.29F
30
Other sources indicate the value of private investment flows to be much higher. According to Zaman (2005) the total value of investment projects undertaken in Africa rose; from just $578m in 2003, to $652m in 2004, rising by one third to $942m in 200530F
31. The Turkey Africa Trade Bridge estimates he value of private FDI for 2006 is at $2.3bn31F
32.
Historically, Turkish FDI has been concentrated in North Africa, predominantly in Libya, Algeria and Egypt. However with the establishment of the Turkish African Trade Bridge Summits organised annually since 2006, new investment opportunities have materialised in other African countries. In May 2008, the third Turkey-Africa Foreign Trade Bridge Summit was held in Istanbul. A private venture supported by the Turkish government, the organisers announced ambitions to undertake new projects to the value of $10bn in the African continent in the next three years.
In recent years, Turkish firms have invested in Ethiopia, Guinea, Burkina Faso, Benin, the Central African Republic, Angola and Malawi for the first time. Currently around 150 Turkish investors are to be found in 23 African countries, compared to only 73 prior to the establishment of the first Turkey-Africa Foreign Trade Bridge Summit. Many of these are small investors and firms taking on small projects; such as a $2m project in crushed rock production for road construction in Malawi. A number of small investments can be found in construction and building material businesses.
30 EIU (2007) 31 Today’s Zaman (2005) 32 www.tuskonafrica.com

10.3. Aid. Turkey’s aid covers a range of activities, providing assistance in health, education, transportation, infrastructure and post conflict rebuilding. Its ODA to Africa has increased steadily but from a small base. Most of its aid is directed towards Asia (Table 10.4).
Table 10.4: Turkish ODA (net disbursements) to regions ($million)
2000 2002 2004 2005 2006
Asia 16.91 14.61* 195.46 422.49 536.06 Europe 4.02 10.65 30.19 96.59 81.64 Africa 0.45 0.1 3.84 11.76 24.86
Source: 2Hwww.oecd.org/dac accessed in May 2008
In 2008 Turkey became the 25th Non-Regional Member of the African Development Bank. The Turkish International Cooperation and Development Agency (TIKA), the main Turkish agency coordinating assistance projects has opened offices in Addis Ababa in 2005 and later in Khartoum and Dakar in the years of 2006 and 2007 respectively. Turkey has also provided 300 scholarships for African students to study in Turkey in 2007-2008.
In recent years Turkey has signed various technical assistance and cooperation agreements with Kenya, Ethiopia, Nigeria, Senegal, Sudan and South Africa. According to the Ministry of Foreign Affairs, Turkey has offered assistance to Africa in the DRC, Ethiopia, Kenya, Nigeria, and Sudan in various sectors from security to technical cooperation in agriculture, health, education and infrastructure.
In 2006, most of Turkey’s aid has been concentrated in Sudan (58 percent) and Somalia (13 percent) (Table 10.5).
Table 10.5: Turkish ODA to Africa ($m, net disbursements)
1995 2000 2005 2006 Total Africa 1.96 0.45 11.76 24.86 Sudan 1.93 - 0.69 14.4 Somalia 0 - 0 3.27 Libya 0.01 - 3.77 1.05 Ethiopia - 0.04 2.49 0.88 Algeria - 0.03 1.05 0.75 Egypt - 0.04 1.2 0.62 Comoros - - - 0.6 Congo, Rep. - - 0.01 0.59 Tunisia 0.01 0.04 1.29 0.56 Gambia - 0.01 0 0.39 Morocco - - 1.06 0.35
Source: 3Hwww.oecd.org/dac accessed in July 2008

10.4 Integration of vectors
Turkey has only very recently made efforts to engage with Africa strategically. Historically, most trade, FDI and aid has been with North African countries.
Turkey’s ‘Open up to Africa’ policy in 1998 became much more effective when it was supported by the efforts of the Confederation of Businessmen and Industrialists of Turkey (TUSKON) in 2006. By organising Annual Trade Bridge Summits, individual and private investors are now finding opportunities and partners to expand business further than the traditional partners. Africa is primarily seen as a market for Turkish goods rather than as a source of supply for energy and commodities.
Turkey’s ambition to eventually join the EU may also work in favour of African countries; if they are able to create trade and investment relations with Turkey at the moment, may benefit from greater opportunities if and when Turkey joins the EU.
The signing of bilateral trade agreements with a number of African Countries; including FTA’s with Egypt and Syria (separately) in 2007 and with Morocco and Tunisia in 2005 evidence Turkey’s willingness to increase such opportunities with Africa. Although the agreements have not as yet become operational they are a step in the right direction.
Further advancement of integration on the government level can also be seen by Turkey’s observer status at the African Union granted in 2005 and it being declared as ‘strategic partner’ by the organisation in 2008. Turkey is organising a “Turkey-Africa Cooperation Summit” in Istanbul with high level participants from African countries in August 2008. Turkeys’ approach towards Africa is a positive one, and as engagement deepens, investment and trade opportunities are likely to increase in the coming years.

References: African Development Bank (2008), African Development Report 2007: Abidjan: African
Development Bank Bloom D. E. and J. D. Sachs (1998), “Geography, Demography and Economic Growth in Africa”, Brookings Papers on Economic Activity, 2.
Altenburg, T., & Weikert, J. (2007). Trilateral Development Cooperation with "New Donors". Bonn: German Development Institute.
Ariff, M., and G. P. Lopez (2006), Outward Foreign Direct Investment: The Malaysian Experience. Malaysian Institute of Economic Research. Paper presented at the ICRIER Conference 2007. 4Hhttp://www.icrier.org/conference/2007/26april07.html
Bajpaee, C. (2008), The Indian Elephant Returns to Africa. Asia Times Online. 5Hhttp://www.atimes.com/atimes/South_Asia/JD25Df02.html
Besada, H., Y. Wang and J. Whalley (2008), China's Growing Economic Activity in Africa. NBER Working Paper, 14024.
Bloom D. E. and J. D. Sachs (1998), Geography, Demography and Economic Growth in Africa, Brookings Papers on Economic Activity, 2.
Bräutigam, D. (1998). Chinese Aid and African Development: Exporting Green Revolution. London: Macmillan Press Ltd.
Broadman, H. G. (March/April 2008) China and India go to Africa, Foreign Affairs, Vol. 87, Issue 2. p95-109.
Cheng L. K. and Ma Z. (July 2007) China’s Outward FDI: Past and Future. 6Hhttp://www.nber.org/books_in_progress/china07/cwt07/cheng.pdf , accessed 31st July 2008
Chinese Statistical Bulletin (2006), retrieved from in June 2008 7Hhttp://preview.hzs2.mofcom.gov.cn/accessory/200710/1192783779118.pdf
Davies, M., H. Edinger, N. Tay, and S. Naidu (2008), How China delivers development assistance to Africa. Centre for Chinese Studies, University of Stellenbosch.
EIU (2007) World investment prospects to 2011; Foreign direct investment and the challenge of political risk. Economist Intelligence Unit with Columbia Program on International Investment. 8Hhttp://www.cpii.columbia.edu/
FDC-CII (2007), Brazil’s Multinationals Take Off. 9Hhttp://www.cpii.columbia.edu/projects/documents/FDC-CPII_Brazil_MNE_Press_Release_English_003.pdf
Harsch, E. (January 2004), Brazil repaying its 'debt' to Africa Africa Recovery, Vol. 17, No. 4, pp-3. United Nations
India Business Frontier (May 2008) Issue 1. 10Hhttp://www.frontier-advisory.com/wp-content/uploads/2008/05/india-business-frontier-may-2008.pdf
India Ministry of External Affairs. (2006). Indian Non Paper on India’s Partnership with Africa. Retrieved May 2008, from 11Hhttp://meaindia.nic.in/treatiesagreement/2006/17t4.707200601.htm
India Ministry of Finance. Union Budget and Economic Survey. Retrieved May 2008, from 12Hhttp://finmin.nic.in/the_ministry/dept_expenditure/index.html
Jobelius, M. (2007) New Powers for Global Change? Challenges for the International Development Cooperation. The Case of India. FES Briefing Paper No. 5. Berlin.
Kalotay K. (2005), Outward Foreign Direct Invest from Russia in a Global Context, Journal of East-West Business, Vol. 11, No. 3 / 4 , pp. 9-22. The Haworth Press, Inc.
Kaplinsky, R. (2006), Revisiting the Terms of Trade Revisited: Will China Make a Difference? World Development, (Vol. 34, No. 6, pp. 981-995)

Kaplinsky, R. (2009), China and the Terms of Trade: The Challenge to Development
Strategy In SSA, in E. Paus, P. Prime and J. Western (eds), The Rise of China: Global Implications: Polity
Kaplinsky, R. and M. Morris (2008), Do the Asian Drivers Undermine Export-Oriented Industrialisation in SSA, World Development Special Issue on Asian Drivers and their Impact on Developing Countries, Vol. 36, No. 2, pp. 254-273.
Kim, J. (2006) Presentation at the Korea-Africa Economic Cooperation April 2006. 13Hwww.koafec.org/admin/en/documents/file.jsp?filename=Seminar3.pdf
Komesaroff (2008), China Eyes Congo’s Treasures, Far Eastern Economic Review, Vol. 171, No. 3, April.
Kuncinas P. (2006), The Russians are Coming: Understanding Emerging Multinational. Rusal in cooperation with the Economist Intelligence Unit.
Lall, S. (2000), The Technological Structure and Performance of Developing Country Manufactured Exports 1985-98, Oxford Development Studies, Vol. 28, No. 3, pp. 337-369.
Mandigora G (2006), The Proposed SACU-India PTA: Where do the opportunities lie?. Retrieved June 2008, from 14Hwww.tralac.org.
Marks, S. (2008), The Bear and the Dragon, Pambazuka News 15Hhttp://www.pambazuka.org/en/category/comment/48823
Ministry of Foreign Affairs of the Russian Federation. Russian Relations with Sub-Saharan African Countries in 2005. Retrieved May 2008, from 16Hhttp://www.ln.mid.ru/brp_4.nsf/f68cd37b84711611c3256f6d00541094/eb58723614295438c32570e6002ee94?OpenDocument
Nestmann T. and D. Orlova (2008), Russia’s Outward Investment, Deutsche Bank Research, Frankfurt.
Price, G. (2005). Diversity In Donorship: The Changing Landscape Of Official Humanitarian Aid - India’s Official Aid Programme. HPG Background Paper. ODI, London
Schläger, C. (2007). Challenges for International Development Cooperation: The Case of Brazil. Berlin: Friedrich Ebert Stiftung.
Stamm, A. (2006). Entwicklungszusammenarbeit im Gesamtkontext der Deutsch-Brasilianischen Kooperation: eine Portfolioanalyse. Bonn: German Development Institute.
Thakurta, P. G. (2008). INDIA: Taking on China in Africa. Inter Press Service. 17Hhttp://ipsnews.net/news.asp?idnews=41875
The Kremlin. Speeches. Retrieved May 2008, from 18Hhttp://www.kremlin.ru/eng/ UNCTAD (2001), Transit Systems of Landlocked and Transit Developing Countries:
Recent Developments and Proposals for Future Action, Report by the UNCTAD Secretariat, Geneva: UNCTAD.
UNCTAD (2004) India’s Outward FDI: A Giant awakening? UNCTAD/DITE/IIAB/2004/1 UNCTAD (2007) Asian Foreign Direct Investment in Africa: Towards a New Era of
Cooperation Among Developing Countries. Geneva, UNCTAD. UNCTAD (2007), Key Data from WIR Annex Tables, retrieved from 19Hhttp://www.unctad.org/Templates/Page.asp?intItemID=3277&lang=1 UNCTAD (2007), Transnational Corporations, Extractive Industries and Development,
World Investment Report. UNCTAD. Geneva.

Vandaele, J. (2008), China Outdoes Europeans in Congo 8th February, Johannesburg:
Inter Press Service Vasiliev, V. A. (2005), Russian Assistance to Africa. G7/G8 Scholarly Publications and
Papers, from 20Hhttps://tspace.library.utoronto.ca/bitstream/1807/4810/2/index.html Vijian, P (April 2008), African Countries Offered Trade Privileges From India in Bua News
(Tshwane). From 21Hwww.tralac.org Wright, G. and J. Czelusta (2004), The Myth of the Resource Curse, Challenge, Vol. 47,
No. 2, pp. 6-38. Zaman; (2005) Turkey’s ‘Africa Year’ effective in boosting country’s exports. Journal of
Turkish Weekly. Zanin, F. and M. Sorbara (Feb 2, 2007), Hot On China's Heels, Brazil is Coming. The
Nation. (Nairobi) http://allafrica.com

The International Development Centre The Open University’s International Development Centre is an inter-faculty centre to develop academic research and teaching interventions on issues of international development, based on collaborations and networking with colleagues from around the world, especially Africa.
Previous IDC working papers include: Political Violence and State Formation in Post-Colonial Africa by Mahmood Mamdani Identities and Transitions: Youth and Development in Africa by Alcinda Honwana Trauma, Memory and Transition: Tensions in Post-Apartheid South Africa by Roxsana Patel Is Informal Enterprise a Path to Urban Socio-Economic Dynamism in Nairobi? By Mary Njeri Kinyanjui
International Development Centre Room 010, Chambers Building Open University Milton Keynes MK7 6AA United Kingdom Tel: +44 (0)1908 655419 Fax:+44 (0)1908 654825 E-mail: [email protected]