Regional Alcohol Indicators for the North West of England 2006
50
Regional Alcohol Indicators for the North West of England 2006 Volume 1 (Part 1) Main report Edited by Michela Morleo, Dan Dedman, Karen Hughes, Jeremy Hooper, Karen Tocque and Mark A. Bellis
-
Upload
independent -
Category
Documents
-
view
0 -
download
0
Transcript of Regional Alcohol Indicators for the North West of England 2006

Regional Alcohol Indicators for the North West of England 2006 Volume 1 (Part 1) Main report
Edited by Michela Morleo, Dan Dedman, Karen Hughes, Jeremy Hooper,Karen Tocque and Mark A. Bellis

2
Regional Alcohol Indicators for the North West of England 2006 Contents Executive Summary .................................................................................................................6 Introduction ..............................................................................................................................7 Indicator 1: Synthetic estimates of binge drinking..............................................................9 Indicator 2: Hospitalised admission for alcohol specific conditions..................................11
a) Males ..............................................................................................................................11 b) Females..........................................................................................................................13 c) Total population ..............................................................................................................15
Indicator 3: Hospitalised admission for all conditions attributable to alcohol ...................16 a) Males ..............................................................................................................................16 b) Females..........................................................................................................................18 c) Total population ..............................................................................................................20
Indicator 4: Reduced life expectancy for all causes attributable to alcohol......................21 a) Males ..............................................................................................................................21 b) Females..........................................................................................................................23 c) Total population ..............................................................................................................25
Indicator 5: All recorded crime attributable to alcohol ......................................................26 Indicator 6: All violent offences attributable to alcohol .....................................................29
a) More serious violence.....................................................................................................32 b) Wounding offences.........................................................................................................34 c) Less serious violence .....................................................................................................36
(i) Assaults on a constable ..............................................................................................38 Indicator 7: Sexual offences attributable to alcohol .........................................................40 Indicator 8: Drink driving ..................................................................................................43 Indicator 9: Premises licensed to sell alcohol ..................................................................44 References .............................................................................................................................44 Appendices z Appendix 1: Codes used for hospitalised admission for alcohol specific conditions ..............46 Appendix 2: Codes used for hospitalised admission for all conditions attributable to
alcohol.............................................................................................................................47 Appendix 3: Codes used for reduced life expectancy attributable to alcohol .........................48 Appendix 4: Codes used for violent crime attributable to alcohol...........................................49

3
List of Figures, Tables and Maps Figures Figure 2.1: Correlation between the male and female prevalence levels of hospitalised
admission for alcohol specific conditions in 2004/05 by Local Authority in the North West ................................................................................................................................14
Figure 2.2: Trends in prevalence of hospitalised admission for alcohol specific conditions per 1,000 of the population by gender in the North West, 2003/04 to 2004/05...............15
Figure 2.3: Correlation between the prevalence of hospitalised admission for alcohol specific conditions per 1,000 of the population in 2004/05 and the Index of Multiple Deprivation in 2004 by Local Authority and gender in the North West............................15
Figure 3.1: Correlation between the male and female prevalence levels of hospitalised admission for all conditions attributable to alcohol in 2004/05, by Local Authority in the North West ................................................................................................................19
Figure 3.2: Trends in the prevalence of hospitalised admission for all conditions attributable to alcohol per 1,000 of the population by gender in the North West, 2003/04 to 2004/05 .........................................................................................................20
Figure 3.3: Correlation between the prevalence of hospitalised admissions for all conditions attributable to alcohol per 1,000 of the population in 2004/05 and the Index of Multiple Deprivation in 2004 by gender and Local Authority in the North West ..........20
Figure 4.1: Correlation between male and female months of life lost for all causes attributable to alcohol in 2004, by Local Authority in the North West..............................24
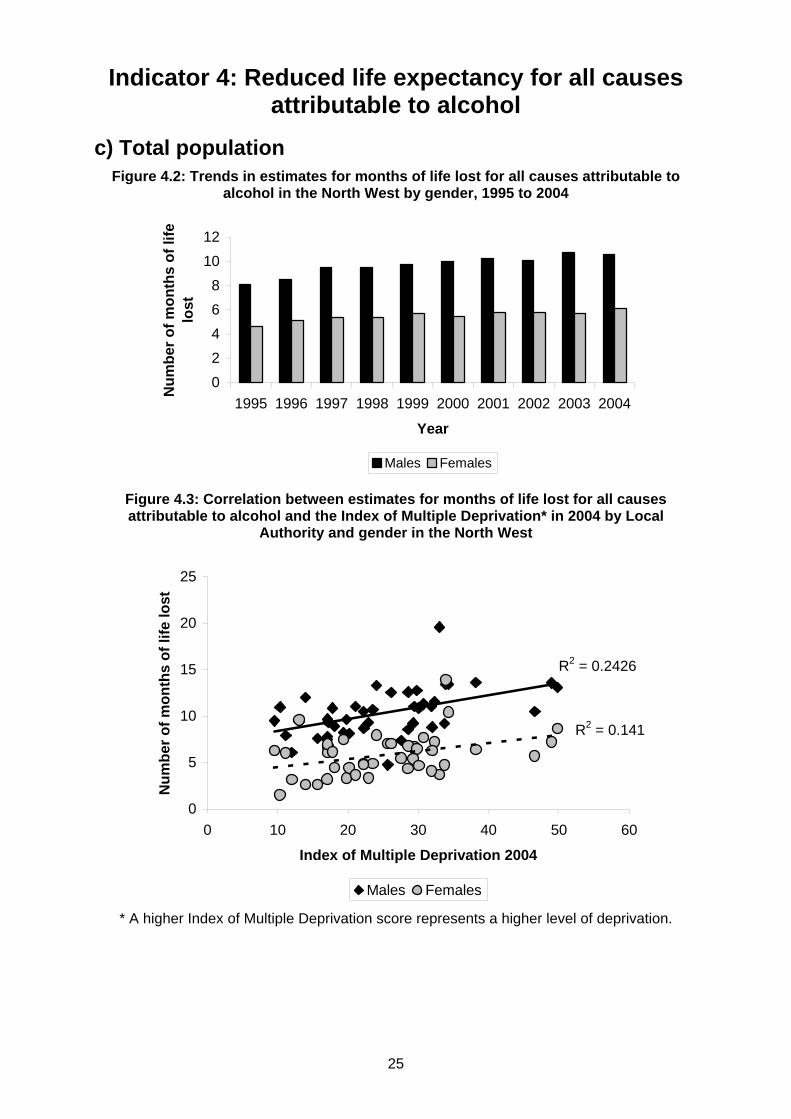
Figure 4.2: Trends in estimates for months of life lost for all causes attributable to alcohol in the North West by gender, 1995 to 2004 ....................................................................25
Figure 4.3: Correlation between estimates for months of life lost for all causes attributable to alcohol and the Index of Multiple Deprivation in 2004 by Local Authority and gender in the North West ............................................................................................................25
Figure 5.1: Trends in all recorded crime attributable to alcohol, rate per 1,000 of the population in the North West, 2002/03 and 2004/05.......................................................28
Figure 5.2: Correlation between the rate of all recorded crime attributable to alcohol per 1,000 of the population in 2004/05 and Index of Multiple Deprivation in 2004 by Local Authority in the North West .............................................................................................28
Figure 6.1: Trends in all violent offences attributable to alcohol, rate per 1,000 of the population in the North West from 2002/03 to 2004/05...................................................31
Figure 6.2: Correlation between the rate of all violent offences attributable to alcohol per 1,000 of the population in 2004/05 and the Index of Multiple Deprivation in 2004 by Local Authority in the North West....................................................................................31
Figure 6.3: Trends in more serious violent offences attributable to alcohol, rate per 1,000 of the population in the North West, 2002/03 to 2004/05................................................33
Figure 6.4: Correlation between the rate of more serious violent offences attributable to alcohol per 1,000 of the population in 2004/05 and the Index of Multiple Deprivation in 2004 by Local Authority in the North West......................................................................33
Figure 6.5: Trends in wounding offences attributable to alcohol, rate per 1,000 of the population in the North West, 2002/03 to 2004/05..........................................................35
Figure 6.6: Correlation between the rate of wounding offences attributable to alcohol per 1,000 of the population in 2004/05 and the Index of Multiple Deprivation in 2004 by Local Authority in the North West....................................................................................35
Figure 6.7: Trends in less serious violent offences attributable to alcohol, rate per 1,000 of the population in the North West, 2002/03 to 2004/05....................................................37
Figure 6.8: Correlation between the rate of less serious violent offences attributable to alcohol per 1,000 of the population in 2004/05 and the Index of Multiple Deprivation in 2004 by Local Authority in the North West......................................................................37
Figure 6.9: Trends in assaults on a constable attributable to alcohol, rate per 1,000 of the population in the North West, 2002/03 to 2004/05..........................................................39

4
Figure 6.10: Correlation between the rate of assaults on a constable attributable to alcohol per 1,000 of the population in 2004/05 and the Index of Multiple Deprivation in 2004 by Local Authority in the North West...............................................................................39
Figure 7.1: Trends in sexual offences attributable to alcohol, rate per 1,000 of the population in the North West, 2002/03 to 2004/05..........................................................42
Figure 7.2: Correlation between rate of sexual offences attributable to alcohol per 1,000 of the population in 2004/05 and Index of Multiple Deprivation in 2004 by Local Authority in the North West ............................................................................................................42
Figure 8.1: Number of positive or refused breath tests per 1,000 of the population by police force area in 2003.................................................................................................43
Figure 9.1: Number of premises licensed to sell alcohol from July 2003 to June 2004 per 1,000 of the population....................................................................................................44
Maps Map 1.1: Synthetic estimates: prevalence of binge drinking among the adult population
(%) between 2000 and 2002 .............................................................................................9 Map 2.1: Prevalence of hospitalised admission for alcohol specific conditions amongst
males in 2004/05.............................................................................................................11 Map 2.2: Prevalence of hospitalised admission for alcohol specific conditions amongst
females in 2004/05..........................................................................................................13 Map 3.1: Prevalence of hospitalised admission for all conditions attributable to alcohol
amongst males in 2004/05 ..............................................................................................16 Map 3.2: Prevalence of hospitalised admission for all conditions attributable to alcohol for
females in 2004/05..........................................................................................................18 Map 4.1: Average projected estimate of months of life lost for all causes attributable to
alcohol amongst males in 2004.......................................................................................21 Map 4.2: Average projected estimate of months of life lost for all causes attributable to
alcohol amongst females in 2004....................................................................................23 Map 5.1: All recorded crime attributable to alcohol, rate per 1,000 of the population in
2004/05 ...........................................................................................................................27 Map 6.1: All violent offences attributable to alcohol, rate per 1,000 of the population in
2004/05 ...........................................................................................................................30 Map 6.2: Mores serious violent offences attributable to alcohol, rate per 1,000 of the
population in 2004/05......................................................................................................32 Map 6.3: Wounding offences attributable to alcohol by Local Authority rate per 1,000 of
the population in 2004/05................................................................................................34 Map 6.4: Less serious violent offences attributable to alcohol, rate per 1,000 of the
population in 2004/05......................................................................................................36 Map 6.5: Assaults on a constable attributable to alcohol per 1,000 of the population in
2004/05 ...........................................................................................................................38 Map 7.1: Sexual offences attributable to alcohol per 1,000 of the population in 2004/05 ......41 Tables Table 1.1: Synthetic estimates: prevalence of binge drinking among the adult population
between 2000 and 2002....................................................................................................9 Table 2.1: Prevalence of hospitalised admission for alcohol specific conditions amongst
males in 2004/05.............................................................................................................11 Table 2.2: Prevalence of hospitalised admissions for alcohol specific conditions amongst
females in 2004/05..........................................................................................................13 Table 3.1: Prevalence of hospitalised admission for all conditions attributable to alcohol
amongst males in 2004/05 ..............................................................................................16 Table 3.2: Prevalence of hospitalised admission for all conditions attributable to alcohol
amongst females in 2004/05 ...........................................................................................18

5
Table 4.1: Average projected estimates of months of life lost for all causes attributable to alcohol amongst males in 2004.......................................................................................21
Table 4.2: Average projected estimates of months of life lost for all causes attributable to alcohol amongst females in 2004....................................................................................23
Table 4.3: Average projected estimate of months of life lost for all causes attributable to alcohol in 2004 in Blackpool, Copeland and Fylde, by gender .......................................24
Table 5.1: Alcohol attributable fractions for recorded crime in England, by category ............26 Table 5.2: All recorded crime attributable to alcohol, rate per 1,000 of the population in
2004/05 ...........................................................................................................................27 Table 6.1: Counting codes used to inform the subcategories of violent crime .......................29 Table 6.2: All violent offences attributable to alcohol, rate per 1,000 of the population in
2004/05 ...........................................................................................................................30 Table 6.3: More serious violent offences attributable to alcohol, rate per 1,000 of the
population in 2004/05......................................................................................................32 Table 6.4: Wounding offences attributable to alcohol, rate per 1,000 of the population in
2004/05 ...........................................................................................................................34 Table 6.5: Less serious violent offences attributable to alcohol, rate per 1,000 of the
population in 2004/05......................................................................................................36 Table 6.6: Assaults on a constable attributable to alcohol, rate per 1,000 of the population
in 2004/05 .......................................................................................................................38 Table 7.1: Sexual offences attributable to alcohol per 1,000 of the population by Local
Authority in 2004/05 ........................................................................................................41 Table 8.1: Number of sentences passed in Magistrates’ Courts for driving or attempting to
drive with excess alcohol in 2004....................................................................................43 Table 9.1: Number of premises licensed to sell alcohol from July 2003 to June 2004...........44 Acknowledgments This report was produced on behalf of, and with significant assistance from, the Regional Alcohol Harm Reduction Strategic Group. In particular, we would like to thank:
• Matt Hennessey, Gail Porter and Alison Stathers-Tracey, Home Office Group, Government Office North West
• John Ashton, Dominic Harrison, Cathy Wynne, Thomas Hennell and Catherine Smith, Public Health Team, Government Office North West
• Pamela Wright and Roger Lincoln, North West Regional Public Health Development Unit
• Rod Thomson, South Sefton Primary Care Trust • Liz Smith, Alcohol and Drug Services, Manchester • Lee Le Clerq, British Beer and Pub Association • Chief Inspector Jon Donnelly, Lancashire Constabulary • Lynn Owen, Central Liverpool Primary Care Trust • Tony Allen and John Ashcroft, North West Trading Standards • Mark Needham, National Institute for Mental Health North West • Beverley Gallier and David McNulty, Greater Manchester Passenger Transport
Executive • Catherine Westwell, Lancashire County Council • Mark Gillman, National Treatment Agency • Sue Henry, North West Development Agency • Chris Sykes, Greater Manchester Police • Gerry Smallshaw and David Johnnie, Lancashire Trading Standards

6
Executive Summary The development of alcohol-related entertainment can offer economic and employment opportunities that are clear to both private investors and local authorities. However, what have often been more difficult to quantify are the negative effects on individual and community well being that result from alcohol use, and the subsequent pressures that fall on health, judicial and other public services. A wide range of research is beginning to identify ill health and crime costs associated with alcohol equivalent to billions of pounds each year. However, these studies often provide no ongoing measures of the negative consequences of alcohol use in particular areas or of any year-on-year progress in tackling them. In order to meet these needs the North West Regional Alcohol Harm Reduction Strategic Group tasked the Centre for Public Health to develop a set of indicators of alcohol-related harm that could be measured separately in each Local Authority and repeated annually in order to assess progress in tackling alcohol-related problems. This, the first set of Regional Alcohol Indicators, provides:
• The latest data on crime and health related to alcohol for each individual Local Authority in the region and, for comparison, the North West average;
• Details on the direction of the indicator’s trend (in terms of whether the impact of alcohol is growing or lessening) for each Local Authority and the North West as a whole;
• A summary of the key points for each indicator (e.g. areas in the North West most affected);
• Information on how the indicator relates to deprivation; and • Details of methodologies and definitions used.
The indicators are a tool that we hope will aid health and judicial services as well as Local Authorities with planning interventions to reduce the negative consequences of alcohol. This initial indicators report serves to highlight the scale such consequences have already reached across the North West. Findings include:
• Alcohol-related health problems are reducing every individual’s life expectancy (across the North West) on average by over ten and a half months for males and over six months for females;
• The average number of months of life lost attributable to alcohol increased by nearly 25 per cent among both males and females between 1995 and 2004 (increasing by 2.51 and 1.50 months respectively);
• The burden of ill-health attributable to alcohol, as measured by hospitalised admission and life expectancy, falls disproportionately on males and on the poorest areas in the region;
• Since 2002/03, recorded crime attributable to alcohol in the North West increased by eight per cent (to 0.87 offences per 1,000 of the population), whilst violent crime attributable to alcohol increased by nearly 40 per cent (to 2.14 per 1,000) (although changes to recording systems have contributed to these increases);
• Twenty-three per cent of the population in the North West are now estimated to be binge drinkers; and
• Across most alcohol indicators measured in this report, more urbanised areas such as Blackpool, Liverpool and Manchester suffer the greatest levels of alcohol-related harms. For example the rate of alcohol-related hospitalised admission among males in the most affected area (15.22 per 1,000 population in Liverpool) is two and a half times higher than that in the least affected area (6.09 per 1,000 in Fylde).
The Regional Alcohol Indicators is an ongoing project and we are keen to receive suggestions both on how existing indicators could be improved and of additional indicators that may be of use to those planning, commissioning or delivering services to reduce alcohol-related harms.

7
Introduction The North West of England is disproportionately affected by alcohol and its related harms (Drummond et al. 2005, Hughes et al. 2004). The region suffers from higher estimates of alcohol consumption and higher rates of alcohol-related mortality than other parts of England. However, even within the North West the impact of alcohol varies considerably. Local Authority areas differ in terms of alcohol consumption levels, the types and extent of alcohol-related harms experienced (such as crime and health problems), the direction in which trends in alcohol measures are moving and how fast such changes are occurring. Understanding the impact of alcohol within local areas is essential in identifying the burden imposed by alcohol and which types of interventions are required to reduce alcohol-related harms. This report and its associated online tools (available through www.nwpho.net/alcohol) aim to provide information on the impact of alcohol at a local level to inform policy and practice throughout the North West. Wherever possible, the information is provided at a Local Authority level, with the aim of creating a profile of the alcohol situation in each Local Authority and enabling comparison between areas and the North West average. The structure of the report In order to provide an accurate representation of the situation in each Local Authority, a variety of different alcohol-related indicators have been developed covering consumption, health, crime and licensing. The indicators used include:
1. Synthetic estimates of binge drinking; 2. The prevalence of hospitalised admission for alcohol specific causes; 3. The prevalence of hospitalised admission for all causes attributable to alcohol; 4. Reduced life expectancy attributable to alcohol; 5. All recorded crime attributable to alcohol; 6. All violent offences attributable to alcohol; 7. Sexual offences attributable to alcohol; 8. Drink driving; and 9. Premises licensed to sell alcohol.
For consistency, each indicator in the report follows a standard format, providing:
• The latest estimate for each indicator for each individual Local Authority in the region and the North West average;
• Information on how far each Local Authority’s estimate varies from the North West average;
• Details on the direction of the indicator’s trend (in terms of whether the impact of alcohol is growing or lessening) for each Local Authority and the North West as a whole;
• A summary of the key points for the indicator; • Information on how the indicator relates to deprivation; and • Details of the methodology and definitions used.
Health profiles specific to each individual Local Authority are available on request and through the above website. These present the indicator data specific to a particular Local Authority, summarising key points and illustrating how that locality compares both to other local authorities in the North West and to the North West as a whole.

8
What next? It is anticipated that the data in this report will be updated and published annually, to enable monitoring of the alcohol situation within Local Authorities and the region over time. It is also intended to expand the indicators used in the report in order to provide a broader picture of alcohol’s impacts across the North West and locally. Based on Alcohol Concern’s Alcohol Strategy Toolkit1 and its suggested baseline indicators, possible future indicators include:
• The number of Anti-Social Behaviour Orders issued; • The number of teenage pregnancies; and • The rate of truancy.
Comments or recommendations on the potential direction of this project report will be welcomed.
1 Please see http://www.localalcoholstrategies.org.uk for more details

9
Indicator 1: Synthetic estimates of binge drinking
Table 1.1: Synthetic estimates: prevalence of binge drinking among the adult
population between 2000 and 2002*
Local Authority Synthetic
estimates of binge drinking
(%)
Variation from North West total
Allerdale 21.1 -1.9 Barrow-in-Furness 21.8 -1.2 Blackburn with Darwen 18.6 -4.4 Blackpool 22.0 -1.0 Bolton 19.7 -3.3 Burnley 20.8 -2.2 Bury 21.4 -1.6 Carlisle 23.2 +0.2 Chester 22.9 -0.1 Chorley 22.3 -0.7 Congleton 21.0 -2.0 Copeland 23.3 +0.3 Crewe & Nantwich 21.5 -1.5 Eden 20.7 -2.3 Ellesmere Port & Neston 21.9 -1.1 Fylde 19.5 -3.5 Halton 23.8 +0.8 Hyndburn 20.6 -2.4 Knowsley 25.0 +2.0 Lancaster 23.1 +0.1 Liverpool 27.8 +4.8 Macclesfield 20.8 -2.2 Manchester 24.8 +1.8 Oldham 19.5 -3.5 Pendle 19.2 -3.8 Preston 22.0 -1.0 Ribble Valley 20.8 -2.2 Rochdale 20.1 -2.9 Rossendale 21.5 -1.5 Salford 24.7 +1.7 Sefton 23.4 +0.4 South Lakeland 19.6 -3.4 South Ribble 22.1 -0.9 St. Helens 22.7 -0.3 Stockport 21.9 -1.1 Tameside 22.2 -0.8 Trafford 22.3 -0.7 Vale Royal 21.0 -2.0 Warrington 22.9 -0.1 West Lancashire 22.7 -0.3 Wigan 22.7 -0.3 Wirral 22.6 -0.4 Wyre 18.7 -4.3 North West 23.0 N/A *Figures in this table may not add up exactly due to rounding.
Map 1.1: Synthetic estimates:
prevalence of binge drinking among the adult population (%) between 2000 and
2002
% of adults who binge drink
18.6 to 19.7 >19.7 to 21.1 >21.1 to 22.3 >22.3 to 23.8 >23.8 to 27.8
10
Indicator 1: Synthetic estimates of binge drinking Few data are available at a Local Authority level on population alcohol consumption levels. Thus, for the purposes of this report synthetic estimates have been calculated using data from the Health Survey for England (2000, 2001 and 2002) and other demographic data sources (Box 1.1). Between 2000 and 2002, 23 per cent of North West adults were estimated to be binge drinkers. This percentage varied across the region. Liverpool (27.8%), Knowsley (24.9%) and Manchester (24.8%) were estimated to have the highest levels of binge drinking, whilst Blackburn with Darwen (18.6%), Wyre (18.7%) and Pendle (19.2%) had the lowest. Because of the nature of synthetic estimates (Box 1.1), it has not been possible to measure trends.
Box 1.1: Indicator description The Health Survey for England surveyed (in 2000, 2001 and 2002) over 30,400 adults(that is household residents aged 16 years and over) regarding their levels of alcoholconsumption (Scholes et al. 2005). Participants provided details on the quantity ofalcohol consumed on the day that they had drunk the largest quantity of alcohol in theprevious week. Binge drinking in the Health Survey for England was defined as (Pickering et al 2005;Scholes et al. 2005):
• For men, the percentage drinking eight units or more of alcohol on at least oneday in the previous week; and
• For women, the percentage drinking six units or more of alcohol on at least oneday in the previous week.
The Health Survey for England provided regional figures on alcohol consumption, butthe sample sizes were too small to produce estimates by local authority areas (thelowest level at which the data can provide estimates for is by Strategic HealthAuthorities) (Pickering et al. 2005). As such, to provide estimates for Local Authorities,synthetic estimates have been calculated. Synthetic estimates provide information on the expected prevalence of a specificbehaviour such as binge drinking (Pickering et al. 2005). A statistical model is useddescribing the relationships between specific types of respondents (such as bingedrinkers) and the characteristics of the area (such as demographic details). This modelis used to ascertain prevalence estimates for specific cases, which can then be used toformulate estimates for specific areas based on their demographic characteristics. For this report, data from three years of the Health Survey for England (2000, 2001 and2002) were combined to produce a single dataset. These estimates and the rankings provided for binge drinking in the individual LocalAuthority health profiles need to be viewed with caution. The data do not account foradditional factors (such as local campaigns on healthy behaviour). In addition, it is notadvised that they are used to measure trends (Pickering et al. 2005; Scholes et al.2005).

11
Indicator 2: Hospitalised admission for alcohol specific conditions
a) Males Table 2.1: Prevalence of hospitalised admission for
alcohol specific conditions amongst males in 2004/05*
Local Authority Admission per 1,000 males in 2004/05
Variation from North West total
Change from
2003/04
Allerdale 5.08 +0.22 +0.89 Barrow-in-Furness 5.22 +0.35 +1.40 Blackburn with Darwen 4.95 +0.09 +1.19 Blackpool 5.20 +0.34 +0.35 Bolton 5.37 +0.50 +1.28 Burnley 5.77 +0.90 +0.28 Bury 3.79 -1.08 -0.31 Carlisle 5.05 +0.19 +0.13 Chester 2.75 -2.11 -0.14 Chorley 2.75 -2.11 -0.53 Congleton 1.98 -2.89 +0.01 Copeland 5.78 +0.91 +0.12 Crewe & Nantwich 3.09 -1.77 -0.13 Eden 2.41 -2.45 +0.29 Ellesmere Port & Neston 3.57 -1.30 +0.11 Fylde 2.13 -2.74 +0.21 Halton 6.14 +1.27 -0.17 Hyndburn 4.69 -0.17 +1.21 Knowsley 6.58 +1.71 +0.09 Lancaster 4.99 +0.12 -0.14 Liverpool 7.94 +3.08 +0.41 Macclesfield 3.10 -1.77 +0.90 Manchester 7.44 +2.58 +1.56 Oldham 4.41 -0.45 -0.39 Pendle 4.24 -0.62 -0.13 Preston 5.48 +0.62 +0.38 Ribble Valley 1.94 -2.93 +0.24 Rochdale 5.36 +0.50 +0.47 Rossendale 4.37 -0.49 +0.53 Salford 6.15 +1.28 +1.36 Sefton 5.14 +0.28 +0.56 South Lakeland 2.94 -1.93 +0.30 South Ribble 2.79 -2.07 +0.15 St. Helens 6.42 +1.56 +0.70 Stockport 4.28 -0.59 +0.54 Tameside 4.96 +0.10 +0.59 Trafford 3.33 -1.54 +0.59 Vale Royal 2.71 -2.15 -0.05 Warrington 4.90 +0.04 +0.21 West Lancashire 3.58 -1.29 -0.37 Wigan 3.70 -1.16 +0.46 Wirral 6.92 +2.06 +0.42 Wyre 2.54 -2.33 +0.46 North West 4.86 N/A +0.46 *Figures in this table may not add up exactly due to rounding.
Map 2.1: Prevalence of hospitalised admission for alcohol specific conditions amongst males in 2004/05
Male hospitalised admission per
1,000 population
1.94 to 2.94 >2.94 to 3.79 >3.79 to 4.69 >4.69 to 5.78 >5.78 to 7.94

12
Indicator 2: Hospitalised admission for alcohol specific conditions
a) Males In 2004/05 in the North West, the prevalence of hospitalised admission for alcohol specific conditions was 4.86 per 1,000 of the male population (for conditions such as alcoholic liver cirrhosis or alcohol overdose; Box 2.1). This rate was higher than that for females (2.49 admissions per 1,000 of the population; Indicator 2b). The total rate for both males and females combined was 3.65 per 1,000 of the population. Prevalence levels of alcohol specific hospitalisation among males varied greatly across the region, ranging from 1.94 per 1,000 of the population in Ribble Valley to more than four times that in Liverpool at 7.94 per 1,000. Both of these local authorities have seen increases in the rate of admissions since 2003/04 (Ribble Valley by 0.24 per 1,000 and Liverpool by 0.41 per 1,000). The prevalence of male hospitalised admission in the North West has increased from 4.40 per 1,000 of the population in 2003/04 to 4.86 per 1,000 of the population in 2004/05. In total, 33 Local Authorities saw an increase in the prevalence of alcohol specific hospitalised admission between 2003/04 and 2004/05, with the largest increases seen in Manchester and Barrow-in-Furness (increasing by 1.56 and 1.40 per 1,000 respectively). In comparison, ten local authorities experienced a decrease in rates, with Chorley experiencing the largest decrease by 0.53 per 1,000 of the population. The rate of male hospitalised admission specific to alcohol showed a strong correlation with deprivation (R2 = 0.79; Figure 2.3), with the rate of hospitalised admission increasing with higher levels of deprivation.
Box 2.1: Indicator description The codes from the World Health Organization’s International Classification of Disease(ICD) were used to extract data on all those aged under 85 years who had beenadmitted to hospital for an alcohol specific cause or condition between the financialyears 2003/04 and 2004/05 (Bellis et al. 2005; WHO 1992). Alcohol specific conditions are those that are classified as being wholly related toalcohol (such as alcohol overdose or, through long-term alcohol misuse, conditionssuch as alcoholic liver cirrhosis). A full list of conditions included in this category isprovided in Appendix 1. The numbers of cases in each code are then summed toproduce the total number of alcohol specific hospitalised admission per 1,000 of thepopulation. This indicator also feeds into Indicator 3, which covers hospitalised admission for allcauses that are attributable to alcohol.

13
Indicator 2: Hospitalised admission for alcohol specific conditions
b) Females
Table 2.2: Prevalence of hospitalised admission for alcohol specific conditions amongst females
in 2004/05*
Local Authority Admission per 1,000
females in 2004/05
Variation from North
West total
Change from
2003/04
Allerdale 2.85 +0.36 -0.17 Barrow-in-Furness 3.17 +0.68 +0.41 Blackburn with Darwen 2.30 -0.20 +0.85 Blackpool 2.39 -0.10 +0.20 Bolton 2.68 +0.18 +0.68 Burnley 2.42 -0.07 -0.37 Bury 2.22 -0.27 +0.40 Carlisle 2.33 -0.16 +0.07 Chester 1.26 -1.23 -0.02 Chorley 1.78 -0.71 -0.37 Congleton 1.37 -1.13 -0.17 Copeland 3.69 +1.19 +0.31 Crewe & Nantwich 1.52 -0.98 -0.24 Eden 1.60 -0.89 +0.51 Ellesmere Port & Neston 1.86 -0.63 -0.27 Fylde 1.54 -0.95 +0.26 Halton 3.13 +0.64 -0.06 Hyndburn 1.62 -0.88 +0.33 Knowsley 3.00 +0.51 -0.10 Lancaster 2.83 +0.33 +0.40 Liverpool 3.75 +1.26 +0.09 Macclesfield 1.64 -0.85 +0.09
Manchester 3.36 +0.87 +0.63 Oldham 1.95 -0.55 -0.07 Pendle 1.98 -0.51 +0.24 Preston 2.59 +0.10 -0.35
Ribble Valley 1.43 -1.06 +0.56 Rochdale 2.25 -0.24 +0.08 Rossendale 2.30 -0.19 +0.56 Salford 2.82 +0.33 +0.77 Sefton 2.50 +0.01 -0.06 South Lakeland 1.64 -0.85 +0.18
South Ribble 1.75 -0.75 -0.21 St. Helens 2.97 +0.48 +0.06 Stockport 2.11 -0.39 +0.26 Tameside 2.63 +0.14 +0.19 Trafford 1.97 -0.52 +0.30 Vale Royal 2.22 -0.28 +0.60 Warrington 2.94 +0.44 +0.17 West Lancashire 1.77 -0.73 -0.46 Wigan 2.70 +0.21 +0.65 Wirral 3.26 +0.77 -0.04 Wyre 1.71 -0.79 +0.54 North West 2.49 N/A +0.21 *Figures in this table may not add up exactly due to rounding.
Map 2.2: Prevalence of hospitalised admission for alcohol specific conditions amongst females in 2004/05
Female hospitalised admission
per 1,000 population
1.26 to 1.64 >1.64 to 1.98 >1.98 to 2.50 >2.50 to 3.00 >3.00 to 3.75

14
Indicator 2: Hospitalised admission for alcohol specific conditions
b) Females In 2004/05 in the North West, the prevalence of hospitalised admission for alcohol specific conditions was 2.49 individuals per 1,000 of the female population, increasing from 2.28 per 1,000 in 2003/04. Rates of admission varied greatly across the region, ranging from 1.26 per 1,000 in Chester to more than triple that in Liverpool at 3.75 per 1,000 of the female population. In total, 28 local authorities saw an increase in the rate of alcohol specific hospitalised admission compared to 2003/04, with Blackburn with Darwen and Salford seeing the largest increases (by 0.85 and 0.77 per 1,000 population respectively). In comparison, 15 local authorities experienced a decrease, with West Lancashire, Burnley and Chorley experiencing the largest decreases (by 0.46, 0.37 and 0.37 per 1,000 respectively). The rate of female hospitalised admission for alcohol specific conditions showed a moderate correlation with deprivation, with the rate of hospitalised admission increasing with higher levels of deprivation (R2 = 0.56; Figure 2.3). However, this correlation was not as strong as that for males. Across the region, the rate of female hospitalised admission for alcohol specific conditions was lower than that for males (2.49 and 4.86 per 1,000 respectively in the North West overall). For example, in Oldham 4.41 per 1,000 males were admitted, compared to 1.95 per 1,000 females. The rate of female admission for alcohol specific conditions showed a strong correlation with the rate of male admission, with the former increasing with the latter (R2 = 0.77; Figure 2.1).
Figure 2.1: Correlation between the male and female prevalence levels of hospitalised admission for alcohol specific conditions in 2004/05 by Local Authority in the North
West
R2 = 0.7713
0
1
2
3
4
0 2 4 6 8 10Rate of male admission per 1,000 population
Rat
e of
fem
ale
adm
issi
on p
er
1,00
0 po
pula
tion
15
Indicator 2: Hospitalised admission for alcohol specific conditions
c) Total population
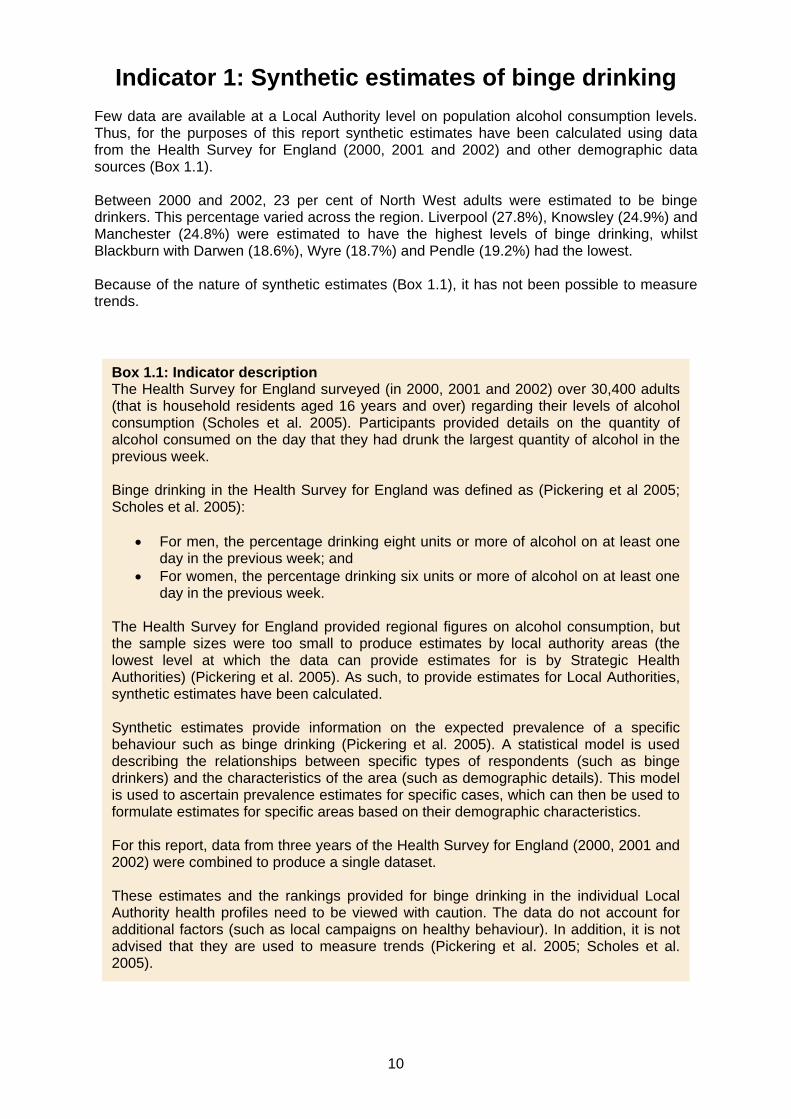
Figure 2.2: Trends in prevalence of hospitalised admission for alcohol specific conditions per 1,000 of the population by gender in the North West, 2003/04 to 2004/05
4.44.86
2.28 2.49
0
1
2
3
4
5
6
2003/04 2004/05
Year
Rat
e of
alc
ohol
spe
cific
ad
mis
sion
per
1,0
00 p
opul
atio
n
Males Females
Figure 2.3: Correlation between the prevalence of hospitalised admission for alcohol specific conditions per 1,000 of the population in 2004/05 and the Index of Multiple
Deprivation* in 2004 by Local Authority and gender in the North West
R2 = 0.5612
R2 = 0.7935
0
1
2
3
4
5
6
7
8
9
0 10 20 30 40 50 60
Index of Multiple Deprivation
Rat
e of
alc
ohol
spe
cific
adm
issi
on
per 1
,000
pop
ulat
ion
Males Females
* A higher Index of Multiple Deprivation score represents a higher level of deprivation.

16
Indicator 3: Hospitalised admission for all conditions attributable to alcohol
a) Males
Table 3.1: Prevalence of hospitalised admission for all conditions attributable to alcohol amongst males
in 2004/05*
Local Authority Admission per 1,000 males in
2004/05
Variation from North West total
Change from
2003/04 Allerdale 11.32 +0.41 +1.02 Barrow-in-Furness 12.16 +1.25 +1.47 Blackburn with Darwen 10.92 +0.01 +1.74 Blackpool 10.46 -0.45 +0.20 Bolton 11.41 +0.50 +1.92 Burnley 13.00 +2.09 -0.03 Bury 9.54 -1.38 -0.19 Carlisle 10.96 +0.04 +0.20 Chester 7.62 -3.29 -0.01 Chorley 7.76 -3.15 -1.17 Congleton 6.61 -4.30 +0.45 Copeland 12.36 +1.45 -0.10 Crewe & Nantwich 8.13 -2.78 +0.34 Eden 7.10 -3.81 +0.52 Ellesmere Port & Neston 9.35 -1.56 +0.51 Fylde 6.09 -4.82 +0.15 Halton 13.68 +2.77 -0.32 Hyndburn 10.13 -0.78 +1.67 Knowsley 14.05 +3.14 +0.44 Lancaster 10.63 -0.28 +0.29 Liverpool 15.22 +4.31 +0.51 Macclesfield 8.20 -2.71 +0.69
Manchester 14.27 +3.36 +1.95 Oldham 10.87 -0.04 -0.37 Pendle 10.85 -0.06 +0.08 Preston 10.65 -0.26 -0.83
Ribble Valley 6.28 -4.63 +0.31 Rochdale 11.82 +0.91 +0.74 Rossendale 10.63 -0.28 +0.07 Salford 13.27 +2.36 +1.83 Sefton 11.13 +0.22 +0.43 South Lakeland 8.34 -2.57 +0.89
South Ribble 7.22 -3.69 -0.72 St. Helens 13.18 +2.27 +1.18 Stockport 10.40 -0.51 +0.83 Tameside 11.62 +0.71 +0.73 Trafford 8.36 -2.56 +0.62 Vale Royal 7.40 -3.52 -0.12 Warrington 11.56 +0.65 +0.75 West Lancashire 9.50 -1.41 -0.43 Wigan 10.14 -0.77 +0.69 Wirral 13.23 +2.32 +1.25 Wyre 6.93 -3.98 +0.59 North West 10.91 N/A +0.63 *Figures in this table may not add up exactly due to rounding.
Map 3.1: Prevalence of
hospitalised admission for all conditions attributable to alcohol amongst males in
2004/05
Male hospitalised admission per
1,000 population
6.09 to 7.76 >7.76 to 9.54 >9.54 to 11.13 >11.13 to 12.36 >12.36 to 15.22

17
Indicator 3: Hospitalised admission for all conditions attributable to alcohol
a) Males In 2004/05 in the North West, the prevalence of hospitalised admission for alcohol attributable conditions was 8.37 individuals per 1,000 of the total population (including both those conditions specific to alcohol – see Indicator 2 – and those for which alcohol is a known contributor; Box 3.1). This rate has increased from 7.88 per 1,000 in 2003/04. Amongst males, this rate was higher at 10.91 per 1,000 of the population (for females the rate was 6.00 per 1,000; Indicator 2b), and this has increased from 10.28 per 1,000 in 2003/04. Rates of male admission varied greatly across the region, ranging from 6.09 per 1,000 in Fylde to nearly triple that in Liverpool at 15.22 per 1,000. Both of these local authorities have seen increases in the rate of admission since 2003/04 (Liverpool by 0.51 per 1,000 and Fylde by 0.15 per 1,000). In total in 2004/05, 32 local authorities saw an increase in the rate of hospitalised admission for alcohol attributable conditions amongst males compared to 2003/04 with Manchester seeing the highest increase (from 12.33 to 14.27 per 1,000 population). In comparison, 11 Local Authorities experienced a decrease, with Chorley seeing the largest decrease (from 8.93 to 7.76 per 1,000 population). The rate of male hospitalised admission attributable to alcohol showed a strong correlation with deprivation (R2 = 0.79; Figure 3.3), with the rate of hospitalised admission increasing with higher levels of deprivation.
Box 3.1: Indicator description The codes from the World Health Organization’s International Classification of Disease(ICD) were used to extract data on all those aged under 85 years who had beenadmitted to hospital for an alcohol attributable cause or condition between the financialyears 2003/04 and 2004/05 (Bellis et al. 2005; WHO 1992). The conditions can becategorised into two distinct areas: • Conditions that are classified as being wholly related to alcohol (such as alcohol
overdose or, through long-term alcohol misuse, conditions such as alcoholic livercirrhosis) – see Appendix 1 for the full list of conditions included; and
• Conditions for which alcohol is a contributory factor in some cases (such conditionsinclude liver cancer, stomach cancer, stroke or unintentional injury and assault) –see Appendix 2 for the full list of conditions included.
This indicator encompasses both categories (the former is also discussedindependently in this report - Indicator 2). In order to calculate the incidence of thelatter, the Strategy Unit (2003) has determined alcohol attributable fractions (AAFs),which indicate the estimated proportion of individual conditions for which alcohol is acontributory factor. For example, stomach cancer has an AAF of 0.20 or 20 per cent as20 per cent of cases are thought to occur as a result of alcohol misuse. As such, tocalculate the number of hospital episodes attributable to alcohol, the total number ofdeaths in each classification is multiplied by the appropriate AAF. Some conditions have more than one attributable fraction that can be used todetermine the rate of incidence. In such cases, the fractions are averaged using themean to produce the final estimate. The number in each code is then summed toproduce the total number of alcohol-attributable hospital admissions per 1,000 of thepopulation.

18
Indicator 3: Hospitalised admission for all conditions attributable to alcohol
b) Females
Table 3.2: Prevalence of hospitalised admission for all conditions attributable to alcohol amongst
females in 2004/05*
Local Authority Admission per 1,000
females in 2004/05
Variation from North
West total
Change from
2003/04
Allerdale 6.54 +0.54 +0.11 Barrow-in-Furness 7.45 +1.45 +0.77 Blackburn with Darwen 5.82 -0.18 +1.23 Blackpool 5.71 -0.29 -0.26 Bolton 6.25 +0.25 +1.09 Burnley 6.34 +0.34 -0.61 Bury 5.77 -0.23 +0.64 Carlisle 5.83 -0.17 +0.29 Chester 3.87 -2.13 +0.16 Chorley 4.47 -1.53 -0.75 Congleton 4.19 -1.81 +0.06 Copeland 7.72 +1.72 -0.10 Crewe & Nantwich 4.64 -1.36 +0.15 Eden 4.59 -1.41 +0.74 Ellesmere Port & Neston 5.01 -0.99 -0.01 Fylde 4.08 -1.92 +0.03 Halton 7.56 +1.56 +0.20 Hyndburn 5.03 -0.97 +0.47 Knowsley 6.88 +0.88 +0.10 Lancaster 6.16 +0.16 +0.61 Liverpool 7.74 +1.74 +0.05 Macclesfield 4.78 -1.22 +0.23
Manchester 7.22 +1.22 +0.91 Oldham 5.74 -0.26 +0.08 Pendle 5.58 -0.42 +0.08 Preston 5.81 -0.19 -0.77
Ribble Valley 4.13 -1.87 +0.79 Rochdale 5.80 -0.20 +0.07 Rossendale 5.86 -0.14 +0.69 Salford 6.99 +0.99 +1.01 Sefton 5.59 -0.41 +0.06 South Lakeland 4.72 -1.28 +0.47
South Ribble 4.35 -1.65 -0.72 St. Helens 6.68 +0.68 +0.32 Stockport 5.98 -0.02 +0.64 Tameside 6.55 +0.55 +0.30 Trafford 4.86 -1.14 +0.34 Vale Royal 5.03 -0.97 +0.70 Warrington 6.88 +0.88 +0.57 West Lancashire 4.85 -1.15 -0.67 Wigan 6.48 +0.48 +0.91 Wirral 7.04 +1.04 +0.36 Wyre 4.24 -1.76 +0.20 North West 6.00 N/A +0.34 *Figures in this table may not add up exactly due to rounding.
Map 3.2: Prevalence of hospitalised admission for all
conditions attributable to alcohol for females in 2004/05
Female hospitalised admission per
1,000 population
3.87 to 4.47
>4.47 to 5.03
>5.03 to 6.16
>6.16 to 7.04
>7.04 to 7.74

19
Indicator 3: Hospitalised admission for all conditions attributable to alcohol
b) Females In 2004/05 in the North West, the prevalence of hospitalised admission attributable to alcohol was 6.00 individuals per 1,000 of the female population (compared to 10.91 per 1,00 for males) (Box 3.1 for methodology), a rate that has increased from 5.65 per 1,000 in 2003/04. The rate of admission varied greatly across the region, ranging from 3.87 per 1,000 in Chester to more than double that in Liverpool at 7.74 per 1,000 of the population. In total in 2004/05, 35 local authorities saw an increase in the rate of female hospitalised admission for all conditions attributable to alcohol compared to 2003/04 with Blackburn with Darwen seeing the highest increase (from 4.59 to 5.82 per 1,000 of the population). In comparison, 11 Local Authorities experienced a decrease in rates with Preston seeing the largest decrease (from 6.58 to 5.81 per 1,000 of the population). The rate of female hospitalised admission for all conditions attributable to alcohol showed a moderate correlation with deprivation (R2 = 0.60; Figure 3.3), with the rate of hospitalised admission increasing with deprivation. However, this correlation was not as strong as that for males. Across all local authorities in the region, the rate of female alcohol attributable hospitalised admission was lower than that for males. For example in Stockport, 10.40 per 1,000 males were admitted, whereas 5.98 per 1,000 females were admitted in 2004/05. The rate of female hospitalised admission attributable to alcohol showed a strong correlation with the rate of male admission (R2 = 0.86; Figure 3.1), with the rate of female admission increasing with the rate of male admission.
Figure 3.1: Correlation between the male and female prevalence levels of hospitalised admission for all conditions attributable to alcohol in 2004/05, by Local Authority in
the North West
R2 = 0.8614
0
1
2
3
4
5
6
7
8
9
0 5 10 15 20
Rate of male admission per 1,000 population
Rat
e of
fem
ale
adm
issi
on p
er 1
,000
po
pula
tion

20
Indicator 3: Hospital admission for all conditions attributable to alcohol
c) Total population Figure 3.2: Trends in the prevalence of hospitalised admission for all conditions attributable to alcohol per 1,000 of the population by gender in the North West,
2003/04 to 2004/05
10.28 10.91
5.65 6.00
0
2
4
6
8
10
12
2003/04 2004/05
Year
Rat
e of
alc
ohol
attr
ibut
able
ad
mis
sion
per
1,0
00
popu
latio
n
Males Females
Figure 3.3: Correlation between the prevalence of hospitalised admissions for all conditions attributable to alcohol per 1,000 of the population in 2004/05 and the Index
of Multiple Deprivation* in 2004 by gender and Local Authority in the North West
R2 = 0.6048
R2 = 0.788
02468
1012141618
0 10 20 30 40 50 60
Index of Multiple Deprivation 2004
Rat
e of
adm
issi
on a
ttrib
utab
le to
al
coho
l per
1,0
00 p
opul
atio
n
Males Females
* A higher Index of Multiple Deprivation score represents a higher level of deprivation.

21
Indicator 4: Reduced life expectancy for all causes attributable to alcohol
a) Males
Table 4.1: Average projected estimates of months of life lost for all causes attributable to alcohol
amongst males in 2004*
Local Authority Number of
male months of life lost
Variation from North West total
Change from 1995
Allerdale 9.29 -1.30 +2.11 Barrow-in-Furness 19.59 +8.99 +8.22 Blackburn with Darwen 11.53 +0.93 +5.92 Blackpool 13.46 +2.87 +0.53 Bolton 11.04 +0.45 +3.51 Burnley 11.01 +0.42 +4.96 Bury 10.67 +0.07 +3.21 Carlisle 10.49 -0.11 +0.40 Chester 7.47 -3.12 +2.48 Chorley 9.36 -1.24 +1.06 Congleton 9.51 -1.09 +1.32 Copeland 4.74 -5.85 -3.60 Crewe & Nantwich 9.69 -0.90 +0.81 Eden 7.62 -2.98 +2.53 Ellesmere Port & Neston 9.64 -0.96 +4.13 Fylde 9.43 -1.17 +4.13 Halton 13.46 +2.86 +6.61 Hyndburn 12.60 +2.00 +4.73 Knowsley 10.48 -0.12 +2.28 Lancaster 8.71 -1.89 -0.30 Liverpool 13.08 +2.49 +3.08 Macclesfield 7.90 -2.69 +2.83 Manchester 13.57 +2.98 -0.25 Oldham 11.32 +0.72 +4.19 Pendle 7.39 -3.20 -0.45 Preston 8.55 -2.04 -2.07 Ribble Valley 10.99 +0.39 +6.18 Rochdale 9.22 -1.38 +2.30 Rossendale 13.31 +2.71 +5.27 Salford 13.61 +3.02 +4.75 Sefton 12.54 +1.95 +4.86 South Lakeland 6.08 -4.51 +1.33 South Ribble 12.03 +1.43 +5.79 St. Helens 8.82 -1.77 +1.74 Stockport 8.93 -1.66 +1.08 Tameside 12.75 +2.16 +5.33 Trafford 8.14 -2.46 +1.37 Vale Royal 7.77 -2.82 +3.79 Warrington 8.25 -2.34 +0.14 West Lancashire 11.03 +0.44 +5.52 Wigan 9.26 -1.33 +3.59 Wirral 10.88 +0.29 -0.26 Wyre 10.85 +0.26 +1.50 North West 10.59 N/A +2.52 *Figures in this table may not add up exactly due to rounding.
Map 4.1: Average projected estimate of months of life lost for all causes attributable to alcohol amongst males in
2004
Number of months of life lost
amongst males
4.74 to 6.08 >6.08 to 8.25 >8.25 to 9.69 >9.69 to 12.03 >12.03 to 19.59

22
Indicator 4: Reduced life expectancy for all causes attributable to alcohol
a) Males Across the North West, male life expectancy was reduced by an average of 10.59 months due to excessive alcohol consumption in 2004. This has increased from 8.07 months lost in 1995, although the North West has seen a decrease compared to 2003 (10.76 months lost). The contribution of alcohol to life expectancy varied widely throughout the region during this period. Males in Barrow-in-Furness suffered by far the greatest burden in 2004, with over one and a half years of life lost through alcohol. This was nine months above the regional average and almost six months greater than the second highest area of Salford (which suffered nearly 14 months of life lost). Barrow-in-Furness has also seen the greatest increase in months of life lost through alcohol over the last decade, with the number of months lost increasing by more than eight months. In comparison, alcohol has had the least impact on life expectancy among males in Copeland, although it was still responsible for almost five months of life lost in 2004. The Local Authority also saw a decrease in the number of months of life lost attributable to alcohol over the last decade, with the number decreasing by three and a half months. In total in the North West, 37 local authorities saw an increase in alcohol attributable reduced life expectancy compared to 1995, whilst only six witnessed a decrease (including Copeland, Pendle and Preston). Reduced life expectancy (attributable to alcohol) amongst males showed a weak correlation with deprivation (R2 = 0.24; Figure 4.3), with reduced life expectancy not necessarily increasing with higher levels of deprivation.
Box 4.1: Indicator description The codes from the World Health Organization’s International Classification of Disease(ICD) were used to extract data on all those aged under 75 years who had died from analcohol attributable cause or condition between 1995 and 2004 (Bellis et al. 2005; WHO1992). The conditions can be categorised into two distinct areas: • Conditions that are classified as being wholly related to alcohol (such as alcohol
overdose or, through long-term alcohol misuse, conditions such as alcoholic livercirrhosis) – see Appendix 1 for the full list of conditions included; and
• Conditions for which alcohol is a contributory factor in some cases (such conditionsinclude liver cancer, stomach cancer, stroke or unintentional injury and assault) – seeAppendix 2 for the full list of conditions included.
This indicator encompasses both categories (see Appendix 3 for the full list of conditionsincluded). In order to calculate the incidence of the latter, the Strategy Unit (2003) has determined analcohol attributable fraction (AAF), which can be applied to the number of conditions wherealcohol was a contributory factor. For example, stomach cancer has an AAF of 0.20 or 20per cent as 20 per cent of cases are thought to be as a result of alcohol misuse. As such,to calculate the number of deaths attributable to alcohol, the total number of deaths in eachclassification is multiplied by the appropriate AAF. The calculations used to estimate the number of months of life lost attributable to alcoholare described by Bellis et al. (2005).
23
Indicator 4: Reduced life expectancy for all causes attributable to alcohol
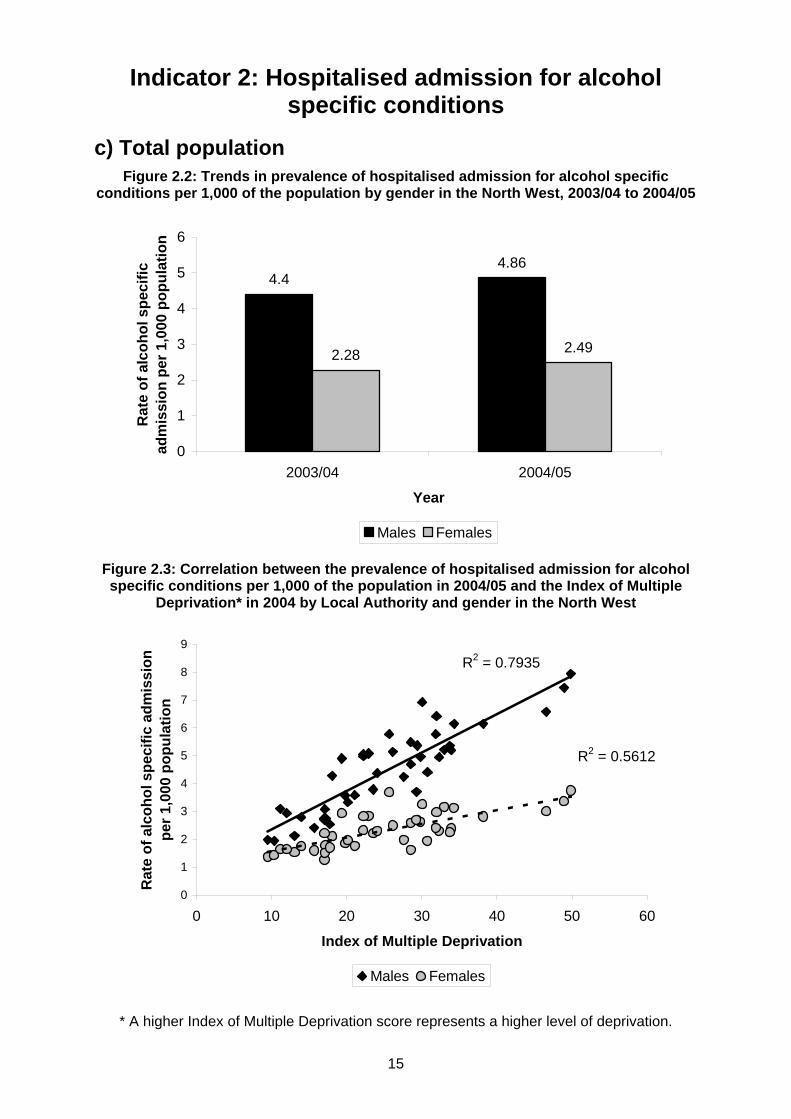
b) Females Table 4.2: Average projected estimates of months of life lost for all causes attributable to alcohol amongst
females in 2004*
Local Authority Number of
female months of life lost
Variation from North West total
Change from 1995
Allerdale 3.35 -2.74 -2.40 Barrow-in-Furness 3.71 -2.39 -0.44 Blackburn with Darwen 7.24 +1.15 +3.07 Blackpool 13.90 +7.81 +7.61 Bolton 6.76 +0.66 +0.81 Burnley 4.09 -2.00 -1.69 Bury 4.92 -1.18 +1.17 Carlisle 4.88 -1.21 +1.43 Chester 3.21 -2.89 +0.92 Chorley 6.68 +0.58 +3.01 Congleton 6.28 +0.18 +2.96 Copeland 7.08 +0.98 +3.37 Crewe & Nantwich 6.10 0.00 +2.29 Eden 2.65 -3.45 -3.11 Ellesmere Port & Neston 3.32 -2.78 -0.47 Fylde 9.58 +3.49 +3.37 Halton 10.43 +4.33 +6.69 Hyndburn 4.36 -1.74 +1.13 Knowsley 5.73 -0.37 -0.82 Lancaster 4.81 -1.28 +1.10 Liverpool 8.65 +2.56 +2.16 Macclesfield 6.05 -0.04 +2.72 Manchester 7.24 +1.14 +1.11 Oldham 7.71 +1.61 +4.03 Pendle 5.48 -0.62 +3.05 Preston 6.80 +0.70 +0.97 Ribble Valley 1.53 -4.56 -2.30 Rochdale 4.75 -1.35 -0.19 Rossendale 7.95 +1.85 +3.46 Salford 6.40 +0.31 -0.03 Sefton 7.05 +0.95 +3.06 South Lakeland 3.19 -2.90 +0.71 South Ribble 2.64 -3.46 -2.60 St. Helens 6.28 +0.19 +1.07 Stockport 4.45 -1.65 +0.51 Tameside 6.48 +0.38 +2.12 Trafford 4.43 -1.66 +0.20 Vale Royal 6.98 +0.88 +2.25 Warrington 7.50 +1.41 +3.13 West Lancashire 3.68 -2.42 -1.75 Wigan 5.39 -0.70 +1.60 Wirral 4.69 -1.40 +0.08 Wyre 6.13 +0.03 +1.04 North West 6.10 N/A +1.43 *Figures in this table may not add up exactly due to rounding.
Map 4.2: Average projected
estimate of months of life lost for all causes attributable to alcohol amongst females in
2004
Number of months of life lost amongst females
1.53 to 3.71
>3.71 to 4.92
>4.92 to 6.68
>6.68 to 8.65
>8.65 to 13.90

24
Indicator 4: Reduced life expectancy for all causes attributable to alcohol
b) Females Female life expectancy in the North West was reduced by an average of 6.10 months due to excessive alcohol consumption in 2004 (Box 4.1 for methodology), its highest point in the last decade (in 1995, 4.66 months were lost). The contribution of alcohol to life expectancy varied widely across the region. Females in Blackpool experienced the largest number of months of life lost, with nearly 14 months lost (more than double the regional average). In comparison, alcohol had the least impact on life expectancy in Ribble Valley where 1.53 months were lost. In total, 32 local authorities saw an increase in alcohol attributable reduced life expectancy compared to 1995 (with Blackpool seeing the highest increase from 6.29 to 13.90 months), whilst 11 Local Authorities experienced a decrease (Eden saw the largest decrease from 5.75 to 2.65 months). In general in the North West in 2004, males experienced a higher number of months lost through excessive alcohol consumption. For example, in Eden male expectancy was reduced by an average of 7.62 months, whilst for females it was reduced by 2.65 months. However, in Blackpool, Copeland and Fylde, the situation was reversed and females experienced a higher number of months lost (Table 4.3).
Table 4.3: Average projected estimate of months of life lost for all causes attributable to alcohol in 2004 in Blackpool, Copeland and Fylde, by gender
Local Authority Males Females Blackpool 13.46 13.90 Copeland 4.74 7.08 Fylde 9.43 9.58
Although there was some correlation between male and female alcohol-attributable months of life lost (R2 = 0.05; Figure 4.1), this was very limited. So the rate of female months of life lost did not necessarily increase with that of males’. There was also negligible correlation evident between months of life lost for females with levels of deprivation (R2 = 0.14; Figure 4.3), with reduced life expectancy not necessarily increasing with higher levels of deprivation.
Figure 4.1: Correlation between male and female months of life lost for all causes attributable to alcohol in 2004, by Local Authority in the North West
R2 = 0.0469
0
2
4
6
8
10
12
14
16
0 5 10 15 20 25
Number of male months of life lost
Num
ber o
f fem
ale
mon
ths
of li
fe
lost
25
Indicator 4: Reduced life expectancy for all causes attributable to alcohol
c) Total population
Figure 4.2: Trends in estimates for months of life lost for all causes attributable to alcohol in the North West by gender, 1995 to 2004
02468
1012
1995 1996 1997 1998 1999 2000 2001 2002 2003 2004
Year
Num
ber o
f mon
ths
of li
fe
lost
Males Females Figure 4.3: Correlation between estimates for months of life lost for all causes attributable to alcohol and the Index of Multiple Deprivation* in 2004 by Local
Authority and gender in the North West
R2 = 0.141
R2 = 0.2426
0
5
10
15
20
25
0 10 20 30 40 50 60
Index of Multiple Deprivation 2004
Num
ber o
f mon
ths
of li
fe lo
st
Males Females * A higher Index of Multiple Deprivation score represents a higher level of deprivation.

26
Box 5.1: Indicator description Recorded crime attributable to alcohol is the total number of recorded crimes attributable toalcohol, calculated using the Strategy Unit attributable fractions. These fractions weretaken from the NEW-ADAM arrestee survey and are based on urine tests of arrestees(Strategy Unit 2003). The proportion of arrestees testing positive for alcohol (and thus theattributable fractions) are shown in Table 5.1. The number in each crime category is then summed to produce the total number of crimesattributable to alcohol per 1,000 of the population. Changes in how crime is reported in England and Wales mean trends are difficult tomeasure. Specifically, the National Crime Recording Standard (NCRS; introduced in 2002)required police to record all known incidents of crimes, regardless of whether thoseinvolved intended to press charges. The impact of these changes led to an estimated 10per cent increase in total recorded crime in 2002/03 compared to 2001/02, with violentcrime most affected (Box 6.1; Simmons et al. 2003). Given these changes, for thepurposes of this report changes in crime have been measured from 2002/03. In addition,other changes to recorded crime have occurred since the introduction of the NCRSincluding those introduced through the Sexual Offences Act 2003 (Box 7.1). Thus trendsreported here should be treated with caution.
Indicator 5: All recorded crime attributable to alcohol
In 2004/05, police in the North West recorded 780,105 crimes (Nicholas et al. 2005), of which 208,958 were estimated to have been attributable to alcohol (Box 5.1), providing a regional rate of 11.42 alcohol attributable crimes per 1,000 of the population. Rates of alcohol-related crime varied widely across the region. The highest levels were seen in the largest cities, with rates of 20.23 per 1,000 in Manchester (nearly twice the regional average) and 19.41 in Liverpool, while the lowest rates were in Ribble Valley (3.84 per 1,000) and Congleton (4.94 per 1,000). Alcohol-related crime in the North West correlated strongly with deprivation, with alcohol-related crime increasing with higher levels of deprivation (R2 = 0.74; Figure 5.2) Trends in alcohol attributable crime are difficult to measure as the crime recording system is continually changing with major changes seen in the recording of both violent and sexual crimes in recent years (Box 5.1 and Box 7.1). Without accounting for such changes, the North West as a whole has seen an increase of 0.87 alcohol-related crimes per 1,000 population since 2002/03 and most local authority areas have recorded an increase over this period, with the highest increase noted in Blackpool (by 8.92 alcohol attributable crimes per 1,000 population) and Burnley (by 4.23 per 1,000). However, rates in 11 local authorities have decreased since 2002/03, with the greatest decreases seen in Oldham (by 3.51 per 1,000) and Trafford (by 2.97 per 1,000).
Table 5.1: Alcohol attributable fractions for recorded crime in England, by category
Crime category Attributable fraction (%) Criminal damage 0.47 (47%) Violence against the person 0.37 (37%) Other 0.26 (26%) Drug offences 0.19 (19%) Burglary 0.17 (17%) Fraud and forgery 0.16 (16%) Sexual offences 0.13 (13%) Theft and handling stolen goods 0.13 (13%) Robbery 0.12 (12%) Source: Strategy Unit (2003).

27
Indicator 5: All recorded crime attributable to alcohol
Table 5.2: All recorded crime attributable to alcohol, rate per 1,000 of the population in 2004/05*
Local Authority Crime per 1,000 in 2004/05
Variation from North West total
Change since
2002/03 Allerdale 8.32 -3.10 +0.49 Barrow-in-Furness 11.73 +0.31 +3.88 Blackburn with Darwen 13.03 +1.61 +3.35 Blackpool 18.29 +6.87 +8.92 Bolton 12.29 +0.87 -1.79 Burnley 14.04 +2.62 +4.23 Bury 9.51 -1.91 -2.32 Carlisle 10.74 -0.68 +2.41 Chester 8.79 -2.63 +0.04 Chorley 8.85 -2.57 +3.47 Congleton 4.94 -6.48 +0.29 Copeland 9.32 -2.10 +2.72 Crewe & Nantwich 7.95 -3.47 +1.35 Eden 5.19 -6.23 +1.26 Ellesmere Port & Neston 8.77 -2.65 +2.01 Fylde 5.71 -5.71 +2.28 Halton 11.88 +0.46 +2.87 Hyndburn 9.53 -1.89 +2.18 Knowsley 11.49 +0.07 +1.15 Lancaster 10.27 -1.15 +3.09 Liverpool 19.41 +7.99 +3.43 Macclesfield 6.74 -4.68 -0.03 Manchester 20.23 +8.81 -2.84 Oldham 10.91 -0.51 -3.51 Pendle 9.91 -1.51 +2.46 Preston 15.57 +4.15 +3.64 Ribble Valley 3.84 -7.58 +0.12 Rochdale 13.40 +1.98 -0.77 Rossendale 9.42 -2.00 +2.86 Salford 13.10 +1.68 -1.97 Sefton 8.65 -2.77 +1.50 South Lakeland 5.88 -5.54 +2.31 South Ribble 7.90 -3.52 +3.04 St. Helens 11.60 +0.18 +2.15 Stockport 10.10 -1.32 -0.39 Tameside 12.73 +1.31 -0.28 Trafford 9.71 -1.71 -2.97 Vale Royal 7.62 -3.80 +0.41 Warrington 8.89 -2.53 +2.12 West Lancashire 6.79 -4.63 +2.16 Wigan 9.32 -2.10 -0.60 Wirral 10.16 -1.26 +1.26 Wyre 6.14 -5.28 +1.66 North West 11.42 N/A +0.87 *Figures in this table may not add up exactly due to rounding.
Map 5.1: All recorded crime attributable to alcohol, rate per
1,000 of the population in 2004/05
Recorded crime attributable to alcohol per 1,000 population
3.84 to 6.79 >6.79 to 8.89 >8.89 to 10.91 >10.91 to 15.57 >15.57 to 20.23

28
Indicator 5: All recorded crime attributable to alcohol
Figure 5.1: Trends in all recorded crime attributable to alcohol, rate per 1,000 of the population in the North West, 2002/03 and 2004/05
10.5511.42
0
2
4
6
8
10
12
14
16
2002/03 2004/05
Year
Rat
e of
all
crim
es a
ttrib
utab
le to
al
coho
l per
1,0
00 p
opul
atio
n
Figure 5.2: Correlation between the rate of all recorded crime attributable to alcohol per 1,000 of the population in 2004/05 and Index of Multiple Deprivation* in 2004 by
Local Authority in the North West
R2 = 0.7391
0
5
10
15
20
25
0 10 20 30 40 50 60
Index of Multiple Deprivation 2004
Rat
e of
all
crim
e at
trib
utab
le to
al
coho
l per
1,0
00 p
opul
atio
n
* A higher Index of Multiple Deprivation score represents a higher level of deprivation.

29
Box 6.1: Indicator description The indicator All violent offences attributable to alcohol has been calculated by applying the Strategy Unit attributable fraction for violence against the person (0.37) to thetotal number of violent crimes (Box 5.1). These figures are then calculated into rates per1,000 of the population. The sub-categories of Wounding, More serious violence and Less serious violence (see Appendix 4) include the counting codes shown in Table 6.1. Assault on a police officer is included in this report as a separate indicator, although thesefigures are also included in the Less serious violence category (code 104). Violent crime was the most affected category of crime when the National Crime RecordingStandard was introduced in 2002 (Box 5.1) – estimated to have increased by 23% between 2002/02 and 2002/03 following changes in recording methods (Simmons et al.2003). Thus, trends in alcohol attributable violence reported here will reflect these changesand are largely not indicative of the direction of the actual incidence of violent crime. Rates of violent offences can also reflect police practice; for example, increased police activity todetect violence and punish offenders can lead to increased recorded rates of violence.Thus increased levels of recorded violence may reflect improved detection.
Indicator 6: All violent offences attributable to alcohol
In 2004/05, police in the North West recorded a total of 143,773 offences for violence against the person, of which an estimated 53,196 (37%; Box 5.1) were attributable to alcohol, equating to 7.79 alcohol attributable violent offences per 1,000 individuals. At a local authority level, Blackpool had the highest rate of alcohol attributable violent offences, at 15.01 per 1,000 of the population; almost 50 per cent higher than the North West average. This was followed by Liverpool (13.56 per 1,000) and Manchester (11.83 per 1,000). The lowest rates were found in Ribble Valley (2.77 per 1,000) and Congleton (3.46 per 1,000). Alcohol attributable violent crime in the region correlated moderately with deprivation, with offences increasing with higher levels of deprivation (R2 = 0.59; Figure 6.2). To provide further details, data for sub-categories of violence have been provided. These include more serious violence, wounding and less serious violence (Box 6.1). Correlations of these with deprivation showed a variety of correlation levels with less serious violent offences attributable to alcohol showing a negligible correlation (R2 = 0.02; Figure 6.8), and wounding attributable to alcohol showing a moderate correlation (R2 = 0.64; Figure 6.6). Changes to crime recording in 2002 strongly impacted on recorded violent crime (Box 5.1) and thus trends in actual incidence are difficult to measure. These changes will explain much of the increase in recorded violence in the North West. Across the region, the rate of alcohol attributable violence increased by 2.14 offences per 1,000 individuals between 2002/03 and 2004/05. The increase was highest in Blackpool, Liverpool and Burnley. However, despite the changes, three Local Authorities saw a decrease (Bury, Oldham and Trafford).
Table 6.1: Counting codes used to inform the sub-categories of violent crime
More serious violence Wounding Less serious
violence 1 5 104 2 6 105A 3 7 105B
37.1 8A 11 4.1 8B 12 4.2 8C 13 4.3 8D 14
4.4/6 8E 15

30
Indicator 6: All violent offences attributable to alcohol
Table 6.2: All violent offences attributable to alcohol, rate per 1,000 of the population in
2004/05*
Local Authority
Violent offences related to alcohol
per 1,000
Variation from North West total
Change from
2002/03
Allerdale 6.34 -1.45 +1.70 Barrow-in-Furness 10.06 +2.27 +4.14 Blackburn with Darwen 9.77 +1.98 +4.49 Blackpool 15.01 +7.22 +9.28 Bolton 7.32 -0.47 +0.65 Burnley 10.53 +2.74 +4.96 Bury 5.65 -2.14 -0.40 Carlisle 7.96 +0.17 +2.59 Chester 6.31 -1.47 +1.14 Chorley 6.85 -0.94 +4.08 Congleton 3.46 -4.33 +0.98 Copeland 7.70 -0.09 +3.02 Crewe & Nantwich 5.88 -1.91 +1.62 Eden 4.00 -3.79 +1.20 Ellesmere Port & Neston 5.87 -1.92 +2.04 Fylde 4.24 -3.55 +2.42 Halton 8.63 +0.84 +3.32 Hyndburn 7.08 -0.71 +2.66 Knowsley 7.34 -0.45 +1.29 Lancaster 8.46 +0.67 +4.10 Liverpool 13.56 +5.77 +5.01 Macclesfield 4.44 -3.35 +1.03 Manchester 11.83 +4.04 +0.83 Oldham 6.95 -0.84 -0.40 Pendle 7.02 -0.77 +2.79 Preston 11.76 +3.97 +4.93 Ribble Valley 2.77 -5.02 +0.73 Rochdale 9.10 +1.31 +1.63 Rossendale 6.66 -1.13 +3.31 Salford 7.52 -0.27 +0.76 Sefton 6.02 -1.77 +2.06 South Lakeland 4.94 -2.85 +2.47 South Ribble 6.20 -1.59 +3.23 St. Helens 8.43 +0.64 +3.38 Stockport 5.81 -1.98 +0.83 Tameside 8.84 +1.05 +2.04 Trafford 5.71 -2.08 -0.54 Vale Royal 5.51 -2.28 +1.33 Warrington 6.12 -1.67 +2.56 West Lancashire 4.92 -2.87 +2.70 Wigan 5.82 -1.96 +0.36 Wirral 7.47 -0.32 +2.06 Wyre 4.81 -2.98 +2.18 North West 7.79 N/A +2.14
*Figures in this table may not add up exactly due to rounding.
Map 6.1: All violent offences attributable to alcohol, rate per
1,000 of the population in 2004/05
Violent offences attributable to alcohol per 1,000 population
2.77 to 4.94 >4.94 to 6.34 >6.34 to 7.96 >7.96 to 10.53 >10.53 to 15.01

31
Indicator 6: All violent offences attributable to alcohol
Figure 6.1: Trends in all violent offences attributable to alcohol, rate per 1,000 of the population in the North West from 2002/03 to 2004/05
5.65
6.967.79
0
1
2
3
4
5
6
7
8
9
2002/03 2003/04 2004/05
Year
Rat
e of
all
viol
ent o
ffenc
es a
ttrib
utab
le
to a
lcoh
ol p
er 1
,000
pop
ulat
ion
Figure 6.2: Correlation between the rate of all violent offences attributable to alcohol
per 1,000 of the population in 2004/05 and the Index of Multiple Deprivation* in 2004 by Local Authority in the North West
R2 = 0.593
0
2
4
6
8
10
12
14
16
0 10 20 30 40 50 60
Index of Multiple Deprivation
Rat
e of
vio
lent
crim
e at
trib
utab
le
to a
lcoh
ol p
er 1
,000
pop
ulat
ion
* A higher Index of Multiple Deprivation score represents a higher level of deprivation.

32
Indicator 6: All violent offences attributable to alcohol
a) More serious violence Table 6.3: More serious violent offences
attributable to alcohol, rate per 1,000 of the population in 2004/05*
Local Authority
More serious violence
per 1,000 in 2004/05
Variation from North
West total
Change from
2002/03
Allerdale 0.16 -0.03 +0.02 Barrow-in-Furness 0.09 -0.10 +0.04 Blackburn with Darwen 0.22 +0.03 +0.07 Blackpool 0.17 -0.02 +0.05 Bolton 0.15 -0.04 +0.03 Burnley 0.18 -0.01 +0.10 Bury 0.17 -0.02 -0.01 Carlisle 0.15 -0.04 +0.10 Chester 0.11 -0.08 +0.04 Chorley 0.13 -0.06 +0.07 Congleton 0.02 -0.17 -0.01 Copeland 0.20 +0.01 +0.12 Crewe & Nantwich 0.11 -0.08 +0.06 Eden 0.12 -0.07 +0.10 Ellesmere Port & Neston 0.17 -0.02 +0.11 Fylde 0.07 -0.12 +0.05 Halton 0.17 -0.02 +0.08 Hyndburn 0.08 -0.11 -0.05 Knowsley 0.34 +0.15 +0.01 Lancaster 0.10 -0.09 +0.02 Liverpool 0.43 +0.24 +0.03 Macclesfield 0.07 -0.12 +0.05 Manchester 0.43 +0.24 +0.03 Oldham 0.12 -0.07 -0.03 Pendle 0.10 -0.09 +0.05 Preston 0.26 +0.07 +0.16 Ribble Valley 0.05 -0.14 +0.03 Rochdale 0.22 +0.03 +0.10 Rossendale 0.16 -0.03 +0.09 Salford 0.28 +0.09 +0.11 Sefton 0.11 -0.08 +0.04 South Lakeland 0.14 -0.05 +0.09 South Ribble 0.15 -0.04 +0.10 St. Helens 0.19 0.00 +0.06 Stockport 0.22 +0.03 +0.08 Tameside 0.19 0.00 -0.25 Trafford 0.23 +0.04 0.00 Vale Royal 0.06 -0.13 0.00 Warrington 0.13 -0.06 +0.08 West Lancashire 0.12 -0.07 +0.06 Wigan 0.13 -0.06 +0.03 Wirral 0.14 -0.05 -0.02 Wyre 0.10 -0.09 +0.06 North West 0.19 N/A +0.04 *Figures in this table may not add up exactly due to rounding.
Map 6.2: Mores serious violent
offences attributable to alcohol, rate per 1,000 of the
population in 2004/05
More serious violent offences attributable to alcohol, per 1,000
population
0.02 to 0.08 >0.08 to 0.14 >0.14 to 0.20 >0.20 to 0.28 >0.28 to 0.43

33
Indicator 6: All violent offences attributable to alcohol
a) More serious violence
Figure 6.3: Trends in more serious violent offences attributable to alcohol, rate per 1,000 of the population in the North West, 2002/03 to 2004/05
0.150.18 0.19
0
0.1
0.2
0.3
0.4
0.5
2002/03 2003/04 2004/05
Year
Rat
e of
mor
e se
rious
vio
lent
crim
e at
trib
utab
le to
alc
ohol
per
1,0
00
popu
latio
n
Figure 6.4: Correlation between the rate of more serious violent offences attributable
to alcohol per 1,000 of the population in 2004/05 and the Index of Multiple Deprivation* in 2004 by Local Authority in the North West
R2 = 0.5993
0
0.1
0.2
0.3
0.4
0.5
0 10 20 30 40 50 60
Index of Multiple Deprivation
Rat
e of
mor
e se
rious
vio
lent
cr
ime
attr
ibut
able
to a
lcoh
ol p
er
1,00
0 po
pula
tion
* A higher Index of Multiple Deprivation score represents a higher level of deprivation.

34
Indicator 6: All violent offences attributable to alcohol b) Wounding offences
Table 6.4: Wounding offences attributable to alcohol, rate per 1,000 of the population in 2004/05*
Local Authority Wounding
per 1,000 in 2004/05
Variation from North West total
Change from
2002/03 Allerdale 4.85 -1.11 +1.40 Barrow-in-Furness 7.90 +1.94 +3.30 Blackburn with Darwen 6.78 +0.82 +3.04 Blackpool 11.04 +5.08 +6.65 Bolton 5.89 -0.07 +0.52 Burnley 8.45 +2.49 +4.27 Bury 4.77 -1.19 -0.03 Carlisle 6.03 +0.07 +2.58 Chester 3.58 -2.38 +1.11 Chorley 5.16 -0.80 +3.02 Congleton 1.77 -4.19 +0.38 Copeland 5.97 +0.01 +2.15 Crewe & Nantwich 2.97 -2.99 +0.85 Eden 3.00 -2.96 +1.06 Ellesmere Port & Neston 2.82 -3.14 +1.03 Fylde 3.02 -2.94 +1.65 Halton 4.10 -1.86 +0.97 Hyndburn 5.10 -0.86 +1.91 Knowsley 5.54 -0.42 +1.91 Lancaster 6.29 +0.33 +3.20 Liverpool 11.15 +5.19 +5.38 Macclesfield 2.46 -3.50 +0.51 Manchester 9.79 +3.83 +0.98 Oldham 5.98 +0.02 -0.24 Pendle 5.26 -0.70 +2.11 Preston 8.33 +2.37 +3.41 Ribble Valley 1.97 -3.99 +0.46 Rochdale 7.48 +1.52 +1.43 Rossendale 5.01 -0.95 +2.56 Salford 6.29 +0.33 +0.85 Sefton 4.71 -1.25 +2.08 South Lakeland 3.87 -2.09 +2.09 South Ribble 4.57 -1.39 +2.22 St. Helens 6.64 +0.68 +2.72 Stockport 4.68 -1.28 +0.76 Tameside 7.40 1.44 +2.04 Trafford 4.71 -1.25 -0.13 Vale Royal 2.52 -3.44 +0.22 Warrington 3.53 -2.43 +1.54 West Lancashire 3.63 -2.33 +1.95 Wigan 4.96 -1.00 +0.53 Wirral 5.89 -0.07 +1.88 Wyre 3.52 -2.44 +1.46 North West 5.96 N/A +1.79 *Figures in this table may not add up exactly due to rounding.
Map 6.3: Wounding offences
attributable to alcohol by Local Authority rate per 1,000 of the population in 2004/05
Wounding offences attributable to alcohol, per 1,000 population
1.77 to 3.02 >3.02 to 4.10 >4.10 to 5.54 >5.54 to 7.90 >7.90 to 11.15

35
Indicator 6: All violent offences attributable to alcohol
b) Wounding offences
Figure 6.5: Trends in wounding offences attributable to alcohol, rate per 1,000 of the population in the North West, 2002/03 to 2004/05
4.16
5.245.96
0
1
2
3
4
5
6
7
2002/03 2003/04 2004/05
Year
Rat
e of
wou
ndin
g of
fenc
es
attr
ibut
able
to a
lcoh
ol p
er
1,00
0 po
pula
tion
Figure 6.6: Correlation between the rate of wounding offences attributable to alcohol
per 1,000 of the population in 2004/05 and the Index of Multiple Deprivation* in 2004 by Local Authority in the North West
R2 = 0.6413
0
2
4
6
8
10
12
0 10 20 30 40 50 60
Index of Multiple Deprivation
Rat
e of
wou
ndin
g of
fenc
es
attr
ibut
able
to a
lcoh
ol p
er 1
,000
po
pula
tion
* A higher Index of Multiple Deprivation score represents a higher level of deprivation.

36
Indicator 6: All violent offences attributable to alcohol
c) Less serious violence Table 6.5: Less serious violent offences attributable
to alcohol, rate per 1,000 of the population in 2004/05*
Local Authority Less serious violence per
1,000 in 2004/05
Variation from North West total
Change from
2002/03
Allerdale 1.33 -0.31 +0.28 Barrow-in-Furness 2.07 +0.43 +0.79 Blackburn with Darwen 2.77 +1.13 +1.38 Blackpool 3.80 +2.16 +2.58 Bolton 1.28 -0.36 +0.09 Burnley 1.90 +0.26 +0.58 Bury 0.72 -0.92 -0.36 Carlisle 1.78 +0.14 -0.08 Chester 2.62 +0.98 -0.01 Chorley 1.56 -0.08 +0.98 Congleton 1.66 +0.02 +0.61 Copeland 1.53 -0.11 +0.75 Crewe & Nantwich 2.81 +1.17 +0.70 Eden 0.88 -0.76 +0.05 Ellesmere Port & Neston 2.89 +1.25 +0.91 Fylde 1.15 -0.49 +0.73 Halton 4.36 +2.72 +2.26 Hyndburn 1.89 +0.25 +0.80 Knowsley 1.46 -0.18 -0.62 Lancaster 2.07 +0.43 +0.88 Liverpool 1.99 +0.35 -0.40 Macclesfield 1.90 +0.26 +0.48 Manchester 1.61 -0.03 -0.18 Oldham 0.86 -0.78 -0.13 Pendle 1.65 +0.01 +0.63 Preston 3.18 +1.54 +1.36 Ribble Valley 0.74 -0.90 +0.23 Rochdale 1.40 -0.24 +0.09 Rossendale 1.50 -0.14 +0.66 Salford 0.95 -0.69 -0.20 Sefton 1.20 -0.44 -0.06 South Lakeland 0.94 -0.70 +0.30 South Ribble 1.48 -0.16 +0.91 St. Helens 1.59 -0.05 +0.60 Stockport 0.91 -0.73 +0.01 Tameside 1.25 -0.39 +0.25 Trafford 0.78 -0.86 -0.40 Vale Royal 2.93 +1.29 +1.11 Warrington 2.46 +0.82 +0.93 West Lancashire 1.17 -0.47 +0.69 Wigan 0.73 -0.91 -0.19 Wirral 1.44 -0.20 +0.21 Wyre 1.20 -0.44 +0.67 North West 1.64 N/A +0.31 *Figures in this table may not add up exactly due to rounding.
Map 6.4: Less serious violent
offences attributable to alcohol, rate per 1,000 of the
population in 2004/05 Less serious violent offences
attributable to alcohol, rate per 1,000 population
0.72 to 1.95 >0.95 to 1.33 >1.33 to 1.78 >1.78 to 2.62 >2.62 to 4.36

37
Indicator 6: All violent offences attributable to alcohol
c) Less serious violence
Figure 6.7: Trends in less serious violent offences attributable to alcohol, rate per 1,000 of the population in the North West, 2002/03 to 2004/05
1.331.54 1.64
0
1
2
3
2002/03 2003/04 2004/05
Year
Rat
e of
less
ser
ious
vio
lenc
e at
trib
utab
le to
alc
ohol
per
1,0
00
popu
latio
n
Figure 6.8: Correlation between the rate of less serious violent offences attributable to alcohol per 1,000 of the population in 2004/05 and the Index of Multiple Deprivation* in
2004 by Local Authority in the North West
R2 = 0.0229
0
1
2
3
4
5
0 10 20 30 40 50 60
Index of Multiple Deprivation
Rat
e of
less
ser
ious
vio
lent
offe
nces
at
trib
utab
le to
alc
ohol
per
1,0
00
popu
latio
n
*A higher Index of Multiple Deprivation score represents a higher level of deprivation.

38
Indicator 6: All violent offences attributable to alcohol
(i) Assaults on a constable Table 6.6: Assaults on a constable attributable to
alcohol, rate per 1,000 of the population in 2004/05*
Local Authority Assaults on a constable per
1,000 in 2004/05
Variation from North West total
Change from
2002/03
Allerdale 0.18 +0.01 +0.10 Barrow-in-Furness 0.30 +0.13 +0.06 Blackburn with Darwen 0.23 +0.06 -0.24 Blackpool 0.43 +0.26 -0.05 Bolton 0.13 -0.04 -0.11 Burnley 0.33 +0.16 -0.40 Bury 0.13 -0.04 -0.06 Carlisle 0.16 -0.01 -0.01 Chester 0.18 +0.01 -0.20 Chorley 0.10 -0.07 -0.17 Congleton 0.08 -0.09 -0.01 Copeland 0.14 -0.03 +0.01 Crewe & Nantwich 0.16 -0.01 -0.21 Eden 0.06 -0.11 -0.05 Ellesmere Port & Neston 0.10 -0.07 -0.06 Fylde 0.13 -0.04 -0.02 Halton 0.12 -0.05 -0.12 Hyndburn 0.18 +0.01 -0.27 Knowsley 0.19 +0.02 -0.14 Lancaster 0.31 +0.14 -0.20 Liverpool 0.34 +0.17 -0.39 Macclesfield 0.10 -0.07 -0.18 Manchester 0.21 +0.04 -0.44 Oldham 0.17 0.00 -0.13 Pendle 0.18 +0.01 -0.30 Preston 0.37 +0.20 -0.21 Ribble Valley 0.05 -0.12 -0.09 Rochdale 0.17 0.00 -0.09 Rossendale 0.21 +0.04 -0.21 Salford 0.15 -0.02 -0.06 Sefton 0.14 -0.03 -0.23 South Lakeland 0.10 -0.07 0.00 South Ribble 0.17 0.00 -0.11 St. Helens 0.13 -0.04 -0.14 Stockport 0.10 -0.07 -0.10 Tameside 0.20 +0.03 +0.04 Trafford 0.12 -0.05 -0.14 Vale Royal 0.12 -0.05 -0.06 Warrington 0.08 -0.09 -0.06 West Lancashire 0.08 -0.09 -0.13 Wigan 0.13 -0.04 -0.08 Wirral 0.14 -0.03 -0.14 Wyre 0.15 -0.02 -0.03 North West 0.17 N/A -0.15 *Figures in this table may not add up exactly due to rounding.
Map 6.5: Assaults on a constable attributable to alcohol
per 1,000 of the population in 2004/05
Assaults on a constable
attributable to alcohol, per 1,000 population
0.05 to 0.10 >0.10 to 0.15 >0.15 to 0.19 >0.19 to 0.23 >0.23 to 0.43

39
Indicator 6: All violent offences attributable to alcohol
(i) Assaults on a constable
Figure 6.9: Trends in assaults on a constable attributable to alcohol, rate per 1,000 of the population in the North West, 2002/03 to 2004/05
0.33
0.19 0.17
0
0.1
0.2
0.3
0.4
0.5
2002/03 2003/04 2004/05
Year
Rat
e of
ass
aults
on
a co
nsta
ble
attr
ibut
able
to a
lcoh
ol p
er 1
,000
po
pula
tion
Figure 6.10: Correlation between the rate of assaults on a constable attributable to
alcohol per 1,000 of the population in 2004/05 and the Index of Multiple Deprivation* in 2004 by Local Authority in the North West
R2 = 0.2936
0
0.1
0.2
0.3
0.4
0.5
0 10 20 30 40 50 60
Index of Multiple Deprivation
Rat
e of
ass
ault
on a
con
stab
le
attr
ibut
able
to a
lcoh
ol p
er 1
,000
po
pula
tion
*A higher Index of Multiple Deprivation score represents a higher level of deprivation.

40
Indicator 7: Sexual offences attributable to alcohol Police recorded 7,808 sexual offences in the North West in 2004/05, of which 1,015 (13% - Box 5.1) offences were estimated to be attributable to alcohol. Across the region as a whole there were 0.15 sexual offences attributable to alcohol per 1,000 of the population in 2004/05. As with other crimes, rates varied widely across the region. Manchester and Burnley had the highest rates of sexual offences at 0.31 per 1,000, followed by Blackpool (0.30) and Blackburn with Darwen (0.26). Rates were lowest in Eden (0.04), Congleton (0.05) and Allerdale (0.08). Recent changes in both recorded crime standards (through the National Criminal Recording Standards; Box 5.1) and through the introduction of the Sexual Offences Act 2003 (Box 7.1) have considerably contributed to the large increase in the rate of sexual offences in recent years. Thus across the North West, the rate of sexual offences attributable to alcohol more than doubled between 2002/03 and 2004/05 (Figure 7.1). Because of the scale of these changes, Local Authority trend data for this indicator have not been calculated. Sexual offences related to alcohol show a weak correlation with deprivation (R2 = 0.40; Figure 7.2), with the rate of sexual offences not necessarily increasing with higher levels of deprivation. Thus, this correlation is less pronounced than for other forms of violent crime (Figures 6.2, 6.4 and 6.6).
Box 7.1: Indicator details The indicator Sexual offences attributable to alcohol has been calculated by applying the Strategy Unit attributable fraction for sexual offences (13%) to the total number ofsexual offences in each Local Authority (Box 5.1). These figures are then calculated intorates per 1,000 of the population. Changes in legislation through the introduction of the National Crime Recording Standard(Box 5.1) and the Sexual Offences Act 2003 in May 2004 mean that trends are difficult to measure, and recorded crime figures for sexual offences showed a 17% increasenationally between 2003/04 and 2004/05 (Nicholas et al. 2005). The Sexual Offences Act 2003 was introduced to try to tackle the under-reporting of sexual offences, and attempts to encourage more confidence in the justice system(Nicholas et al. 2005). In doing so, the Act has redefined many of the sexual offencescovered. For example, exposure has been reclassified from indecent exposure under the‘other offences’ category to exposure under the sexual offences groups (in a new categorycalled ‘miscellaneous sexual offences’; Nicholas et al. 2005).
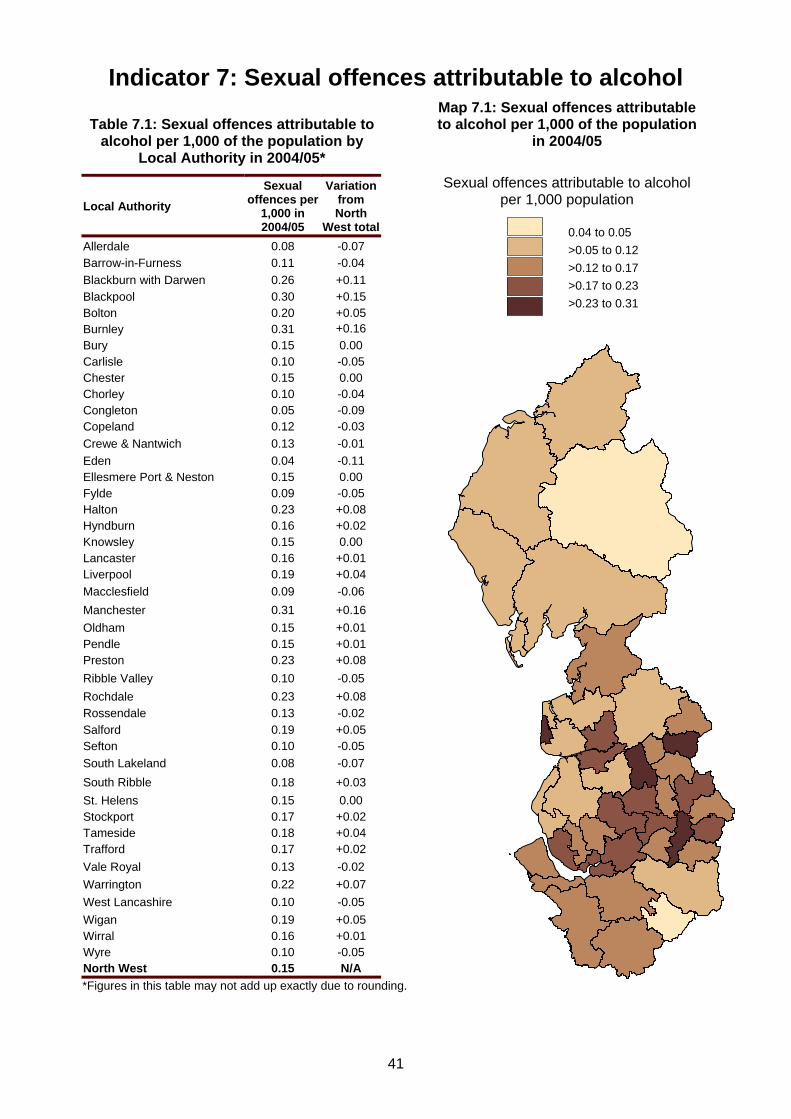
41
Indicator 7: Sexual offences attributable to alcohol
Table 7.1: Sexual offences attributable to alcohol per 1,000 of the population by
Local Authority in 2004/05*
Local Authority Sexual
offences per 1,000 in 2004/05
Variation from North
West totalAllerdale 0.08 -0.07 Barrow-in-Furness 0.11 -0.04 Blackburn with Darwen 0.26 +0.11 Blackpool 0.30 +0.15 Bolton 0.20 +0.05 Burnley 0.31 +0.16 Bury 0.15 0.00 Carlisle 0.10 -0.05 Chester 0.15 0.00 Chorley 0.10 -0.04 Congleton 0.05 -0.09 Copeland 0.12 -0.03 Crewe & Nantwich 0.13 -0.01 Eden 0.04 -0.11 Ellesmere Port & Neston 0.15 0.00 Fylde 0.09 -0.05 Halton 0.23 +0.08 Hyndburn 0.16 +0.02 Knowsley 0.15 0.00 Lancaster 0.16 +0.01 Liverpool 0.19 +0.04 Macclesfield 0.09 -0.06 Manchester 0.31 +0.16 Oldham 0.15 +0.01 Pendle 0.15 +0.01 Preston 0.23 +0.08 Ribble Valley 0.10 -0.05 Rochdale 0.23 +0.08 Rossendale 0.13 -0.02 Salford 0.19 +0.05 Sefton 0.10 -0.05 South Lakeland 0.08 -0.07 South Ribble 0.18 +0.03 St. Helens 0.15 0.00 Stockport 0.17 +0.02 Tameside 0.18 +0.04 Trafford 0.17 +0.02 Vale Royal 0.13 -0.02 Warrington 0.22 +0.07 West Lancashire 0.10 -0.05 Wigan 0.19 +0.05 Wirral 0.16 +0.01 Wyre 0.10 -0.05 North West 0.15 N/A *Figures in this table may not add up exactly due to rounding.
Map 7.1: Sexual offences attributable to alcohol per 1,000 of the population
in 2004/05 Sexual offences attributable to alcohol
per 1,000 population
0.04 to 0.05 >0.05 to 0.12 >0.12 to 0.17 >0.17 to 0.23 >0.23 to 0.31

42
Indicator 7: Sexual offences attributable to alcohol
Figure 7.1: Trends in sexual offences attributable to alcohol, rate per 1,000 of the population in the North West, 2002/03 to 2004/05
0.070.09
0.15
0.00
0.04
0.08
0.12
0.16
0.20
0.24
2002/03 2003/04 2004/05
Year
Rat
e of
sex
ual o
ffenc
es
attr
ibut
able
to a
lcoh
ol p
er 1
,000
po
pula
tion
Figure 7.2: Correlation between rate of sexual offences attributable to alcohol per
1,000 of the population in 2004/05 and Index of Multiple Deprivation in 2004* by Local Authority in the North West
R2 = 0.4021
0.00
0.05
0.10
0.15
0.20
0.25
0.30
0.35
0 10 20 30 40 50 60
Index of Multiple Deprivation
Rat
e of
sex
ual o
ffenc
es a
ttrib
utab
le
to a
lcoh
ol
* A higher Index of Multiple Deprivation score represents a higher level of deprivation.
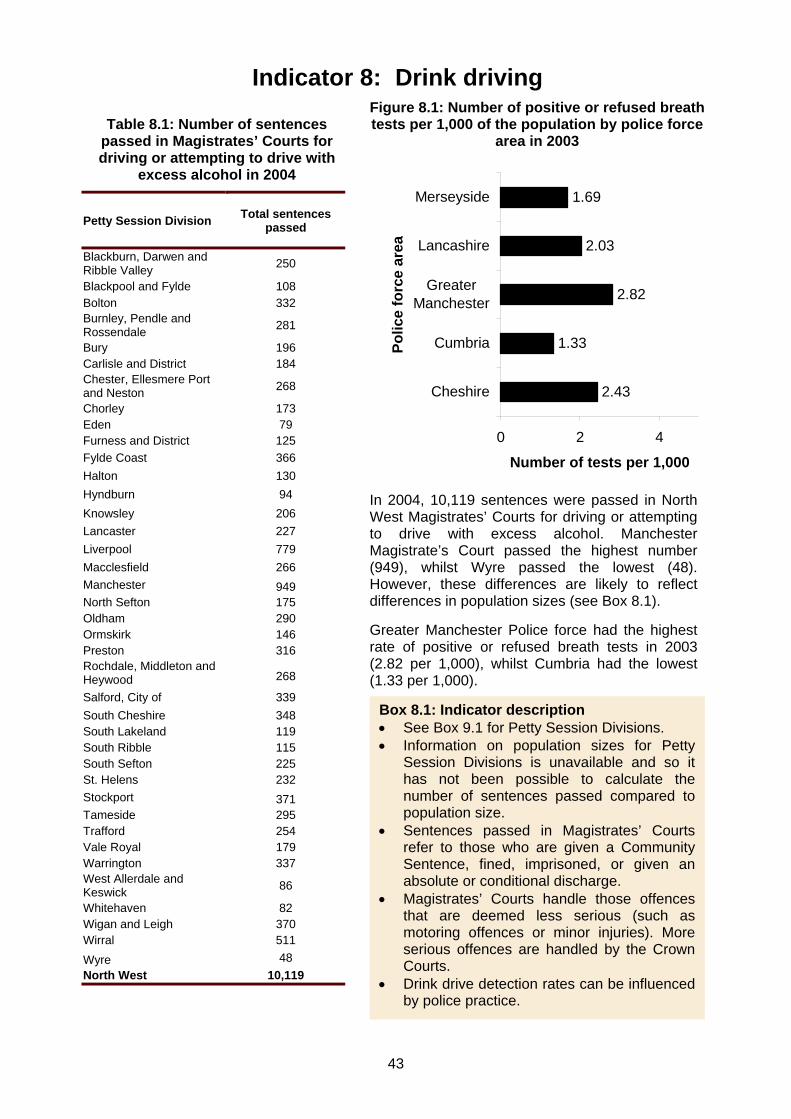
43
Indicator 8: Drink driving
Table 8.1: Number of sentences passed in Magistrates’ Courts for driving or attempting to drive with
excess alcohol in 2004
Petty Session Division Total sentences passed
Blackburn, Darwen and Ribble Valley 250
Blackpool and Fylde 108 Bolton 332 Burnley, Pendle and Rossendale 281
Bury 196 Carlisle and District 184 Chester, Ellesmere Port and Neston 268
Chorley 173 Eden 79 Furness and District 125 Fylde Coast 366 Halton 130 Hyndburn 94 Knowsley 206 Lancaster 227 Liverpool 779 Macclesfield 266 Manchester 949 North Sefton 175 Oldham 290 Ormskirk 146 Preston 316 Rochdale, Middleton and Heywood 268
Salford, City of 339 South Cheshire 348 South Lakeland 119 South Ribble 115 South Sefton 225 St. Helens 232 Stockport 371 Tameside 295 Trafford 254 Vale Royal 179 Warrington 337 West Allerdale and Keswick 86
Whitehaven 82 Wigan and Leigh 370 Wirral 511 Wyre 48 North West 10,119
Figure 8.1: Number of positive or refused breath tests per 1,000 of the population by police force
area in 2003
2.43
1.33
2.82
2.03
1.69
0 2 4
Cheshire
Cumbria
GreaterManchester
Lancashire
Merseyside
Polic
e fo
rce
area
Number of tests per 1,000
In 2004, 10,119 sentences were passed in North West Magistrates’ Courts for driving or attempting to drive with excess alcohol. Manchester Magistrate’s Court passed the highest number (949), whilst Wyre passed the lowest (48). However, these differences are likely to reflect differences in population sizes (see Box 8.1). Greater Manchester Police force had the highest rate of positive or refused breath tests in 2003 (2.82 per 1,000), whilst Cumbria had the lowest (1.33 per 1,000).
Box 8.1: Indicator description • See Box 9.1 for Petty Session Divisions. • Information on population sizes for Petty
Session Divisions is unavailable and so ithas not been possible to calculate thenumber of sentences passed compared topopulation size.
• Sentences passed in Magistrates’ Courtsrefer to those who are given a CommunitySentence, fined, imprisoned, or given anabsolute or conditional discharge.
• Magistrates’ Courts handle those offencesthat are deemed less serious (such asmotoring offences or minor injuries). Moreserious offences are handled by the CrownCourts.
• Drink drive detection rates can be influencedby police practice.

44
Indicator 9: Premises licensed to sell alcohol
Table 9.1: Number of premises licensed to sell alcohol from July 2003 to June 2004
Petty Session Division
Number of on-licensed
premises
Number of off-licensed
premises
Total number of licensed premises
Blackburn, Darwen and Ribble Valley 343 130 473
Blackpool and Fylde 1,704 235 1,939 Bolton 406 233 639 Burnley, Pendle and Rossendale 447 249 696
Bury 356 168 524 Carlisle and District 369 117 486 Chester, Ellesmere Port and Neston 471 152 623
Chorley 221 81 302 Eden 303 62 365 Furness and District 398 167 565 Halton 161 83 244 Hyndburn 165 79 244 Knowsley 123 91 214 Lancaster 390 141 531 Liverpool 1,254 430 1,684 Macclesfield 389 100 489 Manchester City 1,189 477 1,666 North Sefton District 368 142 510 Oldham 417 213 630 Ormskirk 167 81 248 Preston 302 149 451 Rochdale, Middleton and Heywood 369 159 528
Salford, City of 297 214 511 South Cheshire 382 164 546 South Lakeland 542 108 650 South Ribble 114 96 210 South Sefton District 145 88 233 St. Helens 293 171 464 Stockport 420 200 620 Tameside 406 208 614 Trafford 483 196 679 Vale Royal 224 90 314 Warrington 286 147 433 West Allerdale and Keswick 391 77 468
Wirral 501 293 794 Whitehaven 208 52 260 Wigan and Leigh 524 301 825 Wyre 138 71 209 North West 16,666 6,215 21,881
Figure 9.1: Number of premises licensed to sell alcohol from July 2003 to June
2004 per 1,000 of the population
1.93
4.51
1.92
2.79
1.97
0.741.19
0.94 0.92 0.89
0
1
2
3
4
5
Che
shire
Cum
bria
Gre
ater
Man
ches
ter
Lanc
ashi
re
Mer
seys
ide
Num
ber o
f pre
mis
es p
er 1
,000
pop
ulat
ion
On-licences Off-licences
Between July 2003 and June 2004, the North West was home to 16,666 on-licensed and 6,215 off-licensed premises (a total of 21,881). The largest number of premises (for both off and on licenses) per 1,000 of the population was in Cumbria, whilst the lowest was in Cheshire.
Box 9.1: Indicator description • More recent data covering licensed
premises since the changes in legislationare currently unavailable (as there is noroutine or consistent data collectionmethod).
• On licensed premises include hotels,nightclubs, public houses andrestaurants – those where alcohol isbought and consumed on the premises.
• Off-licensed premises sell alcohol forconsumption off the premises andinclude off-licenses and supermarkets.
• Petty Session Divisions have since beenrenamed Local Justice Areas under theLocal Justice Areas Order (2005). Theyrefer to the areas in which magistratesare assigned to, and broadly correspondto Local Authority areas (although thereare some differences).

45
References Bellis, M.A., Hughes, K., Tocque, K., Hennell, T., Humphrey, G. and Wyke, S. (2005). Mini-symposium – Public Health Observatories: assessing and communicating the health and judicial impact of alcohol use. Journal of the Royal Institute of Public Health. 119: 253-61. DCMS (Department for Culture, Media and Sport) (2004). Liquor licensing: England and Wales, July 2003 to June 2004. DCMS Statistical bulletin. DCMS, London. Drummond, C., Oyefeso, A., Phillips, T., Cheeta, S., Deluca, P., Perryman, K., Winfield, H., Jenner, J., Cobain, K., Galea, S., Saunders, V., Fuller, T., Pappalardo, D., Baker, O. and Christoupoulos, A. (2005). Alcohol Needs Assessment Research Project (ANARP): The 2004 national alcohol needs assessment for England. Department of Health, London. Fiti, R., Perry, D. and Liza Murray (2003). Motoring Offences and Breath Test Statistics. Home Office Statistical bulletin 06/05. Home Office, London. http://www.homeoffice.gov.uk/rds/pdfs05/hosb0605.pdf Government Actuary’s Department (UK). Interim life tables 2000–2002. [Available from: URL: http://www.gad.gov.uk/Life_Tables/historical_interim_life_tables.htm]. Home Office (2005). Criminal Statistics 2004: England and Wales. Supplementary Tables Volume 4: Proceedings in magistrates’ courts – data for individual petty sessional areas. http://www.homeoffice.gov.uk/rds/crimstats04.html#vol4 Hughes, K., Tocque, K., Humphrey, G., Bellis, M.A. (2004). Taking Measures: A situational analysis of alcohol in the North West. Centre for Public Health, Liverpool John Moores University. Nicholas, S., Povey, D., Walker, A., and Kershaw, C. (2005). Crime in England and Wales 2004/2005. Home Office Statistical Bulletin 11/05. Home Office, London. http://www.homeoffice.gov.uk/rds/pdfs05/hosb1105.pdf Pickering, K., Scholes, S. and Bajekal, M. (2005). Synthetic estimates of healthy lifestyle indicators: stage 3 report. National Centre for Social Research, London. http://www.natcen.ac.uk/smu_reports05/Synthetic_Estimation_Stage_3_Report.pdf Scholes, S., Madhavi, B. and Pickering, K. (2005). Synthetic estimates of healthy lifestyle indicators: user guide. Department of Health, London. Simmons J, Legg C and Hosking R (2003). National Crime Recording Standard (NCRS): An analysis of the impact on recorded crime. Companion Volume to Crime in England and Wales 2002/2003. Part One: The national picture. Home Office Online Report 31/03. London: Home Office. Strategy Unit (2003). Alcohol misuse: How much does it cost? Cabinet Office, London. http://www.number10.gov.uk/files/pdf/econ.pdf WHO (World Health Organization) (1992). The international statistical classification of diseases and related health problems, tenth revision. World Health Organization, Geneva. Wood J, Hennell T, Jones A, Hooper J, Tocque K, Bellis MA.(2006). Where Wealth means Health: Illustrating Inequality in the North West. North West Public Health Observatory.

46
Appendices
Appendix 1: Codes used for hospitalised admission for alcohol specific conditions
ICD-10* code Condition
E244 Alcohol pseudo-induced Cushing’s syndrome F10 Mental and behavioural disorders due to use of alcohol G312 Degeneration of nervous system due to alcohol G621 Alcoholic polyneuropathy G721 Alcoholic myopathy I426 Alcohol cardiomyopathy K292 Alcoholic gastritis K70 Alcoholic liver disease T510 Ethanol poisoning T511 Methanol poisoning X45 Accidental poisoning by and exposure to alcohol
* The World Health Organization’s International Classification of Diseases. Source: Hughes et al. (2004); Strategy Unit (2003); WHO (1992)
These conditions are entirely due to alcohol and thus have an attributable fraction of 1 (or 100%).

47
Appendix 2: Codes used for hospitalised admission for all conditions attributable to alcohol
This indicator also incorporates those codes and conditions identified in Appendix 1.
Average attributable fraction ICD-10* code Condition
Males Females
A15-19 Respiratory tuberculosis 0.25 0.25 C00 Lip cancer 0.50 0.50 C01-14 (excl. 11) Oropharyngeal cancer 0.25 0.12 C15 Oesophageal cancer 0.29 0.29 C16 Stomach cancer 0.20 0.20 C17-21 Colorectal cancer 0.20 0.20 C22 Liver cancer 0.14 0.24 C32 Laryngeal cancer 0.41 0.26 C50 Female Breast cancer 0.00 0.035 E10-14 Diabetes 0.05 0.05 G40-41 Epilepsy 0.15 0.15 I10-15 Hypertension 0.08 0.04 I20-I25 Ishchaemic heart disease 0.01 0.01 I470, I471, I479, I48 Supra ventricular cardiac arrhythmias 0.17 0.09 I50-51 Heart failure 0.00** 0.00** I60-69 Stroke 0.08 0.08 I85 Oesophageal varices 0.46 0.32 J12-18 Pneumonia and influenza 0.05 0.05 K226 Gastro-oesophageal laceration haemorrhage syndrome 0.29 0.29 K25-27 Peptic ulcer 0.10 0.10 K73 Chronic hepatitis 0.49 0.52 K74 Fibrosis and cirrhosis of liver 0.49 0.52 K85 Acute pancreatitis 0.24 0.24 K860-K861 Chronic pancreatitis 0.72 0.72 L400-404, L408-409 Psoriasis 0.03 0.01 O03 Spontaneous abortion 0.00 0.12 V01-89 Road accidents 0.40 0.31 V90-94 Water transport accidents 0.20 0.11 V95-97 Air/space transport accidents 0.20 0.11 W00-19 Fall injuries 0.29 0.25 W24-31 Work/machine injuries 0.16 0.16 W32-34 Firearm injuries 0.25 0.25 W65-74 Drowning 0.32 0.28
W79 Inhalation and ingestion of food causing obstruction of respiratory tract 0.63 0.63
X00-09 Fire injuries 0.41 0.41 X31 Accidental excessive cold 0.25 0.25 X60-84, Y10-34 Intentional self-harm/Event of undetermined intent 0.34 0.16 X93-Y09 Assault 0.37 0.37
* The World Health Organization’s International Classification of Diseases. ** The average attributable fraction is less than 0.01. Source: Hughes et al. (2004); Strategy Unit (2003); WHO (1992)

48
Appendix 3: Codes used for reduced life expectancy attributable to alcohol
Average attributable fraction ICD-10 code Condition
Males Females
F10 Alcoholic psychosis / Alcohol dependence / Alcohol abuse 1.00 1.00
G621 Alcoholic polyneuropathy 1.00 1.00 I426 Alcoholic cardiomyopathy 1.00 1.00 K292 Alcohol gastritis 1.00 1.00 K70 Alcoholic liver disease 1.00 1.00 T510 Ethanol toxicity 1.00 1.00 T511 Methanol toxicity 1.00 1.00 X45 Alcohol beverage poisoning / Other ethanol poisoning 1.00 1.00 A15-19 Respiratory tuberculosis 0.25 0.25 C00 Lip cancer 0.50 0.50 C01-14 (excl. 11) Oropharyngeal cancer 0.25 0.12 C15 Oesophageal cancer 0.26 0.14 C16 Stomach cancer 0.20 0.20 C17-21 Colorectal cancer 0.20 0.20 C22 Liver cancer 0.14 0.24 C32 Laryngeal cancer 0.41 0.26 C50 Female breast cancer 0.00 0.35 E10-14 Diabetes 0.05 0.05 G40-41 Epilepsy 0.15 0.15 I10-15 Hypertension 0.08 0.35 I20-25 Ischaemic heart disease 0.10 0.10 I470, I471, I479, I48 Supra ventricular cardiac arrhythmias 0.17 0.09
I50-51 Heart failure 0.00** 0.00** I60-69 Stroke 0.80 0.80 I85 Oesophageal varices 0.33 0.08 J12-18 Pneumonia and influenza 0.05 0.05 K226 Gastro-oesophageal laceration haemorrhage syndrome 0.29 0.29 K25-27 Peptic ulcer 0.10 0.10 K860-861 Chronic pancreatitis 0.72 0.72 K73-74 Unspecified cirrhosis 0.49 0.52 K85 Acute pancreatitis 0.24 0.24 L40 (excl. L405) Psoriasis 0.03 0.01 O03 Spontaneous abortion 0.00 0.12 V01-89 Road injuries / Other road accidents 0.40 0.31 V90-94 Water transport accidents 0.20 0.11 V95-97 Air / Space transport accidents 0.20 0.11 W00-19 Fall injuries 0.29 0.25 W24-31 Work / Machine injuries 0.16 0.16 W32-34 Firearm injuries 0.25 0.25 W65-74 Drowning 0.32 0.29 W79 Aspiration 0.63 0.63 X00-09 Fire injuries 0.41 0.41 X31 Accidental excessive cold 0.25 0.25 X60-84, Y10-34 Suicide 0.34 0.16 X93-Y09 Assault 0.37 0.37 * The World Health Organization’s International Classification of Diseases. ** The average attributable fraction is less than 0.01. Source: Hughes et al. (2004); Strategy Unit (2003); WHO (1992)

49
Appendix 4: Codes used for violent crime attributable to alcohol
Code Offence More serious violent offences
1 Murder 2 Attempted murder 3 Threat or conspiracy to murder
37.1 Causing death by aggravated vehicle taking 4.1 Manslaughter 4.2 Infanticide 4.3 Child destruction
4.4/6 Causing death by dangerous or careless driving (including under the influence)
Wounding
5 Wounding or other act endangering life 6 Endangering railway passenger 7 Endangering life at sea
8A Other wounding 8B Possession of weapons 8C Harassment 8D Racially or religiously aggravated other wounding 8E Racially or religiously aggravated harassment
Less serious violent offences
104 Assault on a constable 105A Common assault 105B Racially or religiously aggravated common assault
11 Cruelty to or neglect of children 12 Abandoning a child under the age of two years 13 Child abduction 14 Procuring illegal abortion 15 Concealment of birth
Source: Strategy Unit (2003)

Centre for Public Health Liverpool John Moores University
Faculty of Health and Applied Social Sciences Castle House North Street
Liverpool L3 2AY
April 2006
ISBN: 1-902051-86-6
Tel: 0151 231 4510
www.cph.org.uk www.nwph.net/alcohol