Sources of plutonium to the tropical Northwest Pacific Ocean (1943–1999) identified using a...
11
Sources of plutonium to the tropical Northwest Pacific Ocean (1943–1999) identified using a natural coral archive Patric Lindahl a,d,⇑ , Ryuji Asami b , Yasufumi Iryu c , Paul Worsfold d , Miranda Keith-Roach d , Min-Seok Choi e a Marine Environment Research Department, Korea Ocean Research & Development Institute (KORDI), 1270 Sadong, Ansan 426-744, South Korea b Trans-disciplinary Research Organization for Subtropical Island Studies (TRO-SIS), University of the Ryukyus, 1 Senbaru, Nishihara, Okinawa 903-0213, Japan c Department of Earth and Planetary Sciences, Nagoya University, Furu-cho, Chikusa-ku, Nagoya 464-8601, Japan d School of Geography, Earth and Environmental Sciences, University of Plymouth, Drake Circus, Plymouth PL48AA, UK e Division of Earth and Environmental Science, Korea Basic Science Institute (KBSI), 113 Gwahangno, Yusung-gu, Daejon 305-333, South Korea Received 17 June 2010; accepted in revised form 21 December 2010; available online 30 December 2010 Abstract The Pu isotopes, 239 Pu and 240 Pu, were determined in annually-banded skeletons of an accurately dated (1943–1999) mod- ern coral (Porites lobata) from Guam Island to identify historical Pu sources to the tropical Northwest Pacific Ocean. Activity concentrations of 239+240 Pu and 240 Pu/ 239 Pu atom ratios were determined in the dated coral bands using multi-collector induc- tively coupled plasma mass spectrometry (MC-ICP-MS). Close-in fallout from the former US Pacific Proving Grounds (PPG) in the Marshall Islands and global fallout were identified as the two main sources. The Guam site was dominated by PPG close-in fallout in the 1950s, with an average 240 Pu/ 239 Pu atom ratio of 0.315 ± 0.005. In addition, a higher 240 Pu/ 239 Pu atom ratio (0.456 ± 0.020) was observed that could be attributed to fallout from the “Ivy Mike” thermonuclear detonation in 1952. The atom ratio decreased in the 1960s and 1970s due to increase in the global fallout with a low 240 Pu/ 239 Pu atom ratio (0.18). Recent coral bands (1981–1999) are dominated by the transport of remobilised Pu, with high 240 Pu/ 239 Pu atom ratios, from the Marshall Islands to Guam Island along the North Equatorial Current (NEC). This remobilised Pu was esti- mated to comprise 69% of the total Pu in the recent coral bands, although its contribution was variable over time. Ó 2010 Elsevier Ltd. All rights reserved. 1. INTRODUCTION The main source of Pu to the Pacific Ocean is fallout from atmospheric nuclear weapons testing between 1945 and 1980 (Livingston et al., 2001). Other sources (e.g. dis- charges from the nuclear industry, radioactive waste dump- ing and burn-up of nuclear powered satellites) have only made a relatively minor impact. Between 1945 and 1980, 543 atmospheric weapons tests were carried out worldwide with an estimated total released fission energy yield of 189 Mt (UNSCEAR, 2000). The most intense periods, with 90% of the total fission energy yield released, were 1952– 1958 and 1961–1962. Atmospheric fallout from nuclear weapons testing can be partitioned in two main compo- nents; global and local (close-in) fallout. Global fallout is produced from tests that were injected into the stratosphere and thus dispersed and deposited globally. Due to the loca- tions of the weapons tests, the majority (76%) of global fall- out Pu was deposited in the northern hemisphere. The main nuclear weapons testing locations that have contributed to the global fallout, with over 70% of the global Pu input, are Novaya Zemlya (Russia) and the former US Pacific 0016-7037/$ - see front matter Ó 2010 Elsevier Ltd. All rights reserved. doi:10.1016/j.gca.2010.12.012 ⇑ Corresponding author at: School of Geography, Earth and Environmental Sciences, University of Plymouth, Drake Circus, Plymouth PL4 8AA, UK. Tel.: +44 1752 584579; fax: +44 1752 584710. E-mail address: [email protected] (P. Lindahl). www.elsevier.com/locate/gca Available online at www.sciencedirect.com Geochimica et Cosmochimica Acta 75 (2011) 1346–1356
-
Upload
independent -
Category
Documents
-
view
2 -
download
0
Transcript of Sources of plutonium to the tropical Northwest Pacific Ocean (1943–1999) identified using a...

Available online at www.sciencedirect.com
www.elsevier.com/locate/gca
Geochimica et Cosmochimica Acta 75 (2011) 1346–1356
Sources of plutonium to the tropical Northwest PacificOcean (1943–1999) identified using a natural coral archive
Patric Lindahl a,d,⇑, Ryuji Asami b, Yasufumi Iryu c, Paul Worsfold d,Miranda Keith-Roach d, Min-Seok Choi e
a Marine Environment Research Department, Korea Ocean Research & Development Institute (KORDI), 1270 Sadong,
Ansan 426-744, South Koreab Trans-disciplinary Research Organization for Subtropical Island Studies (TRO-SIS), University of the Ryukyus,
1 Senbaru, Nishihara, Okinawa 903-0213, Japanc Department of Earth and Planetary Sciences, Nagoya University, Furu-cho, Chikusa-ku, Nagoya 464-8601, Japan
d School of Geography, Earth and Environmental Sciences, University of Plymouth, Drake Circus, Plymouth PL48AA, UKe Division of Earth and Environmental Science, Korea Basic Science Institute (KBSI), 113 Gwahangno, Yusung-gu, Daejon 305-333, South Korea
Received 17 June 2010; accepted in revised form 21 December 2010; available online 30 December 2010
Abstract
The Pu isotopes, 239Pu and 240Pu, were determined in annually-banded skeletons of an accurately dated (1943–1999) mod-ern coral (Porites lobata) from Guam Island to identify historical Pu sources to the tropical Northwest Pacific Ocean. Activityconcentrations of 239+240Pu and 240Pu/239Pu atom ratios were determined in the dated coral bands using multi-collector induc-tively coupled plasma mass spectrometry (MC-ICP-MS). Close-in fallout from the former US Pacific Proving Grounds (PPG)in the Marshall Islands and global fallout were identified as the two main sources. The Guam site was dominated by PPGclose-in fallout in the 1950s, with an average 240Pu/239Pu atom ratio of 0.315 ± 0.005. In addition, a higher 240Pu/239Pu atomratio (0.456 ± 0.020) was observed that could be attributed to fallout from the “Ivy Mike” thermonuclear detonation in 1952.The atom ratio decreased in the 1960s and 1970s due to increase in the global fallout with a low 240Pu/239Pu atom ratio(�0.18). Recent coral bands (1981–1999) are dominated by the transport of remobilised Pu, with high 240Pu/239Pu atomratios, from the Marshall Islands to Guam Island along the North Equatorial Current (NEC). This remobilised Pu was esti-mated to comprise 69% of the total Pu in the recent coral bands, although its contribution was variable over time.� 2010 Elsevier Ltd. All rights reserved.
1. INTRODUCTION
The main source of Pu to the Pacific Ocean is falloutfrom atmospheric nuclear weapons testing between 1945and 1980 (Livingston et al., 2001). Other sources (e.g. dis-charges from the nuclear industry, radioactive waste dump-ing and burn-up of nuclear powered satellites) have onlymade a relatively minor impact. Between 1945 and 1980,
0016-7037/$ - see front matter � 2010 Elsevier Ltd. All rights reserved.
doi:10.1016/j.gca.2010.12.012
⇑ Corresponding author at: School of Geography, Earth andEnvironmental Sciences, University of Plymouth, Drake Circus,Plymouth PL4 8AA, UK. Tel.: +44 1752 584579; fax: +44 1752584710.
E-mail address: [email protected] (P. Lindahl).
543 atmospheric weapons tests were carried out worldwidewith an estimated total released fission energy yield of189 Mt (UNSCEAR, 2000). The most intense periods, with90% of the total fission energy yield released, were 1952–1958 and 1961–1962. Atmospheric fallout from nuclearweapons testing can be partitioned in two main compo-nents; global and local (close-in) fallout. Global fallout isproduced from tests that were injected into the stratosphereand thus dispersed and deposited globally. Due to the loca-tions of the weapons tests, the majority (76%) of global fall-out Pu was deposited in the northern hemisphere. The mainnuclear weapons testing locations that have contributed tothe global fallout, with over 70% of the global Pu input, areNovaya Zemlya (Russia) and the former US Pacific

Pu sources to the tropical NW Pacific, 1943–1999 1347
Proving Grounds (PPG) in the Marshall Islands (North Pa-cific). Other locations with significant contribution to theglobal fallout include the Johnston Atoll and ChristmasIsland (North Pacific), the Lop Nor site (China), and theMururoa and Fangataufa Atolls in French Polynesia(South Pacific). Close-in fallout arises from near-surfacetests interacting with the Earth’s surface, which deliverradioactive debris to the local or regional environment.About 160 Mt of fission energy has been dispersed world-wide as global fallout and about 29 Mt has been depositedlocally or regionally as close-in fallout (UNSCEAR, 2000).The majority of close-in fallout deposited in the PacificOcean (27.4 Mt fission) was produced at the PPG. The esti-mated total 239+240Pu input to the Pacific Ocean from glo-bal fallout is 3.4 PBq (IAEA, 2005). The total 239+240Puinput to the Pacific Ocean from close-in fallout is more dif-ficult to estimate due to the limited data available but iswithin 2–6 PBq (Aarkrog, 2003; Nakano and Povinec,2003). The locations of major Pacific test sites for atmo-spheric nuclear weapons tests are shown in Fig. 1.
The Pu deposited in the lagoons and surrounding sedi-ments of the Marshall Islands is continuously remobilisinginto solution and is a significant Pu source to the North Pa-cific with an annual 239+240Pu export to the open ocean ofabout 0.2 TBq a�1 (Noshkin et al., 1987). It has been sug-gested that the westward flowing North Equatorial Current(NEC) and the subsequent Kuroshio Current transport Pulong distances from the Marshall Islands to the NorthwestPacific and its marginal seas (Kim et al., 2004; Lee et al.,2004; Zheng and Yamada, 2004; Wang and Yamada, 2005).
The two most abundant Pu isotopes in the marine envi-ronment are the long-lived 239Pu and 240Pu with half-lives
Fig. 1. Map showing the Guam study site and major nuclear weapons t(NEC). PPG = Pacific Proving Grounds in the Marshall Islands (Bikin aMI = Malden Island, FP = French Polynesia (Mururoa and Fangataufa
of 24,100 years and 6561 years, respectively. The isotopiccomposition of Pu is characteristic of the source of contam-ination, which corresponds to the method of production.Reactor-grade Pu has 240Pu/239Pu atom ratios ranging from0.2 to 1.0 depending on the fuel burn-up, while weapons-grade 240Pu/239Pu atom ratios are in the range 0.02–0.06(Yamana et al., 2001). The 240Pu/239Pu atom ratio in thedebris from nuclear detonations varies depending on theyield and weapon type. For example, fallout from the nu-clear weapons tests at PPG is characterised by 240Pu/239Puatom ratios >0.25 while fallout from the tests in FrenchPolynesia is characterised by 240Pu/239Pu atom ratios be-tween 0.02 and 0.05 (Chiappini et al., 1999; Muramatsuet al., 2001). Higher fission yields are usually accompaniedby higher 240Pu/239Pu atom ratios as heavy Pu isotopes areformed to a greater degree during and after the explosion(Perkins and Thomas, 1980). The 240Pu/239Pu atom ratiosin debris from atmospheric fallout has changed over timedue to changes in weapon designs and yields. This has beendemonstrated by 240Pu/239Pu time series analyses of datedice cores and archived grass samples (Koide et al., 1985;Warneke et al., 2002; Olivier et al., 2004). The worldwideintegrated global fallout Pu signal is characterised by a240Pu/239Pu atom ratio of �0.18 (Kelley et al., 1999).
During the growth of corals annual growth bandswith different densities are formed (Knutson et al.,1972). These bands contain elemental and isotopic infor-mation relating to the physical and chemical conditionsin the surrounding seawater at the time of growth, andhave therefore been used as a record of environmentalchange proxies (Grottoli and Eakin, 2007). Isotopic anal-yses of annual coral bands have provided sensitive
est sites in the Pacific together with the North Equatorial Currentnd Enewetak Atolls), JA = Johnston Atoll, CI = Christmas Island,Atolls).

1348 P. Lindahl et al. / Geochimica et Cosmochimica Acta 75 (2011) 1346–1356
assessments of past ocean chemistry, ocean circulationand climate change (Druffel, 1997; Asami et al., 2009).The main advantage of using coral to retrieve the histor-ical record of a certain element or isotope is the absenceof mixing processes between the annual growth bandsthat occurs in ocean sediments.
Due to the well-defined spatial and temporal inputs ofPu and its physical and chemical properties, Pu can be useda tracer for various oceanic processes such as water masstransport, particle fluxes and scavenging (Lindahl et al.,2010b). Retrospective studies of Pu may therefore providevaluable information on past ocean circulation and furtherthe development of ocean circulation models (Nakano andPovinec, 2003). In seawater, Pu exists mainly in the particlereactive oxidation state, Pu(IV), and the relatively solubleform, Pu(V). Oxidised Pu(V) has high affinity for adsorp-tion onto calcium carbonate particles (e.g. corals) as surfacecomplexes (Keeney-Kennicutt and Morse, 1985). Pluto-nium is incorporated in the coral skeleton during growthwith a constant relationship between Pu in the coral andPu in the surrounding seawater with an estimated concen-tration factor of 2.7 � 103 (Noshkin et al., 1975; Meeceand Benninger, 1993). Therefore, the historical Pu signalin the surrounding seawater can be reconstructed by analys-ing natural archives such as dated coral cores (Noshkinet al., 1975; Benninger and Dodge, 1986; Purdy et al.,1989; Buesseler, 1997).
The aim of this study was to determine the 239+240Puactivity concentrations and 240Pu/239Pu atom ratios in theannual growth bands of an accurately dated modern coralcore from Guam Island (Asami et al., 2004, 2005) to recon-struct the 1943–1999 Pu records in the tropical NorthwestPacific for the first time. The 240Pu/239Pu atom ratios inthe coral bands were used to distinguish the source(s) ofPu contamination and characterise the isotopic input fromnotable nuclear tests. A simple mixing model was then ap-plied to identify recent changes in Pu transport from theMarshall Islands to Guam Island.
2. MATERIALS AND METHODS
2.1. Study site
Guam Island is located in the tropical Northwest Pacificabout 2000 km from the Marshall Islands (Fig. 1). The siteis in the path of NEC, which moves in a northwesterlydirection with a fluctuating speed of 0.1–0.3 m s�1
(Wolanski et al., 2003). The island has an average annualsea surface temperature of 28.5 �C with small seasonal vari-ations (27.3–29.4 �C) observed between 1950 and 2000(Rayner et al., 2003). The sea surface salinity shows no clearseasonal periodicity ranging from 33.9 to 35.1 with a meanvalue of 34.5 for 1969–1995 (Delcroix et al., 2001). Theaverage annual precipitation was �1977 mm year�1 be-tween 1980 and 2000 (Xie and Arkin, 1997). The study site,Double Reef (13.60 �N, 144.84 �E), is located on the north-western coast of Guam Island and is characterised by a nar-row (<350 m wide) fringing reef, extending >5 km fromnorth to south. The massive coral colony used in this studywas exposed directly to open sea surface conditions, living
about 200 m from the coast at a water depth of 7.8 m(Asami et al., 2004, 2005).
2.2. Coral samples
A 273 cm coral core from Porites lobata was collected inApril 2000 vertically from the top using an underwaterhydraulic drill with a bit diameter of 65 mm. The corewas cut into 6 mm thick slabs parallel to the axis of maxi-mum coral growth, ultrasonically cleaned in Milli-Q(18.2 MX) water and air-dried. The coral chronology wasestablished in previous work (Asami et al., 2004, 2005), inwhich coral d18O was determined with high-temporal reso-lution (biweekly to monthly) over the period 1787–2000.Dating of the coral was based on visual observations of softX-radiograph images, which showed well-developed annualhigh/low density skeletal growth bandings. Sections relat-ing to annual skeletal growth increments (approximatelyfrom January to December) were then assigned. No evi-dence of diagenetic alterations was identified in the years1790–2000 by scanning electron microscopy and X-ray dif-fraction analysis on skeletal fragments from �10 cm inter-vals. In this study, only the top �85 cm (excluding thecoral living tissue layer) was used for Pu analysis, coveringthe period between 1943 and 1999. The average coralgrowth rate in this period was about 1.5 cm per year (Elec-tronic annex EA-1). Annual skeletal increment sampleswere therefore taken along the maximum coral growth axisusing a low-speed diamond dental drill and then ground toa homogeneous powder.
2.3. Analytical procedure
Due to the small sample mass available (0.5–0.9 g; Elec-tronic annex EA-1), it is essential that the analytical separa-tion procedure is optimised for a high Pu yield and effectiveremoval of potential interferences (e.g. U, Th and Pb). Themost significant interferences for Pu measurements by ICP-MS are the formation of isobaric uranium hydrides(238UH+) and peak tailing from the 238U+ peak, whichmay cause overestimation of the 239Pu signal. The analyti-cal procedure for the determination of Pu in coral samplesis based on a previously reported method (Lindahl et al.,2010a). Briefly, the powder samples were first dried for24 h at 80 �C and spiked with 242Pu (0.4 mBq) as a yieldmonitor. The samples were digested at 120 �C on a hotplate using tightly sealed Teflon bombs containing a 3:1mixture of concentrated HNO3 and HCl, followed by Puco-precipitation with Fe(OH)3. Further Pu separation wasachieved through anion exchange (AG 1-X8, Bio-Rad) fol-lowed by a two-column extraction chromatography proce-dure (UTEVA+TRU, Eichrom Industries Inc.). Theradiochemical Pu yield obtained for these small size coralsamples was about 87% and the removal of U from thesample matrix was good, with a U decontamination factorof 1.2 � 104.
Measurements of Pu were carried out by a Neptune mul-ti-collector ICP-MS (Thermo Fisher Scientific Inc., USA)equipped with an Apex HF sample introduction systemand a microflow PFA-100 nebuliser. The isotopes of

Pu sources to the tropical NW Pacific, 1943–1999 1349
interest (239Pu, 240Pu, 242Pu and 238U) were measured simul-taneously using the low-resolution (m/Dm = 400) mode anda sample flow rate of �0.1 mL min�1. Optimisation andtuning was performed by analysing a 242Pu standard solu-tion until maximal ion intensity was achieved. Interferenceson the 239Pu peak from 238U (UH+ and peak tailing) weremonitored and corrected for during the measurements.The ratio of 238UH+ (plus peak tailing) to 238U+ was usu-ally around 1.8 � 10�5. The estimated instrumental detec-tion limit for 239Pu and 240Pu was 0.02 fg mL�1 whichcorresponds to an absolute limit of quantification of0.2 lBq and 0.9 lBq for 239Pu and 240Pu, respectively.
The analytical method was validated by analyses ofIAEA-367 (Marshall Islands sediment) and IAEA-384(Fangataufa Atoll sediment) marine reference materials.The reference material matrices contained almost 100% cal-cium carbonate (CaCO3) and hence were representative ofcoral samples. The accuracy of the 239+240Pu activity con-centrations and 240Pu/239Pu atom ratios were in good agree-ment (within 95% confidence interval) with therecommended and previously reported values (Table 1).
A simple mixing model was used to estimate the relativecontributions from specific source terms based on the Puisotopic composition in the contaminated sample (Kelleyet al., 1999). In the Pacific Ocean, marine samples aremainly contaminated from two sources, global fallout andclose-in fallout, and the Pu contribution (%) from close-infallout (XCI) can be estimated from:
XCI ¼ 100 x ðRm �RGÞ=ðRCI �RGÞ ð1Þ
where Rm is the measured 240Pu/239Pu atom ratio in thesample, RG and RCI represent the 240Pu/239Pu atom ratiosin global fallout and close-in fallout, respectively.
3. RESULTS AND DISCUSSION
The annual 239+240Pu activity concentrations and240Pu/239Pu atom ratios in the Guam coral (Fig. 2) showedvarying levels along the coral growth axis, reflectingchanges in the source of Pu over time. Detailed informationon the individual coral bands and their 239Pu and 240Puactivity concentrations and 240Pu/239Pu atom ratios are pre-sented in the Electronic annex EA-1. The activity-weightedaverage 240Pu/239Pu atom ratio for the entire Guam coral(1946–1999) was 0.299 ± 0.005. The presentation and inter-pretation of the results is divided into four time periods
Table 1Analytical results for 239+240Pu activity concentrations and 240Pu/239Pu at
Referencematerial
239+240Pu(Bq kg�1)a
239+240Pu recommended value(Bq kg�1)b
IAEA-367(n = 4)
36.9 ± 0.7 38 (34.4–39.8)
IAEA-384(n = 4)
108.4 ± 2.0 107 (103–110)
a Uncertainty represent the standard uncertainty for four measuremenb Values in parenthesis represent the 95% confidence interval.c 240Pu/239Pu atom ratios from Leon Vintro et al. (1996), McAninch ed IAEA information value and standard uncertainty with a coverage fa
characterised by their distinctive features and source influ-ences. Before 1945, negligible Pu was present in the marineenvironment. The period between 1946 and 1960 is highlyinfluenced by close-in fallout from the PPG during the per-iod 1946–1958. The period from 1961 to 1980 is influencedby global fallout from atmospheric nuclear weapons tests.The final period (1981–1999) reflects the input of Pu afterthe cessation of atmospheric nuclear weapons testing in1980.
3.1. Pu in the 1943–1945 coral bands
The coral bands from 1943–1945 contained detectable239Pu, with an observed average activity concentration of1.96 ± 0.11 mBq kg�1. Prior to 1945, all Pu in the marineenvironment originated from natural sources. The averageactivity concentration of natural 239Pu in the earth’s crustis approximately 0.05 mBq kg�1, with concentrations inthe oceans 3–5 orders of magnitude lower (Taylor, 2001).With an upper limit of background 239Pu in seawater of0.00005 mBq kg�1 and a concentration factor of 2.7 � 103
for Pu uptake in corals (Noshkin et al., 1975) one can esti-mate an upper limit of natural 239Pu activity concentrationof 0.14 mBq kg�1 in the corals, which is an order of magni-tude lower than the concentrations found in the 1943–1945coral bands. This suggests that the small amounts of Pufound in the 1943–1945 coral bands originate from mobilityof anthropogenic Pu after the incorporation in the coral.The 240Pu activity concentrations in the 1943–1945 coralbands were below the detection limit (about 0.6 mBq kg�1)corresponding to a 240Pu/239Pu atom ratio upper limit of0.08. Given the higher Pu concentration in the 1946 coralband (Section 3.2), these low values demonstrate that Puhas low mobility after the incorporation in the coral skele-ton. This approach therefore has clear advantages over theuse of oxic sediments for retrospective studies of Pu in themarine environment, where mixing processes affect the ra-tios obtained.
3.2. Pu inputs from 1946 to 1960
Fig. 3 shows the 239+240Pu activity concentrations in the1946–1960 coral bands together with the annual estimatedlocal fission yields from the PPG tests (UNSCEAR, 2000).The 239+240Pu activity concentrations observed in the1946–1951 coral bands increased from 11.3 ± 2.4 mBq kg�1
om ratios in IAEA reference materials (IAEA-367 and IAEA-384).
240Pu/239Pu atomratioa
240Pu/239Pu information orliterature value
0.298 ± 0.009 0.289–0.320c
0.050 ± 0.003 0.050 ± 0.004d
ts with a coverage factor of 2.
t al. (2000), Muramatsu et al. (2001) and Martinelli et al. (2009).ctor of 2.

0.0
0.1
0.2
0.3
0.4
0.5
1945 1950 1955 1960 1965 1970 1975 1980 1985 1990 1995 20001
10
100
1000
240 Pu
/239 Pu
[ato
m]
239+
240 Pu
[mB
q kg
-1]
Year
Fig. 2. 240Pu/239Pu atom ratios and 239+240Pu activity concentrations in annual growth bands of a Guam coral (Porites lobata), 1943–1999(only 239Pu was detected in the 1943–1945 coral bands). The error bars represent ±1 standard deviation.
1946 1948 1950 1952 1954 1956 1958 19601
10
100
1000
239+
240 Pu
[mB
q kg
-1]
Year
Guam coral 239+240PuPPG annual local fission yield
10-3
10-2
10-1
100
101
Par
titio
ned
fissi
on y
ield
[Mt]
Fig. 3. 239+240Pu activity concentrations in Guam coral bands (Porites lobata), 1946–1960, and the estimated annual local fission yields fromthe Pacific Proving Grounds nuclear weapons tests, 1946–1958 (UNSCEAR, 2000). The error bars represent ±1 standard deviation.
1350 P. Lindahl et al. / Geochimica et Cosmochimica Acta 75 (2011) 1346–1356
to 37.7 ± 2.1 mBq kg�1, due to locally deposited fission en-ergy yields in the range of 0.01–0.16 Mt. However, themajority of the nuclear weapons tests at the PPG were car-ried out between 1952 and 1958; 56 tests with a locally-deposited total fission energy yield of 27.4 Mt. This is
reflected in the rapid increase in 239+240Pu activity concen-trations, peaking in the 1954 coral band. The good correla-tion (correlation coefficient of 0.98) between the 239+240Puactivity in the coral bands corresponding to the PPG testingyears (1946, 1948, 1951, 1952, 1954, 1956 and 1958) and the

Pu sources to the tropical NW Pacific, 1943–1999 1351
annual estimated local fission yields suggests that close-infallout was the main source of Pu.
The isotope ratios determined (Fig. 2) allow this periodto be resolved further. The Pu isotopic composition in the1946–1951 coral bands is characterised by low 240Pu/239Puatom ratios (0.05–0.14) with an activity-weighted averageof 0.082 ± 0.014, which is indicative of low-yield nucleardevices. However, the activity-weighted average240Pu/239Pu atom ratio in the 1952–1960 coral bands was0.315 ± 0.005, indicative of Pu fallout isotope ratios fromdetonations of higher-yield devices.
The first high-yield nuclear device (Ivy Mike, 5.7 Mt fis-sion) was detonated in November 1952 at Enewetak Atollin the Marshall Islands with an estimated locally-depositedfission energy of 2.9 Mt, and it was the only high-yield nu-clear test with close-in fallout to the Pacific Ocean carriedout during 1952 and 1953. The radioactive fallout patternrecorded in the days after the test showed high fallout inthe Guam area (Machta et al., 1956). An additional nucleartest (Ivy King) was conducted in 1952 at Enewetak Atolltwo weeks after the Ivy Mike test and involved a pure fis-sion device with an estimated fission yield of 0.5 Mt. How-ever, this device was detonated at a height of �500 m aboveground resulting in negligible close-in fallout. The increased239+240Pu activity concentrations observed in the 1952 and1953 coral bands of 211 ± 6 mBq kg�1 and 792 ± 19mBq kg�1, respectively, indicate the magnitude of the Puinput from the Ivy Mike test to the surrounding seawater.The observed 240Pu/239Pu atom ratios of 0.421 ± 0.020and 0.464 ± 0.018 in the 1952 and 1953 coral bands, respec-tively, and the activity-weighted average of 0.456 ± 0.020are indicative of Pu from higher fission-yield nuclear de-vices. The similar ratios in the 1952 and 1953 coral bandsreflect the same dominant source of Pu but, as the Ivy Mikedetonation occurred in late 1952, the input to the coral washigher during 1953.
In thermonuclear explosions, heavy nuclides are formedby prompt neutron capture in the target nuclide, usually238U. The distribution of heavy nuclides produced dependspartly on the thermal neutron fluence achieved during thedetonation. The high 240Pu/239Pu atom ratios observed inthe 1952–1953 coral bands suggest the Ivy Mike test in-volved a device with unusually high neutron fluence, withhigh production of 240Pu compared with 239Pu in the sur-rounding natural uranium mantle. These ratios are impor-tant for defining the Pu isotope ratios associated with theIvy Mike test as only one other value has been reported.The previous value was based on mass spectrometric anal-ysis of debris from a nearby atoll, and this was significantlylower at 0.363 ± 0.004 (Diamond et al., 1960). Diamondet al. (1960) did not provide details of their sampling loca-tion or date, or the performance of the analytical proce-dure. Sampling locations are relevant because close-infallout comprises fragments of unexploded weapons-gradePu as well as Pu released during prompt neutron capturein the uranium mantle. The theoretical 240Pu/239Pu atomratio produced in the Ivy Mike device during the completedestruction of the primary fission bomb is between 1.0 and1.5 (Dorn, 1962). By applying the mixing model (Eq. (1))with the 240Pu/239Pu atom ratio of 0.02 for weapons-grade
Pu, it can be estimated that between 57% and 72% of the Puin the Guam coral came from fragments of unexplodedweapons-grade Pu. The equivalent estimation using theIvy Mike debris sample isotopic ratio (0.363) gives a contri-bution between 68% and 79%. The larger contribution fromthe bomb fragments in the Ivy Mike debris sample com-pared with the Guam coral sample is consistent with a clo-ser location of the debris sampling site than Guam Islandand thus greater fallout of the heavier bomb fragments.However, potential analytical issues affecting the Diamondet al. (1960) value have also been acknowledged (Dorn,1962).
The 1954 coral band showed a distinctive peak in239+240Pu activity concentration of 4540 ± 70 mBq kg�1,corresponding to close-in fallout from the Operation Castleseries of high-yield nuclear devices detonated at the Bikiniand Enewetak test sites in the Marshall Islands during thespring of 1954. The total estimated fission energy releasedduring the 1954 test series was 30 Mt, of which 15 Mt wasdeposited locally. The Castle test series included severalhigh-yield nuclear devices that produced significant close-in fallout and hence contributed to the Pu contaminationof Guam Island; Bravo (9.0 Mt), Romeo (7.3 Mt), Union(4.6 Mt) and Yankee (9.0 Mt) tests at the Bikini Atoll andto a lesser extent the Nectar test (0.85 Mt) at the EnewetakAtoll. The 240Pu/239Pu atom ratios observed in the 1954–1955 layers were 0.331 ± 0.006 and 0.331 ± 0.004, respec-tively, with an activity-weighted average of 0.331 ± 0.007,reflecting close-in fallout from the high-yield detonationsin the 1954 test series. This agrees well with the reported240Pu/239Pu atom ratio of 0.32 ± 0.03 in fallout from theBravo test at the Bikini Atoll (Yamamoto et al., 1996). Thiswas determined in samples from a Japanese fishingboat that was accidentally contaminated with fallout deb-ris. Additionally, (Muramatsu et al., 2001) determined240Pu/239Pu atom ratios between 0.302 and 0.306 in soilsamples from Bikini Island and attributed these to theBravo test, and similar ratios (0.263–0.323) were observedin further Bikini Island soil samples and a sediment samplefrom the Bravo test crater (Lachner et al., 2010). However,since these samples were collected several decades after thenuclear weapons tests they are likely to contain a mixture ofPu contamination from different weapons tests carried outin the area.
During the 1956 and 1958 test series at the PPG 48 nu-clear detonations were carried out, releasing 3.0 and 5.9 Mtof locally-deposited fission energy, respectively. There istherefore a significant peak in 239+240Pu activity concentra-tion (692 ± 12 mBq kg�1) in the 1958 coral band. The239+240Pu activity concentration in the 1956 coral bandfrom the 1956 test series cannot be separated visually fromadjacent coral bands due to the high 239+240Pu levels fromthe 1954 test series that remained in the surrounding seawa-ter. However, the 240Pu/239Pu atom ratios in the 1956–1957coral bands were 0.231 ± 0.004 and 0.233 ± 0.013, respec-tively, indicating inputs from different Pu sources with sig-nificantly lower fission yields than the 1954 high-yield testseries.
In addition, the observed 240Pu/239Pu atom ratios in the1958–1959 coral bands were 0.178 ± 0.006 and 0.190 ±
1352 P. Lindahl et al. / Geochimica et Cosmochimica Acta 75 (2011) 1346–1356
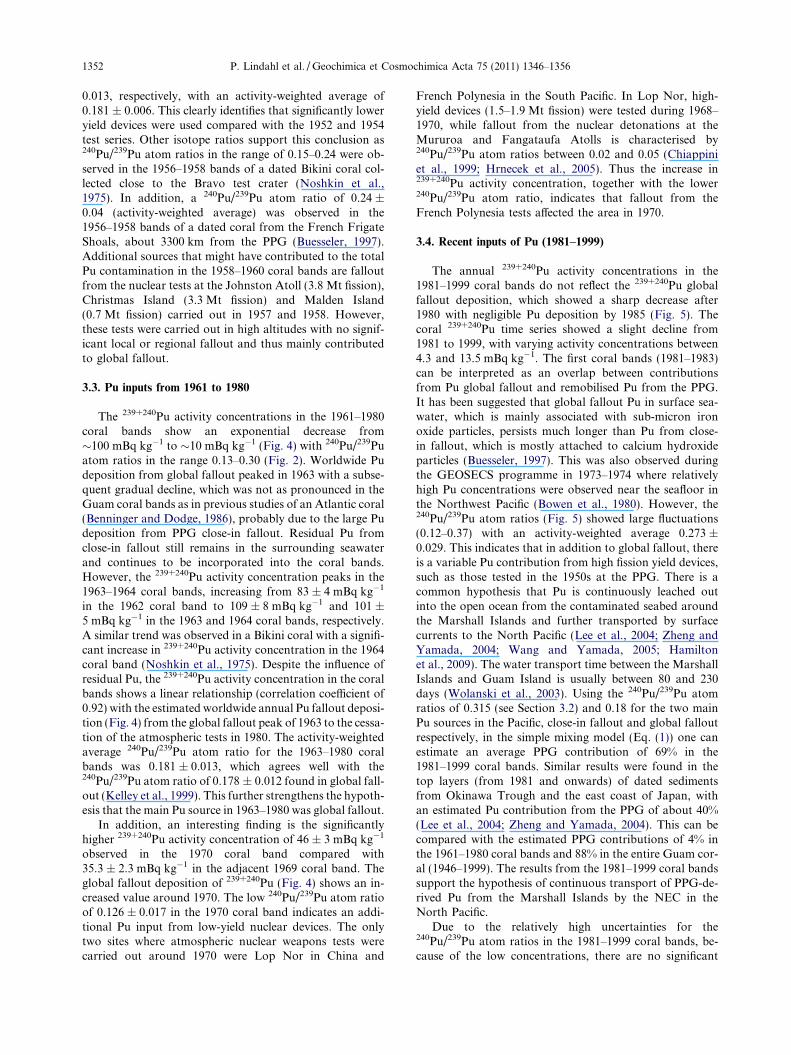
0.013, respectively, with an activity-weighted average of0.181 ± 0.006. This clearly identifies that significantly loweryield devices were used compared with the 1952 and 1954test series. Other isotope ratios support this conclusion as240Pu/239Pu atom ratios in the range of 0.15–0.24 were ob-served in the 1956–1958 bands of a dated Bikini coral col-lected close to the Bravo test crater (Noshkin et al.,1975). In addition, a 240Pu/239Pu atom ratio of 0.24 ±0.04 (activity-weighted average) was observed in the1956–1958 bands of a dated coral from the French FrigateShoals, about 3300 km from the PPG (Buesseler, 1997).Additional sources that might have contributed to the totalPu contamination in the 1958–1960 coral bands are falloutfrom the nuclear tests at the Johnston Atoll (3.8 Mt fission),Christmas Island (3.3 Mt fission) and Malden Island(0.7 Mt fission) carried out in 1957 and 1958. However,these tests were carried out in high altitudes with no signif-icant local or regional fallout and thus mainly contributedto global fallout.
3.3. Pu inputs from 1961 to 1980
The 239+240Pu activity concentrations in the 1961–1980coral bands show an exponential decrease from�100 mBq kg�1 to �10 mBq kg�1 (Fig. 4) with 240Pu/239Puatom ratios in the range 0.13–0.30 (Fig. 2). Worldwide Pudeposition from global fallout peaked in 1963 with a subse-quent gradual decline, which was not as pronounced in theGuam coral bands as in previous studies of an Atlantic coral(Benninger and Dodge, 1986), probably due to the large Pudeposition from PPG close-in fallout. Residual Pu fromclose-in fallout still remains in the surrounding seawaterand continues to be incorporated into the coral bands.However, the 239+240Pu activity concentration peaks in the1963–1964 coral bands, increasing from 83 ± 4 mBq kg�1
in the 1962 coral band to 109 ± 8 mBq kg�1 and 101 ±5 mBq kg�1 in the 1963 and 1964 coral bands, respectively.A similar trend was observed in a Bikini coral with a signifi-cant increase in 239+240Pu activity concentration in the 1964coral band (Noshkin et al., 1975). Despite the influence ofresidual Pu, the 239+240Pu activity concentration in the coralbands shows a linear relationship (correlation coefficient of0.92) with the estimated worldwide annual Pu fallout deposi-tion (Fig. 4) from the global fallout peak of 1963 to the cessa-tion of the atmospheric tests in 1980. The activity-weightedaverage 240Pu/239Pu atom ratio for the 1963–1980 coralbands was 0.181 ± 0.013, which agrees well with the240Pu/239Pu atom ratio of 0.178 ± 0.012 found in global fall-out (Kelley et al., 1999). This further strengthens the hypoth-esis that the main Pu source in 1963–1980 was global fallout.
In addition, an interesting finding is the significantlyhigher 239+240Pu activity concentration of 46 ± 3 mBq kg�1
observed in the 1970 coral band compared with35.3 ± 2.3 mBq kg�1 in the adjacent 1969 coral band. Theglobal fallout deposition of 239+240Pu (Fig. 4) shows an in-creased value around 1970. The low 240Pu/239Pu atom ratioof 0.126 ± 0.017 in the 1970 coral band indicates an addi-tional Pu input from low-yield nuclear devices. The onlytwo sites where atmospheric nuclear weapons tests werecarried out around 1970 were Lop Nor in China and
French Polynesia in the South Pacific. In Lop Nor, high-yield devices (1.5–1.9 Mt fission) were tested during 1968–1970, while fallout from the nuclear detonations at theMururoa and Fangataufa Atolls is characterised by240Pu/239Pu atom ratios between 0.02 and 0.05 (Chiappiniet al., 1999; Hrnecek et al., 2005). Thus the increase in239+240Pu activity concentration, together with the lower240Pu/239Pu atom ratio, indicates that fallout from theFrench Polynesia tests affected the area in 1970.
3.4. Recent inputs of Pu (1981–1999)
The annual 239+240Pu activity concentrations in the1981–1999 coral bands do not reflect the 239+240Pu globalfallout deposition, which showed a sharp decrease after1980 with negligible Pu deposition by 1985 (Fig. 5). Thecoral 239+240Pu time series showed a slight decline from1981 to 1999, with varying activity concentrations between4.3 and 13.5 mBq kg�1. The first coral bands (1981–1983)can be interpreted as an overlap between contributionsfrom Pu global fallout and remobilised Pu from the PPG.It has been suggested that global fallout Pu in surface sea-water, which is mainly associated with sub-micron ironoxide particles, persists much longer than Pu from close-in fallout, which is mostly attached to calcium hydroxideparticles (Buesseler, 1997). This was also observed duringthe GEOSECS programme in 1973–1974 where relativelyhigh Pu concentrations were observed near the seafloor inthe Northwest Pacific (Bowen et al., 1980). However, the240Pu/239Pu atom ratios (Fig. 5) showed large fluctuations(0.12–0.37) with an activity-weighted average 0.273 ±0.029. This indicates that in addition to global fallout, thereis a variable Pu contribution from high fission yield devices,such as those tested in the 1950s at the PPG. There is acommon hypothesis that Pu is continuously leached outinto the open ocean from the contaminated seabed aroundthe Marshall Islands and further transported by surfacecurrents to the North Pacific (Lee et al., 2004; Zheng andYamada, 2004; Wang and Yamada, 2005; Hamiltonet al., 2009). The water transport time between the MarshallIslands and Guam Island is usually between 80 and 230days (Wolanski et al., 2003). Using the 240Pu/239Pu atomratios of 0.315 (see Section 3.2) and 0.18 for the two mainPu sources in the Pacific, close-in fallout and global falloutrespectively, in the simple mixing model (Eq. (1)) one canestimate an average PPG contribution of 69% in the1981–1999 coral bands. Similar results were found in thetop layers (from 1981 and onwards) of dated sedimentsfrom Okinawa Trough and the east coast of Japan, withan estimated Pu contribution from the PPG of about 40%(Lee et al., 2004; Zheng and Yamada, 2004). This can becompared with the estimated PPG contributions of 4% inthe 1961–1980 coral bands and 88% in the entire Guam cor-al (1946–1999). The results from the 1981–1999 coral bandssupport the hypothesis of continuous transport of PPG-de-rived Pu from the Marshall Islands by the NEC in theNorth Pacific.
Due to the relatively high uncertainties for the240Pu/239Pu atom ratios in the 1981–1999 coral bands, be-cause of the low concentrations, there are no significant

1960 1962 1964 1966 1968 1970 1972 1974 1976 1978 19800
20
40
60
80
100
120
0
0.5
1.0
1.5
2.0
239+
240 Pu
[mB
q kg
-1]
Year
Guam coral 239+240PuAnnual global fallout 239+240Pu
239+
240 Pu
dep
ositi
on [P
bq]
Fig. 4. 239+240Pu activity concentrations in Guam coral bands (Porites lobata), 1961–1980, and the estimated worldwide 239+240Pu depositionfrom global fallout. The global fallout 239+240Pu deposition is estimated from the 90Sr global deposition pattern (UNSCEAR, 2000). The errorbars represent ±1 standard deviation.
0
0.1
0.2
0.3
0.4
0.5
1980 1982 1984 1986 1988 1990 1992 1994 1996 1998 20000
4
8
12
16
0
10
20
30Guam coral 240Pu/239PuGuam coral 239+240PuGlobal fallout Pu deposition
240 Pu
/239 Pu
[ato
m]
239+
240 Pu
[mB
q kg
-1]
Year
239+
240 Pu
[TB
q]
Fig. 5. 240Pu/239Pu atom ratios and 239+240Pu activity concentrations in Guam coral growth bands (Porites lobata), 1981–1999, together withestimated worldwide 239+240Pu deposition, 1981–1992 (UNSCEAR, 2000). The error bars represent ±1 standard deviation. Horizontal solidand dashed lines represent the activity-weighted average 240Pu/239Pu atom ratio of 0.273 ± 0.058 (±2 standard deviation) for the 1981–1999coral bands.
Pu sources to the tropical NW Pacific, 1943–1999 1353
deviations from the activity-weighted average 240Pu/239Puatom ratio (Fig. 5). However, a significant peak in the239+240Pu activity concentration was observed in the 1991coral band compared with the adjacent bands of 1990
and 1992. The 240Pu/239Pu atom ratio of �0.29 indicatesan input of PPG-derived Pu to Guam Island. No increasein annual precipitation, which could result in increasedrunoff from land, was observed and the 1991 average sea

1354 P. Lindahl et al. / Geochimica et Cosmochimica Acta 75 (2011) 1346–1356
surface salinity of 34.4 was not significantly different fromthe average value for 1969–1995. The increase in239+240Pu activity concentrations may be attributable tochanges in water transport from the Marshall Islands toGuam Island. The annual volume transport of NEC showeda significant increase during 1991 compared with previousyears (1961–1990) (Qiu and Lukas, 1996), which may havecaused the increase in PPG-derived Pu to Guam Island.
By applying a concentration factor of 2.7 � 103 for theuptake of Pu into coral from the surrounding seawater(Noshkin et al., 1975) to the 239+240Pu activity concentra-tion data for the period 1981–1999, an average 239+240Puactivity volume concentration in surface seawater of�3.0 mBq m�3 can be estimated. This agrees well with theaverage value in the Northwest Pacific of2.5 ± 0.2 mBq m�3 observed during the IAEA ’97 expedi-tion (Povinec et al., 2003). Previous studies have also shownthat the recent 239+240Pu activity volume concentrations(1990–1997) in the Northwest Pacific are relatively homog-enously distributed, with an average 239+240Pu volume con-centration of 3.0 mBq m�3 (Hirose et al., 2001).
4. CONCLUSIONS
The determination of 239+240Pu activity concentrationsand 240Pu/239Pu atom ratios in dated bands of a coral hasprovided a record of the historical Pu composition (1946–1999) in Guam seawater for the first time and reflectschanges in the sources of Pu. The main Pu inputs to the sea-water around Guam were found to be close-in fallout fromthe PPG in the 1950s, global fallout in the 1960s and 1970s,and a mixture of the two sources from the 1980’s onwards.
The Pu isotopic composition in the 1950s coral bands cor-responds to detonations of high-yield nuclear devices fromthe PPG with an activity-weighted average 240Pu/239Pu atomratio of 0.315. However, the variation in the bands allows thespecific input from the 1952 high-yield Ivy Mike nuclear det-onation at the Enewetak Atoll in the Marshall Islands to beidentified, and the associated 240Pu/239Pu atom ratio of0.456 shows that the device tested had an unusually high pro-duction of heavier isotopes. The data also show that the 1956and 1958 PPG test series involved lower fission yield devicesthan the previous series in 1952 and 1954.
A clear input from the atmospheric nuclear tests inFrench Polynesia were identified in the 1970 coral bandwith high 239+240Pu activity concentration and low240Pu/239Pu atom ratio. The Pu input in recent coral bandsis dominated by PPG-derived Pu due to the continuoustransport of Pu-laden seawater by the NEC from the con-taminated seabed around the Marshall Islands. There isalso evidence to support the hypothesis that there have beenchanges in surface seawater transport along the NEC.
This work therefore demonstrates the value of using cor-al archives to examine historic Pu isotope ratios in seawaterand shows the importance of continuing this work alongNEC and its bifurcations to enhance the understanding ofthe fate of the PPG-Pu and to apply it to elucidating pastchanges in water transport in the Northwest Pacific, suchas the proposed disruption of the warm Kuroshio Currentflow due to global climate change (Sato et al., 2006).
ACKNOWLEDGMENTS
We gratefully acknowledge H. Adachi, S. Akama, B. Irish, C.P.Meyer, G. Paulay, T. Yamada and Marine Laboratory staff of Uni-versity of Guam for helping in the sample collection and the fieldsurvey. This work was financially supported under the EuropeanCommission 7th Framework, Marie Curie International OutgoingFellowship Research Project PIOF-GA-2008-219625 “PLUTO-TRACE”; Ministry of Education, Culture, Sport, Science andTechnology of Japan project “GCMAPS” and the Rising Star Pro-gram for Subtropical Island Sciences, University of the Ryukyus.The authors also thank Robert H. Byrne for the editorial handlingand Terry Hamilton, Johannes Lachner and one anonymous re-viewer for their constructive reviews.
APPENDIX A. SUPPLEMENTARY DATA
Supplementary data associated with this article can befound, in the online version, at doi:10.1016/j.gca.2010.12.012.
REFERENCES
Aarkrog A. (2003) Input of anthropogenic radionuclides into theWorld Ocean. Deep-Sea Res. II 50, 2597–2606.
Asami R., Yamada T., Iryu Y., Meyer C. P., Quinn T. M. andPaulay G. (2004) Carbon and oxygen isotopic composition of aGuam coral and their relationships to environmental variablesin the western Pacific. Palaeogeogr. Palaeoecol. 212,
1–22.
Asami R., Yamada T., Iryu Y., Quinn T., Meyer C. P. and PaulayG. (2005) Interannual and decadal variability of the westernPacific sea surface condition for the years 1787–2000: recon-struction based on stable isotope record from a Guam coral. J.
Geophys. Res. 110, C05018.
Asami R., Felis T., Deschamps P., Hanawa K., Iryu Y., Bard E.,Durand N. and Murayama M. (2009) Evidence for tropicalSouth Pacific climate change during the Younger Dryas and theBølling-Allerød from geochemical records of fossil Tahiticorals. Earth Planet. Sci. Lett. 288, 96–107.
Benninger L. K. and Dodge R. E. (1986) Fallout plutonium andnatural radionuclides in annual bands of the coral Montastreaannularis, St. Croix, U.S. Virgin Islands. Geochim. Cosmochim.
Acta 50, 2785–2797.
Bowen V. T., Noshkin V. E., Livingston H. D. and Volchok H. L.(1980) Fallout radionuclides in the Pacific Ocean: vertical andhorizontal distributions, largely from GEOSECS stations.Earth Planet. Sci. Lett. 49, 411–434.
Buesseler K. O. (1997) The isotopic signature of fallout plutoniumin the North Pacific. J. Environ. Radioact. 36, 69–83.
Chiappini R., Pointurier F., Millies-Lacroix J. C., Lepetit G. andHemet P. (1999) 240Pu/239Pu isotopic ratios and 239+240Pu totalmeasurements in surface and deep waters around Mururoa andFangataufa atolls compared with Rangiroa atoll (FrenchPolynesia). Sci. Total Environ. 237–238, 269–276.
Delcroix T., Henin C., Masia F. and Varillon D. (2001) Three
Decades of In Situ Sea Surface Salinity Measurements in the
Tropical Pacific Ocean. Tropical Pacific Ocean Climate Studies,Laboratory of Physical Oceanography of IRD Noumea, NewCaledonia, CD-ROM.
Diamond H., Fields P. R., Stevens C. S., Studier M. H., Fried S. M.,Inghram M. G., Hess D. C., Pyle G. L., Mech J. F., Manning W.M., Ghiorso A., Thompson S. G., Higgins G. H., Seaborg G. T.,Browne C. I., Smith H. L. and Spence R. W. (1960) Heavy isotope

Pu sources to the tropical NW Pacific, 1943–1999 1355
abundances in Mike thermonuclear device. Phys. Rev. 119,
2000–2004.
Dorn D. W. (1962) Mike results – implications for spontaneousfission. Phys. Rev. 126, 693.
Druffel E. R. M. (1997) Geochemistry of corals: proxies of pastocean chemistry, ocean circulation, and climate. Proc. Natl.
Acad. Sci. USA 94, 8354–8361.
Grottoli A. G. and Eakin C. M. (2007) A review of modern corald18O and D14C proxy records. Earth-Sci. Rev. 81, 67–91.
Hamilton T., Dasher D., Brown T., Martinelli R., Marchetti A.and Kehl S. (2009) Determination of plutonium activityconcentrations and 240Pu/239Pu atom ratios in Brown Algae(Fucus distichus) collected from Amchitka Island, Alaska. J.
Radioanal. Nucl. Chem. 282, 477–482.
Hirose K., Aoyama M., Miyao T. and Igarashi Y. (2001)Plutonium in seawaters of the western North Pacific. J.
Radioanal. Nucl. Chem. 248, 771–776.
Hrnecek E., Steier P. and Wallner A. (2005) Determination ofplutonium in environmental samples by AMS and alphaspectrometry. Appl. Rad. Isot. 63, 633–638.
IAEA. (2005) Worldwide Marine Radioactivity Studies
(WOMARS): Radionuclide Levels in Oceans and Seas. IAEA-TECDOC-1429. International Atomic Energy Agency, Vienna,Austria. 194 pp.
Keeney-Kennicutt W. L. and Morse J. W. (1985) The redoxchemistry of PuðVÞOþ2 interaction with common mineralsurfaces in dilute solutions and seawater. Geochim. Cosmochim.
Acta 49, 2577–2588.
Kelley J. M., Bond L. A. and Beasley T. M. (1999) Globaldistribution of Pu isotopes and 237Np. Sci. Total Environ. 237–
238, 483–500.
Kim C. K., Kim C. S., Chang B. U., Choi S. W., Chung C. S.,Hong G. H., Hirose K. and Igarashi Y. (2004) Plutoniumisotopes in seas around the Korean Peninsula. Sci. Total
Environ. 318, 197–209.
Knutson D. W., Buddemeier R. W. and Smith S. V. (1972) Coralchronometers: seasonal growth bands in reef corals. Science
177, 270–272.
Koide M., Bertine K. K., Chow T. J. and Goldberg E. D. (1985)The 240Pu/239Pu ratio, a potential geochronometer. Earth
Planet. Sci. Lett. 72, 1–8.
Lachner J., Christl M., Bisinger T., Michel R. and Synal H.-A.(2010) Isotopic signature of plutonium at Bikini atoll. Appl.
Radiat. Isot. 68, 979–983.
Lee S.-Y., Huh C.-A., Su C.-C. and You C.-F. (2004)Sedimentation in the Southern Okinawa Trough: enhancedparticle scavenging and teleconnection between the Equato-rial Pacific and western Pacific margins. Deep-Sea Res. I 51,
1769–1780.
Leon Vintro L., Mitchell P. I., Condren O. M., Moran M., Vives iBatlle J. and Sanchez-Cabeza J. A. (1996) Determination of the240Pu/239Pu atom ratio in low activity environmental samplesby alpha spectrometry and spectral deconvolution. Nucl.
Instrum. Methods Phys. Res. Sect. A 369, 597–602.
Lindahl P., Keith-Roach M., Worsfold P., Choi M.-S., Shin H.-S.and Lee S.-H. (2010a) Ultra-trace determination of plutoniumin marine samples using multi-collector inductively coupledplasma mass spectrometry. Anal. Chim. Acta 671, 61–69.
Lindahl P., Lee S.-H., Worsfold P. and Keith-Roach M. (2010b)Plutonium isotopes as tracers for ocean processes: a review.Mar. Environ. Res. 69, 73–84.
Livingston H. D., Povinec P. P., Ito T. and Togawa O. (2001) Thebehaviour of plutonium in the Pacific Ocean. In Plutonium in
the Environment (ed. A. Kudo). Elsevier, pp. 267–292.Machta L., List R. J. and Hubert L. F. (1956) World-wide travel of
atomic debris. Science 124, 474–477.
Martinelli R., Hamilton T., Williams R. and Kehl S. (2009)Separation of uranium and plutonium isotopes for measure-ment by multi collector inductively coupled plasma massspectroscopy. J. Radioanal. Nucl. Chem. 282, 343–347.
McAninch J. E., Hamilton T. F., Brown T. A., Jokela T. A.,Knezovich J. P., Ognibene T. J., Proctor I. D., Roberts M. L.,Sideras-Haddad E., Southon J. R. and Vogel J. S. (2000)Plutonium measurements by accelerator mass spectrometry atLLNL. Nucl. Instrum. Methods Phys. Res. Sect. B 172, 711–716.
Meece D. E. and Benninger L. K. (1993) The coprecipitation of Puand other radionuclides with CaCO3. Geochim. Cosmochim.
Acta 57, 1447–1458.
Muramatsu Y., Hamilton T., Uchida S., Tagami K., Yoshida S.and Robison W. (2001) Measurement of 240Pu/239Pu isotopicratios in soils from the Marshall Islands using ICP-MS. Sci.
Total Environ. 278, 151–159.
Nakano M. and Povinec P. P. (2003) Modelling the distribution ofplutonium in the Pacific Ocean. J. Environ. Radioact. 69, 85–
106.
Noshkin V. E., Wong K. M., Eagle R. J. and Gatrousis C. (1975)Transuranics and other radionuclides in Bikini Lagoon:concentration data retrieved from aged coral sections. Limnol.
Oceanogr. 20, 729–742.
Noshkin V. E., Wong K. M., Jokela T. A., Brunk J. L. and EagleR. J. (1987) Plutonium and americium behavior in coral atollenvironments. In Oceanic Processes in Marine Pollution (eds. T.P. Conner, C. W. Burt and I. A. Duedall). pp. 159–174.
Olivier S., Bajo S., Fifield L. K., Gaggeler H. W., Papina T.,Santschi P. H., Schotterer U., Schwikowski M. and Wacker L.(2004) Plutonium from global fallout recorded in an ice corefrom the Belukha Glacier. Siberian Altai. Environ. Sci. Technol.
38, 6507–6512.
Perkins R. W. and Thomas C. W. (1980) Worldwide fallout. InTransuranic Elements in the Environment (ed. W. C. Hanson).US DOE/TIC-22800. Office of Health and EnvironmentalResearch. pp. 53–82.
Povinec P. P., Livingston H. D., Shima S., Aoyama M., GastaudJ., Goroncy I., Hirose K., Huynh-Ngoc L., Ikeuchi Y., Ito T.,La Rosa J., Liong Wee Kwong L., Lee S.-H., Moriya H.,Mulsow S., Oregioni B., Pettersson H. and Togawa O. (2003)IAEA’97 expedition to the NW Pacific Ocean – results ofoceanographic and radionuclide investigations of the watercolumn. Deep-Sea Res. II 50, 2607–2637.
Purdy C. B., Druffel E. R. M. and Hugh D. L. (1989) Anomalouslevels of 90Sr and 239,240Pu in Florida corals: evidence of coastalprocesses. Geochim. Cosmochim. Acta 53, 1401–1410.
Qiu B. and Lukas R. (1996) Seasonal and interannual variability ofthe North Equatorial Current, the Mindanao Current, and theKuroshio along the Pacific western boundary. J. Geophys. Res.
101, 12315–12330.
Rayner N. A., Parker D. E., Horton E. B., Folland C. K.,Alexander L. V., Rowell D. P., Kent E. C. and Kaplan A.(2003) Global analyses of sea surface temperature, sea ice, andnight marine air temperature since the late nineteenth century.J. Geophys. Res 108, 4407.
Sato Y., Yukimoto S., Tsujino H., Ishizaki H. and Noda A. (2006)Response of North Pacific Ocean circulation in a Kuroshio-resolving ocean model to an Arctic Oscillation (AO)-likechange in northern hemisphere atmospheric circulation due togreenhouse-gas forcing. J. Meteor. Soc. Japan 84, 295–309.
Taylor D. M. (2001) Environmental plutonium – creation of theuniverse to twenty-first century mankind. In Plutonium in the
Environment (ed. A. Kudo). Elsevier, pp. 1–14.UNSCEAR. (2000) Sources and Effects of Ionizing Radiation,
Volume I: Sources. United Nations Scientific Committee on theEffects of Atomic Radiation, Report to the General Assembly,

1356 P. Lindahl et al. / Geochimica et Cosmochimica Acta 75 (2011) 1346–1356
with Scientific Annexes, United Nations. United Nations, NewYork. 649 pp.
Wang Z.-l. and Yamada M. (2005) Plutonium activities and240Pu/239Pu atom ratios in sediment cores from the east Chinasea and Okinawa Trough: sources and inventories. Earth
Planet. Sci. Lett. 233, 441–453.
Warneke T., Croudace I. W., Warwick P. E. and Taylor R. N.(2002) A new ground-level fallout record of uranium andplutonium isotopes for northern temperate latitudes. Earth
Planet. Sci. Lett. 203, 1047–1057.
Wolanski E., Richmond R. H., Davis G., Deleersnijder E. andLeben R. R. (2003) Eddies around Guam, an island in theMariana Islands group. Cont. Shelf Res. 23, 991–1003.
Xie P. and Arkin P. A. (1997) Global precipitation: a 17-yearmonthly analysis based on gauge observations, satellite esti-
mates, and numerical model outputs. Bull. Amer. Meteor. Soc.
78, 2539–2558.
Yamamoto M., Ishiguro T., Tazaki K., Komura K. and Kaoru U.(1996) 237Np in hemp-palm leaves of Bontenchiku for fishinggear used by the Fifth Fukuryu-Maru: 40 years after “Bravo”.Health Phys. 70, 744–748.
Yamana H., Yamamoto T. and Moriyama H. (2001) Isotopic ratioof Pu released from fuel cycle facilities – importance ofradiochemically pure 236Pu as a tracer. In Plutonium in the
Environment (ed. A. Kudo). Elsevier, pp. 31–46.Zheng J. and Yamada M. (2004) Sediment core record of global
fallout and Bikini close-in fallout Pu in Sagami Bay, westernNorthwest Pacific margin. Environ. Sci. Technol. 38, 3498–3504.
Associate editor: Robert H. Byrne