Sound infuence on landscape values
10
Sound influence on landscape values Jose ´ Luis Carles a,* , Isabel Lo ´pez Barrio a , Jose ´ Vicente de Lucio b a Instituto de Acu ´stica (CSIC) C/ Serrano, 144. 28006, Madrid, Spain b Departamento de Ecologı ´a, Universidad Complutense de Madrid, 28040, Madrid, Spain Received 6 November 1997; received in revised form 27 July 1998; accepted 13 October 1998 Abstract In order to study the influence of the interaction between visual and acoustic stimuli on perception of the environment, 36 sound and image combinations were presented to 75 subjects. The sounds and images used were of natural and semi-natural settings and urban green space. Affective response was measured in terms of pleasure. The results show a rank of preferences running from natural to man-made sounds, with the nuance of a potential alert or alarm-raising component of the sound. The potential for alert or alarm-raising may be related, over and above the information content or meaning, to the characteristics of the sound frequency spectrum, specifically to the existence of frequency bands whose sound levels impose themselves on the acoustic background. The congruence or coherence between sound and image influences preferences. Coherent combinations are rated higher than the mean of the component stimuli. Results suggest that there is a need to identify places or settings where the conservation of the sound environment is essential, because of its salient informational content or due to the drastic impact of the loss of sound quality on observer appreciation, for example, in urban green spaces, natural spaces and cultural landscapes. # 1999 Elsevier Science B.V. All rights reserved. Keywords: Soundscape; Perception; Acoustic; Ecology 1. Introduction The perceptual interaction between image and sound has been amply dealt with in laboratory studies (Stein and Meredith, 1993; Meredith et al., 1987). In an experiment carried out in an anechoic chamber in which stimuli were electronically generated, Parlitz and Colonius (1993) confirmed the significant influ- ence of visual parameters in the appraisal and percep- tion of sound. They concluded that different sen- sory stimuli, auditory and visual, converge in ‘multi- sensorial’ neurones which govern functions like spatial ability and orientation. Environmental studies usually deal with sound in its noise or pollutant facet, and rarely as an informative or orientational element. The information function of a landscape, however, is not circumscribed to this aggressive aspect. A landscape totally devoid of sound would certainly prove disturbing or unnerving. A number of studies in recent years have coincided in stressing the key role of soundscapes (Schafer, 1976) in environmental evaluation. Several authors have attempted to identify the informational, aesthetic or affective qualities of sound which help to confer quality on a given landscape. Landscape and Urban Planning 43 (1999) 191–200 *Corresponding author. Tel.: +349-34-1-5618806; fax: +349-34- 1-4117651; e-mail: [email protected] 0169-2046/99/$19.00 # 1999 Elsevier Science B.V. All rights reserved. PII S0169-2046(98)00112-1
Transcript of Sound infuence on landscape values

Sound in¯uence on landscape values
Jose Luis Carlesa,*, Isabel LoÂpez Barrioa, Jose Vicente de Luciob
aInstituto de AcuÂstica (CSIC) C/ Serrano, 144. 28006, Madrid, SpainbDepartamento de EcologõÂa, Universidad Complutense de Madrid, 28040, Madrid, Spain
Received 6 November 1997; received in revised form 27 July 1998; accepted 13 October 1998
Abstract
In order to study the in¯uence of the interaction between visual and acoustic stimuli on perception of the environment, 36
sound and image combinations were presented to 75 subjects. The sounds and images used were of natural and semi-natural
settings and urban green space. Affective response was measured in terms of pleasure. The results show a rank of preferences
running from natural to man-made sounds, with the nuance of a potential alert or alarm-raising component of the sound. The
potential for alert or alarm-raising may be related, over and above the information content or meaning, to the characteristics of
the sound frequency spectrum, speci®cally to the existence of frequency bands whose sound levels impose themselves on the
acoustic background. The congruence or coherence between sound and image in¯uences preferences. Coherent combinations
are rated higher than the mean of the component stimuli. Results suggest that there is a need to identify places or settings
where the conservation of the sound environment is essential, because of its salient informational content or due to the drastic
impact of the loss of sound quality on observer appreciation, for example, in urban green spaces, natural spaces and cultural
landscapes. # 1999 Elsevier Science B.V. All rights reserved.
Keywords: Soundscape; Perception; Acoustic; Ecology
1. Introduction
The perceptual interaction between image and
sound has been amply dealt with in laboratory studies
(Stein and Meredith, 1993; Meredith et al., 1987). In
an experiment carried out in an anechoic chamber in
which stimuli were electronically generated, Parlitz
and Colonius (1993) con®rmed the signi®cant in¯u-
ence of visual parameters in the appraisal and percep-
tion of sound. They concluded that different sen-
sory stimuli, auditory and visual, converge in `multi-
sensorial' neurones which govern functions like
spatial ability and orientation.
Environmental studies usually deal with sound in its
noise or pollutant facet, and rarely as an informative or
orientational element. The information function of a
landscape, however, is not circumscribed to this
aggressive aspect. A landscape totally devoid of sound
would certainly prove disturbing or unnerving.
A number of studies in recent years have coincided
in stressing the key role of soundscapes (Schafer,
1976) in environmental evaluation. Several authors
have attempted to identify the informational, aesthetic
or affective qualities of sound which help to confer
quality on a given landscape.
Landscape and Urban Planning 43 (1999) 191±200
*Corresponding author. Tel.: +349-34-1-5618806; fax: +349-34-
1-4117651; e-mail: [email protected]
0169-2046/99/$19.00 # 1999 Elsevier Science B.V. All rights reserved.
P I I S 0 1 6 9 - 2 0 4 6 ( 9 8 ) 0 0 1 1 2 - 1
Some isolated approaches to this matter have also
been made from the ®elds of geography and environ-
mental psychology. Southworth (1969), for instance,
in a pioneering study which charted the reactions of
different population groups during a tour round Bos-
ton, showed that people's evaluation of a city's sound
environment depends on three aspects: the informa-
tion contained in the sound, the context in which it is
perceived and its level.
Anderson et al. (1983) found that any appraisal of a
given place depended largely on the sounds heard
there. The authors used a variety of procedures such as
in situ evaluation, questionnaires setting out verbal
descriptions of sounds, and slides accompanied by
recorded sounds. Herrington et al. (1993) studied the
validity of different media for representing landscapes
with signi®cant dynamic elements.
More recently Viollon and Lavandier (1997) stu-
died the in¯uence of visual on auditory components in
urban landscapes. Their ®ndings were that visual
conditions modify the auditory perception of subjects
to a signi®cant degree.
Generally speaking the results of these studies
indicate that both the emotional meaning attributed
to a sound and the importance of the context in which
it occurs determine the degree of liking felt for a
particular landscape.
In a research project involving 127 school pupils
aged 11 and 12, asked to rate combinations of four
sounds and eight landscape photographs (Carles et al.,
1992) it was found that `̀ a general factor of congru-
ence may be evoked to explain most of the observed
interactions.'' Appraisal of a sound depended largely
on the extent to which it matched with the setting in
which it occurred (e.g. natural sounds in a natural
setting). When sounds are not appropriate to the
context in which they are perceived and do not provide
readable information on the same (traf®c circulation in
a natural landscape) they are perceived as `noise' and
negatively rated. Apparently sounds provide a speci®c
kind of information over and above the visual which
helps enhance and emphasise the different compo-
nents of the environment.
In a ®eld study carried out in three Spanish
cities (LoÂpez Barrio and Carles, 1995), it was shown
that the acoustic identity of different urban environ-
ments in¯uenced subjects' evaluation of these
places.
The aim of this study is to analyse the sound±image
coherence in greater depth, identifying the speci®c
contribution of each stimulus to the total landscape
value. In short, our aim is to show how the acoustic
impact on landscapes and, in particular, on those most
highly regarded by the population, can signify a loss of
environmental quality which until now has been
barely considered. This study, speci®cally, starts from
the hypothesis that the suspicion of activities deleter-
ious to the landscape awoken by the presence of
unexpected sounds gives rise to high levels of rejec-
tion among subjects.
2. Methods
Sound ratings can be carried out either in situ or in
the laboratory. As regards the ®rst category, we would
cite the approach to soundscapes developed in the
1970s (Schafer, 1976), which seeks to centre acoustic
analysis strategies on honing the listening skills of the
hearer through techniques like the soundwalk which
are also clearly educational. Laboratory procedures, in
the meantime, generally make use of pre-recorded
sounds or methods using verbal descriptions of
sounds. Some studies extend their scope beyond sound
to visual characteristics, essentially through the use of
slides. In general, projects on environmental prefer-
ences and attitudes confront the dif®culties which
human beings face in expressing feelings, emotions
or ideas. This dif®culty is exacerbated in the case of
sound, as environmental analysis has tended to deal
with sound environments in relation to noise, making
it harder to talk about sounds in terms which avoid this
negative connotation (Amphoux, 1991; LoÂpez Barrio
and Carles, 1997). In our case, we start from the idea
that the method to be used in a project like the present
one must not only suf®ciently effective to overcome
the above-mentioned dif®culties in expressing or
representing sound, but must also prove simple and
comfortable for survey participants. This can be
achieved through the use of direct stimuli, in our case
slides and recorded sounds.
To conclude, we hope that the procedures used in
our study will facilitate, as far as is possible, automatic
responses and an objective and precise evaluation of
one particular aspect of the environment, that of sound
preferences. An aspect on which there exist few
192 J.L. Carles et al. / Landscape and Urban Planning 43 (1999) 191±200
analysis procedures and little theoretical knowledge
suf®ciently tried and tested, above all if we compare
with the wide body of knowledge existing about visual
preferences.
2.1. Stimuli
Six images and six sounds were selected covering
natural and semi-natural scenes and urban green
spaces (parks) on a parallel variability scale of similar
environmental situations (Table 1). Sounds ranged
from the purely natural, without human presence, to
those containing voices or mechanical sounds caused
by anthropic activity. In choosing the images a balance
was sought between built-up and natural elements.
Exclusively urban images without any natural element
were excluded from the selection. In ®ve cases the
correspondence between sound and image represented
the most likely association in reality.
Natural sounds are normally associated with gentle
variations in volume and tone. Likewise natural land-
scapes are associated with an abundance of vegetation.
In view of this, and in order to provide a wider range of
stimuli, a sixth visual element was included compris-
ing a natural image but with very little greenery,
similar to a steppe, and the sound of a thunderstorm.
The sample thus comprised 36 different sound±image
combinations. The sound fragments chosen combined
a number of elements to make up a simple, easily
recognisable soundscape in which each part was
clearly distinguishable. Each fragment lasted around
30 s.
2.2. Procedure
The visual and sound stimuli were presented ®rst
separately and then in varying combinations (Table 2).
Subjects had to rate, ®rst, each image (Ii), then each
sound (Si) and ®nally, each combination (Ii/Si) in
terms of pleasure on a ®ve-point scale (1 � very
unpleasant; 5 � very pleasant). Application of the test
took around 25 min. Valuations of images, sounds and
combinations were carried out in the same order, in a
single session, by the 75 individuals participating in
the experiment. It was not considered necessary to
randomise the sample on the grounds that both sounds
and images are independently perceived. Also, the fact
that the number of participants (75) was far smaller
than the number of possible combinations (6!) to be
made with visual and acoustic stimuli would make
randomisation more dif®cult.
Images and sounds were presented to groups in an
acoustically conditioned room under good conditions
of visibility. Participants were placed at a distance of
between 4 and 10 m from high ®delity loudspeakers
and efforts were made to ensure that each one was in a
similar stereophonic space. Equipment comprised a
Sony DAT (Digital Audio Tape) player (TDC-D10
PRO) with an ampli®er and high ®delity loudspeakers.
The images were shown on slides projected against a
screen. Responses were written down by each parti-
cipant on a pre-prepared template.
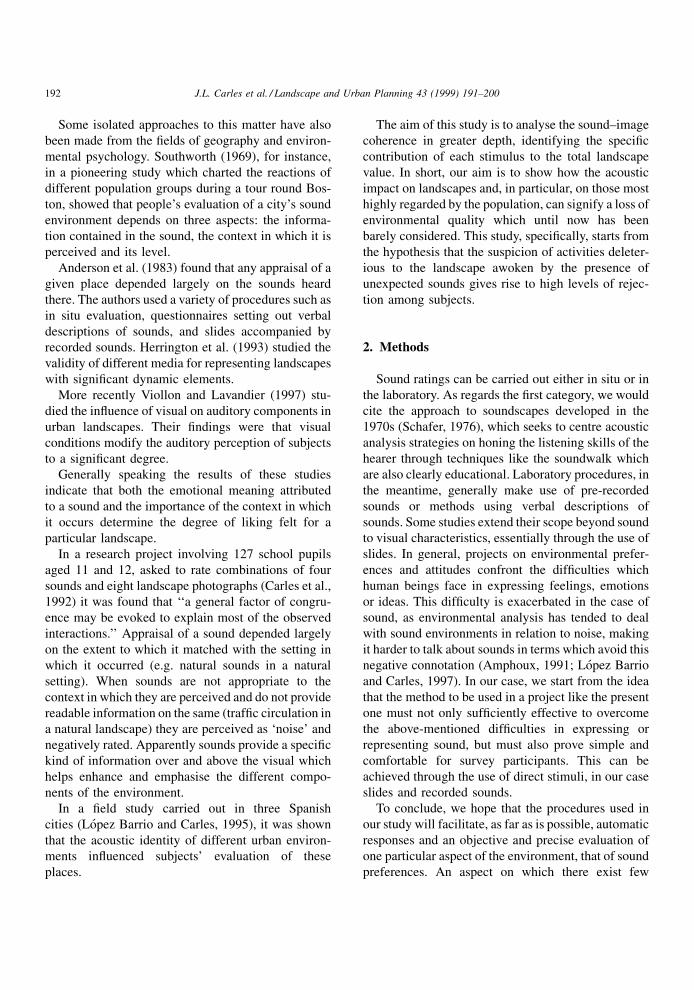
Table 1
Acoustic and visual stimuli selected
Sounds Images
Village Village
Stream with birdsong Stream
Busy park Park with children
Thunderstorm Steppe
Quiet park Empty park
Residential neighbourhood Residential neighbourhood
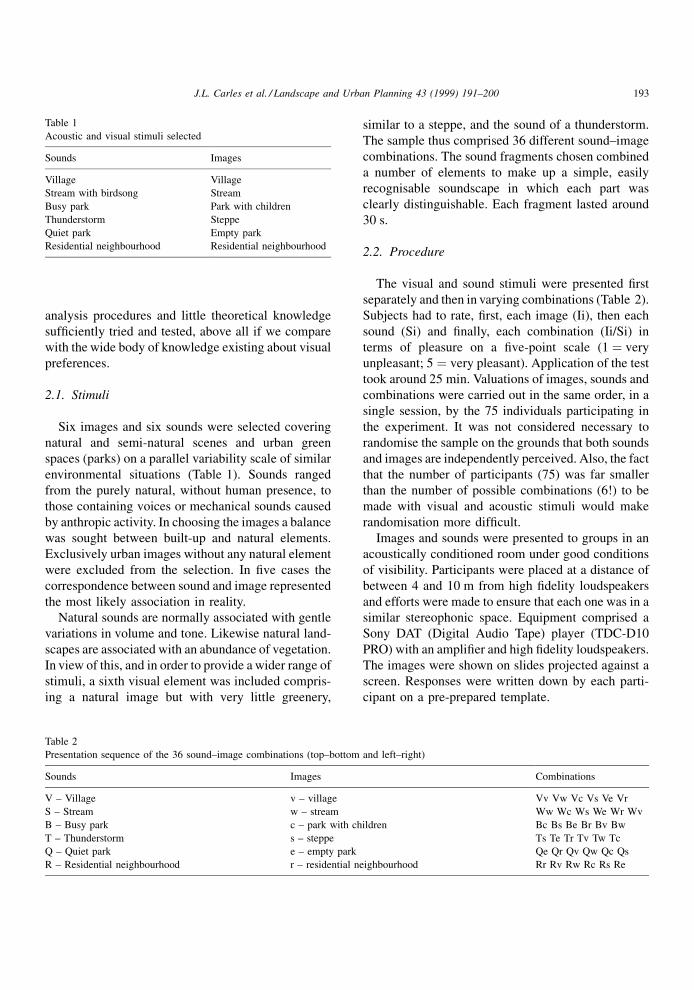
Table 2
Presentation sequence of the 36 sound±image combinations (top±bottom and left±right)
Sounds Images Combinations
V ± Village v ± village Vv Vw Vc Vs Ve Vr
S ± Stream w ± stream Ww Wc Ws We Wr Wv
B ± Busy park c ± park with children Bc Bs Be Br Bv Bw
T ± Thunderstorm s ± steppe Ts Te Tr Tv Tw Tc
Q ± Quiet park e ± empty park Qe Qr Qv Qw Qc Qs
R ± Residential neighbourhood r ± residential neighbourhood Rr Rv Rw Rc Rs Re
J.L. Carles et al. / Landscape and Urban Planning 43 (1999) 191±200 193

2.3. Sample
Survey participants were 75 university students (43
women and 32 men) aged between 21 and 30 (average
age � 23). Valuations of both images, sounds and
combinations were carried out in the same order by
all 75 participants.
3. Results
3.1. Evaluation of sounds and landscape images
Firstly, to indicate that the inter-rater reliability
ratio (Carmines theta) applied to combination ratings
was 0.83.
Presented separately, sound and image sets received
a similar average rating (Table 3): sounds: 3.55;
images: 3.65. The scoring range for each group of
stimuli was also very similar. The maximum scores in
both cases corresponded to the sound and image of the
stream: 4.60, sound and 4.48, image. The residential
neighbourhood (open development) received the low-
est rating: 2.25, sound and 2.40, image. Excluding the
image of the steppe and sound of the thunderstorm,
which do not match up, the ranking of preferences was
the same for each set: stream, village, quiet park, busy
park and residential neighbourhood. An overall pre-
ference is evident for natural and rural rather than
urban or man-made scenes. Sounds in which voices
and domestic animals predominate, like the village,
attract a higher rating than urban parks. This kind of
sound environment comes within the general concept
of cultural landscape, a frequent subject of the litera-
ture on landscape conservation (Stanners and Bour-
deau, 1995).
The thunderstorm sound scored slightly higher than
pleasant (4.10), and received the highest rating of all
those sounds including arti®cial components, and the
lowest of all the natural sounds. The steppe image was
rated slightly less than pleasant (3.77), and achieved a
similar score to the empty park and higher than the
images depicting built-up elements.
Subjects were more discriminating in their prefer-
ences when asked about sound±image combinations.
The average valuation range was wider, running from
4.68 (image and sound of stream) to 1.77 (image of
stream and sound of busy park). The evaluation of
Table 3
Mean scores (in bold) and standard deviation obtained by different sound±image combinations
Images Sounds Combination
means/standar
deviations
Separate sound
means/standar
deviationsVillage Stream Busy
park
Thunder-
storm
Quiet
park
Residential
neighbourhood �x �xs s
village �x 43.7 3.89 2.80 3.91 3.52 3.19 3.61 4.14
s 0.67 1.03 0.93 0.97 0.99 0.97 1.06 0.71
stream �x 3.37 4.68 1.77 4.03 3.11 1.89 3.14 4.60
s 1.17 0.70 0.85 1.15 1.13 0.86 1.44 0.63
park with childern �x 3.09 2.80 2.88 2.99 2.49 1.92 2.70 2.79
s 0.99 1.03 0.96 1.18 0.83 0.98 1.07 0.76
steppe �x 3.85 4.08 1.79 4.05 3.12 1.84 3.12 4.10
s 0.90 1.02 0.86 1.08 0.87 0.90 1.35 1.00
empty park �x 3.92 4.19 2.23 4.21 3.75 2.19 3.41 3.13
s 0.98 0.86 0.91 1.03 0.84 0.91 1.26 0.98
residential neighbourhood �x 3.27 2.61 2.04 3.11 3.04 2.43 2.75 2.55
s 0.99 0.87 0.81 1.07 0.76 0.79 0.98 0.76
Combination
means/standar deviations
�x 3.65 3.71 2.25 3.72 3.17 2.24 �x � 3.55
s 1.05 1.19 0.99 1.18 0.99 1.01 s � 0.81
Separate image
means/standar deviations
�x 4.11 4.48 3.37 3.77 3.80 2.40 �x � 3.66
s 0.53 0.60 0.95 1.09 0.75 0.80 s � 0.79
Average score and standard deviation of sounds heard in the absence of images and images seen in the absence of sounds.
194 J.L. Carles et al. / Landscape and Urban Planning 43 (1999) 191±200

each visual or auditory stimulus was substantially
modi®ed by the presence of another stimulus, suggest-
ing that the sum of the two gives subjects a greater
basis for judgement.
The differences in the scores of each land and
soundscape are statistically signi®cant, both for
images and sounds taken separately and interacting
(Table 4).
As we can see from Table 3, the mean value of
sound±image combinations is not the same as the
mean score obtained for each stimulus individually.
In general, coherent combinations of sound and image
are more highly rated than the mean of each compo-
nent stimulus (Fig. 1). The congruence or coherence
effect has already been reported in previous experi-
ments (Carles et al., 1992) and may be related to the
coherence variable found in studies on visual land-
scape (BernaÂldez, 1985; Kaplan et al., 1987) and,
more classically, with the coherence concept used
in aesthetic psychology studies (FranceÂs, 1979).
Certain sounds consistently increased the scores of
both urban and rural or natural images. This was the
case in our experiment with the sounds of the stream
and the thunderstorm. Natural sounds, particularly of
water, help create positive feelings towards the land-
scape. The attraction of the presence of water in
landscapes has been interpreted as expressing the
qualities of survival and fertility ascribed to this
element (Schafer, 1976; BernaÂldez et al., 1989).
The most highly rated combination was the sound
and image of a stream, while the lowest score was
accorded the combination of the stream image and the
sound of the busy park. These appraisals would seem
to arise from the speci®c effect of the sound of water
and the importance of sound±image congruence. The
sound of the stream, in the meantime, usually
increased the value assigned to images.
The images of city parks were more appreciated
when subjects did not hear their real sound content,
evidencing how such landscapes lose quality as the
sound environment deteriorates. Many people
would prefer to ®nd more silence in a park, consider-
ing its real function, or, even better, the sounds of
nature.
Table 4
Variance analysis on scores of sound±image combinations
Source Sum of squares df Mean square F-value
Sound 1128.10 5 225.62 250.74a
Image 291.49 5 58.30 64.79a
Interaction 411.71 25 16.47 18.30a
Error 2397.12 2664 0.90
ap < 0.01.
Fig. 1. Sound and image means. (a) Bar chart corresponding to the mean values assigned by subjects to sounds with and without the presence
of images. V ± Village, W ± Stream, B ± Busy park, T ± Thunderstorm, Q ± Quiet park, R ± Residential neighbourhood. (b) Bar chart
corresponding to the mean values assigned by subjects to images with and without the presence of sounds. V ± Village, W ± Stream, C ± Park
with children, S ± Steppe, E ± Empty park, R ± Residential neighbourhood. Fig. 1 sets out the mean scores of each of the stimuli used in this
experiment (both sound and image) ± and, therefore, the variation in ratings ± before and after their combination. We can see from the figure
how those combinations in which sound and image fit perfectly together receive a higher rating than that assigned to component stimuli when
they are rated separately. The most congruent combinations attract higher scores than their individual components.
J.L. Carles et al. / Landscape and Urban Planning 43 (1999) 191±200 195
In order to track the complex mutual in¯uences at
work between sounds and images, we carried out a
correspondence analysis. This procedure allows reg-
ular patterns or trends in subjects' responses to be
picked out. Evaluation styles or trends are represented
through a system of co-ordinates or dimensions which
can be interpreted by the position of the variables or
stimuli used in the survey.
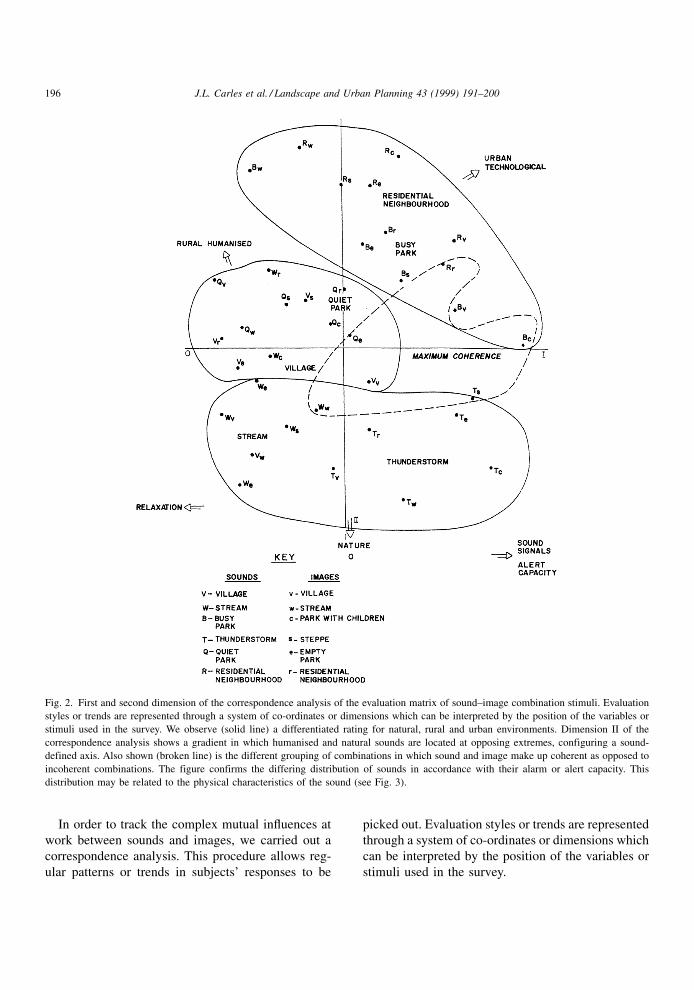
Fig. 2. First and second dimension of the correspondence analysis of the evaluation matrix of sound±image combination stimuli. Evaluation
styles or trends are represented through a system of co-ordinates or dimensions which can be interpreted by the position of the variables or
stimuli used in the survey. We observe (solid line) a differentiated rating for natural, rural and urban environments. Dimension II of the
correspondence analysis shows a gradient in which humanised and natural sounds are located at opposing extremes, configuring a sound-
defined axis. Also shown (broken line) is the different grouping of combinations in which sound and image make up coherent as opposed to
incoherent combinations. The figure confirms the differing distribution of sounds in accordance with their alarm or alert capacity. This
distribution may be related to the physical characteristics of the sound (see Fig. 3).
196 J.L. Carles et al. / Landscape and Urban Planning 43 (1999) 191±200
The distribution in space of the combinations
allows different groupings to be distinguished
with regard to both relative distances (the
proximity or distance of each combination from
others) and their locations versus the axis mid-
points.
The ®rst two dimensions of the correspondence
analysis account for 61.68% of the total variance of
the data matrix. Fig. 2 shows a projection of sound±
image combinations on the plane formed by these two
dimensions.
The ®rst dimension shows a gradient associated
with sound characteristics in terms of their alarm or
alert content. Located at the positive end of axis 1 are
combinations with the storm, busy park and open
residential neighbourhood.
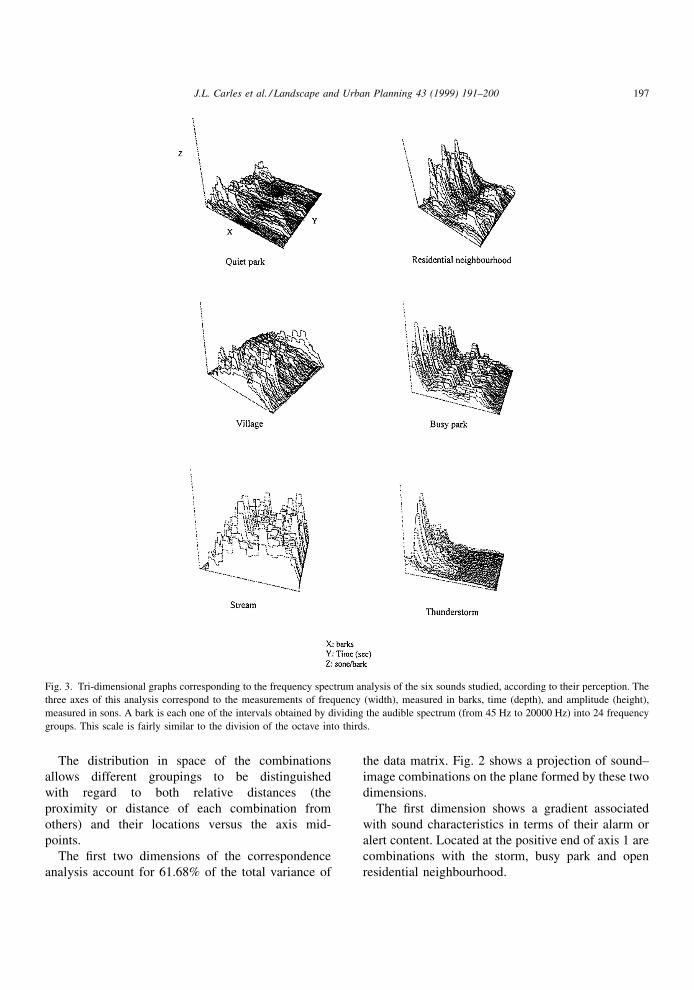
Fig. 3. Tri-dimensional graphs corresponding to the frequency spectrum analysis of the six sounds studied, according to their perception. The
three axes of this analysis correspond to the measurements of frequency (width), measured in barks, time (depth), and amplitude (height),
measured in sons. A bark is each one of the intervals obtained by dividing the audible spectrum (from 45 Hz to 20000 Hz) into 24 frequency
groups. This scale is fairly similar to the division of the octave into thirds.
J.L. Carles et al. / Landscape and Urban Planning 43 (1999) 191±200 197

Spectral analysis of sound in the three dimensions
of frequency, loudness and time denotes, as can be
observed in Fig. 3, the presence of narrow bands
corresponding to the speci®c pitches produced by
voices, dogs, car horns, thunder, etc., which stand
out from the background noise. This frequency ana-
lysis by barks takes into account the auditory ampli-
®cation curves to obtain the frequency distribution of
sounds, exactly as they are after being submitted to the
auditory mechanism, and therefore just as the subject
perceives them (Zwicker and Fastl, 1990).
These sound signals vary in time, with attention-
drawing sounds of an intrusive or penetrating nature
successively appearing and disappearing (Fidel and
Teffeteller, 1981; Bjork, 1986, 1995). In contrast, the
stream, village and peaceful park, although their
frequency components are many, display only mod-
erate variations in loudness in which no single band
predominates over the rest of the spectrum. Alarm or
alert capacity is a very concrete aspect of the informa-
tion content of sound which appears to play a crucial
role in landscape appreciation.
As we can see from Fig. 2, the second dimension
shows the naturalness±arti®ciality gradient of scenes
according to the sounds present. The positive pole
groups combinations with man-made sounds, while
combinations with natural sounds are located at the
negative end. Combinations attracting a low rating
tend to be located at the positive extreme correspond-
ing to arti®cial settings. The combinations of man-
made sounds with whatever kind of image also tend
towards the positive end of the co-ordinate axis.
4. Discussion
4.1. Components of soundscape preferences:
Naturalness and alarm. Both image and sound
interact in perception of the general quality of
landscape
The different analyses carried out in this research
project allow us to verify the importance of the sound
component in determining preference variations. Spe-
ci®cally, the correspondence analysis shows that when
sounds are taken separately, they tend to receive more
consistent ratings than images, whose position in the
system of co-ordinates would be better explained in
relation to the accompanying sound.
The results of correspondence analysis point to two
main functions of sound in the landscape as regards
the providing of information which complements
visual data. One such function is related to the inter-
pretation of the sounds identi®ed (water, birdsong,
voices, cars, etc.), the other is related to the abstract
structure of sound information.
Natural sounds are rated positively, and increase
appreciation of natural and arti®cial settings. Many
natural sounds (especially the sound of water) help to
enhance both the images of natural environments and
of urban spaces by projecting onto them a meaning
other than that derived from the image in isolation. In
this regard, the experiments carried out by Bjork
(1986, 1995), show how the sounds of water and of
birdsong (excepting alarm calls) have greater ability
than human sounds to induce states of relaxation, as
analysed from selected psychophysiological para-
meters (heart rate, skin conductance and electromyo-
graphic responses). The ®ndings on natural
soundscapes are consistent with those relating to the
visual landscape. Likewise, it has been found that
natural landscapes are particularly sensitive to the
presence of man-made sounds.
The results of this study also show how human
sounds (voices, footsteps, conversations, etc.) ®t in
relative to natural sounds (highly rated) and techno-
logical sounds (widely rejected). Apparently this kind
of sound, when it appears as an element of commu-
nication, of social intercourse adds to an appreciation
of humanised spaces (whether in a rural or urban
setting), although in some cases (shouts, noise...) it
may clash with the aspirations attached to speci®c
sites, for example, peace and quiet in an urban park. In
other cases, man-made sounds can denote the exis-
tence of activities which are not present in the image,
and signal a deterioration in the environmental quality
of the landscape.
In our experiment, rural sounds tended to occupy a
halfway point between the most purely urban and
natural sounds. This kind of soundscape could well
represent a part of our acoustic heritage which is being
lost, together with other aspects of traditional cultural
landscapes.
The second facet of the information content of
sound is more closely associated to its physical struc-
ture in terms of ability to produce alarm or alert. This
kind of information may be related to the most
198 J.L. Carles et al. / Landscape and Urban Planning 43 (1999) 191±200
primitive, instinctive aspects of auditory perception
as regards how the information is processed by the
brain. Their function would be the rapid detection
of environmental sound patterns, facilitating, for
example, the recognition of signals of alarm or alert.
Similar perceptual systems, in this case geared to the
recognition of visual patterns, have been detected in
eye movements during the exploration of landscape
images (De Lucio et al., 1996).
A sound's alert-raising capacity is related to abrupt
variations in the sound level of certain frequency
bands. Sound signals produced in a storm or those
present in a busy park or residential area induce states
of alert which are evaluated differently according to
the receiver and the place. Although more uniform
sounds are usually associated with natural settings, in
many cases the opposite is true. Our study, for
instance, included the thunderstorm as a natural sound
but with abrupt variations in loudness and the totally
man-made sounds of a village but with gentle varia-
tions in sound level.
A number of authors have referred to information
content as de®ning artistic preferences (FranceÂs,
1979) and landscape preferences (BernaÂldez, 1985),
differentiating the identi®able and/or concrete con-
tents from other more abstract contents relating to the
structure of the stimulus. In our case, these informa-
tion contents could be associated to the ®rst and
second dimensions, respectively, of the correspon-
dence analysis.
4.2. Sound±image congruence
The relationship between a sound's alert-raising
capacity and the setting in which it appears has an
important impact on its interpretation. An alarm sound
in a setting to which it is alien means something
different from the same sound ascribable to a certain
visual element of the landscape. Our general inter-
pretation would be that ratings can be signi®cantly
affected when the interaction between the sound and
visual elements present is inappropriate. A change in
sound±image compatibility conditions is enough to
produce quite different aesthetic and affective reac-
tions. Visual information and acoustic information, as
such, can reinforce or interfere with each other.
The role of sound±image congruence in shaping
environmental preferences, as found in this and pre-
vious experiments, may be interpreted with reference
to the information content which the sound provides
relative to the image. Sounds indicate components of
the landscape not detectable by the eye, inducing
appreciation or rejection according to the information
content provided, the physical structure of the sound
itself and the degree of concordance between both
stimuli.
This sense of coherence or congruence has been
invoked in classic studies on aesthetic preferences
(FranceÂs, 1979; Arnheim, 1983) to refer to subjects'
ability to unite disparate elements and con®gurations
of a given scene into a coherent whole.
The relating of the information content of images
and sounds on two different planes opens up whole
new horizons in landscape studies. It would be inter-
esting, for example, to analyse the effect of sound-
image congruence on certain variables classically used
for the prediction of landscape preferences, such as
`mystery' as reported by Kaplan et al. (1989): `̀ ...pro-
mise of new but related information.'' This explora-
tory and anticipatory function may well be ful®lled
largely by sound.
As regards this variable, the lower ratings accorded
to combinations in which the natural landscape
appears with sounds alien to its typology could clash
with the traditional view. In classic studies of land-
scape preferences, this promise of new information in
the landscape is a positive and relevant variable as
regards preferences. This ful®lment of a basic need, in
this case the need to explore, may be limited in our
study by an overload or saturation of contradictory
visual and acoustic stimuli (Milgran, 1970; Amphoux,
1991) which may cause a decrease in the scores of
environments where sound is not congruent with the
visual landscape.
4.3. Consequences for planners and managers
Images modify the effects of sounds and also
determine environmental quality. In our experiment,
the scenes in which sounds are most highly rated are
those containing vegetation or abundant water. These
preferences are related to the expectations of quality,
diversity, complexity, etc. which these environments
give rise to. In certain places with a distinct environ-
mental identity, any acoustic disturbance can lead to a
rapid deterioration in quality. Natural sounds, mean-
J.L. Carles et al. / Landscape and Urban Planning 43 (1999) 191±200 199
while, may improve the quality of built-up environ-
ments to a certain extent. However, any incongruence
between sound and image in a landscape quite clearly
diminishes the value assigned it, indicating the need to
conserve singular soundscapes. This question comes
to the fore in places whose use and function implies
the presence of natural sounds. Such cases call for the
application of soundscape conservation measures in
protected natural spaces, cultural landscapes and parks
and green areas. A further in¯uence stems from the
alert-raising capacity of sounds, which appears to
attract different ratings according to the subjects
consulted, and displays a similar behaviour to the
variables studied in landscape preferences, such as
mystery or risk.
Our interest in this study has centred on the evalua-
tion of a limited number of natural or natural-urba-
nised environments. This raises the question as to
whether other kinds of soundscapes, either natural
(re¯ecting different ecosystems from those set out
here) or urban, technological, social, etc. share the
same properties. A fundamental step in this respect
would be to develop research projects aimed at the
analysis and study of soundscape preferences. We
regard it as essential that this method be developed
and contrasted with others, in order to obtain a more
exact idea of its viability. It is also important to enlarge
the sample to other population groups to establish
control over the preference impact of factors like age,
sex, cultural origin, etc.
Acknowledgements
The authors wish to thank the anonymous reviewers
for their suggestions and remarks concerning the
manuscript.
References
Anderson, L.M., Mulligan, B.E., Goodman, L.S., Regan, H.Z.,
1983. Effects of sounds on preferences for outdoor settings.
Environ. Behaviour 15(5), 539±566.
Arnheim, R., 1983. Arte y percepcioÂn visual. Alianza Editorial,
Madrid.
Amphoux, P., 1991. Aux eÂcoutes de la ville. CRESSON. Rapport
n894 Grenoble.
BernaÂldez, F.G., 1985. InvitacioÂn a la ecologõÂa humana. Adapta-
cioÂn afectiva al entorno. Ed. Tecnos, Madrid.
BernaÂldez, F.G., AbelloÂ, R.P., Gallardo, D., 1989. Environmental
challenge and environmental preferences: Age and sex effects.
J. Environ. Manage. 28, 53±70.
Bjork, E.A., 1986. Laboratory annoyance and skin conductance
responses to some natural sounds. J. Sound Vibration 109(2),
339±345.
Bjork, E.A., 1995. Psychophysiological responses to some natural
sounds. Acta Acustica. 3, 83±88.
Carles, J.L., BernaÂldez, F.G., y De Lucio, J.V., 1992. Audio-visual
interactions in soundscape preferences. Landscape Res. 17(2),
52±56.
De Lucio, J.V., Mohamadian, M., Ruiz, J.P., Benayas, J.,
BernaÂldez, F.G., 1996. Visual landscape exploration as revealed
by eye movement tracking. Landscape and Urban Planning 34,
135±142.
Fidel, S., Teffeteller, S., 1981. Scaling the annoyance of intrusive
sounds. J. Sound and Vibration. 78, 291.
FranceÂs, R., 1979. Psychologie de l'art et de l'estheÂtique. PUF,
Paris.
Herrington, S., Daniel, T.C., Brown, T.C., 1993. Is motion more
important than it sounds? The medium of presentation in
environment research. Environ. Psychology 13, 283±291.
Kaplan, R., Kaplan, S., Brown, T., 1989. Environmental pre-
ference: A Comparison of Four Domains of Predictors. J.
Environ. Behaviour 21(5), 509±530.
Kaplan, R., Herbert, R.J., 1987. Cultural and subcultural compar-
isons in preferences for natural settings. Landscape and urban
planning, 14, pp. 161±176.
LoÂpez Barrio, I., Carles, J.L., 1995. Acoustic dimensions of
inhabited areas: Quality criteria. The Soundscape Newsletter
10, 6±8.
LoÂpez Barrio, I. y Carles, J.L., 1997. La calidad sonora de
Valencia. Espacios sonoros representativos. FundacioÂn Ban-
caixa. Valencia.
Meredith, M.A., Nemitz, J.W., Stein, B.E., 1987. Determinants of
multisensory integration in superior colliculus neurons. I.
Temporal factors. J. Neurosci. 10, 3215±3229.
Milgran, S., 1970. The experience of living cities. Science 167,
1461±1468.
Parlitz, D., Colonius, H., 1993. Effects of visual stimulation on
auditory detection. In: Schick, August (Ed.), Contribution to
Psychological Acoustics. Oldenburg.
Stein, B.E., Meredith, M.A., 1993. The Merging of the Senses,
MIT Press.
Schafer, M.R., 1976. The Tuning of the World. McClelland and
Stewart. Toronto.
Stanners, D., Bourdeau, P. (Eds.), 1995. Europe's Environment.
The Dobris Assessment. European Environment Agency,
Copenhagen.
Southworth, 1969. The sonic environment of the cities Environ-
ment and behavior I, 49±70.
Viollon, S., Lavandier, C., 1997. EÂ tude de l'influence de la vision
sur l'audition en contexte urbain. In: Actes du 4eÂme CongreÂs
Franc,ais d'Acoustique, vol. 1, pp. 311±314.
Zwicker, E., Fastl, H., 1990. Psychoacoustics. Facts and Models.
Springer, Heidelberg.
200 J.L. Carles et al. / Landscape and Urban Planning 43 (1999) 191±200