
Rethinking Generalization in American Sign Language ... - arXiv
Some aspects of the generalization of small-scale digital elevation models
Zsuzsanna Ungvári*, Renáta Szabó**
* PhD Student at Eötvös Loránd University (ELTE), Department of Cartography and Geoinformatics, [email protected] ** Assistant research fellow, Hungarian Academy of Sciences, Geographical Insti-tute, Research Centre for Astronomy and Earth Sciences. [email protected]
Abstract. The present study examined the usability of ETOPO1 digital ele-vation model for small scale maps. The horizontal generalization of the con-tour lines generated from ETOPO1 was based on a geoinformatics algo-rithm. The authors gave the reduction values of simplification for the algo-rithm, and assigned these values to each map scale. The vertical generaliza-tion was examined by a diagram made on the frequency of the depths. The contour lines of the presented maps were based on the most frequent values of depths, though other criteria were also considered. The calculated values were compared with the earlier assigned values for the whole world. The examined area was the Arctic Ocean; therefore, the determined calculated values are valid for this region only.
Keywords: vertical generalization, horizontal generalization, DEM, line generalization algorithm
1. Introduction Digital elevation models (DEM) are widely used in cartographic practice, but it is important to know their limits. The technical parameters are known from the documentation, but their cartographic applications are sometimes incorrect. The goal of the current project is to examine the use-fulness of contour lines of the vertical and horizontal generalization in vari-ous map scales generated from DEM.

The examinations were started with 1 : 25 000 000 and smaller scale maps. We chose a sample area, the Arctic Ocean (Szabó 2012), for which the eleva-tion model was freely available. This area is over 60° north, therefore the SRTM and ASTER GDEM are unusable; in addition, most of the areas are marine regions. The best choice was the ETOPO1 dataset of the bedrock of the ocean basin with 1 arc minute spatial resolution. This database is free for download from NOAA’s ERDAP server (NOAA ERDAP server, 2013). This model contains also the elevations for the maritime bedrock under the ocean surface. From this model, the terrain elevations can be prepared for further processing.
In this paper, the authors examine how to reduce the subjectivity of gener-alization in map making and give ideas how to generalize the contour lines generated from DEMs.
2. Determination of the best values in vertical generalization
The horizontal and vertical generalizations are closely related, but they should be separated in particular cases. At the horizontal generalization, the cartographers edit the contour lines according to their knowledge of geo-graphical forms. The geoinformatics algorithms, like the Ramer-Douglas-Peucker algorithm, simplify the shape and the number of polyline nodes. However, the vertical generalization means the selection of the heights and depths where the contour lines are drawn.
Using the information from the DEM's about the heights and depths of the terrain, it is possible to create the demonstrative hypsometric curve of each elevation frequency for a sample area. In the past, these diagrams were made manually (Márton 2012), which was hard work, and some data were neglected. Therefore, the authors created a file from ETOPO1, which con-tains the elevations of the terrain with one minute spatial resolution. From this file, the authors processed the data, and classified the elevations in sev-eral categories. Each number was rounded according to the conventional rules of mathematical rounding. The output dataset contains the group of each elevation in every 50 meter.
According to earlier studies that gave recommendations for the number of contour lines and their values, the minimal number is sixteen at 1 : 25 000 000 and smaller scales (Márton, 2012). Márton offered the fol-lowing values for bathymetric lines:

200, 1000, 2000, 3000, 3500, 3750, 4000, 4200, 4400, 4600, 4800, 5000, 5250, 5500, 5750, 6000
Figure 1: The map of the Arctic Ocean with the earlier mentioned depths (Szabó 2012).
When he made the histogram of terrain elevations, he considered the whole world ocean floor. The authors chose the area of the Arctic Ocean for their study, therefore, the recommended values were changed (Figure 2).
When selecting the depth values, the authors considered several aspects, which make the map making and reading easier. The contour lines should not be too close to each other; therefore, the minimum contour interval is 200 meters. Accordingly, also the steep slopes can be represented until the contour lines touch each other or should abort them in the graphic depic-tion. The most frequent depths were chosen and modified due to this prin-
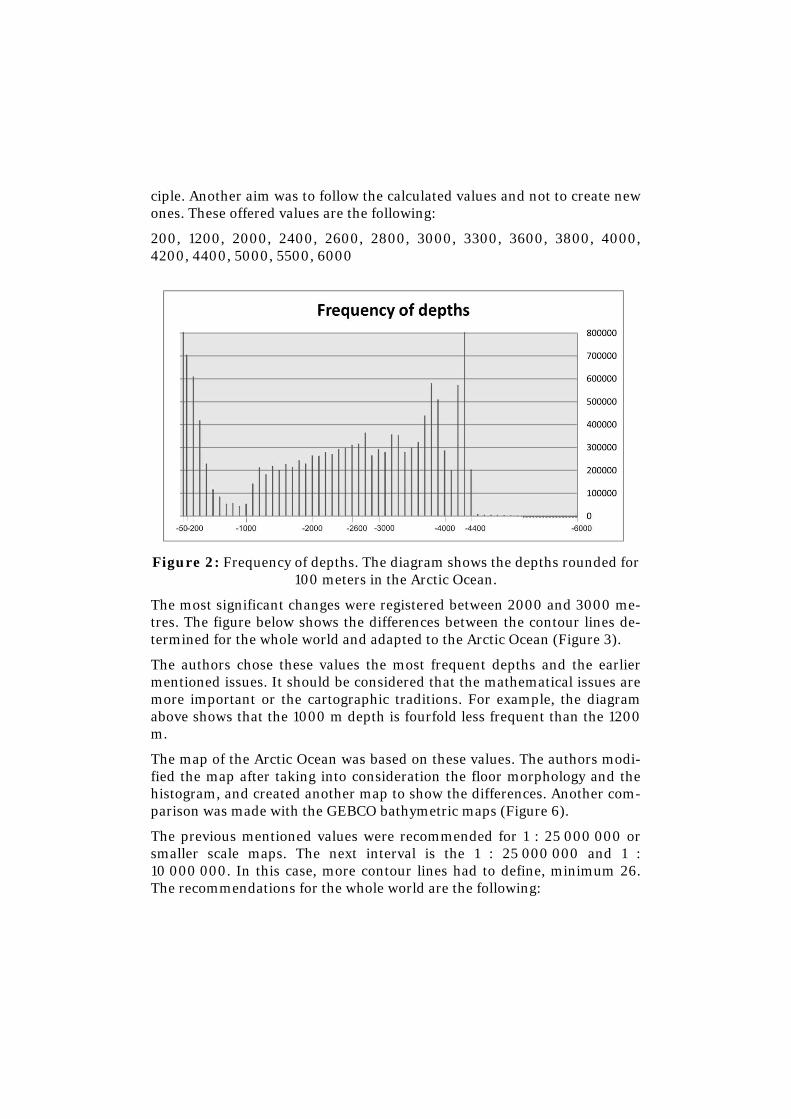
ciple. Another aim was to follow the calculated values and not to create new ones. These offered values are the following:
200, 1200, 2000, 2400, 2600, 2800, 3000, 3300, 3600, 3800, 4000, 4200, 4400, 5000, 5500, 6000
Figure 2: Frequency of depths. The diagram shows the depths rounded for 100 meters in the Arctic Ocean.
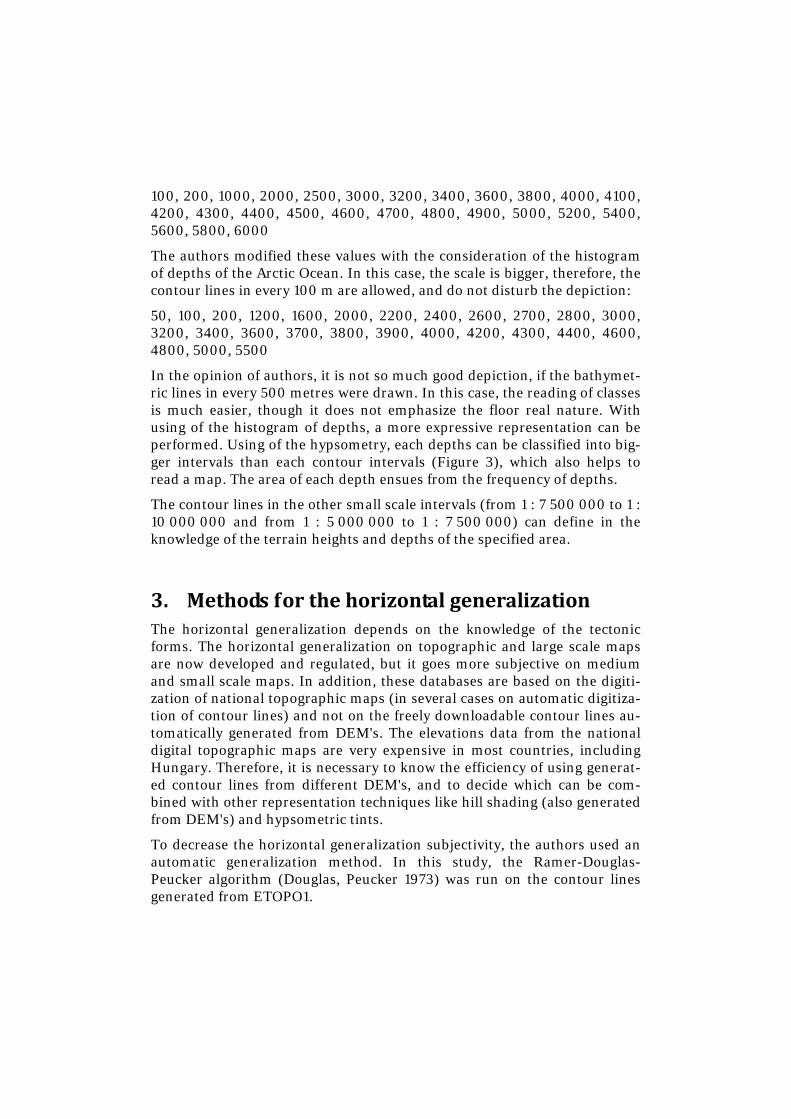
The most significant changes were registered between 2000 and 3000 me-tres. The figure below shows the differences between the contour lines de-termined for the whole world and adapted to the Arctic Ocean (Figure 3).
The authors chose these values the most frequent depths and the earlier mentioned issues. It should be considered that the mathematical issues are more important or the cartographic traditions. For example, the diagram above shows that the 1000 m depth is fourfold less frequent than the 1200 m.
The map of the Arctic Ocean was based on these values. The authors modi-fied the map after taking into consideration the floor morphology and the histogram, and created another map to show the differences. Another com-parison was made with the GEBCO bathymetric maps (Figure 6).
The previous mentioned values were recommended for 1 : 25 000 000 or smaller scale maps. The next interval is the 1 : 25 000 000 and 1 : 10 000 000. In this case, more contour lines had to define, minimum 26. The recommendations for the whole world are the following:
100, 200, 1000, 2000, 2500, 3000, 3200, 3400, 3600, 3800, 4000, 4100, 4200, 4300, 4400, 4500, 4600, 4700, 4800, 4900, 5000, 5200, 5400, 5600, 5800, 6000
The authors modified these values with the consideration of the histogram of depths of the Arctic Ocean. In this case, the scale is bigger, therefore, the contour lines in every 100 m are allowed, and do not disturb the depiction:
50, 100, 200, 1200, 1600, 2000, 2200, 2400, 2600, 2700, 2800, 3000, 3200, 3400, 3600, 3700, 3800, 3900, 4000, 4200, 4300, 4400, 4600, 4800, 5000, 5500
In the opinion of authors, it is not so much good depiction, if the bathymet-ric lines in every 500 metres were drawn. In this case, the reading of classes is much easier, though it does not emphasize the floor real nature. With using of the histogram of depths, a more expressive representation can be performed. Using of the hypsometry, each depths can be classified into big-ger intervals than each contour intervals (Figure 3), which also helps to read a map. The area of each depth ensues from the frequency of depths.
The contour lines in the other small scale intervals (from 1 : 7 500 000 to 1 : 10 000 000 and from 1 : 5 000 000 to 1 : 7 500 000) can define in the knowledge of the terrain heights and depths of the specified area.
3. Methods for the horizontal generalization The horizontal generalization depends on the knowledge of the tectonic forms. The horizontal generalization on topographic and large scale maps are now developed and regulated, but it goes more subjective on medium and small scale maps. In addition, these databases are based on the digiti-zation of national topographic maps (in several cases on automatic digitiza-tion of contour lines) and not on the freely downloadable contour lines au-tomatically generated from DEM's. The elevations data from the national digital topographic maps are very expensive in most countries, including Hungary. Therefore, it is necessary to know the efficiency of using generat-ed contour lines from different DEM's, and to decide which can be com-bined with other representation techniques like hill shading (also generated from DEM's) and hypsometric tints.
To decrease the horizontal generalization subjectivity, the authors used an automatic generalization method. In this study, the Ramer-Douglas-Peucker algorithm (Douglas, Peucker 1973) was run on the contour lines generated from ETOPO1.
Figure 3: The first picture shows the earlier determined values for the whole world; and the second one represents the new bathymetric lines based on frequen-cy of depths in the Arctic Ocean. The hypsometry can help to understand the map.
For generating the isoline dataset, the authors used the Global Mapper software. The contour lines were exported to GeoJSON text file format. Then the authors wrote a program, which simplified the polylines with the RDP algorithm, and replaced the breaking lines with Bézier curves. Finally, the curvy lines were saved in SVG format (Agárdi, Ungvári, Zentai 2013). If we want to print the map, some preparation is needed, but the preparation times are not same. The advantage of the replacement of the broken lines with Bézier curves is that these maps are suitable for printing with minimal
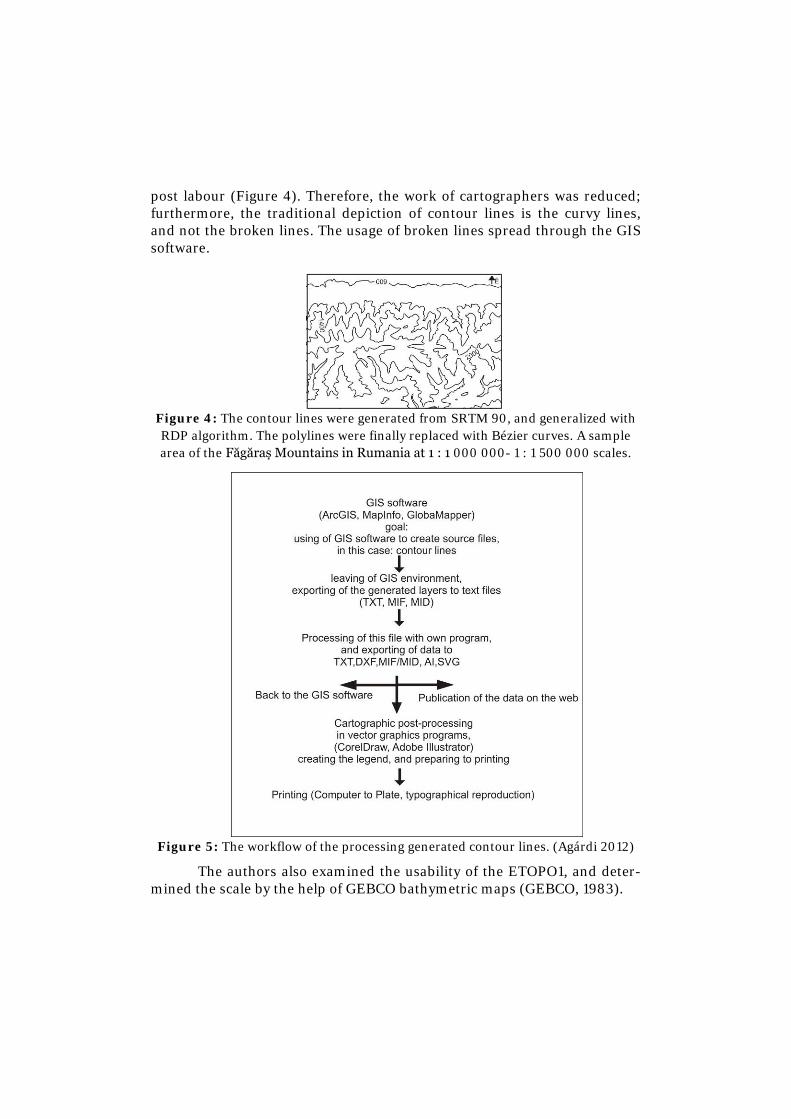
post labour (Figure 4). Therefore, the work of cartographers was reduced; furthermore, the traditional depiction of contour lines is the curvy lines, and not the broken lines. The usage of broken lines spread through the GIS software.
Figure 4: The contour lines were generated from SRTM 90, and generalized with RDP algorithm. The polylines were finally replaced with Bézier curves. A sample area of the Făgăraș Mountains in Rumania at 1 : 1 000 000- 1 : 1 500 000 scales.
Figure 5: The workflow of the processing generated contour lines. (Agárdi 2012)
The authors also examined the usability of the ETOPO1, and deter-mined the scale by the help of GEBCO bathymetric maps (GEBCO, 1983).
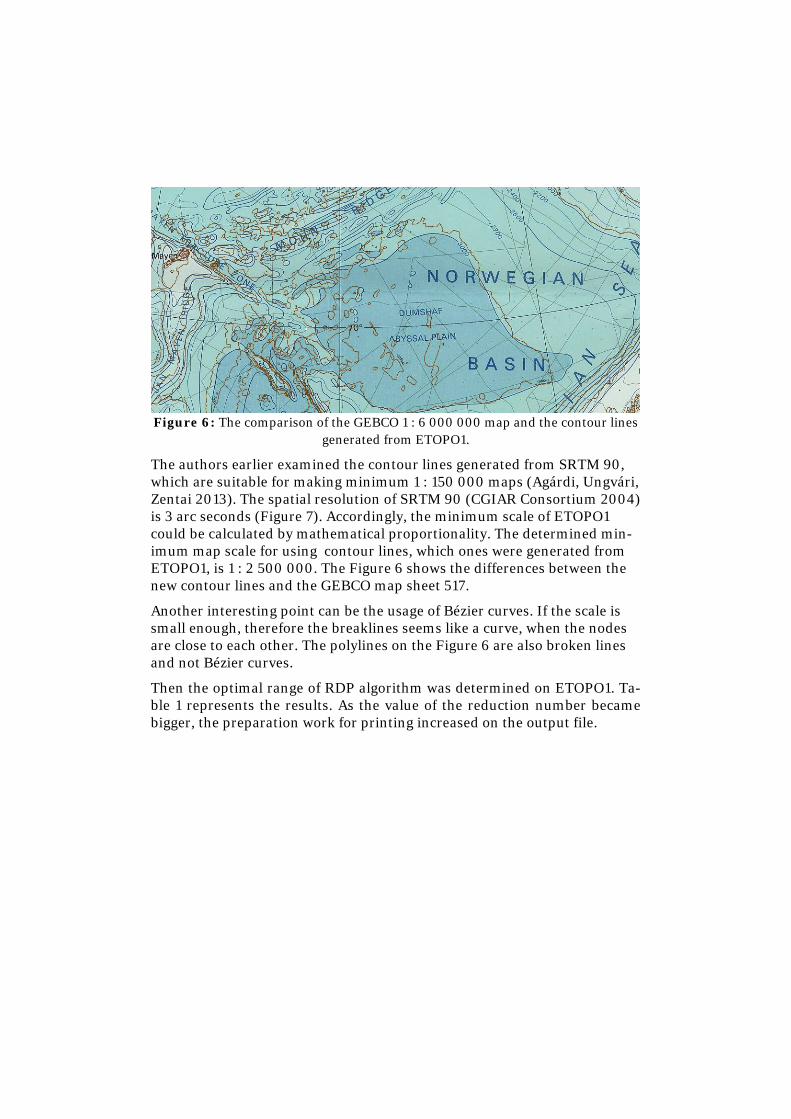
Figure 6: The comparison of the GEBCO 1 : 6 000 000 map and the contour lines generated from ETOPO1.
The authors earlier examined the contour lines generated from SRTM 90, which are suitable for making minimum 1 : 150 000 maps (Agárdi, Ungvári, Zentai 2013). The spatial resolution of SRTM 90 (CGIAR Consortium 2004) is 3 arc seconds (Figure 7). Accordingly, the minimum scale of ETOPO1 could be calculated by mathematical proportionality. The determined min-imum map scale for using contour lines, which ones were generated from ETOPO1, is 1 : 2 500 000. The Figure 6 shows the differences between the new contour lines and the GEBCO map sheet 517.
Another interesting point can be the usage of Bézier curves. If the scale is small enough, therefore the breaklines seems like a curve, when the nodes are close to each other. The polylines on the Figure 6 are also broken lines and not Bézier curves.
Then the optimal range of RDP algorithm was determined on ETOPO1. Ta-ble 1 represents the results. As the value of the reduction number became bigger, the preparation work for printing increased on the output file.
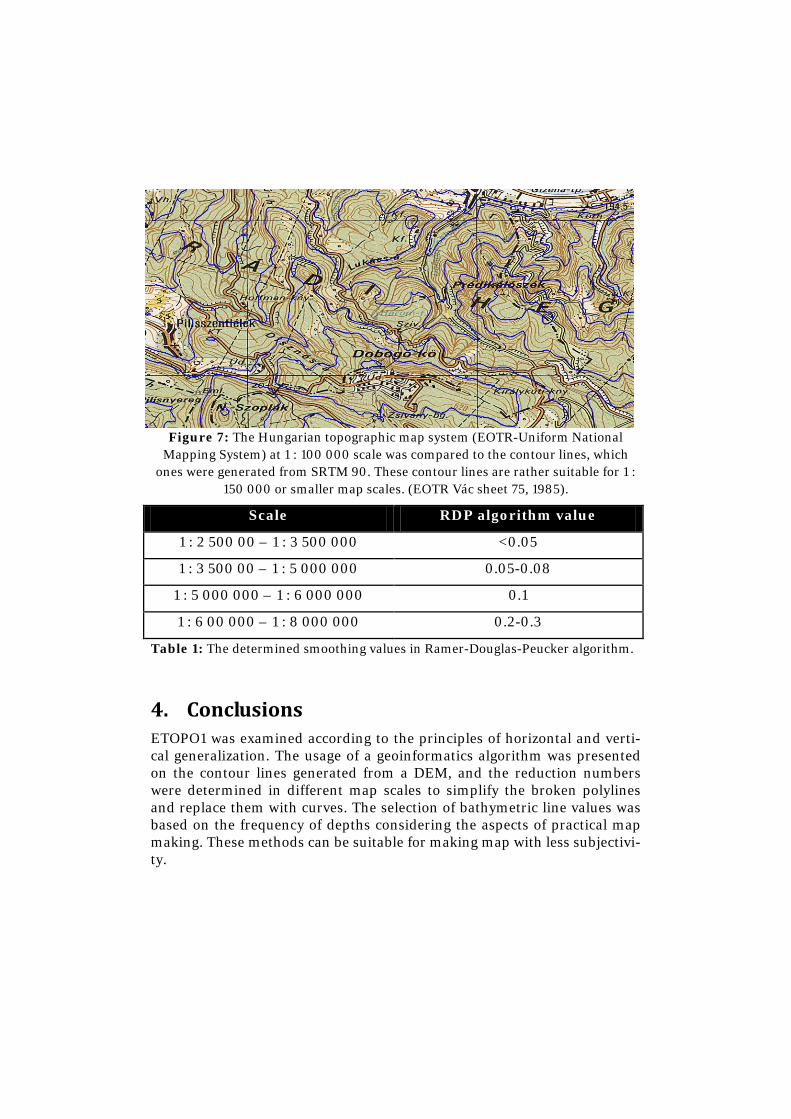
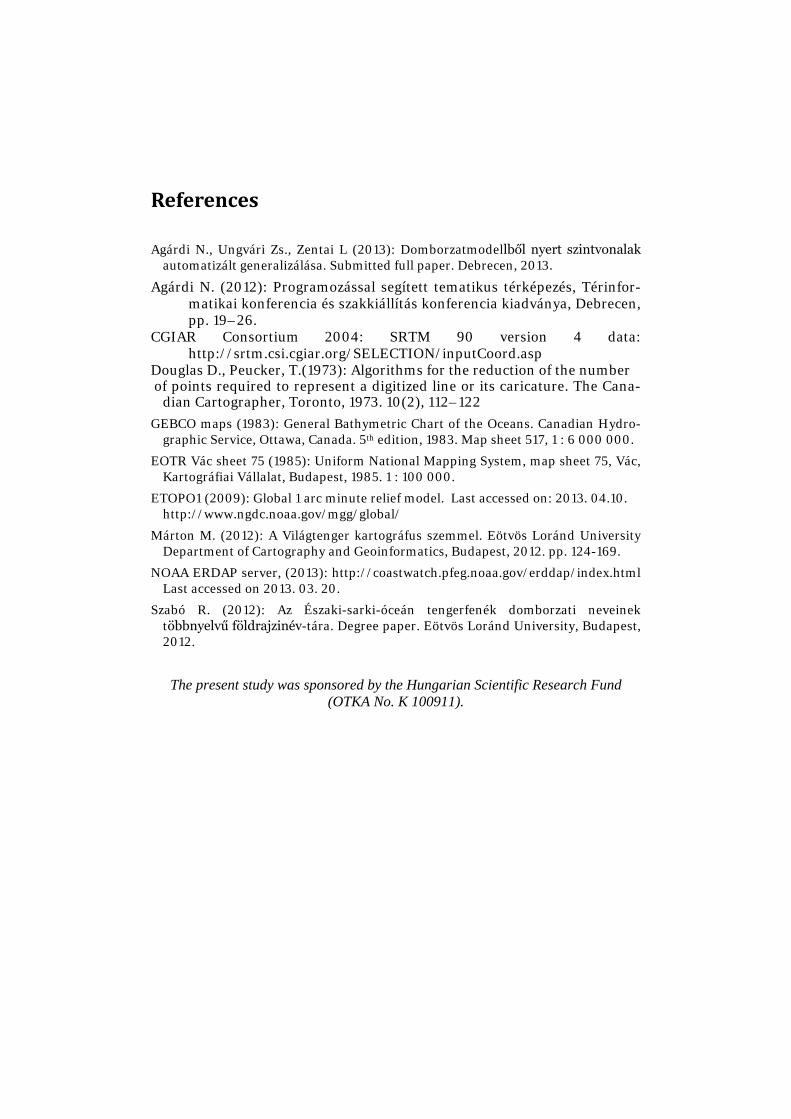
Figure 7: The Hungarian topographic map system (EOTR-Uniform National Mapping System) at 1 : 100 000 scale was compared to the contour lines, which
ones were generated from SRTM 90. These contour lines are rather suitable for 1 : 150 000 or smaller map scales. (EOTR Vác sheet 75, 1985).
Scale RDP algorithm value
1 : 2 500 00 – 1 : 3 500 000 <0.05
1 : 3 500 00 – 1 : 5 000 000 0.05-0.08
1 : 5 000 000 – 1 : 6 000 000 0.1
1 : 6 00 000 – 1 : 8 000 000 0.2-0.3
Table 1: The determined smoothing values in Ramer-Douglas-Peucker algorithm.
4. Conclusions ETOPO1 was examined according to the principles of horizontal and verti-cal generalization. The usage of a geoinformatics algorithm was presented on the contour lines generated from a DEM, and the reduction numbers were determined in different map scales to simplify the broken polylines and replace them with curves. The selection of bathymetric line values was based on the frequency of depths considering the aspects of practical map making. These methods can be suitable for making map with less subjectivi-ty.
References
Agárdi N., Ungvári Zs., Zentai L (2013): Domborzatmodellből nyert szintvonalak automatizált generalizálása. Submitted full paper. Debrecen, 2013.
Agárdi N. (2012): Programozással segített tematikus térképezés, Térinfor-matikai konferencia és szakkiállítás konferencia kiadványa, Debrecen, pp. 19–26.
CGIAR Consortium 2004: SRTM 90 version 4 data: http://srtm.csi.cgiar.org/SELECTION/inputCoord.asp
Douglas D., Peucker, T.(1973): Algorithms for the reduction of the number of points required to represent a digitized line or its caricature. The Cana-
dian Cartographer, Toronto, 1973. 10(2), 112–122 GEBCO maps (1983): General Bathymetric Chart of the Oceans. Canadian Hydro-
graphic Service, Ottawa, Canada. 5th edition, 1983. Map sheet 517, 1 : 6 000 000.
EOTR Vác sheet 75 (1985): Uniform National Mapping System, map sheet 75, Vác, Kartográfiai Vállalat, Budapest, 1985. 1 : 100 000.
ETOPO1 (2009): Global 1 arc minute relief model. Last accessed on: 2013. 04.10. http://www.ngdc.noaa.gov/mgg/global/
Márton M. (2012): A Világtenger kartográfus szemmel. Eötvös Loránd University Department of Cartography and Geoinformatics, Budapest, 2012. pp. 124-169.
NOAA ERDAP server, (2013): http://coastwatch.pfeg.noaa.gov/erddap/index.html Last accessed on 2013. 03. 20.
Szabó R. (2012): Az Északi-sarki-óceán tengerfenék domborzati neveinek többnyelvű földrajzinév-tára. Degree paper. Eötvös Loránd University, Budapest, 2012.
The present study was sponsored by the Hungarian Scientific Research Fund (OTKA No. K 100911).
Copyright © 2022 FDOKUMEN


![[Revised] Revisiting Verb Aspect in T'boli](https://static.fdokumen.com/doc/165x107/631ef9e50ff042c6110c9f71/revised-revisiting-verb-aspect-in-tboli.jpg)