solving system of linear equations graphing (Math) 2015 PPT
14
solving system of linear solving system of linear equations graphing equations graphing
-
Upload
independent -
Category
Documents
-
view
1 -
download
0
Transcript of solving system of linear equations graphing (Math) 2015 PPT
solving system of linear solving system of linear equations graphingequations graphing
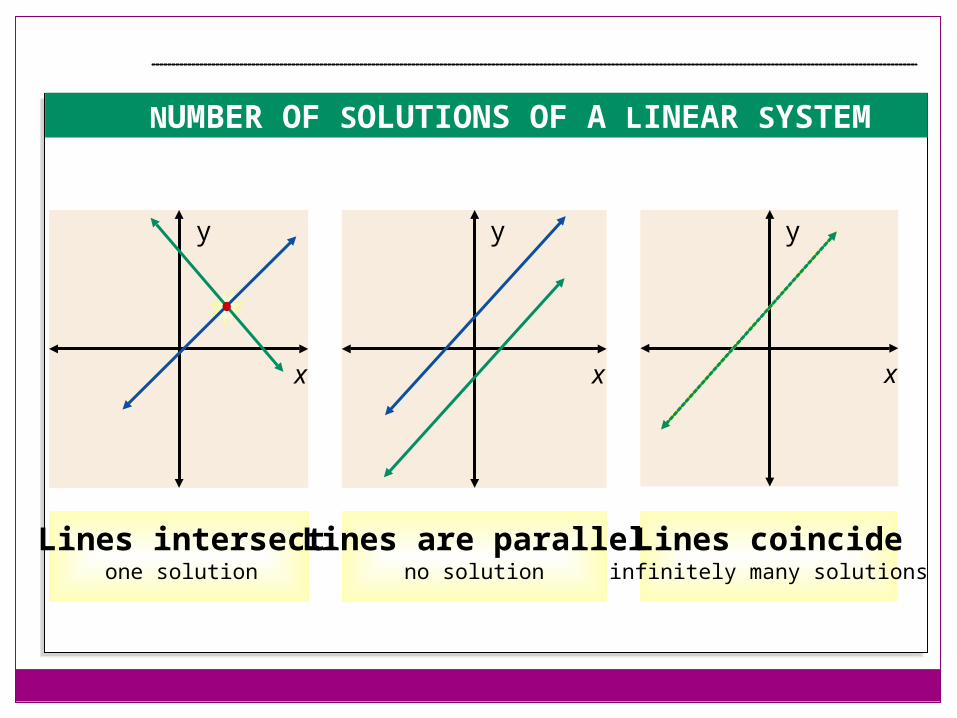
NUMBER OF SOLUTIONS OF A LINEAR SYSTEM
y
x
y
x
Lines intersectone solution
Lines are parallelno solution
y
x
Lines coincideinfinitely many solutions

All the slides in this presentation are timed. You do not need to click the mouse or
press any keys on the keyboard for the presentation on each slide to continue.
However, in order to make sure the presentation does not go too quickly, you will need to click the mouse or press a key on the keyboard to advance to the next slide.
You will know when the slide is finished when you see a small icon in the bottom left corner of the slide.
What is a System of Linear Equations?
A system of linear equations is simply two or more linear equations using the same variables.We will only be dealing with systems of two equations using two variables, x and y.
If the system of linear equations is going to have a solution, then the solution will be an ordered pair (x , y) where x and y make both equations true at the same time.
We will be working with the graphs of linear systems and how to find their solutions graphically.
If the lines are parallel, there will be no solutions.If the lines are the same, there will be an infinite number of solutions.
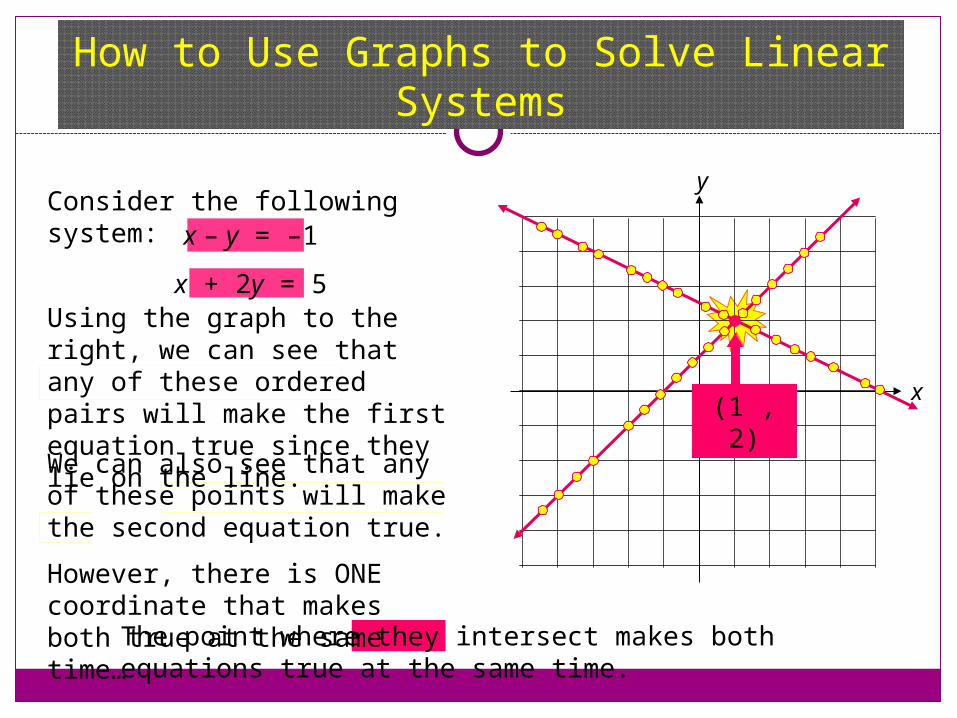
How to Use Graphs to Solve Linear Systems
x
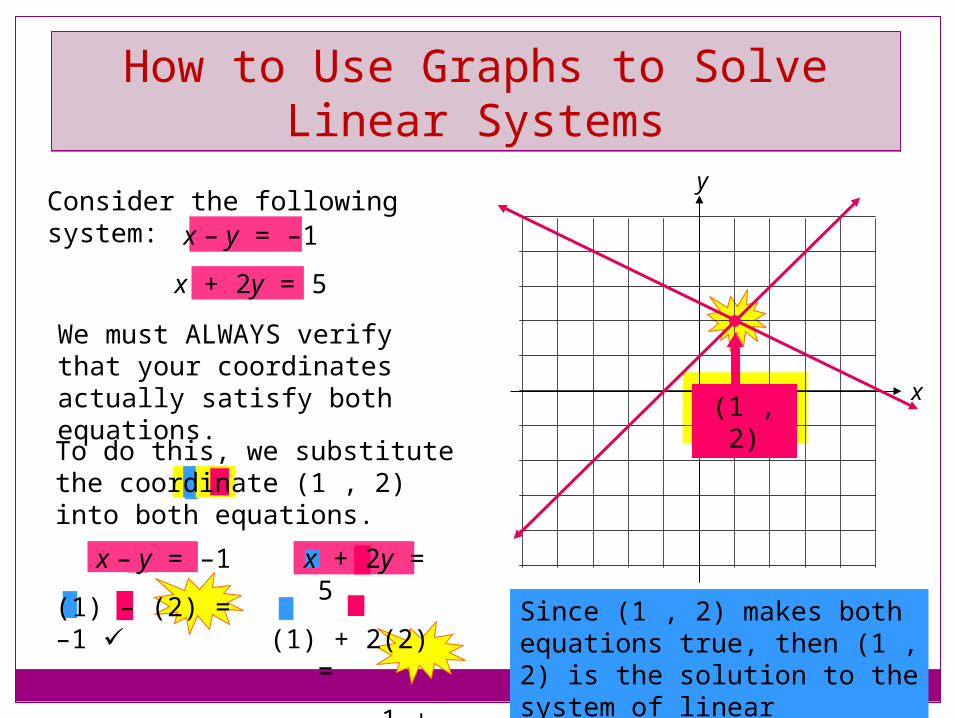
yConsider the following system: x – y = –1
x + 2y = 5Using the graph to the right, we can see that any of these ordered pairs will make the first equation true since they lie on the line.We can also see that any of these points will make the second equation true.However, there is ONE coordinate that makes both true at the same time…
(1 , 2)
The point where they intersect makes both equations true at the same time.
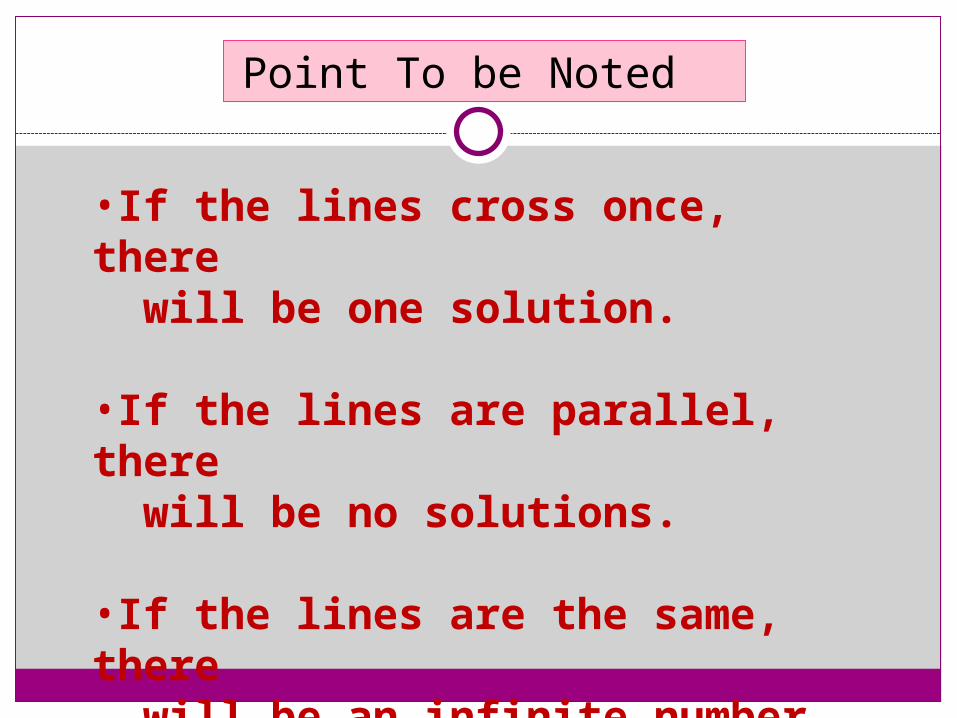
•If the lines cross once, there will be one solution.
•If the lines are parallel, there will be no solutions.
•If the lines are the same, there will be an infinite number of solutions.
Point To be Noted
Parallel Lines
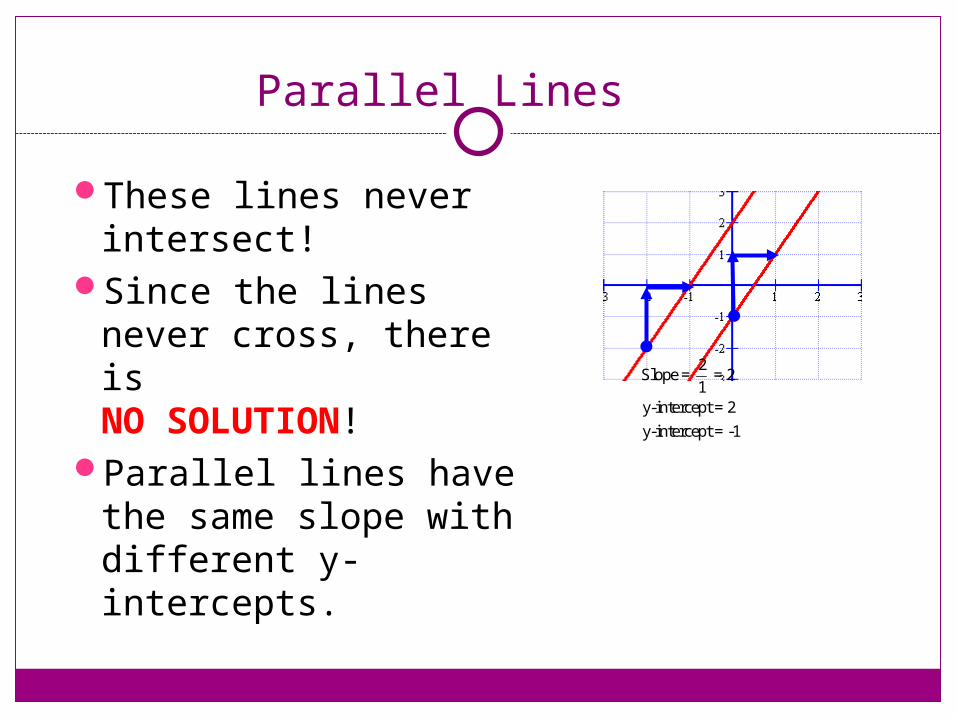
These lines never intersect!
Since the lines never cross, there is NO SOLUTION!
Parallel lines have the same slope with different y-intercepts.
2Slope = = 21y-intercept = 2y-intercept = -1
Coinciding Lines
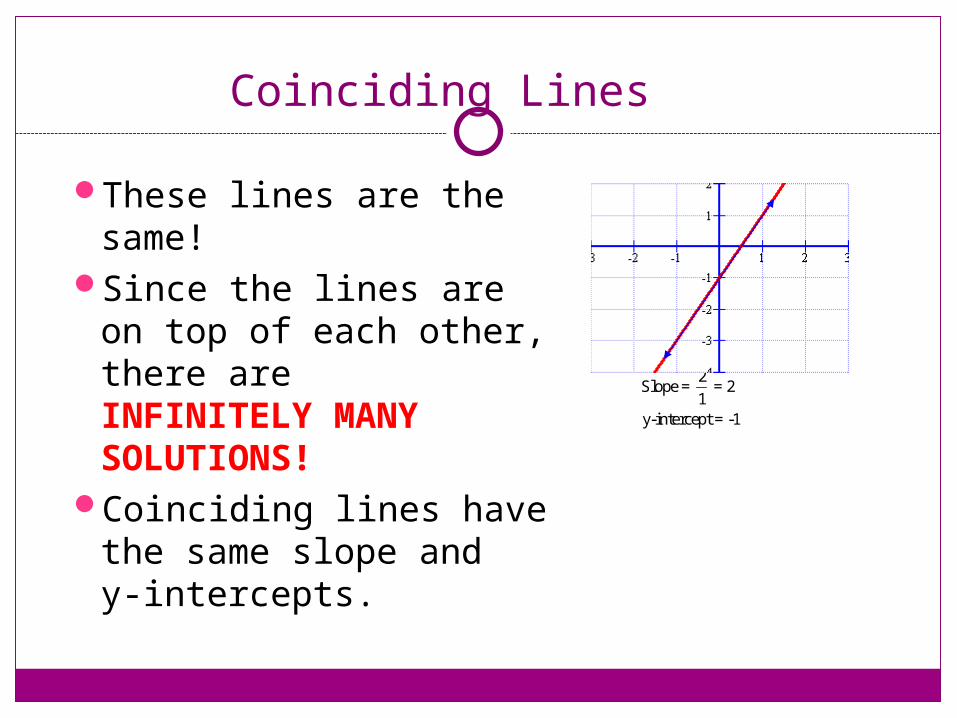
These lines are the same!
Since the lines are on top of each other, there are INFINITELY MANY SOLUTIONS!
Coinciding lines have the same slope and y-intercepts.
2Slope = = 21y-intercept = -1
x – y = –1x + 2y = 5
How to Use Graphs to Solve Linear Systems
x
yConsider the following system:
(1 , 2)
We must ALWAYS verify that your coordinates actually satisfy both equations.To do this, we substitute the coordinate (1 , 2) into both equations. x – y = –1(1) – (2) = –1
Since (1 , 2) makes both equations true, then (1 , 2) is the solution to the system of linear equations.
x + 2y = 5
(1) + 2(2) =
1 + 4 = 5
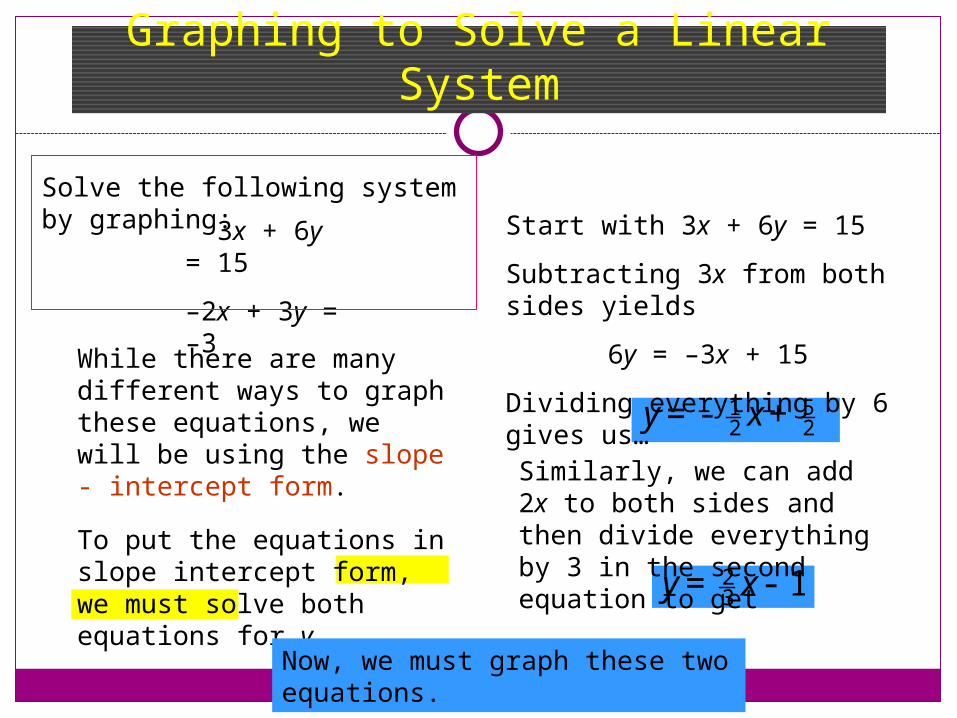
Graphing to Solve a Linear System
While there are many different ways to graph these equations, we will be using the slope - intercept form.To put the equations in slope intercept form, we must solve both equations for y.
Start with 3x + 6y = 15Subtracting 3x from both sides yields
6y = –3x + 15Dividing everything by 6 gives us…
512 2y x= - +
Similarly, we can add 2x to both sides and then divide everything by 3 in the second equation to get
23 1y x= -
Now, we must graph these two equations.
Solve the following system by graphing: 3x + 6y
= 15–2x + 3y = –3
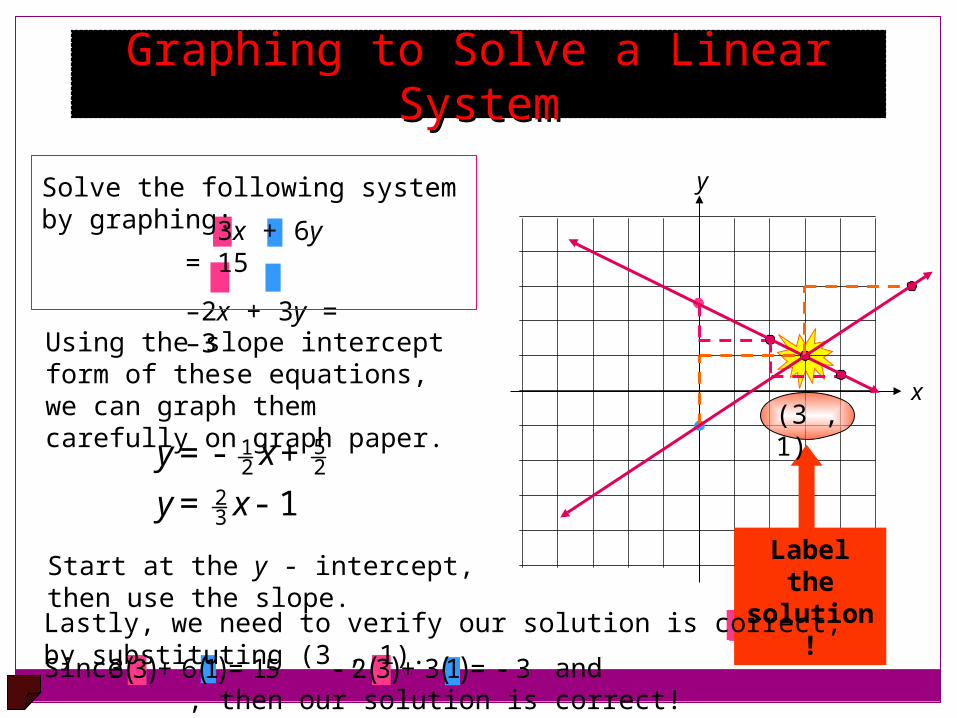
Graphing to Solve a Linear Graphing to Solve a Linear SystemSystem
512 2
23 1
y xy x= - += -
Solve the following system by graphing: 3x + 6y
= 15–2x + 3y = –3Using the slope intercept
form of these equations, we can graph them carefully on graph paper.
x
y
Start at the y - intercept, then use the slope.
Label the
solution!
(3 , 1)
Lastly, we need to verify our solution is correct, by substituting (3 , 1).Since and , then our solution is correct!
( ) ()3 3 6 1 15+ = ( ) ()2 3 3 1 3- + = -
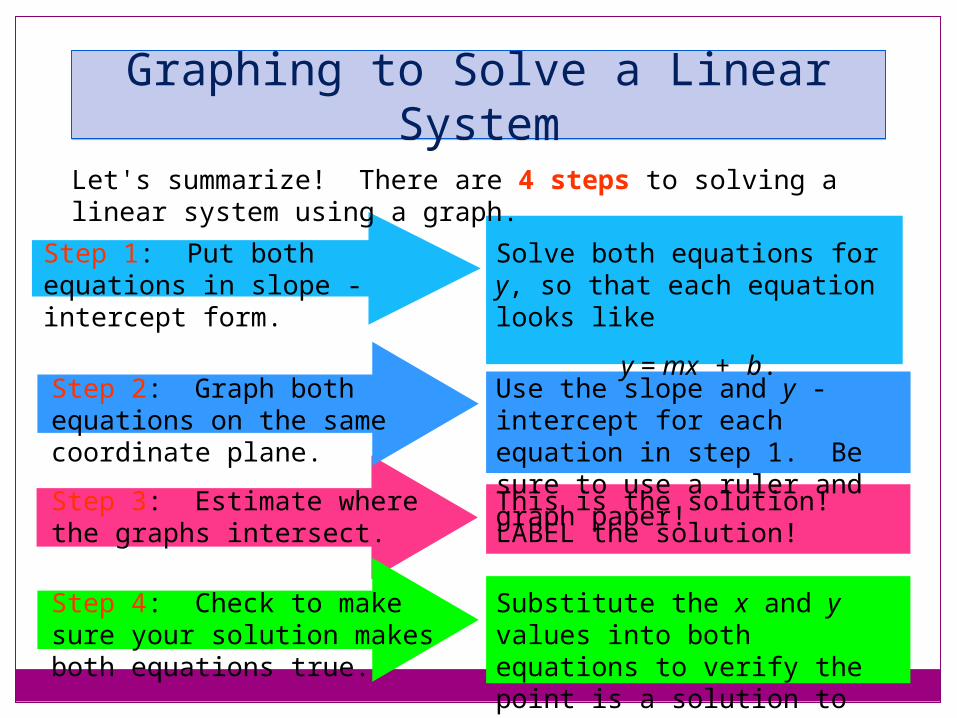
Graphing to Solve a Linear System
Let's summarize! There are 4 steps to solving a linear system using a graph.
Step 1: Put both equations in slope - intercept form.
Step 2: Graph both equations on the same coordinate plane.Step 3: Estimate where the graphs intersect.
Step 4: Check to make sure your solution makes both equations true.
Solve both equations for y, so that each equation looks like
y = mx + b.Use the slope and y - intercept for each equation in step 1. Be sure to use a ruler and graph paper!This is the solution! LABEL the solution!
Substitute the x and y values into both equations to verify the point is a solution to both equations.
x
y
LABEL the solution!
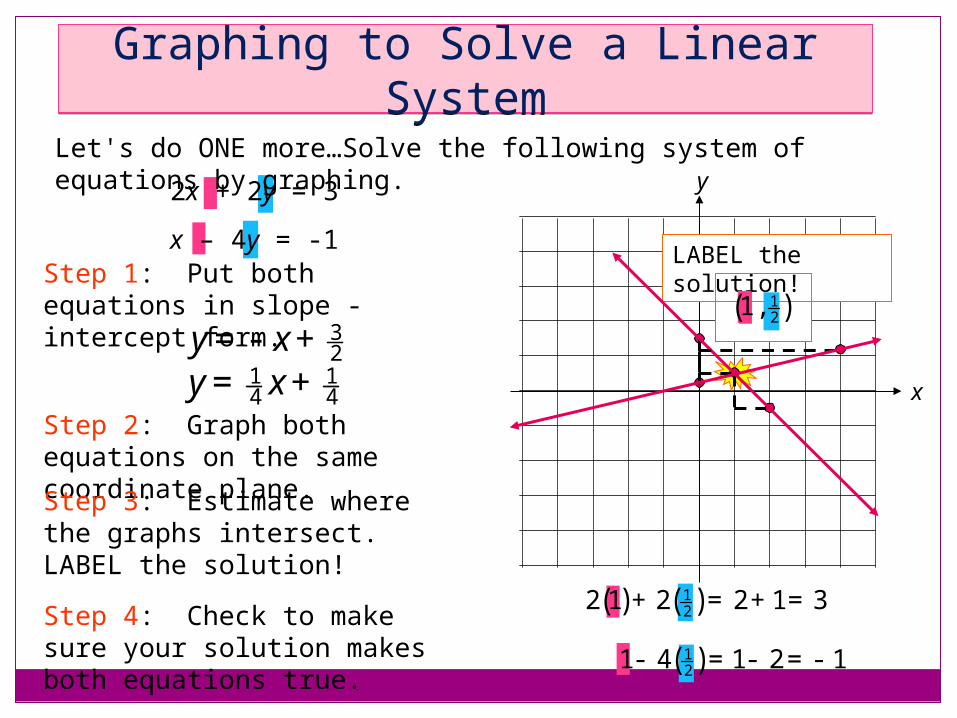
Graphing to Solve a Linear System
Step 1: Put both equations in slope - intercept form.
Step 2: Graph both equations on the same coordinate plane.Step 3: Estimate where the graphs intersect. LABEL the solution!Step 4: Check to make sure your solution makes both equations true.
Let's do ONE more…Solve the following system of equations by graphing.2x + 2y = 3
x – 4y = -1
32y x= - +
1 14 4y x= +
() ( )122 1 2 2 1 3+ = + =
( )121 4 1 2 1- = - = -
( )121,