SOLUTION STRATEGIES AND ACHIEVEMENT IN DUTCH COMPLEX ARITHMETIC: LATENT VARIABLE MODELING OF CHANGE...
20
PSYCHOMETRIKA 2008 DOI : 10.1007/ S11336-008-9074- Z SOLUTION STRATEGIES AND ACHIEVEMENT IN DUTCH COMPLEX ARITHMETIC: LATENT VARIABLE MODELING OF CHANGE MARIAN HICKENDORFF,WILLEM J. HEISER, AND CORNELIS M. VAN PUTTEN LEIDEN UNIVERSITY NORMAN D. VERHELST CITO, NATIONAL INSTITUTE FOR EDUCATIONAL MEASUREMENT In the Netherlands, national assessments at the end of primary school (Grade 6) show a decline of achievement on problems of complex or written arithmetic over the last two decades. The present study aims at contributing to an explanation of the large achievement decrease on complex division, by inves- tigating the strategies students used in solving the division problems in the two most recent assessments carried out in 1997 and in 2004. The students’ strategies were classified into four categories. A data set resulted with two types of repeated observations within students: the nominal strategies and the dichoto- mous achievement scores (correct/incorrect) on the items administered. It is argued that latent variable modeling methodology is appropriate to analyze these data. First, latent class analyses with year of assessment as a covariate were carried out on the multivariate nominal strategy variables. Results showed a shift from application of the traditional long division algorithm in 1997, to the less accurate strategy of stating an answer without writing down any notes or calculations in 2004, especially for boys. Second, explanatory IRT analyses showed that the three main strategies were significantly less accurate in 2004 than they were in 1997. Key words: covariate, predictor, explanatory IRT, latent class analysis, repeated categorical observations, incomplete design, mathematics education. 1. Introduction 1.1. National Assessments of Mathematics Achievement In the Netherlands, the level of mathematics achievement has changed over the last two decades. Large-scale national assessments of mathematics education at the end of primary school by the National Institute for Educational Measurement (CITO) on four consecutive occasions (1987, 1992, 1997, and 2004) showed diverse trends (Janssen, Van der Schoot, & Hemker, 2005). On the one hand, achievement has increased strongly on numerical estimation and general num- ber concepts, and has increased to a lesser extent on calculations with percentages and mental addition and subtraction. However, results show a steady and large decline of performance on complex (written) arithmetic. Specifically, students at the end of Grade 6 in 2004 performed less well than students at the end of Grade 6 did in 1987 on complex addition and subtraction, and especially on complex multiplication and division. In the period from 1987 to 2004, achievement in complex multiplication and division has declined with more than one standard deviation on the ability scale, with an accelerating trend (Janssen et al., 2005). The research was supported by CITO, National Institute for Educational Measurement. For their efforts in coding the strategy use, we would like to thank Meindert Beishuizen, Gabriëlle Rademakers, and the Bachelor students from Educational and Child Studies who participated in the research project into strategy use. Requests for reprints should be sent to Marian Hickendorff, Division of Methodology and Psychometrics, In- stitute for Psychological Research, Leiden University, P.O. Box 9555, 2300 RB, Leiden, The Netherlands. E-mail: [email protected] © 2008 The Author(s). This article is published with open access at Springerlink.com
-
Upload
leidenuniv -
Category
Documents
-
view
0 -
download
0
Transcript of SOLUTION STRATEGIES AND ACHIEVEMENT IN DUTCH COMPLEX ARITHMETIC: LATENT VARIABLE MODELING OF CHANGE...
PSYCHOMETRIKA2008DOI: 10.1007/S11336-008-9074-Z
SOLUTION STRATEGIES AND ACHIEVEMENT IN DUTCH COMPLEX ARITHMETIC:LATENT VARIABLE MODELING OF CHANGE
MARIAN HICKENDORFF, WILLEM J. HEISER, AND CORNELIS M. VAN PUTTEN
LEIDEN UNIVERSITY
NORMAN D. VERHELST
CITO, NATIONAL INSTITUTE FOR EDUCATIONAL MEASUREMENT
In the Netherlands, national assessments at the end of primary school (Grade 6) show a decline ofachievement on problems of complex or written arithmetic over the last two decades. The present studyaims at contributing to an explanation of the large achievement decrease on complex division, by inves-tigating the strategies students used in solving the division problems in the two most recent assessmentscarried out in 1997 and in 2004. The students’ strategies were classified into four categories. A data setresulted with two types of repeated observations within students: the nominal strategies and the dichoto-mous achievement scores (correct/incorrect) on the items administered.
It is argued that latent variable modeling methodology is appropriate to analyze these data. First,latent class analyses with year of assessment as a covariate were carried out on the multivariate nominalstrategy variables. Results showed a shift from application of the traditional long division algorithm in1997, to the less accurate strategy of stating an answer without writing down any notes or calculations in2004, especially for boys. Second, explanatory IRT analyses showed that the three main strategies weresignificantly less accurate in 2004 than they were in 1997.
Key words: covariate, predictor, explanatory IRT, latent class analysis, repeated categorical observations,incomplete design, mathematics education.
1. Introduction
1.1. National Assessments of Mathematics Achievement
In the Netherlands, the level of mathematics achievement has changed over the last twodecades. Large-scale national assessments of mathematics education at the end of primary schoolby the National Institute for Educational Measurement (CITO) on four consecutive occasions(1987, 1992, 1997, and 2004) showed diverse trends (Janssen, Van der Schoot, & Hemker, 2005).On the one hand, achievement has increased strongly on numerical estimation and general num-ber concepts, and has increased to a lesser extent on calculations with percentages and mentaladdition and subtraction. However, results show a steady and large decline of performance oncomplex (written) arithmetic. Specifically, students at the end of Grade 6 in 2004 performed lesswell than students at the end of Grade 6 did in 1987 on complex addition and subtraction, andespecially on complex multiplication and division. In the period from 1987 to 2004, achievementin complex multiplication and division has declined with more than one standard deviation onthe ability scale, with an accelerating trend (Janssen et al., 2005).
The research was supported by CITO, National Institute for Educational Measurement. For their efforts in codingthe strategy use, we would like to thank Meindert Beishuizen, Gabriëlle Rademakers, and the Bachelor students fromEducational and Child Studies who participated in the research project into strategy use.
Requests for reprints should be sent to Marian Hickendorff, Division of Methodology and Psychometrics, In-stitute for Psychological Research, Leiden University, P.O. Box 9555, 2300 RB, Leiden, The Netherlands. E-mail:[email protected]
© 2008 The Author(s). This article is published with open access at Springerlink.com
PSYCHOMETRIKA
1.2. Mathematics Education
Mathematics education has experienced a reform process of international scope over the lastcouple of decades (Kilpatrick, Swafford, & Findell, 2001). Although several countries differ intheir implementation, there are common trends. These are globally described by a shift awayfrom transmission of knowledge toward investigation, construction, and discourse by students(Gravemeijer, 1997).
In the Netherlands, this reform movement is in effect by the name of Realistic MathematicsEducation (RME) (Freudenthal, 1973; Gravemeijer, 1997). The content of mathematics educa-tion has shifted from the product of mathematics to the process of doing mathematics (Gravemeij-er, 1997). Instruction is based on the key principle of guided reinvention (Freudenthal, 1973).This principle entails that teachers should give students the opportunity to reinvent the mathe-matics they have to learn for themselves, according to a mapped out learning route. The informalstrategies of students are a possible starting point. Mathematics problems are often embedded inexperientially real situations.
At present, Dutch primary schools have almost uniformly adopted mathematics textbooksbased on the principles of RME (Janssen et al., 2005), although these books differ in their empha-sis on prestructuring of students’ solutions (Van Putten, Van den Brom-Snijders, & Beishuizen,2005).
1.3. Complex Division
In this paper, the focus is on complex or written division for two reasons. First, the largestdecline in performance is observed in this domain. This development is worrisome, since it isa core educational objective set by the Dutch government that students at the end of primaryeducation “can perform the operations addition, subtraction, multiplication, and division withstandard procedures or variants thereof, and can apply these in simple situations” (Dutch Min-istry of Education, Culture and Sciences, 1998, p. 26). This objective has not changed since itsfirst publication in 1993, and it was still valid in the most recent publication of the educationalobjectives in 2005. A panel of several experts on mathematics education (such as experiencedteachers and teachers’ instructors) set up norm levels to offer a frame of reference for evaluat-ing to what extent these core objectives are reached by the educational system (Van der Schoot,2008). If a majority (70–75%) of the students attains these norm levels, the core objectives aresufficiently reached, according to the expert panel. In 1997, only half of the students reachedthis level on complex multiplication and division (Janssen, Van der Schoot, Hemker & Verhelst,1999), and in 2004 this dropped even further to only 12% of the students (Janssen et al., 2005).So, the objectives of primary education on complex division seem not to be reached by far, par-ticularly not in 2004.
Second, with the introduction of RME in the Netherlands, complex division has served as aprototype of the alternative informal approach (Van Putten et al., 2005). So, that makes a furtherstudy into changes in this domain of mathematics education particularly interesting. This is es-pecially true if the solution strategies that students applied are incorporated in the analysis. Byincluding this information on the cognitive processes involved in solving these problems, we aimto give more insight in the decrease in achievement level.
Several studies investigated the informal strategies young children develop for division (Am-brose, Baek, & Carpenter, 2003; Mulligan & Mitchelmore, 1997; Neuman, 1999). Main strate-gies observed in these studies were counting, repeatedly adding or subtracting the divisor, mak-ing multiples of the divisor (so-called chunking), decomposing or partitioning the dividend, and(reversed) multiplication.
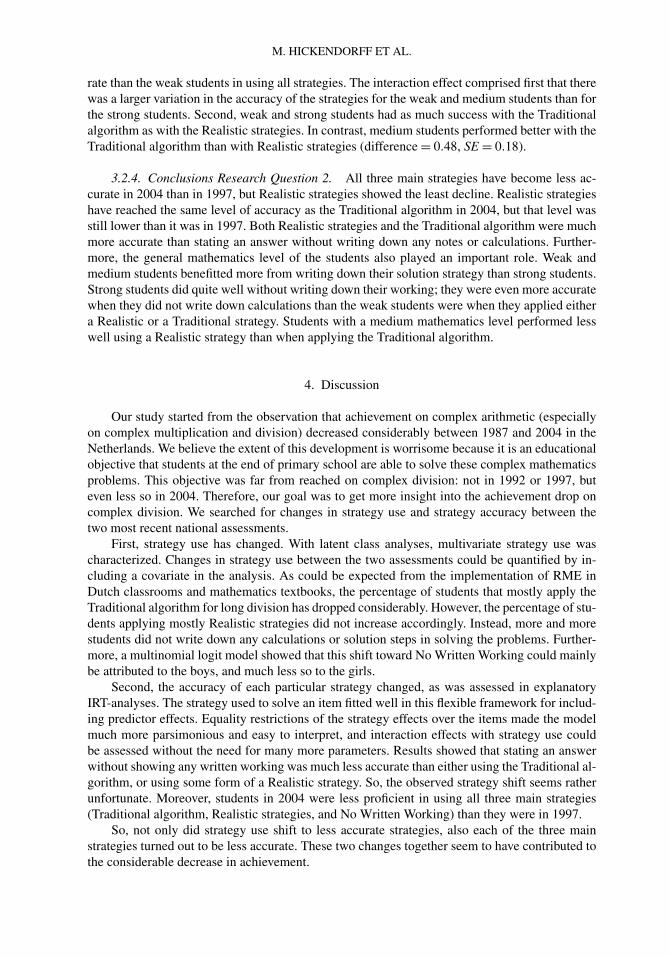
In RME, the didactical approach to complex division starts from these informal strategies.Treffers (1987) introduced column arithmetic according to progressive schematization, resulting
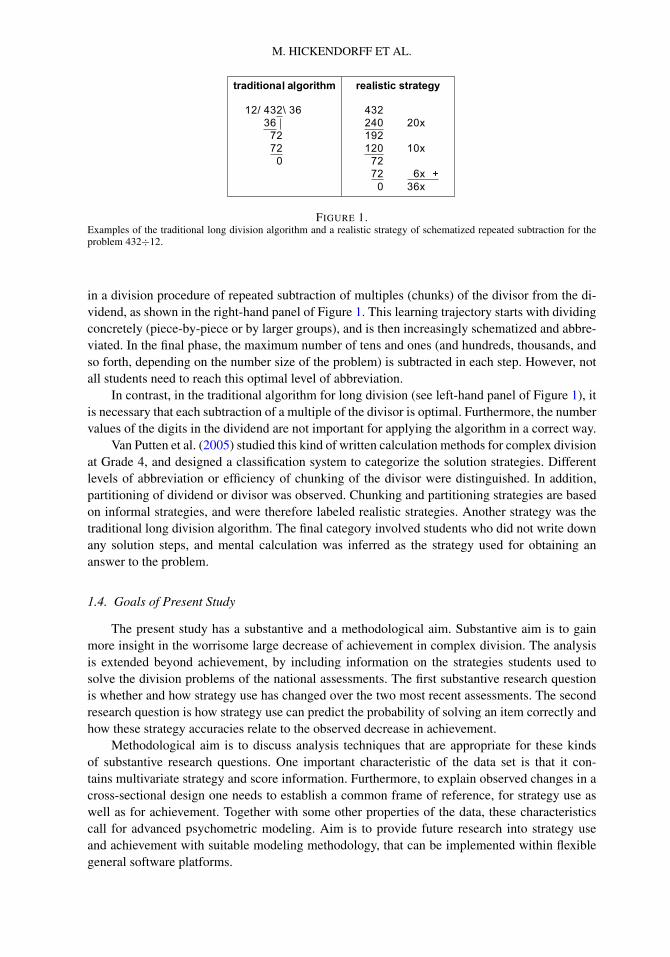
M. HICKENDORFF ET AL.
FIGURE 1.Examples of the traditional long division algorithm and a realistic strategy of schematized repeated subtraction for theproblem 432÷12.
in a division procedure of repeated subtraction of multiples (chunks) of the divisor from the di-vidend, as shown in the right-hand panel of Figure 1. This learning trajectory starts with dividingconcretely (piece-by-piece or by larger groups), and is then increasingly schematized and abbre-viated. In the final phase, the maximum number of tens and ones (and hundreds, thousands, andso forth, depending on the number size of the problem) is subtracted in each step. However, notall students need to reach this optimal level of abbreviation.
In contrast, in the traditional algorithm for long division (see left-hand panel of Figure 1), itis necessary that each subtraction of a multiple of the divisor is optimal. Furthermore, the numbervalues of the digits in the dividend are not important for applying the algorithm in a correct way.
Van Putten et al. (2005) studied this kind of written calculation methods for complex divisionat Grade 4, and designed a classification system to categorize the solution strategies. Differentlevels of abbreviation or efficiency of chunking of the divisor were distinguished. In addition,partitioning of dividend or divisor was observed. Chunking and partitioning strategies are basedon informal strategies, and were therefore labeled realistic strategies. Another strategy was thetraditional long division algorithm. The final category involved students who did not write downany solution steps, and mental calculation was inferred as the strategy used for obtaining ananswer to the problem.
1.4. Goals of Present Study
The present study has a substantive and a methodological aim. Substantive aim is to gainmore insight in the worrisome large decrease of achievement in complex division. The analysisis extended beyond achievement, by including information on the strategies students used tosolve the division problems of the national assessments. The first substantive research questionis whether and how strategy use has changed over the two most recent assessments. The secondresearch question is how strategy use can predict the probability of solving an item correctly andhow these strategy accuracies relate to the observed decrease in achievement.
Methodological aim is to discuss analysis techniques that are appropriate for these kindsof substantive research questions. One important characteristic of the data set is that it con-tains multivariate strategy and score information. Furthermore, to explain observed changes in across-sectional design one needs to establish a common frame of reference, for strategy use aswell as for achievement. Together with some other properties of the data, these characteristicscall for advanced psychometric modeling. Aim is to provide future research into strategy useand achievement with suitable modeling methodology, that can be implemented within flexiblegeneral software platforms.
PSYCHOMETRIKA
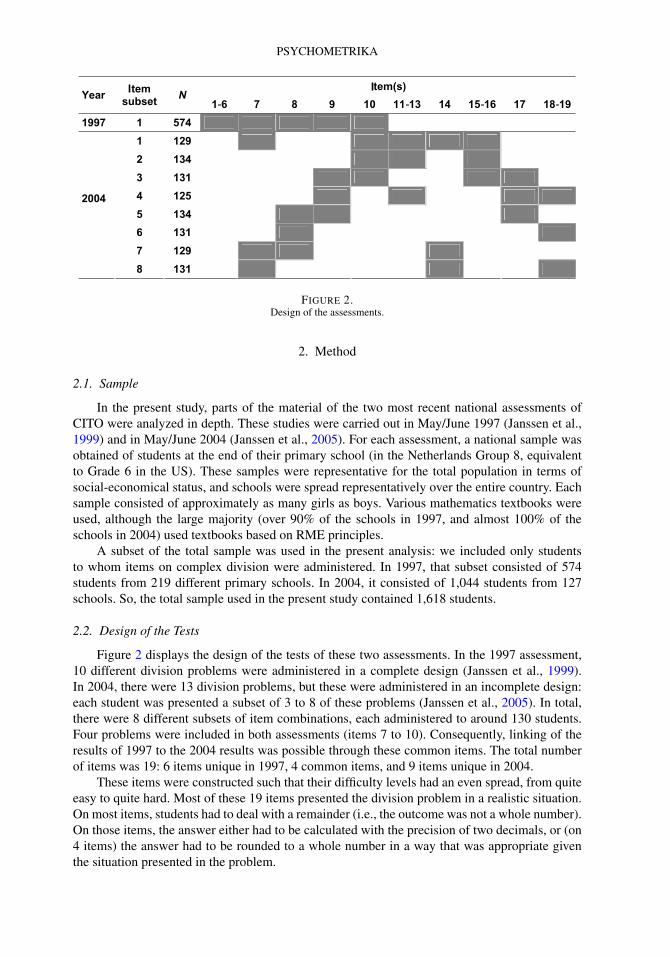
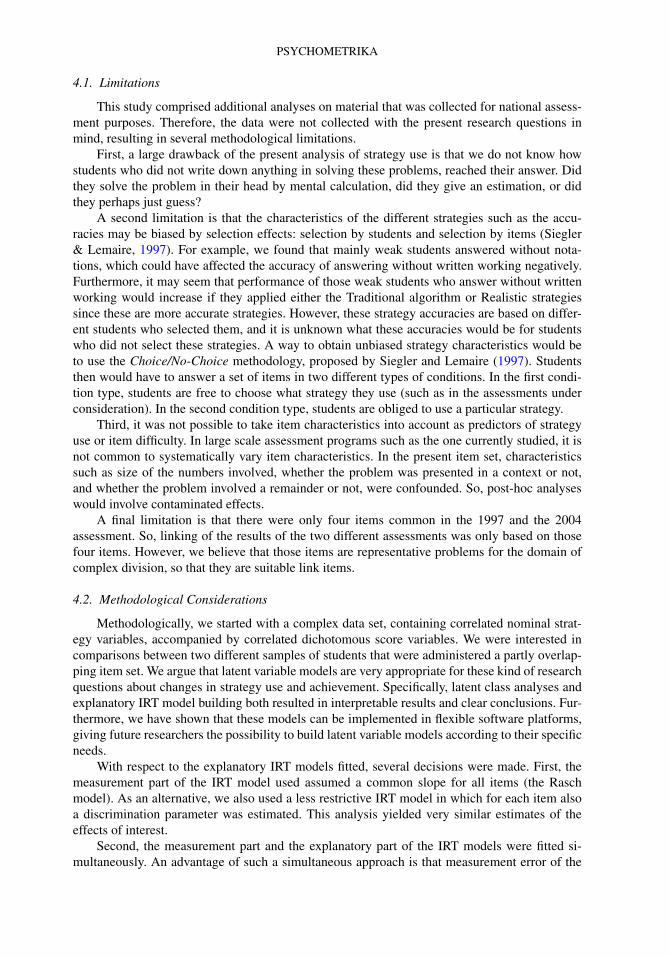
FIGURE 2.Design of the assessments.
2. Method
2.1. Sample
In the present study, parts of the material of the two most recent national assessments ofCITO were analyzed in depth. These studies were carried out in May/June 1997 (Janssen et al.,1999) and in May/June 2004 (Janssen et al., 2005). For each assessment, a national sample wasobtained of students at the end of their primary school (in the Netherlands Group 8, equivalentto Grade 6 in the US). These samples were representative for the total population in terms ofsocial-economical status, and schools were spread representatively over the entire country. Eachsample consisted of approximately as many girls as boys. Various mathematics textbooks wereused, although the large majority (over 90% of the schools in 1997, and almost 100% of theschools in 2004) used textbooks based on RME principles.
A subset of the total sample was used in the present analysis: we included only studentsto whom items on complex division were administered. In 1997, that subset consisted of 574students from 219 different primary schools. In 2004, it consisted of 1,044 students from 127schools. So, the total sample used in the present study contained 1,618 students.
2.2. Design of the Tests
Figure 2 displays the design of the tests of these two assessments. In the 1997 assessment,10 different division problems were administered in a complete design (Janssen et al., 1999).In 2004, there were 13 division problems, but these were administered in an incomplete design:each student was presented a subset of 3 to 8 of these problems (Janssen et al., 2005). In total,there were 8 different subsets of item combinations, each administered to around 130 students.Four problems were included in both assessments (items 7 to 10). Consequently, linking of theresults of 1997 to the 2004 results was possible through these common items. The total numberof items was 19: 6 items unique in 1997, 4 common items, and 9 items unique in 2004.
These items were constructed such that their difficulty levels had an even spread, from quiteeasy to quite hard. Most of these 19 items presented the division problem in a realistic situation.On most items, students had to deal with a remainder (i.e., the outcome was not a whole number).On those items, the answer either had to be calculated with the precision of two decimals, or (on4 items) the answer had to be rounded to a whole number in a way that was appropriate giventhe situation presented in the problem.
M. HICKENDORFF ET AL.
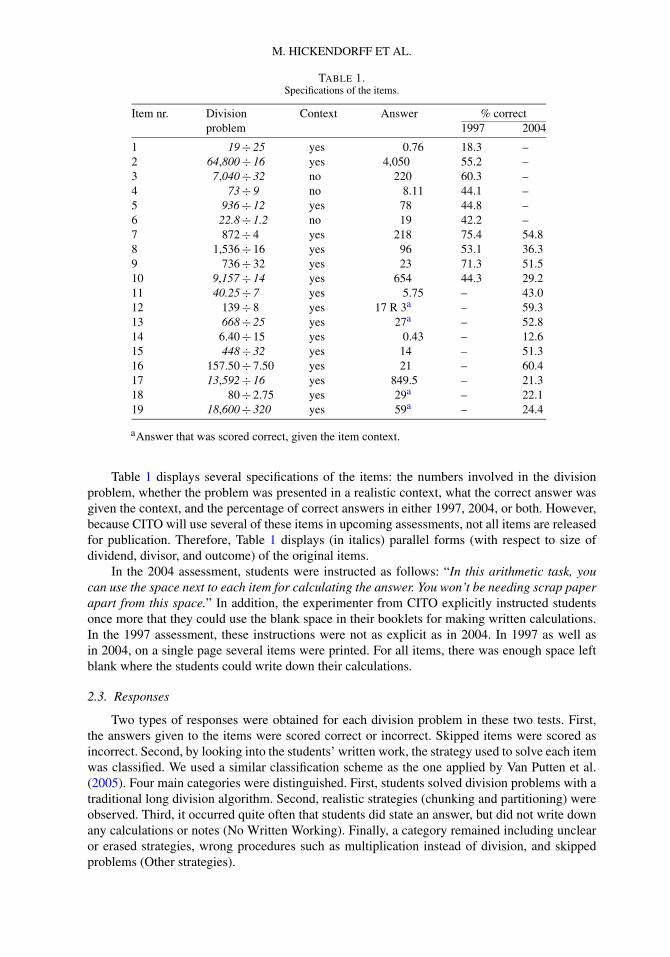
TABLE 1.Specifications of the items.
Item nr. Division Context Answer % correctproblem 1997 2004
1 19 ÷ 25 yes 0.76 18.3 –2 64,800 ÷ 16 yes 4,050 55.2 –3 7,040 ÷ 32 no 220 60.3 –4 73 ÷ 9 no 8.11 44.1 –5 936 ÷ 12 yes 78 44.8 –6 22.8 ÷ 1.2 no 19 42.2 –7 872 ÷ 4 yes 218 75.4 54.88 1,536 ÷ 16 yes 96 53.1 36.39 736 ÷ 32 yes 23 71.3 51.510 9,157 ÷ 14 yes 654 44.3 29.211 40.25 ÷ 7 yes 5.75 – 43.012 139 ÷ 8 yes 17 R 3a – 59.313 668 ÷ 25 yes 27a – 52.814 6.40 ÷ 15 yes 0.43 – 12.615 448 ÷ 32 yes 14 – 51.316 157.50 ÷ 7.50 yes 21 – 60.417 13,592 ÷ 16 yes 849.5 – 21.318 80 ÷ 2.75 yes 29a – 22.119 18,600 ÷ 320 yes 59a – 24.4
aAnswer that was scored correct, given the item context.
Table 1 displays several specifications of the items: the numbers involved in the divisionproblem, whether the problem was presented in a realistic context, what the correct answer wasgiven the context, and the percentage of correct answers in either 1997, 2004, or both. However,because CITO will use several of these items in upcoming assessments, not all items are releasedfor publication. Therefore, Table 1 displays (in italics) parallel forms (with respect to size ofdividend, divisor, and outcome) of the original items.
In the 2004 assessment, students were instructed as follows: “In this arithmetic task, youcan use the space next to each item for calculating the answer. You won’t be needing scrap paperapart from this space.” In addition, the experimenter from CITO explicitly instructed studentsonce more that they could use the blank space in their booklets for making written calculations.In the 1997 assessment, these instructions were not as explicit as in 2004. In 1997 as well asin 2004, on a single page several items were printed. For all items, there was enough space leftblank where the students could write down their calculations.
2.3. Responses
Two types of responses were obtained for each division problem in these two tests. First,the answers given to the items were scored correct or incorrect. Skipped items were scored asincorrect. Second, by looking into the students’ written work, the strategy used to solve each itemwas classified. We used a similar classification scheme as the one applied by Van Putten et al.(2005). Four main categories were distinguished. First, students solved division problems with atraditional long division algorithm. Second, realistic strategies (chunking and partitioning) wereobserved. Third, it occurred quite often that students did state an answer, but did not write downany calculations or notes (No Written Working). Finally, a category remained including unclearor erased strategies, wrong procedures such as multiplication instead of division, and skippedproblems (Other strategies).
PSYCHOMETRIKA
TABLE 2.Part of the data set.
Student Year Gender PBE GML Item 7 Item 8 Item 19 . . .
Str Sc Str Sc Str Sc . . .
1 1997 b 1 Weak R 1 N 0 – – . . .
2 1997 b 2 Strong T 1 T 1 – – . . .
......
......
......
......
......
...
574 1997 g 1 Medium T 0 N 0 – – . . .
575 2004 g 3 Weak – – R 0 R 1 . . .
......
......
......
......
......
...
705 2004 b 3 Medium O 0 – – R 1 . . .
......
......
......
......
......
...
1,618 2004 b 1 Strong – – R 1 – – . . .
Note 1. Str = strategy, T = Traditional, R = Realistic, N = No Written Working, O = Other.Note 2. Sc = score (1 = correct, 0 = incorrect).Note 3. – = item not administered.
For parts of the material, the strategies were coded by two different raters, and Cohen’sκ (Cohen, 1960) was computed to assess the interrater reliability. For the 1997 data, solutionstrategies of 100 students were coded by two raters, resulting in a value of Cohen’s κ of 0.89.In 2004, solution strategies of 65 students were coded by two raters, resulting in a Cohen’s κ of0.83. So, in both assessments, a satisfactory level of interrater reliability was attained.
In addition to the response variables, three student characteristics were available. First, gen-der of the student was recorded. Second, an index of parental background and educational level(PBE) was available, with 3 categories: students with at least one foreign (non-Dutch) parentwith a low level of education and/or occupation, students with Dutch parents who both have alow level of education and/or occupation, and all other students. Third, a rough indication ofgeneral mathematics level (GML) of the students was computed, based on performance of thestudents on all mathematics items (other than complex division) presented to them. In each as-sessment sample, the students were divided into three equally sized groups, labeled as weak,medium, and strong general mathematics level.
2.4. Properties of the Data Set
In discussing what psychometric modeling techniques are appropriate to obtain answers tothe research questions, we have to take a further look into the specific properties of the presentdata set. Two aspects deserve attention. They are also illustrated in Table 2, presenting part of thedata set.
First, because each student had several items administered, the different responses withineach student are correlated. Analysis techniques should take this correlated data structure into ac-count. In addition, each of these repeatedly observed responses is bivariate: the item was solvedcorrect or incorrect (dichotomous score variable) and a specific strategy was used (nominal vari-able).
Second, both research questions involve a comparison of the results from 1997 and 2004.The incomplete design of the data set impedes these comparisons because different students com-pleted different subsets of items. Analysis on the item level would be justified, but would not takethe multivariate aspect of the responses into account. In addition, univariate statistics would be
M. HICKENDORFF ET AL.
based on different samples of students. Furthermore, analyses involving changes in performancewould be limited to the four common items and would therefore not take all information intoaccount.
Therefore, we need analysis techniques that can take into account the multivariate aspectof the data, and are not hampered by the incomplete design. This aim can elegantly be attainedby introducing a latent variable. Individual differences are modeled by mapping the correlatedresponses on the latent variable, while the student remains the unit of analysis.
Finally, it should be possible to include at least one predictor variable: year of assessment.For both research questions, we discuss appropriate techniques next.
2.5. Latent Class Analysis
The first research question is directed at changes in strategy use between the two assess-ments. So, the nominal strategy responses are the dependent variables. We argue that a categor-ical latent variable is best to model this multivariate strategy use, because differences betweenstudents are qualitative in this respect. Latent class analysis (LCA) accomplishes this goal, byintroducing a latent class variable that accounts for the covariation between the observed strategyuse variables (e.g., Lazarsfeld & Henry, 1968; Goodman, 1974). The basic latent class model is:
f(y|D) =
K∑
k=1
P(k)∏
i∈D
P(yi |k
). (1)
Classes run from k = 1, . . . ,K , and y is a vector containing the nominal strategy codes onall items i that are part of the item set D presented to the student. Resulting parameters are theclass probabilities or sizes P(k) and the conditional probabilities P(yi |k). The latter reflect theprobability of solving item i with each particular strategy, for each latent class. So, we search forsubgroups (latent classes) of students that are characterized by a specific pattern of strategy useover the items presented.
2.5.1. Predictor Effects. To assess differences in strategy use between the assessments of1997 and 2004, year of assessment was introduced as a covariate with 2 levels in the LCA.This entails that classes are formed conditional upon the level of the covariate, so that year ofassessment predicts class membership (Vermunt & Magidson, 2002). The latent class model withone observed covariate z can be expressed as:
f(y|D,z
) =K∑
k=1
P(k|z)
∏
i∈D
P(yi |k
). (2)
Class probabilities sum to 1, conditional on the level of the covariate, i.e.,∑K
k=1 P(k|z) = 1.Parameters estimated are the class probabilities conditional on year of assessment, and for eachclass, the probability of using each particular strategy on each item (the conditional probabilities).
To study how the other background variables were associated with strategy use, we carriedout some further analyses. Inserting all these variables and their interactions as covariates in thelatent class analysis would yield an overparameterized model. Therefore, all students were as-signed to the latent class for which they had the highest posterior probability (modal assignment).Next, this latent class variable was analyzed as the response variable in a multinomial logit model(e.g., Vermunt, 1997). The associations of each of the explanatory variables with latent class weremodeled conditional on the joint distribution of all explanatory variables. Cell entries fkz of the5-way frequency table, with k the value on the response variable latent class, and z the joint dis-tribution of the explanatory variables year of assessment, gender, parental background/education,
PSYCHOMETRIKA
and general mathematics level, are modeled as
logfkz = αk +∑
j
βj xjkz. (3)
The design matrix xjkz specifies the j associations or effects in the model.
2.5.2. Software. Analyses were carried out in the program LEM (Vermunt, 1997), a gen-eral and versatile program for the analysis of categorical data. Input data for the latent classanalyses consisted of the strategy used on each of the 19 items, and the level of the covariateyear of assessment. The incompleteness of the design (Figure 2) yielded 9 different patterns ofmissing values (for the items that were not administered). Input data for the multinomial logitmodels were the values on each of the 4 explanatory variables and the latent class each studentwas assigned to.
2.6. Explanatory IRT
Research question 2 asks how strategy use can predict the probability of solving an itemcorrectly, and how these strategy accuracies relate to the observed decrease in achievement. So,the repeatedly observed correct/incorrect scores are the dependent variables, and the nominalstrategies take on the role of predictors. We argue that in these analyses, a continuous latentvariable is appropriate. This latent variable models the individual differences in proficiency incomplex division by explaining the correlations between the observed responses. Item ResponseTheory (IRT) modeling accomplishes this goal. Through the four common items, it was possibleto fit one common scale for 1997 and 2004 of proficiency in complex division, based on all 19items.
In the most simple IRT measurement model, the probability of a correct response of subjectp on item i can be expressed as follows:
P(ypi = 1|θp
) = exp(θp + βi)
1 + exp(θp + βi). (4)
Latent variable θ expresses ability or proficiency, measured on a continuous scale. The itemparameters βi represent the easiness of each item.
Such descriptive or measurement IRT models can be extended with an explanatory part (Wil-son & De Boeck, 2004; Rijmen, Tuerlinckx, De Boeck, & Kuppens, 2003). This implies thatcovariates or predictor variables are included, of which the effects on the latent scale are deter-mined. These can be (a) item covariates that vary across items but not across persons, (b) personcovariates that vary across persons but not across items, and (c) person-by-item or dynamic co-variates that vary across both persons and items. The latent regression model SAUL (Verhelst &Verstralen, 2002) is an example of a explanatory IRT model with person covariates.
The present data set includes person predictors and person-by-item predictors (the strategyused on each item). Person predictors are denoted Zpj (j = 1, . . . , J ), and have regression pa-rameters ζj . Person-by-item predictors are denoted Wpih (i = 1, . . . , I and h = 1, . . . ,H ), andhave regression parameters δih. These explanatory parts enter the model in (4) as follows, withindices i for items, p for persons, h for strategy, and j for the person covariate used as predictorvariable:
P(ypi = 1|Zp1 . . .ZpJ ,Wpi1 . . .WpiH
)
=∫ exp
(∑Jj=1 ζjZpj + ∑H
h=1 δihWpih + εp
)
1 + exp(∑J
j=1 ζjZpj + ∑Hh=1 δihWpih + εp
)g(ε) dε. (5)
M. HICKENDORFF ET AL.
TABLE 3.Part of the data set in long matrix format.
Student Year Gender PBE GML d7 d8 d19 . . . Str Sc
1 1997 b 1 Weak 1 0 0 . . . R 11 1997 b 1 Weak 0 1 0 . . . N 0...
......
......
......
......
...
2 1997 b 2 Strong 1 0 0 . . . T 12 1997 b 2 Strong 0 1 0 . . . T 1...
......
......
......
......
...
1,618 2004 b 1 Strong 0 1 0 . . . R 1
Note that the item easiness parameters βi have been replaced by the item-specific strategyparameters δih, which estimate the easiness of item i given that strategy h was used on that item.Furthermore, it is assumed that all person specific error parameters εp come from the commondensity g(ε). Usually, it is assumed that g(ε) is a normal distribution, with mean fixed to 0 to getthe scale identified, i.e., εp ∼ N(0, σ 2
ε ).
2.6.1. Fitting the Models. In the present data set, there are 2 binary person predictors (yearof assessment and gender). Furthermore, there are 2 categorical person predictors with each 3categories (parental background/education and general mathematics level). These can both bedummy-coded in 2 binary predictors, respectively. The strategy used on each item yields 19categorical person-by-item predictors, each with 4 categories. However, the Other strategies arenot of interest in the present analysis into strategy accuracies. These Other strategies are a smallheterogeneous category of remainder solution strategies, consisting mainly of skipped items,which of course, result in incorrect answers. Therefore, we excluded item-student combinationssolved with an Other strategy from the explanatory IRT analyses. Dummy coding the remaining3 strategies, taking the No Written Working strategy as reference category on each item, yieldeda total of 19 × (3 − 1) = 38 binary strategy predictors. For each of these 38 strategy predictors, aregression parameter is estimated. So, this model with strategy predictors specified for each itemseparately yields many parameters, which is an unpleasant property of the model as discussedlater.
2.6.2. Software. Model (5) is equivalent to a general linear mixed model, a GLMM (Mc-Culloch & Searle, 2001). Advantage of formulating the model in the GLMM framework is thatexisting and newly formulated models can be estimated in general purpose statistical software.All explanatory IRT models in this study were estimated using Marginal Maximum Likelihood(MML) estimation procedures within the NLMIXED procedure from SAS (SAS Institute, 2002;Sheu, Chen, Su, & Wang, 2005; Rijmen et al., 2003; De Boeck & Wilson, 2004). We chose non-adaptive Gaussian quadrature for the numerical integration of the marginal likelihood, with 90quadrature points, and Newton–Raphson as the optimization method.
To use the NLMIXED procedure, the data have to be transposed into a long matrix, inwhich each row represents the response of one student to one item. Separate dummy variables(d1, d2, . . . , d19) indicate which item is at stake. So, in the long data matrix, each student isreplicated as many times as the number of items he or she was administered. Table 3 shows thistransformation of a part of Table 2.
PSYCHOMETRIKA
TABLE 4.Strategy use in proportions.
Common items All itemsItem 7 Item 8 Item 9 Item 10 Total Total
1997 2004 1997 2004 1997 2004 1997 2004 1997 2004 1997 2004
Traditional 0.31 0.08 0.34 0.11 0.42 0.19 0.41 0.19 0.37 0.14 0.35 0.13Realistic 0.22 0.15 0.21 0.16 0.24 0.33 0.22 0.25 0.22 0.22 0.21 0.25No Writ. working 0.41 0.61 0.26 0.54 0.22 0.30 0.17 0.35 0.26 0.45 0.26 0.44Other 0.06 0.16 0.19 0.19 0.12 0.19 0.20 0.21 0.14 0.19 0.18 0.19# observations 574 386 574 392 574 388 574 392 2,296 1,558 5,740 5,312
TABLE 5.Latent class models.
Classes LL BIC #p
1 −15,373.9 31,279.8 722 −12,798.8 26,565.6 1313 −11,790.2 24,984.3 1904 −11,385.7 24,611.5 2495 −11,219.2 24,714.2 3086 −11,106.3 24,924.4 367
3. Results
3.1. Research Question 1
Table 4 displays proportions of use of the four main strategies, separately for the 1997 andthe 2004 assessment. In the first 8 columns, strategy proportions are presented for the four com-mon items. Next, these are totaled over these four items. The final two columns contain thestrategy use totaled over all items presented in each assessment, so these proportions for 1997and 2004 are based on different item collections. From Table 4, we see that the four commonitems were solved less often by the Traditional algorithm in 2004 than in 1997, but that the pro-portion of Realistic strategies did not change. Instead, it appears that stating an answer withoutwriting down any calculations has increased in relative frequency. A similar pattern of strategyshifts is observed when all items are included.
Latent class models with year of assessment as a covariate were fitted with 1 to 6 latentclasses. Table 5 gives the log-likelihood (LL), Bayesian Information Criterion (BIC), and numberof parameters (#p) for each of these models. The BIC is a criterion that penalizes the fit (LL)of a model with the loss in parsimony. It is computed as -2LL + #p ∗ ln(N), with N the samplesize. Lower BIC-values indicate better models in terms of parsimony. From Table 5, the 4-classmodel had the best fit, according to the BIC. So, we chose to interpret the model with 4 classes.1
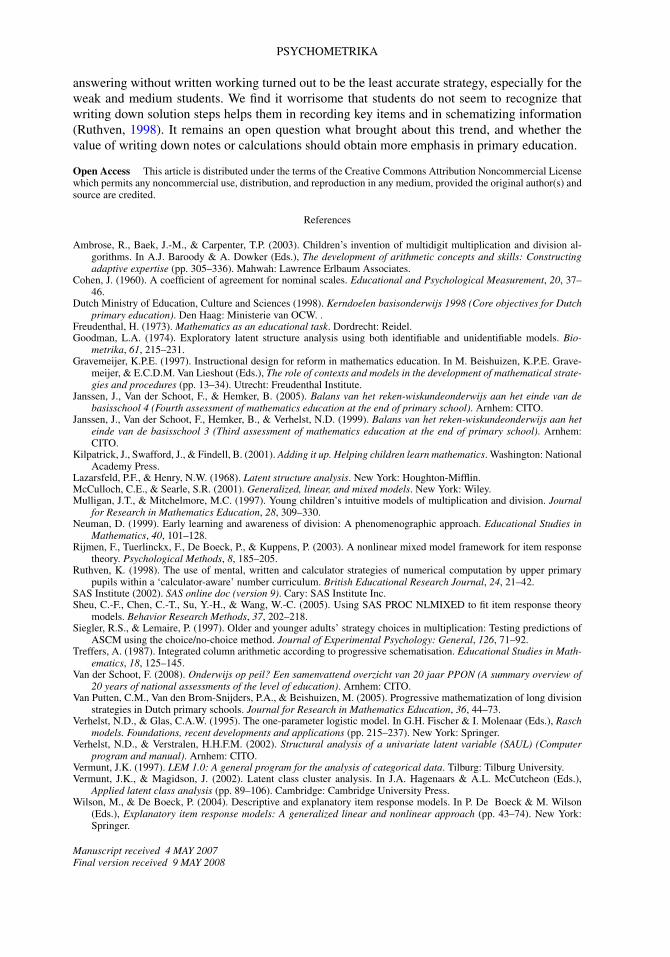
Figure 3 displays the probabilities of using each strategy on the 19 items for each particularclass (the conditional probabilities P(yi |k)). First note that each class-specific strategy profile ismore or less dominated by one strategy type used on all items. So, apparently students are quite
1As Table 5 shows, the number of parameters increases rapidly when the number of latent classes increases. Whenestimating models with more than 150 parameters, LEM does not report standard errors of parameters. Moreover, for the5 and 6-class models, several locally optimal solutions were found. Therefore, we have also estimated models with 1 to6 classes, based only on the strategies used on the four common items. On this less complex problem, again the 4-classmodel has the best fit according to the BIC. The interpretation of this 4-class model is very similar to the one reportedhere.
M. HICKENDORFF ET AL.
FIGURE 3.Conditional probabilities of the 4-class LC model.
PSYCHOMETRIKA
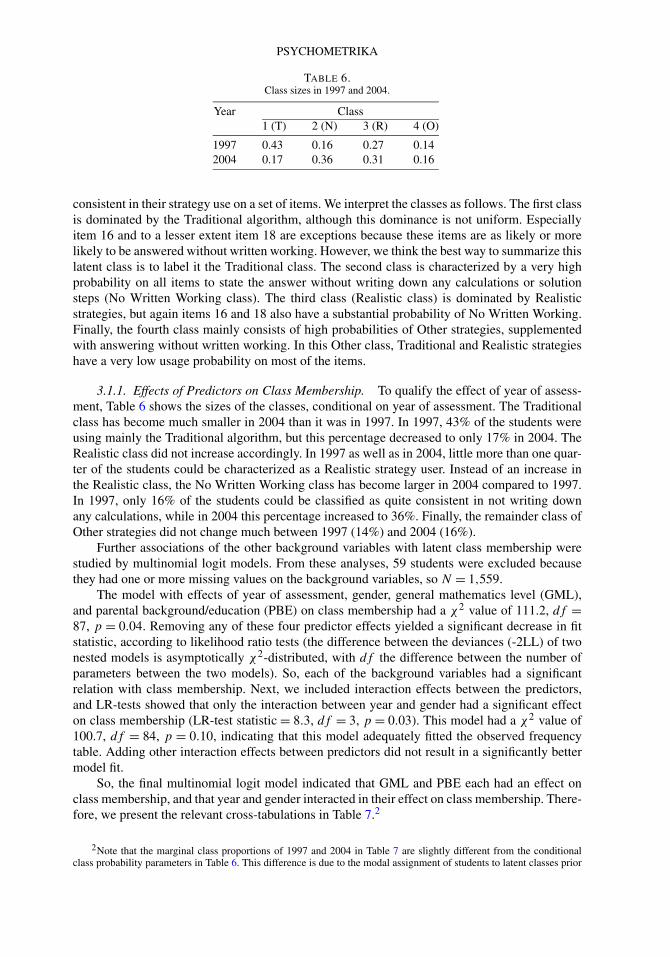
TABLE 6.Class sizes in 1997 and 2004.
Year Class1 (T) 2 (N) 3 (R) 4 (O)
1997 0.43 0.16 0.27 0.142004 0.17 0.36 0.31 0.16
consistent in their strategy use on a set of items. We interpret the classes as follows. The first classis dominated by the Traditional algorithm, although this dominance is not uniform. Especiallyitem 16 and to a lesser extent item 18 are exceptions because these items are as likely or morelikely to be answered without written working. However, we think the best way to summarize thislatent class is to label it the Traditional class. The second class is characterized by a very highprobability on all items to state the answer without writing down any calculations or solutionsteps (No Written Working class). The third class (Realistic class) is dominated by Realisticstrategies, but again items 16 and 18 also have a substantial probability of No Written Working.Finally, the fourth class mainly consists of high probabilities of Other strategies, supplementedwith answering without written working. In this Other class, Traditional and Realistic strategieshave a very low usage probability on most of the items.
3.1.1. Effects of Predictors on Class Membership. To qualify the effect of year of assess-ment, Table 6 shows the sizes of the classes, conditional on year of assessment. The Traditionalclass has become much smaller in 2004 than it was in 1997. In 1997, 43% of the students wereusing mainly the Traditional algorithm, but this percentage decreased to only 17% in 2004. TheRealistic class did not increase accordingly. In 1997 as well as in 2004, little more than one quar-ter of the students could be characterized as a Realistic strategy user. Instead of an increase inthe Realistic class, the No Written Working class has become larger in 2004 compared to 1997.In 1997, only 16% of the students could be classified as quite consistent in not writing downany calculations, while in 2004 this percentage increased to 36%. Finally, the remainder class ofOther strategies did not change much between 1997 (14%) and 2004 (16%).
Further associations of the other background variables with latent class membership werestudied by multinomial logit models. From these analyses, 59 students were excluded becausethey had one or more missing values on the background variables, so N = 1,559.
The model with effects of year of assessment, gender, general mathematics level (GML),and parental background/education (PBE) on class membership had a χ2 value of 111.2, df =87, p = 0.04. Removing any of these four predictor effects yielded a significant decrease in fitstatistic, according to likelihood ratio tests (the difference between the deviances (-2LL) of twonested models is asymptotically χ2-distributed, with df the difference between the number ofparameters between the two models). So, each of the background variables had a significantrelation with class membership. Next, we included interaction effects between the predictors,and LR-tests showed that only the interaction between year and gender had a significant effecton class membership (LR-test statistic = 8.3, df = 3, p = 0.03). This model had a χ2 value of100.7, df = 84, p = 0.10, indicating that this model adequately fitted the observed frequencytable. Adding other interaction effects between predictors did not result in a significantly bettermodel fit.
So, the final multinomial logit model indicated that GML and PBE each had an effect onclass membership, and that year and gender interacted in their effect on class membership. There-fore, we present the relevant cross-tabulations in Table 7.2
2Note that the marginal class proportions of 1997 and 2004 in Table 7 are slightly different from the conditionalclass probability parameters in Table 6. This difference is due to the modal assignment of students to latent classes prior
M. HICKENDORFF ET AL.
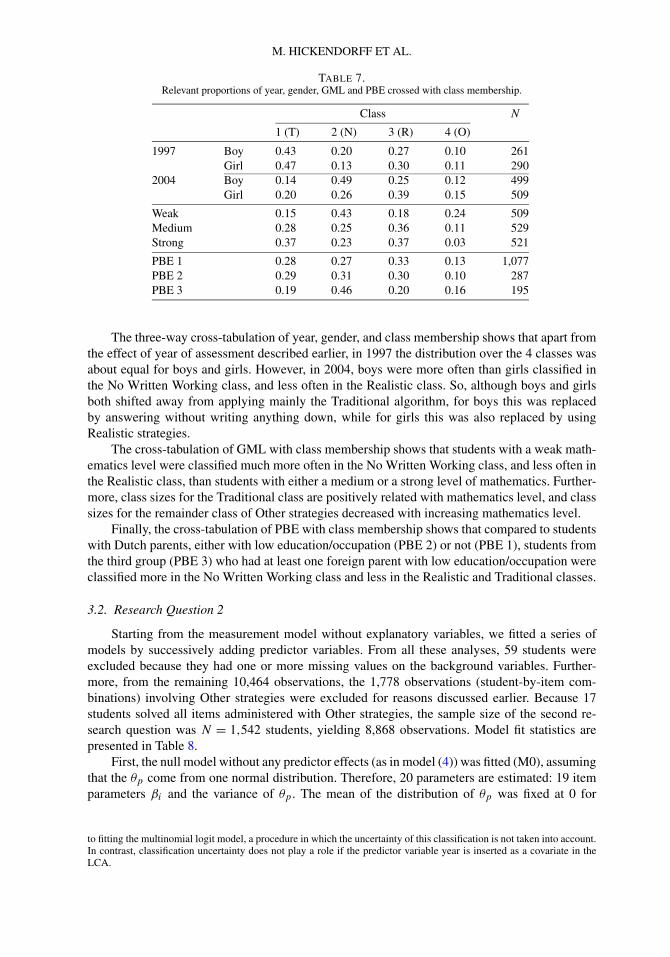
TABLE 7.Relevant proportions of year, gender, GML and PBE crossed with class membership.
Class N
1 (T) 2 (N) 3 (R) 4 (O)
1997 Boy 0.43 0.20 0.27 0.10 261Girl 0.47 0.13 0.30 0.11 290
2004 Boy 0.14 0.49 0.25 0.12 499Girl 0.20 0.26 0.39 0.15 509
Weak 0.15 0.43 0.18 0.24 509Medium 0.28 0.25 0.36 0.11 529Strong 0.37 0.23 0.37 0.03 521
PBE 1 0.28 0.27 0.33 0.13 1,077PBE 2 0.29 0.31 0.30 0.10 287PBE 3 0.19 0.46 0.20 0.16 195
The three-way cross-tabulation of year, gender, and class membership shows that apart fromthe effect of year of assessment described earlier, in 1997 the distribution over the 4 classes wasabout equal for boys and girls. However, in 2004, boys were more often than girls classified inthe No Written Working class, and less often in the Realistic class. So, although boys and girlsboth shifted away from applying mainly the Traditional algorithm, for boys this was replacedby answering without writing anything down, while for girls this was also replaced by usingRealistic strategies.
The cross-tabulation of GML with class membership shows that students with a weak math-ematics level were classified much more often in the No Written Working class, and less often inthe Realistic class, than students with either a medium or a strong level of mathematics. Further-more, class sizes for the Traditional class are positively related with mathematics level, and classsizes for the remainder class of Other strategies decreased with increasing mathematics level.
Finally, the cross-tabulation of PBE with class membership shows that compared to studentswith Dutch parents, either with low education/occupation (PBE 2) or not (PBE 1), students fromthe third group (PBE 3) who had at least one foreign parent with low education/occupation wereclassified more in the No Written Working class and less in the Realistic and Traditional classes.
3.2. Research Question 2
Starting from the measurement model without explanatory variables, we fitted a series ofmodels by successively adding predictor variables. From all these analyses, 59 students wereexcluded because they had one or more missing values on the background variables. Further-more, from the remaining 10,464 observations, the 1,778 observations (student-by-item com-binations) involving Other strategies were excluded for reasons discussed earlier. Because 17students solved all items administered with Other strategies, the sample size of the second re-search question was N = 1,542 students, yielding 8,868 observations. Model fit statistics arepresented in Table 8.
First, the null model without any predictor effects (as in model (4)) was fitted (M0), assumingthat the θp come from one normal distribution. Therefore, 20 parameters are estimated: 19 itemparameters βi and the variance of θp . The mean of the distribution of θp was fixed at 0 for
to fitting the multinomial logit model, a procedure in which the uncertainty of this classification is not taken into account.In contrast, classification uncertainty does not play a role if the predictor variable year is inserted as a covariate in theLCA.
PSYCHOMETRIKA
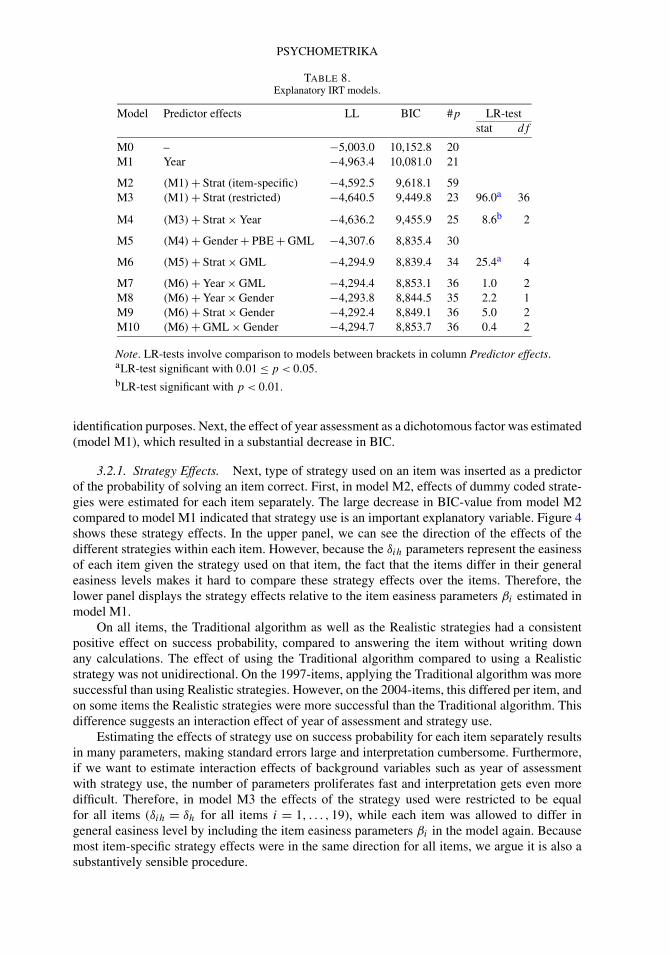
TABLE 8.Explanatory IRT models.
Model Predictor effects LL BIC #p LR-teststat df
M0 – −5,003.0 10,152.8 20M1 Year −4,963.4 10,081.0 21
M2 (M1) + Strat (item-specific) −4,592.5 9,618.1 59M3 (M1) + Strat (restricted) −4,640.5 9,449.8 23 96.0a 36
M4 (M3) + Strat × Year −4,636.2 9,455.9 25 8.6b 2
M5 (M4) + Gender + PBE + GML −4,307.6 8,835.4 30
M6 (M5) + Strat × GML −4,294.9 8,839.4 34 25.4a 4
M7 (M6) + Year × GML −4,294.4 8,853.1 36 1.0 2M8 (M6) + Year × Gender −4,293.8 8,844.5 35 2.2 1M9 (M6) + Strat × Gender −4,292.4 8,849.1 36 5.0 2M10 (M6) + GML × Gender −4,294.7 8,853.7 36 0.4 2
Note. LR-tests involve comparison to models between brackets in column Predictor effects.aLR-test significant with 0.01 ≤ p < 0.05.bLR-test significant with p < 0.01.
identification purposes. Next, the effect of year assessment as a dichotomous factor was estimated(model M1), which resulted in a substantial decrease in BIC.
3.2.1. Strategy Effects. Next, type of strategy used on an item was inserted as a predictorof the probability of solving an item correct. First, in model M2, effects of dummy coded strate-gies were estimated for each item separately. The large decrease in BIC-value from model M2compared to model M1 indicated that strategy use is an important explanatory variable. Figure 4shows these strategy effects. In the upper panel, we can see the direction of the effects of thedifferent strategies within each item. However, because the δih parameters represent the easinessof each item given the strategy used on that item, the fact that the items differ in their generaleasiness levels makes it hard to compare these strategy effects over the items. Therefore, thelower panel displays the strategy effects relative to the item easiness parameters βi estimated inmodel M1.
On all items, the Traditional algorithm as well as the Realistic strategies had a consistentpositive effect on success probability, compared to answering the item without writing downany calculations. The effect of using the Traditional algorithm compared to using a Realisticstrategy was not unidirectional. On the 1997-items, applying the Traditional algorithm was moresuccessful than using Realistic strategies. However, on the 2004-items, this differed per item, andon some items the Realistic strategies were more successful than the Traditional algorithm. Thisdifference suggests an interaction effect of year of assessment and strategy use.
Estimating the effects of strategy use on success probability for each item separately resultsin many parameters, making standard errors large and interpretation cumbersome. Furthermore,if we want to estimate interaction effects of background variables such as year of assessmentwith strategy use, the number of parameters proliferates fast and interpretation gets even moredifficult. Therefore, in model M3 the effects of the strategy used were restricted to be equalfor all items (δih = δh for all items i = 1, . . . ,19), while each item was allowed to differ ingeneral easiness level by including the item easiness parameters βi in the model again. Becausemost item-specific strategy effects were in the same direction for all items, we argue it is also asubstantively sensible procedure.

M. HICKENDORFF ET AL.
FIGURE 4.Item-specific effect parameters of each strategy, from model M2.
These restrictions yielded a much more parsimonious model with only 23 parameters insteadof 59. Model M3 is nested within model M2, so a likelihood ratio (LR) testing procedure couldbe applied. Relevant LR-test statistics are presented in Table 8. Although the result of the LR-testbetween model M3 and M2 indicated a significant decrease in model fit, the lower BIC-value ofmodel M3 compared to model M2 (Table 8) indicated a much better trade-off between model fitand parsimony. Therefore, the model with restricted strategy effects was taken as the base modelto which other effects were added.
First, we expected a different effect of the strategy used for the 1997 assessment and forthe 2004 assessment, as already suggested by the item-specific strategy effects. Therefore, weestimated the interaction effect of (restricted) strategy use and year of assessment in model M4.The LR-test comparing model M4 and M3 was significant, so the strategy accuracies changeddifferently between 1997 and 2004.
3.2.2. Background Variables. Next, in model M5 the background variables gender,parental background/education (PBE) and general mathematics level of the student (GML) wereincluded. This again resulted in a large drop in BIC-value. The effects of mathematics level
PSYCHOMETRIKA
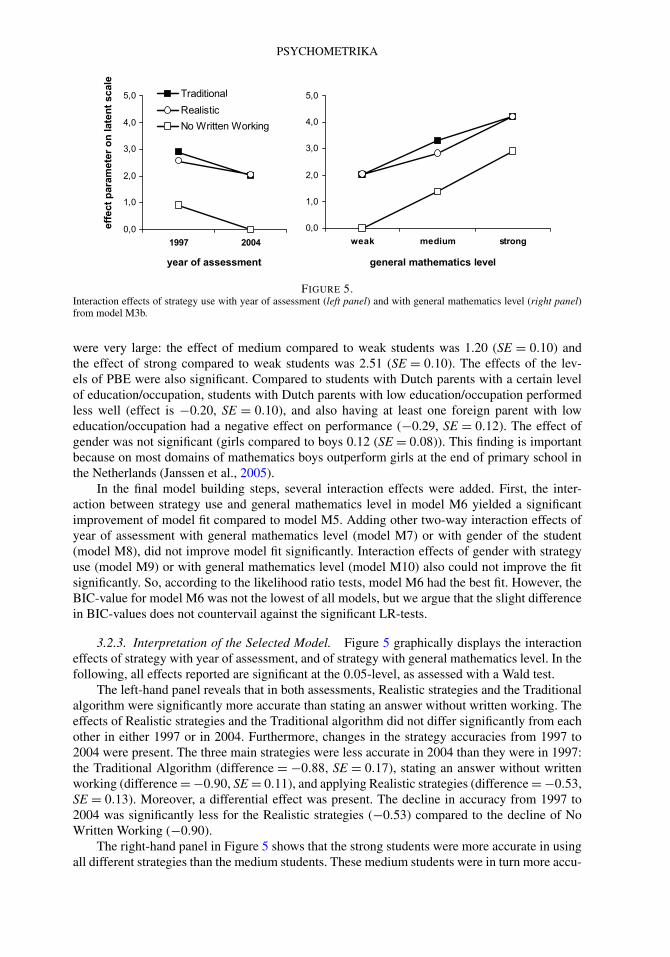
FIGURE 5.Interaction effects of strategy use with year of assessment (left panel) and with general mathematics level (right panel)from model M3b.
were very large: the effect of medium compared to weak students was 1.20 (SE = 0.10) andthe effect of strong compared to weak students was 2.51 (SE = 0.10). The effects of the lev-els of PBE were also significant. Compared to students with Dutch parents with a certain levelof education/occupation, students with Dutch parents with low education/occupation performedless well (effect is −0.20, SE = 0.10), and also having at least one foreign parent with loweducation/occupation had a negative effect on performance (−0.29, SE = 0.12). The effect ofgender was not significant (girls compared to boys 0.12 (SE = 0.08)). This finding is importantbecause on most domains of mathematics boys outperform girls at the end of primary school inthe Netherlands (Janssen et al., 2005).
In the final model building steps, several interaction effects were added. First, the inter-action between strategy use and general mathematics level in model M6 yielded a significantimprovement of model fit compared to model M5. Adding other two-way interaction effects ofyear of assessment with general mathematics level (model M7) or with gender of the student(model M8), did not improve model fit significantly. Interaction effects of gender with strategyuse (model M9) or with general mathematics level (model M10) also could not improve the fitsignificantly. So, according to the likelihood ratio tests, model M6 had the best fit. However, theBIC-value for model M6 was not the lowest of all models, but we argue that the slight differencein BIC-values does not countervail against the significant LR-tests.
3.2.3. Interpretation of the Selected Model. Figure 5 graphically displays the interactioneffects of strategy with year of assessment, and of strategy with general mathematics level. In thefollowing, all effects reported are significant at the 0.05-level, as assessed with a Wald test.
The left-hand panel reveals that in both assessments, Realistic strategies and the Traditionalalgorithm were significantly more accurate than stating an answer without written working. Theeffects of Realistic strategies and the Traditional algorithm did not differ significantly from eachother in either 1997 or in 2004. Furthermore, changes in the strategy accuracies from 1997 to2004 were present. The three main strategies were less accurate in 2004 than they were in 1997:the Traditional Algorithm (difference = −0.88, SE = 0.17), stating an answer without writtenworking (difference = −0.90, SE = 0.11), and applying Realistic strategies (difference = −0.53,SE = 0.13). Moreover, a differential effect was present. The decline in accuracy from 1997 to2004 was significantly less for the Realistic strategies (−0.53) compared to the decline of NoWritten Working (−0.90).
The right-hand panel in Figure 5 shows that the strong students were more accurate in usingall different strategies than the medium students. These medium students were in turn more accu-
M. HICKENDORFF ET AL.
rate than the weak students in using all strategies. The interaction effect comprised first that therewas a larger variation in the accuracy of the strategies for the weak and medium students than forthe strong students. Second, weak and strong students had as much success with the Traditionalalgorithm as with the Realistic strategies. In contrast, medium students performed better with theTraditional algorithm than with Realistic strategies (difference = 0.48, SE = 0.18).
3.2.4. Conclusions Research Question 2. All three main strategies have become less ac-curate in 2004 than in 1997, but Realistic strategies showed the least decline. Realistic strategieshave reached the same level of accuracy as the Traditional algorithm in 2004, but that level wasstill lower than it was in 1997. Both Realistic strategies and the Traditional algorithm were muchmore accurate than stating an answer without writing down any notes or calculations. Further-more, the general mathematics level of the students also played an important role. Weak andmedium students benefitted more from writing down their solution strategy than strong students.Strong students did quite well without writing down their working; they were even more accuratewhen they did not write down calculations than the weak students were when they applied eithera Realistic or a Traditional strategy. Students with a medium mathematics level performed lesswell using a Realistic strategy than when applying the Traditional algorithm.
4. Discussion
Our study started from the observation that achievement on complex arithmetic (especiallyon complex multiplication and division) decreased considerably between 1987 and 2004 in theNetherlands. We believe the extent of this development is worrisome because it is an educationalobjective that students at the end of primary school are able to solve these complex mathematicsproblems. This objective was far from reached on complex division: not in 1992 or 1997, buteven less so in 2004. Therefore, our goal was to get more insight into the achievement drop oncomplex division. We searched for changes in strategy use and strategy accuracy between thetwo most recent national assessments.
First, strategy use has changed. With latent class analyses, multivariate strategy use wascharacterized. Changes in strategy use between the two assessments could be quantified by in-cluding a covariate in the analysis. As could be expected from the implementation of RME inDutch classrooms and mathematics textbooks, the percentage of students that mostly apply theTraditional algorithm for long division has dropped considerably. However, the percentage of stu-dents applying mostly Realistic strategies did not increase accordingly. Instead, more and morestudents did not write down any calculations or solution steps in solving the problems. Further-more, a multinomial logit model showed that this shift toward No Written Working could mainlybe attributed to the boys, and much less so to the girls.
Second, the accuracy of each particular strategy changed, as was assessed in explanatoryIRT-analyses. The strategy used to solve an item fitted well in this flexible framework for includ-ing predictor effects. Equality restrictions of the strategy effects over the items made the modelmuch more parsimonious and easy to interpret, and interaction effects with strategy use couldbe assessed without the need for many more parameters. Results showed that stating an answerwithout showing any written working was much less accurate than either using the Traditional al-gorithm, or using some form of a Realistic strategy. So, the observed strategy shift seems ratherunfortunate. Moreover, students in 2004 were less proficient in using all three main strategies(Traditional algorithm, Realistic strategies, and No Written Working) than they were in 1997.
So, not only did strategy use shift to less accurate strategies, also each of the three mainstrategies turned out to be less accurate. These two changes together seem to have contributed tothe considerable decrease in achievement.
PSYCHOMETRIKA
4.1. Limitations
This study comprised additional analyses on material that was collected for national assess-ment purposes. Therefore, the data were not collected with the present research questions inmind, resulting in several methodological limitations.
First, a large drawback of the present analysis of strategy use is that we do not know howstudents who did not write down anything in solving these problems, reached their answer. Didthey solve the problem in their head by mental calculation, did they give an estimation, or didthey perhaps just guess?
A second limitation is that the characteristics of the different strategies such as the accu-racies may be biased by selection effects: selection by students and selection by items (Siegler& Lemaire, 1997). For example, we found that mainly weak students answered without nota-tions, which could have affected the accuracy of answering without written working negatively.Furthermore, it may seem that performance of those weak students who answer without writtenworking would increase if they applied either the Traditional algorithm or Realistic strategiessince these are more accurate strategies. However, these strategy accuracies are based on differ-ent students who selected them, and it is unknown what these accuracies would be for studentswho did not select these strategies. A way to obtain unbiased strategy characteristics would beto use the Choice/No-Choice methodology, proposed by Siegler and Lemaire (1997). Studentsthen would have to answer a set of items in two different types of conditions. In the first condi-tion type, students are free to choose what strategy they use (such as in the assessments underconsideration). In the second condition type, students are obliged to use a particular strategy.
Third, it was not possible to take item characteristics into account as predictors of strategyuse or item difficulty. In large scale assessment programs such as the one currently studied, it isnot common to systematically vary item characteristics. In the present item set, characteristicssuch as size of the numbers involved, whether the problem was presented in a context or not,and whether the problem involved a remainder or not, were confounded. So, post-hoc analyseswould involve contaminated effects.
A final limitation is that there were only four items common in the 1997 and the 2004assessment. So, linking of the results of the two different assessments was only based on thosefour items. However, we believe that those items are representative problems for the domain ofcomplex division, so that they are suitable link items.
4.2. Methodological Considerations
Methodologically, we started with a complex data set, containing correlated nominal strat-egy variables, accompanied by correlated dichotomous score variables. We were interested incomparisons between two different samples of students that were administered a partly overlap-ping item set. We argue that latent variable models are very appropriate for these kind of researchquestions about changes in strategy use and achievement. Specifically, latent class analyses andexplanatory IRT model building both resulted in interpretable results and clear conclusions. Fur-thermore, we have shown that these models can be implemented in flexible software platforms,giving future researchers the possibility to build latent variable models according to their specificneeds.
With respect to the explanatory IRT models fitted, several decisions were made. First, themeasurement part of the IRT model used assumed a common slope for all items (the Raschmodel). As an alternative, we also used a less restrictive IRT model in which for each item alsoa discrimination parameter was estimated. This analysis yielded very similar estimates of theeffects of interest.
Second, the measurement part and the explanatory part of the IRT models were fitted si-multaneously. An advantage of such a simultaneous approach is that measurement error of the

M. HICKENDORFF ET AL.
estimated item parameters is taken into account when predictor effects are estimated. A potentialdisadvantage of this approach is that item parameter estimates may be affected by the inclusionof predictors. Moreover, it is not possible to establish the fit of the measurement model and as-sess the importance of the predictors separately. For a more detailed discussion of disadvantagesof the simultaneous approach, see Verhelst and Verstralen (2002). Therefore, as an alternative,we also applied a sequential approach. In the first step, the measurement model was estimated.In the second step, this measurement scale was fixed, and effects of explanatory variables wereestimated with the item parameters inserted as known constants. Again, very similar parameterestimates were found as in the analyses presented.
Finally, in fitting the item parameters of the measurement model, we used Marginal Maxi-mum Likelihood (MML) estimation. In MML formulation, it is assumed that person parametersθp or εp arose from a normal distribution. MML estimation is therefore population-specific. Asan alternative estimation procedure, we also used Conditional Maximum Likelihood (CML) esti-mation, in which the model is fitted without making assumptions on the distribution of the latentscale in the population (Verhelst & Glas, 1995). Again, very similar results were obtained. A dis-advantage of CML estimation is that it is not possible to estimate the easiness parameters anddiscrimination parameters jointly with CML, if one is interested in a 2-parameter IRT model. Itis also not possible to estimate the effects of the explanatory variables with CML, so one needsto do this in a second step.
In conclusion, several alternative approaches to the presented explanatory IRT analyses weretested: incorporating item discrimination parameters, using a sequential approach for fitting themeasurement part and explanatory part of the model, and using CML estimation for the mea-surement part of the model. All alternative approaches resulted in the currently presented model(M6) as the best fitting model, and the interpretation of the parameter estimates was very similar.Therefore, we presented the results of the most simple model, and we believe that these resultsare robust against potential model misspecifications.
4.3. Educational Implications
The present findings of changes in strategy use and strategy accuracy may have several edu-cational implications. A first issue is the relative accuracies of Realistic strategies and the Tradi-tional algorithm, since the latter strategy is disappearing. Realistic strategies were as accurate asthe Traditional algorithm, and also decreased the least in that accuracy. So, from these figures, itseems that replacing the Traditional algorithm with Realistic strategies is not a bad developmentwith respect to accuracy, but it only holds if students apply those strategies in a structured way,by writing down their solution steps.
A second educational issue is also related to the gradual disappearance of the Traditionalalgorithm for long division. The decrease in the use of the Traditional algorithm did not occurparallel with the introduction of mathematics textbooks adhering to the RME principles. In 1997as well as in 2004, almost all schools used textbooks that did not cover the Traditional algorithmfor division. However, we see that a substantial number of students still used that algorithm in1997, and even in 2004 (albeit relatively fewer students). So, this may call the implementationof RME into question: it seems that teachers do not always follow the instructional design fromtheir textbooks. This possibility is supported by results from a questionnaire for teachers in theassessment of 2004 (Janssen et al., 2005), in which 41% of the teachers reported that they stillinstructed the Traditional algorithm, either as the preferred strategy, or in combination with Re-alistic strategies.
Finally, there seems to be a trend that students (especially boys and students with a weakmathematics level) do not find it necessary to write down solution steps or calculations, or thatthese students are less able to do so. However, based on our current findings, we believe the de-creasing use of pen and paper in solving problems on complex arithmetic is unfortunate, because
PSYCHOMETRIKA
answering without written working turned out to be the least accurate strategy, especially for theweak and medium students. We find it worrisome that students do not seem to recognize thatwriting down solution steps helps them in recording key items and in schematizing information(Ruthven, 1998). It remains an open question what brought about this trend, and whether thevalue of writing down notes or calculations should obtain more emphasis in primary education.
Open Access This article is distributed under the terms of the Creative Commons Attribution Noncommercial Licensewhich permits any noncommercial use, distribution, and reproduction in any medium, provided the original author(s) andsource are credited.
References
Ambrose, R., Baek, J.-M., & Carpenter, T.P. (2003). Children’s invention of multidigit multiplication and division al-gorithms. In A.J. Baroody & A. Dowker (Eds.), The development of arithmetic concepts and skills: Constructingadaptive expertise (pp. 305–336). Mahwah: Lawrence Erlbaum Associates.
Cohen, J. (1960). A coefficient of agreement for nominal scales. Educational and Psychological Measurement, 20, 37–46.
Dutch Ministry of Education, Culture and Sciences (1998). Kerndoelen basisonderwijs 1998 (Core objectives for Dutchprimary education). Den Haag: Ministerie van OCW. .
Freudenthal, H. (1973). Mathematics as an educational task. Dordrecht: Reidel.Goodman, L.A. (1974). Exploratory latent structure analysis using both identifiable and unidentifiable models. Bio-
metrika, 61, 215–231.Gravemeijer, K.P.E. (1997). Instructional design for reform in mathematics education. In M. Beishuizen, K.P.E. Grave-
meijer, & E.C.D.M. Van Lieshout (Eds.), The role of contexts and models in the development of mathematical strate-gies and procedures (pp. 13–34). Utrecht: Freudenthal Institute.
Janssen, J., Van der Schoot, F., & Hemker, B. (2005). Balans van het reken-wiskundeonderwijs aan het einde van debasisschool 4 (Fourth assessment of mathematics education at the end of primary school). Arnhem: CITO.
Janssen, J., Van der Schoot, F., Hemker, B., & Verhelst, N.D. (1999). Balans van het reken-wiskundeonderwijs aan heteinde van de basisschool 3 (Third assessment of mathematics education at the end of primary school). Arnhem:CITO.
Kilpatrick, J., Swafford, J., & Findell, B. (2001). Adding it up. Helping children learn mathematics. Washington: NationalAcademy Press.
Lazarsfeld, P.F., & Henry, N.W. (1968). Latent structure analysis. New York: Houghton-Mifflin.McCulloch, C.E., & Searle, S.R. (2001). Generalized, linear, and mixed models. New York: Wiley.Mulligan, J.T., & Mitchelmore, M.C. (1997). Young children’s intuitive models of multiplication and division. Journal
for Research in Mathematics Education, 28, 309–330.Neuman, D. (1999). Early learning and awareness of division: A phenomenographic approach. Educational Studies in
Mathematics, 40, 101–128.Rijmen, F., Tuerlinckx, F., De Boeck, P., & Kuppens, P. (2003). A nonlinear mixed model framework for item response
theory. Psychological Methods, 8, 185–205.Ruthven, K. (1998). The use of mental, written and calculator strategies of numerical computation by upper primary
pupils within a ‘calculator-aware’ number curriculum. British Educational Research Journal, 24, 21–42.SAS Institute (2002). SAS online doc (version 9). Cary: SAS Institute Inc.Sheu, C.-F., Chen, C.-T., Su, Y.-H., & Wang, W.-C. (2005). Using SAS PROC NLMIXED to fit item response theory
models. Behavior Research Methods, 37, 202–218.Siegler, R.S., & Lemaire, P. (1997). Older and younger adults’ strategy choices in multiplication: Testing predictions of
ASCM using the choice/no-choice method. Journal of Experimental Psychology: General, 126, 71–92.Treffers, A. (1987). Integrated column arithmetic according to progressive schematisation. Educational Studies in Math-
ematics, 18, 125–145.Van der Schoot, F. (2008). Onderwijs op peil? Een samenvattend overzicht van 20 jaar PPON (A summary overview of
20 years of national assessments of the level of education). Arnhem: CITO.Van Putten, C.M., Van den Brom-Snijders, P.A., & Beishuizen, M. (2005). Progressive mathematization of long division
strategies in Dutch primary schools. Journal for Research in Mathematics Education, 36, 44–73.Verhelst, N.D., & Glas, C.A.W. (1995). The one-parameter logistic model. In G.H. Fischer & I. Molenaar (Eds.), Rasch
models. Foundations, recent developments and applications (pp. 215–237). New York: Springer.Verhelst, N.D., & Verstralen, H.H.F.M. (2002). Structural analysis of a univariate latent variable (SAUL) (Computer
program and manual). Arnhem: CITO.Vermunt, J.K. (1997). LEM 1.0: A general program for the analysis of categorical data. Tilburg: Tilburg University.Vermunt, J.K., & Magidson, J. (2002). Latent class cluster analysis. In J.A. Hagenaars & A.L. McCutcheon (Eds.),
Applied latent class analysis (pp. 89–106). Cambridge: Cambridge University Press.Wilson, M., & De Boeck, P. (2004). Descriptive and explanatory item response models. In P. De Boeck & M. Wilson
(Eds.), Explanatory item response models: A generalized linear and nonlinear approach (pp. 43–74). New York:Springer.
Manuscript received 4 MAY 2007Final version received 9 MAY 2008