Electromagnetic surface waves: photonic crystal–photonic crystal interface
Upload
khangminh22Category
view
3download
0
research papers
IUCrJ (2021). 8, 655–664 https://doi.org/10.1107/S2052252521004826 655
IUCrJISSN 2052-2525
CHEMISTRYjCRYSTENG
Received 18 December 2020
Accepted 6 May 2021
Edited by L. R. MacGillivray, University of Iowa,
USA
‡ Both these authors contributed equally to this
work.
Keywords: solid–solid phase transition
mechanisms; time-resolved crystallography;
RNA structural biology; large conformational
changes.
Supporting information: this article has
supporting information at www.iucrj.org
The mechanism driving a solid–solid phasetransition in a biomacromolecular crystal
Saminathan Ramakrishnan,a‡ Jason R. Stagno,a‡ William F. Heinz,b Xiaobing Zuo,c
Ping Yua and Yun-Xing Wanga*
aStructural Biophysics Laboratory, Centre for Cancer Research, National Cancer Institute, Frederick, MD 21702, USA,bOptical Microscopy and Analysis Laboratory, Cancer Research Technology Program, Frederick National Laboratory for
Cancer Research, Frederick, MD 21702, USA, and cX-ray Science Division, Argonne National Laboratory, Lemont, IL
60439, USA. *Correspondence e-mail: [email protected]
Solid–solid phase transitions (SSPTs) occur between distinguishable crystalline
forms. Because of their importance in application and theory in materials
science and condensed-matter physics, SSPTs have been studied most
extensively in metallic alloys, inorganic salts and small organic molecular
crystals, but much less so in biomacromolecular crystals. In general, the
mechanisms of SSPTs at the atomic and molecular levels are not well
understood. Here, the ordered molecular rearrangements in biomacromolecular
crystals of the adenine riboswitch aptamer are described using real-time serial
crystallography and solution atomic force microscopy. Large, ligand-induced
conformational changes drive the initial phase transition from the apo unit cell
(AUC) to the trans unit cell 1 (TUC1). During this transition, coaxial stacking
of P1 duplexes becomes the dominant packing interface, whereas P2–P2
interactions are almost completely disrupted, resulting in ‘floating’ layers of
molecules. The coupling points in TUC1 and their local conformational
flexibility allow the molecules to reorganize to achieve the more densely packed
and energetically favorable bound unit cell (BUC). This study thus reveals the
interplay between the conformational changes and the crystal phases – the
underlying mechanism that drives the phase transition. Using polarized video
microscopy to monitor SSPTs in small crystals at high ligand concentration, the
time window during which the major conformational changes take place was
identified, and the in crystallo kinetics have been simulated. Together, these
results provide the spatiotemporal information necessary for informing time-
resolved crystallography experiments. Moreover, this study illustrates a practical
approach to characterization of SSPTs in transparent crystals.
1. Introduction
In both organic and inorganic crystals, rearrangements of
atoms or small molecules occur in diffusionless solid–solid
phase transitions (SSPTs), which are generally triggered by
temperature, humidity, pressure or mechanical stress
(Commins et al., 2016; Anwar & Zahn, 2017). SSPTs are often
classified as first or second order according to the proposal of
Ehrenfest (Porter et al., 2008; Pogatscher et al., 2016; Peng et
al., 2015; Mnyukh, 2009). From general thermodynamic
studies of oscillators to current investigations on neural
oscillations in the brain (Brochini et al., 2016), SSPTs have
been a topic of great interest. Well known examples are phase
changes in shape memory alloys caused by temperature
variation (Otsuka & Wayman, 1998), or in small organic
molecular crystals by heat or light exposure (Etter & Siedle,
1983; Skoko et al., 2010; Smets et al., 2020). Notably, in shape
memory alloys, the challenge between increased entropy and
intrinsic order in a crystal drives the molecular rearrangement
to overcome the heat applied (Everhardt et al., 2019). SSPTs
have also been observed in living systems with functional
roles, for example, in strain-induced tail-sheath contraction in
T-even bacteriophages (Olson & Hartman, 1982; Harris &
Scriven, 1970) and in flagella-assisted bacterial locomotion
(Baker et al., 2006; Calladine, 1978). However, mechanisms of
SSPTs in organic and inorganic crystals at the molecular and
atomic levels are relatively poorly understood due to technical
challenges, but frequently involve dislocation generation and
motion. A very recent study of organic molecular crystals
illustrates the cooperative motion in phase transitions (Smets
et al., 2020).
The SSPT is a dynamic process that requires the existence
of a solid phase (e.g. a crystal) throughout. Unlike solid–liquid
phase transitions, for instance in lipid membranes, SSPTs
typically progress through movements of atoms restricted to
within a few angstroms, and are governed collectively by
intermolecular interactions. Unfortunately, as a result, use of
crystallographic methods alone to study phase transitions of
single macromolecular crystals has not been possible, as they
rely on trapping crystals in various transitional states rather
than real-time observations, and/or are restricted to systems
involving only small conformational changes. Moreover, if
there is any dissolution of crystals during phase transition, the
reversible assembly of a macromolecular crystal to solid
intermediate or final phase is hypothetical in a liquid
environment. Solution atomic force microscopy (AFM) and
polarization video microscopy (PVM) methods exclude this
possibility through continuous monitoring of a single crystal
throughout the SSPT.
Riboswitches are versatile, functional RNA elements that
undergo conformational transitions upon ligand binding to
regulate gene expression (Nahvi et al., 2002). Previous studies
using mix-and-inject time-resolved serial crystallography
(TRX) revealed that the addition of a ligand to crystals of
adenine riboswitch aptamer RNA (riboA) result in large
conformational changes that drive the crystals through an
SSPT, from monoclinic (AUC), to triclinic (TUC1), to
orthorhombic (BUC) (Stagno et al., 2017; Ramakrishnan,
Stagno, Conrad et al., 2021). The structure of AUC contains
two unique conformers (apo1/apo2) of riboA in the asym-
metric unit. The binding of the ligand Ade leads to accumu-
lation of [apo1/IB�Ade], which eventually triggers the AUC–
TUC1 lattice transition through ligand-driven rotation and
translation of the P1 helix by 15–22� and 8 A, respectively.
Upon completing the transition to TUC1, both molecules
exhibit the bound-like ([B�Ade]-like) conformation. Even-
tually, the [B�Ade]-like molecules in TUC1 reorient to achieve
the optimal packing through distinct lattice-coupling points,
thus forming [B�Ade] in the orthorhombic BUC setting. The
lattice reorganization from TUC1 to BUC likely involves the
TUC2 intermediate lattice, but further studies are needed to
elucidate its involvement in the transition pathway. Impor-
tantly, since the biologically relevant conformational changes
occur in the AUC–TUC1 transition, understanding the
mechanism of this stage of the SSPT and the time-window
during which it takes place is paramount for guiding subse-
quent TRX experiments for mapping out a molecular movie.
Here, we present a detailed analysis of the SSPT in riboA
crystals and the underlying mechanism that drives the transi-
tion. Using AFM and PVM, we directly visualized, in real
time, the ordered lattice changes and molecular rearrange-
ments throughout the SSPT. The atomic and molecular details
during the transition at each step are further corroborated
with TRX data, which provide atomic structures of riboA and
its crystal contacts at each stage of the SSPT. Our in situ
studies reveal, at the molecular and atomic levels, the interplay
between the molecular conformational changes and their
resultant lattices, which is the underlying mechanism that
drives the synchronous phase transition in riboA crystals.
2. Methods
2.1. Structural analysis of crystal packing interfaces
The crystal structures of riboA in AUC [PDB entry 5e54
(Stagno et al., 2017)], TUC1 [PDB entry 6vwt (Ramakrishnan,
Stagno, Conrad et al., 2021)] and BUC [PDB entries 5swe
(Stagno et al., 2017) and 4tzx (Zhang & Ferre-D’Amare,
2014)] were analyzed using the PyMOL Molecular Graphics
System (Schrodinger, LLC). As there were no major
discernable differences between the TRX and single-crystal
BUC structures (PDB entries 5swe and 4tzx, respectively), the
higher resolution and higher quality structure (PDB entry
4tzx) was used throughout for depiction of the BUC model.
Multiple unit cells were generated by symmetry in the ab or ac
plane using the ‘supercell’ PyMOL extension. All unique
contact interfaces for a single molecule were identified and
interacting residues in each interface were defined as those
involved in hydrogen bonding (�3.5 A) or van der Waals
(�4.0 A) interactions. For AUC, in which the two molecules of
the asymmetric unit are structurally unique, both molecules
were included in the identification of packing interfaces. The
buried surface area (BSA) for each interface was calculated as
(A + B � AB)/2, where A and B are the individual solvent
accessible surface areas (SASA) of each interacting molecule
A and B in isolation, respectively, and AB is the SASA of the
two molecules together, using a solvent radius of 1.4 A.
2.2. Mica surface-assisted riboA crystal growth
The crystallization buffer consisted of 40 mM sodium
cacodylate, pH 6.5, 80 mM KCl, 100 mM MgCl2, 12 mM
spermine tetrahydrochloride and 32–65%(v/v) 2-methyl-2,4-
pentanediol (MPD). To prepare the stabilization buffer, equal
volumes of crystallization buffer (65% MPD) and RNA buffer
(10 mM HEPES pH 7.5, 100 mM KCl, 0.5 mM EDTA) were
mixed. The buffers were stored at room temperature and
homogenized before use. A freshly cleaved mica wafer was
first treated with 10 mM spermidine for 15 min. After treat-
ment, the mica was washed with ultrapure water and air-dried.
The mica was then adhered to an EasyXtal crystallization
support (Qiagen, Germantown, MD, USA) using a drop of
paraffin oil. Next, 0.5 ml of 1:1000 dilution of crystal seed
solution was placed in the center of the mica wafer and
research papers
656 Saminathan Ramakrishnan et al. � SSPT in a biomacromolecular crystal IUCrJ (2021). 8, 655–664

incubated for 1 min. The sample was covered tightly with a
glass box to avoid evaporation. 2.5 ml of gel-purified riboA was
mixed with an equal volume of crystallization buffer (32%
MPD), and immediately and gently dispensed onto the mica
containing the seed solution. The sample, on the support, was
then inverted and tightly screwed into a well in the EasyXtal
crystallization plate, suspended over 700 ml of crystallization
buffer. The vapor-diffusion crystallization setup was incubated
overnight at 22�C.
2.3. AFM imaging
AFM topographs of the crystals were collected using a
Cipher VRS AFM (Asylum Research, Oxford Instruments,
Santa Barbara, California, USA) fitted out with a temperature
control and a cantilever holder with integrated perfusion
ports. The mica substrate with riboA crystals was first fixed on
a stainless-steel puck (Ted Pella, Redding, CA, USA) by
transparent epoxy resin. To avoid evaporation, the sample was
tightly covered using a Petri dish after 20–30 ml of stabilization
buffer was added on the surface. The sample was then placed
on a magnetic sample stage, and the probe holder was
connected via tubing to the inlet and outlet buffer reservoirs.
A total of 100 ml of stabilization buffer was carefully infused
through the perfusion tubes to cover the mica surface. The
temperature of the AFM stage was set to 15�C, and the sample
temperature was equilibrated in the AFM chamber for at least
30 min prior to measurements. The intermittent contact mode
was used to image the crystal surface using a BL-AC40TS-C2
Biolever mini probe (Asylum Research, Oxford Instruments,
Santa Barbara, CA, USA). The resonance frequency
(�12 kHz) of the probe in stabilization buffer was obtained
using the thermal peak method. The crystal surfaces were
measured at a line scan rate of 12 Hz, with a scan size of 256�
256 pixels (100 � 100 nm). After the AUC topography was
acquired, the ligand-free buffer was carefully removed and
exchanged with 150 mM (ac plane) or 50 mM (ab plane)
adenine ligand in stabilization buffer (�500 ml). The imaging
continued until the BUC phase was recorded. Due to the
ligand-induced physical changes in the crystal, the contact
between the probe and the crystal surface was frequently lost.
However, the setpoint was adjusted to recover the contact,
and imaging continued using the parameters already recorded.
2.4. AFM image processing in SPIP and unit-cell dimensionscalculation
Due to the viscosity of the stabilization buffer and soft
sample surface, the raw AFM data show very low signal-to-
noise. Scanning Probe Image Processor software (SPIP)
(Image Metrology, Lyngby, Denmark) was used to reduce the
noise and obtain ultra-sharp topographs. First, the AFM data
pixel resolution was set to 2024 � 2024. Then, the fast fourier
transform (FFT) function was used to remove any random
noise by manually picking prominent FFT peaks and gener-
ating filtered images via the inverse FFT. The corresponding
autocorrelation function of filtered images was used to
determine the unit-cell dimensions by manual inspection. Figs.
S1 and S2 of the supporting information show the original
AFM image, corresponding filtered image and autocorrelation
function of AUC, TUC1 and BUC in both the ac and the ab
planes. The AFM images are 40 � 40 nm (ac plane) or 30 �
30 nm (ab plane) in size. Table S4 shows the unit-cell dimen-
sions of each phase, derived from the autocorrelation function.
2.5. Superimposition of crystal structures onto the AFMimages
Using the unit-cell dimensions of AUC, TUC1 and BUC
obtained from X-ray diffraction and AFM images, the orien-
tations of the crystal structures relative to the AFM images
were determined. The crystal structures, containing several
molecules in the ac or ab plane, were superimposed onto the
AFM images, guided by topographical features. First, the
crystal structure image transparency was reduced to 55% and
placed on the AFM image. An approximate superimposition
was carried out manually by extending the crystal structure to
fit the unit cell in the AFM image. Then, the placement of
molecules was taken into consideration to correlate the crystal
structure with the AFM image. For instance, both the crystal
structure and the AFM image of the AUC ac plane exhibit two
molecules closely stacked [Fig. 1(a)] in a column, which
corresponds to the P2–P2 interaction. The crystal structure
was tilted and adjusted accordingly to match the orientation in
the AFM image. The same method was applied to TUC1 and
BUC images of the ac plane [Figs. 1(b) and 1(c)]. In particular,
the BUC ac plane has every pair of adjacent columns rotated
by 180�. Such features aid in maximizing the overall fit of the
overlayed images.
2.6. PVM experiment to record ligand-induced SSPTs inriboA crystals
An optically transparent glass-bottom dish coated with poly
d-lysine (MatTek Corporation, P35GC-1.5–14-C) was used to
grow riboA crystals directly on the surface. To initiate crystal
growth, 0.5 ml of 1:1000 dilution riboA crystal seed solution
was placed in the middle of the glass-bottom dish. The seed
solution was allowed to adsorb to the coated surface for 1 min.
To avoid evaporation, the sample was tightly covered with a
glass beaker. Then, 5 ml of an equal mixture of gel-purified
riboA and 34% MPD crystallization buffer was gently placed
on the seed solution. The crystallization setup was then flipped
upside down and fixed on the dish cover containing 700 ml of
34% MPD crystallization buffer and tightly sealed with Teflon
tape. The crystallization setup was kept at 22�C for 12 h.
Before the PVM experiment, the glass bottom dish with
crystals was first rinsed with 34% stabilization buffer to
remove the excess RNA. The dish was then filled with 1.5 ml
34% stabilization buffer, fixed on a PVM stage and covered
with a glass cover slip. The rectangular ac-face crystals 5–
10 mm in size were selected, centered and focused. The angle
of polarization was optimized to observe the intensity changes
due to crystal birefringence. A volume of 1.5 ml 20 mM
adenine in 34% stabilization buffer was added to the dish
(final adenine concentration of 10 mM) while the crystal was
research papers
IUCrJ (2021). 8, 655–664 Saminathan Ramakrishnan et al. � SSPT in a biomacromolecular crystal 657
continuously recorded. To avoid evaporation, the sample was
carefully covered with a glass cover slip. The video of intensity
changes in the crystal throughout the ligand-induced SSPTwas
recorded at 2456 pixels � 1842 pixels and 200 ms exposure
time for 132 s, with a frame rate of �275 ms per frame. Time-
lapsed image data were visualized, processed and analyzed
with FIJI (Schindelin et al., 2012). In brief, AVI files were
imported into FIJI as a z-stack of 16-bit TIFFs and converted
to greyscale. The crystal dimensions were measured manually
with the FIJI line tool. A region of interest (ROI) (Fig. 4,
green square), corresponding to 80 � 80 pixels (�2 � 2 mm,
24.75 nm per pixel), was selected for analysis, cropped and
saved as a greyscale AVI file. A custom MatLab (v. 2019b,
Mathworks) script, as described by Ramakrishnan, Stagno,
Magidson et al. (2021), was used to measure the intensity of
birefringence as a function of time and its first derivative. For
the analysis, the 80 � 80 pixel ROI was spatially averaged by
10 � 10 pixels resulting in an 8� 8 pixel ROI with 246 nm per
pixel resolution, the approximate diffraction-limited optical
resolution of PVM. The kinetics simulation methods for the
T1 transition are described in the supporting information.
2.7. AFM imaging of forward and reverse SSPTs in riboAcrystals
The riboA crystals were grown on mica surface using the
same methodology described above. Before the ligand infu-
sion, the AUC topography was recorded several times to
identify the optimum measurement criteria for AFM.
Approximately 100 ml of 50 mM adenine ligand in stabilization
buffer was infused gently inside the AFM sample stage while
the crystal surface was continuously imaged. The forward
SSPTwas carried out at 15�C. When the final BUC topography
was recorded, the imaging was stopped, and 1 ml of ligand-
free stabilization buffer was infused through the perfusion
tubes and completely exchanged with the ligand-containing
stabilization buffer. This buffer exchange was carried out
several times and the crystal sample was finally soaked in the
ligand-free buffer overnight at 15�C. After 12 h of soaking, the
buffer in the sample stage was replaced with 1 ml of fresh
stabilization buffer, and the temperature of the experimental
setup was increased to 35�C. Every 30 min, 1 ml of fresh buffer
was infused inside the chamber and this process was continued
for (at least) a further 5 h. The AUCrev topography was
recorded after 17–20 h. The AFM topographs of forward and
reverse SSPT phases were then processed in SPIP using the
protocol described above.
3. Results
3.1. Crystal packing viewed from the ac plane
The ordered multiphasic transition in the riboA crystals is
driven by synchronous ligand-induced conformational
changes and their resultant intermolecular lattice coupling
points. Maintaining crystalline order throughout the SSPT is
therefore dependent on the distinct crystal packing inter-
actions at each stage, and the coordinated changes between
them. The lattice changes are most visible in the ac plane (Figs.
1 and 2). The molecular arrangement in AUC observed by
research papers
658 Saminathan Ramakrishnan et al. � SSPT in a biomacromolecular crystal IUCrJ (2021). 8, 655–664
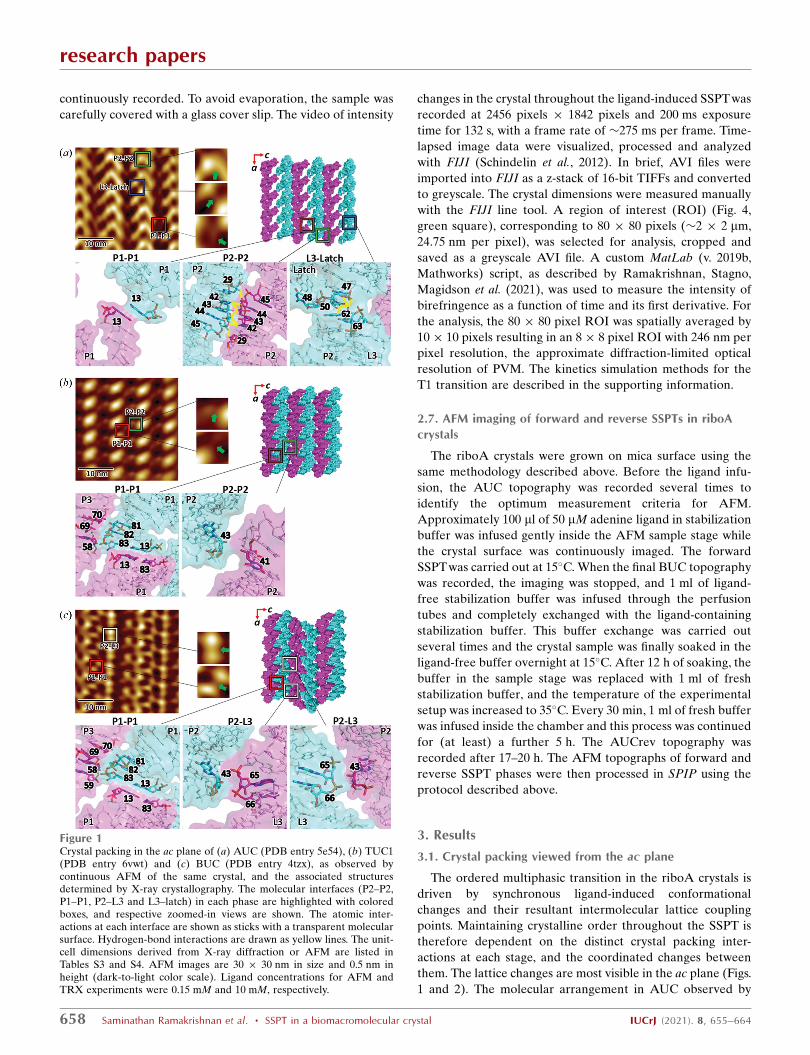
Figure 1Crystal packing in the ac plane of (a) AUC (PDB entry 5e54), (b) TUC1(PDB entry 6vwt) and (c) BUC (PDB entry 4tzx), as observed bycontinuous AFM of the same crystal, and the associated structuresdetermined by X-ray crystallography. The molecular interfaces (P2–P2,P1–P1, P2–L3 and L3–latch) in each phase are highlighted with coloredboxes, and respective zoomed-in views are shown. The atomic inter-actions at each interface are shown as sticks with a transparent molecularsurface. Hydrogen-bond interactions are drawn as yellow lines. The unit-cell dimensions derived from X-ray diffraction or AFM are listed inTables S3 and S4. AFM images are 30 � 30 nm in size and 0.5 nm inheight (dark-to-light color scale). Ligand concentrations for AFM andTRX experiments were 0.15 mM and 10 mM, respectively.
AFM is consistent with the crystal structure [Fig. 1(a)] which,
when superimposed onto the AUC AFM topography [Fig.
S3(a)], highlights the distinct crystal packing interfaces. The
molecules in the ac plane of AUC are coupled predominantly
through a symmetrical network of hydrogen bonds and van
der Waals (VDW) contacts involving residues 29 and 42–45,
located in the P2 stems of adjacent molecules [Fig. 1(a),
bottom].
In the AFM image, the P2–P2 interface is prominent and is
observed between the columns of stacked riboA molecules
along the a axis [Fig. 1(a)]. The smaller interface, which
includes residues 47 and 50 of one molecule, and 62 of another
(L3-latch), is also visible. However, there is a very weak
packing interaction between the unstable P1 helices via base-
stacking of terminal residues of opposing 50-strands [Fig. 1(a),
bottom]. This dynamic interface is mostly invisible to AFM,
most likely owing to its flexibility and partial disorder, but is
somewhat apparent in the far-right column [Fig. 1(a)]. Large
available spaces around the P1 helices indicate that, in the
AUC phase, these regions are highly accommodating to
structural changes.
Continuous AFM imaging of the crystal surface after the
addition of ligand reveals the SSPT to form TUC1 [Fig. 1(b)].
The ligand-stabilized helices solidify the P1–P1 coaxial
stacking interface in TUC1, which is further stabilized by
VDW interactions between the 30 terminus and residues 58, 69
and 70 of two adjacent molecules [Fig. 1(b)]. This effectively
reduces the distance between adjacent molecules along c by
�1.5 nm [9.3 nm (AUC) to 7.8 nm (TUC1); Figs. 1(a) and
1(b)]. In contrast to AUC, TUC1 crystal packing is dominated
by the P1–P1 interaction, whereas the P2–P2 interface
becomes almost negligible. Both interfaces are observed in the
AFM image [Fig. 1(b)]. The extensive P2–P2 interface in AUC
is minimized in TUC1 to a VDW contact between residues 41
and 43, thereby resulting in ‘floating’ layers of molecules along
this planar interface. Furthermore, as residue 48 is displaced
by the ligand and flips out into the solvent, the L3–latch
interface is altered, and contributes more to stacking in the ab
plane [compare Figs. 1(a) and 3(b)]. In general, the latch and
kissing-loop regions (in particular residues 48, 35–36 and 62–
64) are more dynamic in TUC1. Such freedom of motion
amongst every other layer of molecules in TUC1 drives the
transition to BUC, as the molecular layers reorganize to
achieve a lower lattice energy [Fig. 1(c)]. The net result is that
every other ‘pair’ of layers along the a axis is inverted (rotated
180� around c) (Fig. 2).
The stable P1–P1 interface is virtually unchanged from
TUC1 to BUC, the only addition being residue 59 moving into
a VDW distance of <4 A [Fig. 1(c)]. The minimal P2–P2
interface [buried surface area (BSA): 84.5 A2] in TUC1 now
becomes a slightly stronger P2–L3 VDW interface (BSA:
117.5 A2) involving residues 43 and 65–66 (Table S1). More-
over, because of the additional crystal symmetry, the P2–L3
interface is duplicated, providing even more coupling points.
Given the conformational and lattice restraints, this is the
most energetically favorable packing that can be achieved
(Table S1). Interestingly, the AFM image of BUC in the ac
plane [Fig. 1(c)] shows that the P1 helices of all molecules in a
column are embedded, whereas other helical domains appear
as prominent protrusions. This is consistent with the topo-
graphical staggering along the b axis, where P1 helices are
below the lattice plane, relative to the remaining structure.
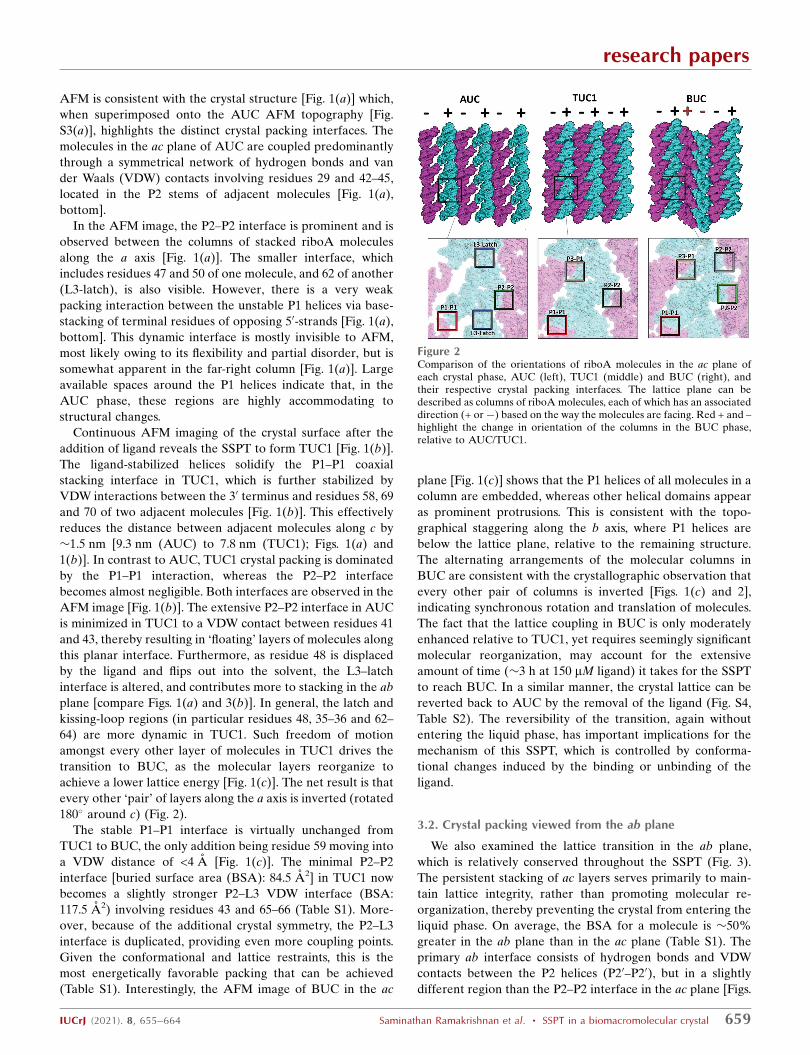
The alternating arrangements of the molecular columns in
BUC are consistent with the crystallographic observation that
every other pair of columns is inverted [Figs. 1(c) and 2],
indicating synchronous rotation and translation of molecules.
The fact that the lattice coupling in BUC is only moderately
enhanced relative to TUC1, yet requires seemingly significant
molecular reorganization, may account for the extensive
amount of time (�3 h at 150 mM ligand) it takes for the SSPT
to reach BUC. In a similar manner, the crystal lattice can be
reverted back to AUC by the removal of the ligand (Fig. S4,
Table S2). The reversibility of the transition, again without
entering the liquid phase, has important implications for the
mechanism of this SSPT, which is controlled by conforma-
tional changes induced by the binding or unbinding of the
ligand.
3.2. Crystal packing viewed from the ab plane
We also examined the lattice transition in the ab plane,
which is relatively conserved throughout the SSPT (Fig. 3).
The persistent stacking of ac layers serves primarily to main-
tain lattice integrity, rather than promoting molecular re-
organization, thereby preventing the crystal from entering the
liquid phase. On average, the BSA for a molecule is �50%
greater in the ab plane than in the ac plane (Table S1). The
primary ab interface consists of hydrogen bonds and VDW
contacts between the P2 helices (P20–P20), but in a slightly
different region than the P2–P2 interface in the ac plane [Figs.
research papers
IUCrJ (2021). 8, 655–664 Saminathan Ramakrishnan et al. � SSPT in a biomacromolecular crystal 659
Figure 2Comparison of the orientations of riboA molecules in the ac plane ofeach crystal phase, AUC (left), TUC1 (middle) and BUC (right), andtheir respective crystal packing interfaces. The lattice plane can bedescribed as columns of riboA molecules, each of which has an associateddirection (+ or�) based on the way the molecules are facing. Red + and –highlight the change in orientation of the columns in the BUC phase,relative to AUC/TUC1.
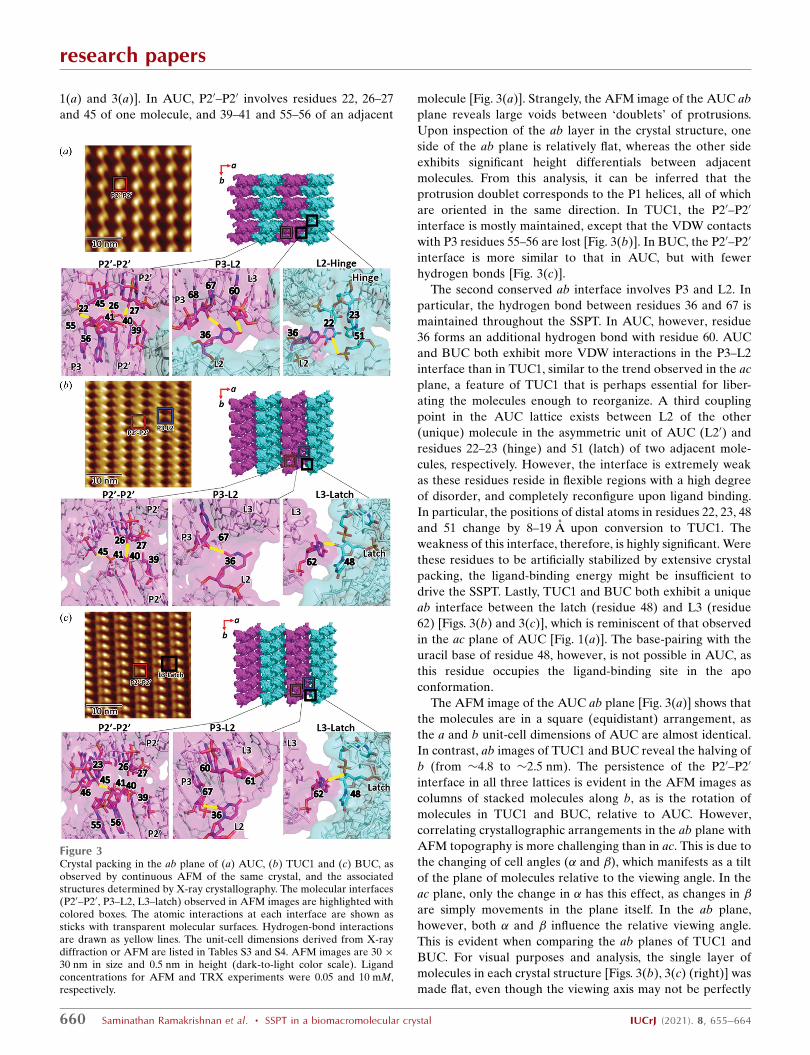
1(a) and 3(a)]. In AUC, P20–P20 involves residues 22, 26–27
and 45 of one molecule, and 39–41 and 55–56 of an adjacent
molecule [Fig. 3(a)]. Strangely, the AFM image of the AUC ab
plane reveals large voids between ‘doublets’ of protrusions.
Upon inspection of the ab layer in the crystal structure, one
side of the ab plane is relatively flat, whereas the other side
exhibits significant height differentials between adjacent
molecules. From this analysis, it can be inferred that the
protrusion doublet corresponds to the P1 helices, all of which
are oriented in the same direction. In TUC1, the P20–P20
interface is mostly maintained, except that the VDW contacts
with P3 residues 55–56 are lost [Fig. 3(b)]. In BUC, the P20–P20
interface is more similar to that in AUC, but with fewer
hydrogen bonds [Fig. 3(c)].
The second conserved ab interface involves P3 and L2. In
particular, the hydrogen bond between residues 36 and 67 is
maintained throughout the SSPT. In AUC, however, residue
36 forms an additional hydrogen bond with residue 60. AUC
and BUC both exhibit more VDW interactions in the P3–L2
interface than in TUC1, similar to the trend observed in the ac
plane, a feature of TUC1 that is perhaps essential for liber-
ating the molecules enough to reorganize. A third coupling
point in the AUC lattice exists between L2 of the other
(unique) molecule in the asymmetric unit of AUC (L20) and
residues 22–23 (hinge) and 51 (latch) of two adjacent mole-
cules, respectively. However, the interface is extremely weak
as these residues reside in flexible regions with a high degree
of disorder, and completely reconfigure upon ligand binding.
In particular, the positions of distal atoms in residues 22, 23, 48
and 51 change by 8–19 A upon conversion to TUC1. The
weakness of this interface, therefore, is highly significant. Were
these residues to be artificially stabilized by extensive crystal
packing, the ligand-binding energy might be insufficient to
drive the SSPT. Lastly, TUC1 and BUC both exhibit a unique
ab interface between the latch (residue 48) and L3 (residue
62) [Figs. 3(b) and 3(c)], which is reminiscent of that observed
in the ac plane of AUC [Fig. 1(a)]. The base-pairing with the
uracil base of residue 48, however, is not possible in AUC, as
this residue occupies the ligand-binding site in the apo
conformation.
The AFM image of the AUC ab plane [Fig. 3(a)] shows that
the molecules are in a square (equidistant) arrangement, as
the a and b unit-cell dimensions of AUC are almost identical.
In contrast, ab images of TUC1 and BUC reveal the halving of
b (from �4.8 to �2.5 nm). The persistence of the P20–P20
interface in all three lattices is evident in the AFM images as
columns of stacked molecules along b, as is the rotation of
molecules in TUC1 and BUC, relative to AUC. However,
correlating crystallographic arrangements in the ab plane with
AFM topography is more challenging than in ac. This is due to
the changing of cell angles (� and �), which manifests as a tilt
of the plane of molecules relative to the viewing angle. In the
ac plane, only the change in � has this effect, as changes in �are simply movements in the plane itself. In the ab plane,
however, both � and � influence the relative viewing angle.
This is evident when comparing the ab planes of TUC1 and
BUC. For visual purposes and analysis, the single layer of
molecules in each crystal structure [Figs. 3(b), 3(c) (right)] was
made flat, even though the viewing axis may not be perfectly
research papers
660 Saminathan Ramakrishnan et al. � SSPT in a biomacromolecular crystal IUCrJ (2021). 8, 655–664
Figure 3Crystal packing in the ab plane of (a) AUC, (b) TUC1 and (c) BUC, asobserved by continuous AFM of the same crystal, and the associatedstructures determined by X-ray crystallography. The molecular interfaces(P20–P20, P3–L2, L3–latch) observed in AFM images are highlighted withcolored boxes. The atomic interactions at each interface are shown assticks with transparent molecular surfaces. Hydrogen-bond interactionsare drawn as yellow lines. The unit-cell dimensions derived from X-raydiffraction or AFM are listed in Tables S3 and S4. AFM images are 30 �30 nm in size and 0.5 nm in height (dark-to-light color scale). Ligandconcentrations for AFM and TRX experiments were 0.05 and 10 mM,respectively.

normal to that plane. As a result, the packing arrangements in
the ab plane of the TUC1 and BUC crystal structures appear
identical. However, � changes from �99 (TUC1) to 90�
(BUC), thereby changing the relative viewing angle by �9�.
By comparing the AFM images of these two surfaces [Figs.
3(b) and 3(c) (left)], it is evident that, even though the layer
contains roughly the same molecular arrangement, the change
in the relative viewing angle results in a slightly different
topography.
3.3. Temporal characterization of the SSPT
The first stage of the SSPT (AUC to TUC1) is driven by the
ligand-induced major conformational changes in [apo1/apo2]
(AUC) to form [B�Ade]-like � 2 (TUC1). Surprisingly, many
of these changes include residues directly involved in crystal
packing interactions, particularly in the P1 and latch regions
(Fig. S5). Therefore, it is equally important to understand the
underlying temporal information of these spatial changes. We
used PVM to observe the first stage of the SSPT by monitoring
changes in crystal birefringence under cross-polarized light
(Fig. 4).
Importantly, a ligand concentration of 10 mM was used to
match that of the TRX experiments. The onset of the SSPT is
observable as waves of decreasing intensity of birefringence
that originate primarily from one edge of the crystal at a defect
[Fig. 4(a), green arrow]. The slow build-up of [apo1/IB�Ade],
the duration of which is dependent on the ligand concentra-
tion, leads to thermal expansion and accumulated crystal
strain. The phase transition is then triggered by structural and
lattice changes associated with conformational switching,
resulting in the sudden and stochastic release of energy, which
is evident optically by birefringence and physically in the form
of crystal motion and stress fractures [Fig. 4(a)]. The physical
manifestations of energy release are analogous to those
observed in ‘jumping crystals’ of small molecules (Commins et
al., 2016; Skoko et al., 2010). As time goes on, and the crystal
lattice stabilizes, many of the fractures anneal and crystal
birefringence gradually increases [Figs. 4(a) and 4(b)].
For temporal measurements, we selected a region of interest
(80 � 80 pixels, 2 � 2 mm) at the center of the crystal that is
approximately equal to the diameter (1–2 mm) of the X-ray
beam used in our XFEL experiments. The intensity of crystal
birefringence was measured for this ROI and plotted as a
function of time [Fig. 4(b)]. Plotting the first-derivative of the
research papers
IUCrJ (2021). 8, 655–664 Saminathan Ramakrishnan et al. � SSPT in a biomacromolecular crystal 661
Figure 4(a) PVM images of a riboA crystal (8� 6 mm) in the presence of 10 mM adenine ligand. A crystal defect, which serves as the point of origin for the phasetransition, is indicated by the green arrow. (b) Averaged intensity of crystal birefringence for each spatially averaged (10 � 10 pixels) superpixel in theselected ROI (80� 80 pixels, green square) plotted versus time. (c) The first derivative of the intensity plot in (b). (d) Histogram of the time values of thefirst-derivative peaks for all superpixels (64), revealing T1, T2 and T3. As the addition of ligand causes disturbance to birefringence intensity and view ofthe crystal under the microscope, measurements prior to 10 s were omitted from the analysis.
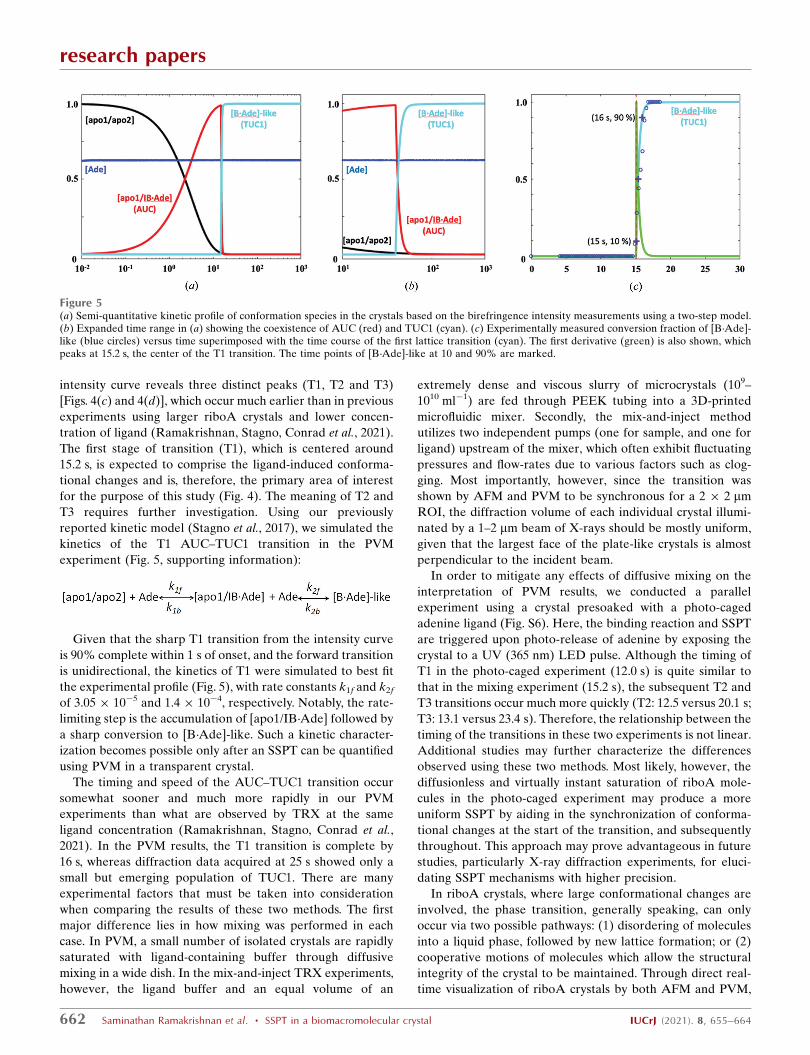
intensity curve reveals three distinct peaks (T1, T2 and T3)
[Figs. 4(c) and 4(d)], which occur much earlier than in previous
experiments using larger riboA crystals and lower concen-
tration of ligand (Ramakrishnan, Stagno, Conrad et al., 2021).
The first stage of transition (T1), which is centered around
15.2 s, is expected to comprise the ligand-induced conforma-
tional changes and is, therefore, the primary area of interest
for the purpose of this study (Fig. 4). The meaning of T2 and
T3 requires further investigation. Using our previously
reported kinetic model (Stagno et al., 2017), we simulated the
kinetics of the T1 AUC–TUC1 transition in the PVM
experiment (Fig. 5, supporting information):
Given that the sharp T1 transition from the intensity curve
is 90% complete within 1 s of onset, and the forward transition
is unidirectional, the kinetics of T1 were simulated to best fit
the experimental profile (Fig. 5), with rate constants k1f and k2f
of 3.05 � 10�5 and 1.4 � 10�4, respectively. Notably, the rate-
limiting step is the accumulation of [apo1/IB�Ade] followed by
a sharp conversion to [B�Ade]-like. Such a kinetic character-
ization becomes possible only after an SSPT can be quantified
using PVM in a transparent crystal.
The timing and speed of the AUC–TUC1 transition occur
somewhat sooner and much more rapidly in our PVM
experiments than what are observed by TRX at the same
ligand concentration (Ramakrishnan, Stagno, Conrad et al.,
2021). In the PVM results, the T1 transition is complete by
16 s, whereas diffraction data acquired at 25 s showed only a
small but emerging population of TUC1. There are many
experimental factors that must be taken into consideration
when comparing the results of these two methods. The first
major difference lies in how mixing was performed in each
case. In PVM, a small number of isolated crystals are rapidly
saturated with ligand-containing buffer through diffusive
mixing in a wide dish. In the mix-and-inject TRX experiments,
however, the ligand buffer and an equal volume of an
extremely dense and viscous slurry of microcrystals (109–
1010 ml�1) are fed through PEEK tubing into a 3D-printed
microfluidic mixer. Secondly, the mix-and-inject method
utilizes two independent pumps (one for sample, and one for
ligand) upstream of the mixer, which often exhibit fluctuating
pressures and flow-rates due to various factors such as clog-
ging. Most importantly, however, since the transition was
shown by AFM and PVM to be synchronous for a 2 � 2 mm
ROI, the diffraction volume of each individual crystal illumi-
nated by a 1–2 mm beam of X-rays should be mostly uniform,
given that the largest face of the plate-like crystals is almost
perpendicular to the incident beam.
In order to mitigate any effects of diffusive mixing on the
interpretation of PVM results, we conducted a parallel
experiment using a crystal presoaked with a photo-caged
adenine ligand (Fig. S6). Here, the binding reaction and SSPT
are triggered upon photo-release of adenine by exposing the
crystal to a UV (365 nm) LED pulse. Although the timing of
T1 in the photo-caged experiment (12.0 s) is quite similar to
that in the mixing experiment (15.2 s), the subsequent T2 and
T3 transitions occur much more quickly (T2: 12.5 versus 20.1 s;
T3: 13.1 versus 23.4 s). Therefore, the relationship between the
timing of the transitions in these two experiments is not linear.
Additional studies may further characterize the differences
observed using these two methods. Most likely, however, the
diffusionless and virtually instant saturation of riboA mole-
cules in the photo-caged experiment may produce a more
uniform SSPT by aiding in the synchronization of conforma-
tional changes at the start of the transition, and subsequently
throughout. This approach may prove advantageous in future
studies, particularly X-ray diffraction experiments, for eluci-
dating SSPT mechanisms with higher precision.
In riboA crystals, where large conformational changes are
involved, the phase transition, generally speaking, can only
occur via two possible pathways: (1) disordering of molecules
into a liquid phase, followed by new lattice formation; or (2)
cooperative motions of molecules which allow the structural
integrity of the crystal to be maintained. Through direct real-
time visualization of riboA crystals by both AFM and PVM,
research papers
662 Saminathan Ramakrishnan et al. � SSPT in a biomacromolecular crystal IUCrJ (2021). 8, 655–664
Figure 5(a) Semi-quantitative kinetic profile of conformation species in the crystals based on the birefringence intensity measurements using a two-step model.(b) Expanded time range in (a) showing the coexistence of AUC (red) and TUC1 (cyan). (c) Experimentally measured conversion fraction of [B�Ade]-like (blue circles) versus time superimposed with the time course of the first lattice transition (cyan). The first derivative (green) is also shown, whichpeaks at 15.2 s, the center of the T1 transition. The time points of [B�Ade]-like at 10 and 90% are marked.
our results clearly demonstrate that structural changes and
molecular rearrangements are accommodated by the crystal-
line environment such that an ordered solid phase is main-
tained throughout. This feature of the SSPT is critical for
structure determination of intermediate conformations,
making it possible to determine a molecular movie of a large
conformational switch. To do so, however, requires temporal
information for how and when the transitions occur, and the
number of intermediate lattices that may be involved. Such
analyses for defining the time-window of conformational
changes are critical for informing future TRX studies using an
XFEL. As we now know that the transition from AUC to
TUC1 encompasses the full extent of ligand-induced confor-
mational changes relevant to aptamer switching, the knowl-
edge gained from these experiments allows us to focus our
data acquisition on the time regime during which those
changes occur.
4. Conclusions
To our knowledge, this study represents the first report
elucidating the mechanistic interplay between the conforma-
tional changes that drive an SSPT in a biomacromolecular
crystal and the intermolecular lattice contacts associated with
each stage of the transition. Although some of the packing
interfaces are conserved in all three phases, there are distinct
differences in the types (e.g. hydrogen bonds, VDW) and
extent of interactions, as well as the orientations of molecules
to achieve them. The conformational changes are also
restricted by lattice energies and confined RNA conforma-
tional pathways (Bailor et al., 2010, 2011), in which lattice
order is maintained, even to the atomic level. This is in
contrast to other examples of SSPTs that can involve different
transition pathways. The most recent studies in nonbiological
systems show that SSPTs triggered by heating or photons can
occur via a metastable liquid phase (Peng et al., 2015; Smets et
al., 2020; Pogatscher et al., 2016; Mohammadi et al., 2018;
Taniguchi et al., 2019). In crystals of linear amino acids,
synchronous cooperative motion of molecules was shown to
be only one of many possible transition mechanisms (Smets et
al., 2020). The first-order (continuous) or second-order
(discontinuous) classificaitons of SSPTs by Ehrenfest have
since been challenged (Mnyukh, 2009). Mnyukh argued that
all SSPTs are first order in nature and follow a mechanism of
continuous nucleation and growth (molecule-by-molecule).
Similar to the study by Smets et al. (2020), however, our results
demonstrate that the nucleation-and-growth process of the
SSPT in riboA crystals is not mutually exclusive to the coop-
erative motions of subdomains of molecules. Importantly, the
mechanism of these changes is not theoretical, but is directly
observable and measurable using the combination of PVM,
AFM and TRX. This more complex phenomenon of nuclea-
tion and growth coupled with molecular synchronization may
be a particular distinction in crystals of biomolecules, which
involve weaker and much more dynamic interactions in crys-
tals with much higher solvent content. Despite its complexity,
the SSPT observed in riboA crystals is reversible. The devel-
opment of ‘switchable’ materials using external stimuli is of
great scientific interest, not only for materials science and
technology but also for biology and pharamaceuticals.
Therefore, expanding such research to include SSPTs of
biomacromolecular crystals and their mechanisms could have
broad and profound implications.
Acknowledgements
The content of this publication does not necessarily reflect the
views or policies of the Department of Health and Human
Services, nor does the mention of trade names, commercial
products or organizations imply endorsement by the US
Government.
Funding information
This project is supported by the National Institutes of Health/
National Cancer Institute (NCI) Intramural Research
Program (awarded to YXW) and the contract with NCI
(contract No. 75N91019D00024 awarded to WFH).
References
Anwar, J. & Zahn, D. (2017). Adv. Drug Deliv. Rev. 117, 47–70.Bailor, M. H., Mustoe, A. M., Brooks, C. L. & Al-Hashimi, H. M.
(2011). Curr. Opin. Struct. Biol. 21, 296–305.Bailor, M. H., Sun, X. & Al-Hashimi, H. M. (2010). Science, 327, 202–
206.Baker, M. D., Wolanin, P. M. & Stock, J. B. (2006). Bioessays, 28, 9–22.Brochini, L., Costa, A. D., Abadi, M., Roque, A. C., Stolfi, J. &
Kinouchi, O. (2016). Sci. Rep. 6, 1–15.Calladine, C. R. (1978). J. Mol. Biol. 118, 22.Commins, P., Desta, I. T., Karothu, D. P., Panda, M. K. & Naumov, P.
(2016). Chem. Commun. 52, 13941–13954.Etter, M. C. & Siedle, A. R. (1983). J. Am. Chem. Soc. 105, 641–643.Everhardt, A. S., Damerio, S., Zorn, J. A., Zhou, S. L., Domingo, N.,
Catalan, G., Salje, E. K. H., Chen, L. Q. & Noheda, B. (2019). Phys.Rev. Lett. 123, 087603.
Harris, W. F. & Scriven, L. E. (1970). J. Theor. Biol. 27, 233–257.Mnyukh, Y. (2009). Fundamentals of Solid-State Phase Transitions,
Ferromagnetism and Ferroelectricity. Fairfield: 1st Book Library.Mohammadi, P., Aranko, A. S., Lemetti, L., Cenev, Z., Zhou, Q.,
Virtanen, S., Landowski, C. P., Penttila, M., Fischer, W. J.,Wagermaier, W. & Linder, M. B. (2018). Commun. Biol. 1, 12.
Nahvi, A., Sudarsan, N., Ebert, M. S., Zou, X., Brown, K. L. &Breaker, R. R. (2002). Chem. Biol. 9, 1043–1049.
Olson, G. B. & Hartman, H. (1982). J. Phys. 43, 855–865.Otsuka, K. & Wayman, C. M. (1998). Shape Memory Materials.
Cambridge University Press.Peng, Y., Wang, F., Wang, Z., Alsayed, A. M., Zhang, Z., Yodh, A. G.
& Han, Y. (2015). Nat. Mater. 14, 101–108.Pogatscher, S., Leutenegger, D., Schawe, J. E., Uggowitzer, P. J. &
Loffler, J. F. (2016). Nat. Commun. 7, 11113.Porter, D. A., Easterling, K. E. & Sherif, M. Y. (2008). Phase
Transformations in Metals and Alloys. Boca Raton, FL: CRC Press.Ramakrishnan, S., Stagno, J. R., Conrad, C. E., Ding, J., Yu, P.,
Bhandari, Y. R., Lee, Y.-T. & Pauly, G. (2021). Nat. Commun. 12,1762.
Ramakrishnan, S., Stagno, J. R., Magidson, V., Heinz, W. F. & Wang,Y.-X. (2021). J. Appl. Cryst. 54, 787–796.
Schindelin, J., Arganda-Carreras, I., Frise, E., Kaynig, V., Longair, M.,Pietzsch, T., Preibisch, S., Rueden, C., Saalfeld, S., Schmid, B.,Tinevez, J. Y., White, D. J., Hartenstein, V., Eliceiri, K., Tomancak,P. & Cardona, A. (2012). Nat. Methods, 9, 676–682.
research papers
IUCrJ (2021). 8, 655–664 Saminathan Ramakrishnan et al. � SSPT in a biomacromolecular crystal 663

Skoko, Z., Zamir, S., Naumov, P. & Bernstein, J. (2010). J. Am. Chem.Soc. 132, 14191–14202.
Smets, M. M. H., Kalkman, E., Krieger, A., Tinnemans, P., Meekes,H., Vlieg, E. & Cuppen, H. M. (2020). IUCrJ, 7, 331–341.
Stagno, J. R., Liu, Y., Bhandari, Y. R., Conrad, C. E., Panja, S., Swain,M., Fan, L., Nelson, G., Li, C., Wendel, D. R., White, T. A., Coe, J.D., Wiedorn, M. O., Knoska, J., Oberthuer, D., Tuckey, R. A., Yu, P.,Dyba, M., Tarasov, S. G., Weierstall, U., Grant, T. D., Schwieters, C.
D., Zhang, J., Ferre-D’Amare, A. R., Fromme, P., Draper, D. E.,Liang, M., Hunter, M. S., Boutet, S., Tan, K., Zuo, X., Ji, X., Barty,A., Zatsepin, N. A., Chapman, H. N., Spence, J. C., Woodson, S. A.& Wang, Y. X. (2017). Nature, 541, 242–246.
Taniguchi, T., Sato, H., Hagiwara, Y., Asahi, T. & Koshima, H. (2019).Chem. Commun. 2, 10.
Zhang, J. & Ferre-D’Amare, A. R. (2014). Structure, 22, 1363–1371.
research papers
664 Saminathan Ramakrishnan et al. � SSPT in a biomacromolecular crystal IUCrJ (2021). 8, 655–664
Copyright © 2022 FDOKUMEN