SOLID FOUNDATION FOR FUTURE VALUE - BIDV
32
SOLID FOUNDATION FOR FUTURE VALUE November 2021
-
Upload
khangminh22 -
Category
Documents
-
view
1 -
download
0
Transcript of SOLID FOUNDATION FOR FUTURE VALUE - BIDV

SOLID FOUNDATION FOR FUTURE VALUE
November 2021

Contents
2
SECTION 1 – VIETNAM MACRO ECONOMY
• Macroeconomic Highlights ……………….…………………………….….... p.3
• Banking Industry Review ……………………….………………………….... p.6
SECTION 2 – BIDV OVERVIEW
• BIDV Profile ……………………………………………………………......... p.9
• BIDV Performance in 2016 – Q3.2021 ……..………………………………. p.19
SECTION 3 – CAPITAL RAISING PLAN
• Overall Plan ………………………………………………………………… p.30

VIETNAM MACRO ECONOMY1
Macroeconomic Highlights
4
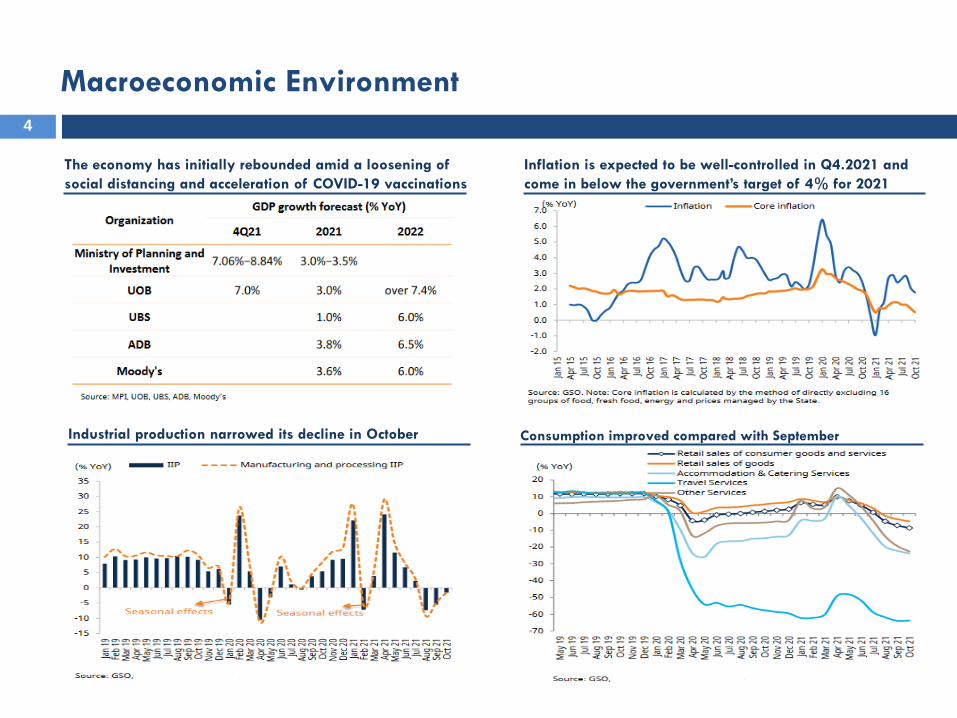
Macroeconomic Environment
The economy has initially rebounded amid a loosening of
social distancing and acceleration of COVID-19 vaccinations
Inflation is expected to be well-controlled in Q4.2021 and
come in below the government’s target of 4% for 2021
Industrial production narrowed its decline in October Consumption improved compared with September

5
Macroeconomic Environment
Exports expected to regain growth momentum when
production and business activities recover Registered FDI maintained double-digit growth rate
Public investment is expected to recover in 2022−2024Vietnam’s market is expected to enjoy high EPS growth,
fair 2021 forward P/E

VIETNAM MACRO ECONOMY1
Banking Industry Review

7
Supportive monetary and fiscal policies
Supportive monetary policy Headroom for fiscal policy remains comfortable
Lower financing cost to encourage investment VND appreciates relative to US$ in 10M2021

Banking industry8
2012 2021
42%
42%
33%
50%
40%
52%
46%
33%44%
41%
Market share in 2020
Credit growth is expected to accelerate for financing the recovery Pandemic-driven bad debt concerns
16% 12% 11%
29%15%
41%40% 42%
47%
45%
43% 48% 48%
24%
40%
State-owned Commercial Banks Joint Stock Commercial Banks Other
Total Assets Lending Deposits Charter Captial Profit after Tax

BIDV OVERVIEW2
BIDV Profile

Differentiating BIDV
BIDVPayment system Network
Customer base Financial Capacity
Credit Rating Information Technology
# 1 by Total Assets
# 1 by PPOP
# 2 by National Network Coverage
(190 Branches, 895 Transaction Offices, over
1,900 ATMs and 33,000 POS)
# 1 by Customer Loans
# 1 by Customer Deposits
• Settlement bank for Vietnam stock market
• The only settlement bank for domestic transactions
of Master Card in Vietnam
• The Vietnam Domestic Technology and
Operations Bank of the Year awarded by
Asian Banking & Finance (ABF)
• Ranking first for Readiness for IT
application to business for 10 years
A leading bank in Vietnam market10
Moody’s
(March 2021)
Rating Ba3
Outlook Positive
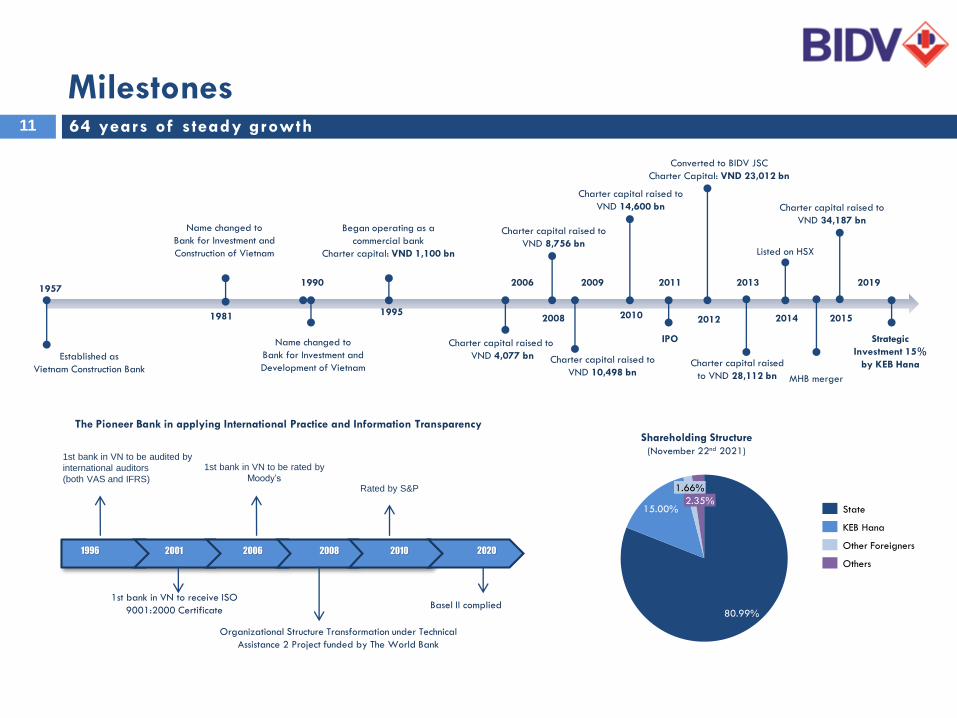
Milestones
1957
Established as
Vietnam Construction Bank
1990
Name changed to
Bank for Investment and
Development of Vietnam
1995
Began operating as a
commercial bank
Charter capital: VND 1,100 bn
Charter capital raised to
VND 4,077 bn
2006
1981
Name changed to
Bank for Investment and
Construction of Vietnam
2008
Charter capital raised to
VND 8,756 bn
2009
Charter capital raised to
VND 10,498 bn
2010
Charter capital raised to
VND 14,600 bn
2011
IPO
2012
2013
Charter capital raised
to VND 28,112 bn
Converted to BIDV JSC
Charter Capital: VND 23,012 bn
Listed on HSX
2014
MHB merger
2015
Charter capital raised to
VND 34,187 bn
2019
64 years of steady growth11
Shareholding Structure (November 22nd 2021)
1st bank in VN to be audited by
international auditors
(both VAS and IFRS)
1st bank in VN to receive ISO
9001:2000 Certificate
1st bank in VN to be rated by
Moody’s
Organizational Structure Transformation under Technical
Assistance 2 Project funded by The World Bank
Rated by S&P
1996 2001 2006 2008 2010 2020
Basel II complied
The Pioneer Bank in applying International Practice and Information Transparency
Strategic
Investment 15%
by KEB Hana
80.99%
15.00%
1.66%
2.35%State
Others
KEB Hana
Other Foreigners

Mission, Vision & Core Value
Mission
Vision
• Best services for customers
• Best value to shareholders
• Professional working environment for employees
• Pioneer in community development activities
Being a leading financial institutions in Southeast Asia
with the best digital platform in Vietnam, striving to be in
Top 100 largest banks in Asia.
Commit ted to del ivering the best value12
cCore
values
Customer
OrientationInnovation
Quality and
Trustworthiness
Social
Responsibility

2021 – 2025 Strategy
13
Scale
Asset Quality
Profitability
•Total Assets: 9 - 13% pa
•Lending: 9.5-12.5% pa.
•Deposits: 10.5-15% pa.
•NPL: ≤ 1.6%
•ROA: 1%
•ROE: 17%
1
• Sound financial capacity as a basis for growingoperational scale, increasing market share andmaintaining a leading position in the banking market
2
• Sustainable performance, improving the quality ofassets, increasing the proportion of non-interest income.providing the best banking - finance - insuranceproducts and services to customers.
3
• Customer structure has shifted positively, becoming theleading bank in Vietnam in terms of market share in thesegment of retail & SMEs.
4• Managing and operating transparently, effectively as
international practices.
5• As a leading bank in information technology and digital
banking applications in Vietnam.
6
• High quality human resources ensure in the trend ofintegration and technology 4.0; Professional, modern,learning and creative working environment.

Organization Chart
14
ORGANIZATIONAL STRUCTUREAs of June 30th 2021
GOVERNANCE CHARTAs of June 30th 2021

Diversified Business
189 Domestic Branches
01 Oversea Branch
895 Transaction Offices
1,900 ATMs
33,000 POS
Internet Banking
Mobile Banking
Extensive Domestic Network Coverage for both Traditional and Modern
Distribution Channels*
International Expansion
• RMA with 1,100 banks and 50 Nostro accounts with large banks all
over the world
• Joint-ventures with international partners Russia, Singapore,
Malaysia, Cambodia, Laos
• Representative Offices in Cambodia, Laos, Myanmar, Russia, Taiwan
• Branch in Myanmar
* As of September 30th 2021
15

16
BIDV’s Market Position (as of 30/09/2021)

Achievements
Top 10 Vietnam companies
Outstanding Retail Bank in Vietnam
2016-2020, Best Digital Business
Transformation 2020
Best Payment Bank in Vietnam
Best SME 2018-2020
Best Cash Management Bank in Vietnam
Best Transaction Bank in VietnamTop 300 Global Banking Brand
Top 4 most valued brands in Vietnam
Top 10 sustainable companies
2018-2020
Best SME Bank 2018-2020
Best FX Provider 2018-2020
Top 2000 World’s Biggest Public
Companies, Top 50 Vietnam
Companies
17
Leadership in Contactless active
terminals penetration 2019,2020
Best SME Bank Vietnam
2018, 2019,2020
6 excellent high technology applied products: BIDV-Ezone; BIDV Paygate; Automatic
deposit investment system and bilateral payment for Vietnam Social Security; BIDV’s
bank statement system; Cross-selling management system - BIDV Sale Power; Sales
support mobile application for corporate customers named B.Sales.

BIDV Shares
18
Ticker BID
Listed on Ho Chi Minh Stock Exchange
Listing Date 24th January 2014
Outstanding Volume (shares) 4,022,018,040
Free-floating ratio 4.01%
Foreign ownership 16.66% (15% by Hana)
Market Cap (VND tn)VND 180 trillion (USD 7.9 billion)
Rank the 9th in Vietnam Stock Market
Last closed price
(November 22nd 2021)45,750 VND
52-week high/low 49,000 / 37,900 VND
EPS 2,449 VND
P/B (November 22nd 2021) 2.17x
P/E (November 22nd 2021) 18.3x
Share Price Performance
Peer ComparisonNovember 22nd, 2021
0
2
4
6
8
10
12
14
16
18
20
0
50,000
100,000
150,000
200,000
250,000
300,000
350,000
400,000
BID CTG VCB VPB TCB MBB ACB STB HDB
Market Cap P/E P/B

BIDV OVERVIEW2
BIDV Performance

Steady balance sheet growth20
Total Assets(VND billion)
Customer Deposits(VND billion)
Customer Loans(VND billion)
1.006.635
2016
1.312.8861.202.283
2017 2018
1.489.957
2019
1.516.686
2020
1.685.678
3Q2021
+11,1%10,8%
723,697
866,885
988,739
1,116,998
1,214,296
1,328,680
2017 20192016 2018 2020 3Q2021
9.4%+14%
726,022
859,985
989,671
1,114,163
1,226,6741,309,953
202020172016 2018 3Q20212019
+6.8%+14%
Profit Before Tax (VND billion)
10,733
3Q202120172016 20202018
7,709
2019
13,000
8,6659,473
10,876
9,214+41%
+11%

Loan portfolio focusing on retail and SME components21
• Market share: 13.4%
• The Bank’s lending increased by 9.4% from end of 2020 to VND 1,328,680 billion as of September 30th 2021
• Loan portfolio:
• Focusing on retail and SME components (37.7% and 22.5% respectively as of 2020).
• Short term loans increased proportion and accounted for 64.7% of the portfolio.
Trend in Gross Customer Loans(VND billion)
58.0%
11.9%
1,328,680
2017
33.2%
2016
32.6%
61.8%
7.2%
31.4%30.9%
2018
1,214,296
62.6%
6.6%
30.8%
54.8%
2019
62.9%
5.8%
723,697
64.7%
2020
5.4%
29.8%
3Q2021
866,885
988,739
1,116,998
9.4%
9.4%14%
Short-term Long-termMedium-term
Loan portfolio by customers
40,2%Corporate
22,5%
Retail
SME
37,3%
Q3.2021

Diversified focusing on high-growth sector and good credit quality22
Loan portfolio by group (%)
4,4%
Agriculture, forestry & seafood
1,1%
Mining
16,1%
8,9%
Electricity, petroleum & water5,6%
Manufacturing & processing
Construction
30,8%
Wholesale & retail trade
3,9%Transport & warehousing
11,8%Services
2,5%
Real estate14,8%
Others
Loan portfolio by industry
• Credit quality was improved with NPL ratio according to Circular
No.11 was at 1.39% (The ratio of 2020 was 1.54%) .
• Loan portfolio by industry improved positively by increasing
loans for high-growth industries (such as services, wholesale &
retail) and decreasing loans for high-risk industries (such as real
estate, mining, manufacturing).
2016
1,99%
3,75%
94,26%
3,52%
1,62%
94,86% 95,77%
2017 2020
1,90%
2,33%
2018 2019
1,74%
1,10%2,23%
96,03%
1,76%
1,12%
97,12%
1,61%
97,29%
3Q2021
NPL Special Mentioned Current
2020
5,4%
Agriculture & forestry
12,1%
7,5%
3,0%
7,1%
Electricity, petroleum & water
Manufacturing & processing
Mining
19,1%
15,8%
Others
Wholesale & retail trade
Construction
23,1%
2,2%Transport & warehousing
4,6%Services
Real estate
2016

Deposits23
82.1%
17.2%
Specific Purpose Term Deposit Demand Deposit
• Market share: 11.0%
• Customer deposits grew by 14% p.a. in the period of 2016-2020 thanks to nationwide network and strong brand name.
• Deposit structure: Individuals deposit accounted for 48% of total mobilized funds, ensuring the stable deposit growth.
Customer Deposits by Term(VND billion)
0.7% 0.5%
82.1%
17.2%
2017
18.6%
80.7%
0.7%
16.4%
726,022
82.9%
2016
1,226,674
2018
1.1%
16.0%
82.9%
18.0%
81.4%
2020
18.5%
81.0%
0.4%
3Q2021
1,114,231
2019
859,985
989,671
1,309,953
0.8%
+6.8%
+14%
Deposit Breakdown
48%
45%
7%
FI
Corporate
Individuals
Q3.2021

Financial Performance24
Total Operating Income
(VND billion)
Net Interest Income
(VND billion)Non-Interest Income
(VND billion)
2017 20202018
50.035
20192016 3Q2021
44.483
30.434
39.017
48.165 47.144
13,2%
2016 2017 1H20212018 2019 2020
35.964
23.435
30.955
35.99534.956
11,2%
20172016 2018 2019
11.179
2020 3Q2021
6.999
8.062
9.527
12.171
14.238
+19,4%
17.280
2016 20192017
16.167
2018 2020 3Q2021
13.527
15.504
17.696
13.216
6,9%
Total Operating Expense
(VND billion)

2,528
25
Financial Performance
89%
6%
From deposits
From loans to customers
From debt securities
0%
2%
From guarantee
From finance leases
1%
Others
2%
74%
10%
13%
Interest income
0%
Investment income
Fee & commission
2%
Other income
Gold and FX
0%
Securities income
Non-interest income accounted for bigger proportion in TOI Interest income from loans to customers is driven factor in NII
24%
20%
24%
12%
7%
13%
Insurance activities
Payment services
Other service
Card
Digital banking
Trade finance
Leading banking service focusing on settlement and insurance
58%
17%
19%
6%
0%
Taxes and fees
Administration Expense
Staff Cost
Rental & Fixed Assets
Provision expense
0%
Insurance for customer deposits
Well-managed operating expense
Q3.2021
Q3.2021 Q3.2021
Q3.2021

Key Ratios26
Source: BIDV Financial Reports
Asset quality 2016 2017 2018 2019 2020 3Q2021
Loans to deposits 100% 101% 99.9% 100.0% 99.0% 101.4%
Loan loss reserve coverage (Provision/NPL) 69.7% 80.7% 66.0% 74.2% 88.4% 140.2%
NPL ratio 1.99% 1.62% 1.90% 1.74% 1.76% 1.61%
Credit Cost 1.39% 1.87% 2.04% 1.90% 1.98% 2.36%
Profitability 2016 2017 2018 2019 2020 3Q2021
Net interest margin 2.72% 2.98% 2.94% 2.82% 2,61% 2.36%
Non-interest income/Operating Income 23.0% 20.7% 21.4% 25.3% 28.5% 23.7%
ROAA 0.67% 0.63% 0.60% 0.62% 0.49% 0.64%
ROAE 14.4% 14.9% 14.6% 13.1% 9.4% 12.3%
CIR 44.4% 39.7% 36.2% 35.9% 35.4% 28.9%

Retail Banking 27
Retail Deposits (VND billion )
308,337
374,526
425,879
488,761
2016 20182017 2019 2020 3Q2021
185,216
238,527
14.8%
23.1%
Retail Loans (VND billion)
8,802
10,040
11,340
12,786
14,24115,331
2016 2017 20202018 2019 3Q2021
7.7%12.8%
Customer Base (thousand people) Retail Loans Breakdown (VND billion)
32,3%
Mortgages
Consumers
22,2%
Commercial & Production 45,0%
0,5%
OthersQ3.2021
435,283
523,643571,204
625,666 634,127672,843
20202016 2017 3Q202120192018
6.11%
9.9%

28
Digital Banking
BIDV’s digital banking vision 2030 - Become the leading financial
institution in Southeast Asia with the best digital platform in Vietnam,
and strive to be among the 100 largest banks in Asia.
Digital Channels: Internet banking, Mobile banking, Web Chat,
Messenger, Facebook Fan Page, YouTube Channel, 3rd party
app/web, Online Application for Internet & mobile banking…
Innovation products: Apple Watch, Interactive game, Smart
Keyboard for fund transfer, Chatbot, Notification for transaction (OTT
messages) in Smart Banking; Virtual Account, Swift GPI in iBank
Number of E-banking users: (Update September 2021): 8.5 million,
include Smartbanking: 6.0 million (70%).
Transaction Value (the 9 months of 2021): ~120 billion USD,
increased 38% compare with 2020.

Update 1H202129
Source: BIDV Financial Reports
Income Statement (VND billion) 2016 2017 2018 2019 2020 3Q2021CAGR
2016-2020
Net interest income 23,435 30,955 34,956 35,995 35,797 35,964 13.1%
Net fee & commission income 2,509 2,966 3,551 4,283 4,266 4,770 12.8%
Total operating income 30,434 39,017 44,483 48,165 50,035 47,143 15.2%
Operating expense 13,527 15,504 16,117 17,280 17,696 13,216 9.8%
Profit before provision 16,907 23,513 28,366 30,885 32,339 33,928 18.9%
Provision expenses 9,199 14,847 18,894 20,009 23,125 23,195 32.4%
Profit before tax 7,709 8,665 9,473 10,876 9,214 10,733 3.0%
Taxation charge 1.48 1.72 1,931 2,211 1,851 2,150 3.3%
Net profit 6,229 6,946 7,542 8,665 7,363 8,583 2.9%
Balance Sheet (VND billion) 2016 2017 2018 2019 2020 3Q2021CAGR
2016-2020
Total assets 1,006,404 1,202,284 1,313,038 1,490,105 1,516,870 1,685,678 12.3%
Customer loans 723,697 866,885 988,739 1,116,925 1,214,296 1,328,680 15.2%
Customer deposits 726,022 859,985 989,671 1,114,231 1,226,674 1,309,953 16.8%

CAPITAL RAISING PLAN3
Overall Plan

Projected Shareholding Structure
STAGE 1: 2019 STAGE 3: From 2022
• Issuing shares to foreign investors
(total up to 30%):
- Strategic Investor (KEB Hana): 15%
- Financial investor: up to 12%
• State ownership ≥ 65%
• Additional public offering
• Issuing additional shares to foreign
• Foreign Investors (may hold >30% in
total)
• State ownership decrease to ≥ 51%
• IPO finished on December, 2011
• Transforming to Joint Stock
Commercial Bank in April 2012
• State ownership: 80.99%
• KEB Hana: 15%
• Other Foreigner ownership: 3%
STAGE 2: To 2022
31
KEB Hana
Foreigners
80,99%
3,00%
15,00%1,01%
Others
State
5%
65%Sate ownership
30%Foreign ownership
Others
5%5%
OthersEmployees
39%
Foreign ownership
51%
Sate ownership
(*) According to “The Development Strategy of the Vietnam Banking Sector to 2025, vision to 2030” approved by the Prime Minister in Decision No.986/QD-TTg dated 8th Aug 2018

This Presentation (the Presentation) has been prepared by IR Team - BIDV for the purpose of setting out certain
confidential information in respect of BIDV’s business activities and strategy. This Presentation is for the exclusive use of
the recipients to whom it is addressed.
This presentation is to provide general information and analysis on BIDV for those who qualify as a “professional
securities investor” as defined in the Securities Law. Such investors should use information, analysis, comment in this
presentation as a reference source only. This presentation and any meeting where this presentation is made are for the
purpose of providing information and do not intend to advertise BIDV or BID stock or to advice readers to buy or sell BID
stock or any other securities. No representation or warranty, express or implied, is made concerning, and no reliance
should be placed on, the accuracy, fairness, or completeness of this Presentation. BIDV takes no responsibility with regard
to the accuracy or completeness of any information contained here. Viewpoint and analysis in the report can be changed
without notification.
The presentation is a property of BIDV and under copyright protection. Infringement of copy, change and reprint of the
report without permission of BIDV is illegal. BIDV owns the copyright on this documentation.
IR Team:
Ms. Tran Nguyet Quynh Hoa - Tel: +84 937 050 282 - Email: [email protected]
Mr. Nguyen Xuan Thieu - Tel: +84 899 568 688 - Email: [email protected]
Mr. Nguyen Phi Long - Tel: +84 936 337 717 - Email: [email protected]
Ms. Hoang Ngoc Anh - Tel: +84 947 653919 - Email: [email protected]
Important Notice32