Enzymes, Cell Respiration, Immune - 8. SCIENTIFIC INQUIRY ...
(This is a sample cover image for this issue. The actual cover is not yet available at this time.)
This article appeared in a journal published by Elsevier. The attachedcopy is furnished to the author for internal non-commercial researchand education use, including for instruction at the authors institution
and sharing with colleagues.
Other uses, including reproduction and distribution, or selling orlicensing copies, or posting to personal, institutional or third party
websites are prohibited.
In most cases authors are permitted to post their version of thearticle (e.g. in Word or Tex form) to their personal website orinstitutional repository. Authors requiring further information
regarding Elsevier’s archiving and manuscript policies areencouraged to visit:
http://www.elsevier.com/copyright
Author's personal copy
Soil respiration and rates of soil carbon turnover differ among six common Europeantree species
Lars Vesterdal a,⇑, Bo Elberling b, Jesper Riis Christiansen a,b, Ingeborg Callesen a,1, Inger Kappel Schmidt a
a Forest & Landscape Denmark, University of Copenhagen, Rolighedsvej 23, DK-1958 Frederiksberg C, Denmarkb Department of Geography and Geology, University of Copenhagen, Øster Voldgade 10, DK-1350 Copenhagen K, Denmark
a r t i c l e i n f o
Article history:Received 24 August 2011Received in revised form 5 October 2011Accepted 7 October 2011
Keywords:Tree speciesSoil carbonSoil respirationCommon garden designCarbon turnover
a b s t r a c t
The knowledge of tree species effects on soil organic carbon (C) turnover based on rigorous experimentaldesigns is limited for common European deciduous tree species. We assessed soil respiration, and rates ofC turnover in six tree species in a more than 30-year-old common garden experiment replicated at sixsites in Denmark. The studied tree species were the broadleaves beech (Fagus sylvatica L.), pedunculateoak (Quercus robur L.), lime (Tilia cordata L.), sycamore maple (Acer pseudoplatanus L.) and ash (Fraxinusexcelsior L.) and the conifer Norway spruce (Picea abies (L.) Karst.). Rates of C turnover were estimatedby (i) the ratio of estimated soil heterotrophic respiration (Rh) to C stock in forest floor and top mineralsoil, (ii) the ratio of litterfall C to forest floor C, (iii) foliar mass loss in litterbags, and (iv) mineral soil Cturnover assessed by laboratory incubation. Soil respiration differed significantly among several speciesand increased in the order beech < lime < spruce = oak = maple < ash. Soil respiration was temperaturelimited with no significant species difference in Q10. Norway spruce soils were significantly driest, andsoil respiration was also limited by soil moisture. Carbon turnover rates based on the ratio between Rh
and C stock were significantly higher in ash than in all other species except maple, and maple also hadhigher C turnover than spruce. A similar influence of tree species on C turnover was indicated by the lit-terfall C to forest floor C ratio and by foliar mass loss; rates of C turnover increased in the order spruce < -beech < oak < ash = lime = maple with significant differences between several of the species. Mineral soilC turnover during laboratory incubation was highest for ash, maple and oak, and significantly lower forspruce. The indices of soil C turnover were largely consistent and some were significantly correlated. Dif-ferences in C turnover were for the most part attributable to variation in litter quality and microclimaticconditions. Litterfall foliar N, Ca and Mg concentrations and to some extent lignin concentration corre-lated best with C turnover indices that integrated the forest floor. The results suggests that specific traitsof Norway spruce and these five common broadleaf forest species should be taken into account in themodelling of soil C stock dynamics over decades.
� 2011 Elsevier B.V. All rights reserved.
1. Introduction
Forest ecosystems are currently in focus as potential carbonsinks. This is particularly the case for younger forest ecosystemswith a net primary production far exceeding the rate of decompo-sition resulting in net CO2 uptake from the atmosphere (Falloonet al., 1998; Gaudinski et al., 2000). The net C accumulation resultsin increasing aboveground biomass which is accounted for in na-tional greenhouse gas inventories (Lindner and Karjalainen,2007). Many studies have lately assessed C pools, but more knowl-
edge of the dynamics of soil organic C (SOC) in different foresttypes is needed to support modelling and subsequently reportingof changes in soil carbon stocks under the Climate Conventionand the Kyoto Protocol (Peltoniemi et al., 2007). Carbon sequestra-tion in soil may prove to represent a more stable and longer lastingsolution than C sequestration in standing biomass (Batjes, 1998)since biomass C stocks are more vulnerable to natural and man-in-duced disturbances (Jandl et al., 2007).
Soils contain a substantial part of terrestrial C and play an impor-tant part in the terrestrial C cycle. In temperate forests the soilcontains more than twice as much C as the living biomass (Eswaranet al., 1993; Goodale et al., 2002). Accumulation of SOC in forest eco-systems is closely related to tree species, climate and soil type (Vest-erdal and Raulund-Rasmussen, 1998; Côté et al., 2000; Callesenet al., 2003; Jandl et al., 2007). While the litter production is primar-ily controlled by tree physiological functions (Epron et al., 2001), the
0378-1127/$ - see front matter � 2011 Elsevier B.V. All rights reserved.doi:10.1016/j.foreco.2011.10.009
⇑ Corresponding author. Tel.: +45 35331672; fax: +45 35332671.E-mail addresses: [email protected] (L. Vesterdal), [email protected] (B. Elberling),
[email protected] (J.R. Christiansen), [email protected] (I. Callesen), [email protected] (I.K.Schmidt).
1 Present address: Biosystems Division, Risø-DTU, Technical University of Denmark,Frederiksborgvej 399, DK-4000 Roskilde, Denmark.
Forest Ecology and Management 264 (2012) 185–196
Contents lists available at SciVerse ScienceDirect
Forest Ecology and Management
journal homepage: www.elsevier .com/locate / foreco
Author's personal copy
decomposition of litter material is influenced by a number of inter-acting biotic and abiotic factors, including litter quality in terms ofnutrient and lignin contents, decomposer community, soil temper-ature, soil water content, pH, clay content and soil structure amongseveral other soil properties (Prescott, 2010).
Previous studies indicated that different tree species plantedwithin the same sites have different amounts of SOC, but the maindifference was found in forest floor C pools (Vesterdal et al., 2008).Soil C stocks are controlled by the balance between input of C bylitterfall and output of C by decomposition and associated hetero-trophic respiration. Tree species may affect both fluxes. The outputflux of C by respiration has mainly been attributed to differences inthe quality of litter (Borken et al., 2002) and specific climatic con-ditions under the canopy (Prescott, 2002). Previous research incommon garden experiments showed relatively similar above-ground litterfall inputs in different tree species at the same site(Vesterdal et al., 2008; Hansen et al., 2009; Trum et al., 2011),whereas litterfall to forest floor ratios differed widely. This sug-gests that the individual tree species would influence soil C stocksmore strongly via the litter quality effect on C turnover rate thanvia the magnitude of litterfall C inputs to the soil. Topsoil C mayalso be lost by leaching in the form of DOC (Kleja et al., 2008). Suchleaching fluxes may differ among tree species but are often of lim-ited magnitude (Fröberg et al., 2011).
Only few studies reported soil respiration and soil C turnover inreplicated stands of different tree species within similar climates(e.g. Borken et al., 2002; Ladegaard-Pedersen et al., 2005; Bergeret al., 2010), and even less studies addressed tree species effectson soil respiration and C turnover in replicated common gardenexperiments where the effect of confounding site-related factorscan be minimized (e.g. Reich et al., 2005). Raich and Tufekcioglu(2000) reviewed vegetation influence on soil respiration and foundan indication that broadleaf stands have higher respiration ratesthan paired conifer stands at the same site. However, the dataset was limited and their suggestion that higher litter quality inbroadleaves would lead to faster cycling of C has not been clearlydemonstrated. A more recent meta-analysis by Subke et al.(2006) found no significant difference in soil respiration betweentemperate coniferous and deciduous tree species, but this analysiswas not limited to paired sites and so included more site-relatedvariability. The lack of estimates of SOC dynamics in various tem-perate forest types is surprising compared to the need for green-house gas reporting for afforestation areas and forests in generalas well as the need for input to complete carbon accounting mod-els for forest ecosystems (Paul et al., 2003; Lindner and Karjalainen,2007). Results of such models have recently shown that lack ofinformation on specific site factors, processes as well as manage-ment practice information, are among the most critical unknownsin order to improve model predictions (de Wit et al., 2006;Peltoniemi et al., 2007).
We evaluated the effect of tree species on soil C turnover basedon soil C respiration, litter decomposition and potential C mineral-ization rates in six tree species (Norway spruce and five indigenousbroadleaved tree species) in a common garden design replicated atdifferent sites. This unique experiment allowed us to quantifywhether consistent differences had developed in soil C dynamicsafter more than 30 years below these six tree species across differ-ent site types. Specifically, the objectives were to evaluate (1) dif-ferences in total soil respiration rates under the six tree species, (2)environmental controls on in situ soil CO2 effluxes, and (3) indicesof soil C turnover and their relationships, and (4) influence of litterquality on soil C turnover for the six tree species. Based on earlierdocumented soil C stock differences (Vesterdal et al., 2008) and soilrespiration in similar climate (Ladegaard-Pedersen et al., 2005), wehypothesise that differences in litter chemistry (1) lead to slower Cturnover in Norway spruce than broadleaves, and (2) lead to
significant differences in soil respiration and C turnover evenwithin broadleaves which must be taken into account in modellingof soil C stock dynamics over decades.
2. Materials and methods
2.1. Common garden design
Soil respiration and rates of C turnover were evaluated in a com-mon garden design based on monoculture stands of six commonEuropean tree species; the broadleaves beech (Fagus sylvatica L.),pedunculate oak (Quercus robur L.), lime (Tilia cordata L.), sycamoremaple (Acer pseudoplatanus L.) and ash (Fraxinus excelsior L.) and theconifer Norway spruce (Picea abies (L.) Karst.). The common gardendesign was replicated at six sites (Table 1) but there was no repli-cation of tree species within each site, i.e. there was one stand ofeach species present in each site. The sites belonged to an experi-ment on productivity of various broadleaves established in 1973,except for the Kragelund site established in 1961. The common gar-den design was almost complete; at the Vallø site, the ash standwas missing as its establishment failed due to deer browsing.
Previous land use was beech forest except at Mattrup and Kra-gelund where stands were planted on former arable land. Climaticvariation is fairly limited within Denmark. Annual mean precipita-tion varied from 579 to 783 mm while annual mean temperatureranged from 7.5 to 8.1 �C. The sites have soils developed fromdeposits from the most recent glaciation and have been classifiedaccording to Soil Survey Staff (1998) as Hapludult (1), Hapludalfs(4) or Argiudoll (1) with coarse-loamy to fine-loamy texture andexcept for the Hapludult relatively high pH and base saturation.All stands are planted on almost level or weakly undulatingground. Individual tree species plots are on average 0.25 ha andhave been thinned approximately every fourth year since 1987.Stands were managed according to common practice of the forestdistrict. Mean stand characteristics for the six tree species at allsix sites are given in Vesterdal et al. (2008). Mean height rangedbetween 14.4 m (oak) and 18.9 m (Norway spruce) while totalwood production (thinnings and standing stock) ranged from 240(oak) to 519 m3 ha�1 (Norway spruce). Understory shrubs werepresent in oak, ash, lime, and maple stands along with some regen-eration of ash and beech. Vascular plant species were almost ab-sent in spruce due to low light availability, and lime and beechstands had a vascular plant cover of about 30%, whereas grassesand herbs were present in oak, maple and ash stands with a coverof about 50–60% (Hoffmann, 2007).
All six sites were used for basic characterization of C fluxes andpools while three to four of the six sites were employed for moreintensive studies of C fluxes and turnover rates.
2.2. Soil respiration in the field
Soil CO2 efflux was measured during a full year in stands of thesix species at three sites (Mattrup, Vallø and Wedellsborg) using aLiCor infrared gas analyzer (LiCor 6400-09/6262 Soil CO2 FluxChamber, LiCor, Lincoln, USA) equipped with a portable chamber,functioning as a dark and closed soil-efflux chamber (Elberlingand Brandt, 2003). The chamber was placed on top of open perma-nently installed collars for 2–3 min before measurement. Collars(9 cm high and 10 cm in diameter) were inserted 6 cm into the soilwith the remaining 3 cm above the forest floor surface. The CO2 ef-flux was calculated on the basis of a linear increase (n > 100,R2 > 0.95, P < 0.05) in chamber CO2 concentrations over time. Mea-surements were made on 10 replicate collars in each of the treespecies on a weekly basis at Vallø and on a monthly basis atMattrup and Wedellsborg from September 2004 through August
186 L. Vesterdal et al. / Forest Ecology and Management 264 (2012) 185–196

Author's personal copy
2005. Due to technical problems, measurements were not carriedout in July 2005 but were estimated based on tree species- andsite-specific temperature sensitivity functions and observed soiltemperatures in July 2005.
2.3. Temperature, soil moisture and leaf area index
The volumetric soil water content was monitored using hand-held Theta Probe, Soil Moisture Sensors (ML2x, Delta-T DevicesLtd., Cambridge, UK). Three readings of the near-surface soil watercontent (0–5 cm) and one manual reading of the soil temperature(5 cm) were made at the same time as soil CO2 efflux measure-ments for each of the LiCor collars at the Mattrup, Vallø and Wed-ellsborg sites. In addition, soil temperatures at 2 depths (5 and10 cm) were measured for the beech and Norway spruce standsat Vallø on a bihourly basis using TinyTag loggers (Gemini DataLoggers Ltd., Chichester, UK). Leaf area index (LAI) was measuredin the central part of each stand in July 2006 using a Li-COR LAI-2000 Plant Canopy Analyzer (Li-COR, Lincoln, Nebraska, USA).
2.4. Soil C turnover rate
The rate of annual soil C turnover was estimated for six treespecies at Vallø, Mattrup and Wedellsborg from the ratio betweenannual soil CO2 efflux and soil C stocks to different soil depths.First, soil CO2 effluxes were related to near-surface soil tempera-tures by applying a commonly used first-order exponential equa-tion of van‘t Hoff type (1) (Davidson et al., 2006):
Resp ¼ aebTðwhere Q10 ¼ eb10Þ ð1Þ
where Resp is the respiration rate (measured as in situ soil CO2 ef-flux), a and b are fitted parameters, T is measured soil temperatureand Q10 is the temperature sensitivity of respiration. The equationwas fit for each of the 17 stands. Finally, Resp was calculated on abi-hourly basis using site specific soil temperatures and summa-rised for the entire year to provide the annual CO2 efflux estimate.Estimated bi-hourly soil temperatures at Wedellsborg and Mattrupwere generated by multiplying the Vallø soil temperatures with theratio of Tsoil (Wedellsborg or Mattrup) to Tsoil(Vallø).
A general ratio between root and microbial respiration amongtree species was assumed in order to estimate the heterotrophiccomponent of measured soil CO2 effluxes. Heterotrophic respira-tion was assumed to be 54.2% of total soil respiration based onthe review soil respiration portioning studies in temperate forestsby Hanson et al. (2000). The rate of soil C turnover was estimated
from the ratio of estimated annual heterotrophic soil respiration tothe sum of forest floor mass and mineral soil C stocks to 5, 15 or30 cm, respectively, as reported by Vesterdal et al. (2008). It wasthus assumed that the main heterotrophic CO2 respiration fluxoriginated from these soil compartments.
2.5. Litter quality
Litterfall was collected monthly using 10 circular litter trapswith a diameter of 31 cm installed along two line transects. Tenlitterfall samples were pooled to one sample per stand at eachsampling occasion. Norway spruce litter and broadleaf litter werecollected through one full year (August 2004–July 2005) at Mattrupand Vallø. At the remaining four sites, litterfall was collected inbroadleaved species only from September through November2004 (three months) in campaigns to gauge the discrete foliar litter-fall event common to these broadleaved species (Vesterdal et al.,2008). Litterfall was dried at 55 �C and sorted in foliar and non-foliar litter before the samples (from 12 collection dates or 3 collec-tion dates) were pooled. Ground samples of foliar litterfall wereanalyzed for total C and N by dry combustion (Dumas method) ina Leco CSN 2000 Analyzer (Matejovic, 1993). Total contents of Ca,Mg, K, Mn and P were determined after microwave-assisted diges-tion in concentrated nitric acid, and the digests were subsequentlyanalyzed for total element contents by ICP-OES (Perkin Elmer Opti-ma 3000XL). Acid-detergent lignin contents were determined byproximate analysis (Van Soest and Robertson, 1985) by the WalloonAgricultural Research Centre, Gembloux, Belgium.
2.6. Fractional annual loss of forest floor C
The litterfall C flux and C content in the forest floor were as-sessed in all six tree species at all six sites and used to assess frac-tional annual losses of C from the forest floor under the assumptionof continuous foliar litterfall for spruce and discrete foliar litterfallevents for deciduous species (Olson, 1963). Forest floor C stocksand fractional annual loss were previously reported in Vesterdalet al. (2008).
2.7. Foliar litter decomposition
Decomposition of foliar litter of beech, lime, maple and oakwere studied for two years at the four sites Vallø, Odsherred, Kra-gelund and Viemose. Foliar litter was collected during October andNovember 2004 by placing fibre tissue on the ground. In December
Table 1Selected climate and soil properties at the six sites.
Site Location Precip.a,(mm year�1)
Annual temp,(�C)
Soil type(USDA)b
Clay,c
(%)Silt,(%)
Sand,(%)
pHCaCl2c BSe,
(%)Extr. Pc,(mg kg�1)
Previous landuse
Kragelund 56�100N,9�250E
703 7.5 ArenicHapludult
8 7 85 4.4 18 30 Agriculture
Mattrup 55�570N,9�380E
783 7.5 LamellicHapludalf
17 9 74 4.6 76 34 Agriculture
Odsherred 55�500N,11�420E
579 8.0 OxyaquicHapludalf
11 11 78 4.2 68 281 Beech
Vallø 55�250N,12�030E
625 7.7 OxyaquicHapludalf
17 13 70 5.4 98 187 Beech
Viemose 55�010N,12�090E
603 8.1 TypicHapludalf
25 20 55 4.4 84 77 Beech
Wedellsborg 55�240N,9�520E
658 7.8 OxyaquicArgiudoll
30 30 40 6.8 100 222 Beech
a Means 1961–1990 from nearby stations (Danish Meteorological Institute).b Soil classification is based on Soil Survey Staff (1998).c Clay: <2 l, silt: 2–20 l, sand: 20–2000 l. Extractable P: Unburnt soil sample in 0.1 M sulphuric acid for 2 h. BSe: base saturation calculated from unbuffered extraction of
cations in 1 M NH4NO3. Particle size distribution, pH, BSe, and extractable P are given as weighted values for the 50–100 cm layer.
L. Vesterdal et al. / Forest Ecology and Management 264 (2012) 185–196 187
Author's personal copy
2004, 2–4 g dw of foliar litter was enclosed in polyester litterbags(10 � 10 and 13 � 15 cm, mesh size 3 mm) and returned to thestands of litter origin. Litterbags were placed on the forest floorin five 1 � 1 m subplots randomly distributed within each stand.Two litterbags were sampled from each plot at four samplingdates. A total of 640 litterbags were used for the study (4 tree spe-cies � 4 sites � 4 sampling dates � 10 replicates). Litterbags werefastened to the forest floor by 10 cm long pins of high carbon steeland were collected in March 2005 (after 3 months), June 2005(6 months), December 2005 (1 year) and December 2006 (2 years).Litterbags were brought directly to the laboratory, where moss andmineral soil were removed. The contents were dried at 55 �C for48 h and weighed. Litterbag samples were analysed for C by anANCA system coupled to an isotopic-ratio mass spectrometer(20-20 IRMS, Europa Scientific Ltd., Crewe, UK). Rates of C release(year�1) from litterbags were estimated using an exponential de-cay model (Olson, 1963).
2.8. Basal respiration assay
Four replicate samples each composited from three subsampleswere collected from the top 5 cm of the mineral soil in each standfor measurements of potential heterotrophic soil respiration. Soilsamples were collected using a soil auger (Ø 4 cm) on 25–26 April2005 for Kragelund, Mattrup and Wedellsborg and 19 May 2005(Viemose), 26 May 2005 (Odsherred) and 31 May 2005 (Vallø). Inthe laboratory, visible roots and stones were manually removedand the three soil cores were mixed. Ten gram fresh soil wasweighted into a 250 ml Nalgene container for respiration. Basal soilrespiration rates were measured continuously with a conducto-metric soil respirometer (Chapman, 1971; Nordgren, 1988) at15 �C using a water bath. CO2 was captured in 10 ml 0.3 M KOHsolution, which was replaced weekly. The conductometer mea-sures the electrical resistance of the KOH solution every hour. An-other subsample of soil was used for correction of moisturecontent and for organic matter determination by loss on ignitionat 550 �C. The heterotrophic respiration in each sample was ex-pressed as mg C g C�1 d�1 (assuming 50% LOI as an approximationfor organic C content).
2.9. Statistics
In the analysis of soil respiration at the three studied sites,monthly measurements of soil respiration for each stand wereinterpreted as repeated measurements of the same experimentalunit. Therefore, the statistical analysis needs to accommodate forthe possible autocorrelation between soil respiration measure-ments in different months within the same stand. Effects of treespecies and site on soil respiration were consequently analysedby one-way repeated measures ANOVA with site as the block fac-tor. The common garden design was complete except for ash miss-ing at the Vallø site. In case of significant effects of tree species andsites, means were compared by the Tukey–Kramer procedure (avariant of Tukey HSD for unbalanced models).
Effects of tree species on temperatures, moisture, Q10, litterquality, C contents in soil pools and reactivity of soil C pools wereanalysed by one-way ANOVA with site as the block factor. Massloss for beech, oak, lime and maple foliar litter at four of the com-mon garden sites was analysed for each date of collection by one-way ANOVA with site as the block factor. The Tukey–Kramer pro-cedure was consequently used to detect significant differencesamong tree species means. Some variables were log transformed(soil C stocks and C turnover estimates based on the ratio betweenRh and C stocks) to fulfil the requirements of normally distributedresiduals and homogeneity of variances. As there was no replica-tion of tree species within site, the experimental design did not
enable analyses of possible interaction effects between tree speciesand site.
The effects of soil temperature and moisture on in situ soil CO2
effluxes at the Vallø site were tested by non-linear regression anal-ysis within each of the five tree species present (no ash stand).Exponential equations best modelled the relationships. Modelresiduals (observed minus predicted CO2 efflux) were subse-quently related to soil moisture content to test whether the unex-plained variation could be attributed to soil moisture.
Relationships between the C turnover indices were explored bysimple linear regression. Multiple regression analyses were subse-quently used to examine relationships between each C turnover in-dex and litter quality indices. Candidate models were sought usingtwo or three independent variables. The regression procedure(REG) was used with the adjusted-R-square (ADJRSQ) selectionmethod to identify the top models with two and three variables,respectively. Models with the fewest possible variables were givenpreference if all other factors were similar, i.e. only two- or threevariable models that improved the degree of explanation were pre-sented. All statistical tests were carried out using procedures GLM,NLIN and REG in SAS 9.2 (SAS Institute Inc., Cary, NC), and the ac-cepted level of significance was P < 0.05.
3. Results
3.1. In situ soil CO2 effluxes, temperature and moisture in the six treespecies at three sites
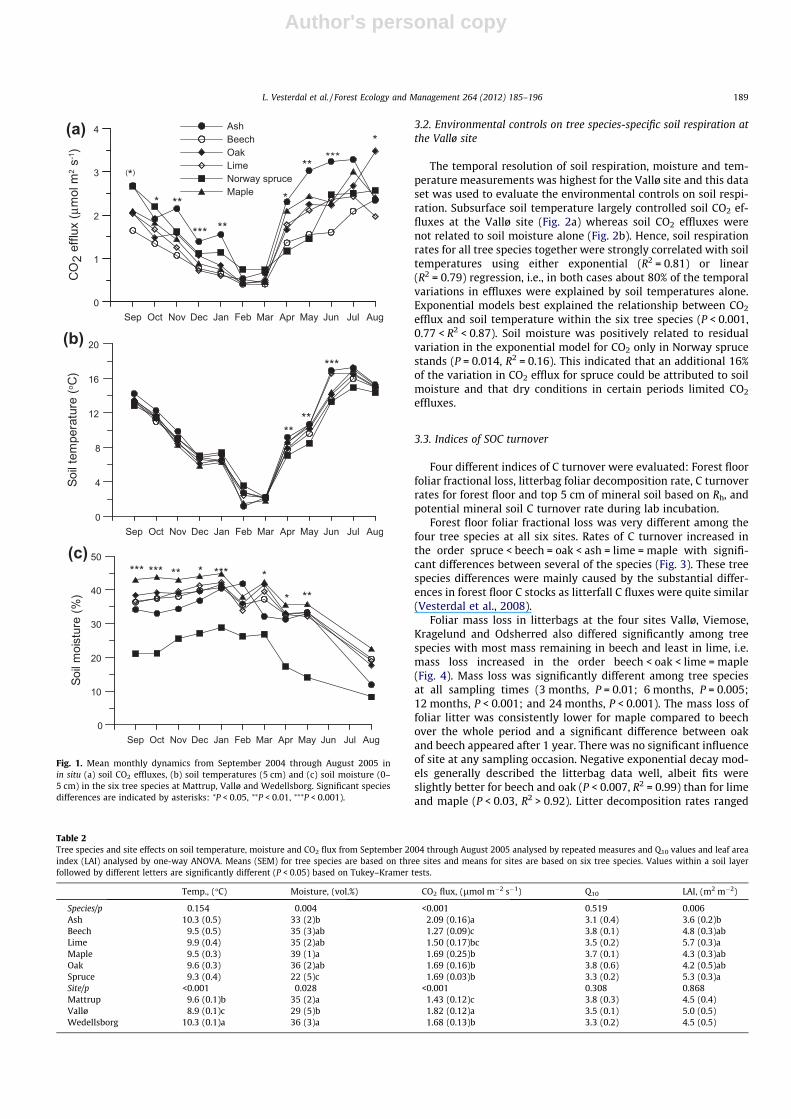
Mean soil CO2 effluxes differed significantly among tree speciesand sites over the year (Fig. 1a and Table 2) and increased in theorder beech < spruce = oak = maple < ash. Soil CO2 efflux in limewas only significantly lower than in ash. There were significantmonth x tree species interactions for CO2 efflux (P < 0.001), indicat-ing inconsistency in tree species differences during the year. SoilCO2 effluxes differed significantly among tree species in mostmonths except the two coldest months, February and March. Theranking of tree species according to respiration rate differed fromthe annual average pattern in August, September and October;oak had the highest respiration rate in August, and Norway sprucehad high respiration rates in September and October (Fig. 1a).Within growing (May–October) and dormant (November–April)seasons, repeated measures analysis showed nearly the same spe-cies differences in soil CO2 effluxes as over the whole year. Amongsites, annual mean CO2 effluxes increased in the order Matt-rup < Wedellsborg < Vallø. Q10 values were between 3.1 and 3.8and were not significantly different among tree species or sites(Table 2).
Soil temperatures did not differ significantly among tree speciesin the repeated measures analysis over the whole year (Fig. 1b, Ta-ble 2), but soil temperature increased in the order Vallø <Mattrup < Wedellsborg. There was, however, a tree spe-cies �month interaction effect (P < 0.001); species differenceswere significant only during April–June with lower soil tempera-ture in spruce than in all broadleaved stands (Fig. 1b).
Soil moisture (5 cm depth) differed significantly among treespecies with lowest soil moisture in spruce stands during the year(Table 2). Ash stands also had lower soil moisture than maplestands. The pattern in soil moisture was fairly consistent duringthe year (Fig. 1c) with only a minor month � tree species interac-tion (P = 0.03).
Leaf area index (LAI) was significantly higher in Norway spruceand lime than in ash stands while LAI values were intermediate inthe remaining species (Table 2). This indicates highest light trans-mittance under the canopy of ash. There was no effect of site onLAI.
188 L. Vesterdal et al. / Forest Ecology and Management 264 (2012) 185–196
Author's personal copy
3.2. Environmental controls on tree species-specific soil respiration atthe Vallø site
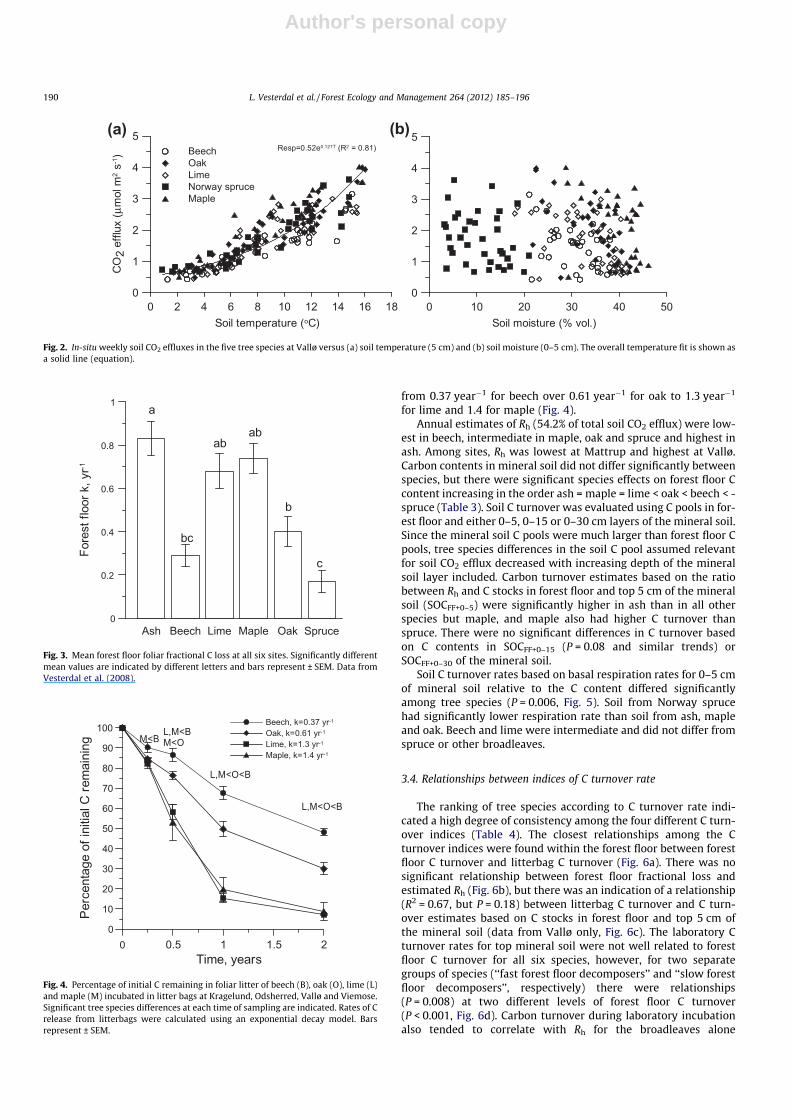
The temporal resolution of soil respiration, moisture and tem-perature measurements was highest for the Vallø site and this dataset was used to evaluate the environmental controls on soil respi-ration. Subsurface soil temperature largely controlled soil CO2 ef-fluxes at the Vallø site (Fig. 2a) whereas soil CO2 effluxes werenot related to soil moisture alone (Fig. 2b). Hence, soil respirationrates for all tree species together were strongly correlated with soiltemperatures using either exponential (R2 = 0.81) or linear(R2 = 0.79) regression, i.e., in both cases about 80% of the temporalvariations in effluxes were explained by soil temperatures alone.Exponential models best explained the relationship between CO2
efflux and soil temperature within the six tree species (P < 0.001,0.77 < R2 < 0.87). Soil moisture was positively related to residualvariation in the exponential model for CO2 only in Norway sprucestands (P = 0.014, R2 = 0.16). This indicated that an additional 16%of the variation in CO2 efflux for spruce could be attributed to soilmoisture and that dry conditions in certain periods limited CO2
effluxes.
3.3. Indices of SOC turnover
Four different indices of C turnover were evaluated: Forest floorfoliar fractional loss, litterbag foliar decomposition rate, C turnoverrates for forest floor and top 5 cm of mineral soil based on Rh, andpotential mineral soil C turnover rate during lab incubation.
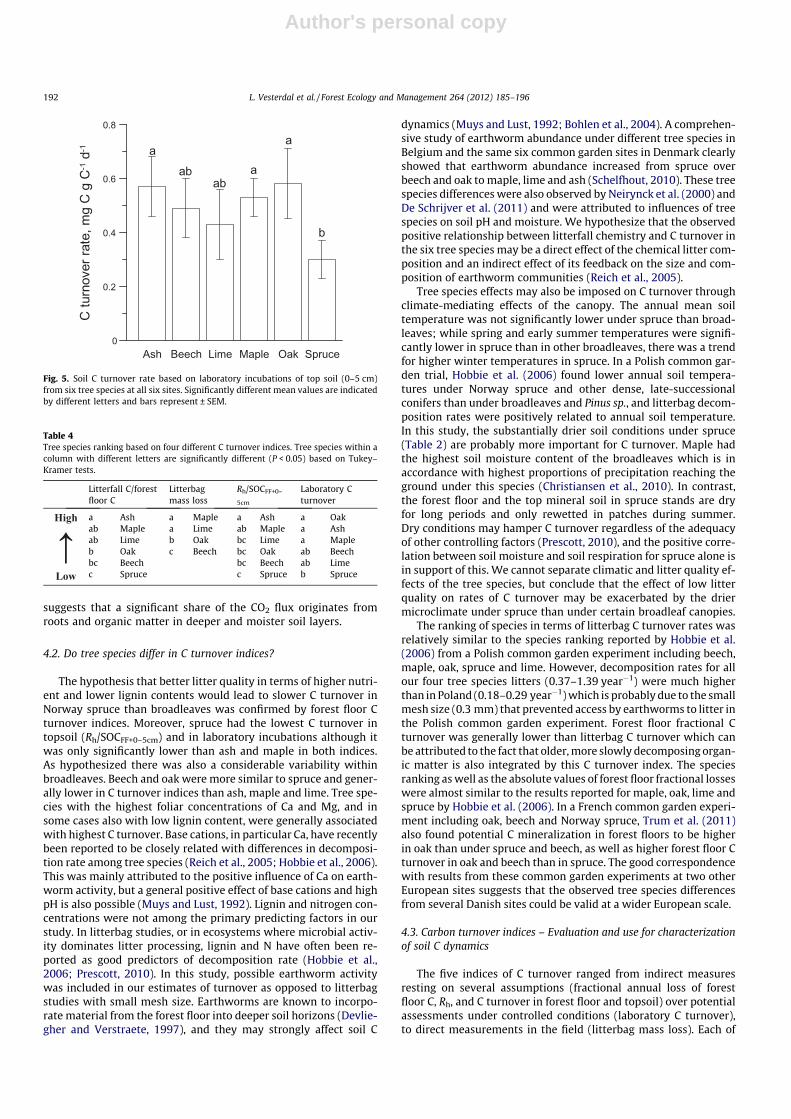
Forest floor foliar fractional loss was very different among thefour tree species at all six sites. Rates of C turnover increased inthe order spruce < beech = oak < ash = lime = maple with signifi-cant differences between several of the species (Fig. 3). These treespecies differences were mainly caused by the substantial differ-ences in forest floor C stocks as litterfall C fluxes were quite similar(Vesterdal et al., 2008).
Foliar mass loss in litterbags at the four sites Vallø, Viemose,Kragelund and Odsherred also differed significantly among treespecies with most mass remaining in beech and least in lime, i.e.mass loss increased in the order beech < oak < lime = maple(Fig. 4). Mass loss was significantly different among tree speciesat all sampling times (3 months, P = 0.01; 6 months, P = 0.005;12 months, P < 0.001; and 24 months, P < 0.001). The mass loss offoliar litter was consistently lower for maple compared to beechover the whole period and a significant difference between oakand beech appeared after 1 year. There was no significant influenceof site at any sampling occasion. Negative exponential decay mod-els generally described the litterbag data well, albeit fits wereslightly better for beech and oak (P < 0.007, R2 = 0.99) than for limeand maple (P < 0.03, R2 > 0.92). Litter decomposition rates ranged
0
1
2
3
4
CO
2 ef
flux
( µm
ol m
2 s-1)
Sep Oct Nov Dec Jan Feb Mar Apr May Jun Jul Aug
AshBeechOakLimeNorway spruceMaple
* **
*** **
*
*****
*
(*)
0
4
8
12
16
20
Soil
tem
pera
ture
(o C)
Sep Oct Nov Dec Jan Feb Mar Apr May Jun Jul Aug
****
***
0
10
20
30
40
50
Soil
moi
stur
e (%
)
Sep Oct Nov Dec Jan Feb Mar Apr May Jun Jul Aug
*** *** ** * *** *
* **
(c)
(b)
(a)
Fig. 1. Mean monthly dynamics from September 2004 through August 2005 inin situ (a) soil CO2 effluxes, (b) soil temperatures (5 cm) and (c) soil moisture (0–5 cm) in the six tree species at Mattrup, Vallø and Wedellsborg. Significant speciesdifferences are indicated by asterisks: ⁄P < 0.05, ⁄⁄P < 0.01, ⁄⁄⁄P < 0.001).
Table 2Tree species and site effects on soil temperature, moisture and CO2 flux from September 2004 through August 2005 analysed by repeated measures and Q10 values and leaf areaindex (LAI) analysed by one-way ANOVA. Means (SEM) for tree species are based on three sites and means for sites are based on six tree species. Values within a soil layerfollowed by different letters are significantly different (P < 0.05) based on Tukey–Kramer tests.
Temp., (�C) Moisture, (vol.%) CO2 flux, (lmol m�2 s�1) Q10 LAI, (m2 m�2)
Species/p 0.154 0.004 <0.001 0.519 0.006Ash 10.3 (0.5) 33 (2)b 2.09 (0.16)a 3.1 (0.4) 3.6 (0.2)bBeech 9.5 (0.5) 35 (3)ab 1.27 (0.09)c 3.8 (0.1) 4.8 (0.3)abLime 9.9 (0.4) 35 (2)ab 1.50 (0.17)bc 3.5 (0.2) 5.7 (0.3)aMaple 9.5 (0.3) 39 (1)a 1.69 (0.25)b 3.7 (0.1) 4.3 (0.3)abOak 9.6 (0.3) 36 (2)ab 1.69 (0.16)b 3.8 (0.6) 4.2 (0.5)abSpruce 9.3 (0.4) 22 (5)c 1.69 (0.03)b 3.3 (0.2) 5.3 (0.3)aSite/p <0.001 0.028 <0.001 0.308 0.868Mattrup 9.6 (0.1)b 35 (2)a 1.43 (0.12)c 3.8 (0.3) 4.5 (0.4)Vallø 8.9 (0.1)c 29 (5)b 1.82 (0.12)a 3.5 (0.1) 5.0 (0.5)Wedellsborg 10.3 (0.1)a 36 (3)a 1.68 (0.13)b 3.3 (0.2) 4.5 (0.5)
L. Vesterdal et al. / Forest Ecology and Management 264 (2012) 185–196 189
Author's personal copy
from 0.37 year�1 for beech over 0.61 year�1 for oak to 1.3 year�1
for lime and 1.4 for maple (Fig. 4).Annual estimates of Rh (54.2% of total soil CO2 efflux) were low-
est in beech, intermediate in maple, oak and spruce and highest inash. Among sites, Rh was lowest at Mattrup and highest at Vallø.Carbon contents in mineral soil did not differ significantly betweenspecies, but there were significant species effects on forest floor Ccontent increasing in the order ash = maple = lime < oak < beech < -spruce (Table 3). Soil C turnover was evaluated using C pools in for-est floor and either 0–5, 0–15 or 0–30 cm layers of the mineral soil.Since the mineral soil C pools were much larger than forest floor Cpools, tree species differences in the soil C pool assumed relevantfor soil CO2 efflux decreased with increasing depth of the mineralsoil layer included. Carbon turnover estimates based on the ratiobetween Rh and C stocks in forest floor and top 5 cm of the mineralsoil (SOCFF+0–5) were significantly higher in ash than in all otherspecies but maple, and maple also had higher C turnover thanspruce. There were no significant differences in C turnover basedon C contents in SOCFF+0–15 (P = 0.08 and similar trends) orSOCFF+0–30 of the mineral soil.
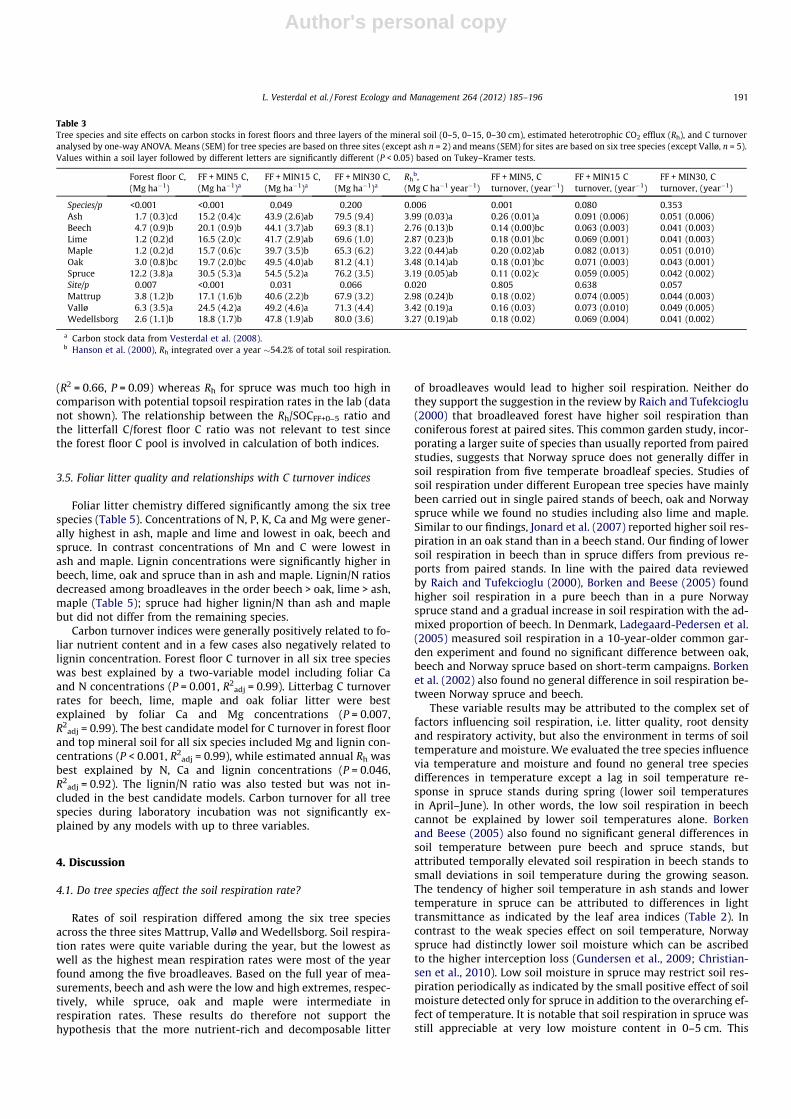
Soil C turnover rates based on basal respiration rates for 0–5 cmof mineral soil relative to the C content differed significantlyamong tree species (P = 0.006, Fig. 5). Soil from Norway sprucehad significantly lower respiration rate than soil from ash, mapleand oak. Beech and lime were intermediate and did not differ fromspruce or other broadleaves.
3.4. Relationships between indices of C turnover rate
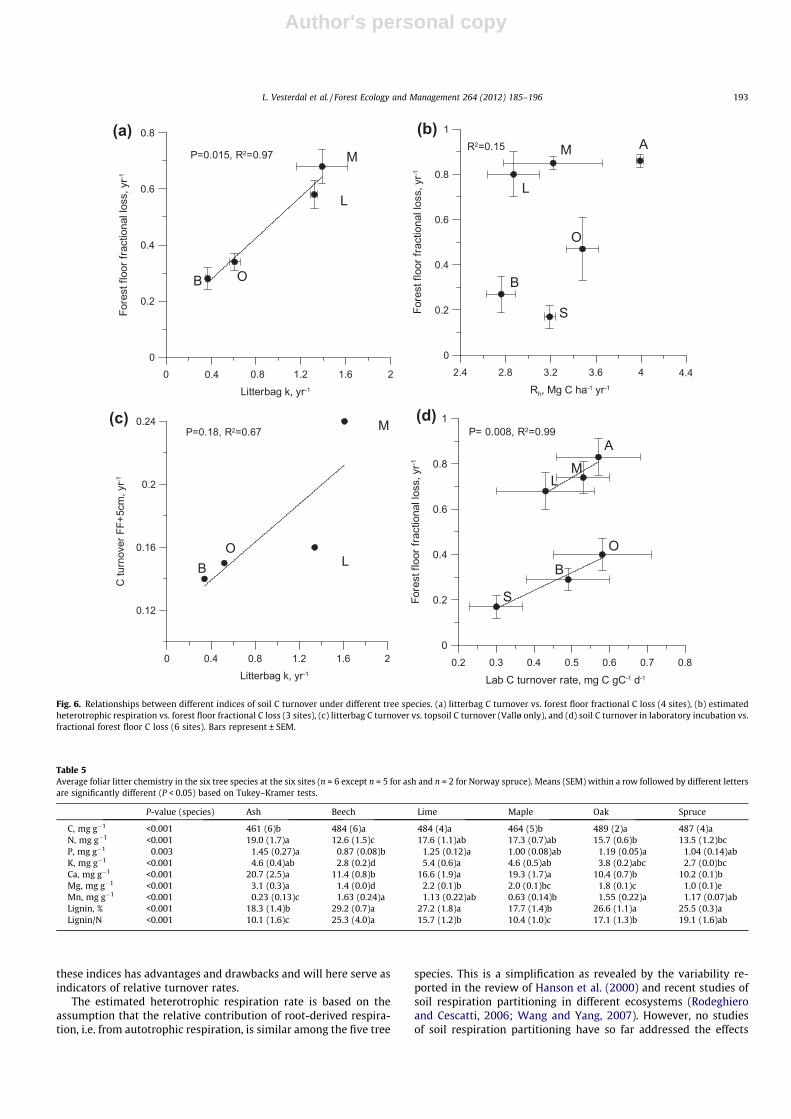
The ranking of tree species according to C turnover rate indi-cated a high degree of consistency among the four different C turn-over indices (Table 4). The closest relationships among the Cturnover indices were found within the forest floor between forestfloor C turnover and litterbag C turnover (Fig. 6a). There was nosignificant relationship between forest floor fractional loss andestimated Rh (Fig. 6b), but there was an indication of a relationship(R2 = 0.67, but P = 0.18) between litterbag C turnover and C turn-over estimates based on C stocks in forest floor and top 5 cm ofthe mineral soil (data from Vallø only, Fig. 6c). The laboratory Cturnover rates for top mineral soil were not well related to forestfloor C turnover for all six species, however, for two separategroups of species (‘‘fast forest floor decomposers’’ and ‘‘slow forestfloor decomposers’’, respectively) there were relationships(P = 0.008) at two different levels of forest floor C turnover(P < 0.001, Fig. 6d). Carbon turnover during laboratory incubationalso tended to correlate with Rh for the broadleaves alone
0 2 4 6 8 10 12 14 16 18Soil temperature (oC)
0
1
2
3
4
5
CO
2 ef
flux
( µm
ol m
2 s-1)
(a)BeechOakLimeNorway spruceMaple
Resp=0.52e0.127T (R2 = 0.81)
0 10 20 30 40 50Soil moisture (% vol.)
0
1
2
3
4
5(b)
Fig. 2. In-situ weekly soil CO2 effluxes in the five tree species at Vallø versus (a) soil temperature (5 cm) and (b) soil moisture (0–5 cm). The overall temperature fit is shown asa solid line (equation).
0
0.2
0.4
0.6
0.8
1
Fore
st fl
oor k
, yr-1
Ash Beech Lime Maple Oak Spruce
bc
a
abab
b
c
Fig. 3. Mean forest floor foliar fractional C loss at all six sites. Significantly differentmean values are indicated by different letters and bars represent ± SEM. Data fromVesterdal et al. (2008).
0 0.5 1 1.5 2Time, years
0
10
20
30
40
50
60
70
80
90
100
Perc
enta
ge o
f ini
tial C
rem
aini
ng M<BL,M<BM<O
L,M<O<B
L,M<O<B
Beech, k=0.37 yr-1
Oak, k=0.61 yr-1
Lime, k=1.3 yr-1
Maple, k=1.4 yr-1
Fig. 4. Percentage of initial C remaining in foliar litter of beech (B), oak (O), lime (L)and maple (M) incubated in litter bags at Kragelund, Odsherred, Vallø and Viemose.Significant tree species differences at each time of sampling are indicated. Rates of Crelease from litterbags were calculated using an exponential decay model. Barsrepresent ± SEM.
190 L. Vesterdal et al. / Forest Ecology and Management 264 (2012) 185–196
Author's personal copy
(R2 = 0.66, P = 0.09) whereas Rh for spruce was much too high incomparison with potential topsoil respiration rates in the lab (datanot shown). The relationship between the Rh/SOCFF+0–5 ratio andthe litterfall C/forest floor C ratio was not relevant to test sincethe forest floor C pool is involved in calculation of both indices.
3.5. Foliar litter quality and relationships with C turnover indices
Foliar litter chemistry differed significantly among the six treespecies (Table 5). Concentrations of N, P, K, Ca and Mg were gener-ally highest in ash, maple and lime and lowest in oak, beech andspruce. In contrast concentrations of Mn and C were lowest inash and maple. Lignin concentrations were significantly higher inbeech, lime, oak and spruce than in ash and maple. Lignin/N ratiosdecreased among broadleaves in the order beech > oak, lime > ash,maple (Table 5); spruce had higher lignin/N than ash and maplebut did not differ from the remaining species.
Carbon turnover indices were generally positively related to fo-liar nutrient content and in a few cases also negatively related tolignin concentration. Forest floor C turnover in all six tree specieswas best explained by a two-variable model including foliar Caand N concentrations (P = 0.001, R2
adj = 0.99). Litterbag C turnoverrates for beech, lime, maple and oak foliar litter were bestexplained by foliar Ca and Mg concentrations (P = 0.007,R2
adj = 0.99). The best candidate model for C turnover in forest floorand top mineral soil for all six species included Mg and lignin con-centrations (P < 0.001, R2
adj = 0.99), while estimated annual Rh wasbest explained by N, Ca and lignin concentrations (P = 0.046,R2
adj = 0.92). The lignin/N ratio was also tested but was not in-cluded in the best candidate models. Carbon turnover for all treespecies during laboratory incubation was not significantly ex-plained by any models with up to three variables.
4. Discussion
4.1. Do tree species affect the soil respiration rate?
Rates of soil respiration differed among the six tree speciesacross the three sites Mattrup, Vallø and Wedellsborg. Soil respira-tion rates were quite variable during the year, but the lowest aswell as the highest mean respiration rates were most of the yearfound among the five broadleaves. Based on the full year of mea-surements, beech and ash were the low and high extremes, respec-tively, while spruce, oak and maple were intermediate inrespiration rates. These results do therefore not support thehypothesis that the more nutrient-rich and decomposable litter
of broadleaves would lead to higher soil respiration. Neither dothey support the suggestion in the review by Raich and Tufekcioglu(2000) that broadleaved forest have higher soil respiration thanconiferous forest at paired sites. This common garden study, incor-porating a larger suite of species than usually reported from pairedstudies, suggests that Norway spruce does not generally differ insoil respiration from five temperate broadleaf species. Studies ofsoil respiration under different European tree species have mainlybeen carried out in single paired stands of beech, oak and Norwayspruce while we found no studies including also lime and maple.Similar to our findings, Jonard et al. (2007) reported higher soil res-piration in an oak stand than in a beech stand. Our finding of lowersoil respiration in beech than in spruce differs from previous re-ports from paired stands. In line with the paired data reviewedby Raich and Tufekcioglu (2000), Borken and Beese (2005) foundhigher soil respiration in a pure beech than in a pure Norwayspruce stand and a gradual increase in soil respiration with the ad-mixed proportion of beech. In Denmark, Ladegaard-Pedersen et al.(2005) measured soil respiration in a 10-year-older common gar-den experiment and found no significant difference between oak,beech and Norway spruce based on short-term campaigns. Borkenet al. (2002) also found no general difference in soil respiration be-tween Norway spruce and beech.
These variable results may be attributed to the complex set offactors influencing soil respiration, i.e. litter quality, root densityand respiratory activity, but also the environment in terms of soiltemperature and moisture. We evaluated the tree species influencevia temperature and moisture and found no general tree speciesdifferences in temperature except a lag in soil temperature re-sponse in spruce stands during spring (lower soil temperaturesin April–June). In other words, the low soil respiration in beechcannot be explained by lower soil temperatures alone. Borkenand Beese (2005) also found no significant general differences insoil temperature between pure beech and spruce stands, butattributed temporally elevated soil respiration in beech stands tosmall deviations in soil temperature during the growing season.The tendency of higher soil temperature in ash stands and lowertemperature in spruce can be attributed to differences in lighttransmittance as indicated by the leaf area indices (Table 2). Incontrast to the weak species effect on soil temperature, Norwayspruce had distinctly lower soil moisture which can be ascribedto the higher interception loss (Gundersen et al., 2009; Christian-sen et al., 2010). Low soil moisture in spruce may restrict soil res-piration periodically as indicated by the small positive effect of soilmoisture detected only for spruce in addition to the overarching ef-fect of temperature. It is notable that soil respiration in spruce wasstill appreciable at very low moisture content in 0–5 cm. This
Table 3Tree species and site effects on carbon stocks in forest floors and three layers of the mineral soil (0–5, 0–15, 0–30 cm), estimated heterotrophic CO2 efflux (Rh), and C turnoveranalysed by one-way ANOVA. Means (SEM) for tree species are based on three sites (except ash n = 2) and means (SEM) for sites are based on six tree species (except Vallø, n = 5).Values within a soil layer followed by different letters are significantly different (P < 0.05) based on Tukey–Kramer tests.
Forest floor C,(Mg ha�1)
FF + MIN5 C,(Mg ha�1)a
FF + MIN15 C,(Mg ha�1)a
FF + MIN30 C,(Mg ha�1)a
Rhb,
(Mg C ha�1 year�1)FF + MIN5, Cturnover, (year�1)
FF + MIN15 Cturnover, (year�1)
FF + MIN30, Cturnover, (year�1)
Species/p <0.001 <0.001 0.049 0.200 0.006 0.001 0.080 0.353Ash 1.7 (0.3)cd 15.2 (0.4)c 43.9 (2.6)ab 79.5 (9.4) 3.99 (0.03)a 0.26 (0.01)a 0.091 (0.006) 0.051 (0.006)Beech 4.7 (0.9)b 20.1 (0.9)b 44.1 (3.7)ab 69.3 (8.1) 2.76 (0.13)b 0.14 (0.00)bc 0.063 (0.003) 0.041 (0.003)Lime 1.2 (0.2)d 16.5 (2.0)c 41.7 (2.9)ab 69.6 (1.0) 2.87 (0.23)b 0.18 (0.01)bc 0.069 (0.001) 0.041 (0.003)Maple 1.2 (0.2)d 15.7 (0.6)c 39.7 (3.5)b 65.3 (6.2) 3.22 (0.44)ab 0.20 (0.02)ab 0.082 (0.013) 0.051 (0.010)Oak 3.0 (0.8)bc 19.7 (2.0)bc 49.5 (4.0)ab 81.2 (4.1) 3.48 (0.14)ab 0.18 (0.01)bc 0.071 (0.003) 0.043 (0.001)Spruce 12.2 (3.8)a 30.5 (5.3)a 54.5 (5.2)a 76.2 (3.5) 3.19 (0.05)ab 0.11 (0.02)c 0.059 (0.005) 0.042 (0.002)Site/p 0.007 <0.001 0.031 0.066 0.020 0.805 0.638 0.057Mattrup 3.8 (1.2)b 17.1 (1.6)b 40.6 (2.2)b 67.9 (3.2) 2.98 (0.24)b 0.18 (0.02) 0.074 (0.005) 0.044 (0.003)Vallø 6.3 (3.5)a 24.5 (4.2)a 49.2 (4.6)a 71.3 (4.4) 3.42 (0.19)a 0.16 (0.03) 0.073 (0.010) 0.049 (0.005)Wedellsborg 2.6 (1.1)b 18.8 (1.7)b 47.8 (1.9)ab 80.0 (3.6) 3.27 (0.19)ab 0.18 (0.02) 0.069 (0.004) 0.041 (0.002)
a Carbon stock data from Vesterdal et al. (2008).b Hanson et al. (2000), Rh integrated over a year �54.2% of total soil respiration.
L. Vesterdal et al. / Forest Ecology and Management 264 (2012) 185–196 191
Author's personal copy
suggests that a significant share of the CO2 flux originates fromroots and organic matter in deeper and moister soil layers.
4.2. Do tree species differ in C turnover indices?
The hypothesis that better litter quality in terms of higher nutri-ent and lower lignin contents would lead to slower C turnover inNorway spruce than broadleaves was confirmed by forest floor Cturnover indices. Moreover, spruce had the lowest C turnover intopsoil (Rh/SOCFF+0–5cm) and in laboratory incubations although itwas only significantly lower than ash and maple in both indices.As hypothesized there was also a considerable variability withinbroadleaves. Beech and oak were more similar to spruce and gener-ally lower in C turnover indices than ash, maple and lime. Tree spe-cies with the highest foliar concentrations of Ca and Mg, and insome cases also with low lignin content, were generally associatedwith highest C turnover. Base cations, in particular Ca, have recentlybeen reported to be closely related with differences in decomposi-tion rate among tree species (Reich et al., 2005; Hobbie et al., 2006).This was mainly attributed to the positive influence of Ca on earth-worm activity, but a general positive effect of base cations and highpH is also possible (Muys and Lust, 1992). Lignin and nitrogen con-centrations were not among the primary predicting factors in ourstudy. In litterbag studies, or in ecosystems where microbial activ-ity dominates litter processing, lignin and N have often been re-ported as good predictors of decomposition rate (Hobbie et al.,2006; Prescott, 2010). In this study, possible earthworm activitywas included in our estimates of turnover as opposed to litterbagstudies with small mesh size. Earthworms are known to incorpo-rate material from the forest floor into deeper soil horizons (Devlie-gher and Verstraete, 1997), and they may strongly affect soil C
dynamics (Muys and Lust, 1992; Bohlen et al., 2004). A comprehen-sive study of earthworm abundance under different tree species inBelgium and the same six common garden sites in Denmark clearlyshowed that earthworm abundance increased from spruce overbeech and oak to maple, lime and ash (Schelfhout, 2010). These treespecies differences were also observed by Neirynck et al. (2000) andDe Schrijver et al. (2011) and were attributed to influences of treespecies on soil pH and moisture. We hypothesize that the observedpositive relationship between litterfall chemistry and C turnover inthe six tree species may be a direct effect of the chemical litter com-position and an indirect effect of its feedback on the size and com-position of earthworm communities (Reich et al., 2005).
Tree species effects may also be imposed on C turnover throughclimate-mediating effects of the canopy. The annual mean soiltemperature was not significantly lower under spruce than broad-leaves; while spring and early summer temperatures were signifi-cantly lower in spruce than in other broadleaves, there was a trendfor higher winter temperatures in spruce. In a Polish common gar-den trial, Hobbie et al. (2006) found lower annual soil tempera-tures under Norway spruce and other dense, late-successionalconifers than under broadleaves and Pinus sp., and litterbag decom-position rates were positively related to annual soil temperature.In this study, the substantially drier soil conditions under spruce(Table 2) are probably more important for C turnover. Maple hadthe highest soil moisture content of the broadleaves which is inaccordance with highest proportions of precipitation reaching theground under this species (Christiansen et al., 2010). In contrast,the forest floor and the top mineral soil in spruce stands are dryfor long periods and only rewetted in patches during summer.Dry conditions may hamper C turnover regardless of the adequacyof other controlling factors (Prescott, 2010), and the positive corre-lation between soil moisture and soil respiration for spruce alone isin support of this. We cannot separate climatic and litter quality ef-fects of the tree species, but conclude that the effect of low litterquality on rates of C turnover may be exacerbated by the driermicroclimate under spruce than under certain broadleaf canopies.
The ranking of species in terms of litterbag C turnover rates wasrelatively similar to the species ranking reported by Hobbie et al.(2006) from a Polish common garden experiment including beech,maple, oak, spruce and lime. However, decomposition rates for allour four tree species litters (0.37–1.39 year�1) were much higherthan in Poland (0.18–0.29 year�1) which is probably due to the smallmesh size (0.3 mm) that prevented access by earthworms to litter inthe Polish common garden experiment. Forest floor fractional Cturnover was generally lower than litterbag C turnover which canbe attributed to the fact that older, more slowly decomposing organ-ic matter is also integrated by this C turnover index. The speciesranking as well as the absolute values of forest floor fractional losseswere almost similar to the results reported for maple, oak, lime andspruce by Hobbie et al. (2006). In a French common garden experi-ment including oak, beech and Norway spruce, Trum et al. (2011)also found potential C mineralization in forest floors to be higherin oak than under spruce and beech, as well as higher forest floor Cturnover in oak and beech than in spruce. The good correspondencewith results from these common garden experiments at two otherEuropean sites suggests that the observed tree species differencesfrom several Danish sites could be valid at a wider European scale.
4.3. Carbon turnover indices – Evaluation and use for characterizationof soil C dynamics
The five indices of C turnover ranged from indirect measuresresting on several assumptions (fractional annual loss of forestfloor C, Rh, and C turnover in forest floor and topsoil) over potentialassessments under controlled conditions (laboratory C turnover),to direct measurements in the field (litterbag mass loss). Each of
0
0.2
0.4
0.6
0.8
C tu
rnov
er ra
te, m
g C
g C
-1 d
-1
Ash Beech Lime Maple Oak Spruce
aa
b
abab
a
Fig. 5. Soil C turnover rate based on laboratory incubations of top soil (0–5 cm)from six tree species at all six sites. Significantly different mean values are indicatedby different letters and bars represent ± SEM.
Table 4Tree species ranking based on four different C turnover indices. Tree species within acolumn with different letters are significantly different (P < 0.05) based on Tukey–Kramer tests.
Litterfall C/forestfloor C
Litterbagmass loss
Rh/SOCFF+0–
5cm
Laboratory Cturnover
a Ash a Maple a Ash a Oakab Maple a Lime ab Maple a Ashab Lime b Oak bc Lime a Mapleb Oak c Beech bc Oak ab Beechbc Beech bc Beech ab Limec Spruce c Spruce b Spruce
192 L. Vesterdal et al. / Forest Ecology and Management 264 (2012) 185–196
Author's personal copy
these indices has advantages and drawbacks and will here serve asindicators of relative turnover rates.
The estimated heterotrophic respiration rate is based on theassumption that the relative contribution of root-derived respira-tion, i.e. from autotrophic respiration, is similar among the five tree
species. This is a simplification as revealed by the variability re-ported in the review of Hanson et al. (2000) and recent studies ofsoil respiration partitioning in different ecosystems (Rodeghieroand Cescatti, 2006; Wang and Yang, 2007). However, no studiesof soil respiration partitioning have so far addressed the effects
0.2 0.3 0.4 0.5 0.6 0.7 0.8
Lab C turnover rate, mg C gC-1 d-1
0
0.2
0.4
0.6
0.8
1Fo
rest
floo
r fra
ctio
nal l
oss,
yr-1
B
O
LM
S
AP= 0.008, R2=0.99
2.4 2.8 3.2 3.6 4 4.4Rh, Mg C ha-1 yr-1
0
0.2
0.4
0.6
0.8
1
Fore
st fl
oor f
ract
iona
l los
s, y
r-1
B
O
L
MR2=0.15
S
A
0 0.4 0.8 1.2 1.6 2Litterbag k, yr-1
0.12
0.16
0.2
0.24
C tu
rnov
er F
F+5c
m, y
r-1
BO
M
L
P=0.18, R2=0.67
0 0.4 0.8 1.2 1.6 2
Litterbag k, yr-1
0
0.2
0.4
0.6
0.8Fo
rest
floo
r fra
ctio
nal l
oss,
yr-1
P=0.015, R2=0.97
B O
M
L
(a) (b)
(d)(c)
Fig. 6. Relationships between different indices of soil C turnover under different tree species. (a) litterbag C turnover vs. forest floor fractional C loss (4 sites), (b) estimatedheterotrophic respiration vs. forest floor fractional C loss (3 sites), (c) litterbag C turnover vs. topsoil C turnover (Vallø only), and (d) soil C turnover in laboratory incubation vs.fractional forest floor C loss (6 sites). Bars represent ± SEM.
Table 5Average foliar litter chemistry in the six tree species at the six sites (n = 6 except n = 5 for ash and n = 2 for Norway spruce). Means (SEM) within a row followed by different lettersare significantly different (P < 0.05) based on Tukey–Kramer tests.
P-value (species) Ash Beech Lime Maple Oak Spruce
C, mg g�1 <0.001 461 (6)b 484 (6)a 484 (4)a 464 (5)b 489 (2)a 487 (4)aN, mg g�1 <0.001 19.0 (1.7)a 12.6 (1.5)c 17.6 (1.1)ab 17.3 (0.7)ab 15.7 (0.6)b 13.5 (1.2)bcP, mg g�1 0.003 1.45 (0.27)a 0.87 (0.08)b 1.25 (0.12)a 1.00 (0.08)ab 1.19 (0.05)a 1.04 (0.14)abK, mg g�1 <0.001 4.6 (0.4)ab 2.8 (0.2)d 5.4 (0.6)a 4.6 (0.5)ab 3.8 (0.2)abc 2.7 (0.0)bcCa, mg g�1 <0.001 20.7 (2.5)a 11.4 (0.8)b 16.6 (1.9)a 19.3 (1.7)a 10.4 (0.7)b 10.2 (0.1)bMg, mg g�1 <0.001 3.1 (0.3)a 1.4 (0.0)d 2.2 (0.1)b 2.0 (0.1)bc 1.8 (0.1)c 1.0 (0.1)eMn, mg g�1 <0.001 0.23 (0.13)c 1.63 (0.24)a 1.13 (0.22)ab 0.63 (0.14)b 1.55 (0.22)a 1.17 (0.07)abLignin, % <0.001 18.3 (1.4)b 29.2 (0.7)a 27.2 (1.8)a 17.7 (1.4)b 26.6 (1.1)a 25.5 (0.3)aLignin/N <0.001 10.1 (1.6)c 25.3 (4.0)a 15.7 (1.2)b 10.4 (1.0)c 17.1 (1.3)b 19.1 (1.6)ab
L. Vesterdal et al. / Forest Ecology and Management 264 (2012) 185–196 193
Author's personal copy
of the studied six tree species under more controlled common gar-den conditions. The assumed relative contribution of heterotrophicrespiration of around 50% is also in line with the meta-analyticalreview by Subke et al. (2006) who also found no significant differ-ence between temperate coniferous and deciduous tree species.Soil C turnover rates based on the ratio between heterotrophic res-piration and the topsoil C pool decreases with an increasing soil Cpool included in the estimate (Table 3). In this case we focusedmainly on C in the forest floor and the 0–5 cm layer of mineral soilas the primary C pools contributing to heterotrophic CO2 effluxes.The mineral soil (SOM and roots) often contributes the most to to-tal soil respiration; e.g. Borken and Beese (2005) and Berger et al.(2010) found that forest floors contributed 31–45% and 11–32%of total soil respiration in beech and spruce stands, respectively.We expect that the relative contribution of forest floors to hetero-trophic respiration is larger, so the SOCFF+0–5 pool covered the mostactive SOM.
The ranking of tree species according to C turnover index(Table 4) as well as correlations among C turnover indices(Fig. 6) suggest a high degree of consistency in tree species effectson soil C turnover. However, correlations were less clear betweenindices for the forest floor C stock and indices integrating the min-eral soil C stock. Carbon turnover indices for the forest floor or fo-liar litter generally showed stronger tree species effects than didindices that also integrated mineral soil C stocks (Rh, Rh/SOCFF+0–5
and potential soil C turnover in the laboratory). Foliar litter C turn-over and fractional forest floor C turnover for beech, oak, mapleand lime were very well correlated (Fig. 6a) whereas estimatedheterotrophic respiration was not significantly correlated with for-est floor fractional C turnover. This could be explained by the largeramount of topsoil C available for heterotrophic activity in somespecies than other, but there was no straightforward relationshipbetween forest floor C stocks and soil respiration as also reportedby Borken and Beese (2005). On the other hand, the topsoil C turn-over and litterbag C turnover rates correlated well for the fourbroadleaf species. Both these indices appear to be representativeof forest floor processes. Mineral soil C turnover rates in lab incu-bations were overall not well related to forest floor fractional Cturnover; however, there were significant relationships withinthe two tree species groups that clearly differed in forest floor Cturnover (Fig. 6d). This pattern indicates that tree species withmineral soil C turnover within the same range yet may possessvery different C turnover rates in the forest floor. This could beattributed to slightly higher below-canopy temperatures in ashand lime (Table 2 and Fig. 1b) positively affecting the forest floorC turnover whereas the temperature effect was controlled in labo-ratory incubation of mineral soil. Another possible explanation isthat different sources of C control the two C turnover indices. Forinstance, the influence of foliar litter input and its quality wouldbe high for forest floor C turnover while the influence of root litterinput and DOC would be more important for estimated mineral soilC turnover rates.
More information on belowground processes is obviouslyneeded to fully understand tree species effects on soil C turnover.We only included aboveground litter input and the influence of fo-liar litter quality on SOC turnover, but fine root litter input alsoplays an important role for soil C dynamics (Rasse et al., 2005;Kleja et al., 2008). It is often assumed that the same litter qualityfactors influence fine root turnover and that differences in fine rootchemistry among tree species mirror those of foliar litter. However,it has been reported lately that foliar litter and fine root turnoverrates were unrelated which was partly ascribed to differences inthe influential traits that affected decomposition of leaves and fineroots (Hobbie et al., 2010). It is conceivable that the lack of corre-lation between certain indices of C turnover, as well as the failureof foliar litter quality to predict C turnover under laboratory condi-
tions is due to the increasing influence of fine root litter input withincreasing integration of mineral soil in C turnover indices. More-over, there is good evidence that clay-containing soils also stabilizea part of SOC through chemical and physical protection againstdecomposition (von Lützow et al., 2006; Schöning and Kögel-Knab-ner, 2006). For the studied suite of tree species it remains clear thatforest floor processes mainly governed by aboveground litterdynamics should not uncritically be extrapolated to the mineralsoil where belowground litter input as well as various stabilizationmechanisms influence C dynamics.
In light of current efforts to account for C stock changes in forestecosystems, more information is needed on effects of a change intree species. This study has shown that soil C turnover rates differmarkedly among six tree species while their aboveground litterfallinputs were quite similar (Vesterdal et al., 2008). This suggests thatthe individual tree species would influence soil C stocks morestrongly via litter quality or microclimate mediated effects ondecomposition and C mineralization rates than via litterfall C in-puts to the soil. Our current knowledge therefore suggests that for-est managers by informed selection of tree species may influencesoil C stocks mainly through the effect of tree species on litter qual-ity and climatic conditions under the canopy. Prescott (2010) sug-gested that to better manage soil C stocks based on knowledgeabout litter decomposition, focus should be drawn to the diversionof litter into stable pools rather than just trying to slow the speedof decomposition. Mineral soil C pools are better protected in clay-containing soils than are forest floor C pools (von Lützow et al.,2006; Jandl et al., 2007), thus one way of managing for C sequestra-tion would be to select tree species that better divert litter C intostable mineral soil-associated humus. Based on rates of litter Cturnover spruce and beech appear as best options for soil C seques-tration, however, species with fast litter turnover such as mapleand ash showed a tendency for higher C stocks in mineral topsoilwhich could be caused by macrofauna-mediated incorporation ofdecomposing litter material or differences in root litter inputs(Vesterdal et al., 2008). A similar pattern in opposite vertical C dis-tribution was observed between maple and coniferous tree speciesin Pacific Northwest (Turk et al., 2008).
Mineral soil processes in terms of root litter input and specificrates of turnover must be quantified to fully address the questionof organic matter turnover for the six common European tree spe-cies. This is particularly required to improve C turnover rates in soilC models for sites and tree species where soil C dynamics are notwell characterized by C turnover occurring in the forest floor. Thisstudy suggests that specific traits of the five common broadleaf for-est species should be taken into account in the modelling of soil Cstock dynamics over decades. Thus, tree species with base cation-rich litter and a significant macrofauna component (e.g. maple,lime and ash in this study) have extremely fast C turnover ratesjudged from forest floor fractional loss or litterbags. However,SOC models with no separation of forest floor and mineral soil orsolely based on forest floor dynamics may fail to simulate that lit-ter remains of certain tree species are also stored in stable form inthe mineral soil (de Wit et al., 2006; Berg et al., 2007, 2009).
5. Conclusions
This study explored soil respiration in six common Europeantree species and estimated C turnover differences by four differentindices. The first hypothesis that Norway spruce would differ frombroadleaves in soil respiration and soil C turnover rate was notconfirmed for soil respiration but was supported by several Cturnover indices. The second hypothesis that litter chemistry dif-ferences lead to significant differences in soil respiration and Cturnover even within broadleaves was clearly supported by high
194 L. Vesterdal et al. / Forest Ecology and Management 264 (2012) 185–196
Author's personal copy
C turnover rates particularly in ash and maple and lowest C turn-over rate in beech. The ranking of tree species according to C turn-over indices was largely consistent, and some C turnover indiceswere also correlated suggesting that the indices are relatively ro-bust in terms of quantifying species differences in soil C turnover.However, weak correlations among some C turnover indices indi-cated that tree species differences in soil C turnover vary depend-ing on whether C turnover indices are limited to the forest floor Cpool or integrate a smaller or larger part of the mineral soil C pool.Differences in C turnover were for the most part attributable tovariation in litter quality and microclimatic conditions. Litterfallfoliar N, Ca and Mg concentrations and to some extent lignin con-centration correlated best with C turnover indices that integratedthe forest floor while we hypothesize that root litter input and Cstabilization processes must be included to better explain mineralsoil C turnover. Differences in C turnover and soil C stocks afterthree decades suggest that specific traits of these five commonbroadleaf forest species should be taken into account in the mod-elling of soil C stock dynamics over decades.
Acknowledgements
This study was funded by the Danish Agricultural and Veteri-nary Research Council (Project No. 23-03-0195) and the EuropeanCommission in the 5th Framework Program CNTER (Contract No.QLK5-2001-00596). We thank Stina N. Rasmussen, Mads M. Krag,Preben Frederiksen, Xhevat Haliti and Lena Byrgesen for help withfield sampling and for laboratory analyses.
References
Batjes, N.H., 1998. Mitigation of atmospheric CO2 concentrations by increasedcarbon sequestration in the soil. Biol. Fertil. Soils 27, 230–235.
Berg, B., Gundersen, P., Akselsson, C., Johansson, M.-B., Nilsson, Å., Vesterdal, L.,2007. Carbon sequestration rates in Swedish forest soils – A comparison of threeapproaches. Silva Fennica 41, 541–558.
Berg, B., Johansson, M.-B., Nilsson, Å., Gundersen, P., Norell, L., 2009. Sequestrationof carbon in the humus layer of Swedish forests – Direct measurements. Can. J.For. Res. 39, 962–975.
Berger, T.W., Inselsbacher, E., Zechmeister-Boltenstern, S., 2010. Carbon dioxideemissions of soils under pure and mixed stands of beech and spruce, affected bydecomposing foliage litter mixtures. Soil Biol. Biochem. 42, 986–997.
Bohlen, P.J., Pelletier, D.M., Groffman, P.M., Fahey, T.J., Fisk, M.C., 2004. Influence ofearthworm invasion on redistribution and retention of soil carbon and nitrogenin northern temperate forests. Ecosystems 7, 13–27.
Borken, W., Xu, Y.-J., Davidson, E.A., Beese, F., 2002. Site and temporal variation ofsoil respiration in European beech, Norway spruce, and Scots pine forests.Global Change Biol. 8, 1205–1216.
Borken, W., Beese, F., 2005. Soil respiration in pure and mixed stands of Europeanbeech and Norway spruce following removal of organic horizons. Can. J. For.Res. 35, 2756–2764.
Callesen, I., Liski, J., Raulund-Rasmussen, K., Olsson, M.T., Tau-Strand, L., Vesterdal,L., Westman, C.J., 2003. Soil carbon stores in Nordic well-drained forest soils –Relationships with climate and texture class. Global Change Biol. 9, 358–370.
Chapman, S.B., 1971. A simple conductimetric soil respirometer for field use. Oikos22, 348–353.
Christiansen, J.R., Vesterdal, L., Callesen, I., Elberling, B., Schmidt, I.K., Gundersen, P.,2010. Role of six European tree species and land-use legacy for nitrogen andwater budgets in forests. Global Change Biol. 16, 2224–2240.
Côté, L., Brown, S., Paré, D., Fyles, J., Bauhus, J., 2000. Dynamics of carbon andnitrogen mineralization in relation to stand type, stand age and soil texture inthe boreal mixedwood. Soil Biol. Biochem. 32, 1079–1090.
Davidson, E.A., Janssens, I.A., Luo, Y., 2006. On the variability of respiration interrestrial ecosystems: moving beyond Q10. Global Change Biol. 12, 154–164.
De Schrijver, A., De Frenne, P., Staelens, J., Verstraeten, G., Muys, B., Vesterdal, L.,Wuyts, K., Van Nevel, L., Schelfhout, S., De Neve, S., Verheyen, K., 2011. Treespecies traits cause divergence in soil acidification during four decades of post-agricultural forest development. Global Change Biol., in press. doi:10.1111/j.1365-2486.2011.02572.x.
Devliegher, W., Verstraete, W., 1997. The effect of Lumbricus terrestris on soil inrelation to plant growth: effects of nutrient-enrichment processes (NEP) andgut-associated processes (GAP). Soil Biol. Biochem. 29, 341–346.
de Wit, H.A., Palosuo, T., Hylen, G., Liski, J., 2006. A carbon budget of forest biomassand soils in southeast Norway calculated using a widely applicable method. For.Ecol. Manage. 225, 15–26.
Elberling, B., Brandt, K.K., 2003. Uncoupling of microbial CO2 production and releasein frozen soil and its implications for field studies of arctic C cycling. Soil Biol.Biochem. 35, 263–272.
Epron, D., Le Dantec, V., Dufrene, E., Granier, A., 2001. Seasonal dynamics of soilcarbon dioxide efflux and simulated rhizosphere respiration in a beech forest.Tree Physiol. 21, 145–152.
Eswaran, H., Van Den Berg, E., Reich, P., 1993. Organic carbon in soils of the world.Soil Sci. Soc. Am. J. 57, 192–194.
Falloon, P.D., Smith, P., Smith, J.U., Szabo, J., Coleman, K., Marshall, S., 1998. Regionalestimates of carbon sequestration potential: linking the Rothamsted CarbonModel to GIS databases. Biol. Fertil. Soils 27, 236–241.
Fröberg, M., Hansson, K., Kleja, D.B., Alavi, G., 2011. Dissolved organic carbon andnitrogen leaching from Scots pine, Norway spruce and silver birch stands insouthern Sweden. For. Ecol. Manage. 262, 1742–1747.
Gaudinski, J.B., Trumbore, S.E., Davidson, E.A., Zheng, S.H., 2000. Soil carbon cyclingin a temperate forest: radiocarbon-based estimates of residence times,sequestration rates and partitioning of fluxes. Biogeochemistry 51, 3–69.
Goodale, C.L., Apps, M.J., Birdsey, R.A., Field, C.B., Heath, L.S., Houghton, R.A.,Jenkins, J.C., Kohlmaier, G.H., Kurz, W., Liu, S., Nabuurs, G.-J., Nilsson, S.,Shvidenko, A.Z., 2002. Forest carbon sinks in the northern hemisphere. Ecol.Appl. 12, 891–899.
Gundersen, P., Sevel, L., Christiansen, J.R., Vesterdal, L., Hansen, K., Bastrup-Birk, A.,2009. Do indicators of nitrogen retention and leaching differ betweenconiferous and broadleaved forests in Denmark? For. Ecol. Manage. 258,1137–1146.
Hansen, K., Vesterdal, L., Schmidt, I.K., Gundersen, P., Sevel, L., Bastrup-Birk, A.,Pedersen, L.B., Bille-Hansen, J., 2009. Litterfall and nutrient return in fivetree species in a common garden experiment. For. Ecol. Manage. 257, 2133–2144.
Hanson, P.J., Edwards, N.T., Garten, C.T., Andrews, J.A., 2000. Separating root and soilmicrobial contributions to soil respiration: a review of methods andobservations. Biogeochemistry 48, 115–146.
Hobbie, S.E., Reich, P.B., Oleksyn, J., Ogdahl, M., Zytkowiak, R., Hale, C., Karolewski,P., 2006. Tree species effects on decomposition and forest floor dynamics in acommon garden. Ecology 87, 2288–2397.
Hobbie, S.E., Oleksyn, J., Eissenstat, D.M., Reich, P.B., 2010. Fine root decompositionrates do not mirror those of leaf litter among temperate tree species. Oecologia162, 505–513.
Hoffmann, A., 2007. Differences in the understorey and soil processes under six treespecies on six sites in Denmark (In Danish). MSc thesis, Institute of Biology,University of Copenhagen.
Jandl, R., Lindner, M., Vesterdal, L., Bauwens, B., Baritz, R., Hagedorn, F., Johnson,D.W., Minkkinen, K., Byrne, K.A., 2007. How strongly can forest managementinfluence soil carbon sequestration? Geoderma 137, 253–268.
Jonard, M., André, F., Jonard, F., Mouton, N., Procés, P., Ponette, Q., 2007. Soil carbondioxide efflux in pure and mixed stands of oak and beech. Ann. For. Sci. 64, 141–150.
Kleja, D.B., Svensson, M., Majdi, H., Jansson, P.E., Langvall, O., Bergkvist, B.,Johansson, M.-B., Weslien, P., Truusb, L., Lindroth, A., Ågren, G.I., 2008. Poolsand fluxes of carbon in three Norway spruce ecosystems along a climaticgradient in Sweden. Biogeochemistry 89, 7–25.
Ladegaard-Pedersen, P., Elberling, B., Vesterdal, L., 2005. Soil carbon stocks,mineralization rates and CO2 effluxes under 10 tree species on contrastingsoil types. Can. J. For. Res. 35, 1277–1284.
Lindner, M., Karjalainen, T., 2007. Carbon inventory methods and carbon mitigationpotentials of forests in Europe: a short review of recent progress. Eur. J. For. Res.126, 149–156.
Matejovic, I., 1993. Determination of carbon, hydrogen, and nitrogen in soils byautomated elemental analysis (dry combustion method). Commun. Soil Sci.Plant Anal. 24, 2213–2222.
Muys, B., Lust, N., 1992. Inventory of the earthworm communities and the state oflitter decomposition in the forests of Flanders, Belgium, and its implications forforest management. Soil Biol. Biochem. 24, 1677–1681.
Neirynck, J., Mirtcheva, S., Sioen, G., Lust, N., 2000. Impact of Tilia platyphyllos Scop.,Fraxinus excelsior L., Acer pseudoplatanus L., Quercus robur L. and Fagus sylvaticaL. on earthworm biomass and physico-chemical properties of a loamy topsoil.For. Ecol. Manage. 133, 275–286.
Nordgren, A., 1988. Apparatus for the continuous, long-term monitoring of soilrespiration rate in large numbers of samples. Soil Biol. Biochem. 20, 955–957.
Olson, J.S., 1963. Energy storage and the balance of producers and decomposers inecological systems. Ecology 44, 322–331.
Paul, K.I., Polglase, P.J., Richards, G.P., 2003. Predicted change in soil carbonfollowing afforestation or reforestation, and analysis of controlling factors bylinking a C accounting model (CAMFor) to models of forest growth (3PG), litterdecomposition (GENDEC) and soil C turnover (RothC). For. Ecol. Manage. 177,485–501.
Peltoniemi, M., Thürig, E., Ogle, S., Palosuo, T., Schrumpf, M., Wutzler, T., Butterbach-Bahl, K., Chertov, O., Komarov, A., Mikhailoz, A., Gärdenäs, A., Perry, C., Liski, J.,Smith, P., Mäkipää, R., 2007. Models in country scale carbon accounting of forestsoils. Silva Fennica 41, 575–602.
Prescott, C.E., 2002. The influence of the forest canopy on nutrient cycling. TreePhysiol. 22, 1193–1200.
Prescott, C.E., 2010. Litter decomposition: what controls it and how can we alter itto sequester more carbon in forest soils? Biogeochemistry 101, 133–149.
Raich, J.W., Tufekcioglu, A., 2000. Vegetation and soil respiration: correlations andcontrols. Biogeochemistry 48, 71–90.
L. Vesterdal et al. / Forest Ecology and Management 264 (2012) 185–196 195

Author's personal copy
Rasse, D.P., Rumpel, C., Dignac, M.-F., 2005. Is soil carbon mostly root carbon?Mechanisms for a specific stabilisation. Plant Soil 269, 341–356.
Reich, P.B., Oleksyn, J., Modrzynski, J., Mrozinski, P., Hobbie, S.E., Eissenstat, D.M.,Chorover, J., Chadwick, O.A., Hale, C.M., Tjoelker, M.G., 2005. Linking littercalcium, earthworms and soil properties: a common garden test with 14 treespecies. Ecol. Lett. 811, 818.
Rodeghiero, M., Cescatti, A., 2006. Indirect partitioning of soil respiration in a seriesof evergreen forest ecosystems. Plant Soil 284, 7–22.
Schelfhout, S., 2010. Tree species effects on earthworm communities in Danish andFlemish forests. MSc thesis, University of Ghent, Belgium.
Schöning, I., Kögel-Knabner, I., 2006. Chemical composition of young and old carbonpools throughout Cambisol and Luvisol profiles under forests. Soil Biol.Biochem. 38, 2411–2424.
Soil Survey Staff, 1998. Keys to Soil Taxonomy, eighth ed.. U.S. Department ofAgriculture, Pocahontas Press, Inc., Blacksburg, VA, USA, p. 545.
Subke, J.-A., Inglima, I., Cotrufo, M.F., 2006. Trends and methodological impacts insoil CO2 efflux partitioning: a metaanalytical review. Global Change Biol. 12,921–943.
Trum, F., Titeux, H., Ranger, J., Delvaux, B., 2011. Influence of tree species on carbonand nitrogen transformation patterns in forest floor profiles. Ann. For. Sci. 68,837–847.
Turk, T.D., Schmidt, M.G., Roberts, N.J., 2008. The influence of bigleaf maple on forestfloor and mineral soil properties in a coniferous forest in coastal BritishColumbia. For. Ecol. Manage. 255, 1874–1882.
Van Soest, P.J., Robertson, J.B., 1985. Analysis of Forages and Fibrous Foods: ALaboratory Manual for Animal Sciences. Cornell University, Ithaca, NY.
Vesterdal, L., Raulund-Rasmussen, K., 1998. Forest floor chemistry under seven treespecies along a soil fertility gradient. Can. J. For. Res. 28, 1636–1647.
Vesterdal, L., Schmidt, I.K., Callesen, I., Nilsson, L.O., Gundersen, P., 2008. Carbon andnitrogen in forest floor and mineral soil under six common European treespecies. For. Ecol. Manage. 255, 35–48.
von Lützow, M., Kögel-Knabner, I., Ekschmitt, K., Matzner, E., Guggenberger, G.,Marschner, B., Flessa, H., 2006. Stabilization of organic matter in temperatesoils: mechanisms and their relevance under different soil conditions – Areview. Eur. J. Soil Sci. 57, 426–445.
Wang, C., Yang, J., 2007. Rhizospheric and heterotrophic components of soilrespiration in six Chinese temperate forests. Global Change Biol. 13, 123–131.
196 L. Vesterdal et al. / Forest Ecology and Management 264 (2012) 185–196
Copyright © 2022 FDOKUMEN