Soil organic carbon dynamics as related to land use history in the northwestern Great Plains
13
Soil organic carbon dynamics as related to land use history in the northwestern Great Plains Zhengxi Tan, 1 Shuguang Liu, 2 Carol A. Johnston, 1 Thomas R. Loveland, 3 Larry L. Tieszen, 3 Jinxun Liu, 4 and Rachel Kurtz 3 Received 14 April 2005; revised 2 June 2005; accepted 15 June 2005; published 17 August 2005. [1] Strategies for mitigating the global greenhouse effect must account for soil organic carbon (SOC) dynamics at both spatial and temporal scales, which is usually challenging owing to limitations in data and approach. This study was conducted to characterize the SOC dynamics associated with land use change history in the northwestern Great Plains ecoregion. A sampling framework (40 sample blocks of 10 10 km 2 randomly located in the ecoregion) and the General Ensemble Biogeochemical Modeling System (GEMS) were used to quantify the spatial and temporal variability in the SOC stock from 1972 to 2001. Results indicate that C source and sink areas coexisted within the ecoregion, and the SOC stock in the upper 20-cm depth increased by 3.93 Mg ha 1 over the 29 years. About 17.5% of the area was evaluated as a C source at 122 kg C ha 1 yr 1 . The spatial variability of SOC stock was attributed to the dynamics of both slow and passive fractions, while the temporal variation depended on the slow fraction only. The SOC change at the block scale was positively related to either grassland proportion or negatively related to cropland proportion. We concluded that the slow C pool determined whether soils behaved as sources or sinks of atmospheric CO 2 , but the strength depended on antecedent SOC contents, land cover type, and land use change history in the ecoregion. Citation: Tan, Z., S. Liu, C. A. Johnston, T. R. Loveland, L. L. Tieszen, J. Liu, and R. Kurtz (2005), Soil organic carbon dynamics as related to land use history in the northwestern Great Plains, Global Biogeochem. Cycles, 19, GB3011, doi:10.1029/2005GB002536. 1. Introduction [2] Temporal changes in soil organic carbon (SOC) stock are more informative than absolute quantities for evaluating the potential of terrestrial ecosystems to offset a portion of the CO 2 emissions from human activities. Temporal varia- tions in SOC stock can be used to infer changes in fundamental properties of ecosystems that result from either land use or management practices. Measurements of SOC temporal changes are needed to understand net C exchange between terrestrial ecosystems and the atmosphere over large areas. It has also been recognized that the CO 2 mitigation strategies based on terrestrial C sequestration must involve large areas as one condition for atmospheric CO 2 removal that can exceed the carbon (C) emission from plants and soils [Ellert et al., 2002]. The spatial variation of SOC is a function of a set of factors such as relief, parent material, climate, plant cover, anthropogenic activities, and time [Jenny , 1980]. The C sequestration potential of ecoregions can be assessed by integrating and aggregating spatial data characterizing these factors (e.g., soil properties, land use or land cover, and climatic regime) and their temporal variations. [3] In the last decade, many biogeochemical models have been developed to simulate C cycles at various spatial scales. Process-based modeling studies primarily have focused on potential vegetation conditions, with relatively static land use information, and few of them were capable of dynamically integrating land use change information into the simulation processes over large areas [Chen et al., 2000; Liu et al., 2004b]. In addition, applying ecosystem models at a very coarse spatial resolution would likely result in biases [Turner et al., 2000; Jenkins et al., 2001]. [4] The Intergovernmental Panel on Climate Change (IPCC) developed the Revised Guidelines for National Greenhouse Gas Inventories to provide methods for estimating emissions by sources and removal by sinks of greenhouse gases [Houghton et al., 1997], in which the Land Use and Land Use Change section provides a method to estimate average annual C sources or sinks from soils with changes in land use and management GLOBAL BIOGEOCHEMICAL CYCLES, VOL. 19, GB3011, doi:10.1029/2005GB002536, 2005 1 South Dakota Center for Biocomplexity Studies, Brookings, South Dakota, USA. 2 SAIC, Sioux Falls, South Dakota, USA. 3 U.S. Geological Survey, Sioux Falls, South Dakota, USA. 4 Research Associateship Program at the USGS National Center for EROS, National Research Council, Sioux Falls, South Dakota, USA. Copyright 2005 by the American Geophysical Union. 0886-6236/05/2005GB002536$12.00 GB3011 1 of 10
Transcript of Soil organic carbon dynamics as related to land use history in the northwestern Great Plains
Soil organic carbon dynamics as related to land use history
in the northwestern Great Plains
Zhengxi Tan,1 Shuguang Liu,2 Carol A. Johnston,1 Thomas R. Loveland,3
Larry L. Tieszen,3 Jinxun Liu,4 and Rachel Kurtz3
Received 14 April 2005; revised 2 June 2005; accepted 15 June 2005; published 17 August 2005.
[1] Strategies for mitigating the global greenhouse effect must account for soil organiccarbon (SOC) dynamics at both spatial and temporal scales, which is usually challengingowing to limitations in data and approach. This study was conducted to characterizethe SOC dynamics associated with land use change history in the northwestern GreatPlains ecoregion. A sampling framework (40 sample blocks of 10 � 10 km2 randomlylocated in the ecoregion) and the General Ensemble Biogeochemical Modeling System(GEMS) were used to quantify the spatial and temporal variability in the SOC stockfrom 1972 to 2001. Results indicate that C source and sink areas coexisted within theecoregion, and the SOC stock in the upper 20-cm depth increased by 3.93 Mg ha�1 overthe 29 years. About 17.5% of the area was evaluated as a C source at 122 kg C ha�1 yr�1.The spatial variability of SOC stock was attributed to the dynamics of both slow andpassive fractions, while the temporal variation depended on the slow fraction only.The SOC change at the block scale was positively related to either grassland proportion ornegatively related to cropland proportion. We concluded that the slow C pooldetermined whether soils behaved as sources or sinks of atmospheric CO2, but thestrength depended on antecedent SOC contents, land cover type, and land use changehistory in the ecoregion.
Citation: Tan, Z., S. Liu, C. A. Johnston, T. R. Loveland, L. L. Tieszen, J. Liu, and R. Kurtz (2005), Soil organic carbon dynamics as
related to land use history in the northwestern Great Plains, Global Biogeochem. Cycles, 19, GB3011, doi:10.1029/2005GB002536.
1. Introduction
[2] Temporal changes in soil organic carbon (SOC) stockare more informative than absolute quantities for evaluatingthe potential of terrestrial ecosystems to offset a portion ofthe CO2 emissions from human activities. Temporal varia-tions in SOC stock can be used to infer changes infundamental properties of ecosystems that result from eitherland use or management practices. Measurements of SOCtemporal changes are needed to understand net C exchangebetween terrestrial ecosystems and the atmosphere overlarge areas. It has also been recognized that the CO2
mitigation strategies based on terrestrial C sequestrationmust involve large areas as one condition for atmosphericCO2 removal that can exceed the carbon (C) emission fromplants and soils [Ellert et al., 2002]. The spatial variation of
SOC is a function of a set of factors such as relief, parentmaterial, climate, plant cover, anthropogenic activities,and time [Jenny, 1980]. The C sequestration potential ofecoregions can be assessed by integrating and aggregatingspatial data characterizing these factors (e.g., soil properties,land use or land cover, and climatic regime) and theirtemporal variations.[3] In the last decade, many biogeochemical models have
been developed to simulate C cycles at various spatial scales.Process-based modeling studies primarily have focused onpotential vegetation conditions, with relatively static land useinformation, and few of them were capable of dynamicallyintegrating land use change information into the simulationprocesses over large areas [Chen et al., 2000; Liu et al.,2004b]. In addition, applying ecosystem models at a verycoarse spatial resolution would likely result in biases [Turneret al., 2000; Jenkins et al., 2001].[4] The Intergovernmental Panel on Climate Change
(IPCC) developed the Revised Guidelines for NationalGreenhouse Gas Inventories to provide methods forestimating emissions by sources and removal by sinksof greenhouse gases [Houghton et al., 1997], in whichthe Land Use and Land Use Change section provides amethod to estimate average annual C sources or sinksfrom soils with changes in land use and management
GLOBAL BIOGEOCHEMICAL CYCLES, VOL. 19, GB3011, doi:10.1029/2005GB002536, 2005
1South Dakota Center for Biocomplexity Studies, Brookings, SouthDakota, USA.
2SAIC, Sioux Falls, South Dakota, USA.3U.S. Geological Survey, Sioux Falls, South Dakota, USA.4Research Associateship Program at the USGS National Center for
EROS, National Research Council, Sioux Falls, South Dakota, USA.
Copyright 2005 by the American Geophysical Union.0886-6236/05/2005GB002536$12.00
GB3011 1 of 10

over a 20-year inventory period. Default values forbaseline SOC pools are provided along with a series ofcoefficients that determine C pool changes as a functionof climate, soil type, disturbance history, tillage intensity,productivity, and residue management. Though the IPCCGood Practice Guidance for Land Use, Land-Use Changeand Forestry was recently developed to improve theuncertainty estimates of emissions by sources and removalby sinks of greenhouse gases [Penman et al., 2003], it isdifficult to directly quantify the level of uncertainty inthis type of analysis because each input data set hasan associated level of uncertainty through the analysis[Cannell et al., 1999; Houghton et al., 1999]. The uncer-tainty in the estimates of GHG emissions or reduction withland use change may be as high as 50% [Houghton et al.,1997].[5] Recently, the General Ensemble Biogeochemical
Modeling System (GEMS) has been developed by Liuet al. [2004a, 2004b] to integrate spatially and tempo-rally explicit information (especially land use changeover time) into process-based biogeochemical modelingat a regional or a national scale. This model has beensuccessfully applied to characterize the impacts of landcover changes on the contemporary C sources and sinksover the last 3 decades in the southeastern plains of theUnited States. Briefly, GEMS uses a Monte-Carlo basedensemble approach to incorporate the variability (asmeasured by variances and covariance) of the stateand driving variables of the underlying biogeochemicalmodels into simulations. Thus GEMS simulates not onlythe spatial and temporal trends of C dynamics such asC exchange between the terrestrial biosphere and theatmosphere, but also provides uncertainty estimates ofthe predicted variables in time and space [Liu et al.,2004b].[6] Most investigations of terrestrial C dynamics have
focused on the estimation of C sequestration potential witheither given land use changes or improved managementpractices from point observations (or paired experimentalsites), then extrapolated these results to a regional or anational scale with some assumptions. Terrestrial ecosys-tems, however, are diverse with multiple land uses or landcovers that reflect the patterns of natural resources, socio-economic conditions, and settlement history. This diversitymust be accounted for in forecasted SOC changes underconservation scenarios proposed for target land covertypes. Realistically, we need to know present SOC stocks,past land use history, and future land use changes for theentire ecosystems rather than for a single sector. Thereforethis study was conducted to simulate the time-dependentSOC change in the northwestern Great Plains usingGEMS.[7] The work reported here is an integral part of the
Contemporary U.S. Carbon Trends project, which has threespecific aims [Liu et al., 2004b]: (1) characterizing terres-trial C pools within sample blocks using a samplingframework rather than a conventional wall-to-wallapproach, (2) detecting land use change using remotelysensed data at both a high temporal sampling frequency anda high spatial resolution, and (3) simulating C dynamics
within each sample block by specifying the variance andcovariance of major input variables using GEMS.
2. Materials and Methods
2.1. Study Area
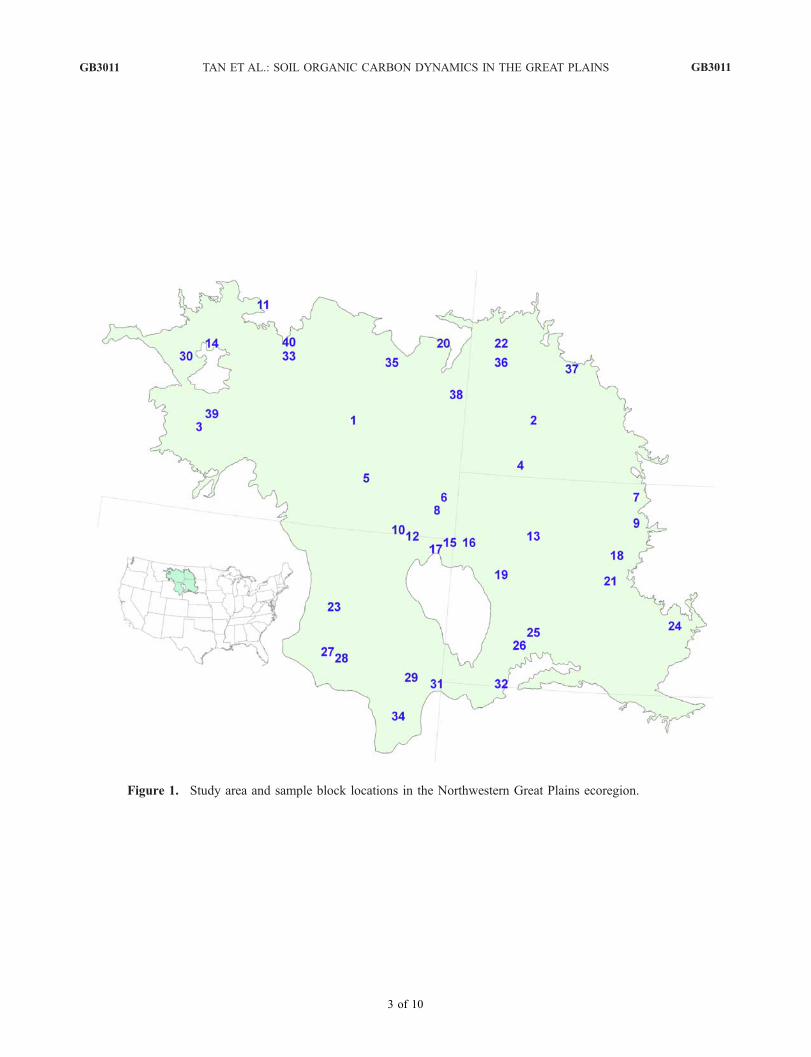
[8] The study area is the northwestern Great Plains, orecoregion 43, one of the 84 Omernik level III ecoregions[Omernik, 1987] (42�3100500N–48�1401400N, 99�0005100W–111�5904500W). Its total surface area is about 338,718 km2. Itcovers western South Dakota, southwestern North Dakota,southeastern Montana, and northeastern Wyoming(Figure 1). The ecoregion is largely an unglaciated, semiaridrolling plain of shale and sandstone. It is punctuated byoccasional buttes and badlands, with ephemeral-intermittentstreams and a few perennial rivers. The annual averageprecipitation from 1971 to 2000 was 401 ± 51 mm, and theannual average temperature was 7.1 ± 1.1�C with a frost-free period from 75 to 143 days. The climate in thenorthwestern Great Plains is characterized by an east-westprecipitation gradient (wetter in the east) and a south-northtemperature gradient (warmer in the south).[9] The ecoregion is vegetated by mixed-grass prairie in
Montana and the western Dakotas, and shortgrass prairie inWyoming [Biondini et al., 1998]. Native grasslands persiston broken topography where they are used for livestockgrazing and wildlife habitat, but were largely replaced onlevel ground by spring wheat (Triticum aestivum) andalfalfa (Medicago sativa). Agriculture is usually limitedby the erratic precipitation and the scarce water resourcesfor irrigation [Omernik, 1987].
2.2. Data Sources
[10] This study primarily used three categories of modelinputs: climate, land use/cover, and soil survey. Climatedata from 1970 through 2000 included monthly averages ofprecipitation and temperature for each sample block. Theywere adapted from Climate Research Unit (available athttp://www.cru.uea.ac.uk/cru/data/hrg.htm). Initial soil char-acteristics within these sample blocks were based on theU.S. State Soil Geographic Database (STATSGO) [U.S.Department of Agriculture Natural Resources ConservationService, 1994]. STATSGO data were used to initialize thesoil components of GEMS. In GEMS, a soil component wasrandomly picked for a specific stochastic simulation fromall components within a soil map unit in proportion to thecomponent’s area in the sample block [Liu et al., 2004b].The larger the area of a soil component, the more likely itwas to be selected as the basis for a specific modelsimulation. Once the component was determined, soilcharacteristics such as drainage class, soil texture, highand low values of soil organic matter (SOM) content(converted to SOC using a factor of 0.58), soil bulk density,and water-holding capacity were retrieved from thecorresponding soil component and layer attribute tables.
2.3. Sampling Protocol and Land Use InformationAbstraction
[11] Detailed wall-to-wall simulations of terrestrial Cdynamics across the conterminous United States are possi-
GB3011 TAN ET AL.: SOIL ORGANIC CARBON DYNAMICS IN THE GREAT PLAINS
2 of 10
GB3011

ble but have not been undertaken because consistent high-resolution land use change databases have not been avail-able [Liu et al., 2004b]. Therefore the sampling frameworkproposed by Loveland et al. [2002] was introduced toidentify the spatial variation of land cover change. Fortysample blocks of 10 km � 10 km were randomly selectedwithin the ecoregion to identify changes with 1% precisionat an 85% confidence level. The changes were detectedbased on five dates of Landsat Multispectral Scanner (MSS)and Thermatic Mapper (TM) imagery data for 1973, 1980,1986, 1992, and 2000 that were analyzed at a cell size of60 m � 60 m for Landsat MSS images and 30 m � 30 m forTM images.
2.4. Model Simulations
[12] The structure and functions of GEMS have beendescribed by Liu et al. [2004a, 2004b]. GEMS consists ofthree major components: one or multiple encapsulatedecosystem biogeochemical models, a data assimilation sys-tem (DAS), and an input/output processor (IOP). The DAS
consists of data search/retrieval algorithms and data pro-cessing mechanisms. The data search/retrieval algorithmsare responsible for searching and retrieving relevant infor-mation from various databases according to the keys pro-vided by a joint frequency distribution (JFD) table [Reinerset al., 2002; Liu et al., 2004a], while data processingmechanisms downscale the information that was aggregatedfrom individual map units to the field scale using a MonteCarlo approach. Once data are assimilated, they are incor-porated into the modeling processes by means of the input/output processor to update the default input files withassimilated data. Values of selected output variables arealso written by the IOP to a set of output files after eachmodel execution. The JFD grids were first created from atime series of land cover maps (i.e., land covers in 1973,1980, 1986, 1992, and 2000), soil, and climate themes at acell size of 60 m � 60 m. In this study, a total of 1696unique combinations of these variables (mainly in terms ofboth land cover category and soil map units) were generatedwith a frequency ranging from 1 to 27889 grid cells. Each
Figure 1. Study area and sample block locations in the northwestern Great Plains ecoregion. See colorversion of this figure at back of this issue.
GB3011 TAN ET AL.: SOIL ORGANIC CARBON DYNAMICS IN THE GREAT PLAINS
3 of 10
GB3011
sample block contained about 42 unique combinations onaverage, varying from 8 to 166 combinations.
2.5. Data Analysis and Presentation
[13] We used sample blocks as data aggregation units, andanalyzed them in time series from 1972 through 2001(encompassing the official Land Cover Trends’ period setfrom 1973 through 2000 with a 1-year buffer before andafter). SOC stock was defined as the total SOC storage inthe 0–20 cm depth of soil and expressed in Mg C ha�1. TheSOC change was determined as the difference in SOCstocks between 2001 and 1972. The term ‘‘C sink- or sourcestrength’’ was used to indicate the extent of soil C seques-tration or depletion for a specific time span, and wasexpressed in kg C ha�1 yr�1. The results were generallyexpressed by the mean ± stderr (standard error), otherwisespecified. To minimize the influences of other large landcovers such as forest and water body, only sample blockswith combined areal percentages of both grassland andcropland greater than 85% or forest cover percentages lessthan 12% were selected for analyzing the effects of landcover on SOC changes between 1972 and 2001. The spatialvariations and change in SOC stocks were analyzed usingKriging interpolation models supported by ArcGIS 9.0[Environmental Systems Research Institute, 2004].
3. Results and Discussion
3.1. Land Cover Change Trends From 1973 to 2000
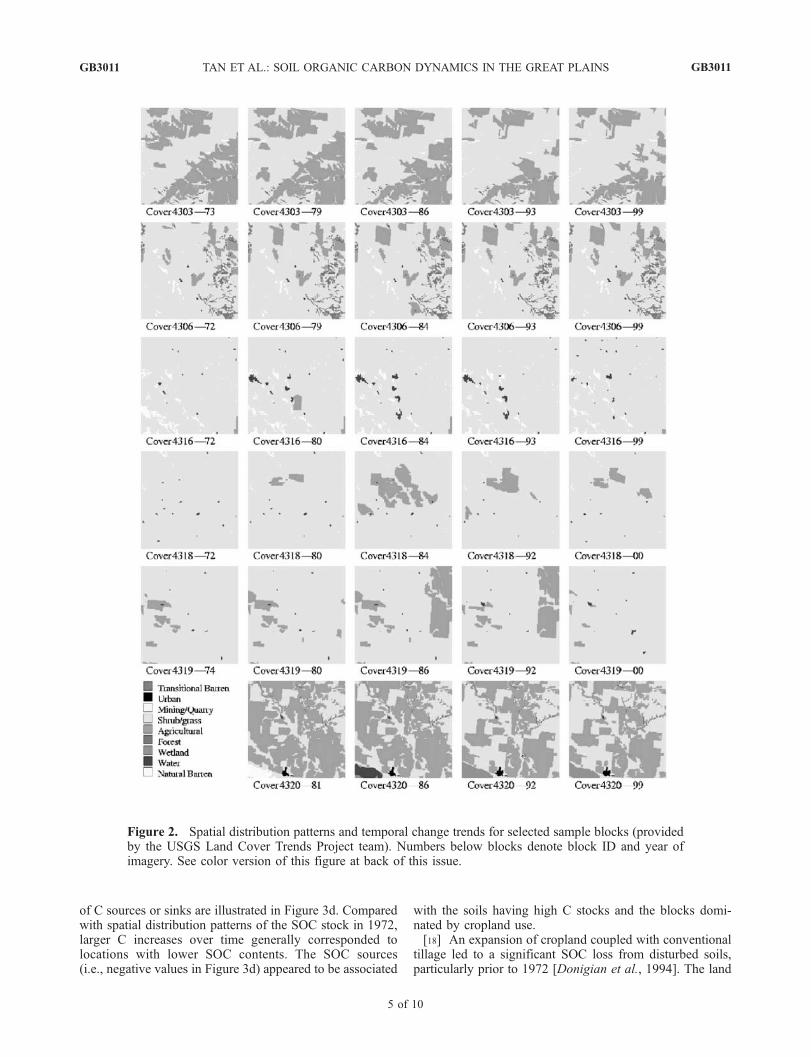
[14] Both grass/shrub cover and agricultural land use wereprevalent in the northwestern Great Plains ecoregionbetween 1973 and 2000. The cumulative area of grass/shrubcover (hereinafter called grassland) increased from 74.9% to77.1%, and the cumulative area of cropland decreased from17.2% to 15.4%. The percentage of wetland increased from0.18% in 1973 to 0.26% in 2000. Almost no changes inother land covers were observed during this period. Thechanges in all land cover categories in the ecoregion havetaken place at an annual average rate of 0.35% between1973 and 2000 (Table 1). The spatial variation and temporalchange trends of land cover for selected sample blocks areillustrated in Figure 2.[15] There was a substantial expansion of cropland before
the mid-1980s (data are available at http://www.nass.usda.
gov/QuickStats/) followed by implementation of the Con-servation Reserve Program (CRP) after Congress passed theFood Security Act in 1985 (data are available at http://www.fsa.usda.gov/dafp/cepd/default.htm/). During the last2 decades, about 1.9 Mha of cropland were converted toCRP grasslands, and the fallow area was increased by 9.7%in Montana, North Dakota, South Dakota, and Wyoming(data are available at http://www.nrcs.usda.gov/technical/NRI/1997/summary_report/table3.html/). These spatial andtemporal changes in land cover in the last 3 decades havecertainly exerted substantial impacts on the SOC dynamicsand modified the C source-sink relationships in the terres-trial ecosystems.
3.2. Historical Soil Organic C Stocks
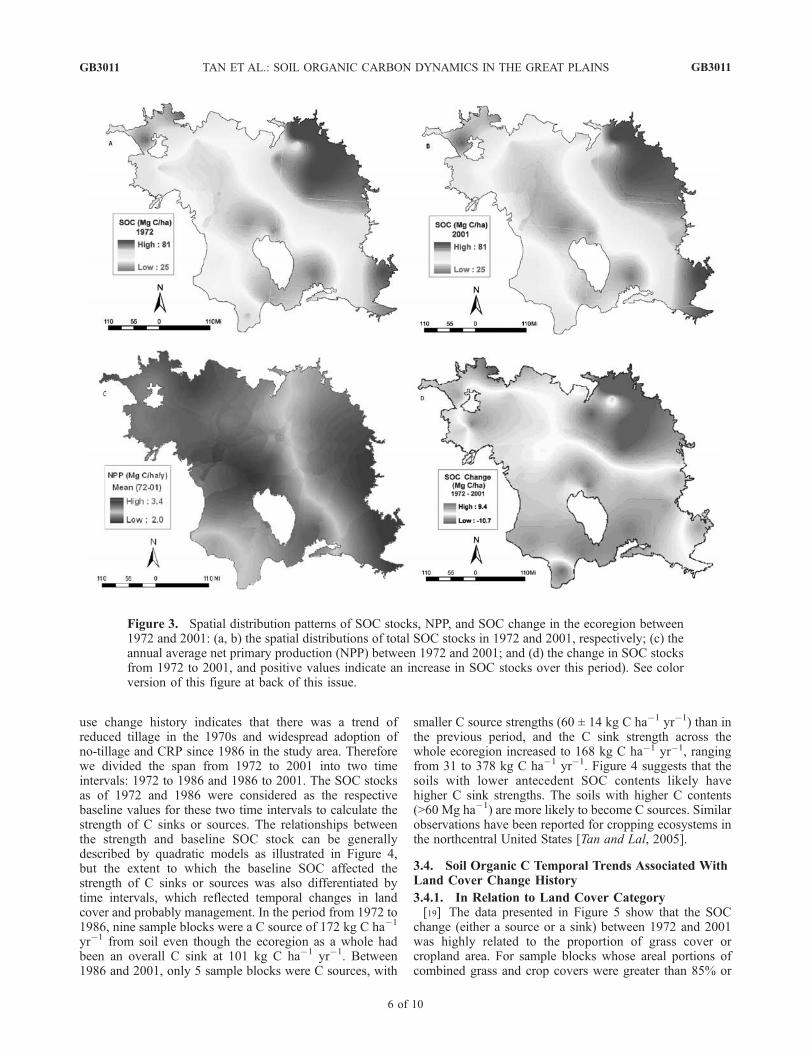
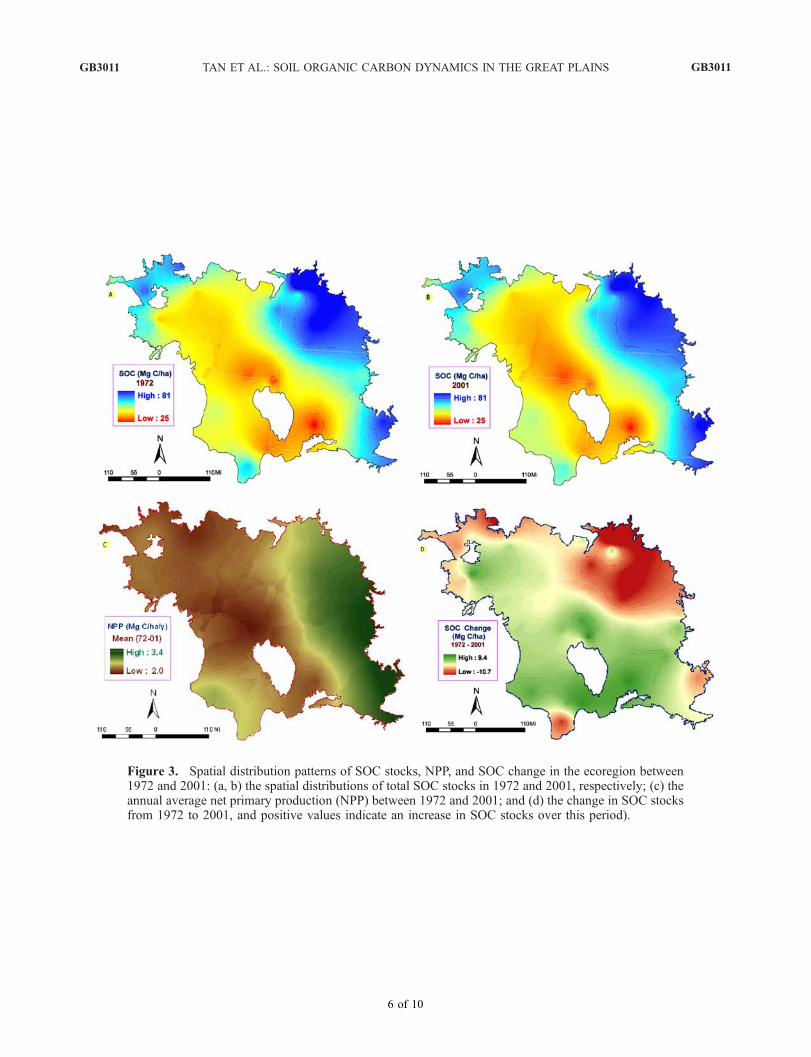
[16] The SOC stock simulated by GEMS for any specifictime varied substantially from sample block to sampleblock, ranging from 24.3 ± 2.5 to 85.1 ± 2.2 Mg C ha�1,and generally increased along the southwest to the northeastprecipitation gradient (Figures 3a and 3b). The spatialvariation in SOC stock was significant (coefficient ofvariation (CV) = 28.6%). The average SOC stock of theentire ecoregion increased from 46.9 Mg C ha�1 in 1972to 50.8 Mg C ha�1 in 2001, increasing by 8.3% over the29-year period with a CV of 2.6%. The spatial distributionpatterns of SOC stock (Figures 3a and 3b) generallycoincided with the distribution patterns of NPP magnitudesaveraged from 1972 to 2001 (Figure 3c), suggesting thathigher biomass production has led to more C inputinto soil. These spatial distribution patterns are also inagreement with the historical levels of grassland produc-tivity and SOM levels that vary along the orientationsof precipitation and temperature gradients [Jenny, 1980;Schimel et al., 1990; Peterson and Cole, 1995].
3.3. Soil Organic C Change and Source-SinkStrengths
[17] The simulated increase in SOC stock between 1972(the baseline) and 2001 was 3.93 Mg C ha�1 averaged forthe whole ecoregion, or an annual accumulation averagerate of 136 ± 24 kg C ha�1 yr�1. However, seven of the40 sample blocks (numbered 2, 4, 11, 22, 34, 37 and 38 inFigure 1) were significant C sources, emitting an average of127 kg C ha�1 yr�1 in the same period. The spatial patterns
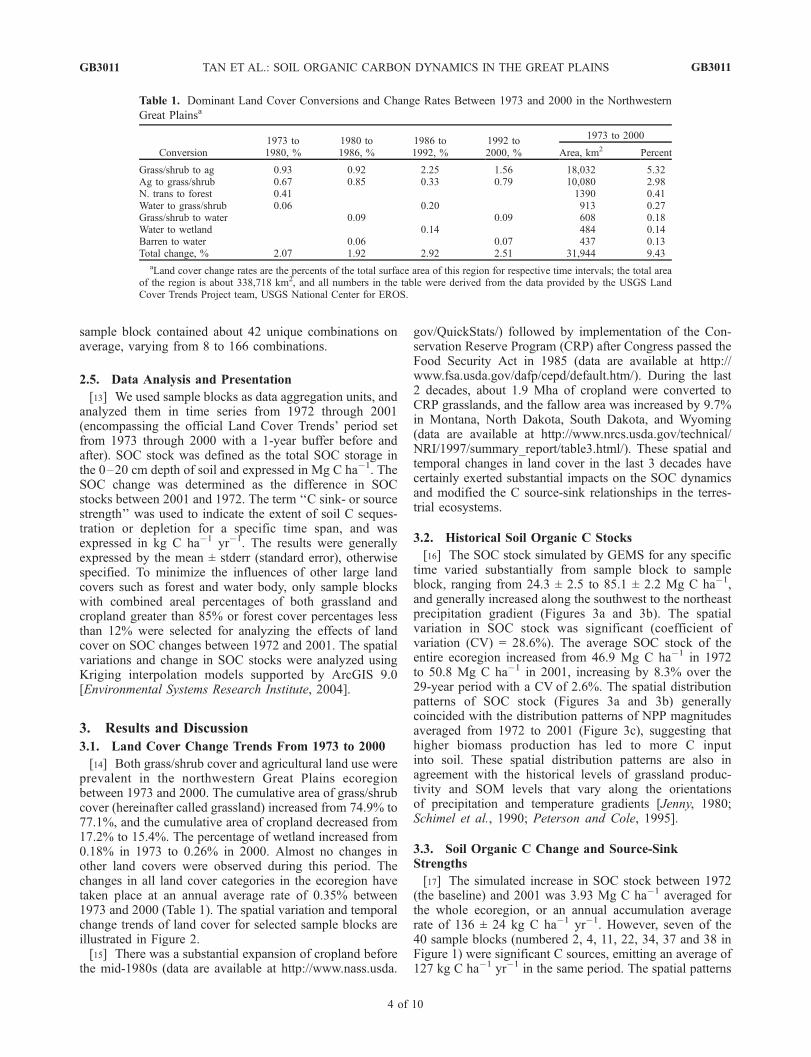
Table 1. Dominant Land Cover Conversions and Change Rates Between 1973 and 2000 in the Northwestern
Great Plainsa
Conversion1973 to1980, %
1980 to1986, %
1986 to1992, %
1992 to2000, %
1973 to 2000
Area, km2 Percent
Grass/shrub to ag 0.93 0.92 2.25 1.56 18,032 5.32Ag to grass/shrub 0.67 0.85 0.33 0.79 10,080 2.98N. trans to forest 0.41 1390 0.41Water to grass/shrub 0.06 0.20 913 0.27Grass/shrub to water 0.09 0.09 608 0.18Water to wetland 0.14 484 0.14Barren to water 0.06 0.07 437 0.13Total change, % 2.07 1.92 2.92 2.51 31,944 9.43
aLand cover change rates are the percents of the total surface area of this region for respective time intervals; the total areaof the region is about 338,718 km2, and all numbers in the table were derived from the data provided by the USGS LandCover Trends Project team, USGS National Center for EROS.
GB3011 TAN ET AL.: SOIL ORGANIC CARBON DYNAMICS IN THE GREAT PLAINS
4 of 10
GB3011
of C sources or sinks are illustrated in Figure 3d. Comparedwith spatial distribution patterns of the SOC stock in 1972,larger C increases over time generally corresponded tolocations with lower SOC contents. The SOC sources(i.e., negative values in Figure 3d) appeared to be associated
with the soils having high C stocks and the blocks domi-nated by cropland use.[18] An expansion of cropland coupled with conventional
tillage led to a significant SOC loss from disturbed soils,particularly prior to 1972 [Donigian et al., 1994]. The land
Figure 2. Spatial distribution patterns and temporal change trends for selected sample blocks (providedby the USGS Land Cover Trends Project team). Numbers below blocks denote block ID and year ofimagery. See color version of this figure at back of this issue.
GB3011 TAN ET AL.: SOIL ORGANIC CARBON DYNAMICS IN THE GREAT PLAINS
5 of 10
GB3011
use change history indicates that there was a trend ofreduced tillage in the 1970s and widespread adoption ofno-tillage and CRP since 1986 in the study area. Thereforewe divided the span from 1972 to 2001 into two timeintervals: 1972 to 1986 and 1986 to 2001. The SOC stocksas of 1972 and 1986 were considered as the respectivebaseline values for these two time intervals to calculate thestrength of C sinks or sources. The relationships betweenthe strength and baseline SOC stock can be generallydescribed by quadratic models as illustrated in Figure 4,but the extent to which the baseline SOC affected thestrength of C sinks or sources was also differentiated bytime intervals, which reflected temporal changes in landcover and probably management. In the period from 1972 to1986, nine sample blocks were a C source of 172 kg C ha�1
yr�1 from soil even though the ecoregion as a whole hadbeen an overall C sink at 101 kg C ha�1 yr�1. Between1986 and 2001, only 5 sample blocks were C sources, with
smaller C source strengths (60 ± 14 kg C ha�1 yr�1) than inthe previous period, and the C sink strength across thewhole ecoregion increased to 168 kg C ha�1 yr�1, rangingfrom 31 to 378 kg C ha�1 yr�1. Figure 4 suggests that thesoils with lower antecedent SOC contents likely havehigher C sink strengths. The soils with higher C contents(>60 Mg ha�1) are more likely to become C sources. Similarobservations have been reported for cropping ecosystems inthe northcentral United States [Tan and Lal, 2005].
3.4. Soil Organic C Temporal Trends Associated WithLand Cover Change History
3.4.1. In Relation to Land Cover Category[19] The data presented in Figure 5 show that the SOC
change (either a source or a sink) between 1972 and 2001was highly related to the proportion of grass cover orcropland area. For sample blocks whose areal portions ofcombined grass and crop covers were greater than 85% or
Figure 3. Spatial distribution patterns of SOC stocks, NPP, and SOC change in the ecoregion between1972 and 2001: (a, b) the spatial distributions of total SOC stocks in 1972 and 2001, respectively; (c) theannual average net primary production (NPP) between 1972 and 2001; and (d) the change in SOC stocksfrom 1972 to 2001, and positive values indicate an increase in SOC stocks over this period). See colorversion of this figure at back of this issue.
GB3011 TAN ET AL.: SOIL ORGANIC CARBON DYNAMICS IN THE GREAT PLAINS
6 of 10
GB3011

forest cover less than 12%, the magnitude of the SOC changefor the study period was positively related to the arealproportion of grassland (R2 = 0.75, n = 34), or negativelyrelated to the areal proportion of cropland (R2 = 0.74, n =34), with both relationships statistically significant. Forexample, sample blocks 2, 4, 22, and 30, where arealpercentages of cropland were greater than 50%, experiencedsignificant SOC depletion. These results suggest that C sinkslikely occur in sample blocks dominated by grass cover,whereas C sources tend to occur in sample blocks withhigher proportions of cropped area.3.4.2. In Relation to Land Cover Change Rates[20] To understand major forces driving C cycles in the
ecosystems, we examined the land use history and itsrelation to the SOC change. Land cover change historywas principally characterized by conversions between grasscover and cropped area, to which the slow C pool, owing toa shorter turnover time, is more sensitive than the passivepool. For sample blocks 3 and 20, we plotted the slow Cpools against the areal ratios of grassland to cropland for theyears of 1973, 1980, 1986, 1992, and 2000 (Figure 6). Slow
C pools proportionally increased with decreasing croppedarea as indicated by the positive slopes of the regressions.The rates of slow C accumulation depended more upon thebaseline pool magnitudes than upon land cover changerates, even though the C dynamics were stimulated by landcover change. The direction of conversion between grass-land and cropland determined whether a site was a sink or asource.[21] Figure 5 shows that 75% of all variance in the SOC
change was associated with the areal proportion of either thegrassland or cropland category in each sample block. Asindicated in Table 1, the land cover change history inthe study area was dominated by conversions betweencultivated area and grassland cover, which should be oneof the major driving factors controlling the SOC dynamics.By analyzing data cited from 23 observation sites world-wide, Conant et al. [2001] found an average SOC seques-tration rate as high as 1010 kg C ha�1 yr�1 with conversionfrom cultivation to grassland. They attributed this huge Csink strength to prior soil C depletion following cultivation.Ogle et al. [2003] used the IPCC model to estimate changein SOC storage in all U.S. agricultural soils over theinventory period from 1982 to 1997. They found thatSOC changes in the U.S. agricultural soils ranged from aloss of 4.4 Tg C yr�1, mainly from managed organic soils,to a gain of 6.9 Tg C yr�1 from managed mineral soils.They attributed most of the uncertainty in estimates of eitherC sources or sinks not only to land cover conversionsbetween cultivated and uncultivated conditions, but also toC losses from managed organic soils.3.4.3. In Relation to the Conservation ReserveProgram (CRP)[22] According to the data provided by USDA Farm
Service Agent (available at http://www.fsa.usda.gov/dafp/cepd/default.htm/), we can attribute the land cover changein the northwestern Great Plains ecoregion, to a greatextent, to the extension of CRP, especially between 1986and 2001. Of all land area of the ecoregion, the arearegistered for CRP increased from 0.05% in 1986 to
Figure 4. Effects of antecedent SOC stocks on C sink orsource strengths (values <0 at y axis refer to C sources): theSOC stock in 1972 as the baseline for the period from 1972to 1986 and the SOC stock in 1986 as the baseline for theperiod from 1986 to 2001.
Figure 5. Magnitudes of C sources or sinks between 1972and 2000 as related to proportions of cropland and grasslandareas (sample blocks with areal percent of combinedcropland and grassland <85% or forest cover >12% wereremoved). Note that each sample block is plotted twice:once in the cropland set and once in the grassland set.
Figure 6. Temporal variations of slow C pools in relationto areal ratios of grass cover against cropped area. Aninteger number surrounding each point symbols refers to thecalendar year. Error bars represent standard errors. Averagestandard error is 0.5 for block 03 and 0.2 for block 20. Bothpassive and labile fractions were not plotted here becausethey showed little sensitivity to land cover change.
GB3011 TAN ET AL.: SOIL ORGANIC CARBON DYNAMICS IN THE GREAT PLAINS
7 of 10
GB3011
3.02% in 1995. About 17% of cropped area was convertedto CRP grassland in 1992 and 13% in 2001 in the ecor-egion. Collins et al. [1999] pointed out that prairie-derivedsoils under conservation practices have a higher potential tosequester C than those derived from other land uses such asforests. On the basis of the paired observation data from14 sites in the Great Plains and western Corn Belt, Follett etal. [2001] estimated an annual soil C sequestration rate (0–20 cm) of 910 kg C ha�1 yr�1 achievable on 10.6 Mha ofCRP land. A regional application of the CENTURY model[Parton et al., 1993] estimated a soil C sequestration rate of600 kg C ha�1 yr�1 on CRP land across the Great Plains[Paustian et al., 2001]. Using IPCC method and changingthe IPCC Base Factor from agricultural land (0.7) to short-term set-aside land (0.8), Eve et al. [2002] estimated anannual increase in SOC of 460 kg C ha�1 yr�1 on CRP landin the northern plains. By evaluating factors responsible forthe change in SOC storage in the U.S. agricultural soilsbetween 1982 and 1997, Ogle et al. [2003] believed thatmost of the net C gain in mineral soils could be attributed toCRP. Therefore we also believe that CRP has enhanced Csinks in the northwestern Great Plains ecoregion between1986 and 2001.
3.5. Dynamics of SOC Fractions in Association WithLand Cover Category
[23] According to CENTURY Soil Organic Matter(SOM) model [Parton et al., 1993], the SOC stock
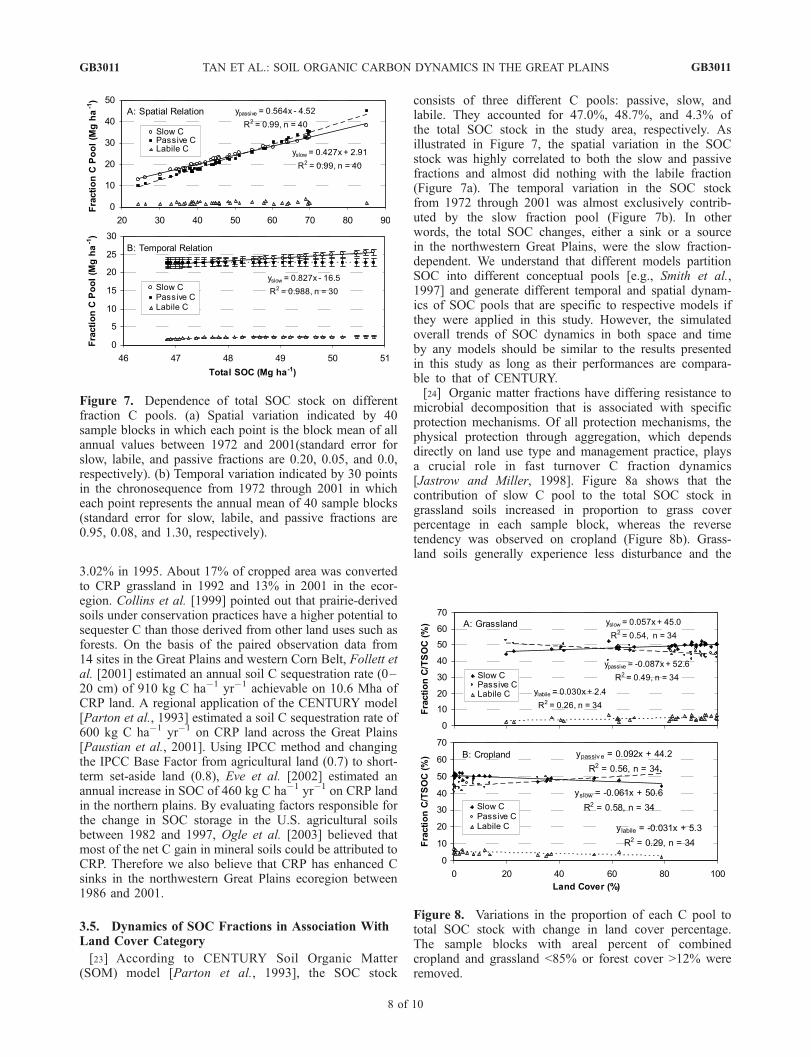
consists of three different C pools: passive, slow, andlabile. They accounted for 47.0%, 48.7%, and 4.3% ofthe total SOC stock in the study area, respectively. Asillustrated in Figure 7, the spatial variation in the SOCstock was highly correlated to both the slow and passivefractions and almost did nothing with the labile fraction(Figure 7a). The temporal variation in the SOC stockfrom 1972 through 2001 was almost exclusively contrib-uted by the slow fraction pool (Figure 7b). In otherwords, the total SOC changes, either a sink or a sourcein the northwestern Great Plains, were the slow fraction-dependent. We understand that different models partitionSOC into different conceptual pools [e.g., Smith et al.,1997] and generate different temporal and spatial dynam-ics of SOC pools that are specific to respective models ifthey were applied in this study. However, the simulatedoverall trends of SOC dynamics in both space and timeby any models should be similar to the results presentedin this study as long as their performances are compara-ble to that of CENTURY.[24] Organic matter fractions have differing resistance to
microbial decomposition that is associated with specificprotection mechanisms. Of all protection mechanisms, thephysical protection through aggregation, which dependsdirectly on land use type and management practice, playsa crucial role in fast turnover C fraction dynamics[Jastrow and Miller, 1998]. Figure 8a shows that thecontribution of slow C pool to the total SOC stock ingrassland soils increased in proportion to grass coverpercentage in each sample block, whereas the reversetendency was observed on cropland (Figure 8b). Grass-land soils generally experience less disturbance and the
Figure 7. Dependence of total SOC stock on differentfraction C pools. (a) Spatial variation indicated by 40sample blocks in which each point is the block mean of allannual values between 1972 and 2001(standard error forslow, labile, and passive fractions are 0.20, 0.05, and 0.0,respectively). (b) Temporal variation indicated by 30 pointsin the chronosequence from 1972 through 2001 in whicheach point represents the annual mean of 40 sample blocks(standard error for slow, labile, and passive fractions are0.95, 0.08, and 1.30, respectively).
Figure 8. Variations in the proportion of each C pool tototal SOC stock with change in land cover percentage.The sample blocks with areal percent of combinedcropland and grassland <85% or forest cover >12% wereremoved.
GB3011 TAN ET AL.: SOIL ORGANIC CARBON DYNAMICS IN THE GREAT PLAINS
8 of 10
GB3011

entrapped fresh organic materials receive more physicalprotection. Conventional cultivation practices on croplandsdisturb the upper 20-cm depth of soil and enhance organicmatter decomposition due to the breakdown of macroag-gregates, whereas conservation measures such as no-till andCRP minimize soil disturbance and promote aggregation[Jastrow et al., 1996; Six and Jastrow, 2002]. That theproportion of passive C pool in the total SOC stockdecreased on cropland (Figure 8b) was mainly due to thedepletion of the slow C fraction, because the pools ofboth passive and labile fractions did not show noticeabletemporal variation over the 29-year span as illustrated inFigure 7B. Studdert et al. [1997] conducted a long-termcrop-pasture (50:50 and 75:25) rotation experiments on onetaxon of Mollisols (Argiudolls) in Balcarce, Argentina.They observed that the SOC content in 0–15 cm depthdecreased by 11.8% in 6 to 7 years under cropping, and thelost C was almost composed of light-fraction. However, thelost SOC was recovered after 3 to 4 years of pasture usage.They attributed the recovery of SOC on pastureland to theincrease in soil aggregate stability and the entrapped freshorganic matter. Mollisols are common in the northwesternGreat Plains ecoregion, a similar effect might be expectedthere.
3.6. Uncertainty Analysis and Model Validation
[25] Uncertainties in model simulation are mainly resultedfrom initial values, inputs, model formulation, and valida-tion data [Klepper, 1997]. GEMS simulates C dynamicsin time and space by deploying the well-establishedCENTURY SOM model in space using the JFD of majordriving variables of the C cycle [Liu et al., 2004a, 2004b].Uncertainties of the input data are propagated to simulatedresults through ensemble Monte Carlo simulations. Asaddressed previously, GEMS simulation was processed foreach randomly picked-up combination (or case) of specificland cover and soil taxon with respective inputs retrievedfrom JFD files and each case was run 20 times to createoutputs weighted by area proportion of cases with standarddeviations. Therefore the inputs and outputs should have abetter representation of the spatial and temporal heteroge-neity of the driving variables than those based on the wall-to-wall simulation that ignores the spatial explicitness andcovariance of these variables. Of course, the uncertainty ofregional estimates depends on the number of sample blocks.Our results with standard errors indicate that forty 10-km by10-km sample blocks in this ecoregion was enough tocapture the general spatial and temporal variability ofC stocks and fluxes. It is impossible to validate our modelingresults using a few isolated point measurements. There areno dynamic regional-scale SOC databases to validate oursimulated results because of multiple constraints at the stateor ecoregion level. Fortunately, our simulated grain yields ofmajor crops were in good agreement with the statewidemean values of grain yields provided by the USDA NationalAgricultural Statistical Service (data available at http://www.usda.gov/nass/) (e.g., corn yield was underestimatedby 5% and spring wheat by 7%). The results presented in thispaper should have represented the general patterns of SOCdynamics because of the stability and robustness of
the GEMS-CENTURY model and the imposition of themultiple constraints.
4. Conclusions
[26] Land cover change history in the northwestern GreatPlains ecoregion was characterized by conversions betweencropland and grassland from 1972 to 2001. The rate ofconversion from cropland to grassland increased due to theintroduction of CRP since 1986 in the four state areas in theecoregion. Conversion of grassland to cropland was adominant driving factor responsible for C sources, and therecovery of grass cover from cultivated lands enhancedSOC sinks, but the magnitude of sequestration may dependon specific management measures. With the exception of afew locations where cropland was prevalent, the northwest-ern Great Plains was a consistent C sink, and SOC dynamicsin the terrestrial ecosystems were highly related to dominantland cover categories (either grassland or cropland) andproportions over the large multiland cover region.
[27] Acknowledgments. The research was funded by the Earth Sur-face Dynamics Program and the Geographic Analysis and MonitoringProgram of the USGS, and by a grant (LUCC99-0022-0035) from NationalAeronautics and Space Administration (NASA). The authors are gratefulfor comments from N. Bliss, M. Budde, P. Waisanen, and several anony-mous reviewers.
ReferencesBiondini, M. E., B. D. Patton, and P. E. Nyren (1998), Grazing intensity andecosystem processes in a northern mixed-grass prairie, USA, Ecol. Appl.,8, 469–479.
Cannell, M. G. R., et al. (1999), National inventories of terrestrial carbonsources and sinks: The U.K. experience, Clim. Change, 42, 505–530.
Chen, W., J. Chen, and J. Cihlar (2000), An integrated terrestrial ecosystemcarbon-budget model based on changes in disturbance, climate, andatmospheric chemistry, Ecol. Modell., 135, 55–79.
Collins, H. P., R. L. Blevins, L. G. Bundy, D. R. Christenson, W. A. Dick,D. R. Huggins, and E. A. Paul (1999), Soil carbon dynamics in corn-based agroecosystems: Results from carbon-13 natural abundance, SoilSci. Soc. Am. J., 63, 584–591.
Conant, R. T., K. Paustian, and E. T. Elliott (2001), Grassland managementand conversion into grassland: Effects on soil carbon, Ecol. Appl., 11,343–355.
Donigian, A. S., Jr., T. O. Barnwell, R. P. Jackson, A. S. Patwardhan, K. B.Weinreich, A. L. Rowell, R. V. Chinnaswamy, and C. V. Cole (1994),Assessment of alternative management practices and policies affectingsoil carbon in agroecosystems of the central United States, Publ. EPAA/600/R-94/067, U.S. Environ. Prot. Agency, Athens, Ga.
Ellert, H. B., H. H. Janzen, and T. Entz (2002), Assessment of a method tomeasure temporal change in soil carbon storage, Soil Sci. Soc. Am. J., 66,1687–1695.
Environmental Systems Research Institute (2004), ArcMap 9.0 version,Redlands, Calif.
Eve, M. D., M. Sperow, K. Howerton, K. Paustian, and R. F. Follett (2002),Predicted impacts of management changes on soil carbon storage for eachcropland region of the conterminous United States, J. Soil Water Con-serv., 57, 196–204.
Follett, R. F., S. E. Samson-Liebig, J. M. Kimble, E. G. Pruessner, and S. W.Waltman (2001), Carbon sequestration under the RP in the historicGreenland soils in the U.S.A., in Soil Carbon Sequestration and theGreenhouse Effect, edited by R. Lala, Spec. Publ. 57, pp. 27–40, SoilSci. Soc. Am., Madison, Wis.
Houghton, J. T., L. G. Meira Filho, B. Lim, K. Tre’anton, I. Mamaty,Y. Bonduki, D. J. Griggs, and B. A. Callander (Eds.) (1997), Revised1996 IPCC Guidelines for National Greenhouse Gas Inventories, 3 vols.,Hadley Cent. Meteorol. Off., Bracknell, UK.
Houghton, R. A., J. L. Hackler, and K. T. Lawrence (1999), The U.S.carbon budget: Contributions from land-use change, Science, 285,574–578.
GB3011 TAN ET AL.: SOIL ORGANIC CARBON DYNAMICS IN THE GREAT PLAINS
9 of 10
GB3011

Jastrow, J. D., and R. M. Miller (1998), Soil aggregate stabilization andcarbon sequestration: Feedbacks through organomineral associations, inSoil Processes and the Carbon Cycle, edited by R. Lal et al., pp. 207–223, CRC, Boca Raton, Fla.
Jastrow, J. D., T. W. Boutton, and R. M. Miller (1996), Carbon dynamics ofaggregate-associated organic matter estimated by carbon-13 natural abun-dance, Soil Sci. Soc. Am. J., 60, 801–807.
Jenkins, J. C., R. A. Birdsey, and Y. Pan (2001), Biomass and NPP estima-tion for the mid-Atlantic region (USA) using plot-level forest inventorydata, Ecol. Appl., 11, 1174–1193.
Jenny, H. (Ed.) (1980), The Soil Resource: Origin and Behavior, 377 pp.,Springer, New York.
Klepper, O. (1997), Multivariate aspects of model uncertainty analysis:Tools for sensitivity analysis and calibration, Ecol. Modell., 101, 1–13.
Liu, S., M. Kaire, E. Wood, O. Dialloc, and L. L. Tieszen (2004a), Impactsof land use and climate change on carbon dynamics in south-centralSenegal, J. Arid Environ., 59, 583–604.
Liu, S., T. R. Loveland, and T. R. Kurtz (2004b), Contemporary carbondynamics in terrestrial ecosystems in the southeastern plains of the UnitedStates, Environ. Manage., 33, 442–456.
Loveland, T. R., T. L. Sohl, S. V. Stehman, A. L. Gallant, K. L. Sayler, andD. E. Napton (2002), A strategy for estimating the rates of recent UnitedStates land-cover changes, Photogramm. Eng. Remote Sens., 68, 1091–1099.
Ogle, S. M., F. J. Breidt, M. D. Eve, and K. Paustian (2003), Uncertainty inestimating land use and management impacts on soil organic carbonstorage for US agricultural lands between 1982 and 1997, Global ChangeBiol., 9, 1521–1542.
Omernik, J. M. (1987), Ecoregions of the conterminous United States,Annu. Assoc. Am. Geogr., 77, 118–125.
Parton, W. J., et al. (1993), Observations and modeling of biomass and soilorganic matter dynamics for the grassland biome worldwide, GlobalBiogeochem. Cycles, 7, 785–809.
Paustian, K., E. T. Elliott, K. Killian, J. Cipra, G. Bluhm, and J. L. Smith(2001), Modeling and regional assessment of soil carbon: A case study ofthe Conservation Reserve Program, in Soil Carbon Sequestration and theGreenhouse Effect, edited by R. Lal, Spec. Publ. 57, pp. 207–225, SoilSci. Soc. Am., Madison, Wis.
Penman, J., et al. (Eds.) (2003), IPCC Good Practice Guidance for LandUse, Land-Use Change and Forestry, Inst. for Global Environ. Strat.,Kanagawa, Japan.
Peterson, G. A., and C. V. Cole (1995), Productivity of Great Plains soils:Past, present, and future, in Conservation of Great Plains Ecosystems,
edited by S. R. Johnson and A. Bouzaher, pp. 325–342, Springer,New York.
Reiners, W. A., S. Liu, K. G. Gerow, M. Keller, and D. S. Schimel (2002),Historical and future land use effects on trace gas emissions using anensemble modeling approach: Costa Rica’s Caribbean Lowlands as anexample, Global Biogeochem. Cycles, 16(4), 1068, doi:10.1029/2001GB001437.
Schimel, D. S., W. J. Parton, T. G. F. Kittel, D. S. Ojima, and C. V. Cole(1990), Grassland biogeochemistry: Links to atmospheric processes,Clim. Change, 17, 13–25.
Six, J., and J. D. Jastrow (2002), Soil organic matter turnover, in Encyclo-pedia of Soil Science, edited by R. Lal, pp. 936 –942, CRC, BocaRaton, Fla.
Smith, P., et al. (1997), A comparison of the performance of nine soilorganic matter models using datasets from seven long-term experiments,Geoderma, 81, 153–225.
Studdert, G. A., H. E. Echeverria, and E. M. Casanovas (1997), Crop-pasture rotation for sustaining the quality and productivity of a typicArgiudoll, Soil Sci. Soc. Am. J., 61, 1466–1472.
Tan, Z. X., and R. Lal (2005), Carbon sequestration potential estimates withchanges in land use and tillage practice in Ohio, USA, Agric. Ecosyst.Environ., in press.
Turner, D. P., W. B. Cohen, and R. E. Kennedy (2000), Alternative spatialresolutions and estimation of carbon flux over a managed forest land-scape in western Oregon, Landscape Ecol., 15, 441–452.
U.S. Department of Agriculture Natural Resources Conservation Service(1994), State Soil Geographic (STATSGO) Data Base: Data use informa-tion, Misc. Publ. 1492, U.S. Dep. of Agric., Washington, D. C.
�������������������������C. A. Johnston, South Dakota Center for Biocomplexity Studies, Box
2202, Brookings, SD 57007, USA. ([email protected])R. Kurtz, T. R. Loveland, and L. L. Tieszen, USGS National Center for
Earth Resources Observation and Science, Sioux Falls, SD 57198, USA.([email protected]; [email protected]; [email protected])J. Liu, Research Associateship Program at the USGS National Center for
EROS, National Research Council, Sioux Falls, SD 57198, USA.([email protected])S. Liu, SAIC, USGS National Center for Earth Resources Observation
and Science, Sioux Falls, SD 57198, USA. ([email protected])Z. Tan, South Dakota Center for Biocomplexity Studies, Box 2202,
Brookings, SD 57007, USA. ([email protected])
GB3011 TAN ET AL.: SOIL ORGANIC CARBON DYNAMICS IN THE GREAT PLAINS
10 of 10
GB3011
3 of 10
Figure 1. Study area and sample block locations in the Northwestern Great Plains ecoregion.
GB3011 TAN ET AL.: SOIL ORGANIC CARBON DYNAMICS IN THE GREAT PLAINS GB3011

5 of 10
Figure 2. Spatial distribution patterns and temporal change trends for selected sample blocks (providedby the USGS Land Cover Trends Project team). Numbers below blocks denote block ID and year ofimagery.
GB3011 TAN ET AL.: SOIL ORGANIC CARBON DYNAMICS IN THE GREAT PLAINS GB3011
6 of 10
Figure 3. Spatial distribution patterns of SOC stocks, NPP, and SOC change in the ecoregion between1972 and 2001: (a, b) the spatial distributions of total SOC stocks in 1972 and 2001, respectively; (c) theannual average net primary production (NPP) between 1972 and 2001; and (d) the change in SOC stocksfrom 1972 to 2001, and positive values indicate an increase in SOC stocks over this period).
GB3011 TAN ET AL.: SOIL ORGANIC CARBON DYNAMICS IN THE GREAT PLAINS GB3011