Soil carbon and nitrogen dynamics in southern African savannas: the effect of vegetation-induced...
15
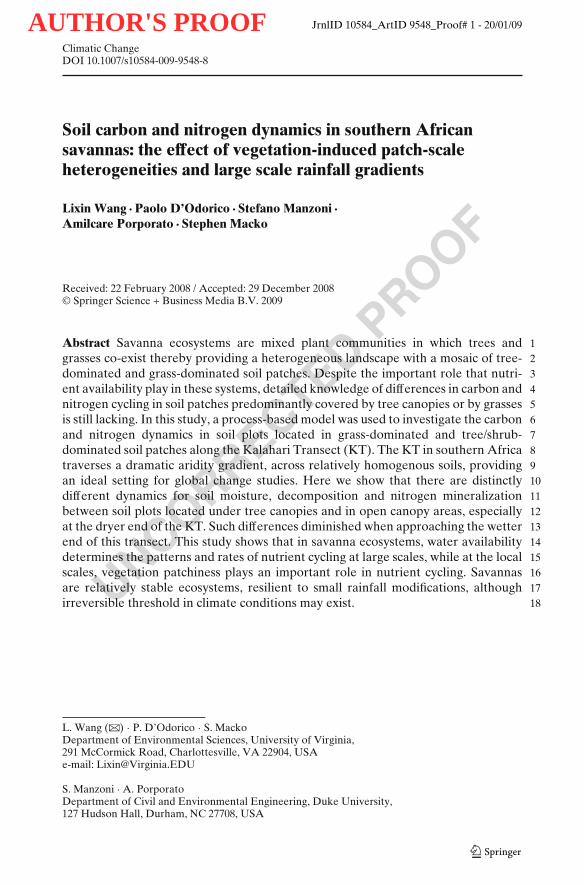
AUTHOR'S PROOF UNCORRECTED PROOF JrnlID 10584_ArtID 9548_Proof# 1 - 20/01/09 Climatic Change DOI 10.1007/s10584-009-9548-8 Soil carbon and nitrogen dynamics in southern African savannas: the effect of vegetation-induced patch-scale heterogeneities and large scale rainfall gradients Lixin Wang · Paolo D’Odorico · Stefano Manzoni · Amilcare Porporato · Stephen Macko Received: 22 February 2008 / Accepted: 29 December 2008 © Springer Science + Business Media B.V. 2009 Abstract Savanna ecosystems are mixed plant communities in which trees and 1 grasses co-exist thereby providing a heterogeneous landscape with a mosaic of tree- 2 dominated and grass-dominated soil patches. Despite the important role that nutri- 3 ent availability play in these systems, detailed knowledge of differences in carbon and 4 nitrogen cycling in soil patches predominantly covered by tree canopies or by grasses 5 is still lacking. In this study, a process-based model was used to investigate the carbon 6 and nitrogen dynamics in soil plots located in grass-dominated and tree/shrub- 7 dominated soil patches along the Kalahari Transect (KT). The KT in southern Africa 8 traverses a dramatic aridity gradient, across relatively homogenous soils, providing 9 an ideal setting for global change studies. Here we show that there are distinctly 10 different dynamics for soil moisture, decomposition and nitrogen mineralization 11 between soil plots located under tree canopies and in open canopy areas, especially 12 at the dryer end of the KT. Such differences diminished when approaching the wetter 13 end of this transect. This study shows that in savanna ecosystems, water availability 14 determines the patterns and rates of nutrient cycling at large scales, while at the local 15 scales, vegetation patchiness plays an important role in nutrient cycling. Savannas 16 are relatively stable ecosystems, resilient to small rainfall modifications, although 17 irreversible threshold in climate conditions may exist. 18 L. Wang (B ) · P. D’Odorico · S. Macko Department of Environmental Sciences, University of Virginia, 291 McCormick Road, Charlottesville, VA 22904, USA e-mail: [email protected] S. Manzoni · A. Porporato Department of Civil and Environmental Engineering, Duke University, 127 Hudson Hall, Durham, NC 27708, USA
Transcript of Soil carbon and nitrogen dynamics in southern African savannas: the effect of vegetation-induced...
AUTHOR'S PROOF
UNCORRECTEDPROOF
JrnlID 10584_ArtID 9548_Proof# 1 - 20/01/09
Climatic ChangeDOI 10.1007/s10584-009-9548-8
Soil carbon and nitrogen dynamics in southern Africansavannas: the effect of vegetation-induced patch-scaleheterogeneities and large scale rainfall gradients
Lixin Wang · Paolo D’Odorico · Stefano Manzoni ·Amilcare Porporato · Stephen Macko
Received: 22 February 2008 / Accepted: 29 December 2008© Springer Science + Business Media B.V. 2009
Abstract Savanna ecosystems are mixed plant communities in which trees and 1grasses co-exist thereby providing a heterogeneous landscape with a mosaic of tree- 2dominated and grass-dominated soil patches. Despite the important role that nutri- 3ent availability play in these systems, detailed knowledge of differences in carbon and 4nitrogen cycling in soil patches predominantly covered by tree canopies or by grasses 5is still lacking. In this study, a process-based model was used to investigate the carbon 6and nitrogen dynamics in soil plots located in grass-dominated and tree/shrub- 7dominated soil patches along the Kalahari Transect (KT). The KT in southern Africa 8traverses a dramatic aridity gradient, across relatively homogenous soils, providing 9an ideal setting for global change studies. Here we show that there are distinctly 10different dynamics for soil moisture, decomposition and nitrogen mineralization 11between soil plots located under tree canopies and in open canopy areas, especially 12at the dryer end of the KT. Such differences diminished when approaching the wetter 13end of this transect. This study shows that in savanna ecosystems, water availability 14determines the patterns and rates of nutrient cycling at large scales, while at the local 15scales, vegetation patchiness plays an important role in nutrient cycling. Savannas 16are relatively stable ecosystems, resilient to small rainfall modifications, although 17irreversible threshold in climate conditions may exist. 18
L. Wang (B) · P. D’Odorico · S. MackoDepartment of Environmental Sciences, University of Virginia,291 McCormick Road, Charlottesville, VA 22904, USAe-mail: [email protected]
S. Manzoni · A. PorporatoDepartment of Civil and Environmental Engineering, Duke University,127 Hudson Hall, Durham, NC 27708, USA
AUTHOR'S PROOF
UNCORRECTEDPROOF
JrnlID 10584_ArtID 9548_Proof# 1 - 20/01/09
Climatic Change
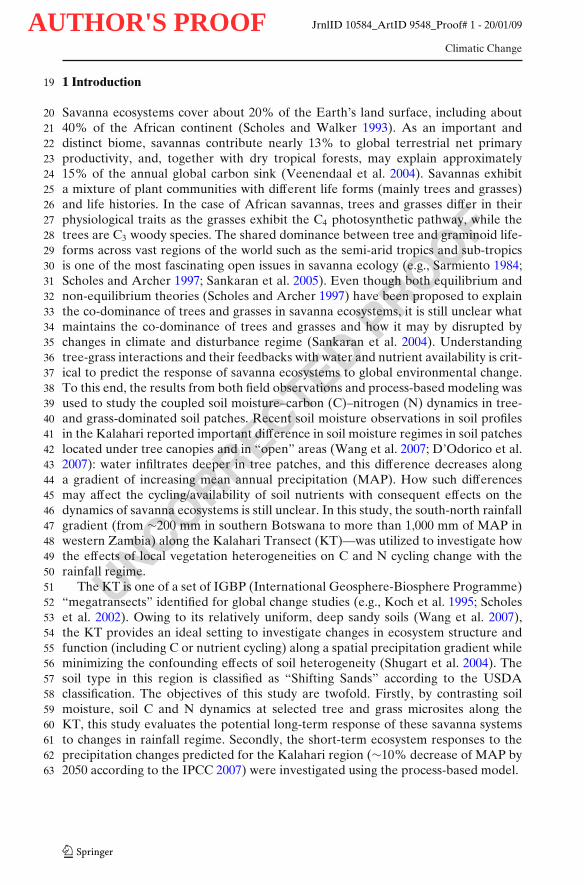
1 Introduction19
Savanna ecosystems cover about 20% of the Earth’s land surface, including about2040% of the African continent (Scholes and Walker 1993). As an important and21distinct biome, savannas contribute nearly 13% to global terrestrial net primary22productivity, and, together with dry tropical forests, may explain approximately2315% of the annual global carbon sink (Veenendaal et al. 2004). Savannas exhibit24a mixture of plant communities with different life forms (mainly trees and grasses)25and life histories. In the case of African savannas, trees and grasses differ in their26physiological traits as the grasses exhibit the C4 photosynthetic pathway, while the27trees are C3 woody species. The shared dominance between tree and graminoid life-28forms across vast regions of the world such as the semi-arid tropics and sub-tropics29is one of the most fascinating open issues in savanna ecology (e.g., Sarmiento 1984;30Scholes and Archer 1997; Sankaran et al. 2005). Even though both equilibrium and31non-equilibrium theories (Scholes and Archer 1997) have been proposed to explain32the co-dominance of trees and grasses in savanna ecosystems, it is still unclear what33maintains the co-dominance of trees and grasses and how it may by disrupted by34changes in climate and disturbance regime (Sankaran et al. 2004). Understanding35tree-grass interactions and their feedbacks with water and nutrient availability is crit-36ical to predict the response of savanna ecosystems to global environmental change.37To this end, the results from both field observations and process-based modeling was38used to study the coupled soil moisture–carbon (C)–nitrogen (N) dynamics in tree-39and grass-dominated soil patches. Recent soil moisture observations in soil profiles40in the Kalahari reported important difference in soil moisture regimes in soil patches41located under tree canopies and in “open” areas (Wang et al. 2007; D’Odorico et al.422007): water infiltrates deeper in tree patches, and this difference decreases along43a gradient of increasing mean annual precipitation (MAP). How such differences44may affect the cycling/availability of soil nutrients with consequent effects on the45dynamics of savanna ecosystems is still unclear. In this study, the south-north rainfall46gradient (from ∼200 mm in southern Botswana to more than 1,000 mm of MAP in47western Zambia) along the Kalahari Transect (KT)—was utilized to investigate how48the effects of local vegetation heterogeneities on C and N cycling change with the49rainfall regime.50
The KT is one of a set of IGBP (International Geosphere-Biosphere Programme)51“megatransects” identified for global change studies (e.g., Koch et al. 1995; Scholes52et al. 2002). Owing to its relatively uniform, deep sandy soils (Wang et al. 2007),53the KT provides an ideal setting to investigate changes in ecosystem structure and54function (including C or nutrient cycling) along a spatial precipitation gradient while55minimizing the confounding effects of soil heterogeneity (Shugart et al. 2004). The56soil type in this region is classified as “Shifting Sands” according to the USDA57classification. The objectives of this study are twofold. Firstly, by contrasting soil58moisture, soil C and N dynamics at selected tree and grass microsites along the59KT, this study evaluates the potential long-term response of these savanna systems60to changes in rainfall regime. Secondly, the short-term ecosystem responses to the61precipitation changes predicted for the Kalahari region (∼10% decrease of MAP by622050 according to the IPCC 2007) were investigated using the process-based model.63
AUTHOR'S PROOF
UNCORRECTEDPROOF
JrnlID 10584_ArtID 9548_Proof# 1 - 20/01/09
Climatic Change
2 Materials and methods 64
2.1 Field sites and data acquirement 65
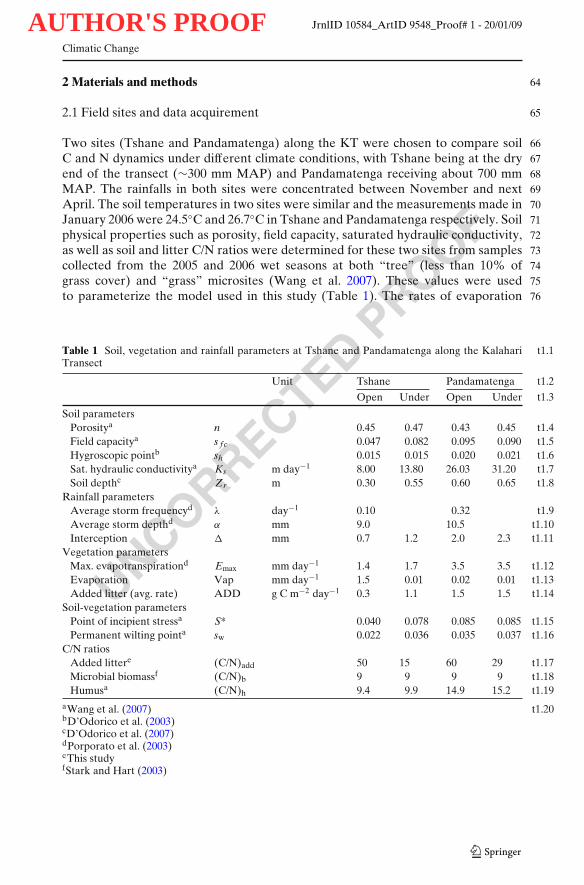
Two sites (Tshane and Pandamatenga) along the KT were chosen to compare soil 66C and N dynamics under different climate conditions, with Tshane being at the dry 67end of the transect (∼300 mm MAP) and Pandamatenga receiving about 700 mm 68MAP. The rainfalls in both sites were concentrated between November and next 69April. The soil temperatures in two sites were similar and the measurements made in 70January 2006 were 24.5◦C and 26.7◦C in Tshane and Pandamatenga respectively. Soil 71physical properties such as porosity, field capacity, saturated hydraulic conductivity, 72as well as soil and litter C/N ratios were determined for these two sites from samples 73collected from the 2005 and 2006 wet seasons at both “tree” (less than 10% of 74grass cover) and “grass” microsites (Wang et al. 2007). These values were used 75to parameterize the model used in this study (Table 1). The rates of evaporation 76
t1.1Table 1 Soil, vegetation and rainfall parameters at Tshane and Pandamatenga along the KalahariTransect
t1.2Unit Tshane Pandamatenga
t1.3Open Under Open Under
Soil parameterst1.4Porositya n 0.45 0.47 0.43 0.45t1.5Field capacitya s f c 0.047 0.082 0.095 0.090t1.6Hygroscopic pointb sh 0.015 0.015 0.020 0.021t1.7Sat. hydraulic conductivitya Ks m day−1 8.00 13.80 26.03 31.20t1.8Soil depthc Zr m 0.30 0.55 0.60 0.65
Rainfall parameterst1.9Average storm frequencyd λ day−1 0.10 0.32
t1.10Average storm depthd α mm 9.0 10.5t1.11Interception � mm 0.7 1.2 2.0 2.3
Vegetation parameterst1.12Max. evapotranspirationd Emax mm day−1 1.4 1.7 3.5 3.5t1.13Evaporation Vap mm day−1 1.5 0.01 0.02 0.01t1.14Added litter (avg. rate) ADD g C m−2 day−1 0.3 1.1 1.5 1.5
Soil-vegetation parameterst1.15Point of incipient stressa S* 0.040 0.078 0.085 0.085t1.16Permanent wilting pointa sw 0.022 0.036 0.035 0.037
C/N ratiost1.17Added littere (C/N)add 50 15 60 29t1.18Microbial biomassf (C/N)b 9 9 9 9t1.19Humusa (C/N)h 9.4 9.9 14.9 15.2
t1.20aWang et al. (2007)bD’Odorico et al. (2003)cD’Odorico et al. (2007)dPorporato et al. (2003)eThis studyfStark and Hart (2003)
AUTHOR'S PROOF
UNCORRECTEDPROOF
JrnlID 10584_ArtID 9548_Proof# 1 - 20/01/09
Climatic Change
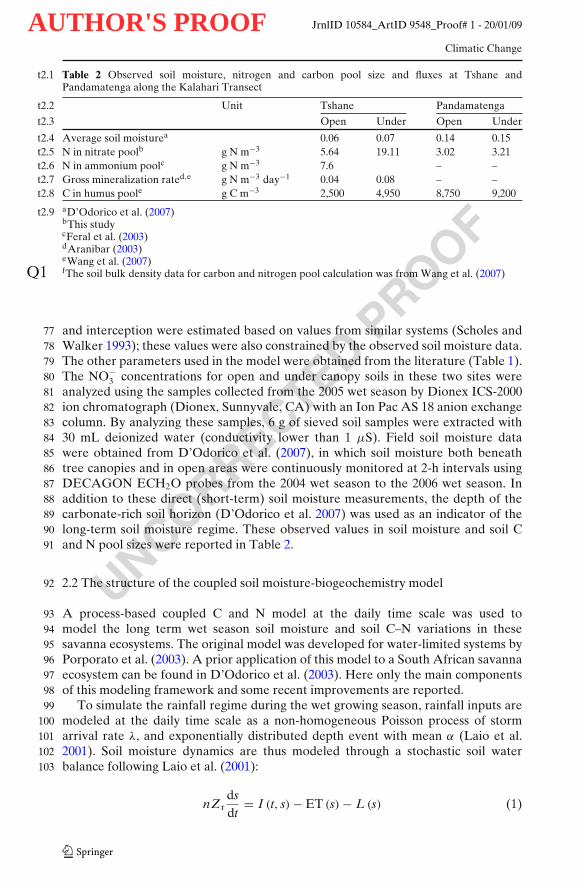
t2.1 Table 2 Observed soil moisture, nitrogen and carbon pool size and fluxes at Tshane andPandamatenga along the Kalahari Transect
t2.2 Unit Tshane Pandamatenga
t2.3 Open Under Open Under
t2.4 Average soil moisturea 0.06 0.07 0.14 0.15t2.5 N in nitrate poolb g N m−3 5.64 19.11 3.02 3.21t2.6 N in ammonium poolc g N m−3 7.6 – –t2.7 Gross mineralization rated,e g N m−3 day−1 0.04 0.08 – –t2.8 C in humus poole g C m−3 2,500 4,950 8,750 9,200
Q1
t2.9 aD’Odorico et al. (2007)bThis studycFeral et al. (2003)dAranibar (2003)eWang et al. (2007)fThe soil bulk density data for carbon and nitrogen pool calculation was from Wang et al. (2007)
and interception were estimated based on values from similar systems (Scholes and77Walker 1993); these values were also constrained by the observed soil moisture data.78The other parameters used in the model were obtained from the literature (Table 1).79The NO−
3 concentrations for open and under canopy soils in these two sites were80analyzed using the samples collected from the 2005 wet season by Dionex ICS-200081ion chromatograph (Dionex, Sunnyvale, CA) with an Ion Pac AS 18 anion exchange82column. By analyzing these samples, 6 g of sieved soil samples were extracted with8330 mL deionized water (conductivity lower than 1 μS). Field soil moisture data84were obtained from D’Odorico et al. (2007), in which soil moisture both beneath85tree canopies and in open areas were continuously monitored at 2-h intervals using86DECAGON ECH2O probes from the 2004 wet season to the 2006 wet season. In87addition to these direct (short-term) soil moisture measurements, the depth of the88carbonate-rich soil horizon (D’Odorico et al. 2007) was used as an indicator of the89long-term soil moisture regime. These observed values in soil moisture and soil C90and N pool sizes were reported in Table 2.91
2.2 The structure of the coupled soil moisture-biogeochemistry model92
A process-based coupled C and N model at the daily time scale was used to93model the long term wet season soil moisture and soil C–N variations in these94savanna ecosystems. The original model was developed for water-limited systems by95Porporato et al. (2003). A prior application of this model to a South African savanna96ecosystem can be found in D’Odorico et al. (2003). Here only the main components97of this modeling framework and some recent improvements are reported.98
To simulate the rainfall regime during the wet growing season, rainfall inputs are99modeled at the daily time scale as a non-homogeneous Poisson process of storm100arrival rate λ, and exponentially distributed depth event with mean α (Laio et al.1012001). Soil moisture dynamics are thus modeled through a stochastic soil water102balance following Laio et al. (2001):103
nZrdsdt
= I (t, s) − ET (s) − L (s) (1)
AUTHOR'S PROOF
UNCORRECTEDPROOF
JrnlID 10584_ArtID 9548_Proof# 1 - 20/01/09
Climatic Change
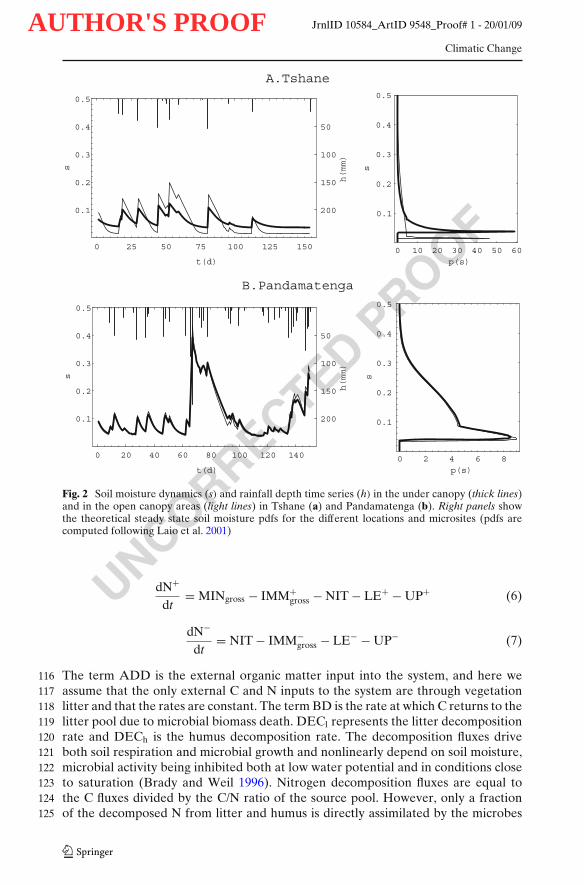
where s is the relative volumetric water content, n is the soil porosity, Zr is active soil 104depth, I(t,s) is the rate of rainfall infiltration, ET(s) is rate of evapotranspiration, and 105L(s) the rate of leakage through the bottom of the soil layer. The same soil depth, 106Zr, was used both for water, C and N budgets. Equation 1, thanks to the random 107infiltration I(t,s), describes a stochastic soil water balance, which can be solved in 108terms of soil moisture probability density function (pdf),p(s) (Laio et al. 2001, Fig. 2). 109
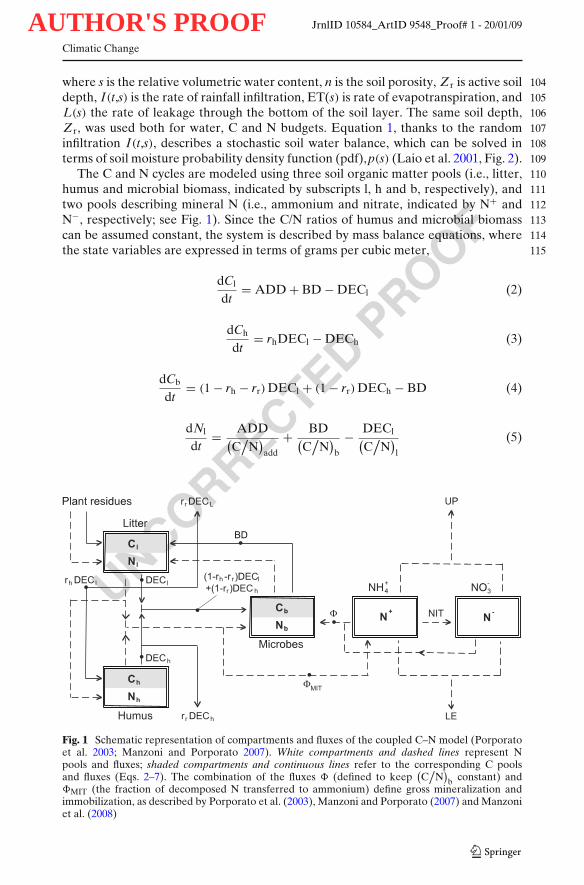
The C and N cycles are modeled using three soil organic matter pools (i.e., litter, 110humus and microbial biomass, indicated by subscripts l, h and b, respectively), and 111two pools describing mineral N (i.e., ammonium and nitrate, indicated by N+ and 112N−, respectively; see Fig. 1). Since the C/N ratios of humus and microbial biomass 113can be assumed constant, the system is described by mass balance equations, where 114the state variables are expressed in terms of grams per cubic meter, 115
dCl
dt= ADD + BD − DECl (2)
dCh
dt= rhDECl − DECh (3)
dCb
dt= (1 − rh − rr) DECl + (1 − rr) DECh − BD (4)
dNl
dt= ADD
(C
/N
)add
+ BD(C
/N
)b
− DECl(C
/N
)l
(5)
Fig. 1 Schematic representation of compartments and fluxes of the coupled C–N model (Porporatoet al. 2003; Manzoni and Porporato 2007). White compartments and dashed lines represent Npools and fluxes; shaded compartments and continuous lines refer to the corresponding C poolsand fluxes (Eqs. 2–7). The combination of the fluxes � (defined to keep
(C
/N
)b constant) and
�MIT (the fraction of decomposed N transferred to ammonium) define gross mineralization andimmobilization, as described by Porporato et al. (2003), Manzoni and Porporato (2007) and Manzoniet al. (2008)
AUTHOR'S PROOF
UNCORRECTEDPROOF
JrnlID 10584_ArtID 9548_Proof# 1 - 20/01/09
Climatic Change
B.Pandamatenga
0 20 40 60 80 100 120 140
t(d)
0.1
0.2
0.3
0.4
0.5
s
200
150
100
50h(mm)
0 2 4 6 8p(s)
0.1
0.2
0.3
0.4
0.5
s
A.Tshane
0 25 50 75 100 125 150
t(d)
0.1
0.2
0.3
0.4
0.5
s
200
150
100
50
h(mm)
0 10 20 30 40 50 60p(s)
0.1
0.2
0.3
0.4
0.5
s
Fig. 2 Soil moisture dynamics (s) and rainfall depth time series (h) in the under canopy (thick lines)and in the open canopy areas (light lines) in Tshane (a) and Pandamatenga (b). Right panels showthe theoretical steady state soil moisture pdfs for the different locations and microsites (pdfs arecomputed following Laio et al. 2001)
dN+
dt= MINgross − IMM+
gross − NIT − LE+ − UP+ (6)
dN−
dt= NIT − IMM−
gross − LE− − UP− (7)
The term ADD is the external organic matter input into the system, and here we116assume that the only external C and N inputs to the system are through vegetation117litter and that the rates are constant. The term BD is the rate at which C returns to the118litter pool due to microbial biomass death. DECl represents the litter decomposition119rate and DECh is the humus decomposition rate. The decomposition fluxes drive120both soil respiration and microbial growth and nonlinearly depend on soil moisture,121microbial activity being inhibited both at low water potential and in conditions close122to saturation (Brady and Weil 1996). Nitrogen decomposition fluxes are equal to123the C fluxes divided by the C/N ratio of the source pool. However, only a fraction124of the decomposed N from litter and humus is directly assimilated by the microbes125
AUTHOR'S PROOF
UNCORRECTEDPROOF
JrnlID 10584_ArtID 9548_Proof# 1 - 20/01/09
Climatic Change
(Fig. 1), while the remaining is mineralized to ammonium according to the parallel 126mineralization scheme (Manzoni and Porporato 2007). Net mineralization is de- 127fined as the difference between gross mineralization (MINgross) and immobilization 128(
IMM+gross, IMM−
gross
), i.e., it refers to the transformation of organic N into NH+
4 . 129
Details on the definition of the gross N fluxes are reported elsewhere (Porporato 130et al. 2003; Manzoni and Porporato 2007). As shown in Eqs. 6 and 7, the dynamics of 131ammonium and nitrate (N+ and N−) were described by the balance of mineralization, 132immobilization, nitrification (NIT), leaching (LE+, LE−) and root uptake (UP+, 133UP−), which in turn strongly depend on soil moisture. Wet and dry deposition as 134well as N fixation are important only in the long-term balance and are neglected in 135this modeling framework. Denitrification, which may take place when soil moisture 136is high, is also neglected in this semiarid ecosystem (Porporato et al. 2003). 137
Owing to the dependence of C and N fluxes on soil moisture, the stochasticity 138of rainfall events is propagated through the soil system, giving rise to different time 139scale responses of C and N pools to soil moisture fluctuations (D’Odorico et al. 2003). 140For example, soil moisture and the fluxes dependent upon it (e.g., decomposition 141and mineralization) oscillate at daily time scale, while the larger soil compartments 142(e.g., soil litter and humus) oscillate at monthly to yearly scales. Because different 143
B.Pandamatenga
0 2000 4000 6000 8000 10000
500
1000
1500
2000
0.0010.0020.0030.0040.005
500
1000
1500
2000
A.Tshane
0 2000 4000 6000 8000 10000
t
500
1000
1500
2000
0.0010.0020.0030.0040.005
500
1000
1500
2000
Cl(gCm –3 )
Cl(gCm –3 )
Cl(gCm –3 )
Cl(gCm –3 )
p l(C )(d)
t p l(C )(d)
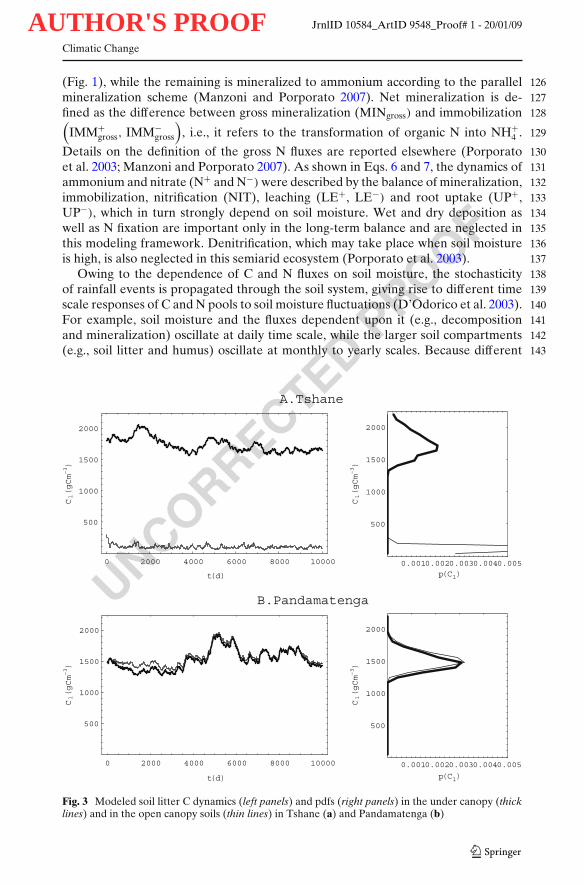
Fig. 3 Modeled soil litter C dynamics (left panels) and pdfs (right panels) in the under canopy (thicklines) and in the open canopy soils (thin lines) in Tshane (a) and Pandamatenga (b)
AUTHOR'S PROOF
UNCORRECTEDPROOF
JrnlID 10584_ArtID 9548_Proof# 1 - 20/01/09
Climatic Change
A. Tshane-open canopy B. Tshane-under canopy
C. Pandamatenga-open canopy D. Pandamatenga-under canopy
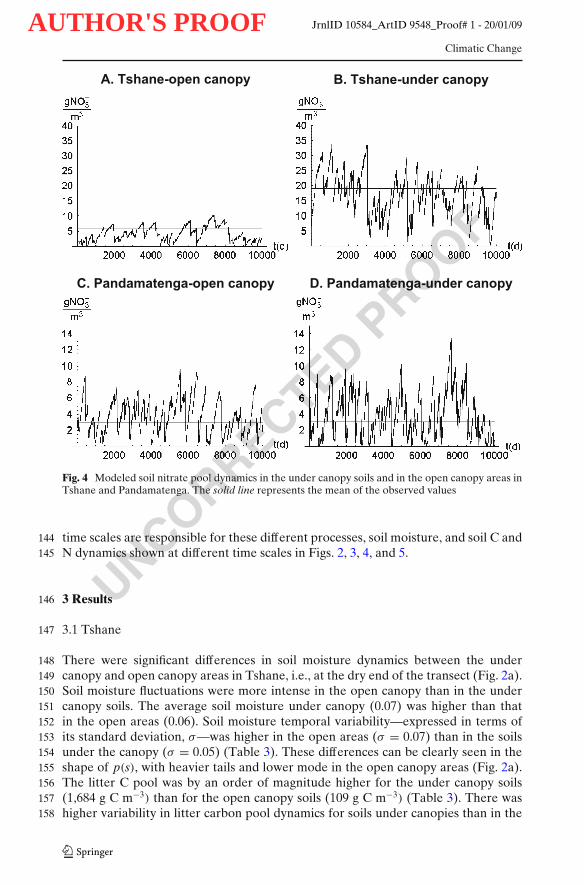
Fig. 4 Modeled soil nitrate pool dynamics in the under canopy soils and in the open canopy areas inTshane and Pandamatenga. The solid line represents the mean of the observed values
time scales are responsible for these different processes, soil moisture, and soil C and144N dynamics shown at different time scales in Figs. 2, 3, 4, and 5.145
3 Results146
3.1 Tshane147
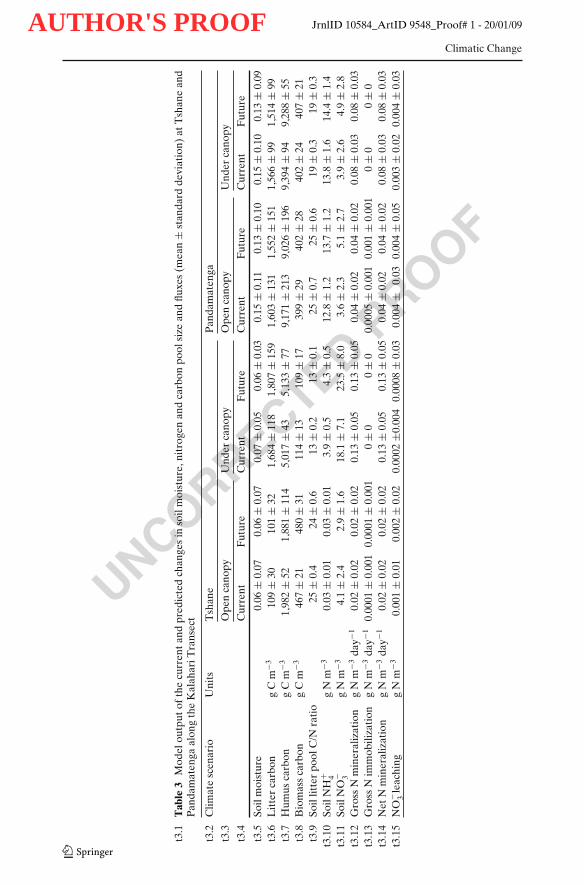
There were significant differences in soil moisture dynamics between the under148canopy and open canopy areas in Tshane, i.e., at the dry end of the transect (Fig. 2a).149Soil moisture fluctuations were more intense in the open canopy than in the under150canopy soils. The average soil moisture under canopy (0.07) was higher than that151in the open areas (0.06). Soil moisture temporal variability—expressed in terms of152its standard deviation, σ—was higher in the open areas (σ = 0.07) than in the soils153under the canopy (σ = 0.05) (Table 3). These differences can be clearly seen in the154shape of p(s), with heavier tails and lower mode in the open canopy areas (Fig. 2a).155The litter C pool was by an order of magnitude higher for the under canopy soils156(1,684 g C m−3) than for the open canopy soils (109 g C m−3) (Table 3). There was157higher variability in litter carbon pool dynamics for soils under canopies than in the158
AUTHOR'S PROOF
UNCORRECTEDPROOF
JrnlID 10584_ArtID 9548_Proof# 1 - 20/01/09
Climatic Change
A. Tshane-open canopy B. Tshane-under canopy
C. Pandamatenga-open canopy D. Pandamatenga-under canopy
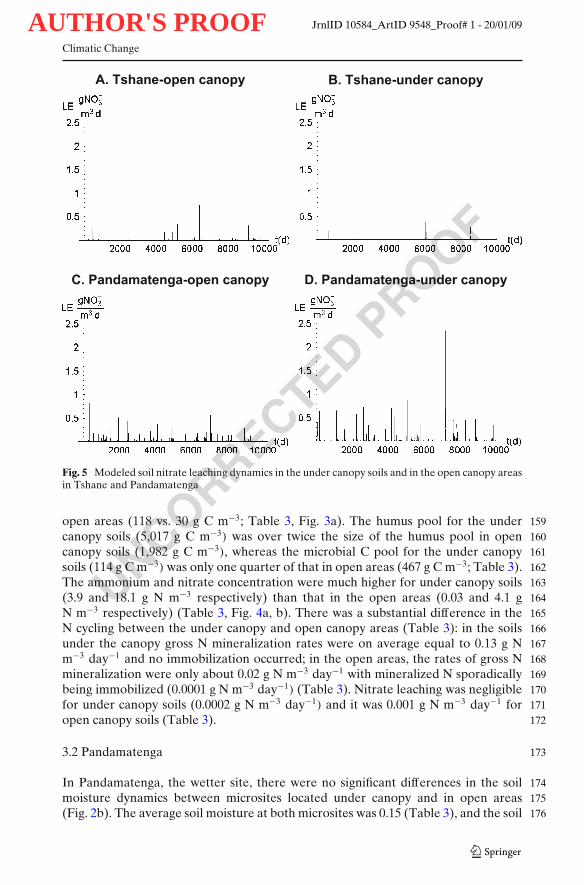
Fig. 5 Modeled soil nitrate leaching dynamics in the under canopy soils and in the open canopy areasin Tshane and Pandamatenga
open areas (118 vs. 30 g C m−3; Table 3, Fig. 3a). The humus pool for the under 159canopy soils (5,017 g C m−3) was over twice the size of the humus pool in open 160canopy soils (1,982 g C m−3), whereas the microbial C pool for the under canopy 161soils (114 g C m−3) was only one quarter of that in open areas (467 g C m−3; Table 3). 162The ammonium and nitrate concentration were much higher for under canopy soils 163(3.9 and 18.1 g N m−3 respectively) than that in the open areas (0.03 and 4.1 g 164N m−3 respectively) (Table 3, Fig. 4a, b). There was a substantial difference in the 165N cycling between the under canopy and open canopy areas (Table 3): in the soils 166under the canopy gross N mineralization rates were on average equal to 0.13 g N 167m−3 day−1 and no immobilization occurred; in the open areas, the rates of gross N 168mineralization were only about 0.02 g N m−3 day−1 with mineralized N sporadically 169being immobilized (0.0001 g N m−3 day−1) (Table 3). Nitrate leaching was negligible 170for under canopy soils (0.0002 g N m−3 day−1) and it was 0.001 g N m−3 day−1 for 171open canopy soils (Table 3). 172
3.2 Pandamatenga 173
In Pandamatenga, the wetter site, there were no significant differences in the soil 174moisture dynamics between microsites located under canopy and in open areas 175(Fig. 2b). The average soil moisture at both microsites was 0.15 (Table 3), and the soil 176
AUTHOR'S PROOF
UNCORRECTEDPROOF
JrnlID 10584_ArtID 9548_Proof# 1 - 20/01/09
Climatic Change
t3.1
Tab
le3
Mod
elou
tput
ofth
ecu
rren
tan
dpr
edic
ted
chan
ges
inso
ilm
oist
ure,
nitr
ogen
and
carb
onpo
olsi
zean
dflu
xes
(mea
n±
stan
dard
devi
atio
n)at
Tsh
ane
and
Pan
dam
aten
gaal
ong
the
Kal
ahar
iTra
nsec
t
t3.2
Clim
ate
scen
ario
Uni
tsT
shan
eP
anda
mat
enga
t3.3
Ope
nca
nopy
Und
erca
nopy
Ope
nca
nopy
Und
erca
nopy
t3.4
Cur
rent
Fut
ure
Cur
rent
Fut
ure
Cur
rent
Fut
ure
Cur
rent
Fut
ure
t3.5
Soil
moi
stur
e0.
06±
0.07
0.06
±0.
070.
07±
0.05
0.06
±0.
030.
15±
0.11
0.13
±0.
100.
15±
0.10
0.13
±0.
09t3
.6L
itte
rca
rbon
gC
m−3
109
±30
101
±32
1,68
4±
118
1,80
7±
159
1,60
3±
131
1,55
2±
151
1,56
6±
991,
514
±99
t3.7
Hum
usca
rbon
gC
m−3
1,98
2±
521,
881
±11
45,
017
±43
5,13
3±
779,
171
±21
39,
026
±19
69,
394
±94
9,28
8±
55t3
.8B
iom
ass
carb
ong
Cm
−346
7±
2148
0±
3111
4±
1310
9±
1739
9±
2940
2±
2840
2±
2440
7±
21t3
.9So
illit
ter
pool
C/N
rati
o25
±0.
424
±0.
613
±0.
213
±0.
125
±0.
725
±0.
619
±0.
319
±0.
3t3
.10
Soil
NH
+ 4g
Nm
−30.
03±
0.01
0.03
±0.
013.
9±
0.5
4.3
±0.
512
.8±
1.2
13.7
±1.
213
.8±
1.6
14.4
±1.
4t3
.11
Soil
NO
− 3g
Nm
−34.
1±
2.4
2.9
±1.
618
.1±
7.1
23.5
±8.
03.
6±
2.3
5.1
±2.
73.
9±
2.6
4.9
±2.
8t3
.12
Gro
ssN
min
eral
izat
ion
gN
m−3
day−
10.
02±
0.02
0.02
±0.
020.
13±
0.05
0.13
±0.
050.
04±
0.02
0.04
±0.
020.
08±
0.03
0.08
±0.
03t3
.13
Gro
ssN
imm
obili
zati
ong
Nm
−3da
y−1
0.00
01±
0.00
10.
0001
±0.
001
0±
00
±0
0.00
05±
0.00
10.
001
±0.
001
0±
00
±0
t3.1
4N
etN
min
eral
izat
ion
gN
m−3
day−
10.
02±
0.02
0.02
±0.
020.
13±
0.05
0.13
±0.
050.
04±
0.02
0.04
±0.
020.
08±
0.03
0.08
±0.
03t3
.15
NO
− 3le
achi
ngg
Nm
−30.
001
±0.
010.
002
±0.
020.
0002
±0.0
040.
0008
±0.
030.
004
±0.
030.
004
±0.
050.
003
±0.
020.
004
±0.
03
AUTHOR'S PROOF
UNCORRECTEDPROOF
JrnlID 10584_ArtID 9548_Proof# 1 - 20/01/09
Climatic Change
moisture pdfs did not significantly differ (Fig. 2b). The litter, humus and microbial C 177pool sizes were all similar for the soils under canopy and in the open areas (Table 3; 178Fig. 3b). Both the ammonium and nitrate level were similar for the under canopy 179(13.8 and 3.9 g N m−3 respectively) and the open canopy (12.8 and 3.6 g N m−3 180respectively) areas (Table 3). Gross N mineralization rates under the canopy (0.08 g 181N m−3 day−1) were twice as much the rates of the open canopy soils (0.04 g N m−3 182day−1) (Table 3). There was no immobilization for the under canopy soils (Table 3) 183but there were sporadic immobilization (0.0005 g N m−3 day−1) episodes for the open 184canopy soils (Table 3). Nitrate leaching was 0.003 and 0.004 g N m−3 day−1 for the 185under canopy and the open canopy soils (Table 3, Fig. 5). 186
3.3 Difference between Tshane and Pandamatenga 187
Soil moisture values were lower at Tshane than at Pandamatenga both at the open 188area and the under the canopy microsites (Table 3, Fig. 2). The litter, humus and 189microbial C pool were also, in most cases, lower at Tshane than that at Pandamatenga 190(Table 3, Fig. 3). At Tshane there were significant differences between under and 191open canopies in soil moisture, litter C/N ratios, litter carbon dynamics and nitrate 192leaching, while these differences diminished at Pandamatenga. Net N mineralization 193was higher under the canopy both at Tshane and Pandamatenga, but the differences 194were much higher at Tshane (Table 3). The nitrate levels at Tshane were significantly 195higher than that at Pandamatenga and such difference was larger for the under 196canopy soils (Fig. 4). The total nitrate leaching was much higher at Pandamatenga 197than that in Tshane, especially for open canopy soils (Table 3, Fig. 5). 198
3.4 Effect of predicted rainfall changes at Tshane and Pandamatenga 199
A predicted decrease in rainfall (∼10% in amount according to IPCC 2007) induced 200a lower soil moisture both at the dry end (except for the open canopy soils in Tshane) 201and at the wet end of the transect, with more obvious effects at the wetter site 202(Table 3). There were no significant changes in the soil C and N pool sizes (Table 3), 203nor did the N fluxes (e.g., N mineralization and immobilization) undergo strong 204changes either. However, the ammonium and nitrate concentrations increased at 205Tshane (only in the soils under the canopy) and at Pandamatenga, (Table 3). At 206either site the mean rates of nitrate leaching did not change considerably, while 207there were substantial increases in the standard deviation of nitrate leaching rates 208in the under canopy soils at Tshane and in the open canopy soils at Pandamatenga 209(Table 3). 210
4 Discussion 211
The model outputs for soil moisture and the C and N pools agree well with the data 212available for the two sites (Tables 2 and 3). The model results generally show that 213there are higher soil C and N stocks and higher soil moisture at the wetter end of 214the transect (Pandamatenga) than that at the dry end (Tshane), where ecosystem 215productivity and litter inputs to the soil are lower, also in agreement with field 216observations (Feral et al. 2003; Veenendaal et al. 2004). 217
AUTHOR'S PROOF
UNCORRECTEDPROOF
JrnlID 10584_ArtID 9548_Proof# 1 - 20/01/09
Climatic Change
Soil moisture is consistently higher for the under canopy soils at the dry end of the218transect, while only minimal differences exist at the wet end. The higher soil moisture219under the canopy is presumably a combination of tree shading effect and different220soil properties. As another important environmental factor, soil temperature is not221included in the model parameter because the soil temperature differences between222sites are very small in these tropical savannas, and the variations in such temperatures223will not likely result in significant changes in C/N cycling. Soil C stocks in under224canopy soils are higher than those in the open canopy soils at both the dry and the225wet end of the transect (Table 3). However, the differences are much larger at the226dry end, presumably due to the larger differences in litter input rates between227the open and under canopy areas at the more arid site. In arid and semiarid land-228scapes the spatial distribution of nutrients tends to be fairly heterogeneous, especially229when shrub encroachment and land degradation occur (Schlesinger et al. 1996). In230these conditions, nutrient-rich and highly-permeable soils tend to develop under231tress/shrub canopies leading to the formation of the so-called “islands of fertility”232(Schlesinger et al. 1990; Okin et al. 2008). Along the KT, the existence of well-233defined islands of fertility are observed at the drier end of the Transect (Tshane),234although at both sites the under-canopy soils show higher permeability and porosity235(Table 1). In Tshane, the rates of N mineralization and the levels of ammonium and236nitrate are higher for the under canopy than in the open canopy soils (Table 3), while237higher N immobilization is predicted by the model in open areas where the litter C/N238ratio and hence microbial N demand are higher (Chapin et al. 2002; Manzoni and239Porporato 2007). In Pandamatenga, despite the different rates of N mineralization240and immobilization, the ammonium and nitrate levels are similar in the under canopy241and the open canopy soils, indicating that the nutrient losses (plant uptake and242leaching) tend to decrease the inorganic pools in the soils under canopy. In general,243changes in soil moisture availability along the KT rainfall gradient affect nutrient244cycling: the levels of soil ammonium increase, while nitrate levels decrease (more245leaching at the wet end) with increasing values of MAP along the KT (Table 3, Feral246et al. 2003). However, the rates of N mineralization are not consistently higher at247the dry or at the wet end (Table 3), due to the combined effect of local vegetation248heterogeneities and the large scale rainfall gradient. These results indicate that at the249larger scales, water availability (e.g., soil moisture) determines the patterns and rates250of nutrient cycling, while at the local scale, vegetation patchiness play an important251role in nutrient cycling. These modeling results are along the same line with the252recent field fertilization experiment results. The fertilization experiments shows that253although there are variations in N mineralization rates for the sites along the KT,254plants do not respond the N fertilizer at both dry and wet ends of the KT (Wang255et al. 2008). These results contradict previous predictions that of a switch between256water and N limitations taking place as annual precipitation exceeded a critical value257(e.g., Scanlon et al. 2003). Instead, they suggest a strong control of water availability258on nutrient cycling. The long term wet season simulations (Figs. 3, 4 and 5) clearly259illustrate how not only inter-site variability shapes the C and N dynamics, but also,260within a single location, significant variability of C and N pools and fluxes occurs. The261simplified model used for these simulations (Eqs. 2–7) does not account explicitly262for vegetation changes (e.g., vegetation biomass and composition) over time, thus263allowing us to focus on the nonlinear dynamics of the soil system in response to264soil moisture fluctuations (D’Odorico et al. 2003). The external stochastic forcing,265
AUTHOR'S PROOF
UNCORRECTEDPROOF
JrnlID 10584_ArtID 9548_Proof# 1 - 20/01/09
Climatic Change
in fact, results in fluctuations of soil variables at different time scales, ranging 266from high-frequency oscillations of inorganic N, mineralization and leaching (Figs. 4 267and 5), to lower-frequency variability of litter (Fig. 3) and other pools with slow 268turnover time. 269
The predicted changes in rainfall regime would cause a decrease in soil moisture 270both at the dry and at the wet end of the transect, though with no significant effects 271on the size of the soil C and N pools and fluxes (Table 3). Changes in the rates 272of nitrate leaching do not exhibit a consistent pattern along the Kalahari Transect 273(Table 3). The slight increase in soil ammonium and nitrate concentrations at both 274sites is presumably due to the decrease in plant uptake induced by the lower soil 275moisture and is in agreement with patterns observed in other semiarid savanna 276ecosystems (Augustine and McNaughton 2004). The relative stability of the soil C 277and N pool and of their fluxes under changing rainfall regimes indicates that these 278savanna ecosystems might be resilient to relative small climate shifts. However, this 279prediction is based on a rather conservative climate change scenario, as it only 280accounts for changes in the rainfall regime changes without including changes in 281other climate variables (e.g., potential evapotranspiration and temperature) and 282vegetation changes. 283
In summary, this study shows that in savanna ecosystems, water availability 284determines the patterns and rates of nutrient cycling at regional scales, while at the 285local scale, vegetation patchiness play an important role in determining the rates 286of nutrient cycling. Savannas seem relatively stable and resilient ecosystems with 287respect to expected changes in rainfall regime for the next 10–50 years. Notably, 288the Kalahari Transect itself can be interpreted as a chronosequence where the drier 289sites may provide useful information on the long-term ecosystem responses to a 290decrease in mean annual rainfall. The existence along the Kalahari of savannas with 291different vegetation composition and structure, and with different soil moisture, C 292and N dynamics, indicates that large and prolonged shifts in precipitation may lead 293to important changes in ecosystem functioning. 294
Acknowledgements The project was supported by NASA-IDS2 (NNG-04-GM71G). We greatly 295appreciate the team-work and field assistance from Lydia Ries, Natalie Mladenov, Matt Therrell, 296Todd Scanlon, Ian McGlynn, Thoralf Meyer (University of Virginia), Kelly Caylor (Indiana 297University), Greg Okin (UCLA), Billy Mogojwa (University of Botswana). We thank Junran Li and 298Ryan Emmanuel for their help with the laboratory and computing instrumentation. The clarity and 299strength of the paper was improved by the comments of two anonymous reviewers and gust editors 300Drs. Sonja Wipf and Francisco Meza to whom we are grateful. 301
References 302
Aranibar J (2003) Nitrogen cycling in southern African soils and plants along rainfall and land-use 303gradients: a stable isotope study. PhD thesis, University of Virginia, p 270 304
Augustine DJ, McNaughton SJ (2004) Temporal asynchrony in soil nutrient dynamics and plant 305production in a semiarid ecosystem. Ecosystems 7:829–840 306
Brady NC, Weil RR (1996) The nature and properties of soil, 11th edn. Prentice Hall, Upper Saddle 307River 308
Chapin FS, Matson PA, Mooney HA (2002) Principles of terrestrial ecosystem ecology. Springer- 309Verlag, New York 310
D’Odorico P, Laio F, Porporato A, Rodriguez-Iturbe I (2003) Hydrologic control on soil carbon and 311nitrogen cycles, II A case study. Adv. Water Resour 26:59–70 312
AUTHOR'S PROOF
UNCORRECTEDPROOF
JrnlID 10584_ArtID 9548_Proof# 1 - 20/01/09
Climatic Change
D’Odorico P, Caylor K, Okin G, Scanlon T (2007) On soil moisture-vegetation feedbacks in dryland313plant ecosystems. J Geophys Res-Biogeosciences 112:G04010. doi:10.1029/2006JG000379314
Feral CJW, Epstein HE, Otter L, Aranibar JN, Shugart HH, Macko SA, Ramontsho J (2003) Carbon315and nitrogen in the soil–plant system along rainfall and land-use gradients in southern Africa.316J Arid Environ 54:327–343317
IPCC (2007) Climate change 2007: the physical science basis. In: Solomon S, Qin D, Manning M,318Chen Z, Marquis M, Averyt K, Tignor M, Miller H (eds) Contribution of Working Group I to319the Fourth Assessment Report of the Intergovernmental Panel on Climate Change. Cambridge320University Press, Cambridge, United KingdomQ2 321
Koch GW, Scholes RJ, Steffen WL, Vitousek PM, Walker BH (1995) The IGBP terrestrial transects:322Science plan, Report No. 36. Stockholm: International Geosphere-Biosphere Programme, p 61323
Laio F, Porporato A, Ridolfi L, Rodriguez-Iturbe I (2001) Plants in water-controlled ecosystems.324Active role in hydrological processes and response to water stress. II Probabilistic soil moisture325dynamics. Adv Water Resour 24(7):707–723326
Manzoni S, Porporato A (2007) A theoretical analysis of nonlinearities and feedbacks in soil carbon327and nitrogen cycles. Soil Biol Biochem 39:1542–1556328
Manzoni S, Porporato A, Schimel JP (2008) Soil heterogeneity in lumped mineralization–329immobilization models. Soil Biol Biochem 40:1137–1148330
Okin GS, Mladenov N, Wang L, Cassel D, Caylor KK, Ringrose S, Macko S (2008) Spatial patterns331of soil nutrients in two southern African savannas. J Geophys Res-Biogeosciences (in press)Q3 332
Porporato A, D’Odorico P, Laio F, Rodriguez-Iturbe I (2003) Soil moisture controls on the nitrogen333cycle I: modeling scheme. Adv Water Res 26:45–58334
Sankaran M, Ratnam J, Hanan NP (2004) Tree–grass coexistence in savannas revisited—insights335from an examination of assumptions and mechanisms invoked in existing models. Ecol Lett3367:480–490337
Sankaran M, Hanan NP, Scholes RJ et al (2005) Determinants of woody cover in African savannas.338Nature 438:846–849339
Sarmiento G (1984) The ecology of neotropical savannas. Harvard University Press, Cambridge, MA340Scanlon TM, Albertson JD, Caylor KK, Williams CA (2003) Determining land surface fractional341
cover from NDVI and rainfall time series for a savanna ecosystem. Remote Sens Environ 82:342376–388343
Schlesinger WH, Reynolds JF, Cunningham GL, Huenneke LF, Jarrell WM, Virginia RA, Whitford344WG (1990) Biological feedbacks in global desertification. Science 247:1043–1048345
Schlesinger W, Raikes J, Hartley A, Cross A (1996) On the spatial pattern of soil nutrients in desert346ecosystems. Ecology 77:364–374347
Scholes RJ, Walker BH (1993) An African savanna. Cambridge University Press, Cambridge348Scholes RJ, Archer SR (1997) Tree–grass interactions in savannas. Ann Rev Ecolog Syst 28:517–544349Scholes RJ, Dowty PR, Caylor K, Parsons DAB, Frost PGH, Shugart HH (2002) Trends in savanna350
structure and composition along an aridity gradient in the Kalahari. J Veg Sci 13:419–428351Shugart HH, Macko SA, Lesolle P, Szuba TA, Mukelabai MM, Dowty P, Swap RJ (2004) The352
SAFARI 2000—Kalahari Transect wet season campaign of year 2000. Glob Chang Biol 10:353273–280354
Stark JM, Hart SC (2003) Nitrogen storage (communication arising): UV-B radiation and soil355microbial communities. Nature 423:137–138. doi:110.1038/423137a356
Veenendaal EM, Kolle O, Lloyd J (2004) Seasonal variation in energy fluxes and carbon dioxide357exchange for a broad-leaved semi-arid savanna (Mopane woodland) in Southern Africa. Glob358Chang Biol 10:318–328359
Wang L, D’Odorico P, Ringrose S, Coetzee S, Macko S (2007) Biogeochemistry of Kalahari sands.360J Arid Environ 71:259–279. doi:10.1016/j.jaridenv.2007.03.016361
Wang L, D’Odorico P, Ries L, Caylor K, Macko S (2008). Combined effects of soil moisture and362nitrogen availability variations on grass productivity in African savannas. Global Change Biology363(in press)Q3 364

AUTHOR'S PROOF
UNCORRECTEDPROOF
JrnlID 10584_ArtID 9548_Proof# 1 - 20/01/09
AUTHOR QUERIES
AUTHOR PLEASE ANSWER ALL QUERIES
Q1. Please provide the designantion of footnote f on Table 2Q2. Please provide the page range of IPCC (2007).Q3. Please provide update on the publication status of Okin et al.
(2008) and Wang et al. (2008)