The Cerrado into-pieces: Habitat fragmentation as a function of landscape use in the savannas of...
12
The Cerrado into-pieces: Habitat fragmentation as a function of landscape use in the savannas of central Brazil Fábio M.V. Carvalho a , Paulo De Marco Júnior a, * , Laerte G. Ferreira b a Laboratório de Ecologia Teórica e Síntese, Departamento de Biologia Geral, Instituto de Ciências Biológicas, Universidade Federal de Goiás, Brazil b Laboratório de Processamento de Imagens e Geoprocessamento, Instituto de Estudos Sócio-Ambientais, Universidade Federal de Goiás, Brazil article info Article history: Received 2 July 2008 Received in revised form 23 January 2009 Accepted 29 January 2009 Available online 6 March 2009 Keywords: Biodiversity conservation Landscape structure Fragmentation indices Land-use patterns abstract Habitat fragmentation and land conversion by humans for agricultural purposes are constant threats to conservation of biodiversity in the Cerrado biome. These landscapes dominated by agricultural activities became dynamic mosaics, which are formed by different land uses. Thus, understanding how the prop- erties of these mosaics affect species’ persistence is one urgent necessity. In this study, the landscape structure of the Cerrado in Goiás State, Central Brazil, was quantified by the use of fragmentation indices, analysed at the class level. The objective of this study was to assess if land use for crop production or for pasture produces different fragmentation patterns, which can result in different pressures for the Cerrado biodiversity. The study showed that landscapes dominated by crops are more fragmented than land- scapes dominated by pastures. These crop-dominated landscapes also presented a smaller number of fragments that could maintain populations of threatened mammal species in Cerrado. Regions with more preserved natural areas are in the northeast of Goiás, where there are rough relief and soil unsuitable for agriculture. Our results indicate that croplands generate a landscape structure more damaging for the conservation of biodiversity in the Cerrado biome. Otherwise, they support the importance to preserve natural remnants, even in areas occupied by agriculture, mainly due to its potential to maintain ecosys- tem services, and suggest that landscapes dominated by pastures should have more current value for conservation, since they showed larger fragments. Ó 2009 Elsevier Ltd. All rights reserved. 1. Introduction Landscapes dominated by agriculture and pastures usually are mosaics that include other land uses, such as urban areas, roads, water courses and patches of natural vegetation (Bennett et al., 2006). These mosaics offer a variety of habitat types for animal and plant species, that can be restricted to the natural elements of the landscape or be capable to use the human-altered areas. These landscapes are dynamic units that change their structure continuously, suffering habitat loss and fragmentation, but also recovering marginal areas. The effects of these changes on natural communities seem predictable, since we have information about the life history and dispersal capability of the organisms under consideration, as well as on the spatial structure parameters re- lated to the modifications occurring in the landscape (Burel et al., 2004). Habitat fragmentation is often defined as a process in which an extension of the habitat is transformed into a number of small patches, with smaller total area, and isolated from each other by a matrix different from the original habitat. The above definition obviously merge the effects of habitat loss (amount of area remain- ing) and habitat fragmentation per se (amount of habitat sub-divi- sion and isolation), which may hind the interpretation of its effects on natural communities (Fahrig, 2003). Some studies suggest that habitat loss has stronger negative effects on biodiversity, compar- atively to isolation, whose effects, besides weaker, can be either negative or positive (Fahrig, 2003). This definition implies in four effects regarding habitat patterns, which form the basis of most of the quantitative fragmentation measures: (a) reduction in habitat amount; (b) increase in number of patches; (c) reduction in patch size; and (d) increase of isolation between patches (Fahrig, 2003). The fragmentation, however, is not a random process, and it occurs preferably in areas where agri- culture activities become more profitable (Baldi et al., 2006). It is expected that each economic activity that competes with native vegetation for space (including different agriculture commodities, cattle raising, mining and urban settlements) is subject to optimal topographic and landscape characteristics to its development (Gautam et al., 2003; Grau et al., 2005; Baldi et al., 2006). Likewise, such human activities also demand different modifications in the landscape (e.g. different needs for roads, different forms of spatial structure of habitat remnants), which may be associated to differ- ent fragmentation patterns (Torbick et al., 2006). 0006-3207/$ - see front matter Ó 2009 Elsevier Ltd. All rights reserved. doi:10.1016/j.biocon.2009.01.031 * Corresponding author. Tel.: +55 62 35211480. E-mail address: [email protected] (P. De Marco). Biological Conservation 142 (2009) 1392–1403 Contents lists available at ScienceDirect Biological Conservation journal homepage: www.elsevier.com/locate/biocon
-
Upload
independent -
Category
Documents
-
view
3 -
download
0
Transcript of The Cerrado into-pieces: Habitat fragmentation as a function of landscape use in the savannas of...
Biological Conservation 142 (2009) 1392–1403
Contents lists available at ScienceDirect
Biological Conservation
journal homepage: www.elsevier .com/locate /biocon
The Cerrado into-pieces: Habitat fragmentation as a function of landscapeuse in the savannas of central Brazil
Fábio M.V. Carvalho a, Paulo De Marco Júnior a,*, Laerte G. Ferreira b
a Laboratório de Ecologia Teórica e Síntese, Departamento de Biologia Geral, Instituto de Ciências Biológicas, Universidade Federal de Goiás, Brazilb Laboratório de Processamento de Imagens e Geoprocessamento, Instituto de Estudos Sócio-Ambientais, Universidade Federal de Goiás, Brazil
a r t i c l e i n f o
Article history:Received 2 July 2008Received in revised form 23 January 2009Accepted 29 January 2009Available online 6 March 2009
Keywords:Biodiversity conservationLandscape structureFragmentation indicesLand-use patterns
0006-3207/$ - see front matter � 2009 Elsevier Ltd. Adoi:10.1016/j.biocon.2009.01.031
* Corresponding author. Tel.: +55 62 35211480.E-mail address: [email protected] (P. De Marco
a b s t r a c t
Habitat fragmentation and land conversion by humans for agricultural purposes are constant threats toconservation of biodiversity in the Cerrado biome. These landscapes dominated by agricultural activitiesbecame dynamic mosaics, which are formed by different land uses. Thus, understanding how the prop-erties of these mosaics affect species’ persistence is one urgent necessity. In this study, the landscapestructure of the Cerrado in Goiás State, Central Brazil, was quantified by the use of fragmentation indices,analysed at the class level. The objective of this study was to assess if land use for crop production or forpasture produces different fragmentation patterns, which can result in different pressures for the Cerradobiodiversity. The study showed that landscapes dominated by crops are more fragmented than land-scapes dominated by pastures. These crop-dominated landscapes also presented a smaller number offragments that could maintain populations of threatened mammal species in Cerrado. Regions with morepreserved natural areas are in the northeast of Goiás, where there are rough relief and soil unsuitable foragriculture. Our results indicate that croplands generate a landscape structure more damaging for theconservation of biodiversity in the Cerrado biome. Otherwise, they support the importance to preservenatural remnants, even in areas occupied by agriculture, mainly due to its potential to maintain ecosys-tem services, and suggest that landscapes dominated by pastures should have more current value forconservation, since they showed larger fragments.
� 2009 Elsevier Ltd. All rights reserved.
1. Introduction
Landscapes dominated by agriculture and pastures usually aremosaics that include other land uses, such as urban areas, roads,water courses and patches of natural vegetation (Bennett et al.,2006). These mosaics offer a variety of habitat types for animaland plant species, that can be restricted to the natural elementsof the landscape or be capable to use the human-altered areas.These landscapes are dynamic units that change their structurecontinuously, suffering habitat loss and fragmentation, but alsorecovering marginal areas. The effects of these changes on naturalcommunities seem predictable, since we have information aboutthe life history and dispersal capability of the organisms underconsideration, as well as on the spatial structure parameters re-lated to the modifications occurring in the landscape (Burel et al.,2004).
Habitat fragmentation is often defined as a process in which anextension of the habitat is transformed into a number of smallpatches, with smaller total area, and isolated from each other bya matrix different from the original habitat. The above definition
ll rights reserved.
).
obviously merge the effects of habitat loss (amount of area remain-ing) and habitat fragmentation per se (amount of habitat sub-divi-sion and isolation), which may hind the interpretation of its effectson natural communities (Fahrig, 2003). Some studies suggest thathabitat loss has stronger negative effects on biodiversity, compar-atively to isolation, whose effects, besides weaker, can be eithernegative or positive (Fahrig, 2003).
This definition implies in four effects regarding habitat patterns,which form the basis of most of the quantitative fragmentationmeasures: (a) reduction in habitat amount; (b) increase in numberof patches; (c) reduction in patch size; and (d) increase of isolationbetween patches (Fahrig, 2003). The fragmentation, however, isnot a random process, and it occurs preferably in areas where agri-culture activities become more profitable (Baldi et al., 2006). It isexpected that each economic activity that competes with nativevegetation for space (including different agriculture commodities,cattle raising, mining and urban settlements) is subject to optimaltopographic and landscape characteristics to its development(Gautam et al., 2003; Grau et al., 2005; Baldi et al., 2006). Likewise,such human activities also demand different modifications in thelandscape (e.g. different needs for roads, different forms of spatialstructure of habitat remnants), which may be associated to differ-ent fragmentation patterns (Torbick et al., 2006).
F.M.V. Carvalho et al. / Biological Conservation 142 (2009) 1392–1403 1393
At present, there is a growing amount of evidence that supportsthe importance of agriculture-dominated landscapes for conserva-tion of a set of biodiversity elements (Potts et al., 2006; Vander-meer and Perfecto, 2007). These areas can maintain a vegetationstructure with more permeability in the matrix among fragments;thus, the individuals can move more easily, what contributes forthe processes of recolonisation and maintenance of genetic diver-sity. A landscape mosaic approach consider these landscapes as aspatially complex and heterogeneous structure, formed by differ-ent types of patches and where the matrix contains different typesof habitats, more or less favourable to the species of the naturalhabitat considered (Metzger, 1999). Therefore, the matrix of theseareas should not be seen simply as a hostile environment, but as anarea that could be managed to contribute to the conservation ofbiodiversity even in areas where most of the natural habitat has al-ready been converted (Vandermeer and Perfecto, 2007).
We consider that habitat fragmentation, more specifically areaand isolation, should be used as surrogates for the probability ofpersistence of many threatened species. Many studies demon-strated that population size is one of the most efficient predictorsof extinction risk (O’Grady et al., 2004; Fagan and Holmes, 2006),especially for large species (Cardillo et al., 2005). This suggests thatthe area available for colonisation may be a good predictor for spe-cies persistence, since large and connected areas will probablymaintain large populations. We assume that probability of persis-tence is a function of the maximum attainable abundance in a frag-ment and this vary among species due to their bionomiccharacteristics, as habitat and diet specialization or body size (Da-muth, 1981; Promislow and Harvey, 1990; Kelt and Van Vuren,1999; Jetz et al., 2004; Fernandez and Vrba, 2005). In mammals,especially those with territorial behaviour, a crude estimate for thismaximum abundance could be made using the mean home rangeof individuals or groups (in social species) for a focal species andthis was used for many conservation purposes (Kirk and Bathe,1994; MacDonald and Rushton, 2003; Jetz et al., 2004). Thus, thedistribution of fragment areas is expected to be a useful surrogatefor the probability of persistence in a given landscape. Consideringthe lack of distributional information of many threatened species,especially in tropical areas of the world (Nelson et al., 1990; Kuperet al., 2006; Tobler et al., 2007), the fragmentation pattern is a cost-effective surrogate for species persistence and may be useful toevaluate the differences among land-use strategies in respect tobiodiversity conservation.
The Cerrado biome is located in central Brazil, and has an areaof about 2 million km2, which corresponds to approximately 25%of the Brazilian territory (IBGE, 2004). The Cerrado is formed bydifferent vegetation physiognomies, from savanna-like formationsto forest forms, like gallery forests (Eiten, 1982; Redford andFonseca, 1986). The Cerrado biome presents a high species rich-ness and high endemism of plants and vertebrates (Myers et al.,2000; Colli et al., 2002; Klink and Machado, 2005) and is undera rapid process of conversion to soya and maize plantation, exten-sive cattle raising (Klink and Moreira, 2002; Klink and Machado,2005), and an imminent expansion of sugar cane plantations. Cur-rently, about of 39% of its total area is under non-Cerrado landcover (Sano et al., 2008), although Machado et al. (2004) considera worst scenario with approximately 55% of Cerrado converted toother land cover classes. This difference is probably related todivergences in the identification of native pastures and naturalor altered areas. Moreover, only 2% of Cerrado area is inside pro-tected areas (Klink and Machado, 2005). Due to its high ende-mism and strong human pressure, the Cerrado is consideredone of the hotspots for the conservation of biodiversity in theworld (Myers et al., 2000).
In face of the rapid land use changes that resulted from agricul-ture development and human population growth (Tilman et al.,
2001), it is urgent to understand how the properties of the landuse mosaics influence the persistence of animal and plant popula-tions and the maintenance of ecological processes. A recent analy-sis of the Cerrado areas on Mato Grosso and Bahia in Brazil showedthat there is a relation between slope, land tenure and vegetationdynamics with the fragmentation pattern (Brannstrom et al.,2008), but the core area of Cerrado of Goiás was not analysed. Thus,it is fundamental to provide a predictive view of the relations be-tween human activities and the parameters that describe habitatfragmentation that are directly related to biodiversity conserva-tion. In this study we analyse the landscape structure in Goiás,the only Brazilian state thoroughly within the Cerrado biome, test-ing if landscapes dominated by pastures or by crops differ in theirfragmentation patterns, and how they could be predictable fromother environmental variables. Additionally, we highlight the con-servation value of the Cerrado remnants evaluating the potentialoccurrence of some threatened mammal species based on somesimple assumptions about their expected densities based on homerange estimates. Under this approach we compare the potentialoccurrence of jaguar (Panthera onca), pampas cat (Leopardus colo-colo), bush dog (Speothos venaticus), giant anteater (Myrmecophagatridactyla), giant armadillo (Priodontes maximus) and maned wolf(Chrysocyon brachyurus) in relation to land use patterns, hopingto determine how future economic pressures to convert the Cerra-do could affect these species. All these species are consideredthreatened based on IUCN criteria in the Brazilian Red List (IBAMA,2003).
2. Materials and methods
2.1. Environmental information
Terrain slope data was obtained from Hydro-1 K digital eleva-tion model (http://edc.usgs.gov/products/elevation/gtopo30/hy-dro/index.html), processed at the resolution of 0.041 decimaldegrees. Land cover information, regarding the distribution of bothnative and converted Cerrado classes, was based on interpretationof 2001 and 2002 Landsat ETM+ satellite images (Sano et al., 2008)interpreted through a semi-automated data analysis strategy; i.e.each 1 � 1.5� subscene was segmented (divided into groups ofadjacent and spectrally uniform pixels). The polygons generatedwere then converted into shapefile format and visually interpretedon the computer screen by overlaying them on the correspondingRGB ETM+ colour composites of bands 3, 4, and 5. The followingland cover classes were considered in this study: natural vegeta-tion – grasslands, shrublands, forestlands, and secondary growths(capoeira); anthropic classes – croplands, pasturelands, reforesta-tions, urban areas, and mining areas. The overall accuracy, ana-lysed in terms of two classes – natural vegetation versus non-Cerrado land cover – was about 90%.
It is important to emphasize that the images used for mappingthe land cover classes were selected based on their radiometricquality and absence of cloud cover (less than 10%). Thus, mostimages were from the dry season months of 2002 (Sano et al.,2007, 2008). Due to partial cloud cover, some scenes needed tobe replaced by 2001 acquisitions. If this was the case, the over-passes selected were also from the dry season months. Thus, theconspicuous seasonality/phenology of the Cerrado biome did nothave a significant impact on the discrimination of the land coverclasses.
The land cover mapping of the state of Goiás (Fig. 1) was a majoreffort (within the context of the project Identification of PriorityAreas for Biodiversity Conservation in Goiás State), which con-sisted in the interpretation of 23 Landsat scenes, extensive fieldwork, and ancillary data (e.g. Radambrasil maps, agricultural cen-sus data and terrain features). Certainly, this map will need to be
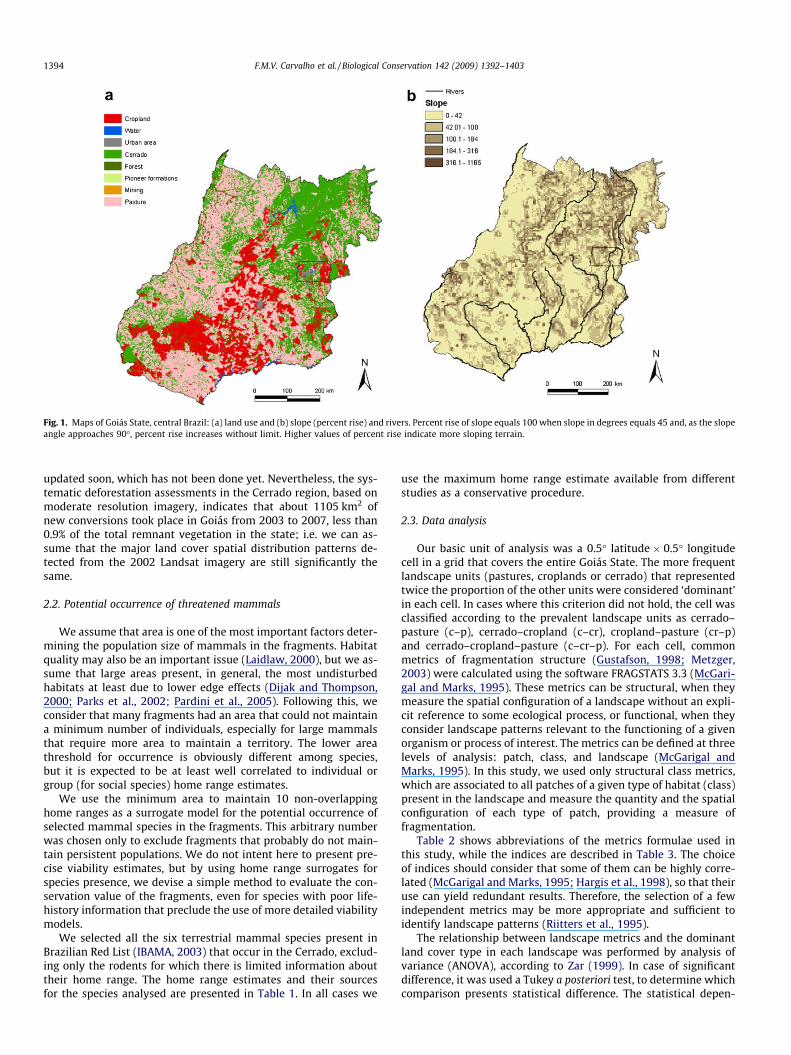
Fig. 1. Maps of Goiás State, central Brazil: (a) land use and (b) slope (percent rise) and rivers. Percent rise of slope equals 100 when slope in degrees equals 45 and, as the slopeangle approaches 90�, percent rise increases without limit. Higher values of percent rise indicate more sloping terrain.
1394 F.M.V. Carvalho et al. / Biological Conservation 142 (2009) 1392–1403
updated soon, which has not been done yet. Nevertheless, the sys-tematic deforestation assessments in the Cerrado region, based onmoderate resolution imagery, indicates that about 1105 km2 ofnew conversions took place in Goiás from 2003 to 2007, less than0.9% of the total remnant vegetation in the state; i.e. we can as-sume that the major land cover spatial distribution patterns de-tected from the 2002 Landsat imagery are still significantly thesame.
2.2. Potential occurrence of threatened mammals
We assume that area is one of the most important factors deter-mining the population size of mammals in the fragments. Habitatquality may also be an important issue (Laidlaw, 2000), but we as-sume that large areas present, in general, the most undisturbedhabitats at least due to lower edge effects (Dijak and Thompson,2000; Parks et al., 2002; Pardini et al., 2005). Following this, weconsider that many fragments had an area that could not maintaina minimum number of individuals, especially for large mammalsthat require more area to maintain a territory. The lower areathreshold for occurrence is obviously different among species,but it is expected to be at least well correlated to individual orgroup (for social species) home range estimates.
We use the minimum area to maintain 10 non-overlappinghome ranges as a surrogate model for the potential occurrence ofselected mammal species in the fragments. This arbitrary numberwas chosen only to exclude fragments that probably do not main-tain persistent populations. We do not intent here to present pre-cise viability estimates, but by using home range surrogates forspecies presence, we devise a simple method to evaluate the con-servation value of the fragments, even for species with poor life-history information that preclude the use of more detailed viabilitymodels.
We selected all the six terrestrial mammal species present inBrazilian Red List (IBAMA, 2003) that occur in the Cerrado, exclud-ing only the rodents for which there is limited information abouttheir home range. The home range estimates and their sourcesfor the species analysed are presented in Table 1. In all cases we
use the maximum home range estimate available from differentstudies as a conservative procedure.
2.3. Data analysis
Our basic unit of analysis was a 0.5� latitude � 0.5� longitudecell in a grid that covers the entire Goiás State. The more frequentlandscape units (pastures, croplands or cerrado) that representedtwice the proportion of the other units were considered ‘dominant’in each cell. In cases where this criterion did not hold, the cell wasclassified according to the prevalent landscape units as cerrado–pasture (c–p), cerrado–cropland (c–cr), cropland–pasture (cr–p)and cerrado–cropland–pasture (c–cr–p). For each cell, commonmetrics of fragmentation structure (Gustafson, 1998; Metzger,2003) were calculated using the software FRAGSTATS 3.3 (McGari-gal and Marks, 1995). These metrics can be structural, when theymeasure the spatial configuration of a landscape without an expli-cit reference to some ecological process, or functional, when theyconsider landscape patterns relevant to the functioning of a givenorganism or process of interest. The metrics can be defined at threelevels of analysis: patch, class, and landscape (McGarigal andMarks, 1995). In this study, we used only structural class metrics,which are associated to all patches of a given type of habitat (class)present in the landscape and measure the quantity and the spatialconfiguration of each type of patch, providing a measure offragmentation.
Table 2 shows abbreviations of the metrics formulae used inthis study, while the indices are described in Table 3. The choiceof indices should consider that some of them can be highly corre-lated (McGarigal and Marks, 1995; Hargis et al., 1998), so that theiruse can yield redundant results. Therefore, the selection of a fewindependent metrics may be more appropriate and sufficient toidentify landscape patterns (Riitters et al., 1995).
The relationship between landscape metrics and the dominantland cover type in each landscape was performed by analysis ofvariance (ANOVA), according to Zar (1999). In case of significantdifference, it was used a Tukey a posteriori test, to determine whichcomparison presents statistical difference. The statistical depen-
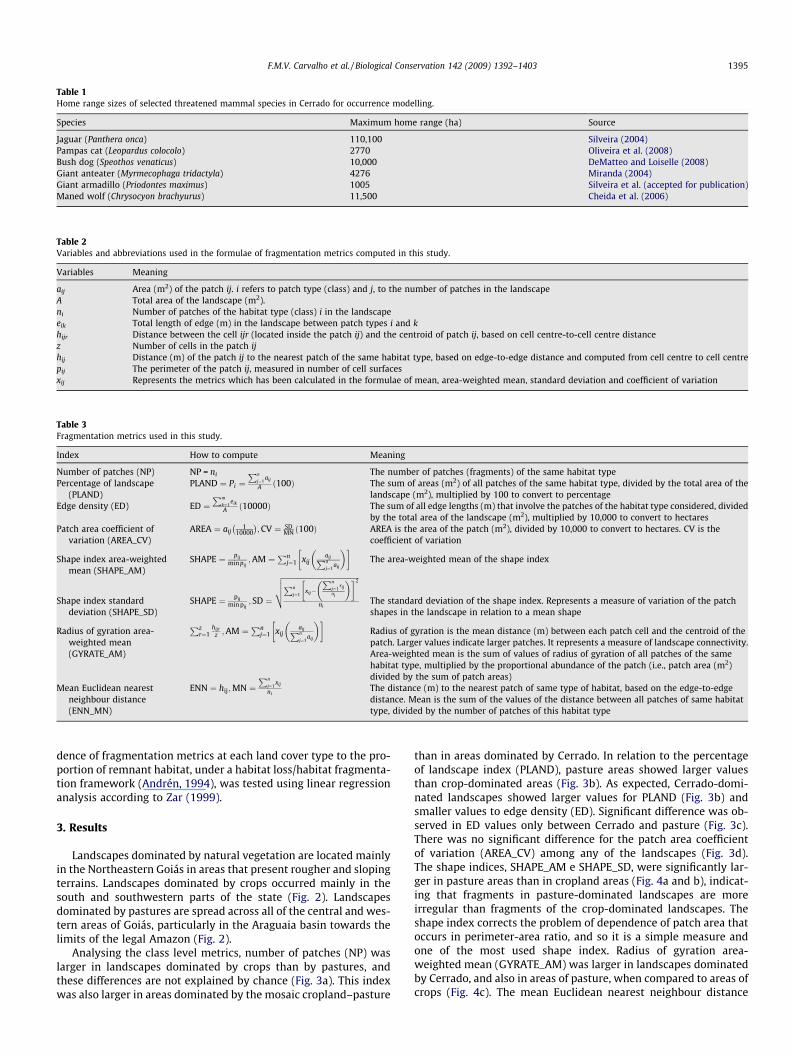
Table 1Home range sizes of selected threatened mammal species in Cerrado for occurrence modelling.
Species Maximum home range (ha) Source
Jaguar (Panthera onca) 110,100 Silveira (2004)Pampas cat (Leopardus colocolo) 2770 Oliveira et al. (2008)Bush dog (Speothos venaticus) 10,000 DeMatteo and Loiselle (2008)Giant anteater (Myrmecophaga tridactyla) 4276 Miranda (2004)Giant armadillo (Priodontes maximus) 1005 Silveira et al. (accepted for publication)Maned wolf (Chrysocyon brachyurus) 11,500 Cheida et al. (2006)
Table 2Variables and abbreviations used in the formulae of fragmentation metrics computed in this study.
Variables Meaning
aij Area (m2) of the patch ij. i refers to patch type (class) and j, to the number of patches in the landscapeA Total area of the landscape (m2).ni Number of patches of the habitat type (class) i in the landscapeeik Total length of edge (m) in the landscape between patch types i and khijr Distance between the cell ijr (located inside the patch ij) and the centroid of patch ij, based on cell centre-to-cell centre distancez Number of cells in the patch ijhij Distance (m) of the patch ij to the nearest patch of the same habitat type, based on edge-to-edge distance and computed from cell centre to cell centrepij The perimeter of the patch ij, measured in number of cell surfacesxij Represents the metrics which has been calculated in the formulae of mean, area-weighted mean, standard deviation and coefficient of variation
Table 3Fragmentation metrics used in this study.
Index How to compute Meaning
Number of patches (NP) NP = ni The number of patches (fragments) of the same habitat typePercentage of landscape
(PLAND)PLAND ¼ Pi ¼
Pn
j¼1aij
A ð100Þ The sum of areas (m2) of all patches of the same habitat type, divided by the total area of thelandscape (m2), multiplied by 100 to convert to percentage
Edge density (ED) ED ¼Pm
k¼1eik
A ð10000Þ The sum of all edge lengths (m) that involve the patches of the habitat type considered, dividedby the total area of the landscape (m2), multiplied by 10,000 to convert to hectares
Patch area coefficient ofvariation (AREA_CV)
AREA ¼ aij1
10000
� �;CV ¼ SD
MN ð100Þ AREA is the area of the patch (m2), divided by 10,000 to convert to hectares. CV is thecoefficient of variation
Shape index area-weightedmean (SHAPE_AM)
SHAPE ¼ pijmin pij
;AM ¼Pn
j¼1 xijaijPn
j¼1aij
� �� �The area-weighted mean of the shape index
Shape index standarddeviation (SHAPE_SD)
SHAPE ¼ pijmin pij
; SD ¼
ffiffiffiffiffiffiffiffiffiffiffiffiffiffiffiffiffiffiffiffiffiffiffiffiffiffiffiffiffiffiffiffiffiffiffiffiffiffiffiffiffiffiPn
j¼1xij�
Pn
j¼1xij
ni
� �� �2
ni
vuutThe standard deviation of the shape index. Represents a measure of variation of the patchshapes in the landscape in relation to a mean shape
Radius of gyration area-weighted mean(GYRATE_AM)
Pzr¼1
hijr
z ;AM ¼Pn
j¼1 xijaijPn
j¼1aij
� �� �Radius of gyration is the mean distance (m) between each patch cell and the centroid of thepatch. Larger values indicate larger patches. It represents a measure of landscape connectivity.Area-weighted mean is the sum of values of radius of gyration of all patches of the samehabitat type, multiplied by the proportional abundance of the patch (i.e., patch area (m2)divided by the sum of patch areas)
Mean Euclidean nearestneighbour distance(ENN_MN)
ENN ¼ hij;MN ¼Pn
j¼1xij
niThe distance (m) to the nearest patch of same type of habitat, based on the edge-to-edgedistance. Mean is the sum of the values of the distance between all patches of same habitattype, divided by the number of patches of this habitat type
F.M.V. Carvalho et al. / Biological Conservation 142 (2009) 1392–1403 1395
dence of fragmentation metrics at each land cover type to the pro-portion of remnant habitat, under a habitat loss/habitat fragmenta-tion framework (Andrén, 1994), was tested using linear regressionanalysis according to Zar (1999).
3. Results
Landscapes dominated by natural vegetation are located mainlyin the Northeastern Goiás in areas that present rougher and slopingterrains. Landscapes dominated by crops occurred mainly in thesouth and southwestern parts of the state (Fig. 2). Landscapesdominated by pastures are spread across all of the central and wes-tern areas of Goiás, particularly in the Araguaia basin towards thelimits of the legal Amazon (Fig. 2).
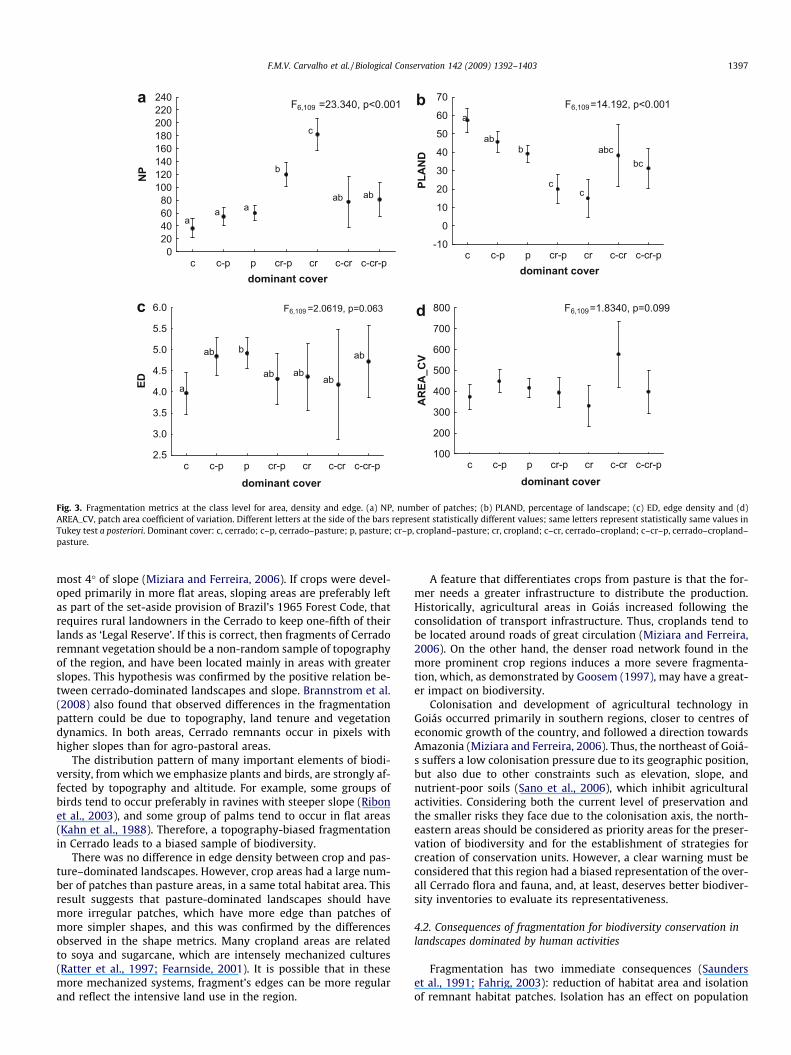
Analysing the class level metrics, number of patches (NP) waslarger in landscapes dominated by crops than by pastures, andthese differences are not explained by chance (Fig. 3a). This indexwas also larger in areas dominated by the mosaic cropland–pasture
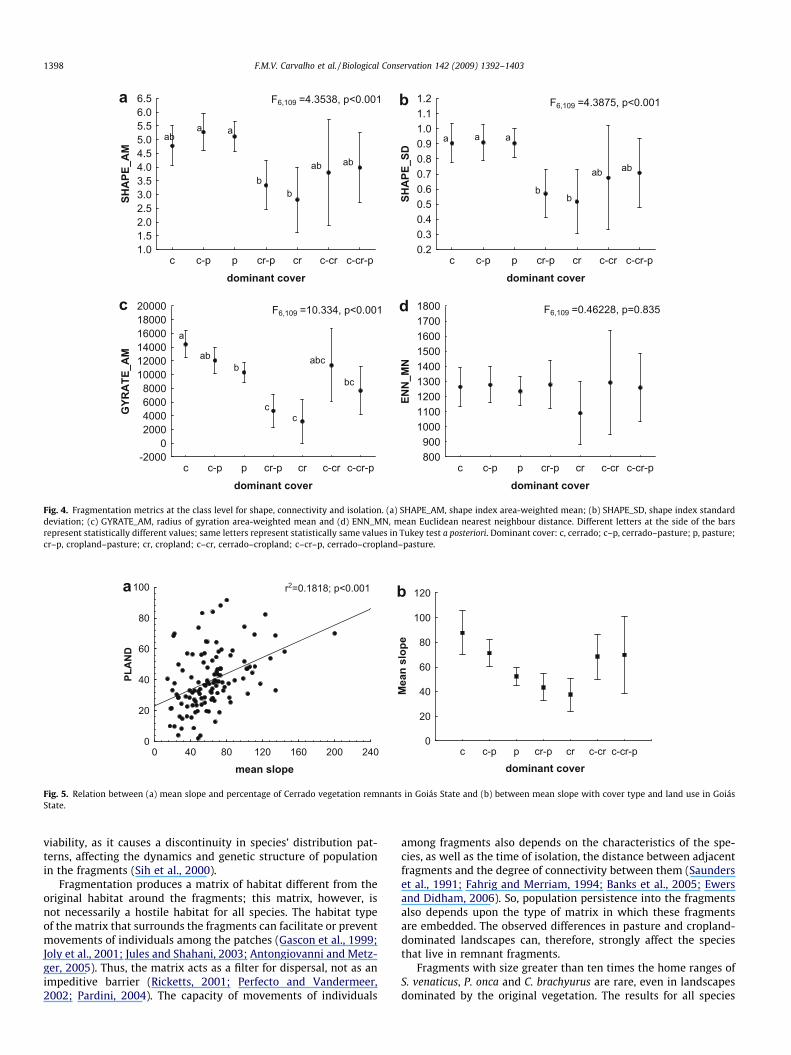
than in areas dominated by Cerrado. In relation to the percentageof landscape index (PLAND), pasture areas showed larger valuesthan crop-dominated areas (Fig. 3b). As expected, Cerrado-domi-nated landscapes showed larger values for PLAND (Fig. 3b) andsmaller values to edge density (ED). Significant difference was ob-served in ED values only between Cerrado and pasture (Fig. 3c).There was no significant difference for the patch area coefficientof variation (AREA_CV) among any of the landscapes (Fig. 3d).The shape indices, SHAPE_AM e SHAPE_SD, were significantly lar-ger in pasture areas than in cropland areas (Fig. 4a and b), indicat-ing that fragments in pasture-dominated landscapes are moreirregular than fragments of the crop-dominated landscapes. Theshape index corrects the problem of dependence of patch area thatoccurs in perimeter-area ratio, and so it is a simple measure andone of the most used shape index. Radius of gyration area-weighted mean (GYRATE_AM) was larger in landscapes dominatedby Cerrado, and also in areas of pasture, when compared to areas ofcrops (Fig. 4c). The mean Euclidean nearest neighbour distance
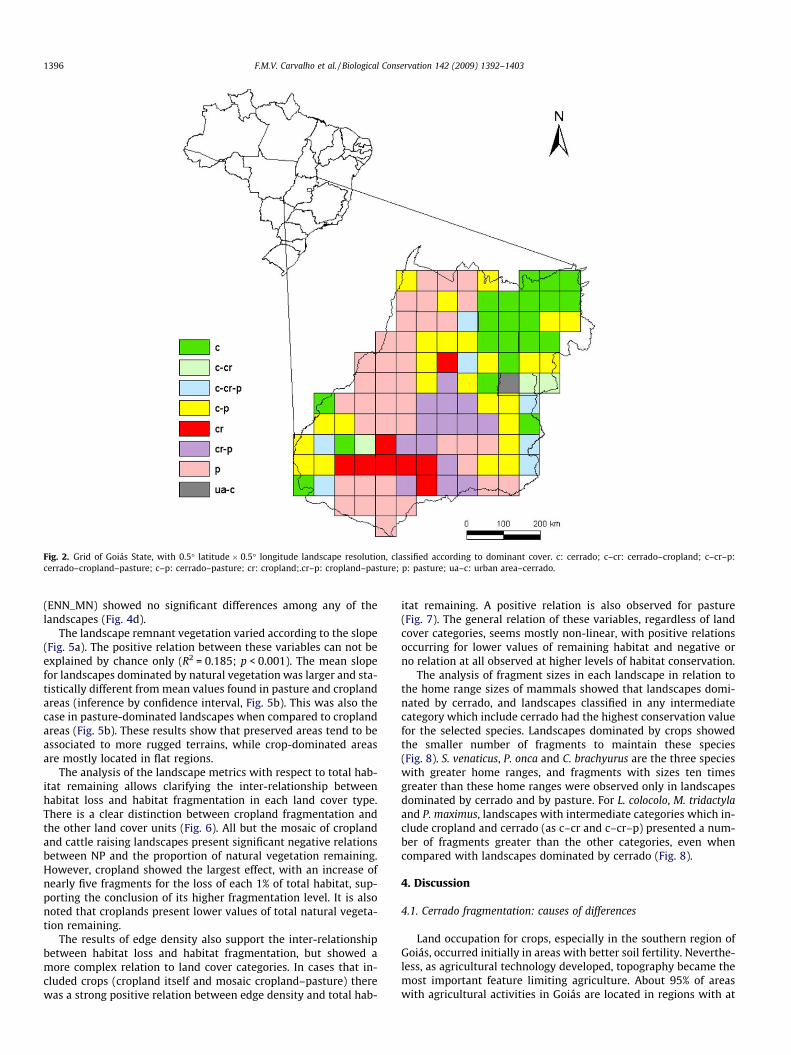
Fig. 2. Grid of Goiás State, with 0.5� latitude � 0.5� longitude landscape resolution, classified according to dominant cover. c: cerrado; c–cr: cerrado–cropland; c–cr–p:cerrado–cropland–pasture; c–p: cerrado–pasture; cr: cropland;.cr–p: cropland–pasture; p: pasture; ua–c: urban area–cerrado.
1396 F.M.V. Carvalho et al. / Biological Conservation 142 (2009) 1392–1403
(ENN_MN) showed no significant differences among any of thelandscapes (Fig. 4d).
The landscape remnant vegetation varied according to the slope(Fig. 5a). The positive relation between these variables can not beexplained by chance only (R2 = 0.185; p < 0.001). The mean slopefor landscapes dominated by natural vegetation was larger and sta-tistically different from mean values found in pasture and croplandareas (inference by confidence interval, Fig. 5b). This was also thecase in pasture-dominated landscapes when compared to croplandareas (Fig. 5b). These results show that preserved areas tend to beassociated to more rugged terrains, while crop-dominated areasare mostly located in flat regions.
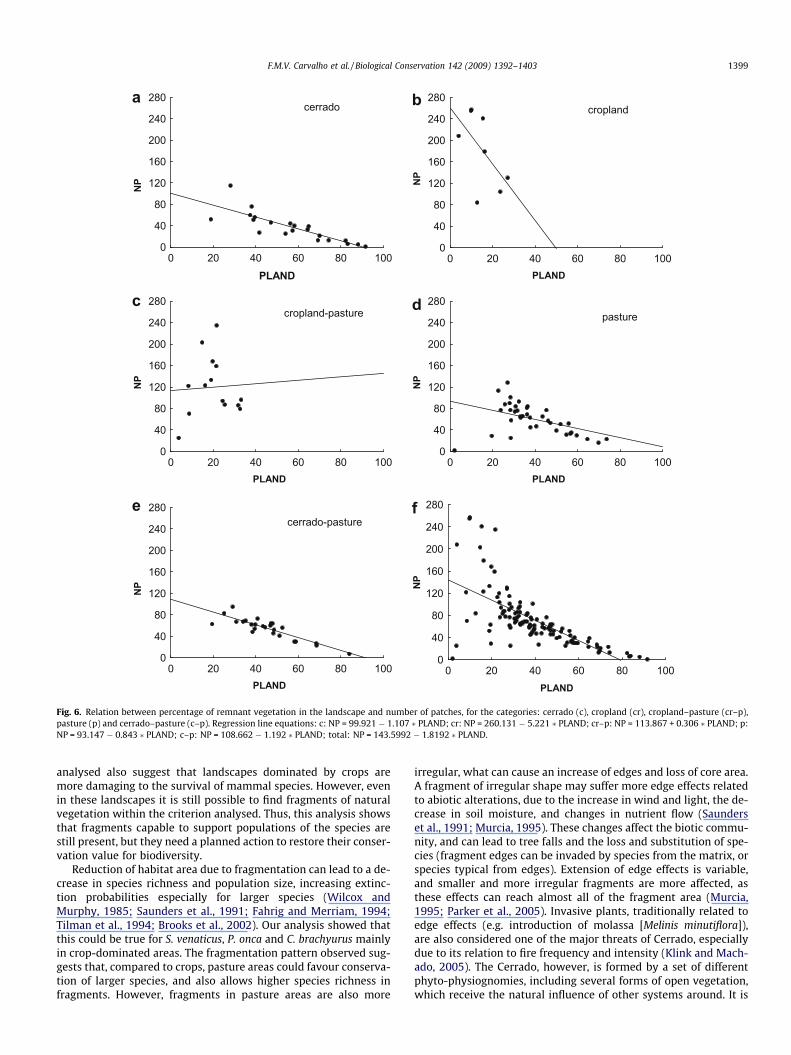
The analysis of the landscape metrics with respect to total hab-itat remaining allows clarifying the inter-relationship betweenhabitat loss and habitat fragmentation in each land cover type.There is a clear distinction between cropland fragmentation andthe other land cover units (Fig. 6). All but the mosaic of croplandand cattle raising landscapes present significant negative relationsbetween NP and the proportion of natural vegetation remaining.However, cropland showed the largest effect, with an increase ofnearly five fragments for the loss of each 1% of total habitat, sup-porting the conclusion of its higher fragmentation level. It is alsonoted that croplands present lower values of total natural vegeta-tion remaining.
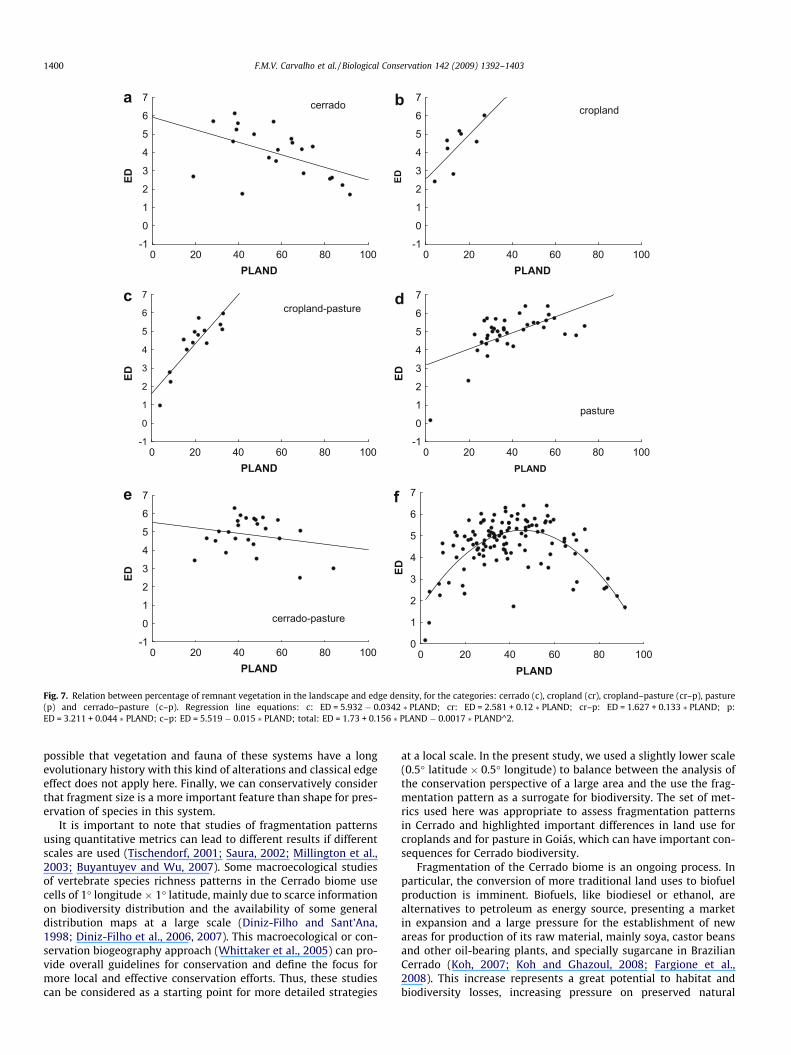
The results of edge density also support the inter-relationshipbetween habitat loss and habitat fragmentation, but showed amore complex relation to land cover categories. In cases that in-cluded crops (cropland itself and mosaic cropland–pasture) therewas a strong positive relation between edge density and total hab-
itat remaining. A positive relation is also observed for pasture(Fig. 7). The general relation of these variables, regardless of landcover categories, seems mostly non-linear, with positive relationsoccurring for lower values of remaining habitat and negative orno relation at all observed at higher levels of habitat conservation.
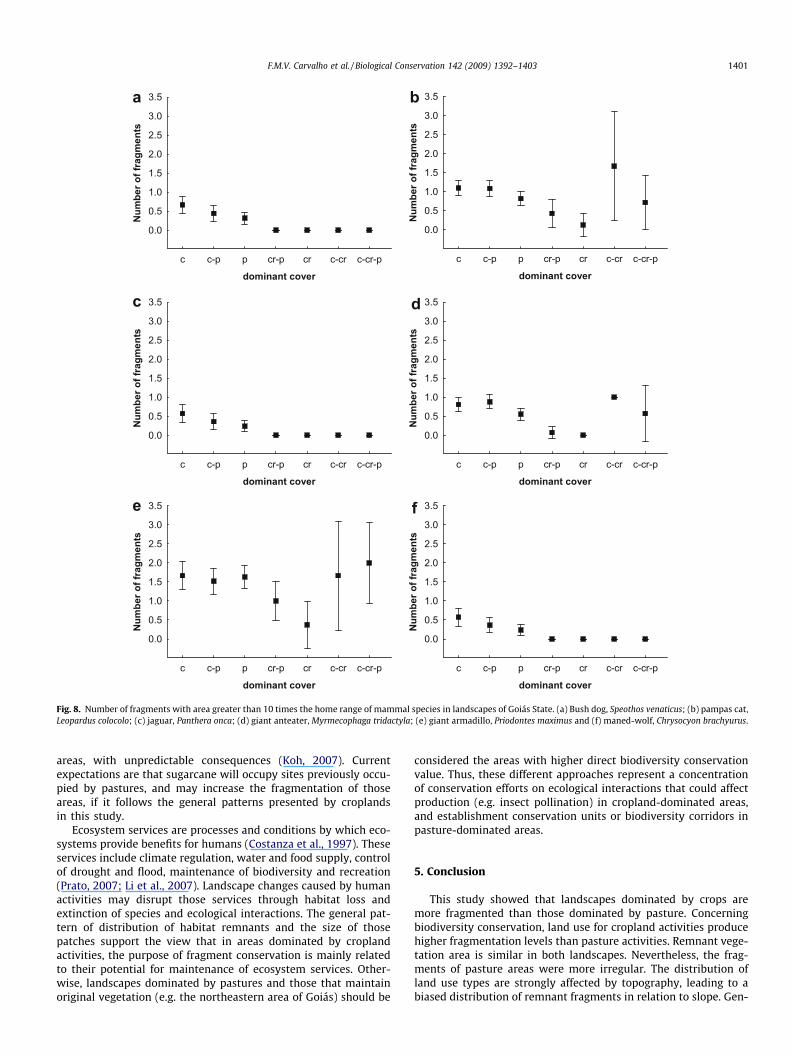
The analysis of fragment sizes in each landscape in relation tothe home range sizes of mammals showed that landscapes domi-nated by cerrado, and landscapes classified in any intermediatecategory which include cerrado had the highest conservation valuefor the selected species. Landscapes dominated by crops showedthe smaller number of fragments to maintain these species(Fig. 8). S. venaticus, P. onca and C. brachyurus are the three specieswith greater home ranges, and fragments with sizes ten timesgreater than these home ranges were observed only in landscapesdominated by cerrado and by pasture. For L. colocolo, M. tridactylaand P. maximus, landscapes with intermediate categories which in-clude cropland and cerrado (as c–cr and c–cr–p) presented a num-ber of fragments greater than the other categories, even whencompared with landscapes dominated by cerrado (Fig. 8).
4. Discussion
4.1. Cerrado fragmentation: causes of differences
Land occupation for crops, especially in the southern region ofGoiás, occurred initially in areas with better soil fertility. Neverthe-less, as agricultural technology developed, topography became themost important feature limiting agriculture. About 95% of areaswith agricultural activities in Goiás are located in regions with at
dominant cover
020406080
100120140160180200220240
NP
F6,109 =23.340, p<0.001
aa a
b
c
ab ab
c c-p p cr-p cr c-cr c-cr-pc c-p p cr-p cr c-cr c-cr-p
c c-p p cr-p cr c-cr c-cr-p
dominant cover
-10
0
10
20
30
40
50
60
70
PLA
ND
F6,109=14.192, p<0.001
bc
a
abc
cc
bab
dominant cover
2.5
3.0
3.5
4.0
4.5
5.0
5.5
6.0
ED a
ab ab
ababab
b
F6,109 =2.0619, p=0.063
c c-p p cr-p cr c-cr c-cr-pdominant cover
100
200
300
400
500
600
700
800
AR
EA_C
V
F6,109=1.8340, p=0.099
a b
dc
Fig. 3. Fragmentation metrics at the class level for area, density and edge. (a) NP, number of patches; (b) PLAND, percentage of landscape; (c) ED, edge density and (d)AREA_CV, patch area coefficient of variation. Different letters at the side of the bars represent statistically different values; same letters represent statistically same values inTukey test a posteriori. Dominant cover: c, cerrado; c–p, cerrado–pasture; p, pasture; cr–p, cropland–pasture; cr, cropland; c–cr, cerrado–cropland; c–cr–p, cerrado–cropland–pasture.
F.M.V. Carvalho et al. / Biological Conservation 142 (2009) 1392–1403 1397
most 4� of slope (Miziara and Ferreira, 2006). If crops were devel-oped primarily in more flat areas, sloping areas are preferably leftas part of the set-aside provision of Brazil’s 1965 Forest Code, thatrequires rural landowners in the Cerrado to keep one-fifth of theirlands as ‘Legal Reserve’. If this is correct, then fragments of Cerradoremnant vegetation should be a non-random sample of topographyof the region, and have been located mainly in areas with greaterslopes. This hypothesis was confirmed by the positive relation be-tween cerrado-dominated landscapes and slope. Brannstrom et al.(2008) also found that observed differences in the fragmentationpattern could be due to topography, land tenure and vegetationdynamics. In both areas, Cerrado remnants occur in pixels withhigher slopes than for agro-pastoral areas.
The distribution pattern of many important elements of biodi-versity, from which we emphasize plants and birds, are strongly af-fected by topography and altitude. For example, some groups ofbirds tend to occur preferably in ravines with steeper slope (Ribonet al., 2003), and some group of palms tend to occur in flat areas(Kahn et al., 1988). Therefore, a topography-biased fragmentationin Cerrado leads to a biased sample of biodiversity.
There was no difference in edge density between crop and pas-ture–dominated landscapes. However, crop areas had a large num-ber of patches than pasture areas, in a same total habitat area. Thisresult suggests that pasture-dominated landscapes should havemore irregular patches, which have more edge than patches ofmore simpler shapes, and this was confirmed by the differencesobserved in the shape metrics. Many cropland areas are relatedto soya and sugarcane, which are intensely mechanized cultures(Ratter et al., 1997; Fearnside, 2001). It is possible that in thesemore mechanized systems, fragment’s edges can be more regularand reflect the intensive land use in the region.
A feature that differentiates crops from pasture is that the for-mer needs a greater infrastructure to distribute the production.Historically, agricultural areas in Goiás increased following theconsolidation of transport infrastructure. Thus, croplands tend tobe located around roads of great circulation (Miziara and Ferreira,2006). On the other hand, the denser road network found in themore prominent crop regions induces a more severe fragmenta-tion, which, as demonstrated by Goosem (1997), may have a great-er impact on biodiversity.
Colonisation and development of agricultural technology inGoiás occurred primarily in southern regions, closer to centres ofeconomic growth of the country, and followed a direction towardsAmazonia (Miziara and Ferreira, 2006). Thus, the northeast of Goiá-s suffers a low colonisation pressure due to its geographic position,but also due to other constraints such as elevation, slope, andnutrient-poor soils (Sano et al., 2006), which inhibit agriculturalactivities. Considering both the current level of preservation andthe smaller risks they face due to the colonisation axis, the north-eastern areas should be considered as priority areas for the preser-vation of biodiversity and for the establishment of strategies forcreation of conservation units. However, a clear warning must beconsidered that this region had a biased representation of the over-all Cerrado flora and fauna, and, at least, deserves better biodiver-sity inventories to evaluate its representativeness.
4.2. Consequences of fragmentation for biodiversity conservation inlandscapes dominated by human activities
Fragmentation has two immediate consequences (Saunderset al., 1991; Fahrig, 2003): reduction of habitat area and isolationof remnant habitat patches. Isolation has an effect on population
c c-p p cr-p cr c-cr c-cr-pdominant cover
1.01.52.02.53.03.54.04.55.05.56.06.5
SHA
PE_A
M
F6,109 =4.3538, p<0.001
ab
abab
bb
aa
c c-p p cr-p cr c-cr c-cr-pdominant cover
0.20.30.40.50.60.70.80.91.01.11.2
SHA
PE_S
D
F6,109 =4.3875, p<0.001
a
abab
bb
aa
c c-p p cr-p cr c-cr c-cr-pdominant cover
-20000
2000400060008000
100001200014000160001800020000
GYR
ATE
_AM
F6,109 =10.334, p<0.001
c
bc
abc
a
c
bab
c c-p p cr-p cr c-cr c-cr-pdominant cover
800900
100011001200130014001500160017001800
ENN
_MN
F6,109 =0.46228, p=0.835
a
c
b
d
Fig. 4. Fragmentation metrics at the class level for shape, connectivity and isolation. (a) SHAPE_AM, shape index area-weighted mean; (b) SHAPE_SD, shape index standarddeviation; (c) GYRATE_AM, radius of gyration area-weighted mean and (d) ENN_MN, mean Euclidean nearest neighbour distance. Different letters at the side of the barsrepresent statistically different values; same letters represent statistically same values in Tukey test a posteriori. Dominant cover: c, cerrado; c–p, cerrado–pasture; p, pasture;cr–p, cropland–pasture; cr, cropland; c–cr, cerrado–cropland; c–cr–p, cerrado–cropland–pasture.
0 40 80 120 160 200 240
mean slope
0
20
40
60
80
100
PLA
ND
r2=0.1818; p<0.001
c c-p p cr-p cr c-cr c-cr-pdominant cover
0
20
40
60
80
100
120
Mea
n sl
ope
a b
Fig. 5. Relation between (a) mean slope and percentage of Cerrado vegetation remnants in Goiás State and (b) between mean slope with cover type and land use in GoiásState.
1398 F.M.V. Carvalho et al. / Biological Conservation 142 (2009) 1392–1403
viability, as it causes a discontinuity in species’ distribution pat-terns, affecting the dynamics and genetic structure of populationin the fragments (Sih et al., 2000).
Fragmentation produces a matrix of habitat different from theoriginal habitat around the fragments; this matrix, however, isnot necessarily a hostile habitat for all species. The habitat typeof the matrix that surrounds the fragments can facilitate or preventmovements of individuals among the patches (Gascon et al., 1999;Joly et al., 2001; Jules and Shahani, 2003; Antongiovanni and Metz-ger, 2005). Thus, the matrix acts as a filter for dispersal, not as animpeditive barrier (Ricketts, 2001; Perfecto and Vandermeer,2002; Pardini, 2004). The capacity of movements of individuals
among fragments also depends on the characteristics of the spe-cies, as well as the time of isolation, the distance between adjacentfragments and the degree of connectivity between them (Saunderset al., 1991; Fahrig and Merriam, 1994; Banks et al., 2005; Ewersand Didham, 2006). So, population persistence into the fragmentsalso depends upon the type of matrix in which these fragmentsare embedded. The observed differences in pasture and cropland-dominated landscapes can, therefore, strongly affect the speciesthat live in remnant fragments.
Fragments with size greater than ten times the home ranges ofS. venaticus, P. onca and C. brachyurus are rare, even in landscapesdominated by the original vegetation. The results for all species
NP
PLAND0 20 40 60 80 100
0
40
80
120
160
200
240
280cerrado
PLAND
NP
0 20 40 60 80 1000
40
80
120
160
200
240
280cropland
PLAND
NP
0 20 40 60 80 1000
40
80
120
160
200
240
280cropland-pasture
PLAND
NP
0 20 40 60 80 1000
40
80
120
160
200
240
280pasture
PLAND
NP
0 20 40 60 80 1000
40
80
120
160
200
240
280cerrado-pasture
0 20 40 60 80 100PLAND
0
40
80
120
160
200
240
280
NP
a
c
e f
b
d
Fig. 6. Relation between percentage of remnant vegetation in the landscape and number of patches, for the categories: cerrado (c), cropland (cr), cropland–pasture (cr–p),pasture (p) and cerrado–pasture (c–p). Regression line equations: c: NP = 99.921 � 1.107 � PLAND; cr: NP = 260.131 � 5.221 � PLAND; cr–p: NP = 113.867 + 0.306 � PLAND; p:NP = 93.147 � 0.843 � PLAND; c–p: NP = 108.662 � 1.192 � PLAND; total: NP = 143.5992 � 1.8192 � PLAND.
F.M.V. Carvalho et al. / Biological Conservation 142 (2009) 1392–1403 1399
analysed also suggest that landscapes dominated by crops aremore damaging to the survival of mammal species. However, evenin these landscapes it is still possible to find fragments of naturalvegetation within the criterion analysed. Thus, this analysis showsthat fragments capable to support populations of the species arestill present, but they need a planned action to restore their conser-vation value for biodiversity.
Reduction of habitat area due to fragmentation can lead to a de-crease in species richness and population size, increasing extinc-tion probabilities especially for larger species (Wilcox andMurphy, 1985; Saunders et al., 1991; Fahrig and Merriam, 1994;Tilman et al., 1994; Brooks et al., 2002). Our analysis showed thatthis could be true for S. venaticus, P. onca and C. brachyurus mainlyin crop-dominated areas. The fragmentation pattern observed sug-gests that, compared to crops, pasture areas could favour conserva-tion of larger species, and also allows higher species richness infragments. However, fragments in pasture areas are also more
irregular, what can cause an increase of edges and loss of core area.A fragment of irregular shape may suffer more edge effects relatedto abiotic alterations, due to the increase in wind and light, the de-crease in soil moisture, and changes in nutrient flow (Saunderset al., 1991; Murcia, 1995). These changes affect the biotic commu-nity, and can lead to tree falls and the loss and substitution of spe-cies (fragment edges can be invaded by species from the matrix, orspecies typical from edges). Extension of edge effects is variable,and smaller and more irregular fragments are more affected, asthese effects can reach almost all of the fragment area (Murcia,1995; Parker et al., 2005). Invasive plants, traditionally related toedge effects (e.g. introduction of molassa [Melinis minutiflora]),are also considered one of the major threats of Cerrado, especiallydue to its relation to fire frequency and intensity (Klink and Mach-ado, 2005). The Cerrado, however, is formed by a set of differentphyto-physiognomies, including several forms of open vegetation,which receive the natural influence of other systems around. It is
PLAND
ED
0 20 40 60 80 100-1
0
1
2
3
4
5
6
7cerrado
PLAND
ED
0 20 40 60 80 100-1
0
1
2
3
4
5
6
7cropland
PLAND
ED
0 20 40 60 80 100-1
0
1
2
3
4
5
6
7cropland-pasture
PLAND
ED
0 20 40 60 80 100-1
0
1
2
3
4
5
6
7
pasture
PLAND
ED
0 20 40 60 80 100-1
0
1
2
3
4
5
6
7
cerrado-pasture
0 20 40 60 80 100PLAND
0
1
2
3
4
5
6
7
ED
a
c
e f
b
d
Fig. 7. Relation between percentage of remnant vegetation in the landscape and edge density, for the categories: cerrado (c), cropland (cr), cropland–pasture (cr–p), pasture(p) and cerrado–pasture (c–p). Regression line equations: c: ED = 5.932 � 0.0342 � PLAND; cr: ED = 2.581 + 0.12 � PLAND; cr–p: ED = 1.627 + 0.133 � PLAND; p:ED = 3.211 + 0.044 � PLAND; c–p: ED = 5.519 � 0.015 � PLAND; total: ED = 1.73 + 0.156 � PLAND � 0.0017 � PLAND^2.
1400 F.M.V. Carvalho et al. / Biological Conservation 142 (2009) 1392–1403
possible that vegetation and fauna of these systems have a longevolutionary history with this kind of alterations and classical edgeeffect does not apply here. Finally, we can conservatively considerthat fragment size is a more important feature than shape for pres-ervation of species in this system.
It is important to note that studies of fragmentation patternsusing quantitative metrics can lead to different results if differentscales are used (Tischendorf, 2001; Saura, 2002; Millington et al.,2003; Buyantuyev and Wu, 2007). Some macroecological studiesof vertebrate species richness patterns in the Cerrado biome usecells of 1� longitude � 1� latitude, mainly due to scarce informationon biodiversity distribution and the availability of some generaldistribution maps at a large scale (Diniz-Filho and Sant’Ana,1998; Diniz-Filho et al., 2006, 2007). This macroecological or con-servation biogeography approach (Whittaker et al., 2005) can pro-vide overall guidelines for conservation and define the focus formore local and effective conservation efforts. Thus, these studiescan be considered as a starting point for more detailed strategies
at a local scale. In the present study, we used a slightly lower scale(0.5� latitude � 0.5� longitude) to balance between the analysis ofthe conservation perspective of a large area and the use the frag-mentation pattern as a surrogate for biodiversity. The set of met-rics used here was appropriate to assess fragmentation patternsin Cerrado and highlighted important differences in land use forcroplands and for pasture in Goiás, which can have important con-sequences for Cerrado biodiversity.
Fragmentation of the Cerrado biome is an ongoing process. Inparticular, the conversion of more traditional land uses to biofuelproduction is imminent. Biofuels, like biodiesel or ethanol, arealternatives to petroleum as energy source, presenting a marketin expansion and a large pressure for the establishment of newareas for production of its raw material, mainly soya, castor beansand other oil-bearing plants, and specially sugarcane in BrazilianCerrado (Koh, 2007; Koh and Ghazoul, 2008; Fargione et al.,2008). This increase represents a great potential to habitat andbiodiversity losses, increasing pressure on preserved natural
c c-p p cr-p cr c-cr c-cr-p
dominant cover
0.0
0.5
1.0
1.5
2.0
2.5
3.0
3.5
Num
ber o
f fra
gmen
ts
c c-p p cr-p cr c-cr c-cr-p
dominant cover
0.0
0.5
1.0
1.5
2.0
2.5
3.0
3.5
Num
ber o
f fra
gmen
ts
c c-p p cr-p cr c-cr c-cr-p
dominant cover
0.0
0.5
1.0
1.5
2.0
2.5
3.0
3.5
Num
ber o
f fra
gmen
ts
c c-p p cr-p cr c-cr c-cr-p
dominant cover
0.0
0.5
1.0
1.5
2.0
2.5
3.0
3.5
Num
ber o
f fra
gmen
ts
c c-p p cr-p cr c-cr c-cr-p
dominant cover
0.0
0.5
1.0
1.5
2.0
2.5
3.0
3.5
Num
ber o
f fra
gmen
ts
c c-p p cr-p cr c-cr c-cr-p
dominant cover
0.0
0.5
1.0
1.5
2.0
2.5
3.0
3.5
Num
ber o
f fra
gmen
ts
a
c
e f
d
b
Fig. 8. Number of fragments with area greater than 10 times the home range of mammal species in landscapes of Goiás State. (a) Bush dog, Speothos venaticus; (b) pampas cat,Leopardus colocolo; (c) jaguar, Panthera onca; (d) giant anteater, Myrmecophaga tridactyla; (e) giant armadillo, Priodontes maximus and (f) maned-wolf, Chrysocyon brachyurus.
F.M.V. Carvalho et al. / Biological Conservation 142 (2009) 1392–1403 1401
areas, with unpredictable consequences (Koh, 2007). Currentexpectations are that sugarcane will occupy sites previously occu-pied by pastures, and may increase the fragmentation of thoseareas, if it follows the general patterns presented by croplandsin this study.
Ecosystem services are processes and conditions by which eco-systems provide benefits for humans (Costanza et al., 1997). Theseservices include climate regulation, water and food supply, controlof drought and flood, maintenance of biodiversity and recreation(Prato, 2007; Li et al., 2007). Landscape changes caused by humanactivities may disrupt those services through habitat loss andextinction of species and ecological interactions. The general pat-tern of distribution of habitat remnants and the size of thosepatches support the view that in areas dominated by croplandactivities, the purpose of fragment conservation is mainly relatedto their potential for maintenance of ecosystem services. Other-wise, landscapes dominated by pastures and those that maintainoriginal vegetation (e.g. the northeastern area of Goiás) should be
considered the areas with higher direct biodiversity conservationvalue. Thus, these different approaches represent a concentrationof conservation efforts on ecological interactions that could affectproduction (e.g. insect pollination) in cropland-dominated areas,and establishment conservation units or biodiversity corridors inpasture-dominated areas.
5. Conclusion
This study showed that landscapes dominated by crops aremore fragmented than those dominated by pasture. Concerningbiodiversity conservation, land use for cropland activities producehigher fragmentation levels than pasture activities. Remnant vege-tation area is similar in both landscapes. Nevertheless, the frag-ments of pasture areas were more irregular. The distribution ofland use types are strongly affected by topography, leading to abiased distribution of remnant fragments in relation to slope. Gen-
1402 F.M.V. Carvalho et al. / Biological Conservation 142 (2009) 1392–1403
eral landscape patterns support the need of different approachesfor crop and pasture-dominated systems.
Acknowledgments
We thank three anonymous reviewers for very useful critiquesand comments of the manuscript. This work was partially fundedby the Brazilian Ministry of Science and Technology ResearchCouncil (MCT – CNPq) through Grants given to PDM and LGF.
References
Andrén, H., 1994. Effects of habitat fragmentation on birds and mammals inlandscapes with different proportions of suitable habitat: a review. Oikos 71,355–366.
Antongiovanni, M., Metzger, J.P., 2005. Influence of matrix habitats on theoccurrence of insectivorous bird species in Amazonian forest fragments.Biological Conservation 122, 441–451.
Baldi, G., Guerschman, J.P., Paruelo, J.M., 2006. Characterizing fragmentation intemperate South America grasslands. Agriculture Ecosystems & Environment116, 197–208.
Banks, S.C., Finlayson, G.R., Lawson, S.J., Lindenmayer, D.B., Paetkau, D., Ward, S.J.,Taylor, A.C., 2005. The effects of habitat fragmentation due to forestryplantation establishment on the demography and genetic variation of amarsupial carnivore, Antechinus agilis. Biological Conservation 122, 581–597.
Bennett, A.F., Radford, J.Q., Haslem, A., 2006. Properties of land mosaics:implications for nature conservation in agricultural environments. BiologicalConservation 133, 250–264.
Brannstrom, C., Jepson, W., Filippi, A.M., Redo, D., Xu, Z.W., Ganesh, S., 2008. Landchange in the Brazilian Savanna (Cerrado), 1986–2002: comparative analysisand implications for land-use policy. Land Use Policy 25, 579–595.
Brooks, T.M., Mittermeier, R.A., Mittermeier, C.G., Fonseca, G.A.B., Rylands, A.B.,Konstant, W.R., Flick, P., Pilgrim, J., Oldfield, S., Magin, G., Hilton-Taylor, C., 2002.Habitat loss and extinction in the hotspots of biodiversity. Conservation Biology16, 909–923.
Burel, F., Butet, A., Delettre, Y.R., de la Pena, N.M., 2004. Differential response ofselected taxa to landscape context and agricultural intensification. Landscapeand Urban Planning 67, 195–204.
Buyantuyev, A., Wu, J.G., 2007. Effects of thematic resolution on landscape patternanalysis. Landscape Ecology 22, 7–13.
Cardillo, M., Mace, G.M., Jones, K.E., Bielby, J., Bininda-Emonds, O.R.P., Sechrest, W.,Orme, C.D.L., Purvis, A., 2005. Multiple causes of high extinction risk in largemammal species. Science 309, 1239–1241.
Cheida, C.C., Nakano-Oliveira, E., Fusco-Costa, R., Rocha-Mendes, F., Quadros, J.,2006. Ordem Carnivora. In: Reis, N.R., Peracchi, A.L., Pedro, W.A., Lima, I.P. (Eds.).Mamíferos do Brasil. Editora UEL, Londrina, pp. 231–276.
Colli, G.R., Bastos, R.P., Araújo, A.B., 2002. The character and dynamics of the Cerradoherpetofauna. In: Oliveira, P.S., Marquis, R.J. (Eds.), The Cerrrados of Brazil:Ecology and Natural History of a Neotropical Savanna. Columbia UniversityPress, New York, pp. 223–241.
Costanza, R., d’Arge, R., de Groot, R., Farber, S., Grasso, M., Hannon, B., Limburg, K.,Naeem, S., O’Neill, R.V., Paruelo, J., Raskin, R.G., Sutton, P., van den Belt, M., 1997.The value of the world’s ecosystem services and natural capital. Nature 387,253–260.
Damuth, J., 1981. Population density and body size in mammals. Nature 290, 699–700.
DeMatteo, K.E., Loiselle, B.A., 2008. New data on the status and distribution of thebush dog (Speothos venaticus): evaluating its quality of protection and directingresearch efforts. Biological Conservation 141, 2494–2505.
Dijak, W.D., Thompson, F.R., 2000. Landscape and edge effects on the distribution ofmammalian predators in Missouri. Journal of Wildlife Management 64, 209–216.
Diniz-Filho, J.A.F., Sant’Ana, C.E.R., 1998. Macroecological analysis of South Americaowls (Strigiformes) using philogenetic independent contrasts. Journal ofComparative Biology 3, 27–32.
Diniz-Filho, J.A.F., Bini, L.M., Pinto, M.P., Rangel, T.F.L.V., Carvalho, P., Bastos, R.P.,2006. Anuran species richness, complementarity and conservation conflicts inBrazilian Cerrado. Acta Oecologica—International Journal of Ecology 29, 9–15.
Diniz-Filho, J.A.F., Bini, L.M., Pinto, M.P., Rangel, T.F.L.V., Carvalho, P., Vieira, S.L.,Bastos, R.P., 2007. Conservation biogeography of anurans in Brazilian Cerrado.Biodiversity and Conservation 16, 997–1008.
Eiten, G., 1982. Brazilian ‘‘savannas”. In: Huntley, B.J., Walker, B.H. (Eds.), EcologicalStudies, Ecology of Tropical Savannas, vol. 42. Springer-Verlag, New York, pp.25–47.
Ewers, R.M., Didham, R.K., 2006. Confounding factors in the detection of speciesresponses to habitat fragmentation. Biological Reviews 81, 117–142.
Fagan, W.F., Holmes, E.E., 2006. Quantifying the extinction vortex. Ecology Letters 9,51–60.
Fahrig, L., 2003. Effects of habitat fragmentation on biodiversity. Annual Review ofEcology and Systematics 34, 487–515.
Fahrig, L., Merriam, G., 1994. Conservation of fragmented populations. ConservationBiology 8, 50–59.
Fargione, J., Hill, J., Tilman, D., Polasky, S., Hawthorne, P., 2008. Land clearing and thebiofuel carbon debt. Science 319, 1235–1238.
Fearnside, P.M., 2001. Soybean cultivation as a threat to the environment in Brazil.Environmental Conservation 28, 23–38.
Fernandez, M.H., Vrba, E.S., 2005. Body size, biomic specialization and range size ofAfrican large mammals. Journal of Biogeography 32, 1243–1256.
Gascon, C., Lovejoy, T.E., Bierregaard, R.O., Malcolm, J.R., Stouffer, P.C., Vasconcelos,H.L., Laurance, W.F., Zimmerman, B., Tocher, M., Borges, S., 1999. Matrix habitatand species richness in tropical forest remnants. Biological Conservation 91,223–229.
Gautam, A.P., Webb, E.L., Shivakoti, G.P., Zoebisch, M.A., 2003. Land use dynamicsand landscape change pattern in a mountain watershed in Nepal. AgricultureEcosystems & Environment 99, 83–96.
Goosem, M., 1997. Internal fragmentation: the effects of roads, highway, andpowerline clearings on movements and mortality of rainforest vertebrates. In:Laurance, W.F., Bierregaard, R.O., Jr. (Eds.), Tropical forest remnants: ecology,Management, and Conservation of Fragmented Communities. The University ofChicago Press, Chicago and London, pp. 241–255.
Grau, H.R., Gasparri, N.I., Aide, T.M., 2005. Agriculture expansion and deforestationin seasonally dry forests of north–west Argentina. Environmental Conservation32, 140–148.
Gustafson, E.J., 1998. Quantifying landscape spatial pattern: what is the state of theart? Ecosystems 1, 143–156.
Hargis, C.D., Bissonette, J.A., David, J.L., 1998. The behavior of landscape metricscommonly used in the study of habitat fragmentation. Landscape Ecology 13,167–186.
IBAMA, 2003. Lista nacional das espécies da fauna Brasileira ameaçadas de extinção.<www.meioambiente.gov.br/port/sbf/fauna/ordem4o.html> (accessed10.10.2007).
IBGE, 2004. Mapa de biomas do Brasil. Escala 1:5.000.000. <http://mapas.ibge.gov.br/biomas2/viewer.htm> (accessed 10.2.2007).
Jetz, W., Carbone, C., Fulford, J., Brown, J.H., 2004. The scaling of animal space use.Science 306, 266–268.
Joly, P., Miaud, C., Lehmann, A., Grolet, O., 2001. Habitat matrix effects on pondoccupancy in newts. Conservation Biology 15, 239–248.
Jules, E.S., Shahani, P., 2003. A broader ecological context to habitat fragmentation:why matrix habitat is more important than we thought. Journal of VegetationScience 14, 459–464.
Kahn, F., Mejia, K., Castro, A., 1988. Species richness and density of palms in terrafirme forests of Amazonia. Biotropica 20, 266–269.
Kelt, D.A., Van Vuren, D., 1999. Energetic constraints and the relationship betweenbody size and home range area in mammals. Ecology 80, 337–340.
Kirk, D.A., Bathe, G.M., 1994. Population size and home range of black-naped haresLepus nigricollis nigricollis on Cousin Island (Seychelles, Indian Ocean).Mammalia 58, 557–562.
Klink, C.A., Machado, R.B., 2005. Conservation of the Brazilian Cerrado. ConservationBiology 19, 707–713.
Klink, C.A., Moreira, A.G., 2002. Past and current human occupation, and land use.In: Oliveira, P.S., Marquis, R.J. (Eds.), The Cerrados of Brazil: Ecology and NaturalHistory of a Neotropical Savanna. Columbia University Press, New York, pp. 69–88.
Koh, L.P., 2007. Potential habitat and biodiversity losses from intensified biodieselfeedstock production. Conservation Biology 21, 1373–1375.
Koh, L.P., Ghazoul, J., 2008. Biofuels, biodiversity, and people: understandingthe conflicts and finding opportunities. Biological Conservation 141, 2450–2460.
Kuper, W., Sommer, J.H., Lovett, J.C., Barthlott, W., 2006. Deficiency in African plantdistribution data – missing pieces of the puzzle. Botanical Journal of the LinneanSociety 150, 355–368.
Laidlaw, R.K., 2000. Effects of habitat disturbance and protected areas on mammalsof peninsular Malaysia. Conservation Biology 14, 1639–1648.
Li, R.Q., Dong, M., Cui, J.Y., Zhang, L.L., Cui, Q.G., He, W.M., 2007. Quantification of theimpact of land-use changes on ecosystem services: a case study in PingbianCounty, China. Environmental Monitoring and Assessment 128, 503–510.
MacDonald, D.W., Rushton, S., 2003. Modelling space use and dispersal of mammalsin real landscapes: a tool for conservation. Journal of Biogeography 30, 607–620.
Machado, R.B., Ramos Neto, M.B., Pereira, P., Caldas, E., Gonçalves, D., Santos, N.,Tabor, K., Steininger, M., 2004. Estimativas de perda da área do Cerradobrasileiro. Conservation International, Brasilia.
McGarigal, K., Marks, B.J., 1995. FRAGSTATS: spatial pattern analysis program forquantifying landscape structure., USDA For. Serv. Gen. Tech. Rep.
Metzger, J.P., 1999. Estrutura da paisagem e fragmentação: análise bibliográfica.Anais da Academia Brasileira de Ciências 71, 435–463.
Metzger, J.P., 2003. Estrutura da paisagem: o uso adequado de métricas. In: Cullen,L., Jr., Rudran, R., Valladares-Padua, C. (Eds.), Métodos de Estudos em Biologia daConservação e Manejo da Vida Silvestre. Universidade Federal do Paraná,Curitiba, pp. 423–453.
Millington, A.C., Velez-Liendo, X.M., Bradley, A.V., 2003. Scale dependency inmultitemporal mapping of forest fragmentation in Bolivia: implications forexplaining temporal trends in landscape ecology and applications tobiodiversity conservation. Isprs Journal of Photogrammetry and RemoteSensing 57, 289–299.
Miranda, G.H.B., 2004. Ecologia e Conservação do Tamanduá-Bandeira(Myrmecophaga tridactyla, Linnaeus, 1758) no Parque Nacional das Emas. PhDthesis, Universidade de Brasília, 81 pp.
F.M.V. Carvalho et al. / Biological Conservation 142 (2009) 1392–1403 1403
Miziara, F., Ferreira, N.C., 2006. Expansão da fronteira agrícola e evolução daocupação e uso do espaço no Estado de Goiás: subsídios à política ambiental. In:Ferreira, L.G. (Ed.), Conservação da Biodiversidade e Sustentabilidade Ambientalem Goiás: Prioridades. Estratégias e Perspectivas. Ed. Canone, Goiânia, pp. 94–109.
Murcia, C., 1995. Edge effects in fragmented forests: implications for conservation.Trends in Ecology & Evolution 10, 58–62.
Myers, N., Mittermeier, R.A., Mittermeier, C.G., Fonseca, G.A.B., Kent, J., 2000.Biodiversity hotspots for conservation priorities. Nature 403, 853–858.
Nelson, B.W., Ferreira, C.A.C., Dasilva, M.F., Kawasaki, M.L., 1990. Endemism Centers,Refugia and Botanical Collection Density in Brazilian Amazonia. Nature 345,714–716.
O’Grady, J.J., Reed, D.H., Brook, B.W., Frankham, R., 2004. What are the bestcorrelates of predicted extinction risk? Biological Conservation 118, 513–520.
Oliveira, T.G., Tortato, M.A., Silveira, L., Kasper, C.B., Mazim, F.D., Jácomo, A.T.A.,Lucherini, M., Soares, J.B.G., Marques, R.V., Sunquist, M., 2008. Ocelot ecologyand its effect on the small-felid guild in the lowland Neotropics. In: Macdonald,D.W., Loveridge, A. (Eds.), Biology and Conservation of Wild Felids. OxfordUniversity Press, Oxford.
Pardini, R., 2004. Effects of forest fragmentation on small mammals in an AtlanticForest landscape. Biodiversity and Conservation 13, 2567–2586.
Pardini, R., de Souza, S.M., Braga-Neto, R., Metzger, J.P., 2005. The role of foreststructure, fragment size and corridors in maintaining small mammalabundance and diversity in an Atlantic forest landscape. BiologicalConservation 124, 253–266.
Parker, T.H., Stansberry, B.M., Becker, C.D., Gipson, P.S., 2005. Edge and area effectson the occurrence of migrant forest songbirds. Conservation Biology 19, 1157–1167.
Parks, S.A., Harcourt, A.H., Tobler, W., Deichmann, U., Gottsegen, J., Maloy, K., 2002.Reserve size, local human density, and mammalian extinctions in US protectedareas. Conservation Biology 16, 800–808.
Perfecto, I., Vandermeer, J., 2002. Quality of agroecological matrix in a tropicalmontane landscape: ants in coffee plantations in southern Mexico.Conservation Biology 16, 174–182.
Potts, S.G., Petanidou, T., Roberts, S., O’Toole, C., Hulbert, A., Willmer, P., 2006. Plant-pollinator biodiversity and pollination services in a complex Mediterraneanlandscape. Biological Conservation 129, 519–529.
Prato, T., 2007. Selection and evaluation of projects to conserve ecosystem services.Ecological Modelling 203, 290–296.
Promislow, D.E.L., Harvey, P.H., 1990. Living fast and dying young: a comparativeanalysis of life history variation among mammals. Journal of Zoology 220, 417–437.
Ratter, J.A., Ribeiro, J.F., Bridgewater, S., 1997. The Brazilian cerrado vegetation andthreats to its biodiversity. Annals of Botany 80, 223–230.
Redford, K.H., Fonseca, G.A.B., 1986. The role of gallery forest in the zoogeography ofthe Cerrado’s non-volant mammalian fauna. Biotropica 18, 126–135.
Ribon, R., Simon, J.E., De Mattos, G.T., 2003. Bird extinctions in Atlantic forestfragments of the Vicosa region, southeastern Brazil. Conservation Biology 17,1827–1839.
Ricketts, T.H., 2001. The matrix matters: effective isolation in fragmentedlandscapes. American Naturalist 158, 87–99.
Riitters, K.H., Oneill, R.V., Hunsaker, C.T., Wickham, J.D., Yankee, D.H., Timmins, S.P.,Jones, K.B., Jackson, B.L., 1995. A factor-analysis of landscape pattern andstructure metrics. Landscape Ecology 10, 23–39.
Sano, E.E., Dambrós, L.A., Oliveira, G.C., 2006. Padrões de cobertura de solos doEstado de Goiás. In: Ferreira, L.G. (Ed.), Conservação da Biodiversidade eSustentabilidade Ambiental em Goiás: Prioridades. Estratégias e Perspectivas.Ed. Canone, Goiânia, pp. 76–93.
Sano, E.E., Ferreira, L.G., Asner, G., Steinke, E., 2007. Spatial and temporalprobabilities of obtaining cloud-free Landsat images over the BrazilianTropical Savanna. International Journal of Remote Sensing 28, 2739–2752.
Sano, E.E., Rosa, R., Brito, J.L.S., Ferreira, L.G., 2008. Mapeamento semidetalhado douso da terra do Bioma Cerrado. Pesquisa Agropecuaria Brasileira 43, 153–156.
Saunders, D.A., Hobbs, R.J., Margules, C.R., 1991. Biological consequences ofecosystem fragmentation: a review. Conservation Biology 5, 18–32.
Saura, S., 2002. Effects of minimum mapping unit on land cover data spatialconfiguration and composition. International Journal of Remote Sensing 23,4853–4880.
Sih, A., Jonsson, B.G., Luikart, G., 2000. Habitat loss: ecological, evolutionary andgenetic consequences. Trends in Ecology & Evolution 15, 132–134.
Silveira, L., 2004. Ecologia Comparada e Conservação da Onça-Pintada (Pantheraonca) e Onça-Parda (Puma concolor) no Cerrado e Pantanal. PhD thesis.Universidade de Brasília, 240 pp.
Silveira, L., Jácomo, A.T.A., Furtado, M.M., Torres, N.M., Sollmann, R., Vynne, C.,accepted for publication. Ecology of the giant armadillo (Priodontes maximus) inthe grasslands of Central Brazil. Edentata.
Tilman, D., May, R.M., Lehman, C.L., Nowak, M.A., 1994. Habitat destruction and theextinction debt. Nature 371, 65–66.
Tilman, D., Fargione, J., Wolff, B., D’Antonio, C., Dobson, A., Howarth, R., Schindler, D.,Schlesinger, W.H., Simberloff, D., Swackhamer, D., 2001. Forecastingagriculturally driven global environmental change. Science 292, 281–284.
Tischendorf, L., 2001. Can landscape indices predict ecological processesconsistently? Landscape Ecology 16, 235–254.
Tobler, M., Honorio, E., Janovec, J., Reynel, C., 2007. Implications of collectionpatterns of botanical specimens on their usefulness for conservation planning:an example of two neotropical plant families (Moraceae and Myristicaceae) inPeru. Biodiversity and Conservation 16, 659–677.
Torbick, N.M., Qi, J.G., Roloff, G.J., Stevenson, R.J., 2006. Investigating impacts ofland-use land cover change on wetlands in the Muskegon River Watershed,Michigan, USA. Wetlands 26, 1103–1113.
Vandermeer, J., Perfecto, I., 2007. The agricultural matrix and a future paradigm forconservation. Conservation Biology 21, 274–277.
Whittaker, R.J., Araujo, M.B., Paul, J., Ladle, R.J., Watson, J.E.M., Willis, K.J., 2005.Conservation Biogeography: assessment and prospect. Diversity andDistributions 11, 3–23.
Wilcox, B.A., Murphy, D.D., 1985. Conservation strategy: the effects offragmentation on extinction. The American Naturalist 125, 879–887.
Zar, J.H., 1999. Biostatistical Analysis, fourth ed. Prentice-Hall, Englewood Cliffs, NJ.