Soil Bulk Density and Penetration Resistance under Different Tillage and Crop Management Systems and...
11
TILLAGE Soil Bulk Density and Penetration Resistance under Different Tillage and Crop Management Systems and Their Relationship with Barley Root Growth J. Lampurlane ´s and C. Cantero-Martı´nez ABSTRACT to determine whether or not reduction or suppression of tillage can increase soil strength disturbing root and To study the effects of fallow and tillage on soil physical properties plant growth. and barley (Hordeum vulgare L.) root growth, an experiment was conducted for several years on two soils of contrasting depth: deep, The most common variables used to assess soil a Fluventic Xerochrept of 120-cm depth, and shallow, a Lithic Xeric strength in tillage studies are BD and penetrometer Torriorthent of 30-cm depth. Subsoil tillage (ST), minimum tillage resistance. They are interrelated, and the use of only (MT), and no-tillage (NT) were compared in the deep soil and MT one of these variables may lead to misleading results and NT in the shallow soil. Bulk density (BD), penetration resistance, (Campbell and Henshall, 1991). gravimetric water content, gravel content, and root length density Bulk density is inversely related to total porosity (Car- were determined at several times during the year. In the deep soil, ter and Ball, 1993), which provides a measure of the BD was lower in the fallow and crop-after-fallow plots (1.26 Mg m 3 ) porous space left in the soil for air and water movement. than in the continuous-crop plots (1.32 Mg m 3 ). In this soil, NT The optimal BD for plant growth is different for each showed the largest bulk densities (mean of 1.34 Mg m 3 ), followed soil. In general, low BD (high porosity) leads to poor by MT (mean of 1.27 Mg m 3 ) and ST (mean of 1.22 Mg m 3 ). Larger penetration resistance was found in NT than in ST and MT in both soils soil–root contact, and high BD (low porosity) reduces soon after tillage operations. However, root length density profiles aeration and increases penetration resistance (PR), lim- sometimes showed greater values for NT than for the other tillage iting root growth (Cassel, 1982). systems, revealing a good soil condition for root growth under NT. Bulk density is related to natural soil characteristics Therefore, an increase in soil strength is observed under NT in the such as texture, organic matter, soil structure (Cassel, first years after its introduction that does not greatly affect root growth 1982; Chen et al., 1998), and gravel content (GC) (Fran- in well-structured soils. Fallow reduces soil strength due to the effect zen et al., 1994). It varies over the year due to the action of tillage and natural loosening factors like drying and wetting cycles of several processes: freezing and thawing (Blevins et al., or fauna activity. This effect extends to the following crop. 1983; Unger, 1991), settling by desiccation and kinetic energy of rainfall (Cassel, 1982), and loosening by root action and animal activity. Crop operations, especially I nterest in NT is growing in the rainfed cereal-crop- tillage, may also alter bulk soil density. ping areas around the world due to the effective One of the goals of tillage is to reduce BD (increasing reduction in time and costs that this tillage system soil porosity). This effect of tillage on BD is temporary, allows. This is the case in the semiarid area of the Ebro and after tillage, the soil rapidly settles, recovering its Valley of Spain. To investigate the effect of NT and former BD (Hernanz and Giro ´ n, 1988; Campbell and other tillage systems on plant and soil properties, a series Henshall, 1991; Franzen et al., 1994; Franzluebbers et of experiments began in 1992. The results on soil water al., 1995). In the first years of NT, BD of the soil may content, root length density, and yield under continuous increase due to the repeated passes of the tractor and crop (CC) and crop after fallow (CAF) have been al- the lack of the loosening action of tillage. ready published in Lampurlane ´ s et al. (2001) and Lamp- Numerous experiments performed to compare NT urlane ´ s et al. (2002). In this paper, we investigate the with other conservation or more conventional tillage effect of reducing tillage intensity on soil physical prop- systems have given different results. In most of them, erties and the relationship between soil physical condi- BD was greater in NT in the first 5 to 10 cm of soil tions and root growth. (Ehlers et al., 1983; Pelegrin et al., 1988; Radcliffe et al., No-tillage is not a new technique. However, the con- 1988; Hammel, 1989; Hill, 1990; Campbell and Henshall, cept of not disturbing the soil still clashes strongly with 1991; Grant and Lafond, 1993; Rhoton et al., 1993; Fran- most farmers, who for years have disturbed the soil to zen et al., 1994; Hubbard et al., 1994; Franzluebbers et obtain a soft medium for better crop growth. For the al., 1995; Unger and Jones, 1998; Tebru ¨ gge and Du ¨ ring, farmer, undisturbed soil seems to be harder and more 1999; Wander and Bollero, 1999). In others, no differ- resistant to root penetration than tilled soil. In fact, high ences in BD were found between tillage systems soil strength has been proved to reduce and even stop (McCalla and Army, 1961; Cassel, 1982; Blevins et al., root growth (Atwell, 1993). Measurements are needed 1983; Burch et al., 1986; Blevins and Frye, 1993; Taboada Departament de Produccio ´ Vegetal i Cie ` ncia Forestal, Universitat de Abbreviations: BD, bulk density; CAF, crop after fallow; CC, continu- Lleida–IRTA, Rovira Roure, 177, 25198 Lleida, Spain. Received 19 ous crop; GC, gravel content; GWC, gravimetric water content; MT, Mar. 2001. *Corresponding author ([email protected]). minimum tillage; NT, no-tillage; PR, penetration resistance; RGR, root growth rate; ST, subsoil tillage. Published in Agron. J. 95:526–536 (2003). 526
-
Upload
independent -
Category
Documents
-
view
4 -
download
0
Transcript of Soil Bulk Density and Penetration Resistance under Different Tillage and Crop Management Systems and...

TILLAGE
Soil Bulk Density and Penetration Resistance under Different Tillage and CropManagement Systems and Their Relationship with Barley Root Growth
J. Lampurlanes and C. Cantero-Martınez
ABSTRACT to determine whether or not reduction or suppressionof tillage can increase soil strength disturbing root andTo study the effects of fallow and tillage on soil physical propertiesplant growth.and barley (Hordeum vulgare L.) root growth, an experiment was
conducted for several years on two soils of contrasting depth: deep, The most common variables used to assess soila Fluventic Xerochrept of 120-cm depth, and shallow, a Lithic Xeric strength in tillage studies are BD and penetrometerTorriorthent of 30-cm depth. Subsoil tillage (ST), minimum tillage resistance. They are interrelated, and the use of only(MT), and no-tillage (NT) were compared in the deep soil and MT one of these variables may lead to misleading resultsand NT in the shallow soil. Bulk density (BD), penetration resistance, (Campbell and Henshall, 1991).gravimetric water content, gravel content, and root length density Bulk density is inversely related to total porosity (Car-were determined at several times during the year. In the deep soil,
ter and Ball, 1993), which provides a measure of theBD was lower in the fallow and crop-after-fallow plots (1.26 Mg m�3)porous space left in the soil for air and water movement.than in the continuous-crop plots (1.32 Mg m�3). In this soil, NTThe optimal BD for plant growth is different for eachshowed the largest bulk densities (mean of 1.34 Mg m�3), followedsoil. In general, low BD (high porosity) leads to poorby MT (mean of 1.27 Mg m�3) and ST (mean of 1.22 Mg m�3). Larger
penetration resistance was found in NT than in ST and MT in both soils soil–root contact, and high BD (low porosity) reducessoon after tillage operations. However, root length density profiles aeration and increases penetration resistance (PR), lim-sometimes showed greater values for NT than for the other tillage iting root growth (Cassel, 1982).systems, revealing a good soil condition for root growth under NT. Bulk density is related to natural soil characteristicsTherefore, an increase in soil strength is observed under NT in the such as texture, organic matter, soil structure (Cassel,first years after its introduction that does not greatly affect root growth 1982; Chen et al., 1998), and gravel content (GC) (Fran-in well-structured soils. Fallow reduces soil strength due to the effect
zen et al., 1994). It varies over the year due to the actionof tillage and natural loosening factors like drying and wetting cyclesof several processes: freezing and thawing (Blevins et al.,or fauna activity. This effect extends to the following crop.1983; Unger, 1991), settling by desiccation and kineticenergy of rainfall (Cassel, 1982), and loosening by rootaction and animal activity. Crop operations, especiallyInterest in NT is growing in the rainfed cereal-crop-tillage, may also alter bulk soil density.ping areas around the world due to the effective
One of the goals of tillage is to reduce BD (increasingreduction in time and costs that this tillage systemsoil porosity). This effect of tillage on BD is temporary,allows. This is the case in the semiarid area of the Ebroand after tillage, the soil rapidly settles, recovering itsValley of Spain. To investigate the effect of NT andformer BD (Hernanz and Giron, 1988; Campbell andother tillage systems on plant and soil properties, a seriesHenshall, 1991; Franzen et al., 1994; Franzluebbers etof experiments began in 1992. The results on soil wateral., 1995). In the first years of NT, BD of the soil maycontent, root length density, and yield under continuousincrease due to the repeated passes of the tractor andcrop (CC) and crop after fallow (CAF) have been al-the lack of the loosening action of tillage.ready published in Lampurlanes et al. (2001) and Lamp-
Numerous experiments performed to compare NTurlanes et al. (2002). In this paper, we investigate thewith other conservation or more conventional tillageeffect of reducing tillage intensity on soil physical prop-systems have given different results. In most of them,erties and the relationship between soil physical condi-BD was greater in NT in the first 5 to 10 cm of soiltions and root growth.(Ehlers et al., 1983; Pelegrin et al., 1988; Radcliffe et al.,No-tillage is not a new technique. However, the con-1988; Hammel, 1989; Hill, 1990; Campbell and Henshall,cept of not disturbing the soil still clashes strongly with1991; Grant and Lafond, 1993; Rhoton et al., 1993; Fran-most farmers, who for years have disturbed the soil tozen et al., 1994; Hubbard et al., 1994; Franzluebbers etobtain a soft medium for better crop growth. For theal., 1995; Unger and Jones, 1998; Tebrugge and During,farmer, undisturbed soil seems to be harder and more1999; Wander and Bollero, 1999). In others, no differ-resistant to root penetration than tilled soil. In fact, highences in BD were found between tillage systemssoil strength has been proved to reduce and even stop(McCalla and Army, 1961; Cassel, 1982; Blevins et al.,root growth (Atwell, 1993). Measurements are needed1983; Burch et al., 1986; Blevins and Frye, 1993; Taboada
Departament de Produccio Vegetal i Ciencia Forestal, Universitat deAbbreviations: BD, bulk density; CAF, crop after fallow; CC, continu-Lleida–IRTA, Rovira Roure, 177, 25198 Lleida, Spain. Received 19ous crop; GC, gravel content; GWC, gravimetric water content; MT,Mar. 2001. *Corresponding author ([email protected]).minimum tillage; NT, no-tillage; PR, penetration resistance; RGR,root growth rate; ST, subsoil tillage.Published in Agron. J. 95:526–536 (2003).
526
LAMPURLANES & CANTERO-MARTINEZ: SOIL STRENGTH AND BARLEY ROOT GROWTH 527
et al., 1998; Arshad et al., 1999; Logsdon et al., 1999; 1994). In general, root tips are unable to penetrate poresnarrower than their diameter (Taylor, 1983; Hamblin,Ferreras et al., 2000; Logsdon and Cambardella, 2000).
In a third group, BD even decreased under NT (Moran 1985; Campbell and Henshall, 1991). They can exert avertical pressure ranging from 0.7 to 2.5 MPa, dependinget al., 1988; Pikul and Asae, 1995; Edwards, 1996; Cro-
vetto, 1998), especially when an increase in organic mat- on crop species (Gregory, 1994). Bulk density valuesthat limit root growth depend on soil water contentter was observed in the first layer of the soil (Edwards,
1996; Crovetto, 1998). (Pabin et al., 1998) and range between 1.46 and 1.90Mg m�3 (Campbell and Henshall, 1991).Owing to the progressive increase in BD after tillage,
the difference between tillage and NT becomes smaller Mechanical impedance increases as BD increases andwater content decreases (Ehlers et al., 1983). Penetra-as the time since tillage increases. In some soils, porosity
under NT decreases in the first few years until the soil tion resistance measured with the penetrometer is usu-ally 2 to 8 times greater than that actually experiencedrecovers its natural structure (Kinsella, 1995).
The most important factors affecting PR or the cone by the root tip (Bengough, 1991; Atwell, 1993; Gregory,1994), owing to the different way in which roots andindex of the soil are soil water content and BD (Cassel,
1982; Hamblin, 1985; Bradford, 1986; Klepper, 1990; probes penetrate the soil. However, it is well correlatedwith the soil strength perceived by roots in soils with aCampbell and O’Sullivan, 1991; Unger and Jones, 1998).
Texture, organic matter, particle surface roughness relatively homogeneous matrix (Atwell, 1993).Root growth decreases as PR increases (Taylor, 1983;(Cassel, 1982; Campbell and O’Sullivan, 1991), and
structure (Bradford, 1986; Campbell and O’Sullivan, Atwell, 1993; Gregory, 1994), showing a linear (Ehlerset al., 1983), inverse (Bengough, 1991; Atwell, 1993), or1991) may also produce a different PR in different soils
or in different layers of the same soil. exponential (Hamblin, 1985) relationship. Penetrome-ter values greater than 2 MPa are generally reported toPenetration resistance increases with depth due to
the increase in shaft friction (Bradford, 1986; Campbell produce a significant root growth reduction (Atwell,1993). However, in well-structured soils or those inand O’Sullivan, 1991; Franzen et al., 1994), and values
from the different soil depths are correlated with each which biochannels are preserved (as in nontilled soils),roots continue to extend at greater penetrometer read-other (Stelluti et al., 1998; Campbell and O’Sullivan,
1991). Yasin et al. (1993) found a cubic relationship ings because they can grow in the interaggregate spaces(Ehlers et al., 1983; Taylor, 1983; Klepper, 1990; Camp-between cone index and depth.
In several studies comparing tilled and nontilled soils, bell and Henshall, 1991).Fallow has been proved to affect water and N balancesgreater PR was found under NT, especially in the upper
10 cm (Ehlers et al., 1983; Radcliffe et al., 1988; Hammel, in the soil (French, 1978; McDonald and Fischer, 1991).It also seems reasonable to hypothesize that fallow can1989; Hill, 1990; Pelegrin et al., 1990; Agenbag and
Maree, 1991; Grant and Lafond, 1993; Lopez et al., have an effect on soil strength because greater watercontent generally encountered under fallow than under1996; Wander and Bollero, 1999; Ferreras et al., 2000).
Franzen et al. (1994) observed significantly smaller cone cultivated soils may modify the restructuring process ofthe soil and its biological activity.index values under NT down to 10-cm soil depth due
to mulching. As for BD, differences between NT and The objective of this study was to follow the evolutionof BD and PR in the first few years after NT was estab-more conventional soil-disturbing tillage methods are
great soon after tillage operations but fall quickly during lished on fallow and continuous barley and to determineits effects on root growth.the growing season and may disappear at the end of the
season (Pelegrin et al., 1990; Franzen et al., 1994; Lopezet al., 1996).
MATERIALS AND METHODSThe tillage system affects not only PR, but also itsrelated variables: soil water content and BD. For this The Experimentreason, some researchers have tried to separate the di-
The experimental fields of this study were located in Elrect effect of tillage on cone index from its indirect effect Canos, in the semiarid area of the northeast Ebro Valley,on water content and BD in different ways to allow Spain (mean annual precipitation of 440 mm), on two soils ofbetter comparisons. Campbell and O’Sullivan (1991) contrasting rooting depth that are representative of the soilsproposed measuring PR at field capacity and simultane- in the area. The deep soil was a fine-loamy, mixed, mesicously measuring BD. Busscher et al. (1997) adjusted Fluventic Xerochrept of 120-cm depth. The shallow soil was
a loamy, mixed, calcareous, mesic, shallow Lithic Xeric Torri-different functions to correct cone index values fromorthent of 30-cm depth. Both soils showed high GC, mainlywater content. Others used analysis of covariance toat the surface (≈15%). Some selected soil properties are shownreduce the effect of water content and BD in the conein Table 1.index comparisons (Yasin et al., 1993; Franzen et al.,
The experiment was designed as a randomized complete1994). After correction, the dependence of cone indexblock with four replications. The plots (10 by 6 m in area)on these variables is reduced (Busscher et al., 1997). were arranged in three contiguous strips. In the central strip,
The root system acts as a bridge between the crop barley was cropped every year. Lateral strips were alterna-operations and plant growth response (Klepper, 1990). tively under fallow or cropped with barley each year. WithThe most important soil physical properties affecting this arrangement, we investigated three field situations: CC,root growth are porosity, mechanical impedance, water CAF, and fallow. Three tillage systems were compared in the
deep soil (ST, MT, and NT) and two in the shallow soil (MTcontent, and soil structure (Klepper, 1990; Gregory,

528 AGRONOMY JOURNAL, VOL. 95, MAY–JUNE 2003
Table 1. Selected properties for the layers of the deep soil (Villar, {2 L ha�1 of 36% glyphosate [N-(phosphonomethyl)glycine]}1989) and the shallow soil. in October and in spring if weeds were present.
Texture USDAOrganic Equivalent
MeasurementsDepth matter CO3Ca Sand Silt Clay
cm % Rainfall and temperature were monitored daily at a weatherDeep soil 0–12 2.4 24 25.1 52.0 22.9 station situated 250 m from the experimental field.
12–32 1.0 25 24.6 53.2 22.2 Bulk density was determined by taking two undisturbed32–47 0.6 16 23.4 51.4 25.2 soil cores from each plot from 0- to 7- and 7- to 14-cm depths.47–117 0.7 7 21.0 51.5 27.5
We took the cores by hammering into the ground stainlessShallow soil 0–10 2.9 26 23.5 55.6 20.910–30 2.5 26 22.6 55.9 21.5 steel cutter edge cylinders 50 mm high and 60 mm in diameter
(141.37-cm3 inner volume). The cores were stored and trans-ported in hermetic cans to determine the gravimetric water
and NT). Subsoil tillage consisted of a subsoiler tilling at 40-cm content (GWC). The cores were dried, weighed, and washeddepth in August and field cultivating at 15-cm depth in October through a 2-mm sieve to determine the GC. Bulk density of(and cultivating in spring in the fallow plots if weeds were the fine soil (� � 2 mm) was calculated as (Mc � Mg)/(Vc �present). Minimum tillage consisted of a field cultivator work- Vg) � 100, where Mc and Vc are the dry mass and the volumeing to a depth of 15 cm before sowing (and in May in the of the soil core, respectively, and Mg and Vg are the massfallow plots if weeds were present). No-tillage consisted of and the volume of the gravel, respectively. This is another
form of Russos’s equation (cited by Franzen et al., 1994).maintaining the soil free of weeds by total herbicide spraying
Table 2. Dates of tillage operations, penetration resistance (PR) or bulk density (BD) measurements, and days and rainfall from thelast tillage operation in the deep soil and the shallow soil.
From last tillage operation
Date Tillage operation† Variable sampled Days Rainfall
Deep soil01 Sept. 1994 Subsoiling of ST plots26 Oct. 1994 Cultivator in ST and MT plots01 Nov. 1994 Sowing01 Dec. 1994 PR (except fallow plots) 36 5114 Mar. 1995 BD 139 6929 Mar. 1995 Cultivator in ST and MT (fallow plots)02 May 1995 PR (fallow plots) (34)‡ (23)04 May 1995 BD (fallow plots) (36) (23)15 Aug. 1995 Subsoiling of ST plots15 Sept. 1995 Cultivator in ST and MT plots BD 25 3720 Sept. 1995 PR 30 7216 Oct. 1995 Cultivator in ST and MT plots23 Oct. 1995 Sowing07 Nov. 1995 BD 22 515 Feb. 1996 PR 122 21223 Feb. 1996 BD 130 21208 May 1996 Cultivator in ST and MT fallow plots07 June 1996 PR, BD 235 (30) 401 (109)16 Sept. 1996 Subsoiling of ST plots24 Oct. 1996 Cultivator in ST and MT plots25 Oct. 1996 Sowing04 Nov. 1996 Compactor roller in ST and MT plots03 Dec. 1996 PR 78 7928 Feb. 1997 Resowing continuous crop plots11 Mar. 1997 PR, BD 176 274
Shallow soil26 Oct. 1994 Cultivator in MT plots01 Nov. 1994 Sowing28 Nov. 1994 PR 33 4915 Feb. 1995 PR 112 6607 Mar. 1995 BD 132 6929 Mar. 1995 Cultivator in MT fallow plots02 May 1995 PR (fallow plots) (34) (23)04 May 1995 BD (fallow plots) (36) (23)26 Sept. 1995 PR 335 (181) 263 (194)16 Oct. 1995 Cultivator in MT plots23 Oct. 1995 Sowing08 Nov. 1995 BD 23 512 Feb. 1996 PR 119 21222 Feb. 1996 BD 129 21208 May 1996 Cultivator in MT (fallow plots)07 June 1996 PR, BD 235 (30) 401 (109)16 Sept. 1996 Cultivator in MT plots24 Oct. 1996 Cultivator in MT plots25 Oct. 1996 Sowing04 Nov. 1996 Compactor roller04 Dec. 1996 PR 41 7913 Mar. 1997 PR, BD 140 274
† ST, subsoil tillage; MT, minimum tillage; NT, no-tillage.‡ Values in parenthesis are for fallow plots and were computed from the spring tillage.
LAMPURLANES & CANTERO-MARTINEZ: SOIL STRENGTH AND BARLEY ROOT GROWTH 529
Gravel content was calculated as Mg/Vc to allow comparison to unequal cell size, this analysis was done as a split-split plotwith Franzen et al.’s (1994) results. Gravimetric water content (Littell et al., 1991), with tillage as a main plot and samplingwas obtained from the fresh and dry weights of the cores. date and depth as successive subplots. Separate analyses ofGravimetric rather than volumetric water content was used variance were computed for every strip: CC, CAF, and fallow.because volumetric water content is affected by BD, which Gravimetric water content, GC, or both were used as covari-varies at the same time during penetration measurements ables in the analysis of BD data when significant linear rela-(Campbell and O’Sullivan, 1991). tionship was found between them and BD. There was a signifi-
To measure PR, we used a hand-held penetrograph (Sti- cant linear relationship between PR and GWC and BD in allboka penetrograph, Eijkelkamp Agrisearch Equipment, Gies- strips. For this reason, we use both GWC and BD as covari-beek, the Netherlands) that draws a graph of the resistance ables for the PR data analysis. Least-square means (correctedto penetration vs. depth to a depth of 80 cm. The conical by the covariables) were used to compare treatments, andpoint was 1 cm2 in area, and the point angle was 60�. The differences for main effects and interactions were tested withmeasurement range was 0 to 5 MPa. At each measurement the PDIFF option of the LSMEANS statement (Littell ettime, we obtained two graphs per plot with a total of eight al., 1991).replications per treatment. To quantify the relationship between soil strength and root
The dates on which tillage operations and BD and pene- growth, a multiple regression analysis was performed on eachtrometer resistance determinations were made are shown in soil, with the RGR as the response variable and GWC, BD,Table 2. and PR as the predictors.
Gravimetric water content and root length density profileswere obtained by taking soil cores between rows with Edelmanor Riverside 5-cm-diam. augers (Eijkelkamp Agrisearch Equip- RESULTSment, Giesbeek, the Netherlands) at important developmentalstages of the barley tillering, stem elongation, anthesis, matu- Rainfallrity, and harvest. Additional samples for water content were
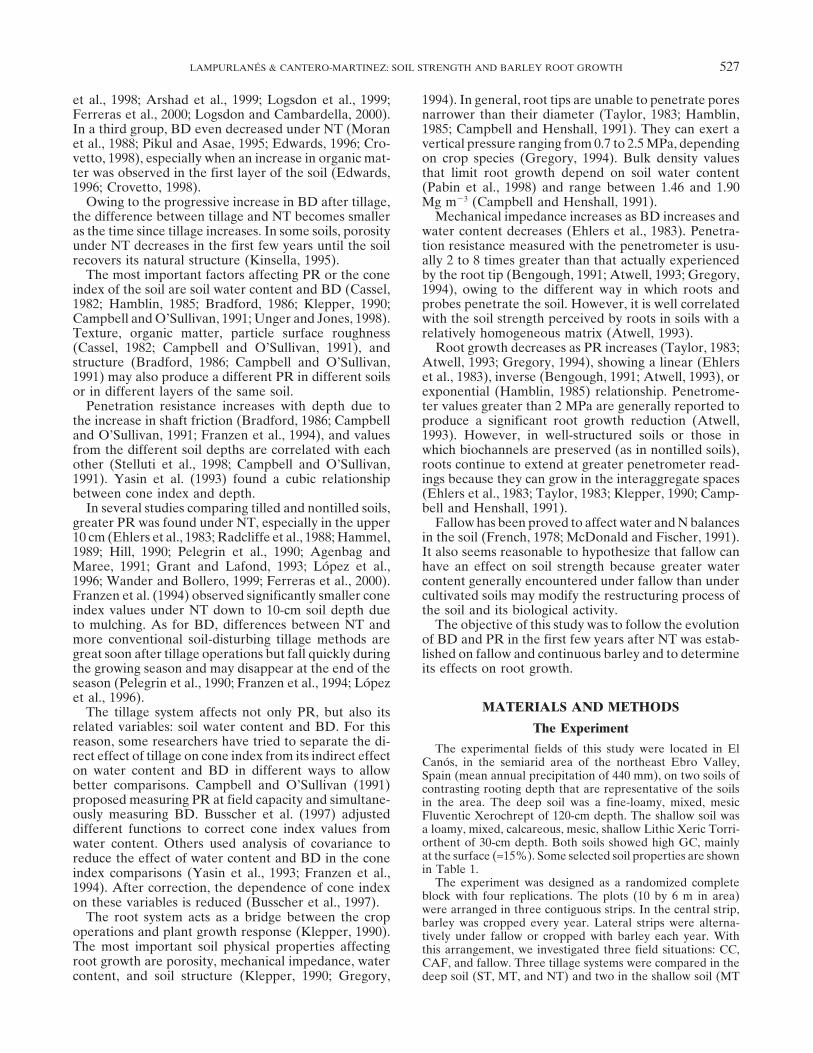
Daily rainfall and tillage operations are shown intaken at sowing and during winter. In each plot of the deepFig. 1. The driest year was 1994–1995, with little wintersoil, soil cores were taken from 0- to 25-, 25- to 50-, 50- to
75-, and 75- to 100-cm depth. In the shallow soil, the cores and spring rainfall. The wettest years were 1995–1996sampled the profile from 0- to 10- and 10- to 30-cm depth. and 1996–1997, with high winter rainfall. In 1995–1996,
Roots in each core were washed out by elutriation (Pearcy spring rainfall was also high.et al., 1989) and stained following the procedure of Ward et In 1994–1995, rainfall between the first and secondal. (1978). Root length was determined by the line intersection tillage operations (142 mm) was higher than in 1995–method (Newman, 1966) and root length density calculated
1996 (74 mm) or in 1996–1997 (52 mm). On the otheras the quotient between root length and volume of the sample.hand, rainfall between the second and third tillage oper-Root growth rate (RGR) between two sample dates was calcu-ations was higher in 1995–1996 (294 mm) and 1996–1997lated as the difference in root length density divided by the
number of days. (275 mm) than in 1994–1995 (69 mm). PrecipitationGravimetric water content was obtained by drying the sam- between the third and first tillage was also higher in
ples (Campbell and Mulla, 1990). 1995–1996 (293 mm) than in 1994–1995 (122 mm).
StatisticsBulk Density
Statistical analyses were accomplished using SAS software.There was a positive linear relationship betweenThe data were analyzed as repeated measures over time and
space (Steel and Torrie, 1980; Gomez and Gomez, 1984). Due GWC and BD for CC and fallow strips of the deep soil
Fig. 1. Daily rainfall and tillage operations. T1, subsoiling and cultivation in subsoil tillage (ST) plots; T2, cultivation in ST and minimum tillage(MT) plots; T3, cultivation in ST and MT fallow plots.
530 AGRONOMY JOURNAL, VOL. 95, MAY–JUNE 2003
Table 4. Probabilities of the bulk density (BD, Mg m�3) analysisTable 3. Regression coefficients of bulk density (BD, t m�3) vs.gravimetric water content (GWC, %) and gravel content (GC, of covariance and LSMEANS separation for the different field
conditions in the deep soil.t m�3) by strip for the deep and shallow soil.
n† Intercept GWC GC R 2 CV‡ Source of variation† Continuous crop Crop after fallow Fallow
GWC 0.0003 – 0.0001Deep soilGC – – 0.0001Continuous crop 143 1.16*** 0.0090* �0.004 0.04§ 12.7TILL 0.03 0.09 0.002Crop after fallow 144 1.17*** 0.0044 0.088 0.01 13.2DATE 0.0001 0.0001 0.0006Fallow 192 1.06*** 0.0148*** �0.256*** 0.15*** 12.7TILL � DATE NS‡ NS NSShallow soilDEPTH 0.0001 0.0001 0.0001Continuous crop 80 1.06*** 0.0072§ �0.399*** 0.15** 13.7TILL � DEPTH NS NS 0.0001Crop after fallow 80 1.20*** �0.0025 �0.197* 0.07§ 10.3DATE � DEPTH NS NS 0.05Fallow 96 0.89*** 0.0152*** �0.336*** 0.31*** 11.6TILL � DATE � DEPTH NS NS 0.07
* Significant at P � 0.05. 0.0001 0.002 0.0001Model P � F 0.011 0.016 0.008** Significant at P � 0.01.MSE 52 54 61*** Significant at P � 0.001.df 0.87 0.78 0.90† n, number of observations.R 2 7.9 10.0 6.9‡ CV, coefficient of variation.CV§ Significant at P � 0.10.Mean 1.32 1.26 1.27TILL
and for the fallow strip of the shallow soil (Table 3). The ST 1.27b§ 1.22b 1.19cMT 1.31ab 1.26ab 1.25blinear relationship between GC and BD was negative forNT 1.36a 1.31a 1.36athe fallow strip of the deep soil and for all of the shallow- DATEMar. 1995 1.46ab 1.30a 1.27cdsoil strips.May 1995 – – 1.26cdSept. 1995 1.26c 1.22b 1.16d
Deep Soil Nov. 1995 0.78d 1.12b 1.16dFeb. 1996 1.40ab 1.34a 1.38ab
Measured BDs ranged between 0.69 and 1.66 Mg m�3. June 1996 1.58a 1.34a 1.29bcMar. 1997 1.40ab 1.31a 1.36abMean BD (Table 4) was similar for CAF and fallow
DEPTHstrips (1.26 and 1.27 Mg m�3) and greater for CC strip 0–7 1.26b 1.21b 1.20b7–14 1.37a 1.32a 1.34a(1.32 Mg m�3). The smallest BDs were found during
the fall and winter months (about 1.12 Mg m�3) and the † GWC, gravimetric water content (%); GC, gravel content (Mg m�3);TILL, tillage system [subsoil tillage (ST), minimum tillage (MT), and no-greatest in spring and summer (1.36 Mg m�3). Bulktillage (NT)]; DATE, date on which measurements were made; DEPTH,density was significantly smaller (P � 0.0001) in the 0-depth of soil (cm); MSE, mean square error; df, degrees of freedom;
to 7-cm soil layer (1.22 Mg m�3) than in the 7- to 14-cm CV, coefficient of variation.‡ NS, nonsignificant at the 0.1 probability level.layer (1.34 Mg m�3).§ Different letters within the columns indicate significant differences (LSDThe effect of tillage on BD was significant in the test at P � 0.05).
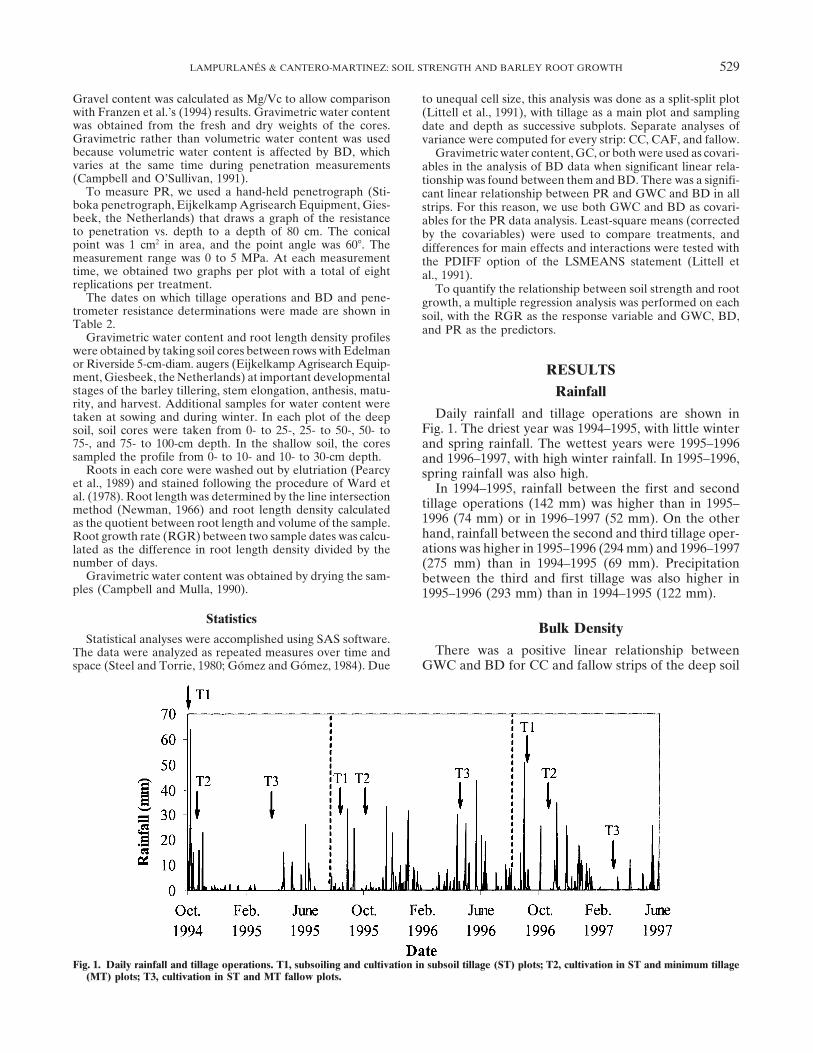
three strips. Bulk density was greater, in general, forNT (mean of 1.34 Mg m�3), medium for MT (1.27 Mg differences were more significant in fallow, the only
strip with significant tillage system � soil depth interac-m�3), and lower for ST (1.22 Mg m�3), according totillage intensity. tion (P � 0.0001, Table 4). The greatest difference be-
tween tillage systems was found in fallow in June 1996Bulk density trends in Fig. 2 show that over the threestrips, BD was greater under NT in the 0- to 7-cm layer from 0- to 7-cm depth, 30 d and 109 mm of rain after
the last tillage operation.and lower under ST in the 7- to 14-cm layer though
Fig. 2. Bulk density (BD) trends for three tillage systems in the deep soil: subsoil tillage (ST), minimum tillage (MT), and no-tillage (NT).
LAMPURLANES & CANTERO-MARTINEZ: SOIL STRENGTH AND BARLEY ROOT GROWTH 531
Table 6. Regression coefficients of penetration resistance (MPa)Table 5. Probabilities of the bulk density (BD, Mg m�3) analysisof covariance and LSMEANS separation for the different field vs. gravimetric water content (GWC, %) and bulk density (BD,
t m�3) by strips for the deep soil and shallow soil.conditions in the shallow soil.
Source of variation† Continuous crop Crop after fallow Fallow n† Intercept GWC BD R 2 CV‡
Deep soilGWC 0.02 – 0.0001GC 0.0008 0.001 0.0001 Continuous crop 2413 �3.10*** �0.087*** 5.00*** 0.28*** 39.4
Crop after fallow 1738 �2.82*** �0.116*** 5.09*** 0.40*** 42.0TILL NS‡ NS NSDATE 0.003 NS 0.02 Fallow 2540 �3.31*** �0.072*** 5.09*** 0.26*** 40.8
Shallow soilTILL � DATE NS NS NSDEPTH 0.0001 0.0001 0.0001 Continuous crop 992 2.45*** �0.067*** 1.12*** 0.06*** 48.4
Crop after fallow 918 1.16*** �0.107*** 2.51*** 0.23*** 50.2TILL � DEPTH NS NS NSDATE � DEPTH NS NS 0.07 Fallow 1463 1.53*** �0.111*** 2.34*** 0.15*** 51.9TILL � DATE � DEPTH NS NS 0.08
*** Significant at P � 0.001.Model P � F 0.002 0.0002 0.0001† n, number of observations.MSE 0.012 0.005 0.007‡ CV, coefficient of variation.df 28 29 34
R 2 0.84 0.86 0.90CV 10.0 6.4 7.4 to 1.20 Mg m�3 in March 1997 for CC and from 1.11 toMean 1.11 1.13 1.09 1.25 Mg m�3 for fallow on the same dates), whereas forTILL
CAF, it decreased (from 1.21 to 1.14 Mg m�3).MT 1.12 1.10 1.08NT 1.09 1.15 1.10
DATE Penetration ResistanceMar. 1995 1.01c§ 1.21 1.11bMay 1995 – – 0.98b For both soils and all strips, there was a negativeSept. 1995 0.97c 1.09 0.93b
linear relationship between GWC and PR and a positiveNov. 1995 1.13bc 1.07 1.13abFeb. 1996 1.21ab 1.13 1.14ab one between BD and PR (Table 6).June 1996 1.20a 1.14 1.25aMar. 1997
DEPTH Deep Soil0–7 1.03b 1.08b 1.02b7–14 1.18a 1.17a 1.16a Though tillage system was not significant for this vari-
able, tillage system � soil depth interaction was very† GWC, gravimetric water content (%); GC, gravel content (Mg m�3);TILL, tillage system [minimum tillage (MT) and no-tillage (NT)]; significant in the three strips (P � 0.0001; Table 7).DATE, date on which measurements were made; DEPTH, depth of soil Tillage system � measurement date � soil depth inter-(cm); MSE, mean square error; df, degrees of freedom; CV, coefficient
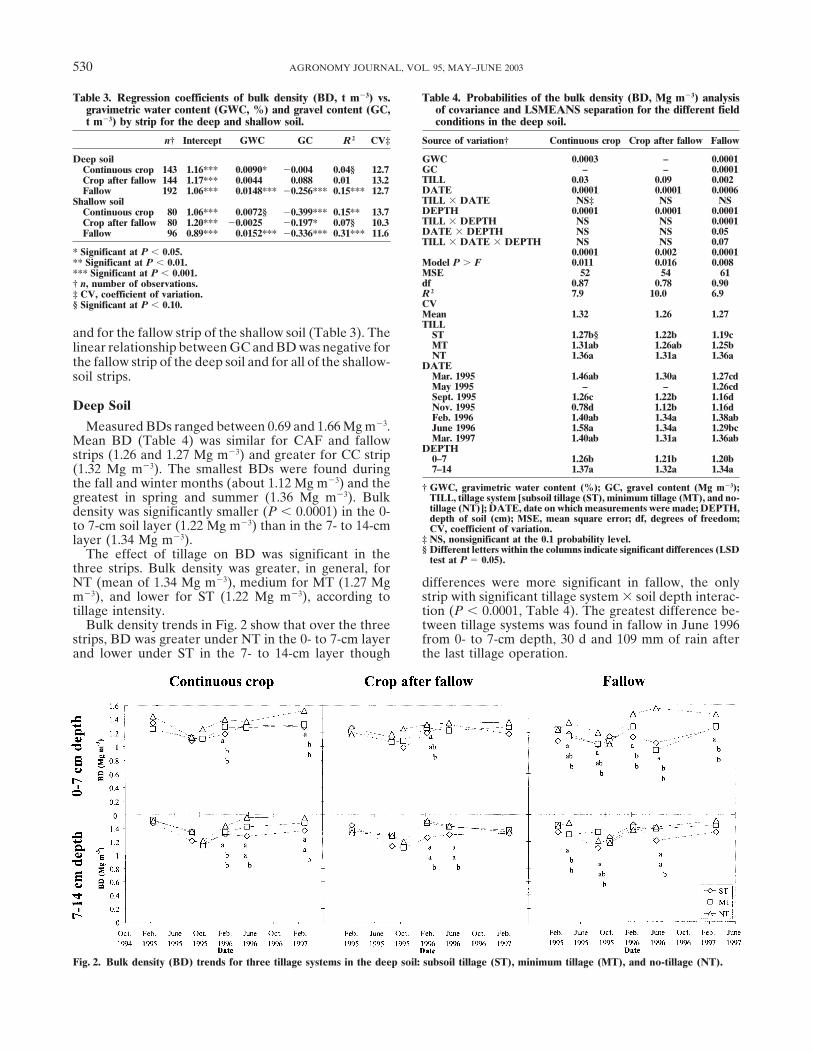
action was also significant in the CAF (P � 0.02) andof variation.‡ NS, nonsignificant at the 0.1 probability level. fallow (P � 0.007) strips. Differences between tillage§ Different letters within the columns indicate significant differences (LSD systems were more evident in the first 20-cm depth,test at P � 0.05).
principally on the following dates (Fig. 3): May 1995 inthe fallow strip, 34 d after cultivator tillage (23 mm of
Shallow Soil accumulated rainfall); September 1995, 30 d after tillage(72 mm); and March 1997, 176 d after last tillageBulk density ranged from 0.67 to 1.46 Mg m�3. Mean
BD for both tillage systems was 1.10 Mg m�3. The results (274 mm). On these dates, PR in NT was 0.5 to 1 MPagreater than that in MT and ST in the first 10-cm depth,of the analysis of covariance for BD (Table 5) show
that neither tillage system nor tillage system � soil depth especially in the fallow strip. In addition, ST showed aPR that was about 1 MPa lower than that in MT and NTinteraction was significant in any strip. Clearly, soil
depth had a significant effect (P � 0.0001), with a mean from 10- to 25-cm depth in September 1995, especially inthe CAF and fallow strips.BD of 1.04 Mg m�3 from 0- to 7-cm depth and 1.17 Mg
m�3 from 7 to 14 cm. For CC and fallow strips, BD The greatest differences between CC and CAF stripswere found in the first 20 cm of soil. In this layer, meanincreased with time (from 1.01 Mg m�3 in March 1995
Table 7. Probabilities of the penetration resistance analysis of covariance for the different field conditions in the deep soil.
Source of variation† Continuous crop Crop after fallow Fallow
GWC 0.0001 0.0001 0.0001BD 0.0001 0.0001 0.0001TILL NS‡ NS NSDATE 0.001 NS 0.0002TILL � DATE NS NS NSDEPTH 0.0001 0.0001 0.0001TILL � DEPTH 0.0001 0.0001 0.0001DATE � DEPTH 0.0001 0.0001 0.0001TILL � DATE � DEPTH NS 0.02 0.007Model P � F 0.0001 0.0001 0.0001MSE 5296 6101 7086df 2102 1522 2189R 2 0.70 0.70 0.64CV 27.5 31.7 30.8
† GWC, gravimetric water content (%); TILL, tillage system; DATE, date on which measurements were made; DEPTH, depth of soil (cm); MSE, meansquare error; df, degrees of freedom; CV, coefficient of variation.
‡ NS, nonsignificant at the 0.1 probability level.

532 AGRONOMY JOURNAL, VOL. 95, MAY–JUNE 2003
Fig. 3. Penetration resistance (PR) profiles in the three strips at different times for the three tillage systems in the deep soil: subsoil tillage (ST),minimum tillage (MT), and no-tillage (NT).
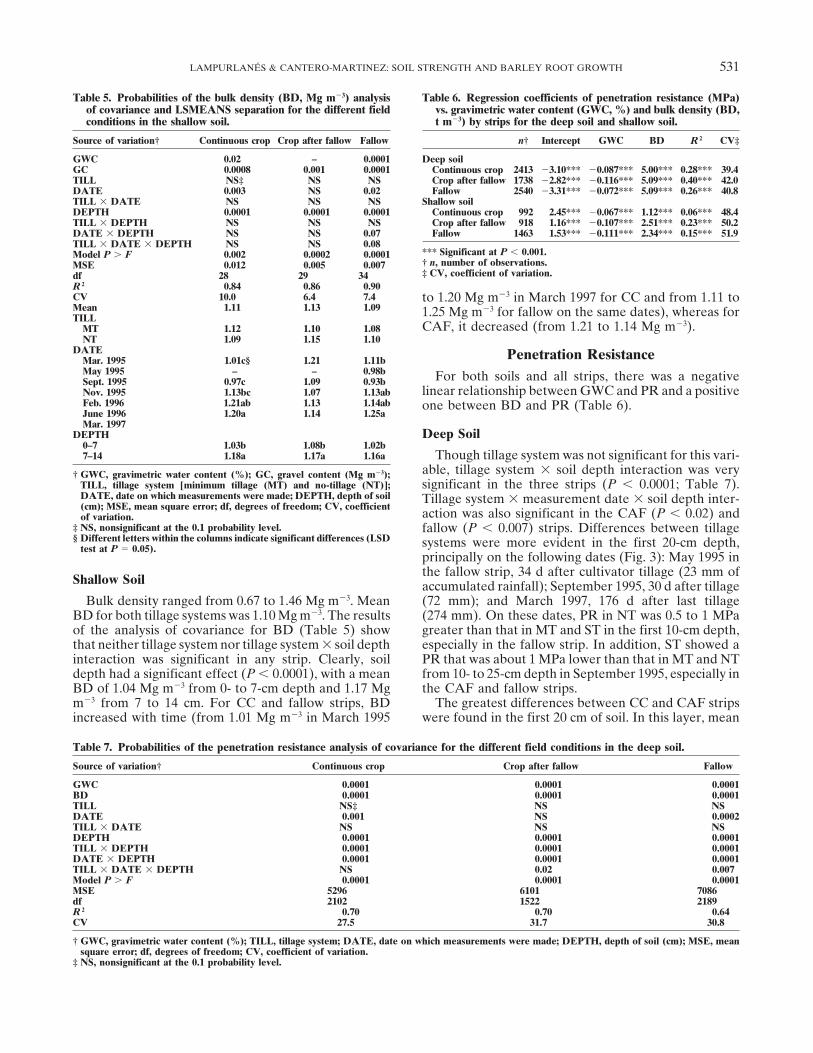
PR was greater for CC than for CAF (0.43 MPa in ST, year, and the differences between MT and NT also in-creased from 0.5 MPa in February 1996 to 1 MPa in0.27 in MT, and 0.36 in NT).March 1997. In the fallow strip, both mean and differ-ences in PR between tillage systems decreased with year.Shallow SoilThe largest differences in PR between MT and NT werePenetration resistance was affected by tillage systems,found in the first 10 to 15 cm of soil in the fallow stripas a main factor, in the fallow strip only (P � 0.012)in May 1995 (34 d after tillage) and June 1996 (30 d(Table 8). However, tillage system � soil depth interac-after tillage) (Fig. 5).tion was significant in the three strips (P � 0.009 for
In the first 20 cm of soil, PR was greater in the CCCC and P � 0.0001 for CAF and fallow strips). Figure 4than in the CAF strip, with a difference of 0.55 MPashows PR profiles for February 1995, February 1996,for MT and 0.32 MPa for NT.and March 1997 at 112, 119, and 140 d after the last
tillage operation, respectively. In CC, PR increased with Soil Strength and Root Growth Rateyear from about 3 MPa in 1994 to nearly 4 MPa in 1996.The differences between MT and NT also increased The relationship between RGR and GWC was posi-
tive, the relationship between RGR and BD was notfrom 0 to 1 MPa in the 0- to 10-cm layer for the sameperiod of time. On the CAF strip, PR increased with significant, and the relationship between RGR and PR
Table 8. Probabilities of the penetration resistance analysis of covariance for the different field conditions in the shallow soil.
Source of variation† Continuous crop Crop after fallow Fallow
GWC 0.0001 0.0001 0.0001GC 0.0001 0.0001 0.0001TILL NS‡ NS 0.012DATE 0.038 0.0001 0.0001TILL � DATE NS NS 0.028DEPTH 0.0001 0.0001 0.0001TILL � DEPTH 0.0094 0.0001 0.0001DATE � DEPTH 0.0001 0.0001 0.0001TILL � DATE � DEPTH NS 0.0043 0.04Model P � F 0.0001 0.0001 0.0001MSE 7139 4976 6138df 792 649 1041R 2 0.62 0.74 0.69CV 33.0 31.5 33.9
† GWC, gravimetric water content (%); GC, gravel content (Mg m�3); TILL, tillage system; DATE, date on which measurements were made; DEPTH,depth of soil (cm); MSE, mean square error; df, degrees of freedom; CV, coefficient of variation.
‡ NS, nonsignificant at the 0.1 probability level.

LAMPURLANES & CANTERO-MARTINEZ: SOIL STRENGTH AND BARLEY ROOT GROWTH 533
Fig. 4. Penetration resistance (PR) changes in time for the three strips and the two tillage systems in the shallow soil: minimum tillage (MT)and no-tillage (NT).
was negative for the deep soil and positive for the shal- action that reduced BD and PR in these plots. Thiseffect extended to the following crop, as is shown bylow soil (Table 9).
The RGR was significantly higher for the CAF strip the lower BD and PR found on the CAF strip than onthan for the CC strip in the deep soil (P � 0.013) but not the CC strip. In NT, lower soil strength of plots wasin the shallow soil (Table 10). This reveals the beneficial also found on the CAF strip than on the CC strip. Ineffect of fallow in the following crop. Differences be- these plots, only natural soil-loosening factors, such astween tillage systems were not significant. drying and wetting cycles or fauna activity, could reduce
soil strength because weeds were removed chemically.Strength reduction due to fallow in NT plots was greaterDISCUSSIONthan in MT plots of the deep soil and lower than in MT
Fallow Effects on Soil Strength plots of the shallow soil. This indicates that in somesituations, natural factors induced by fallow may be asDuring fallow, tillage was performed to control weedseffective as tillage in reducing soil strength.in ST and MT plots. This tillage also had a loosening
Tillage System Effects on Soil StrengthBulk density in NT was greater than in tilled plots in
the first 7 cm of the deep soil, as has also been reportedby a number of authors (Pelegrin et al., 1988; Radcliffeet al., 1988; Hammel, 1989; Hill, 1990; Grant and Lafond,1993; Rhoton et al., 1993; Franzen et al., 1994; Hubbardet al., 1994; Franzluebbers et al., 1995; Unger and Jones,1998; Tebrugge and During, 1999; Wander and Bollero,1999), and increased from 1.29 Mg m�3 in March 1995to 1.44 Mg m�3 in March 1997. This effect was especiallyclear on fallow plots (Fig. 2).
There could be two reasons for these results. First,we measured BD in the first 5 yr after the change fromconventional tillage to NT. According to Kinsella(1995), the soil was in the transition period in which itbuilds humus, regains its structural stability, and restoresthe pore space. During this period, there is first anincrease in BD up to a maximum and then a decreasedue to the restructuring process until an equilibriumFig. 5. Two penetration resistance (PR) profiles in the fallow striplevel is reached when the structure is fully restored. Theshowing the largest PR differences between the tillage systems in
the shallow soil: minimum tillage (MT) and no-tillage (NT). second reason was the low quantity of residues left on

534 AGRONOMY JOURNAL, VOL. 95, MAY–JUNE 2003
Table 9. Regression coefficients of the growth rate of the root length density (cm cm�3 d�1) vs. gravimetric water content (GWC, %),bulk density (BD, t m�3), and penetration resistance (PR, MPa) for the deep soil and the shallow soil.
n† Intercept GWC BD PR R 2 CV‡
Deep soil 338 0.02 0.0006** �0.14 �0.002* 0.12*** 142Shallow soil 160 �0.02 0.0023*** �0.02 0.006* 0.10*** 212
* Significant at P � 0.05.** Significant at P � 0.01.*** Significant at P � 0.001.† n, number of observations.‡ CV, coefficient of variation.
the soil (straw was packed and removed after harvest, Fifty-nine percent of the PR recorded in the deep soiland the shallow soil ranged from 1.3 to 3.7 MPa. Theseas it is a normal practice in the area), which delayed
the increase in organic matter and the restructuring PR values are reported to produce a 50 to 100% reduc-tion in elongation rate for barley (Hadas, 1997). On theprocess of the soil.
Subsoiling was effective in reducing BD in depth other hand, root length density profiles (Lampurlaneset al., 2001, 2002) do not indicate poor conditions for(7–14 cm). Larger differences would probably have been
found if BD had been measured at greater depths. root growth in these soils because the greatest rootlength densities were found in NT, the tillage treatmentIn the shallow soil, with greater GC than the deep
soil, no differences were found in BD among tillage that also showed the greatest soil strength.Several factors could contribute to these high PRsystems due to the structural effect of gravel (Franzen
et al., 1994), which protected the soil against compaction readings. First, the soil has high GC. The gravel inter-fered with the penetrometer measurements, increasingin both MT and NT plots.
When significant differences in PR were found be- the values (Hamblin, 1985) and the variance of the PRreadings (Campbell and O’Sullivan, 1991). Second,tween tillage systems, plots under NT showed greater
PR in the first 10 to 20 cm of soil than tilled plots, as has these soils have moderately high clay content (Table 1)that increases with depth and leads to the formation ofalso been observed by a number of authors (Radcliffe et
al., 1988; Hammel, 1989; Hill, 1990; Pelegrin et al., 1990; strong columnar aggregates (Villar, 1989), which in-crease the PR readings (Atwell, 1993). Finally, the or-Agenbag and Maree, 1991; Grant and Lafond, 1993;
Franzen et al., 1994; Lopez et al., 1996; Wander and ganic matter was relatively high for these semiarid soils(2–3% in the top layer of the soil, Table 1), which isBollero, 1999; Ferreras et al., 2000). In the deep soil,
differences found in the first 20-cm depth were ac- also reported to increase PR (Campbell and O’Sulli-van, 1991).cording to tillage intensity: lower PR for ST, medium
for MT, and higher for NT (Fig. 3). In March 1997, far The stress required to drive a probe into compactedsoil is four to eight times that required for the roots tofrom tillage operations, great differences were found
between NT and ST or MT on CC in the deep soil penetrate the soil (Bengough, 1991; Atwell, 1993). Thisis because roots grow along the boundaries between the(Fig. 3) and between NT and MT on CC and CAF in
the shallow soil (Fig. 4). This seems to indicate, as in peds, thereby avoiding the resistance to penetration ofthe bulk soil (Campbell and Henshall, 1991; Atwell,the case of BD, that the soil under NT is in the transition
period when the soil strength increases. 1993), as was observed by Villar (1989) in the deep soil.The significant relationship between RGR and GWC
(Table 9) was positive because most data were from theSoil Strength and Root Growthpreanthesis period in which roots are still extending. TheThe maximum BDs recorded in the deep soil werefact that the relationship with BD was not significantbetween the critical (1.67 Mg m�3) and the nonlimitingcorroborates the idea that BDs in these soils were below(1.46 Mg m�3) BD values for root growth stated bythe critical range for root growth. The positive regres-Pierce et al. (1983; cited by Godwin, 1990). In the shal-sion coefficient found between RGR and PR in thelow soil, BD was below the nonlimiting value.shallow soil may be due to the high GC in this soil,especially in the first layer where root length densityTable 10. Growth rate of the root length density (cm cm�3 d�1)was also greater.in the preanthesis stages for three tillage systems [subsoil tillage
(ST), minimum tillage (MT), and no-tillage (NT)] and two field The reduction in soil strength in the CAF strip duesituations [continuous crop (CC) and crop after fallow (CAF)] to fallow resulted in higher growth rates of the rootin the deep and shallow soil. Three-year data. length density in the CAF strip than in the CC strip
Deep soil Shallow soil (Table 10). This effect was observed in both the deepand shallow soil, demonstrating the favorable effect thatTillage CC CAF CC CAFfallow can have on root growth in the first stages ofST 0.0038b† 0.0079 – –the crop.MT 0.0063a 0.0080 0.0191 0.0137
NT 0.0054ab 0.0067 0.0123 0.0182Mean 0.0052 0.0075 0.0157 0.0160ANOVA P � 0.013 NS‡ NS NS CONCLUSIONS
† Different letters within the column indicate significant differences (LSD Fallow has been effective in reducing soil strength fortest at P � 0.05).‡ NS, nonsignificant at the 0.1 probability level. the following crop. This effect is as important in tilled
LAMPURLANES & CANTERO-MARTINEZ: SOIL STRENGTH AND BARLEY ROOT GROWTH 535
influence on some physical, chemical and biological parameters.as in nontilled fallows, indicating that natural looseningJ. Soil Water Conserv. 53:194–199.factors, like drying and wetting cycles or fauna activity,
Edwards, W.M. 1996. Soil structure: Processes and management. p.may be as effective as tillage in reducing soil strength. 7–14. In R. Lal and F.J. Pierce (ed.) Soil management for sus-
After the introduction of NT, there is an increase in tainability. Soil and Water Conserv. Soc., Ankeny, IA.Ehlers, W., U. Kopke, F. Hesse, and W. Bohm. 1983. Penetrationsoil strength compared with tilled soils. In our well-
resistance and root growth of oats in tilled and untilled loess soil.structured soils, this increase in strength does not limitSoil Tillage Res. 3:261–275.root growth because roots can grow between the aggre- Ferreras, L.A., J.L. Costa, F.O. Garcia, and C. Pecorari. 2000. Effect of
gates. In gravelly soils, the increase in strength is smaller no-tillage on some soil physical properties of a structural degradedPetrocalcic Paleudoll of the southern “Pampa” of Argentina. Soildue to the structural supporting effect of gravel.Tillage Res. 54:31–39.Differences in root growth due to the cropping (fallow
Franzen, H., R. Lal, and W. Ehlers. 1994. Tillage and mulching effectsor CC) or tillage system were small because the soilon physical properties of a tropical Alfisol. Soil Tillage Res. 28:329–
strength did not reach limiting levels for root growth. 346.Franzluebbers, A.J., F.M. Hons, and D.A. Zuberer. 1995. Tillage and
crop effects on seasonal dynamics of soil CO2 evolution, waterACKNOWLEDGMENTScontent, temperature, and bulk density. Appl. Soil Ecol. 2:95–109.
This work was funded by the Comision de Investigacion French, R.J. 1978. The effect of fallowing on the yield of wheat: I.The effect on soil water storage and nitrate supply. Aust. J. Agric.Cientıfica y Tecnica (CICYT), projects AGR91-312 andRes. 29:653–668.AGF94-198. We thank the Ministerio de Educacion y Cultura
Godwin, R.J. 1990. Agricultural engineering in development: Tillage(MEC), which funded the doctorate studies of J. Lampurlanes.for crop production in areas of low rainfall. FAO, Rome.We also thank J. Boixadera and C. Herrero from the Seccio
Gomez, K.A., and A.A. Gomez. 1984. Statistical procedures for ag-de Noves Tecnologies (DARP), who lent us the penetrograph.ricultural research. John Wiley & Sons, New York.
Grant, C.A., and G.P. Lafond. 1993. The effects of tillage systemsREFERENCES and crop sequences on soil bulk density and penetration resistance
on a clay soil in southern Saskatchewan. Can. J. Soil Sci. 73:223–232.Agenbag, G.A., and P.C.J. Maree. 1991. Effect of tillage on some soil Gregory, P.J. 1994. Root growth and activity. p. 65–93. In K.J. Boote,properties, plant development and yield of spring wheat (Triticum J.M. Bennett, T.R. Sinclair, and G.M. Paulsen (ed.) Physiology andaestivum L.) in stony soil. Soil Tillage Res. 21:97–112. determination of crop yield. ASA, CSSA, and SSSA, Madison, WI.Arshad, M.A., A.J. Franzluebbers, and R.H. Azooz. 1999. Compo-Hadas, A. 1997. Soil tilth—the desired soil structural state obtainednents of surface soil structure under conventional and no-tillage
through proper soil fragmentation and reorientation processes. Soilin northwestern Canada. Soil Tillage Res. 53:41–47.Tillage Res. 43:7–40.Atwell, B.J. 1993. Response of roots to mechanical impedance. Envi-
Hamblin, A.P. 1985. The influence or soil structure on water move-ron. Exp. Bot. 33:27–40.ment, crop root growth, and water uptake. Adv. Agron. 38:95–158.Bengough, A.G. 1991. The penetrometer in relation to mechanical
Hammel, J.E. 1989. Long-term tillage and crop rotation effects onresistance. p. 431–446. In K.A. Smith and C.E. Mullins (ed.) Soilbulk density and soil impedance in northern Idaho. Soil Sci. Soc.analysis. Physical methods. Marcel Dekker, New York.Am. J. 53:1515–1519.Blevins, R.L., and W.W. Frye. 1993. Conservation tillage: An ecologi-
Hernanz, J.L., and V.S. Giron. 1988. Experiments on the growing ofcal approach to soil management. Adv. Agron. 51:33–78.cereals with different tillage systems in central Spain. p. 691–696. InBlevins, R.L., M.S. Smith, G.W. Thomas, and W.W. Frye. 1983. Influ-Proc. Int. Conf. of the Int. Soil Tillage Res. Organ., 11th, Edinburgh,ence of conservation tillage on soil properties. J. Soil Water Con-Scotland. 11–15 July 1988. ISTRO, Edinburgh, Scotland.serv. 38:301–304.
Hill, R.L. 1990. Long-term conventional and no-tillage effects onBradford, J.M. 1986. Penetrability. p. 463–478. In A. Klute (ed.) Meth-selected soil physical properties. Soil Sci. Soc. Am. J. 54:161–166.ods of soil analysis. Part 1. Agron. Monogr. 9. 2nd ed. ASA and
Hubbard, R.K., W.L. Hargrove, R.R. Lowrance, R.G. Williams, andSSSA, Madison, WI.B.G. Mullinix. 1994. Physical properties of a clayey coastal plainBurch, G.J., I.B. Mason, R.A. Fischer, and I.D. Moore. 1986. Tillagesoil as affected by tillage. J. Soil Water Conserv. 49:276–283.effects on soils: Physical and hydraulic responses to direct drilling
Kinsella, J. 1995. The effects of various tillage systems on soil compac-at Lockart, NSW. Aust. J. Soil Res. 24:377–391.tion. p. 15–17. In Farming for a better environment. Soil and WaterBusscher, W.J., P.J. Bauer, C.R. Camp, and R.E. Sojka. 1997. Correc-Conserv. Soc., Ankeny, IA.tion of cone index for soil water content differences in a coastal
Klepper, B. 1990. Root growth and water uptake. p. 281–322. In B.A.plain soil. Soil Tillage Res. 43:205–217.Stewart and D.R. Nielsen (ed.) Irrigation of agricultural crops.Campbell, D.J., and J.K. Henshall. 1991. Bulk density. p. 329–366. InAgron. Monogr. 30. ASA, CSSA, and SSSA, Madison, WI.K.A. Smith and C.E. Mullins (ed.) Soil analysis. Physical methods.
Lampurlanes, J., P. Angas, and C. Cantero-Martınez. 2001. RootMarcel Dekker, New York.growth, soil water content, and yield of barley under differentCampbell, D.J., and M.F. O’Sullivan. 1991. The cone penetrometertillage systems on two soils in semiarid conditions. Field Cropsin relation to trafficability, compaction, and tillage. p. 399–430. InRes. 69:27–40.K.A. Smith and C.E. Mullins (ed.) Soil analysis. Physical methods.
Lampurlanes, J., P. Angas, and C. Cantero-Martınez. 2002. TillageMarcel Dekker, New York.effect on water storage efficiency during fallow, and soil waterCampbell, G.S., and D.J. Mulla. 1990. Measurement of soil watercontent, root growth and yield of the following barley crop on twocontent and potential. p. 127–141. In B.A. Stewart and D.R. Nielsendifferent soils in semiarid conditions. Soil Tillage Res. 65:207–220.(ed.) Irrigation of agricultural crops. Agron. Monogr. 30. ASA,
Littell, R.C., R.F. Freund, and P.C. Spector. 1991. SAS system forCSSA, and SSSA, Madison, WI.linear models. SAS Inst., Cary, NC.Carter, M.R., and B.C. Ball. 1993. Soil porosity. p. 581–588. In M.R.
Logsdon, S.D., and C.A. Cambardella. 2000. Temporal changes inCarter (ed.) Soil sampling methods of soil analysis. Lewis Publ.,small depth-incremental soil bulk density. Soil Sci. Soc. Am. J.Boca Raton, FL.64:710–714.Cassel, D.K. 1982. Tillage effects on soil bulk density and mechanical
Logsdon, S.D., T.C. Kaspar, and C.A. Cambardella. 1999. Depth-impedance. p. 45–67. In P.W. Unger and D.M. Van Doren (ed.)incremental soil properties under no-till or chisel management.Predicting tillage effects on soil physical properties and processes.Soil Sci. Soc. Am. J. 63:197–200.ASA Spec. Publ. 44. ASA and SSSA, Madison, WI.
Lopez, M.V., J.L. Arrue, and V. Sanchez-Giron. 1996. A comparisonChen, Y., S. Tessier, and J. Rouffignat. 1998. Soil bulk density estima-between seasonal changes in soil water storage and penetrationtion for tillage systems and soil textures. Trans. ASAE. 41:1601–resistance under conventional and conservation tillage systems in1610.
Crovetto, C.C. 1998. No-till development in Chequen farm and its Aragon. Soil Tillage Res. 37:251–271.

536 AGRONOMY JOURNAL, VOL. 95, MAY–JUNE 2003
McCalla, T.M., and T.J. Army. 1961. Stubble mulch farming. Adv. dale, and D.D. Tyler. 1993. Chemical and physical characteristicsof four soil types under conventional and no-tillage systems. SoilAgron. 13:125–196.
McDonald, G.K., and R.A. Fischer. 1991. Soil management to main- Tillage Res. 28:51–61.Steel, R.G.D., and J.H. Torrie. 1980. Principles and procedures oftain crop production in semi-arid environments. p. 421–440. In
E. Acevedo, E. Fereres, C. Gimenez, and J.P. Srivastava (ed.) statistics. A biometrical approach. McGraw-Hill, New York.Stelluti, M., M. Maiorana, and D. De Giorgio. 1998. MultivariateImprovement and management of winter cereals under tempera-
ture, drought, and salinity stresses. Proc. ICARDA-INIA Symp., approach to evaluate the penetrometer resistance in different till-age systems. Soil Tillage Res. 46:145–151.Cordoba, Spain. 26–29 Oct. 1987. MAPA-INIA, Madrid, Spain.
Moran, C.J., A.J. Koppi, B.W. Murphy, and A.B. McBratney. 1988. Taboada, M.A., F.G. Micucci, D.J. Cosentino, and R.S. Lavado. 1998.Comparison of compaction induced by conventional an zero tillageComparison of the macropore structure of a sandy loam surface
soil horizon subjected to two tillage treatments. Soil Use Man- in two soils of the Rolling Pampa of Argentina. Soil Tillage Res.49:57–63.age. 4:96–102.
Newman, E.I. 1966. A method of estimating the total length of root Taylor, H.M. 1983. Managing root systems for efficient water use: Anoverview. p. 87–113. In H.M. Taylor, W.R. Jordan, and T.R. Sinclairin a sample. J. Appl. Ecol. 3:139–145.
Pabin, J., J. Lipiec, S. Wlodek, A. Biskupski, and A. Kaus. 1998. (ed.) Limitations to efficient water use in crop production. ASA,CSSA, and SSSA, Madison, WI.Critical soil bulk density and strength for pea seedling root growth
as related to other soil factors. Soil Tillage Res. 46:203–208. Tebrugge, F., and R.A. During. 1999. Reducing tillage intensity—areview of results from a long-term study in Germany. Soil TillagePearcy, R.W., J.R. Ehleringer, H.A. Mooney, and P.W. Rundel. 1989.
Plant physiological ecology. Field methods and instrumentation. Res. 53:15–28.Unger, P.W. 1991. Overwinter changes in physical properties of no-Chapman & Hall, London.
Pelegrin, F., F. Moreno, J. Martin-Aranda, and M. Camps. 1988. tillage soil. Soil Sci. Soc. Am. J. 55:778–782.Unger, P.W., and O.R. Jones. 1998. Long-term tillage and croppingThe influence of tillage methods on soil-water conservation in SW
Spain. p. 803–808. In Tillage and traffic in crop production. Proc. systems affect bulk density and penetration resistance of soilcropped to dryland wheat and grain sorghum. Soil Tillage Res.Int. Conf. Int. Soil Tillage Res. Organ., 11th, Edinburgh, Scotland.
11–15 July 1988. ISTRO, Edinburgh, Scotland. 45:39–57.Villar, J.M. 1989. Evapotranspiracion y productividad del agua enPelegrin, F., F. Moreno, J. Martin-Aranda, and M. Camps. 1990. The
influence of tillage methods on soil physical properties and water cebada (Hordeum vulgare L.) y triticale (� Triticosecale Wittmart)en condiciones de secano en la Segarra (Lleida). UPC, ETSEAL,balance for a typical crop rotation in SW Spain. Soil Tillage Res.
16:345–358. Lleida, Spain.Wander, M.M., and G.A. Bollero. 1999. Soil quality assessment ofPikul, J.L., and J.K. Asae. 1995. Infiltration and soil properties as
affected by annual cropping in the northern Great Plains. Agron. tillage impacts in Illinois. Soil Sci. Soc. Am. J. 63:961–971.Ward, K.J., B. Klepper, R.W. Richman, and R.R. Allmaras. 1978.J. 87:656–662.
Radcliffe, D.E., E.W. Tollner, W.L. Hargrove, R.L. Clark, and M.H. Quantitative estimation of living wheat-root lengths in soil cores.Agron. J. 70:675–677.Golabi. 1988. Effect of tillage practices on infiltration and soil
strength of a Typic Hapludult soil after ten years. Soil Sci. Soc. Yasin, M., R.D. Grisso, L.L. Bashford, A.J. Jones, and L.N. Mielke.1993. Normalizing cone resistance values by covariance analysis.Am. J. 52:798–804.
Rhoton, F.E., R.R. Bruce, N.W. Buehring, G.B. Elkins, C.W. Lang- Trans. ASAE 36:1267–1270.