Socioeconomic inequalities in lung cancer mortality in 16 European populations
9
Lung Cancer 63 (2009) 322–330 Contents lists available at ScienceDirect Lung Cancer journal homepage: www.elsevier.com/locate/lungcan Socioeconomic inequalities in lung cancer mortality in 16 European populations J.H.A. Van der Heyden a,∗,1 , M.M. Schaap b,1 , A.E. Kunst b,1 , S. Esnaola c,1 , C. Borrell d,e,f,1 , B. Cox a,1 , M. Leinsalu g,h,1 , I. Stirbu b,1 , R. Kalediene i,1 , P. Deboosere j,1 , J.P. Mackenbach b,1 , H. Van Oyen a,1 a Scientific Institute of Public Health, Belgium b Department of Public Health, Erasmus MC, Rotterdam, Netherlands c Department of Health of the Basque Country, Spain d Agència de Salut Pública de Barcelona, Spain e Universitat Pompeu Fabra, Barcelona, Spain f CIBER de Epidemiología y Salud Pública (CIBERESP), Spain g Stockholm Centre on Health of Societies in Transition at Södertörn University College, Huddinge, Sweden h Department of Epidemiology and Biostatistics at the National Institute for Health Development, Tallinn, Estonia i Faculty of Public Health Kaunas University of Medicine, Lithuania j Interface Demography, Vrije Universiteit Brussel, Belgium article info Article history: Received 28 February 2008 Received in revised form 2 June 2008 Accepted 7 June 2008 Keywords: Lung cancer Mortality Socioeconomic Education Europe Inequalities Smoking abstract Objectives: This paper aims to describe socioeconomic inequalities in lung cancer mortality in Europe and to get further insight into socioeconomic inequalities in lung cancer mortality in different European populations by relating these to socioeconomic inequalities in overall mortality and smoking within the same or reference populations. Particular attention is paid to inequalities in Eastern European and Baltic countries. Methods: Data were obtained from mortality registers, population censuses and health interview surveys in 16 European populations. Educational inequalities in lung cancer and total mortality were assessed by direct standardization and calculation of two indices of inequality: the Relative Index of Inequality (RII) and the Slope Index of Inequality (SII). SIIs were used to calculate the contribution of inequalities in lung cancer mortality to inequalities in total mortality. Indices of inequality in lung cancer mortality in the age group 40–59 years were compared with indices of inequalities in smoking taking into account a time lag of 20 years. Results: The pattern of inequalities in Eastern European and Baltic countries is more or less similar as the one observed in the Northern countries. Among men educational inequalities are largest in the Eastern European and Baltic countries. Among women they are largest in Northern European countries. Whereas among Southern European women lung cancer mortality rates are still higher among the high educated, we observe a negative association between smoking and education among young female adults. The con- tribution of lung cancer mortality inequalities to total mortality inequalities is in most male populations more than 10%. Important smoking inequalities are observed among young adults in all populations. In Sweden, Hungary and the Czech Republic smoking inequalities among young adult women are larger than lung cancer mortality inequalities among women aged 20 years older. Conclusions: Important socioeconomic inequalities exist in lung cancer mortality in Europe. They are consistent with the geographical spread of the smoking epidemic. In the next decades socioeconomic inequalities in lung cancer mortality are likely to persist and even increase among women. In South- ern European countries we may expect a reversal from a positive to a negative association between socioeconomic status and lung cancer mortality. Continuous efforts are necessary to tackle socioeconomic inequalities in lung cancer mortality in all European countries. © 2008 Elsevier Ireland Ltd. All rights reserved. ∗ Corresponding author at: Scientific Institute of Public Health, Unit of Epidemiology, 14 Juliette Wytsmanstraat, B-1050 Brussels, Belgium. Tel.: +32 2 6425726; fax: +32 2 6425410. E-mail address: [email protected] (J.H.A. Van der Heyden). 1 For the Eurothine consortium. 0169-5002/$ – see front matter © 2008 Elsevier Ireland Ltd. All rights reserved. doi:10.1016/j.lungcan.2008.06.006
Transcript of Socioeconomic inequalities in lung cancer mortality in 16 European populations
Lung Cancer 63 (2009) 322–330
Contents lists available at ScienceDirect
Lung Cancer
journa l homepage: www.e lsev ier .com/ locate / lungcan
Socioeconomic inequalities in lung cancer mortality in16 European populations
J.H.A. Van der Heydena,∗,1, M.M. Schaapb,1, A.E. Kunstb,1, S. Esnaolac,1, C. Borrelld,e,f,1,B. Coxa,1, M. Leinsalug,h,1, I. Stirbub,1, R. Kalediene i,1, P. Deboosere j,1,J.P. Mackenbachb,1, H. Van Oyena,1
a Scientific Institute of Public Health, Belgiumb Department of Public Health, Erasmus MC, Rotterdam, Netherlandsc Department of Health of the Basque Country, Spaind Agència de Salut Pública de Barcelona, Spaine Universitat Pompeu Fabra, Barcelona, Spainf CIBER de Epidemiología y Salud Pública (CIBERESP), Spaing Stockholm Centre on Health of Societies in Transition at Södertörn University College, Huddinge, Swedenh Department of Epidemiology and Biostatistics at the National Institute for Health Development, Tallinn, Estoniai Faculty of Public Health Kaunas University of Medicine, Lithuaniaj Interface Demography, Vrije Universiteit Brussel, Belgium
a r t i c l e i n f o
Article history:Received 28 February 2008Received in revised form 2 June 2008Accepted 7 June 2008
Keywords:Lung cancerMortalitySocioeconomicEducationEuropeInequalitiesSmoking
a b s t r a c t
Objectives: This paper aims to describe socioeconomic inequalities in lung cancer mortality in Europeand to get further insight into socioeconomic inequalities in lung cancer mortality in different Europeanpopulations by relating these to socioeconomic inequalities in overall mortality and smoking within thesame or reference populations. Particular attention is paid to inequalities in Eastern European and Balticcountries.Methods: Data were obtained from mortality registers, population censuses and health interview surveysin 16 European populations. Educational inequalities in lung cancer and total mortality were assessed bydirect standardization and calculation of two indices of inequality: the Relative Index of Inequality (RII)and the Slope Index of Inequality (SII). SIIs were used to calculate the contribution of inequalities in lungcancer mortality to inequalities in total mortality. Indices of inequality in lung cancer mortality in the agegroup 40–59 years were compared with indices of inequalities in smoking taking into account a time lagof 20 years.Results: The pattern of inequalities in Eastern European and Baltic countries is more or less similar as theone observed in the Northern countries. Among men educational inequalities are largest in the EasternEuropean and Baltic countries. Among women they are largest in Northern European countries. Whereasamong Southern European women lung cancer mortality rates are still higher among the high educated,we observe a negative association between smoking and education among young female adults. The con-tribution of lung cancer mortality inequalities to total mortality inequalities is in most male populationsmore than 10%. Important smoking inequalities are observed among young adults in all populations. InSweden, Hungary and the Czech Republic smoking inequalities among young adult women are larger thanlung cancer mortality inequalities among women aged 20 years older.Conclusions: Important socioeconomic inequalities exist in lung cancer mortality in Europe. They areconsistent with the geographical spread of the smoking epidemic. In the next decades socioeconomicinequalities in lung cancer mortality are likely to persist and even increase among women. In South-
ern European countries we may expect a reversal from a positive to a negative association betweensocioeconomic status and lung cancer mortality. Continuous efforts are necessary to tackle socioeconomicinequalities in lung cancer mortality in all European countries.© 2008 Elsevier Ireland Ltd. All rights reserved.
∗ Corresponding author at: Scientific Institute of Public Health, Unit of Epidemiology, 14 Juliette Wytsmanstraat, B-1050 Brussels, Belgium. Tel.: +32 2 6425726;fax: +32 2 6425410.
E-mail address: [email protected] (J.H.A. Van der Heyden).1 For the Eurothine consortium.
0169-5002/$ – see front matter © 2008 Elsevier Ireland Ltd. All rights reserved.doi:10.1016/j.lungcan.2008.06.006
/ Lung
1
ccicT
acae[acvc1[minp
rt
eirntBsptntalt
nescEpicps
acstgirpcmc
iahrtmsos
pnniie
2
2
n4ddaTdmuwa3ptlMaEd
catlt7
iCwotiIcation: ISCED 3 + 4; tertiary education: ISCED 5 + 6). Even thoughseparate information for ISCED 1 and ISCED 2 level was available formost countries, these categories were taken together, as the distinc-
J.H.A. Van der Heyden et al.
. Introduction
Lung cancer in Europe is still the most common cancer relatedause of death with an estimated 334,800 deaths (19.7% from totalancer mortality) in 2006 [1]. Even though lung cancer mortalityn men has been declining since the late 1980s, female lung can-er mortality is still increasing in many European countries [2,3].rends also show important country variations [4].
Some studies have assessed socioeconomic inequalities in over-ll mortality and cause-specific mortality in a range of Europeanountries [5,6]. The relationship between lung cancer mortalitynd socioeconomic status has also been investigated in sev-ral individual countries, both in Europe [7–9] and elsewhere10,11]. In most countries a low education was found to ben independent risk factor for lung cancer and/or lung can-er mortality. One study conducted a systematic analysis ofariations between countries in the size and pattern of socioe-onomic inequalities in lung cancer mortality, using data from0 European populations, collected in the first half of the 1990s12]. The study demonstrated consistently higher lung cancer
ortality rates among the “lower” educated men and womenn Northern and Western Europe and an inverse or less pro-ounced socioeconomic gradient in some Southern Europeanopulations.
As lung cancer continues to be an unabated pandemic, furtheresearch of inequalities in lung cancer mortality remains an impor-ant issue.
Even though previous cross-European studies have put intovidence an important north–south gradient in socioeconomicnequalities both in lung cancer mortality and smoking [12,13], andelated this to the theory of the smoking epidemic [14], there iseed to focus further on regional differences in lung cancer mor-ality inequalities in Europe by including also Eastern European andaltic countries. One particular point of interest is to find out if themoking epidemic in Eastern European countries spreads throughopulations in a similar way as is the case in other European coun-ries. As studies on socioeconomic inequalities in smoking haveow been published for over two decades and recommendationso tackle inequalities in smoking have been suggested [15], there islso need to verify if there are any indications that inequalities inung cancer mortality in Europe will in the future decrease, or onhe contrary, will continue to persist.
In this paper we present new European results on socioeco-omic inequalities in lung cancer mortality, based on recent andxtensive datasets, collected in 16 European populations. Morepecifically the objectives of the paper are: (1) to describe socioe-onomic inequalities in lung cancer mortality in a wide range ofuropean population groups, including Eastern and Central Euro-ean countries; (2) to assess the contribution of lung cancer to
nequalities in total mortality; (3) to get further insight into socioe-onomic inequalities in lung cancer mortality in different Europeanopulations by relating these to socioeconomic inequalities inmoking practices within the same or reference populations.
Cigarette smoking is indeed the major cause of lung cancer,nd most lung cancers have historically occurred among currentigarette smokers or recent quitters. As population patterns inmoking prevalence will continue to be the most powerful predic-or of the future occurrence of lung cancer [16], smoking data couldive clues about the future evolution of socioeconomic inequalitiesn lung cancer mortality. In some birth cohorts also other envi-
onmental and occupational factors may have contributed to theresent international patterns of socioeconomic differences in lungancer mortality. In such case the relation between lung cancerortality inequalities and former smoking inequalities may be lesslear-cut.
t
Cancer 63 (2009) 322–330 323
Knowledge on the contribution of lung cancer to inequalitiesn total mortality is important to identify populations in which
reduction of the inequalities in lung cancer mortality will alsoave a substantial impact on inequalities in total mortality. Previousesearch has shown that the contribution of lung cancer mortalityo the difference between manual and non-manual classes in total
ortality varies substantially from one country to another [17]. Thistudy allowed us to investigate the impact of lung cancer mortalityn the overall socioeconomic inequalities in mortality with anotherocioeconomic measure and in a larger number of countries.
The study was conducted in the framework of the EUROTHINEroject2 that aimed to help policy-makers at the European andational level to develop rational strategies for tackling socioeco-omic inequalities in health. Global results of this project, based on
nternational comparisons of socioeconomic inequalities in mortal-ty and morbidity in many European countries, have been presentedlsewhere [18].
. Methods
.1. Data
Data on lung cancer mortality, total mortality and socioeco-omic status were available for 16 countries or regions, includingEastern European and 2 Baltic countries. Table 1 describes the
ata sources and some characteristics of the data collection. Mostata sources were situated at the national level, but also regionalnd big urban populations (Basque Country, Barcelona, Madrid,urin) were included. The majority of networks provided longitu-inal data. In Barcelona a record linkage was done between theortality register and the census data [19]. A similar approach was
sed in Madrid and the Basque country. In those populations itas not possible to achieve a 100% linkage between the population
nd death registries. In Madrid, this was particularly a problem: ca.0% of mortality records could not be linked. No variation in thisercentage was found according to age, sex, or socioeconomic posi-ion, therefore, estimates of relative inequalities in mortality are notikely to be biased to an important extent. Absolute estimates for
adrid were corrected by using weighted numbers of death withweighting factor equaling 1/0.7 = 1.428571. In the Czech Republic,stonia, Hungary, Lithuania and Poland unlinked cross-sectionalata were used.
In order to compare results on mortality from longitudinal andross-sectional datasets for similar age groups we grouped the dataccording to the average age of death, also for countries with longi-udinal data sets, even if in the latter case it would have been moreogical to do this based on age cohorts. The analyses were restrictedo age groups with an average age at death between 40 and9 years.
The cause specific mortality that was considered was mortal-ty due to cancer of trachea, bronchus and lung (ICD 10 codes33–C34; C39–ICD 9 codes 162–163; 165). Socioeconomic statusas assessed through educational level. The national categoriesf educational level were harmonized on the basis of the Interna-ional Standard Classification of Education (ISCED) and regroupedn three categories (no, primary and lower secondary education:SCED 1 + 2; upper secondary and post-secondary non-tertiary edu-
ion between these two groups is not the same for many countries
2 http://www.eurothine.org.

324 J.H.A. Van der Heyden et al. / Lung Cancer 63 (2009) 322–330
Table 1Data sources in the populations understudy
Population Type of mortality data Follow-up period Person years at risk Data sources used for comparison withsocioeconomic inequalities on smoking
Year(s) of survey(s) Sample size
NorthFinland Longitudinal 1990–2000 27,550,171 Finbalt Health Monitor 94/98/00/02/04 20,371Sweden Longitudinal 1991–2000 48,340,986 Swedish Survey of Living Conditions 00/01 11,484Norway Longitudinal 1990–2000 22,262,277 Norwegian Survey of Living Conditions 02 6,820Denmark Longitudinal 1996–2000 15,354,602 Danish Health and Morbidity Survey 00 16,690
ContinentalBelgium Longitudinal 1991–1995 27,635,206 Health Interview Survey 97/01 18,481Switzerland Longitudinal 1990–2000 30,728,441 Not available –South Turin Longitudinal 1991–2001 5,287,281 Health and health care utilization
survey Italy99/00 118,245
Basque Country Longitudinal 1996–2001 6,457,258 Basque Health Interview Survey 97/02 12,443Barcelona Longitudinal 1992–2001 8,915,780 Health Interview Survey Barcelona 00 10,045Madrid Longitudinal 1996–1997 4,664,793 National Health Survey 01 20,748
EastSlovenia Longitudinal 1991–2000 10,325,538 Not availableHungary CS unlinked 1999–2002 24,953,908 National Health Interview Survey 00/03 10,532Czech Rep. CS unlinked 1999–2003 30,308,765 Sample Survey of the Health Status of
the Czech Pop.02 2,476
Poland CS unlinked 2001–2003 65,844,117 Not available –
BalticLithuania CS unlinked 2000–2002 6,189,927 Finbalt Health Monitor 94/98/00/02/04 11,647
asop
vTu
o
2
idl
TD
N
C
S
E
B
(
Estonia CS unlinked 1998–2002 4,141,440
nd may be especially problematic in the unlinked cross-sectionaltudies because of the numerator/denominator bias. Informationn the educational distribution in the populations, including theercentage of missing data is provided in Table 2.
For 11 populations, including 4 Eastern European countries, sur-ey data were available with information on smoking status. For
urin and Madrid no health interview data were available but wesed national health interview surveys from Italy and Spain instead.As indicators for smoking were used ‘being a current regular orccasional smoker’ and ‘having ever smoked.’
s4
(
able 2istribution of populations by level of educationa
Mortality data
% low % middle % high % mis
orthFinland 51.0 28.7 20.3 0.0Sweden 36.1 37.9 16.2 9.8Norway 34.0 45.7 18.0 2.3Denmark 49.8 31.9 18.3 0.0
ontinentalBelgium 61.3 18.7 14.1 6.0Switzerland 32.1 52.8 14.6 0.6
outhTurin/Italy 72.8 18.9 8.3 0.0Basque C. 69.8 16.0 12.7 1.5Madrid/Spain 64.6 16.5 15.6 3.3Barcelona 70.1 13.9 15.3 0.7
astSlovenia 47.5 40.7 10.4 1.3Hungary 64.3 23.3 12.4 0.0Czech Rep. 62.8 26.7 10.5 0.0Poland 55.8 31.2 11.0 2.0
alticLithuania 30.6 52.8 16.1 0.5Estonia 29.4 51.6 16.6 2.3
a Three levels are distinguished: low = no, primary and lower secondary education (ISISCED 3 + 4); high = tertiary education (ISCED 5 + 6).
Health Behaviour among Estonian AdultPopulation
02/04 4,376
.2. Analysis
In the first step we calculated for each population age standard-zed lung cancer mortality rates by level of education. This wasone by direct standardization using the European standard popu-
ation as reference. Standardized rates were calculated stratified by
ex for the complete age group under study and for 4 subgroups:0–49 years, 50–59 years, 60–69 years and 70–79 years.In the second step we computed the Relative Index of InequalityRII) for lung cancer mortality, which is a regression-based measure
Survey data
sing % low % average % high % missing
23.4 56.3 18.8 1.626.4 46.2 27.3 0.117.0 54.9 25.2 2.925.8 53.6 18.4 2.2
39.5 28.9 28.0 3.6
63.5 30.1 6.4 0.053.0 25.0 22.0 0.166.9 19.7 13.2 0.253.0 25.0 22.0 0.1
57.4 28.9 13.4 0.356.6 31.1 12.4 0.0
39.9 40.5 18.2 1.447.6 34.3 17.5 0.6
CED 1 + 2); middle = upper secondary and post-secondary non-tertiary education

/ Lung
taTdneblosdRt
a
ob
i2tc
vm
tdhtrnem
tamtm
3
tpgt
lAidEeB
arwttp
ecrtgcb
agudacu
mR
icitlttnaf
mcyo4
aww
tbc2
c(
4
4
itmact
J.H.A. Van der Heyden et al.
hat looks at the systematic association between mortality and rel-tive socioeconomic position across all educational groups [20,21].his index is calculated as the ratio of the mortality of the mostisadvantaged (x = 0) to the most advantaged (x = 1). It should beoted that the values x = 0 and 1 do not correspond to the low-st and highest categories but to the extremes of these categories,ased on a rank measure of education, where the rank is calcu-
ated as the mean proportion of the population having a higher levelf education. They thus represent extreme, possibly hypothetical,ubgroups [22]. If the index is 2 then the mortality rate of the mostisadvantaged is 2 times as high as that of the most advantaged. AnII of 1 indicates that there is no inequality. An RII below 1 indicateshat a higher mortality is found among the most advantaged.
Age standardized and gender specific RIIs were computed for allges (40–79 years) together and for the four age groups separately.
RIIs for smoking calculated as prevalence rate ratios werebtained from a regression using a log-link function and assuminginominal distribution of the smoking variable.
For each population we compared RIIs for lung cancer mortalityn the age group 40–59 years with RIIs for smoking in the age group0–39 years. Assuming a time lag of 20 years it was estimated thathe latter would give an indication on future inequalities of lungancer mortality.
The RIIs were calculated with the GENMOD procedure of SAS9.1 applying age adjusted Poisson models in case of lung cancerortality and binomial models in case of smoking.Both for total mortality and lung cancer mortality we computed
he Slope Index of Inequality (SII), which measures the absolute rateifference between the lower and the higher end of the educationalierarchy. As the SII is a measure of absolute inequalities it is sensi-ive to the average level of health in the population. If the mortalityate is low, the SII will be low as well, even if the RII is substantial. Aegative SII corresponds with a higher mortality among the higherducated. The SII permits a decomposition of inequalities in totalortality into inequalities in cause specific mortality.The SII for total and lung cancer mortality can be estimated with
he formula SII = 2MR(RII − 1)/(RII + 1) [23] where MR is the agedjusted overall mortality rate. By dividing the SII for lung cancerortality by the SII for total mortality we obtained the contribu-
ion of inequalities in lung cancer mortality to inequalities in totalortality.
. Results
In the 16 studied populations the age adjusted lung cancer mor-ality rates in the age group 40–79 years ranged from 65.8/100,000erson years in Sweden to 252.4/100,000 person years in Hun-ary among men, and from 11.9/100,000 person years in Madrido 76.4/100,000 person years in Denmark among women.
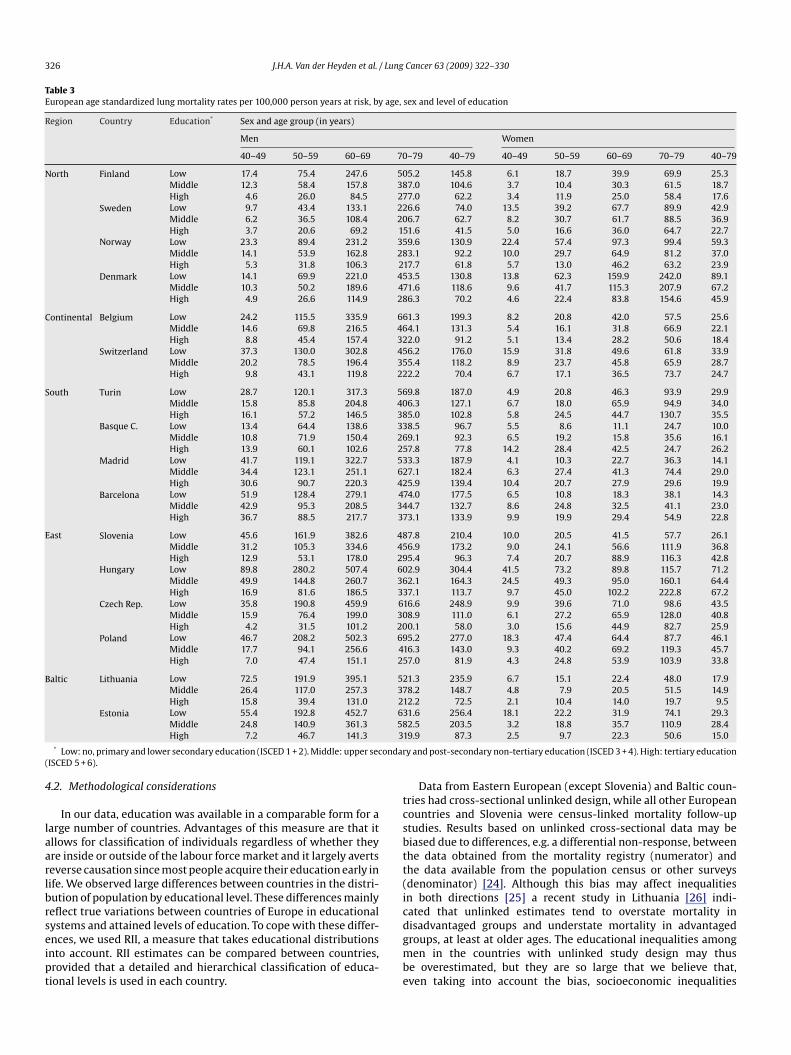
Table 3 presents age adjusted lung cancer mortality rates byevel of education for men and women in different age groups.mong men we observed a sharp increase in lung cancer mortal-
ty with a decreasing educational level. The largest socioeconomicifferences were found in the younger age groups. In the Southernuropean populations the socioeconomic gradient was smaller orven absent, e.g. in the age group between 40 and 49 years in theasque Country.
Among women gradients in lung cancer mortality rates asfunction of educational attainment varied more between the
egions. In the Northern European and Continental populationse observed in all age groups a similar pattern as among men:
he lower the educational level, the higher the lung cancer mor-ality rate and this for all age groups. In the Southern Europeanopulations higher mortality rates were found among the high-
Ntwmi
Cancer 63 (2009) 322–330 325
st educated. The pattern among women in the Eastern Europeanountries was remarkable: while we observed higher mortalityates among the low educated in the youngest age group, this rela-ionship gradually inversed with increasing age. In the highest ageroup higher mortality rates were observed in the highest edu-ated group. This phenomenon was most pronounced in Hungary,ut also observed in Poland and Slovenia.
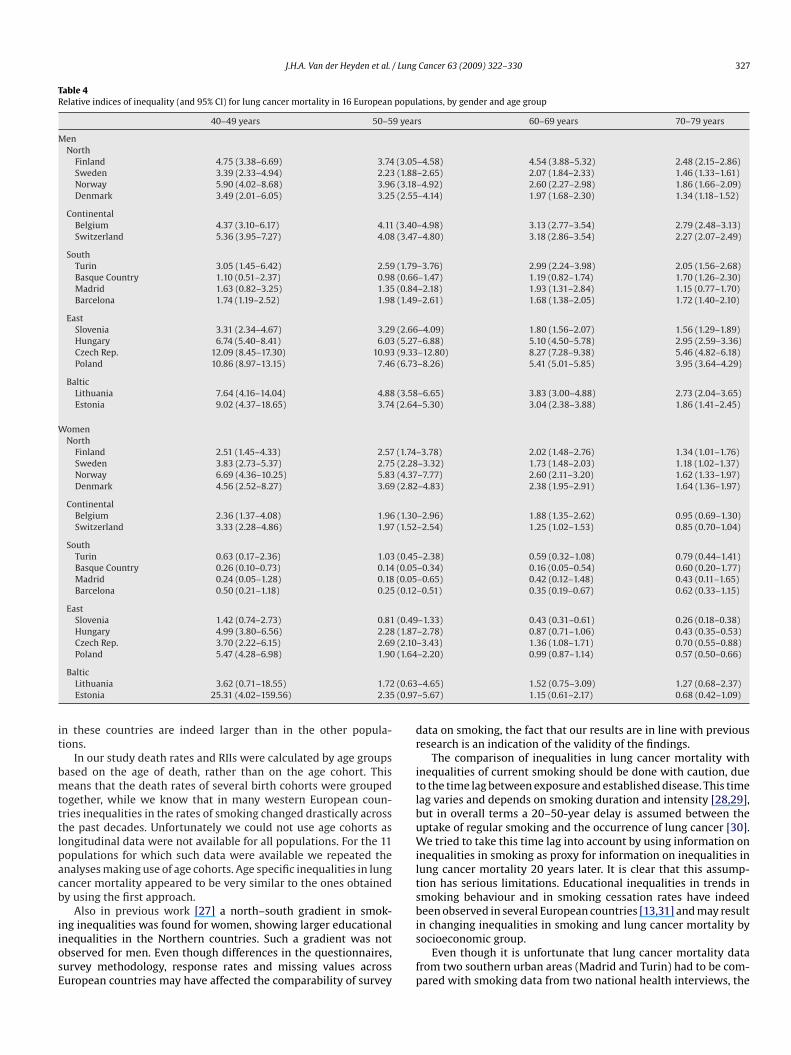
The observed patterns are confirmed in Table 4 in which RIIsnd 95% confidence intervals are presented by country, sex and ageroup. In all populations, except in the Southern European pop-lations RIIs among men were all significantly higher than 1 andecreased with increasing age. Large inequalities were observedmong men aged 40–59 years in Eastern European and Balticountries. Among the male population in Southern European pop-lations’ inequalities were small or non-existent in all age groups.
Inequalities among women were generally smaller than amongen in all age groups. In the Southern European populations most
IIs were significantly lower than 1.The contribution of lung cancer mortality to the total mortality
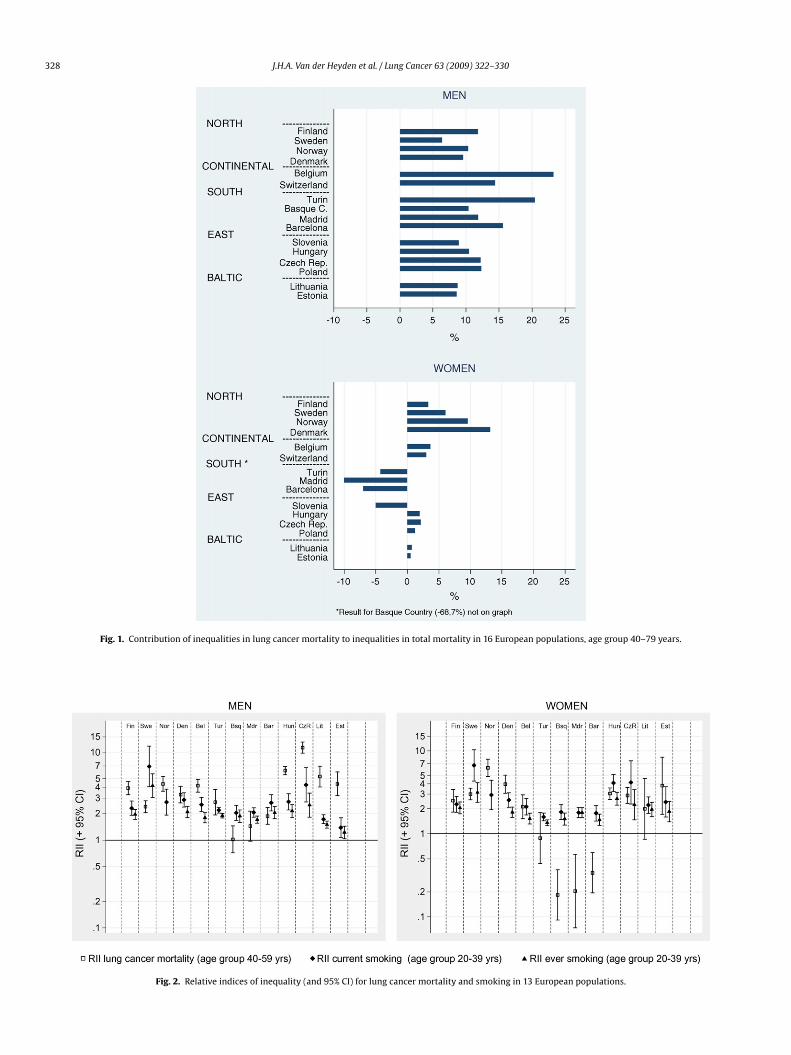
n the population 40–79 years is presented in Fig. 1. Among men theontribution of inequalities in lung cancer mortality to inequalitiesn total mortality was largest in Belgium and Turin. Among womenhis percentage was largest in Denmark and Norway. Only in theatter populations lung cancer mortality contributed substantiallyo the inequalities in total mortality. In the other female populationshe contribution of lung cancer mortality was marginal, or evenegative, indicating that lung cancer mortality rates were highermong the high educated, while an inverse relationship was foundor total mortality.
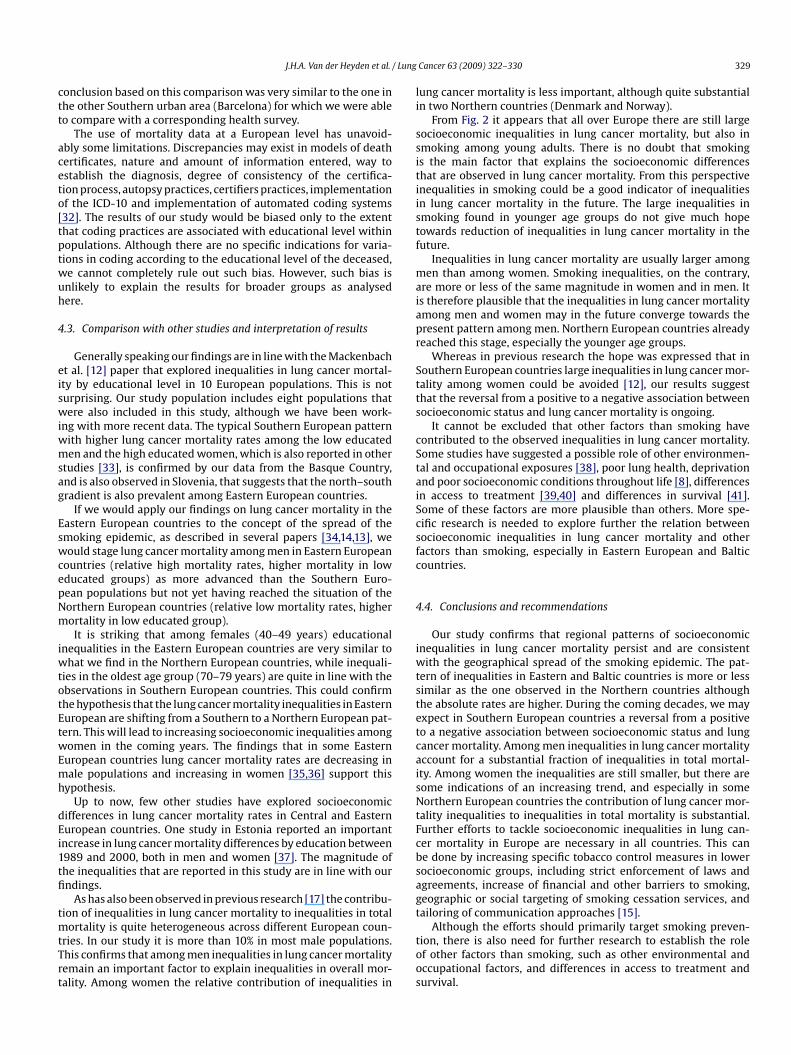
In Fig. 2 we present for each population RIIs for lung cancerortality for persons between 40 and 59 years in relation to RIIs for
urrent smoking and ever smoking for persons between 20 and 39ears. The assumption is made that the latter gives us an indicationf possible lung cancer mortality inequalities among persons aged0–59 years within 20 years.
It is striking that in some countries, like Sweden, Hungarynd the Czech Republic smoking inequalities among young adultomen were larger than lung cancer mortality inequalities amongomen aged 20 years older.
In the Southern European populations the positive associa-ion between education and lung cancer mortality among womenetween 40 and 59 years contrasts strongly with the negative asso-iation between education and smoking among women between0 and 39 years.
RIIs for ever smokers were usually smaller than the ones forurrent smokers, but the geographical pattern was quite similarFig. 2).
. Discussion
.1. Summary of findings
Our study indicates that there are still important socioeconomicnequalities in lung cancer mortality in Europe. Some regional pat-erns can be distinguished. Large socioeconomic inequalities, with
uch higher lung cancer mortality rates among the low educated,re observed in the male populations of some Eastern Europeanountries, like the Czech Republic and Hungary. Among womenhe largest inequalities in lung cancer mortality are observed in the
orthern populations. In most populations there are still impor-ant educational inequalities in smoking, both among men andomen. In the Southern populations inequalities in lung cancerortality and smoking are much smaller or (among women) even
nverse.
326 J.H.A. Van der Heyden et al. / Lung Cancer 63 (2009) 322–330
Table 3European age standardized lung mortality rates per 100,000 person years at risk, by age, sex and level of education
Region Country Education* Sex and age group (in years)
Men Women
40–49 50–59 60–69 70–79 40–79 40–49 50–59 60–69 70–79 40–79
North Finland Low 17.4 75.4 247.6 505.2 145.8 6.1 18.7 39.9 69.9 25.3Middle 12.3 58.4 157.8 387.0 104.6 3.7 10.4 30.3 61.5 18.7High 4.6 26.0 84.5 277.0 62.2 3.4 11.9 25.0 58.4 17.6
Sweden Low 9.7 43.4 133.1 226.6 74.0 13.5 39.2 67.7 89.9 42.9Middle 6.2 36.5 108.4 206.7 62.7 8.2 30.7 61.7 88.5 36.9High 3.7 20.6 69.2 151.6 41.5 5.0 16.6 36.0 64.7 22.7
Norway Low 23.3 89.4 231.2 359.6 130.9 22.4 57.4 97.3 99.4 59.3Middle 14.1 53.9 162.8 283.1 92.2 10.0 29.7 64.9 81.2 37.0High 5.3 31.8 106.3 217.7 61.8 5.7 13.0 46.2 63.2 23.9
Denmark Low 14.1 69.9 221.0 453.5 130.8 13.8 62.3 159.9 242.0 89.1Middle 10.3 50.2 189.6 471.6 118.6 9.6 41.7 115.3 207.9 67.2High 4.9 26.6 114.9 286.3 70.2 4.6 22.4 83.8 154.6 45.9
Continental Belgium Low 24.2 115.5 335.9 661.3 199.3 8.2 20.8 42.0 57.5 25.6Middle 14.6 69.8 216.5 464.1 131.3 5.4 16.1 31.8 66.9 22.1High 8.8 45.4 157.4 322.0 91.2 5.1 13.4 28.2 50.6 18.4
Switzerland Low 37.3 130.0 302.8 456.2 176.0 15.9 31.8 49.6 61.8 33.9Middle 20.2 78.5 196.4 355.4 118.2 8.9 23.7 45.8 65.9 28.7High 9.8 43.1 119.8 222.2 70.4 6.7 17.1 36.5 73.7 24.7
South Turin Low 28.7 120.1 317.3 569.8 187.0 4.9 20.8 46.3 93.9 29.9Middle 15.8 85.8 204.8 406.3 127.1 6.7 18.0 65.9 94.9 34.0High 16.1 57.2 146.5 385.0 102.8 5.8 24.5 44.7 130.7 35.5
Basque C. Low 13.4 64.4 138.6 338.5 96.7 5.5 8.6 11.1 24.7 10.0Middle 10.8 71.9 150.4 269.1 92.3 6.5 19.2 15.8 35.6 16.1High 13.9 60.1 102.6 257.8 77.8 14.2 28.4 42.5 24.7 26.2
Madrid Low 41.7 119.1 322.7 533.3 187.9 4.1 10.3 22.7 36.3 14.1Middle 34.4 123.1 251.1 627.1 182.4 6.3 27.4 41.3 74.4 29.0High 30.6 90.7 220.3 425.9 139.4 10.4 20.7 27.9 29.6 19.9
Barcelona Low 51.9 128.4 279.1 474.0 177.5 6.5 10.8 18.3 38.1 14.3Middle 42.9 95.3 208.5 344.7 132.7 8.6 24.8 32.5 41.1 23.0High 36.7 88.5 217.7 373.1 133.9 9.9 19.9 29.4 54.9 22.8
East Slovenia Low 45.6 161.9 382.6 487.8 210.4 10.0 20.5 41.5 57.7 26.1Middle 31.2 105.3 334.6 456.9 173.2 9.0 24.1 56.6 111.9 36.8High 12.9 53.1 178.0 295.4 96.3 7.4 20.7 88.9 116.3 42.8
Hungary Low 89.8 280.2 507.4 602.9 304.4 41.5 73.2 89.8 115.7 71.2Middle 49.9 144.8 260.7 362.1 164.3 24.5 49.3 95.0 160.1 64.4High 16.9 81.6 186.5 337.1 113.7 9.7 45.0 102.2 222.8 67.2
Czech Rep. Low 35.8 190.8 459.9 616.6 248.9 9.9 39.6 71.0 98.6 43.5Middle 15.9 76.4 199.0 308.9 111.0 6.1 27.2 65.9 128.0 40.8High 4.2 31.5 101.2 200.1 58.0 3.0 15.6 44.9 82.7 25.9
Poland Low 46.7 208.2 502.3 695.2 277.0 18.3 47.4 64.4 87.7 46.1Middle 17.7 94.1 256.6 416.3 143.0 9.3 40.2 69.2 119.3 45.7High 7.0 47.4 151.1 257.0 81.9 4.3 24.8 53.9 103.9 33.8
Baltic Lithuania Low 72.5 191.9 395.1 521.3 235.9 6.7 15.1 22.4 48.0 17.9Middle 26.4 117.0 257.3 378.2 148.7 4.8 7.9 20.5 51.5 14.9High 15.8 39.4 131.0 212.2 72.5 2.1 10.4 14.0 19.7 9.5
Estonia Low 55.4 192.8 452.7 631.6 256.4 18.1 22.2 31.9 74.1 29.3583
ondar(
4
laarlbrseipt
tcsbtt(ic
Middle 24.8 140.9 361.3High 7.2 46.7 141.3
* Low: no, primary and lower secondary education (ISCED 1 + 2). Middle: upper secISCED 5 + 6).
.2. Methodological considerations
In our data, education was available in a comparable form for aarge number of countries. Advantages of this measure are that itllows for classification of individuals regardless of whether theyre inside or outside of the labour force market and it largely avertseverse causation since most people acquire their education early inife. We observed large differences between countries in the distri-ution of population by educational level. These differences mainlyeflect true variations between countries of Europe in educational
ystems and attained levels of education. To cope with these differ-nces, we used RII, a measure that takes educational distributionsnto account. RII estimates can be compared between countries,rovided that a detailed and hierarchical classification of educa-ional levels is used in each country.dgmbe
2.5 203.5 3.2 18.8 35.7 110.9 28.419.9 87.3 2.5 9.7 22.3 50.6 15.0
y and post-secondary non-tertiary education (ISCED 3 + 4). High: tertiary education
Data from Eastern European (except Slovenia) and Baltic coun-ries had cross-sectional unlinked design, while all other Europeanountries and Slovenia were census-linked mortality follow-uptudies. Results based on unlinked cross-sectional data may beiased due to differences, e.g. a differential non-response, betweenhe data obtained from the mortality registry (numerator) andhe data available from the population census or other surveysdenominator) [24]. Although this bias may affect inequalitiesn both directions [25] a recent study in Lithuania [26] indi-ated that unlinked estimates tend to overstate mortality in
isadvantaged groups and understate mortality in advantagedroups, at least at older ages. The educational inequalities amongen in the countries with unlinked study design may thuse overestimated, but they are so large that we believe that,ven taking into account the bias, socioeconomic inequalities
J.H.A. Van der Heyden et al. / Lung Cancer 63 (2009) 322–330 327
Table 4Relative indices of inequality (and 95% CI) for lung cancer mortality in 16 European populations, by gender and age group
40–49 years 50–59 years 60–69 years 70–79 years
MenNorth
Finland 4.75 (3.38–6.69) 3.74 (3.05–4.58) 4.54 (3.88–5.32) 2.48 (2.15–2.86)Sweden 3.39 (2.33–4.94) 2.23 (1.88–2.65) 2.07 (1.84–2.33) 1.46 (1.33–1.61)Norway 5.90 (4.02–8.68) 3.96 (3.18–4.92) 2.60 (2.27–2.98) 1.86 (1.66–2.09)Denmark 3.49 (2.01–6.05) 3.25 (2.55–4.14) 1.97 (1.68–2.30) 1.34 (1.18–1.52)
ContinentalBelgium 4.37 (3.10–6.17) 4.11 (3.40–4.98) 3.13 (2.77–3.54) 2.79 (2.48–3.13)Switzerland 5.36 (3.95–7.27) 4.08 (3.47–4.80) 3.18 (2.86–3.54) 2.27 (2.07–2.49)
SouthTurin 3.05 (1.45–6.42) 2.59 (1.79–3.76) 2.99 (2.24–3.98) 2.05 (1.56–2.68)Basque Country 1.10 (0.51–2.37) 0.98 (0.66–1.47) 1.19 (0.82–1.74) 1.70 (1.26–2.30)Madrid 1.63 (0.82–3.25) 1.35 (0.84–2.18) 1.93 (1.31–2.84) 1.15 (0.77–1.70)Barcelona 1.74 (1.19–2.52) 1.98 (1.49–2.61) 1.68 (1.38–2.05) 1.72 (1.40–2.10)
EastSlovenia 3.31 (2.34–4.67) 3.29 (2.66–4.09) 1.80 (1.56–2.07) 1.56 (1.29–1.89)Hungary 6.74 (5.40–8.41) 6.03 (5.27–6.88) 5.10 (4.50–5.78) 2.95 (2.59–3.36)Czech Rep. 12.09 (8.45–17.30) 10.93 (9.33–12.80) 8.27 (7.28–9.38) 5.46 (4.82–6.18)Poland 10.86 (8.97–13.15) 7.46 (6.73–8.26) 5.41 (5.01–5.85) 3.95 (3.64–4.29)
BalticLithuania 7.64 (4.16–14.04) 4.88 (3.58–6.65) 3.83 (3.00–4.88) 2.73 (2.04–3.65)Estonia 9.02 (4.37–18.65) 3.74 (2.64–5.30) 3.04 (2.38–3.88) 1.86 (1.41–2.45)
WomenNorth
Finland 2.51 (1.45–4.33) 2.57 (1.74–3.78) 2.02 (1.48–2.76) 1.34 (1.01–1.76)Sweden 3.83 (2.73–5.37) 2.75 (2.28–3.32) 1.73 (1.48–2.03) 1.18 (1.02–1.37)Norway 6.69 (4.36–10.25) 5.83 (4.37–7.77) 2.60 (2.11–3.20) 1.62 (1.33–1.97)Denmark 4.56 (2.52–8.27) 3.69 (2.82–4.83) 2.38 (1.95–2.91) 1.64 (1.36–1.97)
ContinentalBelgium 2.36 (1.37–4.08) 1.96 (1.30–2.96) 1.88 (1.35–2.62) 0.95 (0.69–1.30)Switzerland 3.33 (2.28–4.86) 1.97 (1.52–2.54) 1.25 (1.02–1.53) 0.85 (0.70–1.04)
SouthTurin 0.63 (0.17–2.36) 1.03 (0.45–2.38) 0.59 (0.32–1.08) 0.79 (0.44–1.41)Basque Country 0.26 (0.10–0.73) 0.14 (0.05–0.34) 0.16 (0.05–0.54) 0.60 (0.20–1.77)Madrid 0.24 (0.05–1.28) 0.18 (0.05–0.65) 0.42 (0.12–1.48) 0.43 (0.11–1.65)Barcelona 0.50 (0.21–1.18) 0.25 (0.12–0.51) 0.35 (0.19–0.67) 0.62 (0.33–1.15)
EastSlovenia 1.42 (0.74–2.73) 0.81 (0.49–1.33) 0.43 (0.31–0.61) 0.26 (0.18–0.38)Hungary 4.99 (3.80–6.56) 2.28 (1.87–2.78) 0.87 (0.71–1.06) 0.43 (0.35–0.53)Czech Rep. 3.70 (2.22–6.15) 2.69 (2.10–3.43) 1.36 (1.08–1.71) 0.70 (0.55–0.88)Poland 5.47 (4.28–6.98) 1.90 (1.64–2.20) 0.99 (0.87–1.14) 0.57 (0.50–0.66)
(0.63(0.97
it
bmtttlpacb
iiosE
dr
itlbuWiltsb
BalticLithuania 3.62 (0.71–18.55) 1.72Estonia 25.31 (4.02–159.56) 2.35
n these countries are indeed larger than in the other popula-ions.
In our study death rates and RIIs were calculated by age groupsased on the age of death, rather than on the age cohort. Thiseans that the death rates of several birth cohorts were grouped
ogether, while we know that in many western European coun-ries inequalities in the rates of smoking changed drastically acrosshe past decades. Unfortunately we could not use age cohorts asongitudinal data were not available for all populations. For the 11opulations for which such data were available we repeated thenalyses making use of age cohorts. Age specific inequalities in lungancer mortality appeared to be very similar to the ones obtainedy using the first approach.
Also in previous work [27] a north–south gradient in smok-
ng inequalities was found for women, showing larger educationalnequalities in the Northern countries. Such a gradient was notbserved for men. Even though differences in the questionnaires,urvey methodology, response rates and missing values acrossuropean countries may have affected the comparability of surveyis
fp
–4.65) 1.52 (0.75–3.09) 1.27 (0.68–2.37)–5.67) 1.15 (0.61–2.17) 0.68 (0.42–1.09)
ata on smoking, the fact that our results are in line with previousesearch is an indication of the validity of the findings.
The comparison of inequalities in lung cancer mortality withnequalities of current smoking should be done with caution, dueo the time lag between exposure and established disease. This timeag varies and depends on smoking duration and intensity [28,29],ut in overall terms a 20–50-year delay is assumed between theptake of regular smoking and the occurrence of lung cancer [30].e tried to take this time lag into account by using information on
nequalities in smoking as proxy for information on inequalities inung cancer mortality 20 years later. It is clear that this assump-ion has serious limitations. Educational inequalities in trends inmoking behaviour and in smoking cessation rates have indeedeen observed in several European countries [13,31] and may result
n changing inequalities in smoking and lung cancer mortality byocioeconomic group.
Even though it is unfortunate that lung cancer mortality datarom two southern urban areas (Madrid and Turin) had to be com-ared with smoking data from two national health interviews, the
328 J.H.A. Van der Heyden et al. / Lung Cancer 63 (2009) 322–330
Fig. 1. Contribution of inequalities in lung cancer mortality to inequalities in total mortality in 16 European populations, age group 40–79 years.
Fig. 2. Relative indices of inequality (and 95% CI) for lung cancer mortality and smoking in 13 European populations.
/ Lung
ctt
aceto[tptwuh
4
eiswiwmsag
EswcepNm
iwtotEtwEmh
dEi1tfi
tmtTrt
li
ssitiistf
maiapr
Stts
cStaiScsfc
4
iwtstetcaisNtFcbsagt
J.H.A. Van der Heyden et al.
onclusion based on this comparison was very similar to the one inhe other Southern urban area (Barcelona) for which we were ableo compare with a corresponding health survey.
The use of mortality data at a European level has unavoid-bly some limitations. Discrepancies may exist in models of deathertificates, nature and amount of information entered, way tostablish the diagnosis, degree of consistency of the certifica-ion process, autopsy practices, certifiers practices, implementationf the ICD-10 and implementation of automated coding systems32]. The results of our study would be biased only to the extenthat coding practices are associated with educational level withinopulations. Although there are no specific indications for varia-ions in coding according to the educational level of the deceased,e cannot completely rule out such bias. However, such bias isnlikely to explain the results for broader groups as analysedere.
.3. Comparison with other studies and interpretation of results
Generally speaking our findings are in line with the Mackenbacht al. [12] paper that explored inequalities in lung cancer mortal-ty by educational level in 10 European populations. This is noturprising. Our study population includes eight populations thatere also included in this study, although we have been work-
ng with more recent data. The typical Southern European patternith higher lung cancer mortality rates among the low educateden and the high educated women, which is also reported in other
tudies [33], is confirmed by our data from the Basque Country,nd is also observed in Slovenia, that suggests that the north–southradient is also prevalent among Eastern European countries.
If we would apply our findings on lung cancer mortality in theastern European countries to the concept of the spread of themoking epidemic, as described in several papers [34,14,13], weould stage lung cancer mortality among men in Eastern European
ountries (relative high mortality rates, higher mortality in lowducated groups) as more advanced than the Southern Euro-ean populations but not yet having reached the situation of theorthern European countries (relative low mortality rates, higherortality in low educated group).It is striking that among females (40–49 years) educational
nequalities in the Eastern European countries are very similar tohat we find in the Northern European countries, while inequali-
ies in the oldest age group (70–79 years) are quite in line with thebservations in Southern European countries. This could confirmhe hypothesis that the lung cancer mortality inequalities in Easternuropean are shifting from a Southern to a Northern European pat-ern. This will lead to increasing socioeconomic inequalities amongomen in the coming years. The findings that in some Eastern
uropean countries lung cancer mortality rates are decreasing inale populations and increasing in women [35,36] support this
ypothesis.Up to now, few other studies have explored socioeconomic
ifferences in lung cancer mortality rates in Central and Easternuropean countries. One study in Estonia reported an importantncrease in lung cancer mortality differences by education between989 and 2000, both in men and women [37]. The magnitude ofhe inequalities that are reported in this study are in line with ourndings.
As has also been observed in previous research [17] the contribu-ion of inequalities in lung cancer mortality to inequalities in total
ortality is quite heterogeneous across different European coun-ries. In our study it is more than 10% in most male populations.his confirms that among men inequalities in lung cancer mortalityemain an important factor to explain inequalities in overall mor-ality. Among women the relative contribution of inequalities in
toos
Cancer 63 (2009) 322–330 329
ung cancer mortality is less important, although quite substantialn two Northern countries (Denmark and Norway).
From Fig. 2 it appears that all over Europe there are still largeocioeconomic inequalities in lung cancer mortality, but also inmoking among young adults. There is no doubt that smokings the main factor that explains the socioeconomic differenceshat are observed in lung cancer mortality. From this perspectivenequalities in smoking could be a good indicator of inequalitiesn lung cancer mortality in the future. The large inequalities inmoking found in younger age groups do not give much hopeowards reduction of inequalities in lung cancer mortality in theuture.
Inequalities in lung cancer mortality are usually larger amongen than among women. Smoking inequalities, on the contrary,
re more or less of the same magnitude in women and in men. Its therefore plausible that the inequalities in lung cancer mortalitymong men and women may in the future converge towards theresent pattern among men. Northern European countries alreadyeached this stage, especially the younger age groups.
Whereas in previous research the hope was expressed that inouthern European countries large inequalities in lung cancer mor-ality among women could be avoided [12], our results suggesthat the reversal from a positive to a negative association betweenocioeconomic status and lung cancer mortality is ongoing.
It cannot be excluded that other factors than smoking haveontributed to the observed inequalities in lung cancer mortality.ome studies have suggested a possible role of other environmen-al and occupational exposures [38], poor lung health, deprivationnd poor socioeconomic conditions throughout life [8], differencesn access to treatment [39,40] and differences in survival [41].ome of these factors are more plausible than others. More spe-ific research is needed to explore further the relation betweenocioeconomic inequalities in lung cancer mortality and otheractors than smoking, especially in Eastern European and Balticountries.
.4. Conclusions and recommendations
Our study confirms that regional patterns of socioeconomicnequalities in lung cancer mortality persist and are consistent
ith the geographical spread of the smoking epidemic. The pat-ern of inequalities in Eastern and Baltic countries is more or lessimilar as the one observed in the Northern countries althoughhe absolute rates are higher. During the coming decades, we mayxpect in Southern European countries a reversal from a positiveo a negative association between socioeconomic status and lungancer mortality. Among men inequalities in lung cancer mortalityccount for a substantial fraction of inequalities in total mortal-ty. Among women the inequalities are still smaller, but there areome indications of an increasing trend, and especially in someorthern European countries the contribution of lung cancer mor-
ality inequalities to inequalities in total mortality is substantial.urther efforts to tackle socioeconomic inequalities in lung can-er mortality in Europe are necessary in all countries. This cane done by increasing specific tobacco control measures in lowerocioeconomic groups, including strict enforcement of laws andgreements, increase of financial and other barriers to smoking,eographic or social targeting of smoking cessation services, andailoring of communication approaches [15].
Although the efforts should primarily target smoking preven-ion, there is also need for further research to establish the rolef other factors than smoking, such as other environmental andccupational factors, and differences in access to treatment andurvival.

3 / Lung
C
A
Pmdc
R
[
[
[
[
[
[
[
[
[
[
[
[
[
[
[
[
[
[
[
[
[
[
[
[
[
[
[
[
[
[treatment in lung cancer. J Eval Clin Pract 2006;12(5):573–82.
30 J.H.A. Van der Heyden et al.
onflict of interest statement
None declared.
cknowledgements
We wish to thank the European Commission that through theublic Health Program financed the Eurothine project (grant agree-ent 2003125). We also thank all the study sites that provided
ata, as well as all partners and international experts who haveontributed to this EC project.
eferences
[1] Ferlay J, Autier P, Boniol M, Heanue M, Colombet M, Boyle P. Estimates of the can-cer incidence and mortality in Europe in 2006. Ann Oncol 2007;18(3):581–92.
[2] Bosetti C, Levi F, Lucchini F, Negri E, La Vecchia C. Lung cancer mor-tality in European women: recent trends and perspectives. Ann Oncol2005;16(10):1597–604.
[3] Zatonski WA, Manczuk M, Powles J, Negri E. Convergence of male and femalelung cancer mortality at younger ages in the European Union and Russia. Eur JPublic Health 2007;17(5):450–4.
[4] Bray F, Tyczynski JE, Parkin DM. Going up or coming down? The changingphases of the lung cancer epidemic from 1967 to 1999 in the 15 European Unioncountries. Eur J Cancer 2004;40:96–125.
[5] Huisman M, Kunst AE, Bopp M, Borgan JK, Borrell C, Costa G, et al.Educational inequalities in cause-specific mortality in middle-aged andolder men and women in eight western European populations. Lancet2005;365(9458):493–500.
[6] Mackenbach JP, Bos V, Andersen O, Cardano M, Costa G, Harding S, et al. Widen-ing socioeconomic inequalities in mortality in six Western European countries.Int J Epidemiol 2003;32(5):830–7.
[7] van Loon AJ, Goldbohm RA, Van Den Brandt PA. Lung cancer: is there an associ-ation with socioeconomic status in The Netherlands? J Epidemiol CommunityHealth 1995;49(1):65–9.
[8] Hart CL, Hole DJ, Gillis CR, Smith GD, Watt GC, Hawthorne VM. Social classdifferences in lung cancer mortality: risk factor explanations using two Scottishcohort studies. Int J Epidemiol 2001;30(2):268–74.
[9] Martikainen P, Lahelma E, Ripatti S, Albanes D, Virtamo J. Educationaldifferences in lung cancer mortality in male smokers. Int J Epidemiol2001;30(2):264–7.
10] Mao Y, Hu J, Ugnat AM, Semenciw R, Fincham S. Socioeconomic status and lungcancer risk in Canada. Int J Epidemiol 2001;30(4):809–17.
11] Chan-Yeung M, Koo LC, Ho JC, Tsang KW, Chau WS, Chiu SW, et al. Risk fac-tors associated with lung cancer in Hong Kong. Lung Cancer 2003;40(2):131–40.
12] Mackenbach JP, Huisman M, Andersen O, Bopp M, Borgan JK, Borell C, et al.Inequalities in lung cancer mortality by the educational level in 10 Europeanpopulations. Eur J Cancer 2004;40:126–35.
13] Giskes K, Kunst AE, Benach J, Borrell C, Costa G, Dahl E, et al. Trends in smokingbehaviour between 1985 and 2000 in nine European countries by education. JEpidemiol Community Health 2005;59(5):395–401.
14] Cavelaars AE, Kunst AE, Geurts JJ, Crialesi R, Grotvedt L, Helmert U,et al. Educational differences in smoking: international comparison. BMJ2000;320(7242):1102–7.
15] Kunst A, Giskes K, Mackenbach J, for the EU Network on Interventions to ReduceSocio-economic Inequalities in Health. Socio-economic inequalities in smokingin the European Union. Applying an equity lens to tobacco control policies.Rotterdam: Department of Public Health, Erasmus Medical Center Rotterdam;2004. pp. 1–92.
16] Alberg AJ, Brock MV, Samet JM. Epidemiology of lung cancer: looking to thefuture. J Clin Oncol 2005;23(14):3175–85.
17] Kunst AE, Groenhof F, Mackenbach JP, Health EW. Occupational class and causespecific mortality in middle aged men in 11 European countries: comparisonof population based studies. EU Working Group on Socioeconomic Inequalitiesin Health. BMJ 1998;316(7145):1636–42.
18] Mackenbach, JP, Stirbu I, Roskam AJ, Schaap MM, Menvielle G, Leinsalu M, KunstAE, European Union Working Group on Socioeconomic Inequalities in Health.
[
[
Cancer 63 (2009) 322–330
Socioeconomic inequalities in health in 22 European Countries. N Engl J Med2008;358(23):2468–2481.
19] Borrell C, Azlor E, Rodriguez-Sanz M, Puigpinós R, Cano-Serral G, Pasarin MI, etal. Trends in socioeconomic mortality inequalities in a Southern Urban settingat the turn of the century. J Epidemiol Community Health 2008.
20] Pamuk E. Social class inequality in mortality from 1921 to 1972 in England andWales. Popul Stud 1985;39:17–31.
21] Mackenbach JP, Kunst AE. Measuring the magnitude of socio-economic inequal-ities in health: an overview of available measures illustrated with two examplesfrom Europe. Soc Sci Med 1997;44(6):757–71.
22] Hayes LJ, Berry G. Sampling variability of the Kunst–Mackenbach relative indexof inequality. J Epidemiol Community Health 2002;56(10):762–5.
23] Ezendam NP, Stirbu I, Leinsalu M, Lundberg O, Kalediene R, Wojtyniak B, et al.Educational inequalities in cancer mortality differ greatly between countriesaround the Baltic Sea. Eur J Cancer 2007.
24] Kunst AE, Groenhof F, Borgan JK, Costa G, Desplanques G, Faggiano F, etal. Socio-economic inequalities in mortality. Methodological problems illus-trated with three examples from Europe. Rev Epidemiol Sante Publique1998;46(6):467–79.
25] Monitoring of trends in socioeconomic inequalities in mortality: experiencesin mortality, experiences from a European project. Paper presented to theIUSSP seminar on “Determinants of Diverging Trends in Mortality” Session 6.Increasing socio-economic inequalities in mortality within countries-1. Ros-tock, Germany: 2002.
26] Shkolnikov VM, Jasilionis D, Andreev EM, Jdanov DA, Stankuniene V, Ambroza-itiene D. Linked versus unlinked estimates of mortality and length of life byeducation and marital status: evidence from the first record linkage study inLithuania. Soc Sci Med 2007;64:1392–406.
27] Huisman M, Kunst AE, Mackenbach JP. Educational inequalities in smokingamong men and women aged 16 years and older in 11 European countries.Tob Control 2005;14(2):106–13.
28] Shibuya K, Inoue M, Lopez AD. Statistical modeling and projections of lungcancer mortality in 4 industrialized countries. Int J Cancer 2005;117(3):476–85.
29] Flanders WD, Lally CA, Zhu BP, Henley SJ, Thun MJ. Lung cancer mortality inrelation to age, duration of smoking, and daily cigarette consumption: resultsfrom Cancer Prevention Study II. Cancer Res 2003;63(19):6556–62.
30] Wingo PA, Ries LA, Giovino GA, Miller DS, Rosenberg HM, Shopland DR, etal. Annual report to the nation on the status of cancer, 1973–1996, witha special section on lung cancer and tobacco smoking. J Natl Cancer Inst1999;91(8):675–90.
31] Schaap MM, Kunst AE, Leinsalu M, Regidor E, Ekholm O, Dzurova D, Helmert U,Klumbiene J, Santana P, Mackenbach JP. Effect of nation-wide tobacco controlpolicies on smoking cessation in high and low educated groups in 18 Europeancountries. Tob Control 2008, doi:10.1136/tc.2007.024265.
32] Jougla E, Pavillon G, Rossollin F, De Smedt M, Bonte J. Improvement of the qualityand comparability of causes-of-death statistics inside the European Commu-nity. EUROSTAT Task Force on “causes of death statistics”. Rev Epidemiol SantePublique 1998;46(6):447–56.
33] Borrell C, Regidor E, Arias LC, Navarro P, Puigpinos R, Dominguez V, et al. Inequal-ities in mortality according to educational level in two large Southern Europeancities. Int J Epidemiol 1999;28(1):58–63.
34] Lopez AD, Collishaw NE, Piha T. A descriptive model of the cigarette epidemicin developed countries. Tob Control 1994;3:242–7.
35] Kubik A, Plesko I, Reissigova J. Prediction of lung cancer mortality in four CentralEuropean countries, 1990–2009. Neoplasma 1998;45(2):60–7.
36] Tyczynski JE, Bray F, Aareleid T, Dalmas M, Kurtinaitis J, Plesko I, et al. Lungcancer mortality patterns in selected Central, Eastern and Southern Europeancountries. Int J Cancer 2004;109(4):598–610.
37] Leinsalu M, Vagero D, Kunst AE. Estonia 1989–2000: enormous increase inmortality differences by education. Int J Epidemiol 2003;32(6):1081–7.
38] Fano V, Michelozzi P, Ancona C, Capon A, Forastiere F, Perucci CA. Occupationaland environmental exposures and lung cancer in an industrialised area in Italy.Occup Environ Med 2004;61(9):757–63.
39] Jack RH, Gulliford MC, Ferguson J, Moller H. Explaining inequalities in access to
40] Campbell NC, Elliott AM, Sharp L, Ritchie LD, Cassidy J, Little J. Rural and urbandifferences in stage at diagnosis of colorectal and lung cancers. Br J Cancer2001;84(7):910–4.
41] Woods LM, Rachet B, Coleman MP. Origins of socio-economic inequalities incancer survival: a review. Ann Oncol 2006;17(1):5–19.