Socioeconomic factors associated with fishing pressure in small-scale fisheries along the West...
7
Socioeconomic factors associated with fishing pressure in small-scale fisheries along the West Philippine Sea biogeographic region Richard N. Muallil a, b, c, * , Deborah Cleland d , Porfirio M. Aliño a, b, * a Marine Science Institute, University of the Philippines Diliman,1101 Quezon City, Philippines b Marine Environment and Resources Foundation, Inc., Marine Science Institute, University of the Philippines Diliman,1101 Quezon City, Philippines c Mindanao State University, Tawi-Tawi College of Technology and Oceanography, 7500 Bongao, Tawi-Tawi, Philippines d Fenner School of Environment and Society, College of Medicine, Biology & Environment, Australian National University, Canberra, ACT 0200, Australia article info Article history: Available online abstract Small-scale fishers in the Philippines are highly diverse in their fishing behavior and demographic characteristics. Understanding this heterogeneity will provide valuable insights for fisheries manage- ment efforts that could result in winewin outcomes, both for (i) improving sustainable incomes for fishers, and (ii) facilitating recovery and resilience of depleted fisheries. We determined how different socioeconomic factors were associated with fishing effort, measured as the number of fishing trips per month, in six neighboring coastal towns along the West Philippines Sea biogeographic region of the Philippines. We found that types of alternative livelihoods and fisher age were the most important factors influencing fishing effort. Employed fishers (e.g. drivers, boat operators, construction workers, carpenters, etc.) had lower fishing effort than both those without alternative livelihoods and self- employed ones (e.g. subsistence farmers/livestock raisers and small business operators). Younger fishers fished more frequently than older ones. Our study provides valuable insights for management interventions that can effectively foster transitions into alternative livelihoods to alleviate fishing pres- sure while providing fishers with sustainable source of income. Ó 2013 Elsevier Ltd. All rights reserved. 1. Introduction In an archipelagic tropical country like the Philippines, fishing is a significant source of livelihood as well as an important way of life for the majority of the coastal population (Pollnac et al., 2001). Fishing used to be a very lucrative livelihood but due to its “open- access” nature, uncontrolled fish extraction by the burgeoning population resulted in a drastic decline of stocks in many fishing grounds over the past few decades (Alcala and Russ, 2002; Green et al., 2003; Aliño et al., 2004; Lavides et al., 2010). Overfishing has also been considered the major cause of recent ecological ex- tinctions in many heavily fished areas (Jackson et al., 2001; Lavides et al., 2010; Nañola et al., 2011). In effect, overfishing resulted in widespread poverty in fishing communities, which further aggra- vated Malthusian overfishing as competition for the declining stocks increases (Hardin, 1968; Lim et al., 1995; Bene, 2003; Hamilton, 2003). Worm et al. (2009) estimated that 63% of the world’s oceans are already overfished. A similar 64% of Philippine coastal fisheries are also overfished, although this is a conservative estimate since the impacts of destructive fishing practices, such as blast and poison fishing, and the intrusion of the highly efficient commercial fishers to coastal fishing grounds were not accounted for in the study (Muallil et al., 2012). Green et al. (2003) estimated that fish stocks in major fishing grounds in the Philippines have already been reduced to less than 10% of the 1950s levels. Worm et al. (2006) even made a very bold prediction that global fish- eries will collapse by 2048, although this has been strongly criti- cized by other fisheries scientists (Hilborn, 2006). Some believe that even when destructive fishing methods such as blast and poison fishing are effectively controlled, widespread poverty and the rapidly growing fishing population will eventually deplete the resource to the point where recovery will no longer be feasible (Jackson et al., 2001; Pauly et al., 2002; Worm et al., 2006; Newton et al., 2007; Muallil et al., 2012; Cabral et al., 2013 , b). Newton et al. (2007) estimated the maximum sustainable yield for coral reefs to be at 5 mt/km 2 /yr. For the Philippines with a total of 27,000 km 2 coral reef area (Burke et al., 2011), and with more than 1 million small scale fishers alone (BFAR, 2009), a ceiling of less than * Corresponding authors. Marine Science Institute, University of the Philippines Diliman,1101 Quezon City, Philippines. Tel./fax: þ63 2 433 1806. E-mail addresses: [email protected], [email protected] (R.N. Muallil), [email protected] (P.M. Aliño). Contents lists available at SciVerse ScienceDirect Ocean & Coastal Management journal homepage: www.elsevier.com/locate/ocecoaman 0964-5691/$ e see front matter Ó 2013 Elsevier Ltd. All rights reserved. http://dx.doi.org/10.1016/j.ocecoaman.2013.04.013 Ocean & Coastal Management 82 (2013) 27e33
-
Upload
independent -
Category
Documents
-
view
8 -
download
0
Transcript of Socioeconomic factors associated with fishing pressure in small-scale fisheries along the West...
at SciVerse ScienceDirect
Ocean & Coastal Management 82 (2013) 27e33
Contents lists available
Ocean & Coastal Management
journal homepage: www.elsevier .com/locate/ocecoaman
Socioeconomic factors associated with fishing pressure in small-scalefisheries along the West Philippine Sea biogeographic region
Richard N. Muallil a,b,c,*, Deborah Cleland d, Porfirio M. Aliño a,b,*
aMarine Science Institute, University of the Philippines Diliman, 1101 Quezon City, PhilippinesbMarine Environment and Resources Foundation, Inc., Marine Science Institute, University of the Philippines Diliman, 1101 Quezon City, PhilippinescMindanao State University, Tawi-Tawi College of Technology and Oceanography, 7500 Bongao, Tawi-Tawi, Philippinesd Fenner School of Environment and Society, College of Medicine, Biology & Environment, Australian National University, Canberra, ACT 0200, Australia
a r t i c l e i n f o
Article history:Available online
* Corresponding authors. Marine Science Institute,Diliman, 1101 Quezon City, Philippines. Tel./fax: þ63
E-mail addresses: [email protected], [email protected] (P.M. Aliño).
0964-5691/$ e see front matter � 2013 Elsevier Ltd.http://dx.doi.org/10.1016/j.ocecoaman.2013.04.013
a b s t r a c t
Small-scale fishers in the Philippines are highly diverse in their fishing behavior and demographiccharacteristics. Understanding this heterogeneity will provide valuable insights for fisheries manage-ment efforts that could result in winewin outcomes, both for (i) improving sustainable incomes forfishers, and (ii) facilitating recovery and resilience of depleted fisheries. We determined how differentsocioeconomic factors were associated with fishing effort, measured as the number of fishing trips permonth, in six neighboring coastal towns along the West Philippines Sea biogeographic region of thePhilippines. We found that types of alternative livelihoods and fisher age were the most importantfactors influencing fishing effort. Employed fishers (e.g. drivers, boat operators, construction workers,carpenters, etc.) had lower fishing effort than both those without alternative livelihoods and self-employed ones (e.g. subsistence farmers/livestock raisers and small business operators). Youngerfishers fished more frequently than older ones. Our study provides valuable insights for managementinterventions that can effectively foster transitions into alternative livelihoods to alleviate fishing pres-sure while providing fishers with sustainable source of income.
� 2013 Elsevier Ltd. All rights reserved.
1. Introduction
In an archipelagic tropical country like the Philippines, fishing isa significant source of livelihood as well as an important way of lifefor the majority of the coastal population (Pollnac et al., 2001).Fishing used to be a very lucrative livelihood but due to its “open-access” nature, uncontrolled fish extraction by the burgeoningpopulation resulted in a drastic decline of stocks in many fishinggrounds over the past few decades (Alcala and Russ, 2002; Greenet al., 2003; Aliño et al., 2004; Lavides et al., 2010). Overfishinghas also been considered the major cause of recent ecological ex-tinctions in many heavily fished areas (Jackson et al., 2001; Lavideset al., 2010; Nañola et al., 2011). In effect, overfishing resulted inwidespread poverty in fishing communities, which further aggra-vated Malthusian overfishing as competition for the decliningstocks increases (Hardin, 1968; Lim et al., 1995; Bene, 2003;
University of the Philippines2 433 [email protected] (R.N. Muallil),
All rights reserved.
Hamilton, 2003). Worm et al. (2009) estimated that 63% of theworld’s oceans are already overfished. A similar 64% of Philippinecoastal fisheries are also overfished, although this is a conservativeestimate since the impacts of destructive fishing practices, such asblast and poison fishing, and the intrusion of the highly efficientcommercial fishers to coastal fishing grounds were not accountedfor in the study (Muallil et al., 2012). Green et al. (2003) estimatedthat fish stocks in major fishing grounds in the Philippines havealready been reduced to less than 10% of the 1950s levels. Wormet al. (2006) even made a very bold prediction that global fish-eries will collapse by 2048, although this has been strongly criti-cized by other fisheries scientists (Hilborn, 2006).
Some believe that even when destructive fishing methods suchas blast and poison fishing are effectively controlled, widespreadpoverty and the rapidly growing fishing population will eventuallydeplete the resource to the point where recovery will no longer befeasible (Jackson et al., 2001; Pauly et al., 2002; Worm et al., 2006;Newton et al., 2007; Muallil et al., 2012; Cabral et al., 2013,b).Newton et al. (2007) estimated the maximum sustainable yield forcoral reefs to be at 5 mt/km2/yr. For the Philippines with a total of27,000 km2 coral reef area (Burke et al., 2011), andwithmore than 1million small scale fishers alone (BFAR, 2009), a ceiling of less than
R.N. Muallil et al. / Ocean & Coastal Management 82 (2013) 27e3328
1 kg daily catch per fisher for 15 days per month fishing must beimplemented to stay within the limit of this maximum sustainableextraction rate. Such catch rates could hardly provide for the basicdaily needs of fishers’ households (Muallil et al., 2011). Moreover,with the patchy distribution of human populations, inaccessibilityof some offshore reefs to artisanal fishers and the deterioratedcondition of most coral reefs in the Philippines, the impact offishing pressure is much higher andmore detrimental in coral reefsnear the centers of population (Jackson et al., 2001; Nañola et al.,2011). Furthermore, the common illegal incursion of highly effi-cient commercial fishers to coastal waters and the prevalence ofdestructive fishing practices such as blast and poison fishing willfurther accelerate overfishing and habitat deterioration (White andVogt, 2000; Hanna, 2001; Muallil and Geronimo, 2010).
Management measures to effectively address the decliningfisherymust involve reducingfishingeffort or simply catching fewerfish. Livelihood approaches have become popular in providingeconomic assistance to fishers while alleviating fishing pressure asfishers reduce their dependency on the fishery (Allison and Ellis,2001; Matiya et al., 2005). However, we previously showed thatsome of the fishers cannot easily exit the fishery evenwhen offeredrelatively high monthly monetary incentives e.g. higher than theminimumwage in the Philippines (Muallil et al., 2011). Fishing is animportant way of life and job satisfaction in the fishery is high inmany areas, so fishers do not readily leave the fishery for any otheroccupation even in the face of a continually declining catch (Pollnacet al., 2001; Cinner et al., 2009; Bavinck et al., 2012; Muallil et al.,2011). Moreover, with over a million highly resource-dependentfishers in the Philippines, the reduction of fishing pressure thatcan potentially result from livelihood programs may not be enoughto avert fishery collapse in some heavily fished areas (SuPFA, 2006;Licuanan et al., 2008; Muallil et al., 2012).
Quantifying fishing effort is crucial for effective fisheries man-agement (Piet et al., 2007; Anticamara et al., 2011) but is a verychallenging task given the high variability in fishing practices (gear,targetfish, seasonality, sizes and typesoffishing vessels,fishing time,etc.) (Le Pape and Vigneau, 2001; McCluskey and Lewison, 2008;Cabral et al., 2010). Most published studies have investigated fishingeffort as the total effort (e.g. number of vessels, size of vessels,
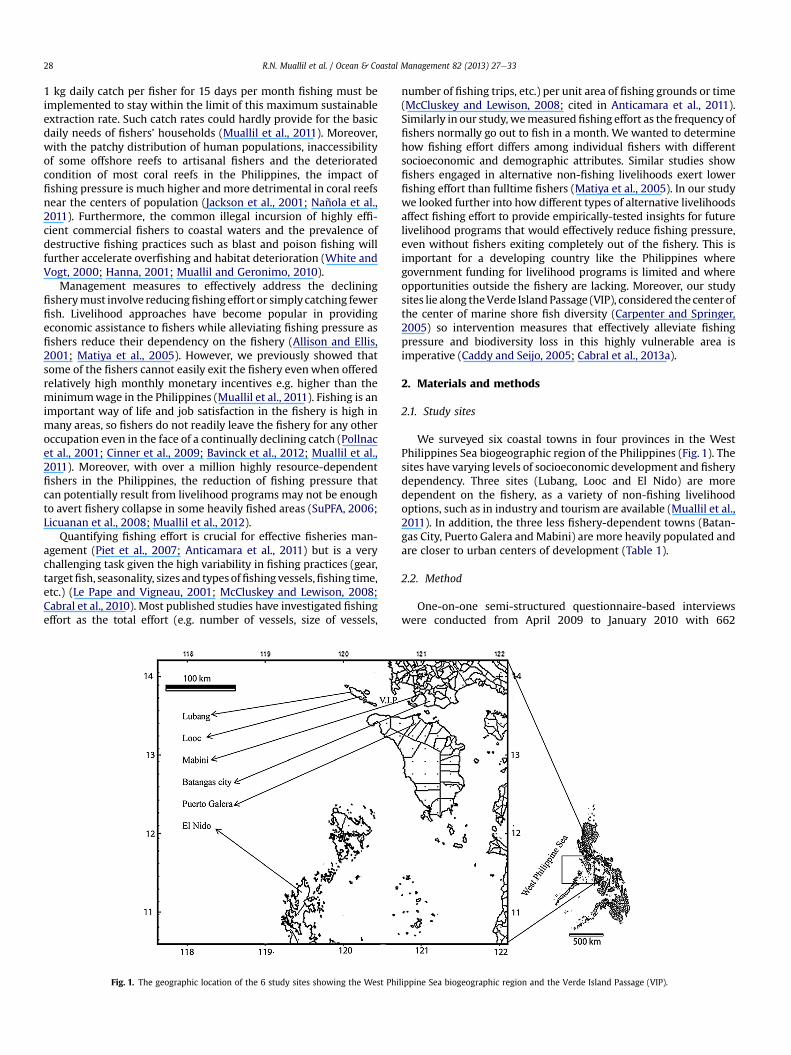
Fig. 1. The geographic location of the 6 study sites showing the West Phi
number of fishing trips, etc.) per unit area of fishing grounds or time(McCluskey and Lewison, 2008; cited in Anticamara et al., 2011).Similarly in our study, wemeasured fishing effort as the frequency offishers normally go out to fish in a month. We wanted to determinehow fishing effort differs among individual fishers with differentsocioeconomic and demographic attributes. Similar studies showfishers engaged in alternative non-fishing livelihoods exert lowerfishing effort than fulltime fishers (Matiya et al., 2005). In our studywe looked further into how different types of alternative livelihoodsaffect fishing effort to provide empirically-tested insights for futurelivelihood programs that would effectively reduce fishing pressure,even without fishers exiting completely out of the fishery. This isimportant for a developing country like the Philippines wheregovernment funding for livelihood programs is limited and whereopportunities outside the fishery are lacking. Moreover, our studysites lie along theVerde IslandPassage (VIP), considered the center ofthe center of marine shore fish diversity (Carpenter and Springer,2005) so intervention measures that effectively alleviate fishingpressure and biodiversity loss in this highly vulnerable area isimperative (Caddy and Seijo, 2005; Cabral et al., 2013a).
2. Materials and methods
2.1. Study sites
We surveyed six coastal towns in four provinces in the WestPhilippines Sea biogeographic region of the Philippines (Fig. 1). Thesites have varying levels of socioeconomic development and fisherydependency. Three sites (Lubang, Looc and El Nido) are moredependent on the fishery, as a variety of non-fishing livelihoodoptions, such as in industry and tourism are available (Muallil et al.,2011). In addition, the three less fishery-dependent towns (Batan-gas City, Puerto Galera andMabini) are more heavily populated andare closer to urban centers of development (Table 1).
2.2. Method
One-on-one semi-structured questionnaire-based interviewswere conducted from April 2009 to January 2010 with 662
lippine Sea biogeographic region and the Verde Island Passage (VIP).

Table 1Demographic and socioeconomic settings of the study sites. n is the number of respondents in each town.
Town Province n Major source of income Population(as of 2007)
No. of fishers(% of total population)
Distance from centersof development
Puerto Galera Oriental Mindoro 88 Tourism 28,035 1.19% 27 kmBatangas City Batangas 51 Industry 295,231 0.38% 0 kmMabini Batangas 78 Industry and Tourism 40,629 1.90% 14 kmLooc Occidental Mindoro 101 Fishery 11,310 7.85% 61 kmLubang Occidental Mindoro 86 Fishery and Agriculture 28,267 2.95% 78 kmEl Nido Palawan 93 Tourism and Fishery 30,249 10.70% 149 km
Source: Modified from Muallil et al. (2011).
Table 2aDescription of categorical variables used in regression tree analysis against fishingeffort. Number and percentage of respondents are also shown.
Variable Description Level Description Count (%)
Education Whether the respondentgraduated from highschool
1 Non-highschool graduate
356(72%)
2 High schoolgraduate
141(28%)
Boat Whether the respondentowned boat
1 Without boat 133(27%)2 With
non-motorizedboat only
78(16%)
3 With motorizedboat
286 (57%)
Alternativelivelihood
Whether the respondentis engaged in non-fishinglivelihood
1 No livelihood 297(60%)2 Self-employed 79(16%)3 Employed 121(25%)
R.N. Muallil et al. / Ocean & Coastal Management 82 (2013) 27e33 29
small-scale male fishers aging 17e77 years old. We did not includewomen fishers in our study since, in all our study sites, fishing ismostly exercised by men while women attend more to householdchores. In the Philippines, small-scale or ‘municipal’ fishers, arethose who are using boats of less than three gross tons (as definedin the Philippine Fisheries Code of 1998). A total of 497 respondentswho provided complete responses in all the parameters asked wereincluded in the analysis. Incomplete responses were excluded, asregression tree analysis (explained below) works better if there areno missing data (De’Ath and Fabricius, 2000). Furthermore, evenafter culling for incomplete responses, we still had sample sizesranging from 51 (Batangas City) to 101 (Looc), or an equivalence ofabout 3.1% (originally 3.8%) to 11.4% (originally 15.0%), respectively,of the total population of male fishers in our study sites.
Snowball sampling, or the chain referral method, was used inchoosing the respondents. In each site, each interviewer inter-viewed the first fisher-respondent he/she met. The respondentwould then suggest for the next respondent and so on. Normally, arespondent would suggest his neighbor or a nearby fisher he sawafter his interview. In each town, interviews were carried out by atleast five local interviewers who had previous experiences in doingsimilar surveys. Moreover, they were briefed well about the ques-tionnaires to ensure standardization in the delivery of questions asmuch as possible. Four to six dominant fishing villages (barangays),based on fisher population upon consultation with the localgovernment unit (LGU) of the respective towns, were sampled ineach town.
Respondents were asked about (i) fishing effort, measured bynumber of fishing days per month, (ii) age, (ii), educationalattainment, (iii) boat ownership, (iv) daily income from fishingcomputed as the total catch (in kg) multiplied by the respondent’sselling price of his major catch, and (v) engagement in non-fishingor alternative livelihood. Fishers in alternative livelihoods werefurther divided into “self-employed” (those engaged in subsistencefarm/livestock and small businesses) and “employed” (thoseengaged in carpentry, transport (as vehicle drivers), other non-farmlabor (construction workers, mechanics, electricians, waiters etc)and government (mostly LGU personnel)). The latter were mostlyminimum daily wage earners. Specifically, we defined “employed”as fishers who were working outside the fishery and were paid fortheir services on a regular basis by employers or “bosses”. On thecontrary, “self-employed” fishers had control over their means ofproduction, and did not necessarily have “bosses”. The most com-mon alternative livelihoods across all towns were subsistencefarming followed by carpentry, small businesses and transport(mostly as vehicle drivers).
Focus group discussions with key informants, mostly older andexperienced fishers and some local leaders, were conducted tovalidate results from one-on-one interviews. Total population datawere obtained from the official website of the National StatisticsOffice of the Philippines. Fisher population and other socioeco-nomic information, such as major source of income of the studysites, were obtained from the records of the respective LGUs.
A non-parametric regression tree analysis was used to deter-mine how the different socioeconomic factors (predictors) influ-enced fishing effort. “ANOVA” method with 0.65 and 0.35 splitsbased on “information” were the specifications used to generatethe regression tree. To validate statistical significance for the mostimportant factors determined by regression tree analysis, we per-formed nested ANOVA, where towns were treated as random(nesting) factor, and subsequent post hoc Tukey’s test, in the mul-ticomp package, for multiple tests that showed significant P values.We used the rank-transformed data in the parametric tests sincethe dependent variable did not have a normal distribution. Allstatistical analyses were implemented in R statistical analysissoftware version 2.15.2 (R Development Core Team, 2012), usingthe rpart (regression tree) and nlme (nested ANOVA) packages.
3. Results
The respondents had a broad range of socioeconomic charac-teristics (Tables 1, 2a and 2b). Fishers’ daily gross income fromfishing was only US$7.6 on average, with 70% of the respondentsactually earning less than this average income. Despite very lowcatches, about 60% of the fishers did not have any other source oflivelihood.
Fishing effort also varied widely, with some fishers barely goingout to sea once a week, and others almost every day, with theaverage at 18 days per month, or just over four days per week.Regression tree analysis showed that having an alternative liveli-hood was the most important factor influencing fishing effort.“Employed” fishers had lower fishing effort (mean 16 days)compared to “self-employed” and those who did not have alter-native livelihood (mean 19 days). The latter two types of fishers,based on alternative livelihoods, were grouped together in theregression tree (Fig. 2). Nested ANOVA showed significant differ-ence in fishing effort between “employed” fishers and the othertwo groups (P ¼ 0.029). When “self-employed” fishers and thosenot engaged in alterative livelihood were treated as two separate
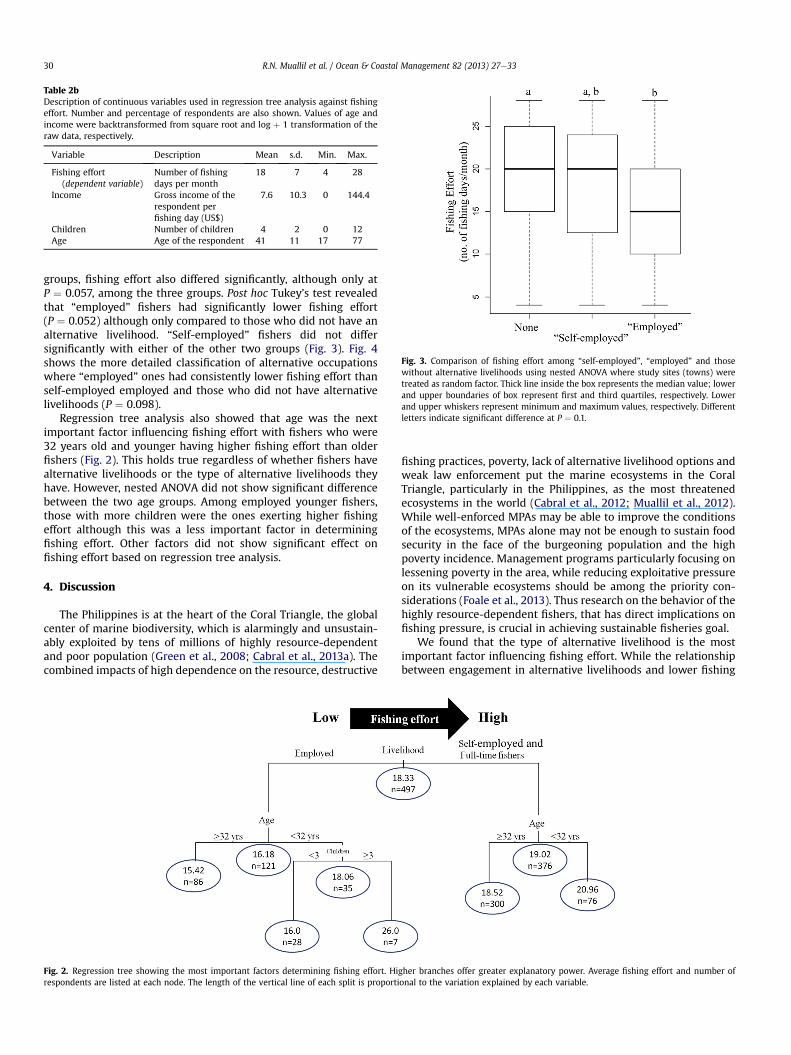
Table 2bDescription of continuous variables used in regression tree analysis against fishingeffort. Number and percentage of respondents are also shown. Values of age andincome were backtransformed from square root and log þ 1 transformation of theraw data, respectively.
Variable Description Mean s.d. Min. Max.
Fishing effort(dependent variable)
Number of fishingdays per month
18 7 4 28
Income Gross income of therespondent perfishing day (US$)
7.6 10.3 0 144.4
Children Number of children 4 2 0 12Age Age of the respondent 41 11 17 77
Fig. 3. Comparison of fishing effort among “self-employed”, “employed” and thosewithout alternative livelihoods using nested ANOVA where study sites (towns) weretreated as random factor. Thick line inside the box represents the median value; lowerand upper boundaries of box represent first and third quartiles, respectively. Lowerand upper whiskers represent minimum and maximum values, respectively. Differentletters indicate significant difference at P ¼ 0.1.
R.N. Muallil et al. / Ocean & Coastal Management 82 (2013) 27e3330
groups, fishing effort also differed significantly, although only atP ¼ 0.057, among the three groups. Post hoc Tukey’s test revealedthat “employed” fishers had significantly lower fishing effort(P ¼ 0.052) although only compared to those who did not have analternative livelihood. “Self-employed” fishers did not differsignificantly with either of the other two groups (Fig. 3). Fig. 4shows the more detailed classification of alternative occupationswhere “employed” ones had consistently lower fishing effort thanself-employed employed and those who did not have alternativelivelihoods (P ¼ 0.098).
Regression tree analysis also showed that age was the nextimportant factor influencing fishing effort with fishers who were32 years old and younger having higher fishing effort than olderfishers (Fig. 2). This holds true regardless of whether fishers havealternative livelihoods or the type of alternative livelihoods theyhave. However, nested ANOVA did not show significant differencebetween the two age groups. Among employed younger fishers,those with more children were the ones exerting higher fishingeffort although this was a less important factor in determiningfishing effort. Other factors did not show significant effect onfishing effort based on regression tree analysis.
4. Discussion
The Philippines is at the heart of the Coral Triangle, the globalcenter of marine biodiversity, which is alarmingly and unsustain-ably exploited by tens of millions of highly resource-dependentand poor population (Green et al., 2008; Cabral et al., 2013a). Thecombined impacts of high dependence on the resource, destructive
Fig. 2. Regression tree showing the most important factors determining fishing effort. Hirespondents are listed at each node. The length of the vertical line of each split is proporti
fishing practices, poverty, lack of alternative livelihood options andweak law enforcement put the marine ecosystems in the CoralTriangle, particularly in the Philippines, as the most threatenedecosystems in the world (Cabral et al., 2012; Muallil et al., 2012).While well-enforced MPAs may be able to improve the conditionsof the ecosystems, MPAs alone may not be enough to sustain foodsecurity in the face of the burgeoning population and the highpoverty incidence. Management programs particularly focusing onlessening poverty in the area, while reducing exploitative pressureon its vulnerable ecosystems should be among the priority con-siderations (Foale et al., 2013). Thus research on the behavior of thehighly resource-dependent fishers, that has direct implications onfishing pressure, is crucial in achieving sustainable fisheries goal.
We found that the type of alternative livelihood is the mostimportant factor influencing fishing effort. While the relationshipbetween engagement in alternative livelihoods and lower fishing
gher branches offer greater explanatory power. Average fishing effort and number ofonal to the variation explained by each variable.
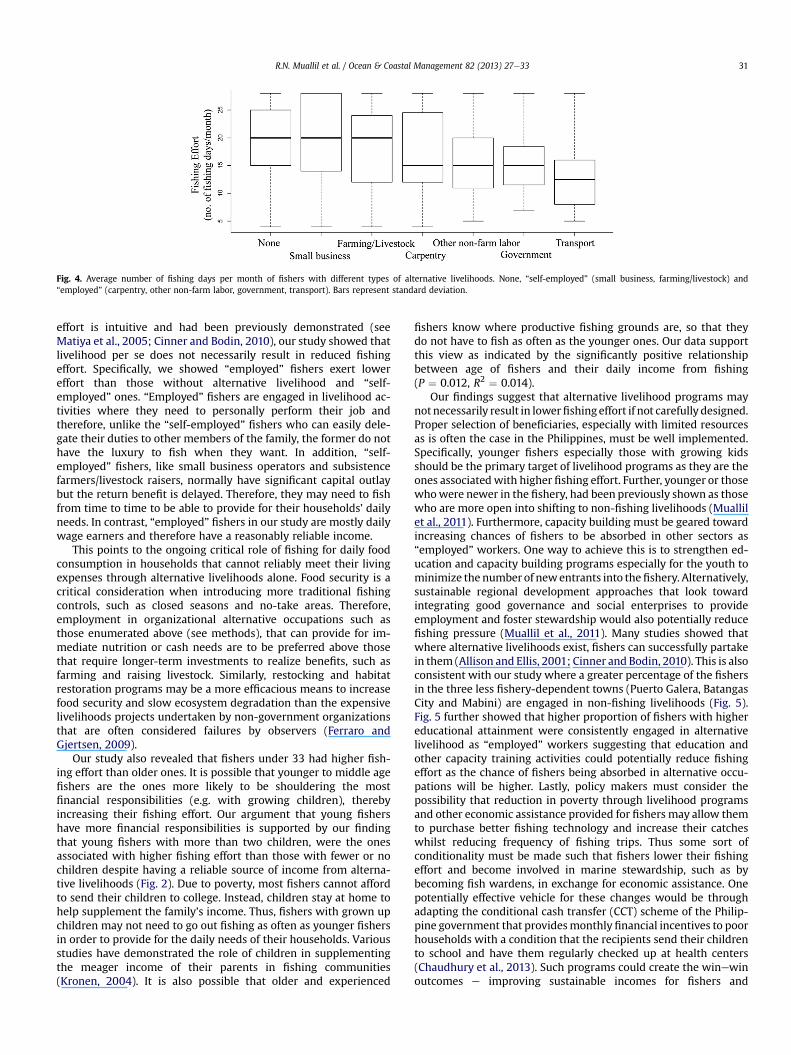
Fig. 4. Average number of fishing days per month of fishers with different types of alternative livelihoods. None, “self-employed” (small business, farming/livestock) and“employed” (carpentry, other non-farm labor, government, transport). Bars represent standard deviation.
R.N. Muallil et al. / Ocean & Coastal Management 82 (2013) 27e33 31
effort is intuitive and had been previously demonstrated (seeMatiya et al., 2005; Cinner and Bodin, 2010), our study showed thatlivelihood per se does not necessarily result in reduced fishingeffort. Specifically, we showed “employed” fishers exert lowereffort than those without alternative livelihood and “self-employed” ones. “Employed” fishers are engaged in livelihood ac-tivities where they need to personally perform their job andtherefore, unlike the “self-employed” fishers who can easily dele-gate their duties to other members of the family, the former do nothave the luxury to fish when they want. In addition, “self-employed” fishers, like small business operators and subsistencefarmers/livestock raisers, normally have significant capital outlaybut the return benefit is delayed. Therefore, they may need to fishfrom time to time to be able to provide for their households’ dailyneeds. In contrast, “employed” fishers in our study are mostly dailywage earners and therefore have a reasonably reliable income.
This points to the ongoing critical role of fishing for daily foodconsumption in households that cannot reliably meet their livingexpenses through alternative livelihoods alone. Food security is acritical consideration when introducing more traditional fishingcontrols, such as closed seasons and no-take areas. Therefore,employment in organizational alternative occupations such asthose enumerated above (see methods), that can provide for im-mediate nutrition or cash needs are to be preferred above thosethat require longer-term investments to realize benefits, such asfarming and raising livestock. Similarly, restocking and habitatrestoration programs may be a more efficacious means to increasefood security and slow ecosystem degradation than the expensivelivelihoods projects undertaken by non-government organizationsthat are often considered failures by observers (Ferraro andGjertsen, 2009).
Our study also revealed that fishers under 33 had higher fish-ing effort than older ones. It is possible that younger to middle agefishers are the ones more likely to be shouldering the mostfinancial responsibilities (e.g. with growing children), therebyincreasing their fishing effort. Our argument that young fishershave more financial responsibilities is supported by our findingthat young fishers with more than two children, were the onesassociated with higher fishing effort than those with fewer or nochildren despite having a reliable source of income from alterna-tive livelihoods (Fig. 2). Due to poverty, most fishers cannot affordto send their children to college. Instead, children stay at home tohelp supplement the family’s income. Thus, fishers with grown upchildren may not need to go out fishing as often as younger fishersin order to provide for the daily needs of their households. Variousstudies have demonstrated the role of children in supplementingthe meager income of their parents in fishing communities(Kronen, 2004). It is also possible that older and experienced
fishers know where productive fishing grounds are, so that theydo not have to fish as often as the younger ones. Our data supportthis view as indicated by the significantly positive relationshipbetween age of fishers and their daily income from fishing(P ¼ 0.012, R2 ¼ 0.014).
Our findings suggest that alternative livelihood programs maynotnecessarily result in lowerfishingeffort if not carefully designed.Proper selection of beneficiaries, especially with limited resourcesas is often the case in the Philippines, must be well implemented.Specifically, younger fishers especially those with growing kidsshould be the primary target of livelihood programs as they are theones associatedwith higher fishing effort. Further, younger or thosewhowere newer in the fishery, had been previously shown as thosewho are more open into shifting to non-fishing livelihoods (Muallilet al., 2011). Furthermore, capacity building must be geared towardincreasing chances of fishers to be absorbed in other sectors as“employed” workers. One way to achieve this is to strengthen ed-ucation and capacity building programs especially for the youth tominimize the number of newentrants into thefishery. Alternatively,sustainable regional development approaches that look towardintegrating good governance and social enterprises to provideemployment and foster stewardship would also potentially reducefishing pressure (Muallil et al., 2011). Many studies showed thatwhere alternative livelihoods exist, fishers can successfully partakein them (Allison and Ellis, 2001; Cinner and Bodin, 2010). This is alsoconsistent with our study where a greater percentage of the fishersin the three less fishery-dependent towns (Puerto Galera, BatangasCity and Mabini) are engaged in non-fishing livelihoods (Fig. 5).Fig. 5 further showed that higher proportion of fishers with highereducational attainment were consistently engaged in alternativelivelihood as “employed” workers suggesting that education andother capacity training activities could potentially reduce fishingeffort as the chance of fishers being absorbed in alternative occu-pations will be higher. Lastly, policy makers must consider thepossibility that reduction in poverty through livelihood programsand other economic assistance provided for fishers may allow themto purchase better fishing technology and increase their catcheswhilst reducing frequency of fishing trips. Thus some sort ofconditionality must be made such that fishers lower their fishingeffort and become involved in marine stewardship, such as bybecoming fish wardens, in exchange for economic assistance. Onepotentially effective vehicle for these changes would be throughadapting the conditional cash transfer (CCT) scheme of the Philip-pine government that providesmonthly financial incentives to poorhouseholds with a condition that the recipients send their childrento school and have them regularly checked up at health centers(Chaudhury et al., 2013). Such programs could create the winewinoutcomes e improving sustainable incomes for fishers and
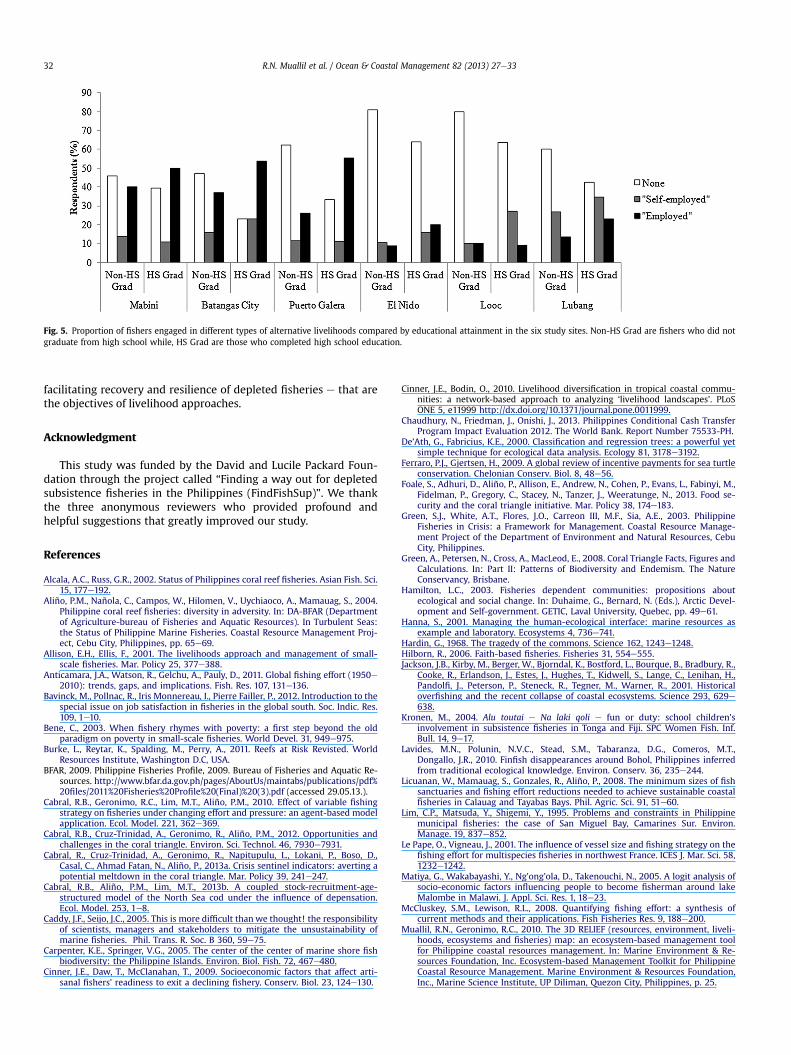
Fig. 5. Proportion of fishers engaged in different types of alternative livelihoods compared by educational attainment in the six study sites. Non-HS Grad are fishers who did notgraduate from high school while, HS Grad are those who completed high school education.
R.N. Muallil et al. / Ocean & Coastal Management 82 (2013) 27e3332
facilitating recovery and resilience of depleted fisheries e that arethe objectives of livelihood approaches.
Acknowledgment
This study was funded by the David and Lucile Packard Foun-dation through the project called “Finding a way out for depletedsubsistence fisheries in the Philippines (FindFishSup)”. We thankthe three anonymous reviewers who provided profound andhelpful suggestions that greatly improved our study.
References
Alcala, A.C., Russ, G.R., 2002. Status of Philippines coral reef fisheries. Asian Fish. Sci.15, 177e192.
Aliño, P.M., Nañola, C., Campos, W., Hilomen, V., Uychiaoco, A., Mamauag, S., 2004.Philippine coral reef fisheries: diversity in adversity. In: DA-BFAR (Departmentof Agriculture-bureau of Fisheries and Aquatic Resources). In Turbulent Seas:the Status of Philippine Marine Fisheries. Coastal Resource Management Proj-ect, Cebu City, Philippines, pp. 65e69.
Allison, E.H., Ellis, F., 2001. The livelihoods approach and management of small-scale fisheries. Mar. Policy 25, 377e388.
Anticamara, J.A., Watson, R., Gelchu, A., Pauly, D., 2011. Global fishing effort (1950e2010): trends, gaps, and implications. Fish. Res. 107, 131e136.
Bavinck, M., Pollnac, R., Iris Monnereau, I., Pierre Failler, P., 2012. Introduction to thespecial issue on job satisfaction in fisheries in the global south. Soc. Indic. Res.109, 1e10.
Bene, C., 2003. When fishery rhymes with poverty: a first step beyond the oldparadigm on poverty in small-scale fisheries. World Devel. 31, 949e975.
Burke, L., Reytar, K., Spalding, M., Perry, A., 2011. Reefs at Risk Revisted. WorldResources Institute, Washington D.C, USA.
BFAR, 2009. Philippine Fisheries Profile, 2009. Bureau of Fisheries and Aquatic Re-sources. http://www.bfar.da.gov.ph/pages/AboutUs/maintabs/publications/pdf%20files/2011%20Fisheries%20Profile%20(Final)%20(3).pdf (accessed 29.05.13.).
Cabral, R.B., Geronimo, R.C., Lim, M.T., Aliño, P.M., 2010. Effect of variable fishingstrategy on fisheries under changing effort and pressure: an agent-based modelapplication. Ecol. Model. 221, 362e369.
Cabral, R.B., Cruz-Trinidad, A., Geronimo, R., Aliño, P.M., 2012. Opportunities andchallenges in the coral triangle. Environ. Sci. Technol. 46, 7930e7931.
Cabral, R., Cruz-Trinidad, A., Geronimo, R., Napitupulu, L., Lokani, P., Boso, D.,Casal, C., Ahmad Fatan, N., Aliño, P., 2013a. Crisis sentinel indicators: averting apotential meltdown in the coral triangle. Mar. Policy 39, 241e247.
Cabral, R.B., Aliño, P.M., Lim, M.T., 2013b. A coupled stock-recruitment-age-structured model of the North Sea cod under the influence of depensation.Ecol. Model. 253, 1e8.
Caddy, J.F., Seijo, J.C., 2005. This is more difficult than we thought! the responsibilityof scientists, managers and stakeholders to mitigate the unsustainability ofmarine fisheries. Phil. Trans. R. Soc. B 360, 59e75.
Carpenter, K.E., Springer, V.G., 2005. The center of the center of marine shore fishbiodiversity: the Philippine Islands. Environ. Biol. Fish. 72, 467e480.
Cinner, J.E., Daw, T., McClanahan, T., 2009. Socioeconomic factors that affect arti-sanal fishers’ readiness to exit a declining fishery. Conserv. Biol. 23, 124e130.
Cinner, J.E., Bodin, O., 2010. Livelihood diversification in tropical coastal commu-nities: a network-based approach to analyzing ‘livelihood landscapes’. PLoSONE 5, e11999 http://dx.doi.org/10.1371/journal.pone.0011999.
Chaudhury, N., Friedman, J., Onishi, J., 2013. Philippines Conditional Cash TransferProgram Impact Evaluation 2012. The World Bank. Report Number 75533-PH.
De’Ath, G., Fabricius, K.E., 2000. Classification and regression trees: a powerful yetsimple technique for ecological data analysis. Ecology 81, 3178e3192.
Ferraro, P.J., Gjertsen, H., 2009. A global review of incentive payments for sea turtleconservation. Chelonian Conserv. Biol. 8, 48e56.
Foale, S., Adhuri, D., Aliño, P., Allison, E., Andrew, N., Cohen, P., Evans, L., Fabinyi, M.,Fidelman, P., Gregory, C., Stacey, N., Tanzer, J., Weeratunge, N., 2013. Food se-curity and the coral triangle initiative. Mar. Policy 38, 174e183.
Green, S.J., White, A.T., Flores, J.O., Carreon III, M.F., Sia, A.E., 2003. PhilippineFisheries in Crisis: a Framework for Management. Coastal Resource Manage-ment Project of the Department of Environment and Natural Resources, CebuCity, Philippines.
Green, A., Petersen, N., Cross, A., MacLeod, E., 2008. Coral Triangle Facts, Figures andCalculations. In: Part II: Patterns of Biodiversity and Endemism. The NatureConservancy, Brisbane.
Hamilton, L.C., 2003. Fisheries dependent communities: propositions aboutecological and social change. In: Duhaime, G., Bernard, N. (Eds.), Arctic Devel-opment and Self-government. GETIC, Laval University, Quebec, pp. 49e61.
Hanna, S., 2001. Managing the human-ecological interface: marine resources asexample and laboratory. Ecosystems 4, 736e741.
Hardin, G., 1968. The tragedy of the commons. Science 162, 1243e1248.Hilborn, R., 2006. Faith-based fisheries. Fisheries 31, 554e555.Jackson, J.B., Kirby, M., Berger, W., Bjorndal, K., Bostford, L., Bourque, B., Bradbury, R.,
Cooke, R., Erlandson, J., Estes, J., Hughes, T., Kidwell, S., Lange, C., Lenihan, H.,Pandolfi, J., Peterson, P., Steneck, R., Tegner, M., Warner, R., 2001. Historicaloverfishing and the recent collapse of coastal ecosystems. Science 293, 629e638.
Kronen, M., 2004. Alu toutai e Na laki qoli e fun or duty: school children’sinvolvement in subsistence fisheries in Tonga and Fiji. SPC Women Fish. Inf.Bull. 14, 9e17.
Lavides, M.N., Polunin, N.V.C., Stead, S.M., Tabaranza, D.G., Comeros, M.T.,Dongallo, J.R., 2010. Finfish disappearances around Bohol, Philippines inferredfrom traditional ecological knowledge. Environ. Conserv. 36, 235e244.
Licuanan, W., Mamauag, S., Gonzales, R., Aliño, P., 2008. The minimum sizes of fishsanctuaries and fishing effort reductions needed to achieve sustainable coastalfisheries in Calauag and Tayabas Bays. Phil. Agric. Sci. 91, 51e60.
Lim, C.P., Matsuda, Y., Shigemi, Y., 1995. Problems and constraints in Philippinemunicipal fisheries: the case of San Miguel Bay, Camarines Sur. Environ.Manage. 19, 837e852.
Le Pape, O., Vigneau, J., 2001. The influence of vessel size and fishing strategy on thefishing effort for multispecies fisheries in northwest France. ICES J. Mar. Sci. 58,1232e1242.
Matiya, G., Wakabayashi, Y., Ng’ong’ola, D., Takenouchi, N., 2005. A logit analysis ofsocio-economic factors influencing people to become fisherman around lakeMalombe in Malawi. J. Appl. Sci. Res. 1, 18e23.
McCluskey, S.M., Lewison, R.L., 2008. Quantifying fishing effort: a synthesis ofcurrent methods and their applications. Fish Fisheries Res. 9, 188e200.
Muallil, R.N., Geronimo, R.C., 2010. The 3D RELIEF (resources, environment, liveli-hoods, ecosystems and fisheries) map: an ecosystem-based management toolfor Philippine coastal resources management. In: Marine Environment & Re-sources Foundation, Inc. Ecosystem-based Management Toolkit for PhilippineCoastal Resource Management. Marine Environment & Resources Foundation,Inc., Marine Science Institute, UP Diliman, Quezon City, Philippines, p. 25.

R.N. Muallil et al. / Ocean & Coastal Management 82 (2013) 27e33 33
Muallil, R.N., Geronimo, R., Cleland, D., Cabral, R., Doctor, M., Cruz-Trinidad, A.,Aliño, P., 2011. Willingness to exit the artisanal fishery as a response to scenariosof declining catch or increasing monetary incentives. Fish. Res. 111, 74e81.
Muallil, R.N., Cabral, R., Mamauag, S., Aliño, P., 2012. Status, trend and sustainabilityof small-scale fisheries in the Philippines. In: Proceedings of the 12th Inter-national Coral Reef Symposium, Cairns, Australia, 9e13 July 2012, 13E Fisheries:General Section.
Nañola, C., Aliño, P., Carpenter, K., 2011. Exploitation-related reef fish species rich-ness depletion in the epicenter of marine biodiversity. Environ. Biol. Fish. 90,405e420.
Newton, K., Cote, I.M., Pilling, G.M., 2007. Current and future sustainability of islandcoral reef fisheries. Curr. Biol. 17, 655e658.
Pauly, D., Christensen, V., Guénette, S., Pitcher, T.J., Sumaila,U.R.,Walters, C.J.,Watson, R.,Zeller, D., 2002. Towards sustainability in world fisheries. Nature 418, 689e695.
Piet, G.J., Quirijns, F.J., Robinson, L., Greenstreet, S.P.R., 2007. Potential pressure in-dicators for fishing, and their data requirements. ICES J. Mar. Sci. 64, 110e121.
Pollnac, R., Pomeroy, R., Harkes, I., 2001. Fishery policy and job satisfaction in threeSoutheast Asian fisheries. Ocean Coast. Manage. 44, 532e544.
R Development Core Team, 2012. R: a Language and Environment for StatisticalComputing. R Foundation for Statistical Computing, Vienna, Austria, ISBN3-900051-07-0. URL: http://www.R-project.org/.
Sustainable Philippine Fisheries Agenda (SuPFA), 2006. Terminal Report.White, A.T., Vogt, H.P., 2000. Philippine coral reefs under threat: lessons after 25
years of community-based reef conservation. Mar. Poll. Bull. 40, 537e550.Worm, B., Barbier, E.B., Beaumont, N., Duffy, J.E., Folke, C., Halpern, B.S., Jackson, J.,
Lotze, H.K., Micheli, F., Palumbi, S.R., Sala, E., Selkoe, K.A., Stachowicz, J.,Watson, R., 2006. Impacts of biodiversity loss on ocean ecosystem services.Science 314, 787e790.
Worm, B., Hilborn, R., Baum, J., Branch, T., Collie, J., Costello, C., Fogarty, M.,Fulton, E., Hutchings, J., Jennings, S., Jensen, O., Lotze, H., Mace, P.,McClanahan, T., Minto, C., Palumbi, S., Parma, S., Richard, D., Rosenberg, A.,Watson, R., Zeller, D., 2009. Rebuilding global fisheries. Science 325, 578e585.