Tackling HIV-Related Stigma and Discrimination in South Asia
Upload
khangminh22Category
view
0download
0
Social Stigma as a Barrier to HIV Testing: Evidence from a
Randomized Experiment in Mozambique
Hang Yu*
December 1, 2019
[Click Here for the Most Updated Draft]
Abstract
Public health experts have seen the stigma as a leading barrier affecting the delivery of
HIV-related health care. By using a field experiment in Mozambique, this study identifies
the role of stigma concerns in hindering HIV testing and quantifies the stigma barrier. To
obtain local measures of the HIV stigma environment in the study sites, we conducted
a baseline survey one year before the experiment. Experiment participants with excessive
concerns, defined as overestimating the stigma in their communities, were randomly assigned
an intervention to relieve stigma concerns. The intervention, which drew upon findings from
the baseline survey, was designed to reveal the correct degree of stigma that a participant
had overestimated. Analyses show that this intervention raised the HIV test uptake rate by
7.7 percentage points (or by 37 percent) from 20.7 percent under the control condition. To
quantify the intervention effect, I introduced testing coupons of different values to estimate
the demand curve for an HIV test. The concern-relieving intervention raised an individual’s
willingness-to-pay for an HIV test by $1.30, or more than half of the daily cost-of-living in
the study population.
*Department of Economics, University of Michigan. Email: [email protected]. I am deeply indebted to myadvisors Dean Yang, Tanya Rosenblat, Hoyt Bleakley and Lauren Falcao Bergquist. Participants at Universityof Michigan Economic Development Seminar had provided invaluable comments. I thank the team of Health,Education, and Economic Interventions for Orphans and Vulnerable Children in Mozambique project for sharingresearch facilities. This project would not be possible without the excellent work of the research assistant team inMozambique led by Lessitala Consultoria e Servicos. I acknowledge funding from Rackham Graduate School andthe Jordan and Kim Dickstein African Initiative Fund at the Department of Economics, University of Michigan.The study is approved by the University of Michigan Health Sciences and Behavioral Sciences InstitutionalReview Board (HUM00113011) and National Committee on Bioethics for Health (CNBS), Ministry of Health ofMozambique, (IRB00002657) and registered with the AEA RCT Registry (AEARCTR-0004120).
1 Introduction
In 2013, the United Nations called for ninety percent of all people living with HIV to know
their status by 2020 in its 90-90-90 goal.1 A month shy of 2020, however, this goal will not
be met. In 2018, the last year for which data was collected, only 79 percent of the global
infected population knew their status. Insufficient status-awareness matters because it imposes
extraordinary challenges on public health authorities to prevent transmission and expand medical
treatment.
Crucial to overcoming this challenge is to raise the HIV testing rate, and especially in Sub-
Sahara Africa, which remains the world’s most HIV-affected region. Of the 37.9 million people
living with HIV, 25.6 million are from Sub-Sahara Africa. While global donors, through a decade-
plus of collaboration with local partners, have made HIV testing freely accessible in almost all of
Sub-Sahara Africa, a low test-uptake rate has substantially undermined this supply-side effort.2
Medical practitioners and community leaders often blame the stigma attached to HIV for the
low testing rate. Anecdotal evidence suggests that people have avoided HIV testing for fear of
being seen and stigmatized by their neighbors. Although public health scholars have documented
correlations between high degrees of stigma and low testing rates under various circumstances
(Sambisa, Curtis and Mishra, 2010; Berendes and Rimal, 2011; Maughan-Brown and Nyblade,
2014; Kelly, Weiser and Tsai, 2016) , there is a dearth of well-identified evidence on the causal
effect of stigma on HIV testing. Nor do we know how large an impact the stigma imposes on
an individual’s testing behavior. The main challenge to causal identification is that stigma, as
a parameter of society, is difficult to experimentally alter without altering confounding factors
at the same time.
My paper overcomes this challenge by employing an intervention that tackles concerns for
stigma at the individual level.3 I use a randomized control trial (RCT) in Mozambique for two
purposes: to identify the role stigma concerns play in hindering HIV testing and to quantify
the stigma barrier. To obtain local measures of the social stigma attached to HIV, we con-
ducted a baseline survey in the study communities one year before the RCT. Participants of the
1The three specific goals are: “By 2020, 90% of all people living with HIV will know their HIV status; 90% ofall people with diagnosed HIV infection will receive sustained antiretroviral therapy; 90% of all people receivingantiretroviral therapy will have viral suppression.”
2Data source: UNAIDS AIDS information program: http://aidsinfo.unaids.org3I follow the conceptual work of Goffman (1963) and define the stigma attached to HIV as the phenomenon that
people living with HIV are socially avoided. Accordingly, the concerns for the stigma are individuals’ concernsfor being avoided in social life because of their association with HIV. The stigma measures and interventions usedin this study strictly followed this definition.
Public health scholars have discussed the concept of the stigma attached to HIV more broadly (Parker andAggleton, 2003; Stangl, Brady and Fritz, 2012; Stangl et al., 2013). According to previous conceptual work, thebroad concept of stigma has manifestations beyond social avoidance, such as internal stigma (feel ashamed ofoneself) and enacted discrimination (be assaulted or treated unfairly by others). My study adopted a narrowerworking definition of stigma to allow for rigorous quantitative analyses. Social avoidance is the core manifestationof all stigmas and can be measured in my study setting. The rise of social avoidance is not the focus of this study;it could stem from the moral judgment on the infected person or people’s excessive concerns for infection. SeeStangl, Brady and Fritz (2012) and Stangl et al. (2013) for reviews.
1
RCT estimated the degree of stigma in their community before entering a randomization pro-
cess. Those with excessive stigma concerns, i.e., overestimated stigma in their community, were
randomly assigned to receive an intervention to alleviate concerns. The concern-relieving inter-
vention, which was individually tailored, revealed the true degree of stigma that a participant
had overestimated. We then tracked test-seeking behavior.
I find that the concern-relieving intervention raised the participants’ test uptake rate by 7.7
percentage points, or by 37%, from 20.7 percent under the control condition. This experiment
provides clear evidence that the stigma concerns for stigma are a barrier that has caused people
to avoid taking HIV tests.
To quantify the stigma barrier, I introduce different levels of monetary incentives for HIV
testing. The testing service in Mozambique is free and anonymous. To track individuals’ test-
seeking behavior, I offered all study participants coupons (a conditional cash transfer) to take
tests. The Control Group and the Concern-Relieving Intervention Group received coupons of 50
Meticais (2.25 dollars by PPP), which was equivalent to the daily cost-of-living. An additional
study group, the High-Incentive Group, was introduced in parallel, where participants received
no intervention but coupons of 100 Meticais. The Control Group and the High-Incentive Group
locally pin down the demand curve for an HIV test. On the demand diagram, relieving stigma
concerns raised individuals’ willingness to pay (WTP) for an HIV test by 29 Meticais (1.30
dollars by PPP).
My paper contributes to the literature on understanding HIV testing behavior in developing
countries. While many studies in this literature have focused on exploring practical interventions
to promote HIV testing, they have often paid less attention to investigating the mechanisms or
identifying a specific barrier inhibiting HIV testing. For example, researchers have found that
financial incentives and home-base testing delivery could raise the testing rate (Swann, 2018;
Moshoeu et al., 2019), and have argued that alleviating stigma was a working channel. Never-
theless, as both interventions addressed multiple potential barriers at the same time,4 we still
do not know which barriers prevent individuals from seeking a test or the best ways to overcome
these barriers. A recent effort to identify the barrier of stigma concerns is Derksen and van
Oosterhout (2019). They found that disseminating educational messages in a community raised
the HIV testing rate and argued that reducing the residents’ stigma concerns was the mecha-
nism. The stigma’s role in their study, however, was not directly supported by experimental
evidence.5 Confounding mechanisms could still drive the effect, such as people inferring higher
4Providing financial incentives and delivering home-based testing services may both address several barriers atthe same time: monetary cost, by compensating or avoiding transportation fees and loss of time; procrastination,by offering instant incentives for testing or reducing cost; stigma concerns, by concealing the intrinsic motivationto learn one’s status or avoid being seen by others (Thornton, 2008; Feyissa, Lockwood and Munn, 2015; Swann,2018; Moshoeu et al., 2019).
5Derksen and van Oosterhout (2019) argued with suggestive evidence that their informational interven-tion—health education meetings disseminating the effectiveness of the HIV treatment in preventing transmis-sion—made people think that their community became more aware that HIV positive persons on medication havea low chance of transmitting HIV. Hence, people in their intervention group had fewer concerns for “statisticaldiscrimination” by potential sex partners, and, as a result, sought more tests.
2
medication effectiveness or acting altruistically. The lack of knowledge on specific barriers ob-
structs us from learning the underlining motivations behind human behavior and prevents us
from designing cost-effective interventions to fight HIV.
In contrast to the existing studies, my experimental intervention directly and solely manip-
ulates an individual’s stigma concerns. Any observed effect on the testing rate can be traced
back to relieved stigma concerns. The clear-cut design allows me to establish the causal effect
of the stigma concerns on testing and to quantify its impact.
My study also contributes to the literature on the role of stigma in socio-economic life.
Stigmas widely exist in human society and increasingly attract economists’ attention. Some
earlier work theoretically analyzed the rise and implications of stigma related to social welfare
receipt and divorce (Moffitt, 1983; Besley and Coate, 1992; Ishida, 2003). A strand of empirical
literature studied how stigma concerns affect individuals’ decisions to claim welfare and reached
mixed conclusions (Bhargava and Manoli, 2015; Friedrichsen, Konig and Schmacker, 2018).
The stigma is especially widespread in the realm of public health. Many health conditions
are stigmatized (Puhl and Heuer, 2009; Bharadwaj, Pai and Suziedelyte, 2017), HIV infection
being a common and policy-relevant example. Hoffmann, Fooks and Messer (2014) documented
evidence of the stigma attached to HIV: The general population tended to avoid objects touched
by people living with HIV. In my study, I take a step further to show that stigma concerns can
cause behavioral changes in the vulnerable population and lead to real health and economic
consequences.
In addition, my work relates to the literature on how misperceived social parameters affect
human behavior (Jensen, 2010; Cruces, Perez-Truglia and Tetaz, 2013; Armona, Fuster and Za-
far, 2018). The intervention tool I use is built on a type of “norm-based interventions,” which
alter people’s perceptions of certain social norms by revealing summary statistics of behavior in a
reference group (Benabou and Tirole, 2011). Researchers have used “norm-based interventions”
to study individuals’ reactions to learning social norms in energy consumption (Schultz et al.,
2007), female labor force participation (Bursztyn, Gonzalez and Yanagizawa-Drott, 2018), and
attitudes toward healthy sexual relationships (Banerjee, Ferrara and Orozco-Olvera, 2019). The
study setting of Banerjee, Ferrara and Orozco-Olvera (2019) was the closest to mine. In their
experiment, young participants in Nigeria first viewed an entertainment-education TV series
promoting healthy sexual relationships and then reported their attitudes towards the TV con-
tents. The treatment group was informed of their peer’s average post-view attitudes before they
reported their own. The authors did not find that the intervention of revealing peer’s attitudes
affected participants’ attitudes.
Unlike previous studies, my intervention identifies new parameters beyond the effect of social
norms. I use social opinion statistics as a tool to mitigate a psychological barrier, i.e., the stigma
concerns. The outcome of interest, taking up an HIV test, is a behavior differing from the
one in which I reveal summary statistics. My paper shows how social opinions collected from
3
hypothetical questions can affect the decision on behavior of high stakes. Moreover, I combine
the norm-based intervention with varying financial incentives to quantify the intervention effect.
2 Background
2.1 The HIV Epidemic and Testing Services in Mozambique
HIV prevalence in Mozambique reached 12.6% among adults in 2018, making it one of the
countries most affected by the epidemic. Mozambique has fallen behind the United Nations’
90-90-90 goal in each step of the HIV treatment cascade. Only 72% of all people living with
HIV in Mozambique know their status. This low awareness has become a major obstacle for HIV
treatment and prevention. In 2018, there were 150,000 new HIV infections and 54,000 AIDS-
related death in Mozambique, accounting for one-twelfth and one-fourteenth, respectively, of the
global totals.6
Mozambique built up its nationwide standardized HIV-testing (formally known as Health
Counseling and Testing) service system following WHO guidelines. Beginning in 2008, the
Mozambican government integrated HIV-related services into other clinical services in sanitary
units (US) in communities. HIV-related services and materials are free of charge in all US’s.
In 2017, Mozambique conducted 7,866,465 HIV tests. (The ratio of the number of tests
to population is 0.273.) The majority, or 80.2%, of the tests were conducted through the
provider-initiated counseling and testing (Portuguese abbreviation ATIP) approach, where doc-
tors referred patients with symptoms of infections to take tests for HIV. The ATIP approach is
typically only able to catch HIV infections late in the progress when the virus may already have
transmitted to others, and the patient has missed the best window to initiate medical treat-
ment. Only 12.7% of HIV tests were initiated by general residents who voluntarily sought to
learn their status in a sanitary unit (formally known as the user-initiated counseling and testing
approach, Portuguese abbreviation ATIU).7 In a high HIV-prevalence region like Mozambique,
encouraging the general population to learn its status before any sign is shown is essential for
preventing transmission and improving treatment efficacy. In this study, we collaborated with
the local sanitary units, where we refer eligible participants to take HIV tests through the ATIU
approach and track their testing behavior.
2.2 Study Population
My research experiment is embedded in a broader evaluation study of the anti-poverty program
Forca a Comunidade e Criancas (FCC, “Strengthening Communities and Children”) in Mozam-
bique.8 Our research team conducted a household survey, hereafter the baseline survey, between
6Data source: UNAIDS (2019).7Data source: “Annual report on activities related to HIV/AIDS 2017” National Healthcare Service, Mozam-
bican Ministry of Health (Portuguese: Relatorio Anual 2017 Relatorio Anual das Actividades Relacionadas aoHIV/SIDA).
8See Yang et al. (2019) for an extensive discussion of the FCC program.
4
May 2017 and March 2018 in 76 communities across three provinces in central Mozambique.
The baseline survey covered a population-representative sample in each study community and
collected rich information about household members’ health, education, knowledge about HIV,
and social opinions. The experiment analyzed in this paper was conducted on an economically
disadvantaged subset of the baseline survey sample. 71.6% of the baseline households are cat-
egorized as “vulnerable” according to a list of pre-specified criteria, and they constituted the
pool of potential participants for this experiment.9
2.3 Measures of the Stigma Environment
We constructed three measures of stigma environment within each community by summarizing
the baseline survey responses to each of the following questions.
Q1. Would you buy fresh vegetables from a shopkeeper if you knew that this person hadHIV? (Yes/No)
Q2. If a member of your family became sick with AIDS, would you be willing to care forthem in your own household? (Yes/No)
Q3. In your opinion, if a teacher has HIV but is not sick, should they be allowed tocontinue teaching at school? (Yes/No)
The questions assess an individuals’ tendency to avoid people living with HIV (stigmatize
HIV); an affirmative answer indicates a supportive attitude, while a negative answer indicates
stigmatization. A higher fraction of affirmative responses from a community indicates a local
environment with less stigma.
The major takeaway from the baseline environment assessment is that the fraction of respon-
dents giving affirmative answers was high across all communities, indicating low social stigma
attached to HIV. In an average community, the fractions of respondents giving an affirmative
answer to the three questions were 80.1%, 93.2%, and 89.2%, respectively. The variation across
communities is moderate, and except for Q1 in three communities, the supportive fractions
are always higher than 60%.10 The three community-level stigma measures are used in the
experimental intervention discussed later to mitigate participants’ concerns for stigma.
The worldwide panel AIDS Indicator Survey (AIS) has used the same three questions to
monitor HIV-related stigmas. The low stigma finding from the baselines survey is consistent
with the findings from the AIS panel in Mozambique. The four rounds of AIS between 2003
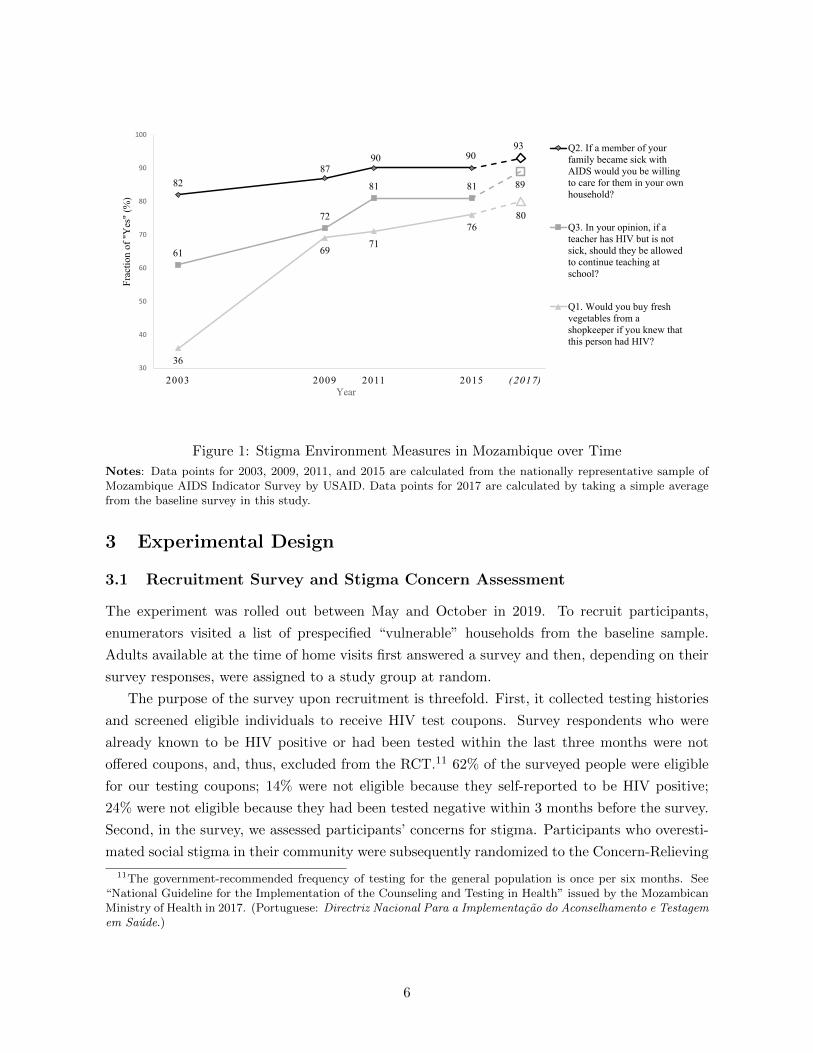
and 2015 show a trend of rapidly lowing stigma associated with HIV in Mozambique. Figure 1
presents the four rounds of AIS and our baseline sample together.
9We assessed a household’s vulnerability in 11 dimensions that covered income, food security, adult-to-childratio, and health conditions. Please see Appendix A3 for details. Since the baseline survey sample is population-representative, the participant pool can be considered the bottom 71.6% of Mozambique’s population in theeconomic well-being distribution. As a comparison, the poverty headcount ratios at $1.90 (2011 dollar) a day and$3.20 (2011 dollar) a day are 62.4% and 81.5% of the country’s population, respectively. Hence, people in myparticipant pool roughly lived on $1.90 to $3.20 a day. Data source: World Bank Data.
10See Appendix A4 for the three measures in each study community.
5
82
8790 90
93
61
72
81 81 89
36
6971
76
80
30
40
50
60
70
80
90
100
2003 2009 2011 2015 (2017 )
Fraction of
"Yes
" (%
)
Year
Q2. If a member of your
family became sick with
AIDS would you be willing
to care for them in your own
household?
Q3. In your opinion, if a
teacher has HIV but is not
sick, should they be allowed
to continue teaching at
school?
Q1. Would you buy fresh
vegetables from a
shopkeeper if you knew that
this person had HIV?
Figure 1: Stigma Environment Measures in Mozambique over Time
Notes: Data points for 2003, 2009, 2011, and 2015 are calculated from the nationally representative sample ofMozambique AIDS Indicator Survey by USAID. Data points for 2017 are calculated by taking a simple averagefrom the baseline survey in this study.
3 Experimental Design
3.1 Recruitment Survey and Stigma Concern Assessment
The experiment was rolled out between May and October in 2019. To recruit participants,
enumerators visited a list of prespecified “vulnerable” households from the baseline sample.
Adults available at the time of home visits first answered a survey and then, depending on their
survey responses, were assigned to a study group at random.
The purpose of the survey upon recruitment is threefold. First, it collected testing histories
and screened eligible individuals to receive HIV test coupons. Survey respondents who were
already known to be HIV positive or had been tested within the last three months were not
offered coupons, and, thus, excluded from the RCT.11 62% of the surveyed people were eligible
for our testing coupons; 14% were not eligible because they self-reported to be HIV positive;
24% were not eligible because they had been tested negative within 3 months before the survey.
Second, in the survey, we assessed participants’ concerns for stigma. Participants who overesti-
mated social stigma in their community were subsequently randomized to the Concern-Relieving
11The government-recommended frequency of testing for the general population is once per six months. See“National Guideline for the Implementation of the Counseling and Testing in Health” issued by the MozambicanMinistry of Health in 2017. (Portuguese: Directriz Nacional Para a Implementacao do Aconselhamento e Testagemem Saude.)
6
Intervention Group or the Control Group. Lastly, the recruitment survey collected a rich set of
pre-intervention characteristics of the participants.
During the recruitment survey, we assessed each respondent’s concerns for the stigma at-
tached to HIV before randomly assigning them to different experiment conditions. The baseline
survey delivered the encouraging news of a low stigma environment; however, people may lack
accurate knowledge about the environment in which they live. In fact, it is not the true stigma
environment, but people’s beliefs about the stigma environment that concerns them and may
affect their test-seeking decision.
In the recruitment survey, we ask participants to report their beliefs about the three stigma
measures of their community:
EQ1. If I ask the question, “Would you buy fresh vegetables from a shopkeeper if you knewthat this person had HIV?” to 10 people in your neighborhood, how many of themwould you expect, to say “Yes”?
EQ2. If I ask the question, “If a member of your family became sick with AIDS, wouldyou be willing to care for them in your own household?” to 10 people in yourneighborhood, how many of them would you expect, to say “Yes”?
EQ3. If I ask the question, “In your opinion, if a teacher has HIV but is not sick, shouldthey be allowed to continue teaching at school?” to 10 people in your neighborhood,how many of them would you expect, to say “Yes”?
If a belief is lower than the corresponding truth in her community, then this participant
has overestimated stigma in this measure. For example, if in the baseline survey, 90% of the
respondents in a community said “yes” when asked if they would buy fresh vegetables from a
shopkeeper whom they knew to have HIV, but a participant believed that only 70% of people in
her community would have said “yes” to the question, then this participant had overestimated
stigma in her community.
Table 1 summarizes participants’ beliefs in the recruitment survey and compares them with
statistics from the baseline. The coupon-eligible sample, on average, believed that 70.2%, 77.5%,
and 81.4% of their neighbors would give affirmative answers to the three stigma-measuring
questions. These numbers are significantly lower than the fractions collected from the baseline.
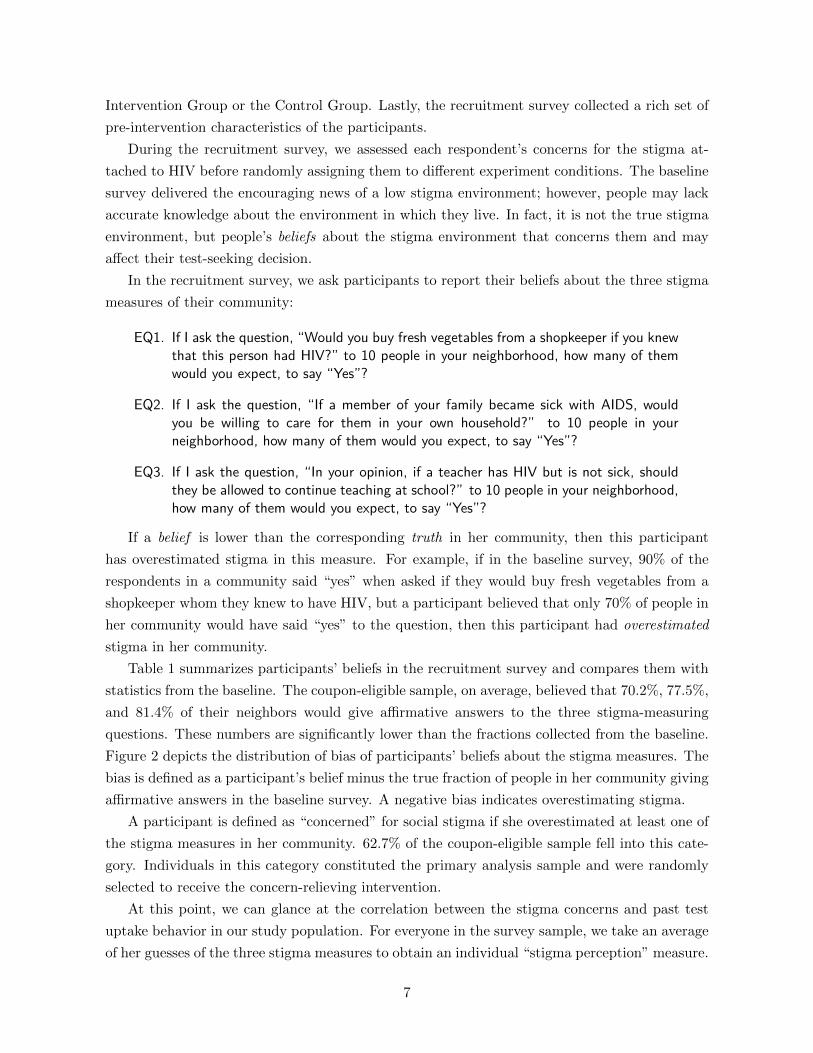
Figure 2 depicts the distribution of bias of participants’ beliefs about the stigma measures. The
bias is defined as a participant’s belief minus the true fraction of people in her community giving
affirmative answers in the baseline survey. A negative bias indicates overestimating stigma.
A participant is defined as “concerned” for social stigma if she overestimated at least one of
the stigma measures in her community. 62.7% of the coupon-eligible sample fell into this cate-
gory. Individuals in this category constituted the primary analysis sample and were randomly
selected to receive the concern-relieving intervention.
At this point, we can glance at the correlation between the stigma concerns and past test
uptake behavior in our study population. For everyone in the survey sample, we take an average
of her guesses of the three stigma measures to obtain an individual “stigma perception” measure.
7
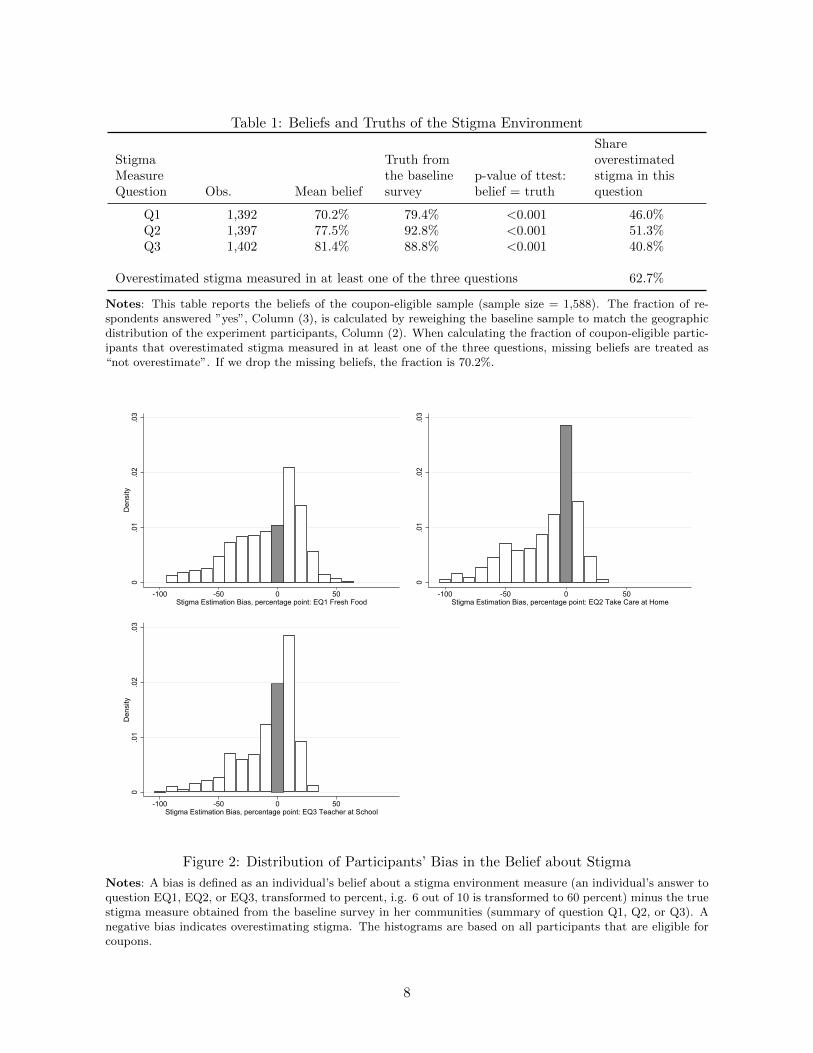
Table 1: Beliefs and Truths of the Stigma Environment
StigmaMeasureQuestion Obs. Mean belief
Truth fromthe baselinesurvey
p-value of ttest:belief = truth
Shareoverestimatedstigma in thisquestion
Q1 1,392 70.2% 79.4% <0.001 46.0%Q2 1,397 77.5% 92.8% <0.001 51.3%Q3 1,402 81.4% 88.8% <0.001 40.8%
Overestimated stigma measured in at least one of the three questions 62.7%
Notes: This table reports the beliefs of the coupon-eligible sample (sample size = 1,588). The fraction of re-spondents answered ”yes”, Column (3), is calculated by reweighing the baseline sample to match the geographicdistribution of the experiment participants, Column (2). When calculating the fraction of coupon-eligible partic-ipants that overestimated stigma measured in at least one of the three questions, missing beliefs are treated as“not overestimate”. If we drop the missing beliefs, the fraction is 70.2%.
0.0
1.0
2.0
3D
ensi
ty
-100 -50 0 50Stigma Estimation Bias, percentage point: EQ1 Fresh Food
0.0
1.0
2.0
3
-100 -50 0 50Stigma Estimation Bias, percentage point: EQ2 Take Care at Home
0.0
1.0
2.0
3D
ensi
ty
-100 -50 0 50Stigma Estimation Bias, percentage point: EQ3 Teacher at School
Figure 2: Distribution of Participants’ Bias in the Belief about Stigma
Notes: A bias is defined as an individual’s belief about a stigma environment measure (an individual’s answer toquestion EQ1, EQ2, or EQ3, transformed to percent, i.g. 6 out of 10 is transformed to 60 percent) minus the truestigma measure obtained from the baseline survey in her communities (summary of question Q1, Q2, or Q3). Anegative bias indicates overestimating stigma. The histograms are based on all participants that are eligible forcoupons.
8

Figure 3 divides survey respondents to quintiles by their beliefs about stigma measure and
depicts the self-reported testing rate (the fraction of people ever tested for HIV) of each quintile.
Those with fewer stigma concerns (i.e., those who guessed a high fraction of people giving
affirmative answers to Q1 to Q3) are in quintile 1 while the most concerned people are in
quintile 5. Quintile 1 has a significantly higher testing rate compared to other quintiles. The
pattern in Figure 3 echoes previous findings that greater concerns for stigma are associated with
a lower HIV testing rate, but causality remains unknown. This association could come from a
hidden third factor that caused high stigma concerns and fewer test uptakes at the same time
or derive from the inverse causal channel that learning one’s HIV status leads to lower stigma
concerns. To rule out these hypotheses, we introduced the concern-relieving intervention to
experimentally mitigate the stigma concerns of a random subset of participants.
.65
.7.7
5.8
.85
1st q
uintile
2nd q
uintile
3rd qu
intile
4th qu
intile
5th qu
intile
Figure 3: HIV Testing Rate by Belief about Stigma
Notes: The y-axis is the fraction of recruitment survey respondents self-reported to had ever tested for HIV.The x-axis is the quintile groups of the belief about local stigma measures. An individual’s belief is the averageof her answers to question EQ1, EQ2, and EQ3, a higher average indicates that this person perceived less stigma.Individuals are ordered by their beliefs, with those who perceived the least stigma on the left and those perceivedthe most stigma on the right. The first quintile group includes the left-most 20 percent, and so on.
9
3.2 The Concern-Relieving Intervention
This intervention shares the measures of stigma environment from the baseline survey with the
participants. To protect human subjects, the information sharing is asymmetric – a true measure
was revealed to a participant only when she “overestimated” stigma in that measure, but not
when she correctly estimated or underestimated it.
One-third of the “concerned” participants received the concern-relieving intervention by ran-
dom selection. The intervention was administered after the recruitment survey. The enumerator
revealed measure(s) of the stigma environment that the participant had overestimated and ex-
plained the implications. As an example, a piece of the enumerator’s scripts for the interventions
goes as follows:
I’d like to share with you some information we collected from your neighborhood.Recall that a few minutes ago, I asked you to guess, out of 10 people, how many ofthem would have answered “yes” to the following question:
“Would you buy fresh vegetables from a shopkeeper if you knew that this person hadHIV?”.
Your guess was [6 out of 10] people would answer “yes.”
In fact, we did ask a large number of people this question last year in your neighbor-hood. The fact is [more than 9 out of 10 people (or 91.5%)] answered “yes.” Peoplein your community are more acceptive of people infected with HIV than you thoughtthey would be.
The intervention shared one to three pieces of such information depending on the number of
overestimates a participant made in the concern-assessing process.
3.3 Coupon Distribution
The primary outcome of interest is the HIV test uptake. In Mozambique, HIV tests are voluntary
and anonymous. We adopted coupons to track participants’ test-seeking behavior. HIV testing
is free of charge at the local clinics. Hence, a coupon should be considered a conditional cash
transfer. After a participant completed the survey and the concern-relieving intervention (when
applicable), the enumerator distributed a testing coupon to each participant who was not already
known to be HIV positive and had not been tested within the last three months.
We varied the value of the coupons to pin down the effect of monetary incentives on testing.
A regular-value coupon was worth 50 Meticais (2.25 dollars by PPP), and a high-value coupon
was worth 100 Meticais. As discussed in the previous section, the study population roughly
matches the population in absolute poverty in Mozambique who lived on $1.90 to $3.20 (2011
dollars) a day. A low-value coupon had the value of an average participant’s daily cost-of-living.
In addition to one coupon for each adult participant, we also distributed coupons of the same
value for each of the participant’s eligible children. A child followed the same eligibility criteria
for a coupon as an adult. The enumerator informed the participant that a coupon should only
10
be used by the designated person (the adult coupon for the participant himself or herself and
the child coupons for any eligible children). For the participant’s convenience, coupons for an
adult male, adult female, and a child were of different designs.
At the time of distributing coupons, we also informed the participants of the typical time
costs of testing in the local sanitary units, and the method of payment for coupon redemption.
To avoid any pressure or concerns for confidentiality loss, we confirmed that at the time of
coupon redemption, the study team would not collect any individually identifiable information
or ask for their test results.
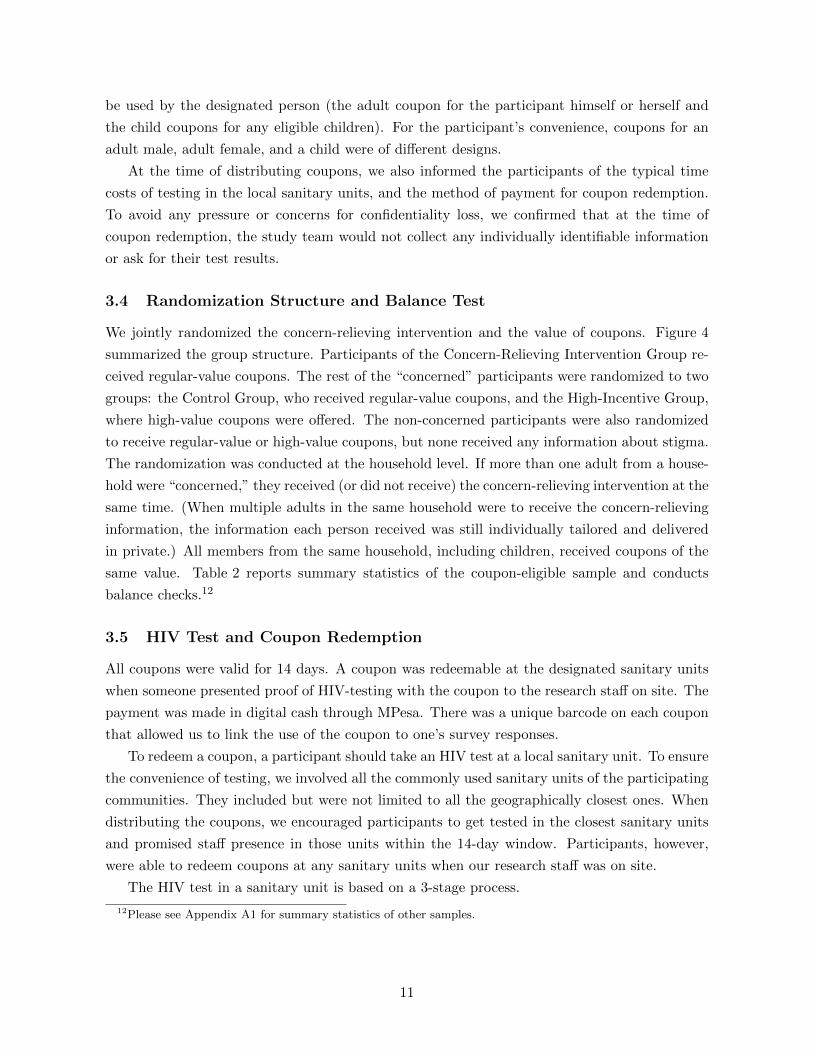
3.4 Randomization Structure and Balance Test
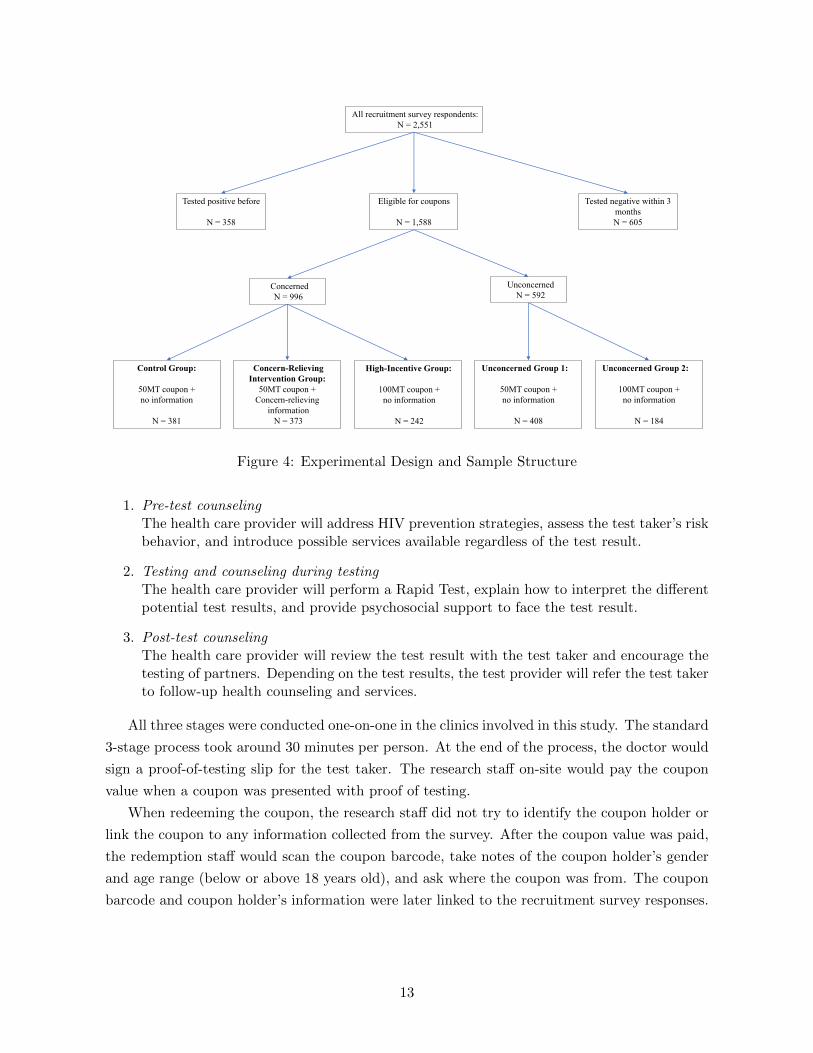
We jointly randomized the concern-relieving intervention and the value of coupons. Figure 4
summarized the group structure. Participants of the Concern-Relieving Intervention Group re-
ceived regular-value coupons. The rest of the “concerned” participants were randomized to two
groups: the Control Group, who received regular-value coupons, and the High-Incentive Group,
where high-value coupons were offered. The non-concerned participants were also randomized
to receive regular-value or high-value coupons, but none received any information about stigma.
The randomization was conducted at the household level. If more than one adult from a house-
hold were “concerned,” they received (or did not receive) the concern-relieving intervention at the
same time. (When multiple adults in the same household were to receive the concern-relieving
information, the information each person received was still individually tailored and delivered
in private.) All members from the same household, including children, received coupons of the
same value. Table 2 reports summary statistics of the coupon-eligible sample and conducts
balance checks.12
3.5 HIV Test and Coupon Redemption
All coupons were valid for 14 days. A coupon was redeemable at the designated sanitary units
when someone presented proof of HIV-testing with the coupon to the research staff on site. The
payment was made in digital cash through MPesa. There was a unique barcode on each coupon
that allowed us to link the use of the coupon to one’s survey responses.
To redeem a coupon, a participant should take an HIV test at a local sanitary unit. To ensure
the convenience of testing, we involved all the commonly used sanitary units of the participating
communities. They included but were not limited to all the geographically closest ones. When
distributing the coupons, we encouraged participants to get tested in the closest sanitary units
and promised staff presence in those units within the 14-day window. Participants, however,
were able to redeem coupons at any sanitary units when our research staff was on site.
The HIV test in a sanitary unit is based on a 3-stage process.
12Please see Appendix A1 for summary statistics of other samples.
11
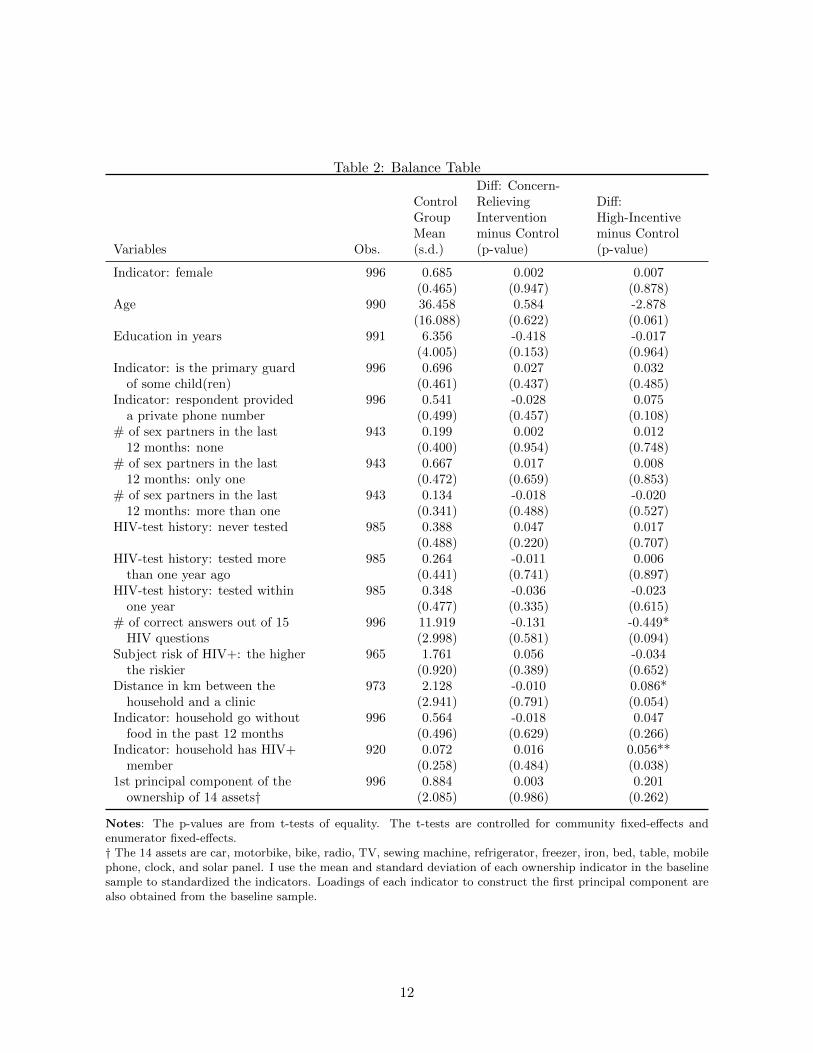
Table 2: Balance Table
Variables Obs.
ControlGroupMean(s.d.)
Diff: Concern-RelievingInterventionminus Control(p-value)
Diff:High-Incentiveminus Control(p-value)
Indicator: female 996 0.685 0.002 0.007(0.465) (0.947) (0.878)
Age 990 36.458 0.584 -2.878(16.088) (0.622) (0.061)
Education in years 991 6.356 -0.418 -0.017(4.005) (0.153) (0.964)
Indicator: is the primary guard 996 0.696 0.027 0.032of some child(ren) (0.461) (0.437) (0.485)
Indicator: respondent provided 996 0.541 -0.028 0.075a private phone number (0.499) (0.457) (0.108)
# of sex partners in the last 943 0.199 0.002 0.01212 months: none (0.400) (0.954) (0.748)
# of sex partners in the last 943 0.667 0.017 0.00812 months: only one (0.472) (0.659) (0.853)
# of sex partners in the last 943 0.134 -0.018 -0.02012 months: more than one (0.341) (0.488) (0.527)
HIV-test history: never tested 985 0.388 0.047 0.017(0.488) (0.220) (0.707)
HIV-test history: tested more 985 0.264 -0.011 0.006than one year ago (0.441) (0.741) (0.897)
HIV-test history: tested within 985 0.348 -0.036 -0.023one year (0.477) (0.335) (0.615)
# of correct answers out of 15 996 11.919 -0.131 -0.449*HIV questions (2.998) (0.581) (0.094)
Subject risk of HIV+: the higher 965 1.761 0.056 -0.034the riskier (0.920) (0.389) (0.652)
Distance in km between the 973 2.128 -0.010 0.086*household and a clinic (2.941) (0.791) (0.054)
Indicator: household go without 996 0.564 -0.018 0.047food in the past 12 months (0.496) (0.629) (0.266)
Indicator: household has HIV+ 920 0.072 0.016 0.056**member (0.258) (0.484) (0.038)
1st principal component of the 996 0.884 0.003 0.201ownership of 14 assets† (2.085) (0.986) (0.262)
Notes: The p-values are from t-tests of equality. The t-tests are controlled for community fixed-effects andenumerator fixed-effects.† The 14 assets are car, motorbike, bike, radio, TV, sewing machine, refrigerator, freezer, iron, bed, table, mobilephone, clock, and solar panel. I use the mean and standard deviation of each ownership indicator in the baselinesample to standardized the indicators. Loadings of each indicator to construct the first principal component arealso obtained from the baseline sample.
12
All recruitment survey respondents:
N = 2,551
Eligible for coupons
N = 1,588
Tested negative within 3
months
N = 605
Tested positive before
N = 358
Concerned N = 996
Unconcerned N = 592
Control Group:
50MT coupon +
no information
N = 381
Concern-Relieving
Intervention Group: 50MT coupon +
Concern-relieving
information
N = 373
High-Incentive Group:
100MT coupon +
no information
N = 242
Unconcerned Group 1:
50MT coupon +
no information
N = 408
Unconcerned Group 2:
100MT coupon +
no information
N = 184
Figure 4: Experimental Design and Sample Structure
1. Pre-test counselingThe health care provider will address HIV prevention strategies, assess the test taker’s riskbehavior, and introduce possible services available regardless of the test result.
2. Testing and counseling during testingThe health care provider will perform a Rapid Test, explain how to interpret the differentpotential test results, and provide psychosocial support to face the test result.
3. Post-test counselingThe health care provider will review the test result with the test taker and encourage thetesting of partners. Depending on the test results, the test provider will refer the test takerto follow-up health counseling and services.
All three stages were conducted one-on-one in the clinics involved in this study. The standard
3-stage process took around 30 minutes per person. At the end of the process, the doctor would
sign a proof-of-testing slip for the test taker. The research staff on-site would pay the coupon
value when a coupon was presented with proof of testing.
When redeeming the coupon, the research staff did not try to identify the coupon holder or
link the coupon to any information collected from the survey. After the coupon value was paid,
the redemption staff would scan the coupon barcode, take notes of the coupon holder’s gender
and age range (below or above 18 years old), and ask where the coupon was from. The coupon
barcode and coupon holder’s information were later linked to the recruitment survey responses.
13
4 Experimental Results
4.1 Main Result - Test Uptake
Comparing the test uptake rate of the Control Group and the Concern-Relieving Intervention
Group identifies the intervention effect, which in turn reveals the role of stigma concerns on
testing.
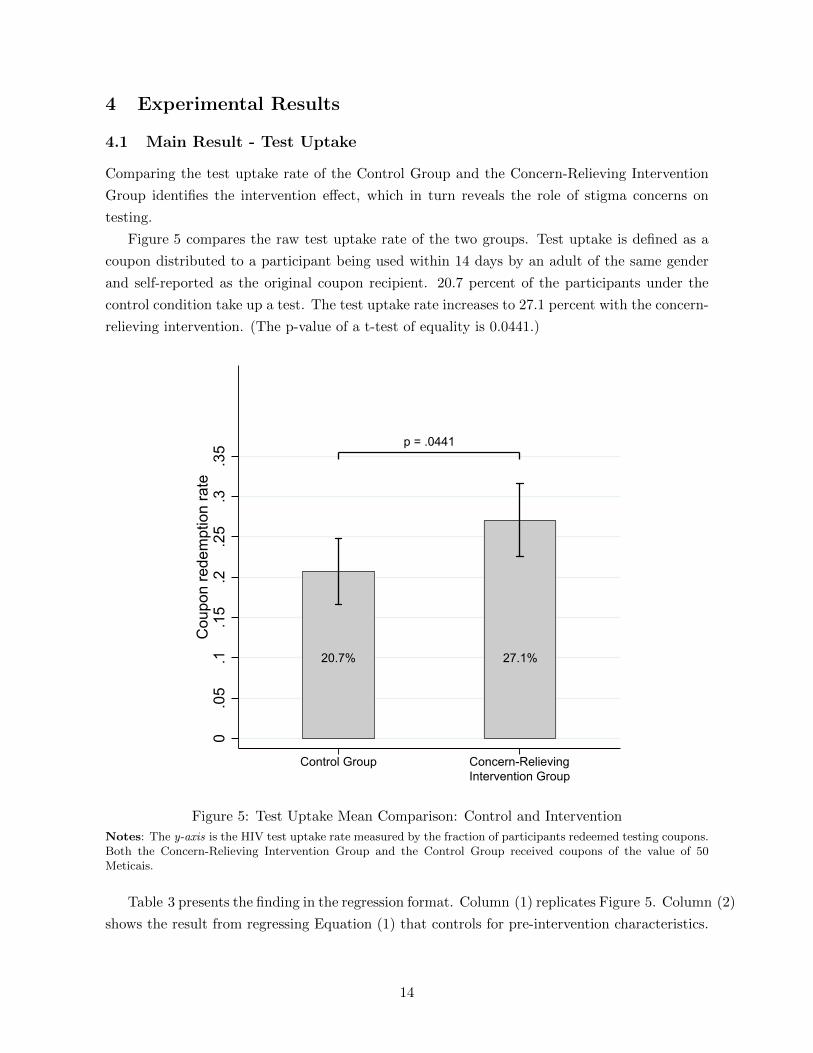
Figure 5 compares the raw test uptake rate of the two groups. Test uptake is defined as a
coupon distributed to a participant being used within 14 days by an adult of the same gender
and self-reported as the original coupon recipient. 20.7 percent of the participants under the
control condition take up a test. The test uptake rate increases to 27.1 percent with the concern-
relieving intervention. (The p-value of a t-test of equality is 0.0441.)
20.7% 27.1%
p = .0441
0.0
5.1
.15
.2.2
5.3
.35
Cou
pon
rede
mpt
ion
rate
Control Group Concern-Relieving Intervention Group
Figure 5: Test Uptake Mean Comparison: Control and Intervention
Notes: The y-axis is the HIV test uptake rate measured by the fraction of participants redeemed testing coupons.Both the Concern-Relieving Intervention Group and the Control Group received coupons of the value of 50Meticais.
Table 3 presents the finding in the regression format. Column (1) replicates Figure 5. Column (2)
shows the result from regressing Equation (1) that controls for pre-intervention characteristics.
14
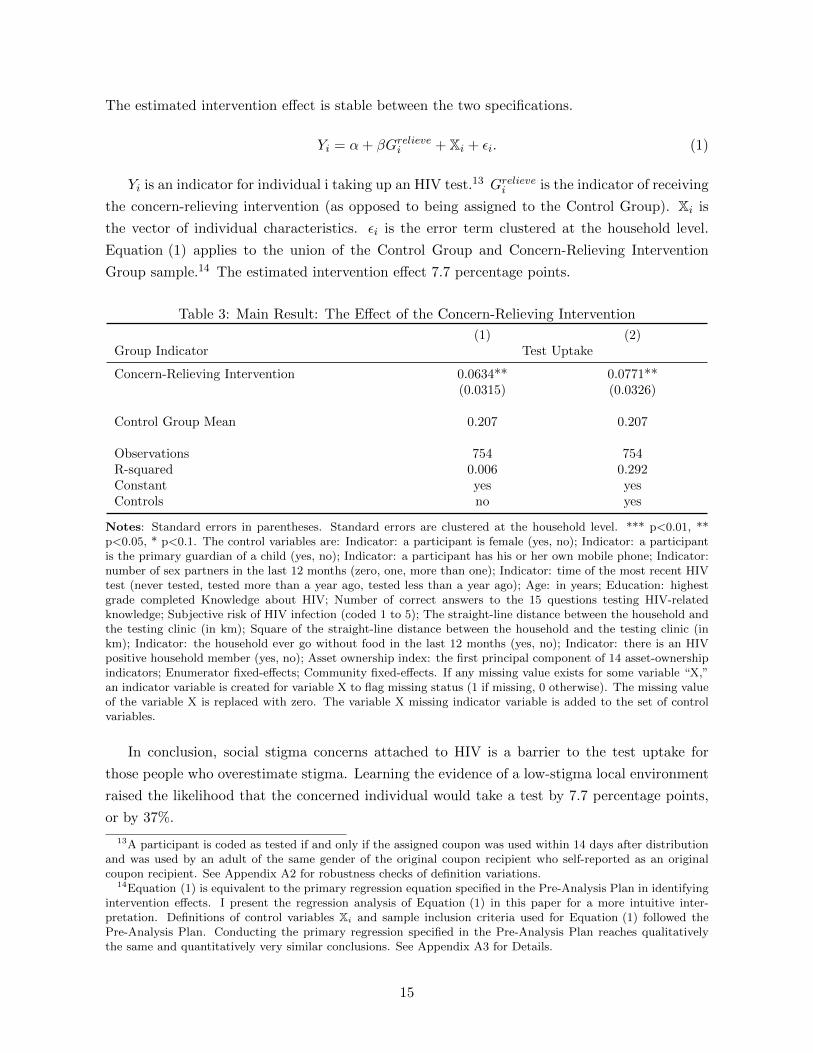
The estimated intervention effect is stable between the two specifications.
Yi = α+ βGrelievei + Xi + εi. (1)
Yi is an indicator for individual i taking up an HIV test.13 Grelievei is the indicator of receiving
the concern-relieving intervention (as opposed to being assigned to the Control Group). Xi is
the vector of individual characteristics. εi is the error term clustered at the household level.
Equation (1) applies to the union of the Control Group and Concern-Relieving Intervention
Group sample.14 The estimated intervention effect 7.7 percentage points.
Table 3: Main Result: The Effect of the Concern-Relieving Intervention
(1) (2)Group Indicator Test Uptake
Concern-Relieving Intervention 0.0634** 0.0771**(0.0315) (0.0326)
Control Group Mean 0.207 0.207
Observations 754 754R-squared 0.006 0.292Constant yes yesControls no yes
Notes: Standard errors in parentheses. Standard errors are clustered at the household level. *** p<0.01, **p<0.05, * p<0.1. The control variables are: Indicator: a participant is female (yes, no); Indicator: a participantis the primary guardian of a child (yes, no); Indicator: a participant has his or her own mobile phone; Indicator:number of sex partners in the last 12 months (zero, one, more than one); Indicator: time of the most recent HIVtest (never tested, tested more than a year ago, tested less than a year ago); Age: in years; Education: highestgrade completed Knowledge about HIV; Number of correct answers to the 15 questions testing HIV-relatedknowledge; Subjective risk of HIV infection (coded 1 to 5); The straight-line distance between the household andthe testing clinic (in km); Square of the straight-line distance between the household and the testing clinic (inkm); Indicator: the household ever go without food in the last 12 months (yes, no); Indicator: there is an HIVpositive household member (yes, no); Asset ownership index: the first principal component of 14 asset-ownershipindicators; Enumerator fixed-effects; Community fixed-effects. If any missing value exists for some variable “X,”an indicator variable is created for variable X to flag missing status (1 if missing, 0 otherwise). The missing valueof the variable X is replaced with zero. The variable X missing indicator variable is added to the set of controlvariables.
In conclusion, social stigma concerns attached to HIV is a barrier to the test uptake for
those people who overestimate stigma. Learning the evidence of a low-stigma local environment
raised the likelihood that the concerned individual would take a test by 7.7 percentage points,
or by 37%.
13A participant is coded as tested if and only if the assigned coupon was used within 14 days after distributionand was used by an adult of the same gender of the original coupon recipient who self-reported as an originalcoupon recipient. See Appendix A2 for robustness checks of definition variations.
14Equation (1) is equivalent to the primary regression equation specified in the Pre-Analysis Plan in identifyingintervention effects. I present the regression analysis of Equation (1) in this paper for a more intuitive inter-pretation. Definitions of control variables Xi and sample inclusion criteria used for Equation (1) followed thePre-Analysis Plan. Conducting the primary regression specified in the Pre-Analysis Plan reaches qualitativelythe same and quantitatively very similar conclusions. See Appendix A3 for Details.
15
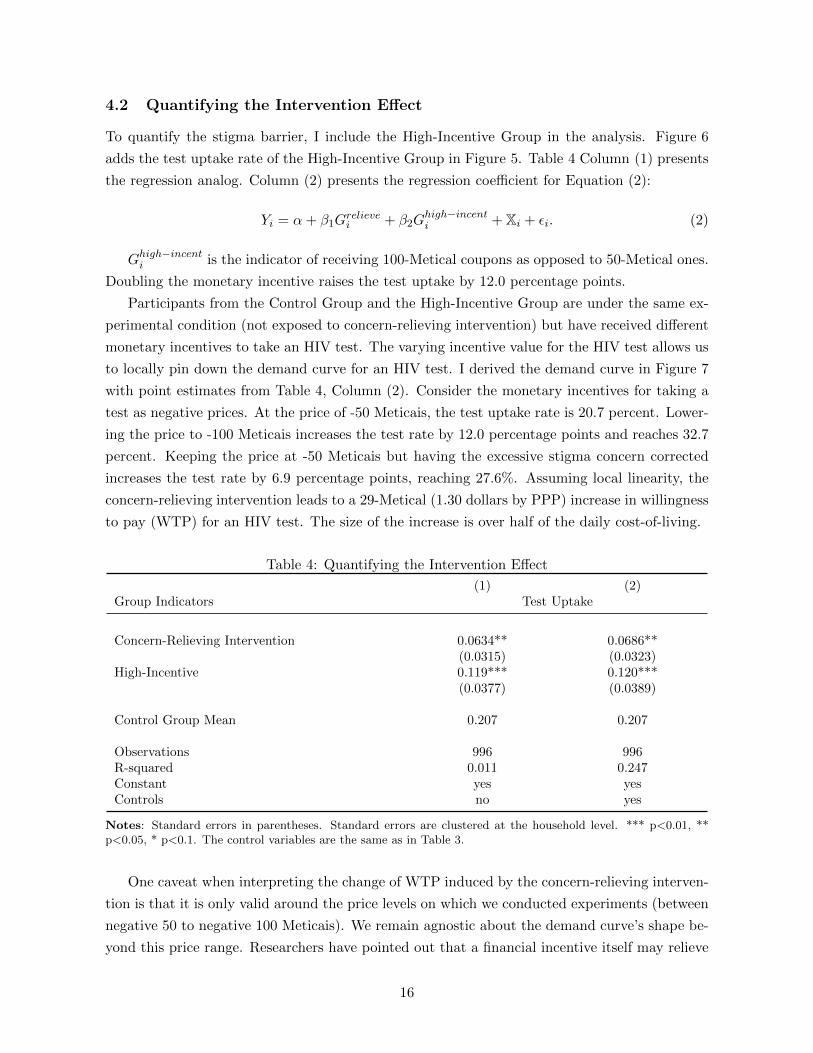
4.2 Quantifying the Intervention Effect
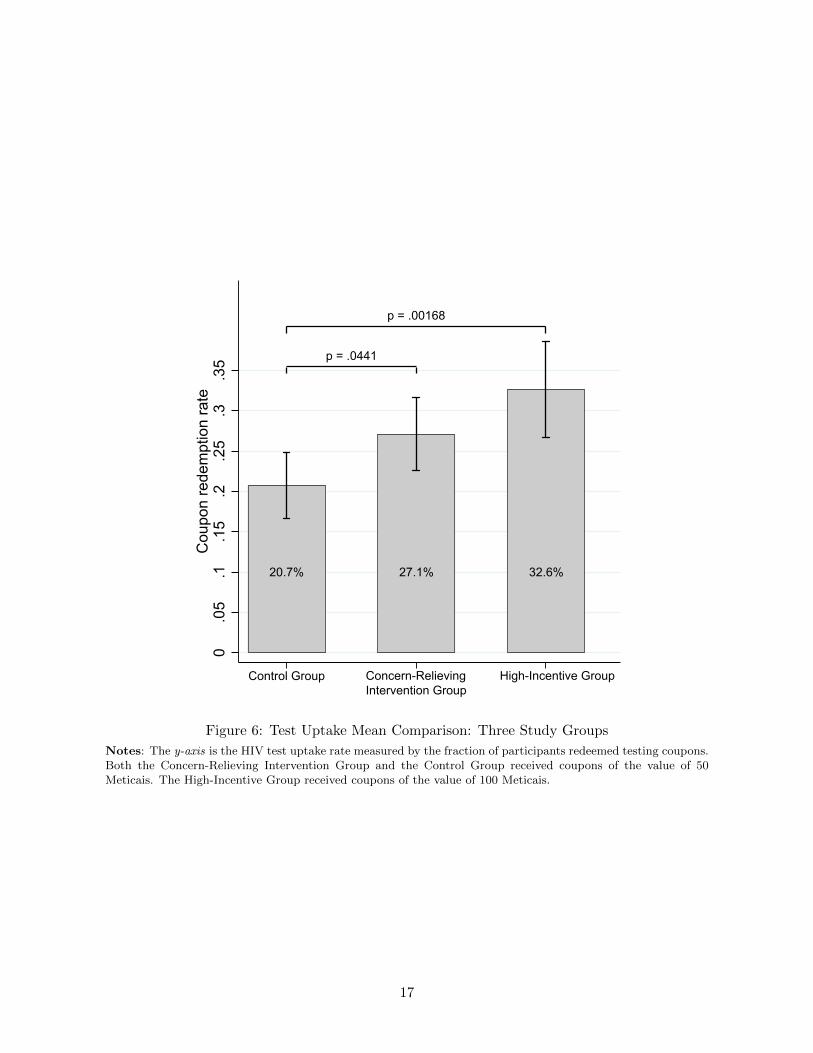
To quantify the stigma barrier, I include the High-Incentive Group in the analysis. Figure 6
adds the test uptake rate of the High-Incentive Group in Figure 5. Table 4 Column (1) presents
the regression analog. Column (2) presents the regression coefficient for Equation (2):
Yi = α+ β1Grelievei + β2G
high−incenti + Xi + εi. (2)
Ghigh−incenti is the indicator of receiving 100-Metical coupons as opposed to 50-Metical ones.
Doubling the monetary incentive raises the test uptake by 12.0 percentage points.
Participants from the Control Group and the High-Incentive Group are under the same ex-
perimental condition (not exposed to concern-relieving intervention) but have received different
monetary incentives to take an HIV test. The varying incentive value for the HIV test allows us
to locally pin down the demand curve for an HIV test. I derived the demand curve in Figure 7
with point estimates from Table 4, Column (2). Consider the monetary incentives for taking a
test as negative prices. At the price of -50 Meticais, the test uptake rate is 20.7 percent. Lower-
ing the price to -100 Meticais increases the test rate by 12.0 percentage points and reaches 32.7
percent. Keeping the price at -50 Meticais but having the excessive stigma concern corrected
increases the test rate by 6.9 percentage points, reaching 27.6%. Assuming local linearity, the
concern-relieving intervention leads to a 29-Metical (1.30 dollars by PPP) increase in willingness
to pay (WTP) for an HIV test. The size of the increase is over half of the daily cost-of-living.
Table 4: Quantifying the Intervention Effect
(1) (2)Group Indicators Test Uptake
Concern-Relieving Intervention 0.0634** 0.0686**(0.0315) (0.0323)
High-Incentive 0.119*** 0.120***(0.0377) (0.0389)
Control Group Mean 0.207 0.207
Observations 996 996R-squared 0.011 0.247Constant yes yesControls no yes
Notes: Standard errors in parentheses. Standard errors are clustered at the household level. *** p<0.01, **p<0.05, * p<0.1. The control variables are the same as in Table 3.
One caveat when interpreting the change of WTP induced by the concern-relieving interven-
tion is that it is only valid around the price levels on which we conducted experiments (between
negative 50 to negative 100 Meticais). We remain agnostic about the demand curve’s shape be-
yond this price range. Researchers have pointed out that a financial incentive itself may relieve
16
20.7% 27.1% 32.6%
p = .0441
p = .00168
0.0
5.1
.15
.2.2
5.3
.35
Cou
pon
rede
mpt
ion
rate
Control Group Concern-Relieving High-Incentive Group Intervention Group
Figure 6: Test Uptake Mean Comparison: Three Study Groups
Notes: The y-axis is the HIV test uptake rate measured by the fraction of participants redeemed testing coupons.Both the Concern-Relieving Intervention Group and the Control Group received coupons of the value of 50Meticais. The High-Incentive Group received coupons of the value of 100 Meticais.
17
some of the stigma concerns by allowing test takers to conceal their real motivations for taking
the test (Thornton, 2008; Swann, 2018). If that is the case, then the demand curve for an HIV
test will jump discontinuously at the price equal to zero. The effect of the concern-relieving
intervention on the WTP at a positive price can differ from that at a negative price. However,
since both the Control Group and the intervention group received the same financial incentive,
the design in this study is always valid in identifying the existence of the stigma-concern barrier
to testing, regardless of the financial incentive’s effect.
4.3 Heterogeneity by Belief Update
The concern relieving treatment is informational by nature. It is designed to change an indi-
vidual’s behavior by first changing his or her perceptions. An immediate inference is that the
intervention will show the strongest effect on people who are open to and able to perceive the
new information. Below I present suggestive evidence that this is the case.
We introduced a “concern re-assess” procedure to a subset of the concern-relieving group.
The “concern re-assess” applied to a participant 15 minutes after the intervention was performed.
(During the interval between the treatment and the re-assess, the participant was occupied by
answering other survey questions unrelated to health or HIV.) In the “concern re-assess” session,
the enumerator re-asked the questions in which the participant overestimated the stigma at
first and learned the correct answers during the intervention. A participant could still give an
answer suggesting high stigma concerns in the re-assess session, either due to lack of trust in the
enumerator-shared information or due to the inability to process and remember the information.
If a participant still overestimated stigma in the re-assess session, the enumerator would repeat
the intervention one more time.
The “concern re-assess” allows us to observe participants’ updates of beliefs in the immediate
short term. Participants updating belief in the right direction were those who took the new
information seriously and correctly. We call them “fast-updaters.” Due to resource constraints,
the re-assess procedure was implemented only in the provinces of Zambezia and Sofala. Two-
thirds of the participants in the re-assess session updated their beliefs about stigma in the correct
direction.
Regressions in Table 5 explore intervention heterogeneity between the fast-updaters and
others. Column (1) replicates Column (2) of Table 3 to show the main intervention effect.
Column (2) and Column (3) run the same regression separately on two subsamples: the one
that we did not conduct a “concern re-assess” (Manica province) and the subsample that we
did (Zambezia province and Sofala province). The two subsamples present very similar main
intervention effects. Column (4) runs a regression that includes the interaction between concern-
relieving intervention and fast-updater status. Since we were not able to measure whether a
participant from the Control Group would be a “fast updater”; an individual’s ability to digest
information and update beliefs is not fully controlled for. The point estimate of the main effect
shrinks to zero, and the intervention effect on the fast-updaters is almost twice the size of the
18
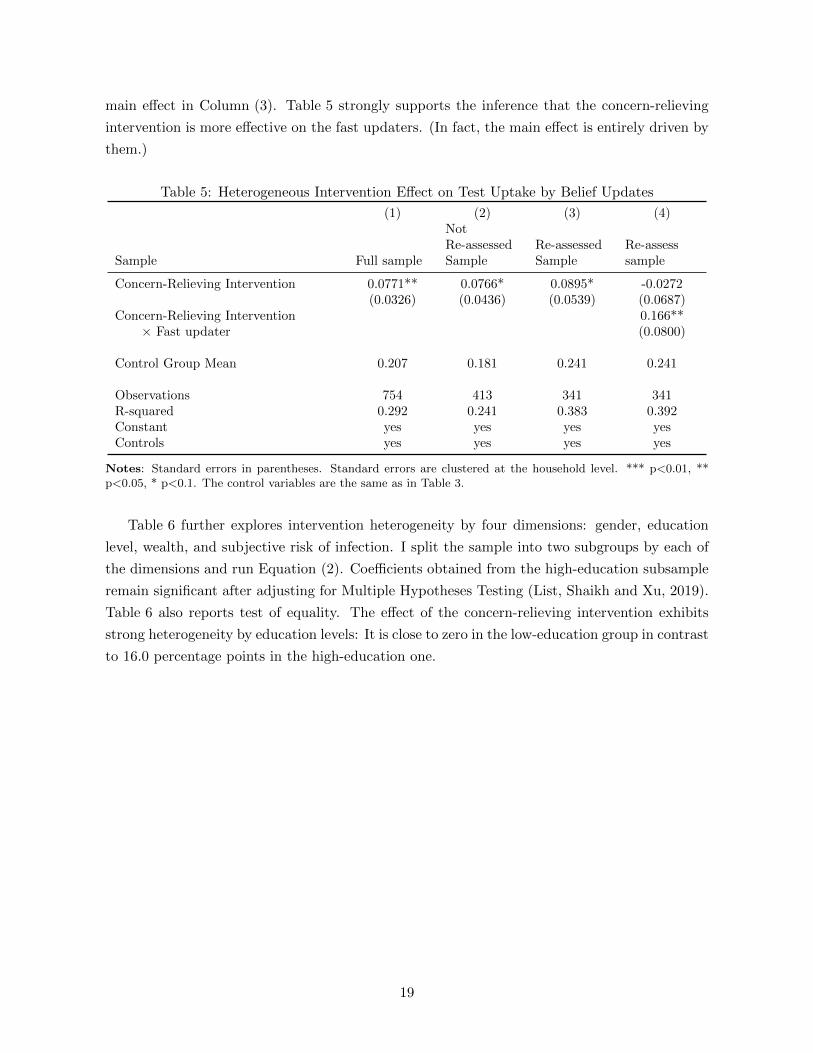
main effect in Column (3). Table 5 strongly supports the inference that the concern-relieving
intervention is more effective on the fast updaters. (In fact, the main effect is entirely driven by
them.)
Table 5: Heterogeneous Intervention Effect on Test Uptake by Belief Updates
(1) (2) (3) (4)
Sample Full sample
NotRe-assessedSample
Re-assessedSample
Re-assesssample
Concern-Relieving Intervention 0.0771** 0.0766* 0.0895* -0.0272(0.0326) (0.0436) (0.0539) (0.0687)
Concern-Relieving Intervention 0.166**× Fast updater (0.0800)
Control Group Mean 0.207 0.181 0.241 0.241
Observations 754 413 341 341R-squared 0.292 0.241 0.383 0.392Constant yes yes yes yesControls yes yes yes yes
Notes: Standard errors in parentheses. Standard errors are clustered at the household level. *** p<0.01, **p<0.05, * p<0.1. The control variables are the same as in Table 3.
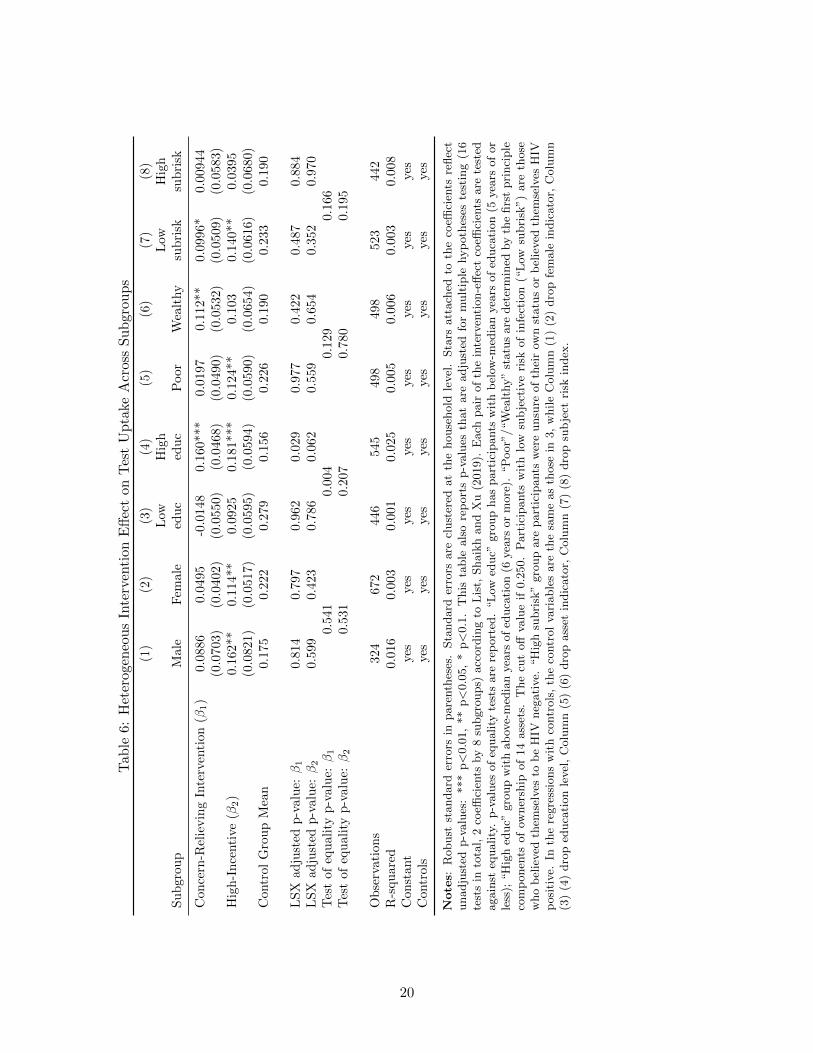
Table 6 further explores intervention heterogeneity by four dimensions: gender, education
level, wealth, and subjective risk of infection. I split the sample into two subgroups by each of
the dimensions and run Equation (2). Coefficients obtained from the high-education subsample
remain significant after adjusting for Multiple Hypotheses Testing (List, Shaikh and Xu, 2019).
Table 6 also reports test of equality. The effect of the concern-relieving intervention exhibits
strong heterogeneity by education levels: It is close to zero in the low-education group in contrast
to 16.0 percentage points in the high-education one.
19
Tab
le6:
Het
erog
eneo
us
Inte
rven
tion
Eff
ect
onT
est
Up
take
Acr
oss
Su
bgr
ou
ps
(1)
(2)
(3)
(4)
(5)
(6)
(7)
(8)
Su
bgr
oup
Male
Fem
ale
Low
edu
cH
igh
edu
cP
oor
Wea
lthy
Low
sub
risk
Hig
hsu
bri
sk
Con
cern
-Rel
ievin
gIn
terv
enti
on(β
1)
0.0
886
0.0
495
-0.0
148
0.1
60***
0.0
197
0.1
12*
*0.0
996*
0.0
0944
(0.0
703)
(0.0
402)
(0.0
550)
(0.0
468)
(0.0
490)
(0.0
532)
(0.0
509)
(0.0
583)
Hig
h-I
nce
nti
ve(β
2)
0.1
62**
0.1
14**
0.0
925
0.1
81***
0.1
24**
0.1
030.1
40**
0.0
395
(0.0
821)
(0.0
517)
(0.0
595)
(0.0
594)
(0.0
590)
(0.0
654)
(0.0
616)
(0.0
680)
Con
trol
Gro
up
Mea
n0.1
75
0.2
22
0.2
79
0.1
56
0.2
26
0.1
90
0.2
33
0.1
90
LS
Xad
just
edp
-val
ue:β1
0.8
14
0.7
97
0.9
62
0.0
29
0.9
77
0.4
22
0.4
87
0.8
84
LS
Xad
just
edp
-val
ue:β2
0.5
99
0.4
23
0.7
86
0.0
62
0.5
59
0.6
54
0.3
52
0.9
70
Tes
tof
equ
alit
yp
-val
ue:β1
0.5
41
0.0
04
0.1
29
0.1
66
Tes
tof
equ
alit
yp
-val
ue:β2
0.5
31
0.2
07
0.7
80
0.1
95
Ob
serv
atio
ns
324
672
446
545
498
498
523
442
R-s
qu
ared
0.0
16
0.0
03
0.0
01
0.0
25
0.0
05
0.0
06
0.0
03
0.0
08
Con
stan
tye
syes
yes
yes
yes
yes
yes
yes
Con
trol
sye
syes
yes
yes
yes
yes
yes
yes
Note
s:R
obust
standard
erro
rsin
pare
nth
eses
.Sta
ndard
erro
rsare
clust
ered
at
the
house
hold
level
.Sta
rsatt
ach
edto
the
coeffi
cien
tsre
flec
tunadju
sted
p-v
alu
es:
***
p<
0.0
1,
**
p<
0.0
5,
*p<
0.1
.T
his
table
als
ore
port
sp-v
alu
esth
at
are
adju
sted
for
mult
iple
hyp
oth
eses
test
ing
(16
test
sin
tota
l,2
coeffi
cien
tsby
8su
bgro
ups)
acc
ord
ing
toL
ist,
Shaik
hand
Xu
(2019).
Each
pair
of
the
inte
rven
tion-e
ffec
tco
effici
ents
are
test
edagain
steq
uality
.p-v
alu
esof
equality
test
sare
rep
ort
ed.
“L
owed
uc”
gro
up
has
part
icip
ants
wit
hb
elow
-med
ian
yea
rsof
educa
tion
(5yea
rsof
or
less
);“H
igh
educ”
gro
up
wit
hab
ove-
med
ian
yea
rsof
educa
tion
(6yea
rsor
more
).“P
oor”
/“W
ealt
hy”
statu
sare
det
erm
ined
by
the
firs
tpri
nci
ple
com
ponen
tsof
owner
ship
of
14
ass
ets.
The
cut
off
valu
eif
0.2
50.
Part
icip
ants
wit
hlo
wsu
bje
ctiv
eri
skof
infe
ctio
n(“
Low
subri
sk”)
are
those
who
bel
ieved
them
selv
esto
be
HIV
neg
ati
ve.
“H
igh
subri
sk”
gro
up
are
part
icip
ants
wer
eunsu
reof
thei
row
nst
atu
sor
bel
ieved
them
selv
esH
IVp
osi
tive.
Inth
ere
gre
ssio
ns
wit
hco
ntr
ols
,th
eco
ntr
ol
vari
able
sare
the
sam
eas
those
in3,
while
Colu
mn
(1)
(2)
dro
pfe
male
indic
ato
r,C
olu
mn
(3)
(4)
dro
ped
uca
tion
level
,C
olu
mn
(5)
(6)
dro
pass
etin
dic
ato
r,C
olu
mn
(7)
(8)
dro
psu
bje
ctri
skin
dex
.
20
Individuals with more education responded stronger to the concern-relieving intervention po-
tentially because they were able to process the information better. This finding is consistent with
the fact that the intervention is more effective on the fast updaters. Both dimensions of hetero-
geneity remind us that when applying informational experiments to a low-literacy population,
participants’ ability to understand the information can substantially affect the intervention’s
impacts.
4.4 Stigma and Test Uptake of Children
Till now, we have focused on adult participants and found that their stigma concerns have
discouraged their test-seeking behavior. 71% of the adult participants are parents and make
decisions for their children when it comes to HIV testing. If stigma concerns hold adults back
from HIV tests for themselves, do they hold children back, too? The potential inter-generational
effect of stigma concerns has important implications because a child’s early experience in HIV
testing can have prolonged effects not only on their short-term health status but also on their
future habits about and attitude towards health behavior when they reach adulthood. This
study can show the role of stigma concerns on children’s test-seeking behavior with its children’s
coupon design.
At the stage of coupon distribution at the participant’s home, each eligible child of the survey
respondent was offered coupons to take an HIV test, regardless of the eligibility of the adult
respondent. Each child received a coupon of the same value as the adult household members.
Children’s coupons were handed to the parent who answered questions on their behalf. In the
analyses below, a child’s group assignment is considered the same as the parent who answered
questions on their behalf. We did not directly interact with children; in the Concern-Relieving
Intervention Group, only adults received the intervention.
In Table 7 we report regressions similar to Table 4, Column (2), but with a sample of chil-
dren. A child enters the regression in Column (1) if one of her parents overestimated stigma,
and the child herself is eligible to receive a coupon for testing.
The child sample presents a test uptake rate of 30.1% under the control condition, higher than
that of the adult sample. The high financial incentive displays a similar impact, 9.3 percentage
points, on the child testing as on the adult testing. The concern-relieving intervention, on the
other hand, does not play a significant role in raising the test uptake rate in children: in Table 7
Column (1), the point estimate of the intervention effect is 1.5 percentage points. Table 7
Column (2) examines how our interventions interact with parents’ testing history (the parent
was eligible for a coupon, the parent had been tested within 3 months, or the parent had been
tested HIV positive). When the parent him or herself was eligible for a coupon, the concern-
relieving intervention raises children’s test uptake by 3.0 percentage point and the effect is still
not statistically different from zero. Children’s testing behavior is strongly correlated with their
parents’. Parents who voluntarily sought tests for themselves within 3 months before our study
are 12.6 percentage points more likely to take their children to be tested with our coupons. Both
21
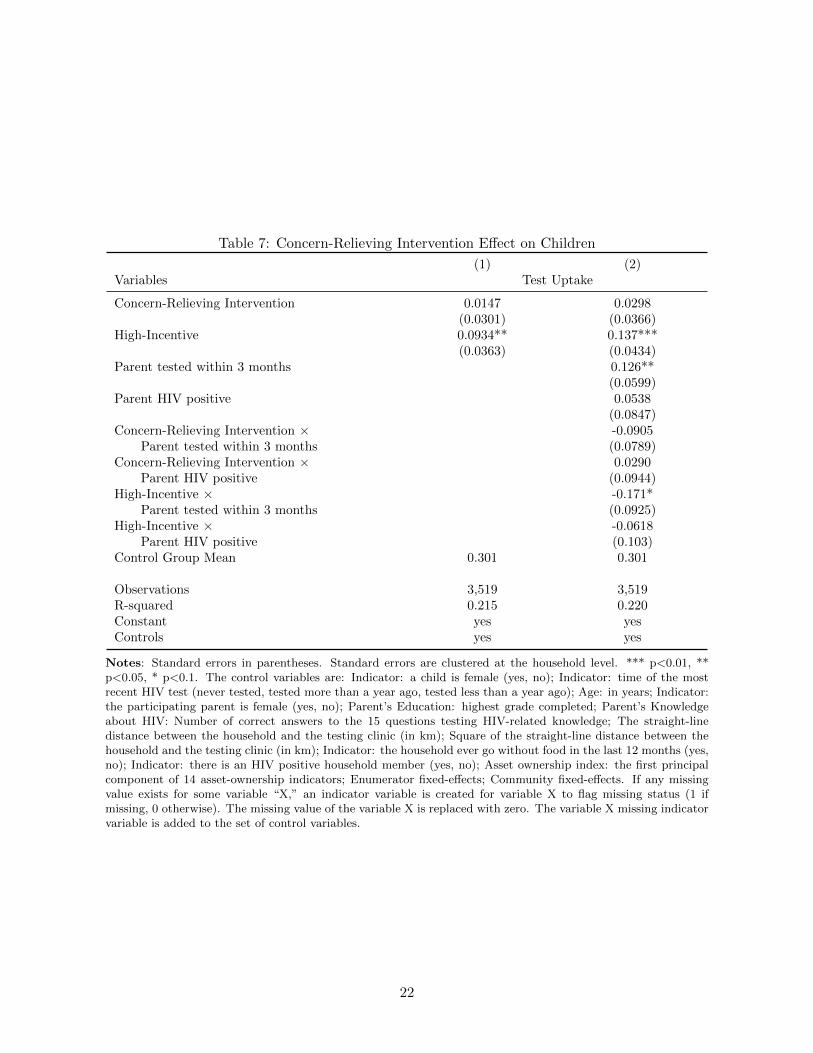
Table 7: Concern-Relieving Intervention Effect on Children
(1) (2)Variables Test Uptake
Concern-Relieving Intervention 0.0147 0.0298(0.0301) (0.0366)
High-Incentive 0.0934** 0.137***(0.0363) (0.0434)
Parent tested within 3 months 0.126**(0.0599)
Parent HIV positive 0.0538(0.0847)
Concern-Relieving Intervention × -0.0905Parent tested within 3 months (0.0789)
Concern-Relieving Intervention × 0.0290Parent HIV positive (0.0944)
High-Incentive × -0.171*Parent tested within 3 months (0.0925)
High-Incentive × -0.0618Parent HIV positive (0.103)
Control Group Mean 0.301 0.301
Observations 3,519 3,519R-squared 0.215 0.220Constant yes yesControls yes yes
Notes: Standard errors in parentheses. Standard errors are clustered at the household level. *** p<0.01, **p<0.05, * p<0.1. The control variables are: Indicator: a child is female (yes, no); Indicator: time of the mostrecent HIV test (never tested, tested more than a year ago, tested less than a year ago); Age: in years; Indicator:the participating parent is female (yes, no); Parent’s Education: highest grade completed; Parent’s Knowledgeabout HIV: Number of correct answers to the 15 questions testing HIV-related knowledge; The straight-linedistance between the household and the testing clinic (in km); Square of the straight-line distance between thehousehold and the testing clinic (in km); Indicator: the household ever go without food in the last 12 months (yes,no); Indicator: there is an HIV positive household member (yes, no); Asset ownership index: the first principalcomponent of 14 asset-ownership indicators; Enumerator fixed-effects; Community fixed-effects. If any missingvalue exists for some variable “X,” an indicator variable is created for variable X to flag missing status (1 ifmissing, 0 otherwise). The missing value of the variable X is replaced with zero. The variable X missing indicatorvariable is added to the set of control variables.
22
the concern-relieving intervention and the high incentives appear to be substitutes for a parent’s
active testing history. The interaction term between the parents tested within 3 months and
either the intervention or the high incentives is negative and sizable.
Although we find that children’s testing behavior is closely correlated with their parents’, a
parent’s stigma concerns do not appear to be a major barrier when it comes to children’s test
uptake. The high test uptake rate among children in the Control Group and lack of effect of
the concern-relieving intervention provide suggestive evidence. That the stigma barrier plays a
less important role in children’s testing than adults’ testing may stem from the nature of the
stigma. HIV infection is associated with some socially disapproved adult behaviors but not child
behaviors; thus, parents believed that children are less prone to stigmatization. Another possible
explanation is that even though children are equally prone to stigmatization, only the health
status of children, but not their social relationship concerns, enters a parent’s utility function.
The experiment design in this study does not allow us to separate these different explanations.
Learning stigma concerns’ role in children’s test uptake requires future work.
4.5 Demand for Testing among the Concerned and the Unconcerned
The analyses above have focused on the population that had excessive stigma concerns. We
have shown that the concern-relieving intervention encouraged these individuals to take an HIV
test and that the effect size is comparable to that of doubling the financial incentives. We also
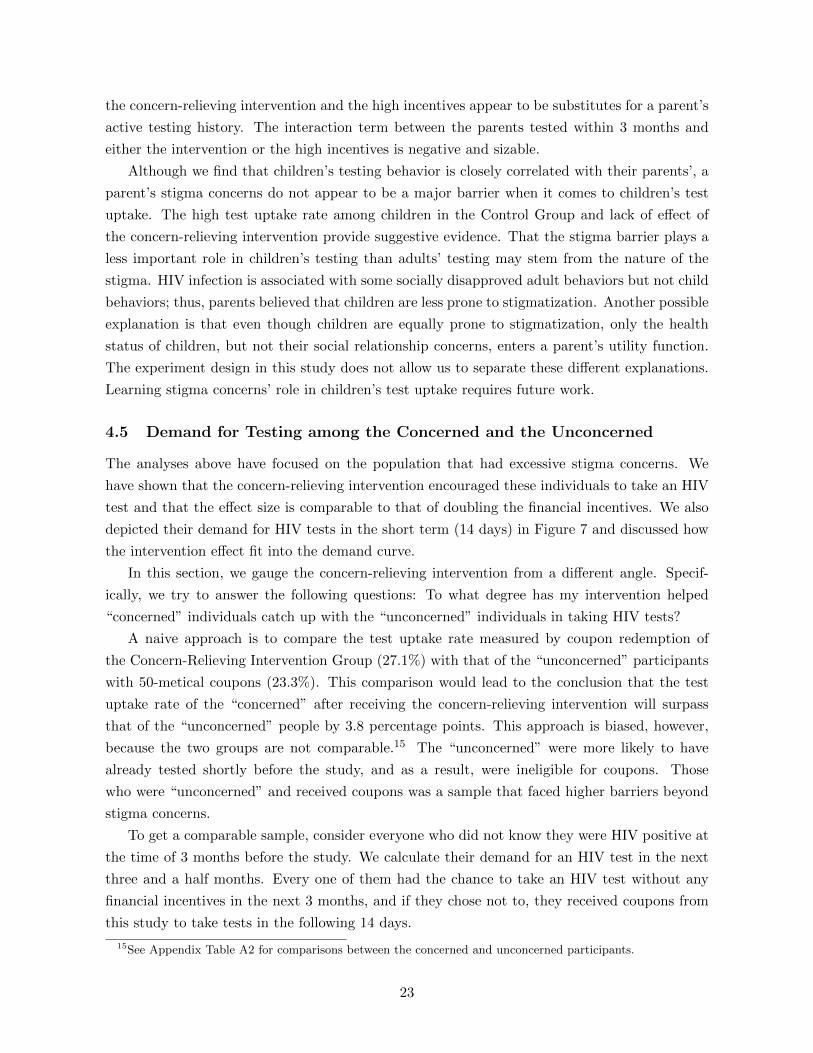
depicted their demand for HIV tests in the short term (14 days) in Figure 7 and discussed how
the intervention effect fit into the demand curve.
In this section, we gauge the concern-relieving intervention from a different angle. Specif-
ically, we try to answer the following questions: To what degree has my intervention helped
“concerned” individuals catch up with the “unconcerned” individuals in taking HIV tests?
A naive approach is to compare the test uptake rate measured by coupon redemption of
the Concern-Relieving Intervention Group (27.1%) with that of the “unconcerned” participants
with 50-metical coupons (23.3%). This comparison would lead to the conclusion that the test
uptake rate of the “concerned” after receiving the concern-relieving intervention will surpass
that of the “unconcerned” people by 3.8 percentage points. This approach is biased, however,
because the two groups are not comparable.15 The “unconcerned” were more likely to have
already tested shortly before the study, and as a result, were ineligible for coupons. Those
who were “unconcerned” and received coupons was a sample that faced higher barriers beyond
stigma concerns.
To get a comparable sample, consider everyone who did not know they were HIV positive at
the time of 3 months before the study. We calculate their demand for an HIV test in the next
three and a half months. Every one of them had the chance to take an HIV test without any
financial incentives in the next 3 months, and if they chose not to, they received coupons from
this study to take tests in the following 14 days.
15See Appendix Table A2 for comparisons between the concerned and unconcerned participants.
23
-50
-100
20.7 32.727.6Price
Test Uptake Rate (%)
-79
TE = 6.9
D
D’
Shift = 29 Meticais
Figure 7: Quantifying the Intervention Effect on HIV Test Demand Curve
Notes: Curve D depicts the demand for an HIV test within 14 days among the “concerned” population. Thisstudy experimentally sets two price levels for a test: negative 50 Meticais (receive 50 Meticais conditional testing)and negative 100 Meticais (receive 100 Meticais conditional testing). The x-axis of this demand diagram is thepercent of people that take the test.
24
To simplify the analysis, for now, we assume that learning one’s HIV status does not af-
fect one’s belief about stigma in society. Thus, the “concern” status obtained from the study
survey correctly reflects participants’ “concern” status 3 months ago. We will later discuss the
implications of our results if the assumption does not hold.
Table 8 summarizes the choices in the next three and half months of those who did not know
they were HIV positive at the time of 3 months before the study, separately for the “concerned”
and “unconcerned.” 28.4% of the concerned and 31.3% of the unconcerned chose to take a test
in the next 3 months. Those who did not take a test (71.6% of the concerned and 68.7% of
the unconcerned) received coupons from this study. Of those who received coupons, when the
coupon value is 50 Meticais, 20.7% of the concerned and 23.3% of the unconcerned took a test.
When the intervention is applied in addition to the 50-Metical coupons, 27.1% of the concerned
people took a test.
Table 8: Test Uptake of the Concerned and Unconcerned
Panel A: Concerned
(1): Test uptake rate within 3 months before theRCT
28.4%
(2) = 100% - (1): Entered the RCT 71.6%
Without intervention With intervention
(3): Test uptake rate with 50-Metical coupons 14days into the RCT
20.7% 27.1%
Test uptake rate during the 3.5 months at price= -50 Meticais
43.2% 47.8%
(1) + (2)*(3)
Panel B: Unconcerned
(4): Test uptake rate within 3 months before theRCT
31.3%
(5) = 100% - (4): Entered the RCT 68.7%
Without intervention With intervention
(6): Test uptake rate with 50-Metical coupons 14days into the RCT
23.3% -
Test uptake rate during the 3.5 months at price= -50 Meticais
47.3% -
(4) + (5)*(6)
Combining the numbers, the fraction of concerned people who would have taken a test in the
3.5 months at the price of negative 50 is 28.4%+ (1-28.4%)×20.1% = 43.2%. Similarly, the de-
mand for a test in the 3.5 months period for the unconcerned group is 31.3%+(1-31.3%)×23.3%=
47.3% at the price of negative. Of the concerned people who also received our intervention and
50-Metical coupons, the test uptake rate within the 3.5 months period would be 28.4%+(1-
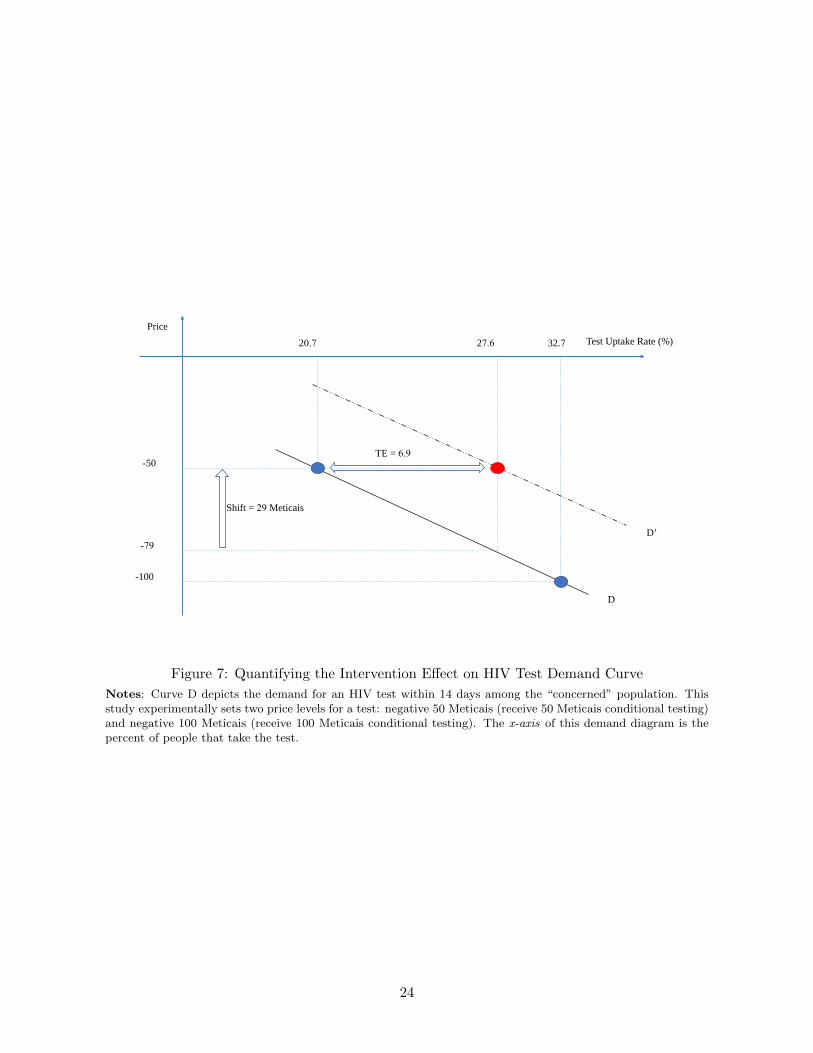
28.4%)×27.1% = 47.8%. The relationships are depicted in Figure 8. In conclusion, when we
25
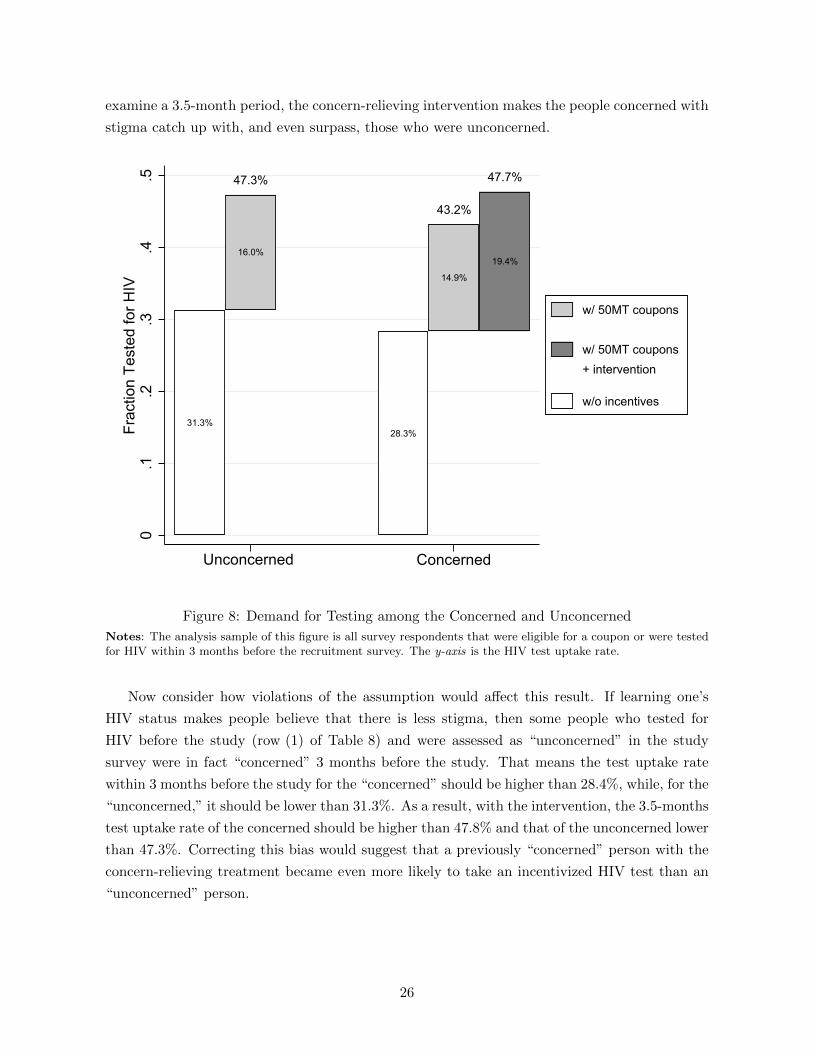
examine a 3.5-month period, the concern-relieving intervention makes the people concerned with
stigma catch up with, and even surpass, those who were unconcerned.
31.3%
16.0%
28.3%
14.9%
19.4%
47.3%
43.2%
47.7%
0.1
.2.3
.4.5
Frac
tion
Test
ed fo
r HIV
Unconcerned Concerned
w/ 50MT coupons w/ 50MT coupons+ intervention w/o incentives
Figure 8: Demand for Testing among the Concerned and Unconcerned
Notes: The analysis sample of this figure is all survey respondents that were eligible for a coupon or were testedfor HIV within 3 months before the recruitment survey. The y-axis is the HIV test uptake rate.
Now consider how violations of the assumption would affect this result. If learning one’s
HIV status makes people believe that there is less stigma, then some people who tested for
HIV before the study (row (1) of Table 8) and were assessed as “unconcerned” in the study
survey were in fact “concerned” 3 months before the study. That means the test uptake rate
within 3 months before the study for the “concerned” should be higher than 28.4%, while, for the
“unconcerned,” it should be lower than 31.3%. As a result, with the intervention, the 3.5-months
test uptake rate of the concerned should be higher than 47.8% and that of the unconcerned lower
than 47.3%. Correcting this bias would suggest that a previously “concerned” person with the
concern-relieving treatment became even more likely to take an incentivized HIV test than an
“unconcerned” person.
26
5 Conclusion
This paper analyzed a randomized control trial to identify the role of stigma concerns in hindering
HIV testing and to quantify the stigma barrier.
We obtained local stigma environment measures of the study communities one year before
the RCT and used these measures to construct an intervention to experimentally mitigate in-
dividuals’ concerns for stigma. Participants with excessive stigma concerns were randomized
to receive the concern-relieving intervention; in this intervention they are informed of the true
stigma environment measures of their communities that suggested lower-than-expected stigma.
We then tracked participants’ test-seeking behavior with testing coupons.
This paper first establishes evidence that the stigma concerns are a barrier that has caused
people to avoid taking an HIV test. Participants from the Concern-Relieving Intervention Group
took up HIV tests 7.7 percentage points more or by 37% more, than those from the Control
Group.
Moreover, the experiment design allowed us to give the stigma barrier a dollar value. We
introduced study groups with different levels of monetary incentives for HIV testing. The Control
Group and the Concern-Relieving Intervention Group received coupons of 50 Meticais (2.25
dollars by PPP, equivalent to the daily cost-of-living). In an additional study group, the High-
Incentive Group, participants received no intervention but coupons of 100 Meticais. The Control
Group and the High-Incentive Group locally pin down the demand curve for HIV testing. In
the demand framework, the concern-relieving intervention raised individuals’ willingness to pay
(WTP) for an HIV test by 29 Meticais (1.30 dollars by PPP, or more than half of the daily
cost-of-living).
This paper conducted additional analyses to depict the role of stigma concerns in HIV test-
ing. Our concern-relieving intervention is most effective on those who were able to perceive the
information immediately or those with more years of educations, which suggests that partici-
pants’ capacity to process new information substantially affects the success of this informational
intervention. In exploring children’s behavior, the study shows that children’s test uptake rate
under the control condition is higher than that of their parents’ and that stigma concerns do
not appear to play a significant role when parents make test-seeking decisions for their children.
Combining self-reported history with the coupon redemption, we found that the simple concern-
relieving intervention is effective enough to help individuals with excessive concerns take HIV
tests at a similar rate as those in the “unconcerned” group.
In response to the HIV epidemic, global donors and national governments have launched a
wide variety of campaigns in Sub-Sahara Africa. Many of these contain informational compo-
nents that disseminate knowledge about the disease and promote supportive attitudes towards
the infected population. This paper suggests a new piece of information, the social stigma
measures, that holds much promise in promoting healthy behavior regarding HIV prevention
and treatment. Building on the fact that the stigma environment has continuously improved in
Sub-Sahara Africa, I showed that letting people learn the supportive, low-stigma environment of
27
their community has a large positive impact on the public uptake of HIV tests. This paper calls
for policymakers to pay particular attention to the social stigma barrier when advancing public
health programs related to HIV. The informational intervention designed in this study can be
scaled up in a broader population at a reasonable cost and can fit into campaigns fighting HIV.
28
References
Armona, Luis, Andreas Fuster, and Basit Zafar. 2018. “Home Price Expectations andBehaviour: Evidence from a Randomized Information Experiment.” The Review of EconomicStudies, 86(4): 1371–1410.
Banerjee, Abhijit, Eliana La Ferrara, and Victor H. Orozco-Olvera. 2019. “The Enter-taining Way to Behavioral Change: Fighting HIV with MTV.” National Bureau of EconomicResearch Working Paper.
Benabou, Roland, and Jean Tirole. 2011. “Laws and Norms.” National Bureau of EconomicResearch Working Paper.
Berendes, Sima, and Rajiv N. Rimal. 2011. “Addressing the Slow Uptake of HIV Testing inMalawi: The Role of Stigma, Self-efficacy, and Knowledge in the Malawi BRIDGE Project.”Journal of the Association of Nurses in AIDS Care, 22(3): 215–228.
Besley, Timothy, and Stephen Coate. 1992. “Understanding Welfare Stigma: TaxpayerResentment and Statistical Discrimination.” Journal of Public Economics, 48(2): 165–183.
Bharadwaj, Prashant, Mallesh M Pai, and Agne Suziedelyte. 2017. “Mental healthstigma.” Economics Letters, 159: 57–60.
Bhargava, Saurabh, and Dayanand Manoli. 2015. “Psychological Frictions and the In-complete Take-Up of Social Benefits: Evidence from an IRS Field Experiment.” AmericanEconomic Review, 105(11): 3489–3529.
Bursztyn, Leonardo, Alessandra L. Gonzalez, and David Yanagizawa-Drott. 2018.“Misperceived Social Norms: Female Labor Force Participation in Saudi Arabia.” NationalBureau of Economic Research Working Paper.
Cruces, Guillermo, Ricardo Perez-Truglia, and Martin Tetaz. 2013. “Biased Percep-tions of Income Distribution and Preferences for Redistribution: Evidence from a SurveyExperiment.” Journal of Public Economics, 98: 100–112.
Derksen, Laura, and Joep van Oosterhout. 2019. “Love in the Time of HIV: Testing as aSignal of Risk.” The Field Experiments Website Working Paper.
Feyissa, Garumma T., Craig Lockwood, and Zachary Munn. 2015. “The Effectivenessof Home-Based HIV Counseling and Testing in Reducing Stigma and Risky Sexual Behavioramong Adults and Adolescents: A Systematic Review and Meta-Analysis.” JBI Database ofSystematic Reviews and Implementation Reports, 13(6): 318–372.
Friedrichsen, Jana, Tobias Konig, and Renke Schmacker. 2018. “Social Image Concernsand Welfare Take-Up.” Journal of Public Economics, 168: 174–192.
Goffman, Erving. 1963. Stigma: Notes on the Management of Spoiled Identity. EnglewoodCliffs, NJ:Prentice-Hall.
Hoffmann, Vivian, Jacob R. Fooks, and Kent D. Messer. 2014. “Measuring and Mitigat-ing HIV Stigma: A Framed Field Experiment.” Economic Development and Cultural Change,62(4): 701–726.
29
Ishida, Junichiro. 2003. “The Role of Social Norms in a Model of Marriage and Divorce.”Journal of Economic Behavior and Organization, 51(1): 131–142.
Jensen, Robert. 2010. “The (Perceived) Returns to Education and the Demand for Schooling.”The Quarterly Journal of Economics, 125(2): 515–548.
Kelly, J. Daniel, Sheri D. Weiser, and Alexander C. Tsai. 2016. “Proximate Contextof HIV Stigma and its Association with HIV Testing in Sierra Leone: A Population-BasedStudy.” AIDS and Behavior, 20(1): 65–70.
List, John A, Azeem M Shaikh, and Yang Xu. 2019. “Multiple hypothesis testing inexperimental economics.” Experimental Economics, 22(4): 773–793.
Maughan-Brown, Brendan, and Laura Nyblade. 2014. “Different Dimensions of HIV-Related Stigma May Have Opposite Effects on HIV Testing: Evidence among Young Menand Women in South Africa.” AIDS and Behavior, 18(5): 958–965.
Moffitt, Robert. 1983. “An Economic Model of Welfare Stigma.” American Economic Review,73(5): 1023–1035.
Moshoeu, Moshoeu Prisca, Desmond Kuupiel, Nonjabulo Gwala, and Tivani P.Mashamba-Thompson. 2019. “The Use of Home-Based HIV Testing and Counseling inLow-and-Middle Income Countries: A Scoping Review.” BMC Public Health, 19(1): 132.
Parker, Richard, and Peter Aggleton. 2003. “HIV and AIDS-Related Stigma and Discrim-ination: A Conceptual Framework and Implications for Action.” Social Science & Medicine,57(1): 13–24.
Puhl, Rebecca M, and Chelsea A Heuer. 2009. “The stigma of obesity: a review andupdate.” Obesity, 17(5): 941.
Sambisa, William, Sian Curtis, and Vinod Mishra. 2010. “AIDS Stigma as an Obstacleto Uptake of HIV Testing: Evidence from a Zimbabwean National Population-Based Survey.”AIDS Care, 22(2): 170–186.
Schultz, P. Wesley, Jessica M. Nolan, Robert B. Cialdini, Noah J. Goldstein, andVladas Griskevicius. 2007. “The Constructive, Destructive, and Reconstructive Power ofSocial Norms.” Psychological Science, 18(5): 429–434.
Stangl, Anne, Jennifer Lloyd, Laura Brady, Claire Holland, and Stefan Baral. 2013.“A Systematic Review of Interventions to Reduce HIV-Related Stigma and Discriminationfrom 2002 to 2013: How far Have We Come?” Journal of the International AIDS Society,16(3S2): 18734.
Stangl, Anne, Laura Brady, and Katherine Fritz. 2012. “Measuring HIV Stigma andDiscrimination.” STRIVE Technical Brief.
Swann, Mandy. 2018. “Economic Strengthening for HIV Testing and Linkage to Care: AReview of the Evidence.” AIDS Care, 30(sup3): 85–98.
Thornton, Rebecca. 2008. “The Demand for, and Impact of, Learning HIV Status.” AmericanEconomic Review, 98(5): 1829–63.
30

UNAIDS. 2019. UNAIDS Data 2018. Geneva, Switzerland:Joint United Nations Programmeon HIV/AIDS.
Yang, Dean, Arlete Mahumane, James Riddell, and Hang Yu. 2019. “Direct andSpillover Impacts of a Community-Level HIV/AIDS Program: Evidence from a Random-ized Controlled Trial in Mozambique.” Accepted based on pre-results review at the Journalof Development Economics.
31
Copyright © 2022 FDOKUMEN