Social Impact Assessment Study
175
Social Impact Assessment Study Delhi-Mumbai Industrial Corridor Project Site: Chamrawali Bodaki Chithehra, Kathehra, and Palla Dadri Tehsil, Gautam Budh Nagar, Uttar Pradesh Draft submitted for Public Hearing and Consultations with Key Stakeholders Submitted by Gautam Buddha University Greater Noida, Uttar Pradesh-201310 November 2020
-
Upload
khangminh22 -
Category
Documents
-
view
0 -
download
0
Transcript of Social Impact Assessment Study

Social Impact Assessment Study Delhi-Mumbai Industrial Corridor Project
Site: Chamrawali Bodaki Chithehra, Kathehra, and Palla
Dadri Tehsil, Gautam Budh Nagar, Uttar Pradesh
Draft submitted for Public Hearing and Consultations with Key Stakeholders
Submitted by
Gautam Buddha University Greater Noida, Uttar Pradesh-201310
November 2020
1
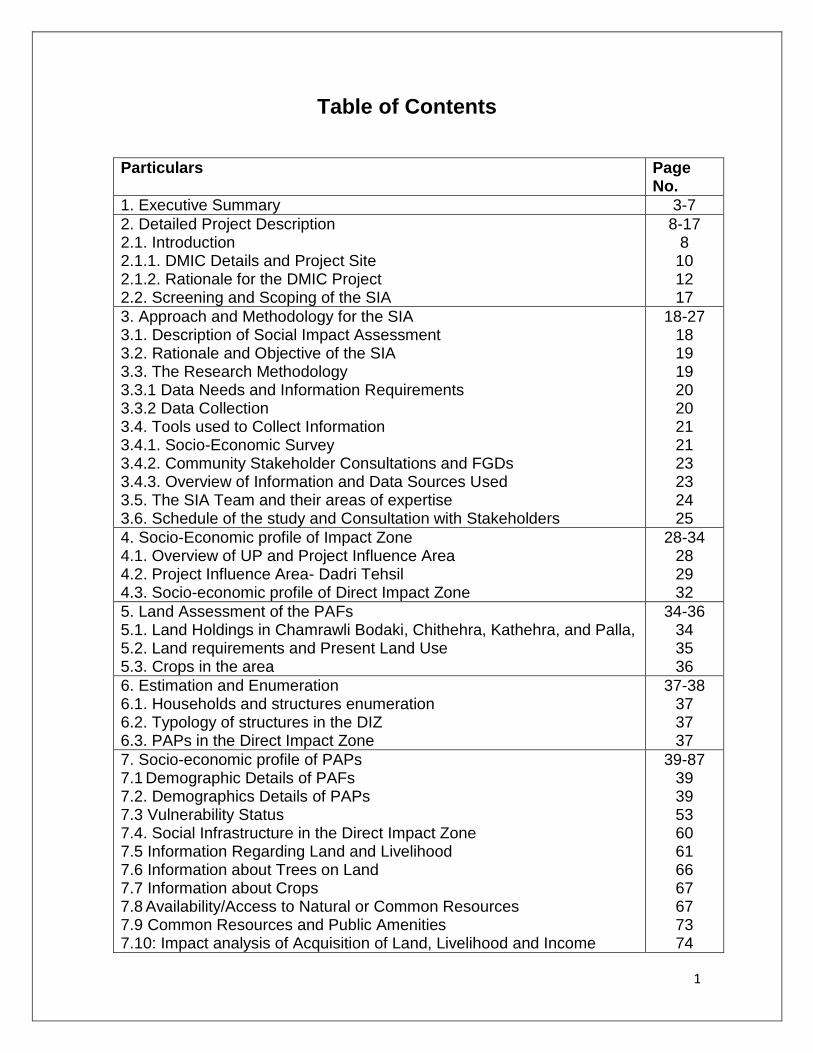
Table of Contents
Particulars Page No.
1. Executive Summary 3-7
2. Detailed Project Description 2.1. Introduction 2.1.1. DMIC Details and Project Site 2.1.2. Rationale for the DMIC Project 2.2. Screening and Scoping of the SIA
8-17 8
10 12 17
3. Approach and Methodology for the SIA 3.1. Description of Social Impact Assessment 3.2. Rationale and Objective of the SIA 3.3. The Research Methodology 3.3.1 Data Needs and Information Requirements 3.3.2 Data Collection 3.4. Tools used to Collect Information 3.4.1. Socio-Economic Survey 3.4.2. Community Stakeholder Consultations and FGDs 3.4.3. Overview of Information and Data Sources Used 3.5. The SIA Team and their areas of expertise 3.6. Schedule of the study and Consultation with Stakeholders
18-27 18 19 19 20 20 21 21 23 23 24 25
4. Socio-Economic profile of Impact Zone 4.1. Overview of UP and Project Influence Area 4.2. Project Influence Area- Dadri Tehsil 4.3. Socio-economic profile of Direct Impact Zone
28-34 28 29 32
5. Land Assessment of the PAFs 5.1. Land Holdings in Chamrawli Bodaki, Chithehra, Kathehra, and Palla, 5.2. Land requirements and Present Land Use 5.3. Crops in the area
34-36 34 35 36
6. Estimation and Enumeration 6.1. Households and structures enumeration 6.2. Typology of structures in the DIZ 6.3. PAPs in the Direct Impact Zone
37-38 37 37 37
7. Socio-economic profile of PAPs 7.1 Demographic Details of PAFs 7.2. Demographics Details of PAPs 7.3 Vulnerability Status 7.4. Social Infrastructure in the Direct Impact Zone 7.5 Information Regarding Land and Livelihood 7.6 Information about Trees on Land 7.7 Information about Crops 7.8 Availability/Access to Natural or Common Resources 7.9 Common Resources and Public Amenities 7.10: Impact analysis of Acquisition of Land, Livelihood and Income
39-87 39 39 53 60 61 66 67 67 73 74

2
711 : Impact Analysis of Physical Resources 7.12: The Collective Inferences:
82 85
8. Public Consultations - FGD 8.1. Need for Focus Group - Public Consultations 8.2 Focus Group - Research Design and Data Collection 8.3 Focus Group Study of Chamrawali Bodaki-Chitehara–Katehara–Palla
87-99 87 88 89
9. Public Consultations - Public Hearing 9.1. Need for Public Consultations - Public Hearing 9.2. Details of the Public Consultations 9.3 Key Concerns and Recommendations 9.4. Pictures from the Project Site 9.5. Pictures from the Public Hearings
100
10. Social Impact Analysis of DMIC 10.1. Potential Positive Impacts 10.2 Positive Impacts Perceived by PAFs 10.3 Impact on Poverty Reduction 10.4 Key Adverse Impacts 10.4.1 Impact on Land 10.4.2 Impact on Common Structures 10.4.3 Impact on Fixed Assets and Occupational Structure 10.4.4 Impact on Livestock and Crops 10.4.5 Impact on the People in the Adjacent Area 10.5 Concerns Perceived by the PAPs
101-105 101 101 102 103 103 103 103 104 104 105
11. Social Impact Management Plan 11.1 Approach to Mitigation Measures 11.2 Impact and Management Plan 11.3 Gender Plan 11.3.1 Management Plan for Women 11.4 Training Need Assessment 11.5 Livelihood Restoration and Income Generation Strategy via Skill Mapping
106-112 106 107 108 108 110
110
12. Annexures 12.1. Land Owners Details 12.2. Structured Questionnaire 12.3 Orders and Letters
113 Onwards

3
1. Executive Summary
1. The DMIC project was launched in pursuance of an MOU signed between the
Government of India and the Government of Japan in December 2006. DMIC
Development Corporation (DMICDC) incorporated in 2008, is the implementing
agency for the project. DMICDC has been registered as a company with 49%
equity of Government of India, 26% equity of the JBIC and the remaining held
by government financial institutions. The Japanese Government had also
announced financial support for DMIC project to an extent of US$ 4.5 billion in
the first phase for the projects with Japanese participation involving cutting edge
technology.
2. The project spans the States of Uttar Pradesh, Haryana, Rajasthan, Madhya
Pradesh, Gujarat and Maharashtra along the Western Dedicated Freight
Corridor (DFC) of the railways. Initially, 8 nodes/cities in the six DMIC states
have been taken up for development.
3. DMIC is being developed along with the Western Dedicated Freight Corridor
(WDFC). DFCCIL, a Ministry of Railways, Government of India enterprise, is
developing WDFC, which passes through the states of Uttar Pradesh, Haryana,
Rajasthan, Gujarat and Maharashtra, having end terminals at Dadri in the Uttar
Pradesh and Jawaharlal Nehru Port (JNPT) near Mumbai, Maharashtra. The
Dedicated Fright Corridor offers high-speed connectivity for High Axle Load
Wagons supported by high power locomotives. DMIC will leverage the High
Speed – High Capacity connectivity of WDFC.
4. Under the Dadri-Ghaziabad-Noida Investment Region of DMIC, following three
Early Bird Projects are being developed:
a. Integrated Industrial Township at Greater Noida
b. Multi Modal Logistic Hub (Freight Village) at Dadri, Greater Noida and
c. Multi Modal Transport Hub at Boraki, Greater Noida
5. The objective of DMIC is to expand India’s Manufacturing & Services base and
develop DMIC as a “Global Manufacturing and Trading Hub”. It will provide a
major impetus to planned urbanization in India with manufacturing as the key

4
driver. In addition to new Industrial Cities, it envisages development of
infrastructure linkages like power plants, assured water supply, high capacity
transportation and logistics facilities as well as softer interventions like skill
development programme for employment of the local populace.
6. A site of 302.63ha has been developed for the “Integrated Industrial Township
(IIT)” under Dadri-Noida-Ghaziabad Investment Region of DMIC to facilitate
large scale investments for the commercial and industrial development expected
in DMIC region.
7. The proposed Freight Village site is located in Dadri Tehsil of Gautam Budh
Nagar of Uttar Pradesh. The site is in close proximity of Delhi-Howrah Broad
Gauge line in the south west and NH 91 in North West. The UP Government has
already initiated the land acquisition process. The site identified for Freight
Village located in Dadri Tehsil in the planning boundaries of the city of Greater
Noida and its extension.
8. The MMTH at Greater Noida has been planned with the key objective to create
a world-class intermodal transport station with provision of international level
facilities incorporating the Rail, Road and MRTS accessibility for the passengers,
in a seamless manner.
9. The proposed Dadri-Ghaziabad-Noida Investment Region of DMIC that includes
three Early Bird Projects namely Integrated Industrial Township at Greater
Noida, Multi Modal Logistic Hub (Freight Village) at Dadri, Greater Noida and
Multi Modal Transport Hub at Boraki, Greater Noida will cause involuntary
resettlement of the PAFs across the four villages (Chamrawali Bodaki,
Chithehra, Katehra and Palla) that are being subsumed under this phase of land
area acquisition.
10. The land holdings of the PAPs range from less than half a hectare up to above
3 hectares. The majority of the land holders are consolidated within the bracket
of 0 to 1 hectare. As per the RFCTLARR Act, 2013, marginal farmers in irrigated
land are defined as those having holdings below 0.5 Ha and small farmers as
those with holdings between 0.5 to 1 Ha. As can be seen, from the table 5.1,
there are large numbers about 82.59 percentage of landholders who are

5
marginal and merely 12.97% of the landholders can be categorized as small
farmers. As per the village Land Records and household (Annexed), the
landholdings for Gautam Budh Nagar district, almost 88.82 % of agricultural
holdings can be categorized as marginal and small farmers, which is almost in
similar pattern as distribution found in India across and in Uttar Pradesh as per
Agriculture Census 2015-16.
11. The total land required for the project is 87.8624 Hectares carved out of total
area of the four villages “Chamrawali Bodaki- Chitehara – Katehara – Palla”
Dadri Tehsil, consisting of 293 land plots or gatasankhya mainly private
agricultural land plots with some 10-15% of PAFs as residential structure which
is to be subsumed under the Direct Impact Zone.
12. The total area of land to be acquired for the project is 87.8624 Hectares. Almost
the entire land is currently used for the purposes of agriculture. The change in
land use, from agricultural to transport, specifically for the purposes of
establishing Delhi-Mumbai corridor has been granted by the government of Uttar
Pradesh.
13. The agricultural lands are irrigated lands in the four demarcated villages
‘Chamrawali Bodaki- Chitehara – Katehara – Palla’ located in Tehsil Dadri. The
landholding pattern indicates that majority of the landholders are small and
marginal farmers. This also resonates with the district level data.
14. The land though is use for agricultural purpose primarily however there are few
residential structures and livestock cottages in the land. The PAFs use these
livestock for milking and dairy purpose which is a major source of income for
them.
15. The gender distribution of PAPs is not deviated on one side. However the
landowners are primarily male members of the family. The females though
almost equal in number is not the earning member of the family and they are
primarily engaged in household activities. All the PAFs are Hindu by religion.
There is a significant presence of other backward classes with a small presence
of scheduled castes and negligible presence of scheduled tribes in the project
impact area.

6
16. A large percentage of the population falls substantially in the range of upto 35
years indicating that the project affected households have a significant number
of young, employable as well as dependent population.
17. The youth (19-35 years) of the project affected area of the four villages consist
of a substantial population which is 32.54%. During SIMP, it is important to
engage this youth in various jobs according to their educational profile and skill
levels. They can be employed as per their competency and qualification.
18. The overall level of literacy of the area is high with 72% being literate. A
substantial population is well educated at primary and secondary level with a
good number of graduates and few postgraduates. Women record lower levels
of literacy as compared to the men.
19. The income level of the affected population is low with major proportion (36.45%)
belonging to up to Rs 4000/- per month, given the small size of land holdings.
And also 16.5% of them have no stable income. The occupational data also
shows that a large number of the people are dependent on their lands for their
livelihood- farming and allied work, there are only a few who have listed their
occupations and source of income from private services and government
services.
20. Women’s occupation and income levels remain behind in the data collected. This
could be due to the fact that women work on their own farms, and rarely go out
to earn. Women’s occupation has mostly been recorded as housewives, as their
labor within the house and on their fields is not reflected as paid work.
21. Nearly two-third of the population lies in the category of APL whereas some of
them (25.91%) are also availing ‘Antyodaya Scheme’. There are a few
households which are headed by single or widowed women, which were also
mentioned in the course of community consultations.
22. For the purpose of SIMP, it is significant to note that a 27% of PAPs are engaged
at the Elementary Occupation level (i.e. Skill I level) and almost 51% of them are
engaged at 6th category level-Skilled Agricultural and Animal Husbandry (i.e.
Skill II level) and around 22% of them are engaged at 4th & 5th Category level –
Clerks and as Service Workers and Shop & Market Sales Workers (i.e. Skill II

7
level) as defined by NCO-2015 report. It is thereby important to constructively
engage them in the prospective employment as per their skills and education.
23. The women in DIZ are highly vulnerable, owing to their illiteracy and status of
non-working population. For SIMP, their hidden skills need to be identified and
required training may be imparted for their social upliftment.
24. The Social Impact Management Plan should thereby ensure a livelihood
mapping exercise, to ascertain the type of skill required in the area of PAPs for
the jobs that would be created. For the purpose, a comprehensive survey should
be conducted to identify the people who want to participate in livelihood and skill
development training and thereby categorizing their areas of interest to find the
suitable and courses and classes. The agency may also identify suitable training
institutes, classes, and organizations in the vicinity of the project affected area
as extended support to PAPs.
25. Greater Noida Industrial Development Authority should facilitate the inclusion of
PAPs in the government-sponsored poverty alleviation program in the area as
per the eligibility criteria of each program. GNIDA may also facilitate training for
skills development. There should be a strong emphasis on imparting vocational
training to the unskilled youth by collaborating with the institutions providing
vocational training and government schemes such as Skill Development
Mission.
26. Moreover, during the implementation of the project, skills training, and job
opportunities could be offered to PAFs. The PAFs can also be engaged in the
allied agriculture activities such as dairy, poultry, cattle rearing, etc. which will
also take care of the existing live-stock of PAFs.
27. The project should also focus on helping the PAFs in providing opportunities for
quality education with the help of various organizations such as Satyam
Foundations Sarvodaya Educational and Welfare Society etc. that will make
them eligible for long-term employment and will contribute to poverty alleviation
of PAFs.

8
2. Detailed Project Description1
2.1 Introduction
The DMIC project was launched in pursuance of an MOU signed between the
Government of India and the Government of Japan in December 2006. DMIC
Development Corporation (DMICDC) incorporated in 2008, is the implementing
agency for the project. DMICDC has been registered as a company with 49% equity
of Government of India, 26% equity of the JBIC and the remaining held by
government financial institutions. The Japanese Government had also announced
financial support for DMIC project to an extent of US$ 4.5 billion in the first phase for
the projects with Japanese participation involving cutting edge technology.
Government of India took the lead in developing Delhi Mumbai Industrial Corridor
(DMIC) Project on the backbone of Western Dedicated Freight Corridor (DFC)
between Delhi and Mumbai covering an overall length of 1504 km and passing
through the States of U.P, Delhi NCR, Haryana, Rajasthan, Gujarat and
Maharashtra, with end terminals at Dadri in the Delhi NCR and Jawaharlal Nehru
Port (JNPT) near Mumbai. The influence region for DMIC includes the States of U.P,
Haryana, Rajasthan, Madhya Pradesh, Gujarat and Maharashtra.
The project spans the States of Uttar Pradesh, Haryana, Rajasthan, Madhya
Pradesh, Gujarat and Maharashtra along the Western Dedicated Freight Corridor
(DFC) of the railways. Initially, 8 nodes/cities in the six DMIC states have been taken
up for development.
Land has been transferred to the SPVs by the concerned State Governments.
Matching equity by DMIC trust has been released to the SPVs.
Master Planning, Environment Clearance and legal framework, authorizing power
to SPVs have been completed.
Work on Trunk Infrastructure packages which includes Common Effluent Treatment
Plant (CETP), Administrative Business Centre (ABC), Water Treatment Plant
1 Source: Extrapolated from https://www.dmicdc.com/about-DMICDC

9
(WTP), Sewage Treatment Plant (STP) and Roads and Services are ready to
commence after finalization of tenders which have already been floated. extrapolate
Thereafter, looking at the progress of DMIC Project, Govt. of India announced other
Industrial Corridor Projects and accordingly, in December 2016, the mandate for
DMIC Trust was expanded to include all other industrial corridors across India
namely:
1. Amritsar Kolkata Industrial Corridor (AKIC)
2. Chennai Bengaluru Industrial Corridor (CBIC)
3. East Coast Economic Corridor (ECEC) with Vizag Chennai Industrial Corridor
(VCIC) as Phase 1
4. Bengaluru Mumbai Industrial Corridor (BMIC)
The DMIC Trust was accordingly renamed as National Industrial Corridor
Development and Implementation Trust (NICDIT) and future corridors, if any will also
be developed and implemented by NICDIT.
Image Source: [https://www.iitgnl.com/gnl-content/overview]

10
2.1.1 DMIC-Details and Project Site2
Delhi Mumbai Industrial Corridor (DMIC) is a flagship program of the Government of
India aiming to develop “Futuristic Smart Industrial Cities” and converging next
generation technologies across infrastructure sectors.
DMIC is being developed along with the Western Dedicated Freight Corridor
(WDFC). DFCCIL, a Ministry of Railways, Government of India enterprise, is
developing WDFC, which passes through the states of Uttar Pradesh, Haryana,
Rajasthan, Gujarat and Maharashtra, having end terminals at Dadri in the Uttar
Pradesh and Jawaharlal Nehru Port (JNPT) near Mumbai, Maharashtra. The
Dedicated Fright Corridor offers high-speed connectivity for High Axle Load Wagons
supported by high power locomotives. DMIC will leverage the High Speed – High
Capacity connectivity of WDFC.
In the first phase of DMIC eight new industrial cities are being developed across six
states- Uttar Pradesh, Haryana, Rajasthan, Madhya Pradesh, Gujarat and
Maharashtra. In the state of Uttar Pradesh, Dadri-Noida-Ghaziabad Investment
Region is being developed under the DMIC. This investment region is located within
50 km from the alignment of Dedicated Freight Corridor and the nearest metropolitan
region is Delhi, the National Capital of India.
Under the Dadri-Ghaziabad-Noida Investment Region of DMIC, following three Early
Bird Projects are being developed:
A. Integrated Industrial Township at Greater Noida
B. Multi Modal Logistic Hub (Freight Village) at Dadri, Greater Noida and
C. Multi Modal Transport Hub at Boraki, Greater Noida
2 Source: Extrapolated form https://www.iitgnl.com/gnl-content/overview

12
2.1.2 Rationale of the DMIC Project:
The objective of DMIC is to expand India’s Manufacturing & Services base and
develop DMIC as a “Global Manufacturing and Trading Hub”. It will provide a major
impetus to planned urbanization in India with manufacturing as the key driver. In
addition to new Industrial Cities, it envisages development of infrastructure linkages
like power plants, assured water supply, high capacity transportation and logistics
facilities as well as softer interventions like skill development programme for
employment of the local populace. The Project intends to trigger developmental
activities in the Greater Noida region and to attract local and global investments. The
area shall also help in building confidence in the market bringing the efforts of the
past half-a-decade to fruition.
A. Integrated Industrial Township at Greater Noida3
The Integrated Industrial Township at Greater Noida, being a flagship project for
Delhi Mumbai Industrial Corridor has been designed with world class standards
envisioned as a sustainable and smart community. The new-age community in the
making draws a balance between functionality and aesthetics. Signature buildings
and vibrant public realm are supported by smart infrastructure components to ensure
a futuristic township.
A site of 302.63ha has been developed for the “Integrated Industrial Township (IIT)”
under Dadri-Noida-Ghaziabad Investment Region of DMIC to facilitate large scale
investments for the commercial and industrial development expected in DMIC
region. The site is located at a road distance of 11 km from Pari Chowk, Greater
Noida. The site abuts the Delhi-Howrah Railway line and Ajayabpur Railway station
is situated near the eastern periphery of the site and proposed Eastern Peripheral
Expressway is abutting southern boundary of the project site. The aerial distance of
the Sikanderpur (South east) town and NH- 91 (North East) are approximately 10km
and 6km respectively. The Dadri railway junction is also located approx. 9.5Km from
3 https://www.iitgnl.com/gnl-content/iit

13
the project site. As per the Greater Noida master plan, Sector Road of 80 m width
on North and 60m wide Sector Road on the West side are proposed. The proposed
Integrated Industrial Township is approximately 35km from Noida City which is one
of the significant industrial cities of the region and a major catchment for skilled
human resources beneficial for this upcoming development. The site is also in
proximity to other major proposed landmark developments of the region such as the
integrated transit facility at Boraki (approx. 4km) and the multi modal logistics hub
near Dadri (approx. 6km) that is likely to improve both the passenger and logistics
connectivity/movement to this industrial township.
B. Multi Modal Logistic Hub (Freight Village) at Dadri4
This Freight Village planned at Dadri is envisaged to function as a dry port
supplementing not just the storage, aggregation and export/import of industrial
freight in the region but also provide value added services that shall allow for
finishing of goods within the facility alongside commercial space to host the freight
companies. An integrated facility with all logistics infrastructure under one roof is
expected to boost the economic environment of the DMIC region to enable it to
compete successfully in the world marketplace. A design report has been prepared
based on the traffic projected for this entity as also the survey report made available
by the project client. This Freight Village project makes it an opportunity for the Client
and the Concessionaire to develop it as a commercially viable proposition.
The proposed Freight Village site is located in Dadri Tehsil of Gautam Budh Nagar
of Uttar Pradesh. The site is in close proximity of Delhi-Howrah Broad Gauge line in
the south west and NH 91 in North West. The UP Government has already initiated
the land acquisition process. The site identified for Freight Village located in Dadri
Tehsil in the planning boundaries of the city of Greater Noida and its extension. The
area indicated is earmarked for the Freight Village plot of 295.44 Ha in addition to
the area of 48.49 Ha for a railway flyover as the approach track to the Freight Village
4 Source: Detailed Project Report for Multi Modal Logistics Hub (MMLH)/ Freight Village and Multi Modal Transport Hub (MMTH) at Greater Noida in Uttar Pradesh under DMIC Project submitted on 12th February 2018 to Delhi Mumbai Industrial Corridor Development Corporation Limited

14
site. It sums up to the overall land area proposed for the facility which is 343.93 Ha.
The site of the Freight Village comprises of an area of about 343.93 Ha (849.87acres)
placed between NH-91 in the north-west and the Delhi-Howrah Broad Gauge line in
the south-west and an additional area of about 145.1 Ha (358.56 acres) between NH-
91and Eastern Peripheral Expressway (EPE) earmarked for future expansion.
[For detailed design information and descriptions, see the Project Report for Multi Modal Logistics
Hub (MMLH)/ Freight Village and Multi Modal Transport Hub (MMTH) at Greater Noida in Uttar Pradesh under DMIC Project submitted on 12th February 2018 to Delhi Mumbai Industrial Corridor
Development Corporation Limited] The development of the Project Area has the following objectives:
i. This DMICDC project envisages development of new industrial cities as
‘smart cities’ and converging new generation technologies across
infrastructure sectors and shall set a benchmark for further development in
the Greater Noida region showcasing the principles of sustainability by
providing a world-class destination for industries;
ii. To act as a catalyst for further development in the Project Area attracting

15
investments from private and public sector alike by providing a
development that is scalable; and
iii. This proposed Freight Village at Dadri will serve as a dry port having
facilities for not just storage, aggregation and export/import of industrial
freight in the region but also value added services such as banking,
insurance, shipping, simple assembly etc. as also other activities related to
finishing of goods within the facility alongside commercial space to host
freight companies.
C. Multi Modal Transport Hub at Bodaki, Greater Noida
The MMTH at Greater Noida has been planned with the key objective to create a
world-class intermodal transport station with provision of international level facilities
incorporating the Rail, Road and MRTS accessibility for the passengers, in a
seamless manner. The prime objectives associated with the proposed project are:
I. To strengthen the link between various modes of transport present in close
proximity, thus achieving the ultimate goal of a multi-modal interchange that
combines various modes and their associated functions in order to achieve a
better degree of transport network
II. Encourage integrated development of traffic movement & networks,
transportation facilities & their linkages and associated functions/ activities
prompting land use modifications to suit the context of the development
III. To provide world-class passenger movement facilities for the growing
population of the catchment zone catering to upcoming developments in the
UP Sub-Region of the NCR
IV. Development of transit facilities as per user rate, multiple mode linking and
passenger comfort and affordability
V. To have a holistic approach to commercial bases and their delineation along
avenues of relevantly related freight movement and logistics
VI. To promote single land use zones to facilitate correlativity between the various
activities that are related to transport and traffic networking

16
VII. To increase location efficiency by boosting transit ridership and minimizing
the traffic congestion within the region
VIII.To improve efficiency of station operations and services to passengers for the
increasing future passenger demand through modernization and expansion
of existing station facilities at Greater Noida
IX. To act as a catalyst for fueling growth within the investment region by
improving connectivity, providing accessibility, increasing efficiency and safety
in a way that benefits the entire region.
The MMTH is planned across an area of ~145 Ha (gross area). It will be bound by
Boraki Railway station to its west, the Integrated Industrial Township on the south-
east, Greater Noida area on the south, and NH 91 towards the north-west. The
proposed MMTH area (as defined below) has been divided into two distinct land
parcels Zone I & Zone II, by the Indian Railways/ Dedicated Freight Corridor (DFC)
tracks on the Delhi – Howrah route. The MMTH besides the above zones also
proposes to have a New Boraki Terminal station and a coach maintenance yard for
the Indian Railways. These have been planned in consultation with
[For detailed design information and descriptions, see the Project Report for Multi Modal Logistics
Hub (MMLH)/ Freight Village and Multi Modal Transport Hub (MMTH) at Greater Noida in Uttar Pradesh under DMIC Project submitted on 12th February 2018 to Delhi Mumbai Industrial Corridor
Development Corporation Limited]

17
2.2 Screening and Scoping of the SIA:
i. The study screens out “no significant impact” from those with significant impact
and get a broad picture of the nature, scale and magnitude of the issues.
ii. This is an initial assessment of likely impact and not meant to determine the
level of impact. It has only identified all of the issues and affected groups.
iii. It attempts to identify key social issues associated with proposed project and
specifies the project's social development outcomes.
iv. The study has taken into account various project components and the likely
impact in terms of land acquisition (loss of houses, livelihood, etc.), and
resultant involuntary resettlement and provide input (in term of magnitude of
impacts and likely costs for mitigation) in preparing appropriate mitigation
plans.
v. The proposed land being acquired is mainly an agricultural land and has no
significant community assets (e.g. school, community assets) including the
religious structures and common property resources (e.g. forest, garaging land)
the impacts of their loss on local population.
The land area proposed to be acquired for DMIC Project in this phase at four villages
for which this SIA study has been conducted is given below:
District Tehsil Village Acquisition Area (Hectare)
Gautam Budh Nagar
Dadri
Chamrawli Bodaki 12.5922 ha
Chithehra 47.5162 ha
Katehra 4.4672 ha
Palla 23.2868 ha
In order to ensure a humanitarian, participative, informed and transparent process
for land acquisition for development of infrastructure facilities, “The Right to Fair

18
Compensation and Transparency in Land Acquisition Rehabilitation and
Resettlement Act, 2013” was introduced by the Government of India. As required
under section 109 to 112 of the given Act, Government of Uttar Pradesh (Govt. UP)
issued “The Right to Fair Compensation and Transparency in Land Acquisition,
Rehabilitation and Resettlement (Uttar Pradesh) Rules, 2016 (RFCTLARR-
UP)”.The study has taken reference from there and is conducted in the same policy
framework.
3. Approach and Methodology for the SIA
3.1. Description of the Social Impact Assessment
The DMIC project is viable only by addressing vulnerability and financial security of
the population residing in the project affected area. In an ideal situation, any project
should not have any adverse effect on the population around however this is not
possible in entirety. The proposed Dadri-Ghaziabad-Noida Investment Region of
DMIC that includes three Early Bird Projects namely Integrated Industrial Township
at Greater Noida, Multi Modal Logistic Hub (Freight Village) at Dadri, Greater Noida
and Multi Modal Transport Hub at Boraki, Greater Noida will cause involuntary
resettlement of the PAFs across the four villages (Chamrawali Bodaki, Chithehra,
Katehra and Palla) that are being subsumed under this phase of land area
acquisition. However, the government is determined to address the security and
financial concerns of the PAFs of the four villages under the provisions of the law to
the great extent. Thereby, a social impact assessment is carried out to assess the
socio economic conditions of the PAFs and arrive at the estimate of the losses that
they will be compromising of in terms of: a) Assets- movable and immovable; b) Loss
of livelihood opportunities; c) Social structures with places of religious, symbolic or
cultural significance. The SIA report may further be used for putting together the
resettlement action plan to mitigate the adverse impacts of the affected population.
A comprehensive Social impact management plan (SIMP) has also been carried out
to make rehabilitation plan of PAPs after extensive stakeholder consultation.

19
The SIA report is essential and valuable in comprehending the existing social fabric
amongst the affected population and this can help in developing the subsequent
effective R&R plan. As per the RFCTLARR (UP) Rules, 2016, any infrastructural
project proposing the acquisition of land from the project affected families is required
to make adequate provisions for the PAFs in a way that ensures the improvement in
their social as well economic status post acquisition. A comprehensive social impact
assessment is the primary step towards assuring the same.
3.2 Rationale and Objective of the SIA
The overall objective of the Social impact assessment is to ensure that the project
addresses the adverse impact on the livelihood of the people and that nobody is left
worse off after implementing resettlement action plan and those affected have
access to project benefits, both during the project construction as well as operation.
The aim of the study is to address the issues of the Identified Stakeholders in terms
of directly or indirectly and positively and negatively affected PAFs; vulnerable
groups; PAFs, who might have an interest or feel that they are affected; affected
population whose cooperation, expertise, or influence would be helpful to the
success of the project.
The socio-economic report for this project undertakes preliminary investigation for
determination of social impact and public purpose in relation to proposed acquisition
of land required for development & construction of the project and for preparation of
Social Impact Management Plan in order to establish that the potential benefits and
the public purpose for the proposed acquisitions shall outweigh the social costs and
adverse social impact as determined by the Social Impact Assessment.
3.3 The Research Methodology
The SIA undertakes this study in line with the rules as defined in the “The Right to
Fair Compensation and Transparency in Land Acquisition, rehabilitation and
resettlement (Uttar Pradesh) Rules, 2016”. The methodology adopted to assess the
impact includes both qualitative and quantitative methods. The quantitative data

20
collection was done through structured socio-economic survey which incorporated
all the demographic details as well as the vulnerability status of project affected
people. The qualitative approach incorporates the primary information gathered
through site reconnaissance, community consultations, observations and focus
group discussions with PAFs in order to gather the necessary information on existing
demographic, socio-economic and cultural conditions in the required project area
and to develop a baseline for the survey.
3.3.1 Data needs and Information requirements
The land to be acquired consists of four villages namely Chamrawali Bodaki-
Chitehara-Katehra,-Palla in the Dadri district, UP. There are 58 Gatas in Chamrawali
Bodaki, 141 in Chitehara, 19 in Katehara and 75 Gatas in Palla to be acquired under
the project which makes a total Gata count of 293 with a total land mass of 87.8624
hectares spread as 12.5922 ha in Chamrawali Bodaki, 47.5162 ha in Chitehara,
4.4672 ha in Katehara and 23.2868 ha in Palla. The data needed a census survey
in order to conduct the Social Impact Analysis of the Project affected families (PAFs).
3.3.2 Data collection
The data collection continued for over two and a half months with regular visits and
contacts with the PAFs. Out of 293 Gatas in all, majority of the respondents were
very supportive and active in sharing the information required. A few of them chose
not to respond to the structured questionnaire however they were actively engaged
in discussions and sharing of their apprehensions and concerns regarding the
project and ongoing survey activities. Their responses were noted and duly
incorporated in the preparation of this report.
The data collection was done in two phases for the quantitative as well as qualitative
data requirements. For the detailed quantitative analysis, The SIA team visited the
four villages (Gautam Budh Nagar District) and surveyed the area that would be
affected by the project (both directly and indirectly). The primary survey was
conducted through structured questionnaire to gather the geographic and socio-

21
economic details of the PAFs of the project affected area which provided first hand
insights of the actual livelihood of the affected people and helped to understand the
geographic limits of the area and the people living there in a better way.
For the qualitative analysis, the SIA team conducted Focus Group Discussions
(FGDs) with the project affected families.
3.4 Tools Used to Collect Information
Since the methodology adopted is both qualitative and quantitative on nature, the
tools required are detailed as follows:
3.4.1 Socio-Economic Survey
For the quantitative study, socio-economic survey was developed to assess the
social and economic impacts on PAPs of the four villages. The primary survey was
conducted among the families (PAFs) and the family members (PAPs) affected by
the proposed project.
The survey was carried out by using a structured Socio-economic survey format.
This survey was conducted to generate baseline information on socio-economic
conditions of the PAFs and PAPs and also to assess the extent of impacts due to
proposed project. The survey was administered to the head of the household
preferably; otherwise an adult member of the household was requested to provide
the responses. The socio-economic questionnaire was developed keeping in view
the aims and objectives and baseline data needed for assessing the socio-economic
conditions of project affected persons with specific concerns to vulnerable sections
of the society (SC, ST, Women headed households, Disabled, Elderly Persons, etc.)
for monitoring the status of project affected people during and after the
implementation of project, if any. The socio-economic questionnaire format also
covered the thematic areas as per Form III of the RFCTLARR (UP) Rules, 2016.
The survey questionnaire to assess Social Impact of PAFs was based on Tendulkar
Committee (2009) which was conceptualized as: people’s way of life, their culture,

22
their community, their political systems, their environment, their health and
wellbeing, their personal and property rights, their fears and aspirations.
The detailed survey questionnaire consisted of 10 parts. The socio-economic survey
format covered data generation through the following sections:
Demographic details of the project affected families- PAFs
Kinship, education and occupation patterns of the project affected people (all
the members of the affected families)- PAPs
Land ownership/use and livelihood
Trees and Crops details and patterns
Poverty levels and vulnerable groups
Quality of life (potable water, toilets, electricity etc.)
Common resources and public amenities
Finally, the structured survey also collected the data about the perceived impact on
land, livelihood and income; physical resources; private assets, public services and
utilities etc.
The questionnaire also focused on determining the vulnerability of PAFs due to their
land being acquired for the project. As per Tendulkar Committee report (2009),
vulnerability is defined as the diminished capacity of an individual or group to
anticipate, cope with, resist and recover from the impact that is caused either due to
man-made or natural hazard. Physical, economic, social and political factors
determine the level of vulnerability among people. Examples of potentially vulnerable
groups include displaced population, migrants, returnees, young children,
dependent women, widows, elderly people and disabled persons. The vulnerability
thus developed for the questionnaire addressed the Physical Vulnerability,
Economic Vulnerability, Social Vulnerability as well as Emotional Vulnerability of the
PAFs. The structured socio-economic survey thus developed was distributed in
person among the PAFs of the four villages.

23
3.4.2. Community Stakeholder Consultations and FGDs
In order to support the quantitative findings, the detailed discussions were held with
community stakeholders and various focus group discussions were conducted to get
the primary feel and understanding of PAPS in relation to proposed project. The
main objectives of these consultations were to promote public understanding of the
proposed project and find out meaningful solutions of developmental issues such as
local needs and problems, loss of livelihoods, impact on religious structures,
alternatives, resettlement issues, etc. The community consultations were aimed at
generating data pertaining to the entire community, as perceived by the people of
these communities and their concerns regarding the proposed project.
The FGDs were conducted after the socio-economic survey, in order to understand
the backgrounds and demographic composition of the PAPs, so as to have a better
understanding of their perceptions. The visits were announced ahead of time, so that
the project affected people had ample time to schedule and respond to the surveyor.
In addition, spot consultations in groups and individual consultations were also held
at several places during the field survey work. Outcome of the consultations was
shared with the design team for integrating the social concerns wherever feasible.
3.4.3 Overview of Information and Data Sources Used
Information for the report was collected from both primary and secondary sources.
Primary source of data collection included the survey and stakeholder consultations.
The secondary sources of data are listed below:
Primary census data highlights for Uttar Pradesh- Census 2011
(http://www.censusindia.gov.in/2011census/PCA/PCA_Highlights/PCA_High
lights_UP.html)
District Census handbook, Gautam Budh Nagar; ‘Village and Town wise
Primary Census Abstract’
(http://censusindia.gov.in/2011census/dchb/0910_PART_B_DCHB_GAUTA
M%20BUDDHA%20NAGAR.pdf)

24
Agriculture Census Data 2010- 11
(http://agcensus.dacnet.nic.in/statesummarytype.aspx)
Right to Fair Compensation and Transparency in Land Acquisition,
Rehabilitation and Resettlement Act, 2013
Right to Fair Compensation and Transparency in Land Acquisition,
Rehabilitation and Resettlement (Uttar Pradesh) Rules, 2016
Land Records from the Revenue Department
Project Report for Multi Modal Logistics Hub (MMLH)/ Freight Village and
Multi Modal Transport Hub (MMTH) at Greater Noida in Uttar Pradesh under
DMIC Project submitted on 12th February 2018 to Delhi Mumbai Industrial
Corridor Development Corporation Limited
https://www.dmicdc.com/about-DMICDC
https://www.iitgnl.com/gnl-content/overview
Source: Census, 2011 (https://www.censusindia2011.com/uttar-pradesh/gautam-buddha-nagar/dadri-population)
District Census Handbook, Gautam Budh Nagar, Uttar Pradesh, The Census of India 2011 [Series 10, Part XII-A] Pages: 44-51
3.5. The SIA Team and their Area of Expertise
The team responsible for conducting the Social Impact Assessment and for
formulating the SIA report is as follows:
1. Prof. N. P. Melkania (Environmental Sciences) Chairperson
2. Dr. Om Prakash (Language and Content Writing) Member
3. Dr. Manisha Sharma (Statistics & Operations) Member
4. Dr. Vinod Kumar Shanwal (Education) Member
5. Dr. Rakesh Kumar Srivastava (Finance & Economics) Member
6. Dr. Vivek Kumar Mishra (Political Science) Member
7. Dr. Prakash Chandra Dilare (Sociology) Member

25
3.6. Schedule of the Study and Consultation with Stakeholders
S. No. Date Place Meeting and Consultation
1. 22.05.2020 Greater Noida
ADM-LA Office
The letter received from the DM/ADM-
LA vide 8023/08-ADM-LA/Greater
Noida/Gautam Budh Nagar
2. 30.05.2020 GBU
Greater Noida
Meeting with Greater Noida Authority
in the Office of the Nodal Officer
3 11.06.2020 GBU
Greater Noida
Notification of the constituting of the
SIA Team
4 12.06.2020 GBU
Greater Noida
Meeting of the SIA Team in the Office
of the Chairperson
5 26.06.2020 Greater Noida
ADM-LA Office
Submission of the Terms of
Reference to the approving authority
6 27.06.2020 Lucknow Approval of the ToR
7 28.06.2020 GBU
Greater Noida
Pre-survey work begins in
consultations with the concerned
Tehsildar and Lekhpal of Dadri Tehsil
8 09.07.2020 GBU
Greater Noida
Meeting with the SDM in the Office of
the Nodal Officer
9 14.07.2020 GBU
Greater Noida
SIA Team meeting and review of the
work in the Office of the Chairperson
10 16.07.2020 GBU
Greater Noida
Final Questionnaires ready and
reviewed
11 24.07.2020 Dadri Tehsil Site Visit (Chamrawli Bodaki and
Palla)
12 25.07.2020 Dadri Tehsil Site Visit (Kathehra and Chithehra)
13 26.07.2020
onwards Dadri Tehsil
Site Visit for FGD and Data
Collection
14 01.10.2020
onwards Dadri Tehsil
Site Visit for FGD and Validating of
the Data
15 25.10.2020 GBU
Greater Noida Compilation of Data and Analysis
16 12.11.2020 GBU
Greater Noida
Draft of Report submitted for the
scheduling of Public Hearing

26

27

28
4. Socio-Economic profile of Impact Zone
4.1. Overview of UP and Project Influence Area
The project is located in the Dadri Tehsil of Gautam Budh Nagar, District of Uttar
Pradesh. Uttar Pradesh is located in the northern part of the country, between 77°3’E
to 84°39’E longitudes and 23°52’N to 30°28’N latitudes. In terms of area it is the
fourth largest state in India and covers an area of about 2,40,928 sq. km, which
accounts for 9 percent of the total area and 16.5 per cent of the population of the
country. The State is bound on the west by Rajasthan, Haryana and Delhi to the
north-west, Uttarakhand and the country of Nepal to the north, Bihar to the east,
Madhya Pradesh to the south and touches the states of Jharkhand and Chhattisgarh
to the south east. The State is organized into 75/83 districts, and 307/316 tehsils and
821/901 development blocks. About 78% of the total population of the state resides
in rural areas. An overview of the State is presented below in Table 4.1:
Table 4.1: Overview of Uttar Pradesh
Indicators
Area (Sq. km) 240928
Household (No.) 33448035
Total Population 199812341
Rural Population (%) 77.7
Urban Population (%) 22.3
SC Population (%) 20.7
ST Population (%) 0.6
Sex ratio (females/1000 males) 912
Overall Literacy (%) 67.7
Female Literacy (%) 57.2
Contribution to Gross State
Domestic Product (2013-14)
Agriculture and allied (%) 16.6
Agriculture (%) 15.0
Industry (%) 16.2
Mining and Quarrying (%) 0.7

29
Manufacturing (%) 9.0
Services (%) 42.5
Annual Rainfall (average mm) 990
Workforce Participation rate (%) 32.9
Male workers (%) 75.7
Female workers (%) 24.3
Main workers (%) 67.8
Marginal workers (%) 32.2
Source: Census, 2011 (Has been presented according to Census, 2011)
The state of Uttar Pradesh is characterized by the pre-dominance of the agricultural
sector with heavy dependence on monsoon, high percentage of marginal and small
land holdings, high population pressure, high incidence of poverty, low literacy rate,
unemployment and low per capita income, small manufacturing sector. The share of
agriculture has been declining, but even then it continues to play a major part of the
economy in terms of employment. It employs about 60% of the work force who
continue to depend on agriculture and allied activities as a prime source of their
livelihood and contributes less than one third of the State income.
Uttar Pradesh is a major food grain producing State in rice, wheat, chickpea and
pigeon pea. Sugarcane is the principal commercial crop of the State, largely
concentrated in the western and central belts of State. U.P. is also a major producer
of vegetables, fruits and potato. The per capita availability of land has been declining
with the increase of population. The average size of land holdings in the State is only
0.86 hectare, while 75.4 per cent of holdings are below one hectare.
4.2. Project Influence Area- Dadri Tehsil
The proposed project lies in Dadri, a tehsil (block/sub-district) in the Gautam Budh
Nagar district, which lies in the western part of Uttar Pradesh. Dadri is located at
28.550°N 77.553°E. It has an average elevation of 216 metres (709 ft). Dadri is a
Tehsil located in Gautam Buddha Nagar district of Uttar Pradesh. It is one of 3

30
Tehsils of Gautam Buddha Nagar district. There are 110 villages and 6 towns in
Dadri Tehsil. As per the Census India 2011, Dadri Tehsil has 234537 households,
population of 1110093 of which 601465 are males and 508628 are females. The
population of children between age 0-6 is 160174 which is 14.43% of total
population. The sex-ratio of Dadri Tehsil is around 846 compared to 912 which is
average of Uttar Pradesh state. The literacy rate of Dadri Tehsil is 70.97% out of
which 76.72% males are literate and 64.17% females are literate. The total area of
Dadri is 578.97 sq.km with population density of 1917 per sq.km. Out of total
population, 29.46% of population lives in Urban area and 70.54% lives in Rural area.
There are 10.26% Scheduled Caste (SC) and 0.2% Scheduled Tribe (ST) of total
population in Dadri Tehsil.
Table 4.2: Overview of Dadri Tehsil5
Indicators Details
Geographical Location and Coordinates Latitude 28.550°N
Longitude 77.553°E
Number of Households 234537
Population 1110093
Male Population 601465 (54.18%)
Female Population 508628 (45.82%)
Children Population 160174
Area 578.97 km2
Population density/km2 1917
Sex-ratio 846
Literacy 70.97%
Male Literacy 76.72%
Female Literacy 64.17%
Scheduled Tribes (ST) % 0.2%
Scheduled Caste (SC) % 10.26%
5 https://www.censusindia2011.com/uttar-pradesh/gautam-buddha-nagar/dadri-population.html

31
Dadri Urban & Rural Population:
Out of total population, 50% of population lives in
Urban area and 60% lives in Rural area
Number of households 180714 53823
Total Population 783094 326999
Population (%) 54.63% 46.88%
Male Population 427766 173699
Female Population 355328 153300
Sex Ratio 831 883
Literacy (%) 73.35% 65.29%
Table 4.3: Number and Percentage of Main Workers, Marginal Workers, and Non- Workers by Sex in Dadri Tehsil, Census 2011
Persons / Males / Females
Total population
Main workers Marginal workers
Total workers (Main and marginal)
Non workers
Number % Number % Number % Number %
Persons 1110093 327863 29.53 65044 5.86 392907 35.39 717186 64.61
Males 601465 269586 44.82 40113 6.67 309699 51.49 291766 48.51
Females 508628 58277 11.46 24931 4.90 83208 16.36 425420 83.64
Table 4.4: Distribution of Workers by Sex in Four Categories of Economic Activity
in Dadri Tehsil, Census 2011
Persons / Males / Females
Total Population
Total number
of workers
(Main + Marginal)
Category of workers
Cultivators Agricultural
Labourers
Household
Industry
workers
Other
workers
Persons 1110093 392907 27760 18250 21594 325303
(35.39) (7.07) (4.64) (5.50) (82.79)
Males 601465 309699 22037 14028 14874 258760
(51.49) (7.12) (4.53) (4.80) (83.55)
Females 508628 83208 5723 4222 6720 66543
(16.36) (6.88) (5.07) (8.08) (79.97)

32
Table 4.5: Distribution of Villages according to availability of Different Amenities
in Dadri Tehsil, Census 2011
Number
of
inhabited
villages
Type of amenity available Type of amenity available
Ed
uca
tio
n
Me
dic
al
Imp
rove
d
dri
nkin
g
wa
ter
Po
st
Off
ice
Te
lep
ho
ne
Tra
nsp
ort
Ba
nks
Ag
ricu
ltu
ral
Cre
dit
So
cie
tie
s
Ap
pro
ach
by
pu
cca
ro
ad
Po
we
r
supply
71 67 52 69 17 71 28 6 3 69 69
% (94.37) (73.24) (97.18) (23.94) (100) (39.44) (8.45) (4.23) (97.18) (97.18)
TABLE 4.6: Number and Percent of Rural Population served by Different
Amenities in Dadri Tehsil, Census 2011
Total
population
of
inhabited
villages
Type of amenity available
Type of amenity available
Educatio
n
Me
dic
al
Imp
rove
d
dri
nkin
g
wa
ter
Po
st
Off
ice
Te
lep
ho
ne
Tra
nsp
ort
Ba
nks
Ag
ricu
ltu
ral
Cre
dit
So
cie
tie
s
Ap
pro
ach
by
pu
cca
ro
ad
Po
we
r
supply
194979 194790 165788 194973 90028 194979 107760 42290 12492 192534 194973
(99.9) (85.03) (100) (46.17) (100) (55.27) (21.69) (6.41) (98.75) (100)
Source: Census, 2011 (https://www.censusindia2011.com/uttar-pradesh/gautam-buddha-nagar/dadri-population), and District Census Handbook, Gautam Budh Nagar, Uttar Pradesh, The Census of India 2011 [Series 10, Part XII-A] Pages: 44-51
4.3. Socio-economic Profile of Direct Impact Zone This section presents an overview of the four villages “Chamrawali Bodaki-
Chitehara – Katehara – Palla” that is going to be affected by the proposed project.
The following table provides a combined summary of data about the project affected
village as per census 2011 and compiled by SIA report.
Table 4.7: Overview of villages “Chamrawali Bodaki- Chitehara – Katehara – Palla”
Indicators
No. of Households 293
Population (No.) 2548

33
Male (%) 53.02
Female (%) 46.98
SC (%) 0.51
ST (%) 0.26
OBC (%) 92.80
Sex Ratio (females/1000males) 886
Overall Literacy (above 6 years) (%) 82.00
Male - % 91.6
Female - % 73.0
Total Workers (%) 28.23
Total Workers (Male) - % 37.67
Total Workers (Female) - % 00.00
Main Workers (as % of Total Workers) 62.24
Distribution of main
workers - %
Agriculture Cultivator - % 37.00
Business - % 6.00
Government Service - % 7.00
Private Service -% 13.00
Artisan - % 5.00
Labour - % 6.00
Agriculture Labour - % 7.00
Unemployed - % 19.00
Marginal workers (as % of total workers) 37.76
Distribution of marginal
workers - %
Agriculture Cultivator - % 22.00
Artisan - % 2.00
Labour - % 5.00
Agriculture Labour - % 34.00
Unemployed - % 37.00
The sex ratio in DIZ of “Chamrawali Bodaki- Chitehara – Katehara – Palla” is 886
that are lower than that of Dadri Tehsil 877 and remarkably lower than the state
number of 912 females per thousand males. Female work force participation is

34
almost nil, although they contribute in house hold and agricultures activity but not
earners in the family. Overall the unemployment rate is very high which is 36.8%
amongst main workers and 37% amongst marginal workers. A substantial population
is engaged in as self-Agriculture cultivator which is 37% amongst main workers and
34% amongst marginal workers as Agriculture Labour. The area consists of very thin
0.51% of scheduled castes and an almost nil population of scheduled tribes as
0.26%, as according to the 2011 census data and also observed by survey, its
largely have around 92.8% OBC population in the project affected area.
5. Land Assessment of the PAFs 5.1 Land Holdings in Chamrawali Bodaki - Chitehara – Katehara – Palla
The land holdings of the PAPs range from less than half a hectare up to above 3
hectares. The majority of the land holders are consolidated within the bracket of 0 to
1 hectare. As per the RFCTLARR Act, 2013, marginal farmers in irrigated land are
defined as those having holdings below 0.5 Ha and small farmers as those with
holdings between 0.5 to 1 Ha. As can be seen, from the table 5.1, there are large
numbers about 82.59 percentage of landholders who are marginal and merely
12.97% of the landholders can be categorized as small farmers. As per the village
Land Records and household (Annexed), the landholdings for Gautam Budh Nagar
district, almost 88.82 % of agricultural holdings can be categorized as marginal and
small farmers, which is almost in similar pattern as distribution found in India across
and in Uttar Pradesh as per Agriculture Census 2015-16. The average land
holding in the district is 0.83 hectares as per the 2011 agriculture census.
Table 5.1: Distribution of Land holding amongst PAFs
Area of Land Holding Percentage
0-0.5 Hectare (Marginal) 82.59
0.5 -1 Hectare (small) 12.97
1-2 Hectare 04.09
2-4 Hectare 0.34
> 4 Hectare Nil
Source: Primary Survey undertaken in September – October 2020

35
As per, Agriculture Census 2015-16 (6th August 2019) All India Report, the small
and marginal holdings taken together (0.00-2.00 ha.) constitute 86.08%, the Semi-
medium and Medium operational holdings (2.00-10.00 ha.) is only 13.35% and the
large holdings (10.00 ha. & above) is merely 0.57% of total number of holdings in
2015-16.
Percentage distribution of number of operational holdings for All Social
Groups (2010-11 & 2015-16) in Uttar Pradesh
Uttar Pradesh
Marginal Small Semi medium
Medium Large
Agriculture Census 2010-11
79.45 13.01 5.72 1.71 0.11
Agriculture Census 2015-16
80.18 12.63 5.51 1.58 0.10
5.2 Land Requirements and Present Land Use
The total land required in this phase for the project is 87.8624 Hectares. The
proportion of land being acquired is carved out of the four villages “Chamrawali
Bodaki- Chitehara – Katehara – Palla” of Dadri Tehsil as mentioned earlier. This
change in land use from agricultural to transport for DMIC and MMLT was sanctioned
by the Government of Uttar Pradesh in March 2020. The current use of the land is
majorly agricultural in nature. Majority of the required land to be acquired from the
four villages “Chamrawali Bodaki- Chitehara – Katehara – Palla” consists of private
agricultural land plots, almost 100%. As per the revenue records and revenue maps
superimposed with the proposed DMIC Project layout, there are a total of 293 land
plots or gata sankhya as they are called, that will be subsumed under the Direct
Impact Zone. As such, according to the land records, primary survey and revenue
records there is marginal amount of land is utilized for structures, drainage and
roads, and storage areas like pits for storing manure. 13-15% number of PAPs who
hold lands in the direct impact zone reside in the direct impact zone and about 85%
of PAPs reside outside of the DIZ.

36
Fig 5.2.1: Landowners residing outside of the impacted area
5.3. Crops in the Area The current use of the land is majorly agricultural in nature. The major crops grown
are Wheat (40%), Paddy/Rice (32%), Jwar (21%) and followed by Bajra (5%) and
other small crops (2%). On average, four crops are grown every year and more than
seventy percent of the total land is estimated to be irrigated and remaining used for
keeping animals mainly cows/buffalos as animal husbandry is another second major
source of income and large number of PAFs involved in animal husbandry. The
figure below depicts the Net Sown Area (NSA) of the land:
Figure 5.3: Crop distribution by area
15%
85%
Residing status of PAFs in the DIZ
PAFs residing in the DIZ
PAFs residing outside the DIZ
40%
5%21%
32%
2%
Distribution of major crops
Wheat
Bajra
Jwar
Paddy/Rice
Others

37
6. Estimation and Enumeration
6.1. Households and Structures Enumeration The total size of the proposed land for DMIC project, at Dadri in this phase for which
this SIA study has been conducted is 87.8624 ha, which mainly consists of
agriculture land. The area under DIZ is the proportion of land being acquired is
carved out of the four villages “Chamrawali Bodaki- Chitehara – Katehara – Palla”
of Dadri Tehsil that consist some residential/commercial or residential cum
commercial structure even one school also, as about 13-15% of the PAFs have
raised some structure for residential purpose and mainly keeping animals as being
in business of animal husbandry, about 5% of the PAFs have raised boundary also,
otherwise remaining land is only agricultural plots.
6.2. Typology of Structures in the DIZ
The entire agricultural land includes total 293 gatas or plots with more than 390
claimants with a total population of 2548 people. Along with these, they also have
tube-wells for water, boring-wells, and well-structured cowsheds or shelters for
animals which are mostly semi-permanent in nature. They also possess cattle mainly
buffalo, cows and goats.
.
6.3. PAPs in the Direct Impact Zone Though the plot owners have a total population of 2548 people but the village is not
a residential unit. The entire land is used only for the agricultural purpose. However,
by the passage of time as the family grows about 13-15% of the PAFs have raised
some structure for residential purpose and for keeping animals as being in business
of animal husbandry, about 5% of the PAFs have raised boundary also, otherwise
remaining land is only agricultural plots. Thereby there is some relocation associated
with the people of the village. The percentage of populations according to their ages
is given as follows:

38
PAPs upto 18 PAPs between 18-35
PAPs between 35-50
PAPs between 50-60
PAPs above 60
29.12% 32.54% 22.37% 6.28% 9.69%
The table indicates that a large percentage of the population falls substantially in the
range of 18-35 years (32.54% as consolidated) and 29.12% are up to 18 years. This
illustrates that the project affected households PAFs/PAPs have a significant
number of very young, employable as well as dependent population.
ENUMERATION OF PAPs
VILLAGES CHILDREN < 18 MALES FEMALES TOTAL
1. CHITEHRA 328 477 446 1251
2. KATEHRA 103 93 86 282
3. PALLA 143 180 165 488
4. BODAKI 169 183 175 527
Total no of PAP's 2548

39
7. Socio-economic profile of PAPs
7.1 Demographic Details of PAPs
The four villages “Chamrawali Bodaki- Chitehara – Katehara – Palla” consists of a
total Gatas [58 + 141 + 19 + 75 (respectively) = 293] i.e. Khasra (Plots) with a total
area of 87.8624 Ha; however many of the gata has more than one claimants
because of the internal division of the family and descendants thereon. Thereby, the
total number of claimants or PAFs from the villages “Chamrawali Bodaki- Chitehara
– Katehara – Palla” appears to be approximately 389 (as per the Bhulekh Records,
Government of Uttar Pradesh) with a total population of 2548. The average
household size is 8.69 i.e. 8-9 members per gata number or 6.5 i.e. 6-7 claimant
family wise for the direct impact zone.
7.1.1 Age profile of PAFs
A major portion of PAFs belong to 40-60 and 60-80 years, very thin around
4.86% belong to above 80 years.

40
7.1.2 Gender composition of PAFs
7.1.3Educational profile of PAFs
24%
22%25%
14%
9%6%
Educational qualification of PAFs
Illiterate
Upto 8th std
10th std
12th std
Graduation
Post Graduation

41
7.1.4 Social Categories of PAFs
In the distribution of social categories indicates that 92.80% of the PAPs belong to
the OBC category, while merely 6.43 % belong to general category. Whereas, the
presence of SC and ST category are very thin almost negligible.
7.1.5 Religious profile of PAFs
100%
0%0%0%0%
Religious Profile of PAFs
Hindu
Muslim
Sikh
Christian
Other

42
As per the findings of the socio-economic survey, only one religions reside in the DIZ
with 100% population of Hindu There are no other religions present in the direct
impact zone.
7.1.6 Monthly income of PAFs
7.1.7 Source of Income

43
7.1.7a Agricultural source of income
7.1.7b Non-agricultural source of income

44
7.2. Demographics Details of PAPs
7.2.1 Gender Composition of Impact Zone
The demographic data as shown in graph below indicates that the males constitute
53.02% of the PAPs while females constitute 46.98%. This ratio reflects the
marginally low sex ratio that is existent at the district level, as indicated by the 2011
census.
Figure 7.2.1: Gender composition in the DIZ
Source: Primary Survey
7.2.2 Age Groups The bar diagram below shows the age and gender-wise distribution of the PAPs that
were surveyed. The highest number of women as well as men fall within the age
bracket of 0-18 and 18-35 years of age which signifies that majority of the people
in the direct impact zone are of employable age and in their primes.

45
Figure 7.2.2: Gender wise age profile of PAPs
Source: Primary Survey
The percentage of populations according to their ages is given as follows: PAPs upto 18 PAPs between
18-35 PAPs between 35-50
PAPs between 50-60
PAPs above 60
29.12% 32.54% 22.37% 6.28% 9.69%
The figures indicate that a large percentage of the population falls substantially in
the range of upto 35 years (61.66% as consolidated). This illustrates that the project
affected households have a significant number of young, employable as well as
dependent population.
7.2.3 Literacy Levels The overall educational profile of the DIZ is indicative of a comparatively fair literacy
ratio of the four villages in Dadri tehasil. The overall level of literacy of the area is
high with 82 % of the population as literate. A substantial population is well educated
at primary and secondary level and a good number of graduates is also there.
However, the illiteracy ratio still stands tall at 18%.

46
Figure 7.2.3a: Literacy profile of PAPs
Source: Primary Survey
There exists a gap between the literacy levels of females, which is considerably
lower than that of the males in the direct impact zone. The area total of 27.0 %
women, who have had no formal education amongst the PAPs in the project impact
zone, as compared to the number of illiterate men is approximately 8.41%. However
the silver lining is that both men and women have a significant contribution at primary
level and upto 8th standard. However, it is significant to note that onwards 10th, 12th
and up to Post Graduation the proportion of female decreases as compared to male,
indicate that large number of female fail to continue their education after 8th standard.
A small amount of the population also has had vocational trainings like fashion,
health workers with ASHA or Anganwadis.
18%
23%
19%
18%
13%
6%3%
Educational Qualification of PAPs
Illiterate
Upto 8th
10th
12th
Graduate
PostGraduate
Any other skills

47
Figure 7.2.3b: Gender wise educational profile of PAPs
Source: Primary Survey
7.2.4 Youth Educational Profile The youth (19-35 years) of the project affected area (the four villages) consist of a
substantial population which is 32.54%. During SIMP, it is important to engage this
youth in various jobs according to their educational profile and skill levels. Below is
the detailed educational youth profile of the PAFs along with stream wise distribution
to have a better insight towards their allocation in befitting jobs as per their
competency and qualification. Refer figure 7.2.4a and 7.2.4b to 7.2.4c.

48
Figure 7.2.4a: Youth Literacy Profile of PAFs
The literacy profile among youth generation of PAFs is good. Only 4% of them are
illiterate and an encouraging 34% are graduates.
Figure 7.2.4b: Youth Literacy Profile of PAFs – Intermediate stream distribution
In intermediate education 65.45% are from Arts stream and merely 25.33% are from
science stream. Only 7.64% have opted Commerce stream.
4%13%
14%
25%
34%
10%
Youth literacy profile of PAPs
Illiterate
Upto 8th std
Upto 10th std
Upto 12th std
Graduate
Post Graduate

49
Figure 7.2.4c: Youth Literacy Profile of PAFs – Graduate stream distribution
The youth graduate population is very diverse from BA degree holders to
BSc/Bcom/MBBS and B.Tech. and along with graduation in some vocational stream.
Few of the youth (7%) are post graduate as well with a wide range of specializations
from MA/MSc/M.Com and even upt o MBA and MS/MD. However, large proportion
about 62% from Art stream and very few 4-5% having technical background. Apart
from formal education, few of the youth about 6-8 have done computer diploma
courses and few of them about 6-8 have also done ITI course.

50
Figure 7.2.4d: Youth Literacy Profile of PAFs – Post Graduation stream distribution
7.2.5: Occupation and Income Levels
7.2.5a: Occupational distribution of PAPs
Figure 7.2.5a: Occupational distribution of PAPs
Source: Primary Survey In the project affected area of the four Villages, Out of 293 gatas,
37%
6%7%13%
5%
6%
7%
19%
Occupational distribution of PAPs
Agriculture Cultivator Business Govt. Service Pvt. Service
Artisan Labour Agriculture labour Unemployed

51
The people of this area are engaged in various occupations. The number of
households dependent on agriculture and agriculture related activities mainly as
crop grower/cultivator, livestock and daily producers/keepers i.e. in animal
husbandry and as agricultural labor. There is a nominal number of households doing
various private jobs (10-12 %), very few of them are employed with government
services as well. Very few PAPs are involved in various artisans’ activities and
business & trade. However, a large proportion of about 19% are unemployed.
Whereas, women in the project affected area work mostly work at cultivating the
lands belonging to their own families, or in allied activities like animal husbandry.
They are not earning either formal or informal way, hence income generated by them
is not reflected in the survey responses as they are not seen as earning members in
their families. Amongst the number of recorded earning members, all of them are
males.
National Classification of Occupations-2015 (NCO-2015) - a report of
Government of India Ministry of Labour & Employment Directorate General of
Employment (www.ncs.gov.in) compatible to ISCO-2008 has a 8 digit coding
structure which was mapped and aligned to ISCO-2008. Coding is done as codifying
major group, sub-major group, minor group, unit group (family) respectively in order
of level of skill required. Broadly there are nine major divisions/classification of jobs.
NCO 2015 Divisions
Title Skill Level
1 Legislators, Senior Officials, and Managers Not Defined
2 Professional IV
3 Associate Professionals III
4 Clerks II
5 Service Workers and Shop & Market Sales Workers II
6 Skilled Agricultural and Fishery Workers II
7 Craft and Related Trades Workers II
8 Plant and Machine Operators and Assemblers II
9 Elementary Occupations I
Source: National Classification of Occupations-2015

52
The National Occupational Standards (NOS) is one of the most important
contributions of the National Skills Development Corporation (NSDC) to the skills
environment of India. This was done in affiliation with the Sector Skill Councils
(SSCs). The SSCs are the national partnership organization with NSDC that bring
together all the stakeholders – industry, labour, and the academia.
‘Skill’ has been defined as the ability to carry out the tasks and duties of a given job,
carrying two dimensions, first is skill level (A function that describes the range of the
tasks and duties involved) and second is skill specialization (means the field of
knowledge required, the tools and machinery used, the materials worked on, and the
kinds of goods and services produced)
The National Skills Qualifications Framework (NSQF) was brought out by National
Skill Development Agency. NSQF is based on an outcome-based approach and
each level in the NSQF is defined and described in terms of competency levels
that need to be achieved. The job roles corresponding to each of these competency
levels would be ascertained with the involvement of the industry through the Sector
Skill Councils (SSCs). As a competency-based and outcome-based qualification
framework, NSQF will facilitate Recognition of Prior Learning (RPL). NSQF will also
help to align Indian qualifications to international qualifications.
For the purpose of SIMP, it is significant to note that a 27% of PAFs are engaged at
the Elementary Occupation level (i.e. Skill I Level) and almost 51% of them are
engaged at 6th category level - Skilled Agricultural and Animal Husbandry (i.e. Skill
II level) and around 22% of them are engaged at 4th & 5th Category level – Clerks
and as Service Workers and Shop & Market Sales Workers (i.e. Skill II level).
7.2.5b: Income Profile of PAPs
The diagram below consolidates the income levels in DIZ. Based on the data
collected, it is observed that the income levels of the affected population is low with
major proportion earn less than 4000/- month, about 36% of PAPs. Very small
population (12.77 %) is earning above in the range of 20,000 – 50,000/- month. An

53
estimate of the total number of earning members in the area is around 510 out of
2548, i.e. the population dependency ratio is 5:1.
Figure 7.2.5a: Income profile of PAPs (Monthly)
Source: Primary Survey
7.3 Vulnerability Status The total land required for the project is 87.8624 Hectares carved out of total area of
2105 Hectares of the four villages “Chamrawali Bodaki- Chitehara – Katehara –
Palla” Dadri Tehsil, consisting of 293 land plots or gatasankhya mainly private
agricultural land plots with some 10-15% of PAFs as residential structure
which is to be subsumed under the Direct Impact Zone.
According to the land records and primary survey, the land to be utilized does not
occupy any common structures/properties. Further, 85-90% of PAPs who hold lands
in the DIZ do not reside there; rather they reside at other places i.e. outside of the
DIZ.
It is significant to note that a 27% of PAFs are engaged at the Elementary Occupation
level (i.e. Skill I Level) and almost 51% of them are engaged at 6th category level -

54
Skilled Agricultural and Animal Husbandry (i.e. Skill II level) and around 22% of them
are engaged at 4th & 5th Category level – Clerks and as Service Workers and Shop
& Market Sales Workers (i.e. Skill II level) as defined by NCO-2015 report. Majority
of them are using their land for farming & animal husbandry for their additional
source of earning and livelihood along with their engagements in other occupations.
Further, the youth (19-35 years) of the project affected area consist of a substantial
population which is 32.54%. The literacy profile among youth generation of PAFs is
fairly good, although only 5-6% have technical skills and more than 60% from Art
stream. Only 4% of them are illiterate and an encouraging 34% are graduates. Even,
only 10% of the youth are post-graduates as well with a wide range of specializations
from MA/MSc/M.Com and B.Tech. & MBA and even upto MS/MD. Seeing substantial
unemployment situation, they may be engaged in various jobs according to their
educational profile and skill levels under SIMP.
There is around 4-5% population in the DIZ which fall below the poverty line. They
have been allotted BPL card. However, majority of the population lies in the category
of APL, and next to them (25-26%) are availing ‘Antyodaya Scheme’. There are a
few households which are headed by single or widowed women, which were also
mentioned in the course of community consultations.
The socio economic primary survey of the four villages “Chamrawali Bodaki-
Chitehara – Katehara – Palla” of Dadri Tehsil that consist some
residential/commercial or residential cum commercial structure even one school
also, as about 13-15% of the PAFs have raised some structure for residential
purpose and mainly keeping animals as being in business of animal husbandry,
about 5% of the PAFs have raised boundary also, otherwise remaining land is only
agricultural plots, does bring the PAFS with considerable vulnerability for those who
are engaged in animal husbandry and have residential structure for their family (10-
15%) and semi-structure house for their animals. Thereby there is some relocation
associated with the people of the village.

55
More than 85% reside outside of DIZs but, The PAFs are majorly depending on
agricultural activities and animal husbandry and engaged in various jobs along with
a good number of PAFs are well educated, although majorly in Art stream, who want
to engage in various employment options as part of compensation brought against
the land acquisition. It is expected that the educated and young PAFs will utilize the
monetary compensation towards business avenues, higher education and
investment. The SIMP will also help towards women empowerment by offering them
various skill jobs and uplift their social structure which might eventually motivate the
girl child towards education and skill development.
Following are the few descriptions in figure to assess the vulnerability:
7.3.1 Economic Status

56
7.3.2 Info about Infant Mortality
7.3.2 Family Monthly Income
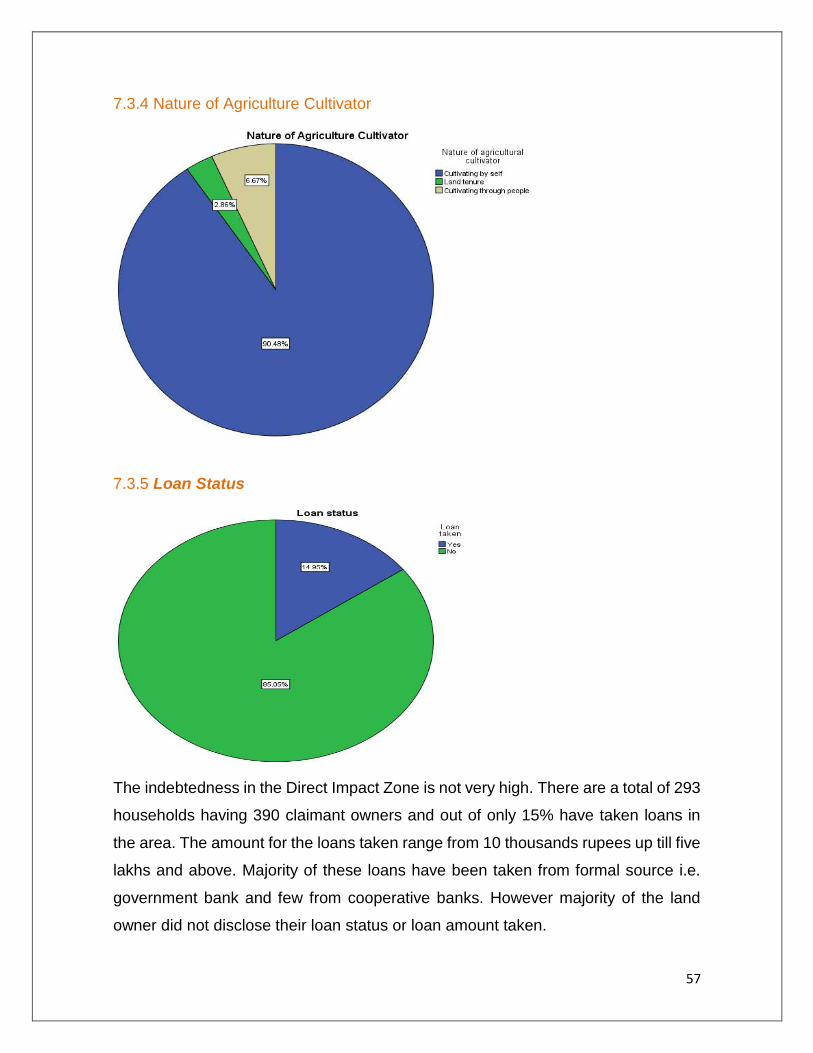
57
7.3.4 Nature of Agriculture Cultivator
7.3.5 Loan Status
The indebtedness in the Direct Impact Zone is not very high. There are a total of 293
households having 390 claimant owners and out of only 15% have taken loans in
the area. The amount for the loans taken range from 10 thousands rupees up till five
lakhs and above. Majority of these loans have been taken from formal source i.e.
government bank and few from cooperative banks. However majority of the land
owner did not disclose their loan status or loan amount taken.

58
7.3.6 Source of Loan
7.3.7 Formal Source of Employment of Women
0%
100%
Formal source of income of Women
Yes
No

59
7.3.8 Informal Source of Employment of Women
7.3.9 Concerns shared by PAFs
0%
100%
Informal source of income of Women
Yes
No
94%
87%85%
82%84%
87%85%
VULNERABILITY CONCERNS
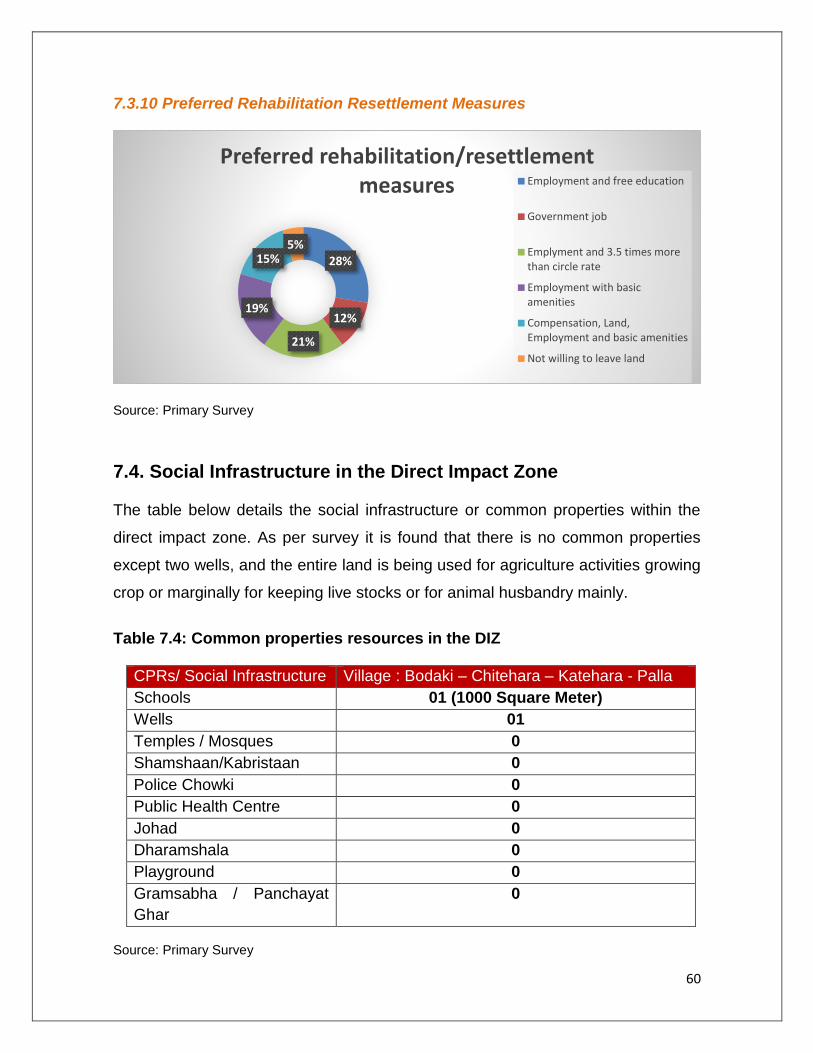
60
7.3.10 Preferred Rehabilitation Resettlement Measures
Source: Primary Survey
7.4. Social Infrastructure in the Direct Impact Zone The table below details the social infrastructure or common properties within the
direct impact zone. As per survey it is found that there is no common properties
except two wells, and the entire land is being used for agriculture activities growing
crop or marginally for keeping live stocks or for animal husbandry mainly.
Table 7.4: Common properties resources in the DIZ
CPRs/ Social Infrastructure Village : Bodaki – Chitehara – Katehara - Palla
Schools 01 (1000 Square Meter)
Wells 01
Temples / Mosques 0
Shamshaan/Kabristaan 0
Police Chowki 0
Public Health Centre 0
Johad 0
Dharamshala 0
Playground 0
Gramsabha / Panchayat
Ghar
0
Source: Primary Survey
28%
12%
21%
19%
15%5%
Preferred rehabilitation/resettlement measures Employment and free education
Government job
Emplyment and 3.5 times morethan circle rate
Employment with basicamenities
Compensation, Land,Employment and basic amenities
Not willing to leave land

61
7.5 Information Regarding Land and Livelihood The DIZ is primarily agricultural in nature and is a very fertile land. The following graphs detail the land demarcation for better inference.
7.5.1 Demarcation of DIZ As shared by PAFs, 64% of total DIZ is used for agricultural use and 36% of the land is utilized for non-agricultural use such as livestock cottages, some residential structures, other temporary structures etc. Figure 7.5.1: Demarcation of the total area of land owned by PAFs:
7.5.2 Demarcation of the agricultural land
The agricultural land is well irrigated and a major part of the area is very fertile. There
are many trees also in DIZ. PAFs use various water resources such as Boring,
Nahar/Boring, Tube well, Engine Boring, Govt. Tube well, Summer cell (Submersible
water pump) etc. as shared by them.
64%
36%
Demarcation of DIZ
Net agricultural use
Non-agricultural use

62
Figure 7.5.2: Demarcation of agricultural land
7.5.3 Current usage of DIZ
The PAFS use the land in different forms such as for agricultural purpose, tree
plantation, livestock cultivation for personal and commercial use and also for their
own domestic needs.
Figure 7.5.3: Usage of land
74%
13%
9% 1%
3%
Demarcation of agricultural land
Irrigated land
Non-irrigated land
Very fertile land
Non-fertile land
Land with tree plantation
59%
3%
2% 0%
28%
8%
Usage of DIZ
Agriculture
Plantation
Commercial
Industry/MSME
Domestic
Other

63
7.5.4 Cottages in DIZ for livestock
Many households have livestock in the DIZ area. They use them for the
agricultural, commercial as well as domestic purpose and the livestock have their
cottages in the DIZ area itself.
Figure 7.5.4: Cottage for Livestock
The land primarily being agricultural in nature, the cattle population is one of the
primary assets and that is why possession of cattle becomes a very important
component for the PAPs. The majority of the households own buffaloes (61%)
followed by cows (39%) which are used for milking and dairy purpose. Amongst the
project affected people, the following are the details of households owning different
types of cattle in DIZ comprising of all the villages:
61%
39%
Cottage for Livestock
Yes
No

64
Figure 7.5.5: Detail of livestock owned by PAFs
7.5.6 Status of Migration from DIZ
Although most of the PAFs reside in the four villages itself, only a small proportion
of the population has migrated for the higher education, employment, matrimonial
alliances etc.
Figure 7.5.6(a): Status of migration
30%
60%
10%
Types of Livestock
Cow
Buffalo
Others
3%
97%
Status of migration
Yes
No

65
Figure 7.5.6(b): Reason of migration
7.5.7 House owned by PAFs
Majority of the families are in the APL category and have their own houses around
DIZ. Only 5% of them do not have their own houses as depicted below:
Figure 7.5.7: House owned by PAFs
45%
49%
6%
Reason of migration
Education
Employment
Other
95%
5%
House owned
Yes
No

66
7.5.8 Private vehicles owned
The people of DIZ essentially use two-wheelers (70%) for regular commuting.
Around 22% of them use their own cars or four wheelers for mobility. Some of the
families have tractors as well used for agricultural activities.
Figure 7.5.8: Private vehicles owned
The PAFs have their own agricultural equipments such as Tractor, Thresher
Machine, Engine machine, Cultivator, Trolly, Wheat cutting machine, Lister Engine,
Diesel Engine etc.
7.6 Information about Trees on Land The DIZ consists of verity of trees majorly Neem, Shesham, Sagwan, Aam and Safeda. Following is the details about type of tree and approximate numbers as per survey.
70%
22%
5%3%
Types of private vehicles owned
Two wheeler
Four wheeler
Tractor
Others

67
Source: Primary survey
7.7 Information about Crops 7.8 Availability/Access to Natural or Common Resources Following is the details about the villagers of DIZ regarding use or access to natural
or common resources, public owned property like canals, ponds, tube wells, public
transport facility, road connectivity to their house, structure about nearest market,
participation in dairy cooperatives/ agricultural cooperatives, status about
membership as SHG or any other, source of energy for cooking, lighting, drinking
water, sanitation facility, bathrooms.
The area is well served with adequate amounts of water. The major sources of water are
hand-pumps, tube-wells, and wells. The public health engineering department also supplies
water to these villages but only few of the households are availing this facility. Water is also
sourced from the canal and boring for irrigation purposes. However, a large number of PAFs
have Hand-pumps as water resource. PAPs usually dispose waste that is generated in
the house by dumping it onto farmlands. They also use community waste dumping
sites that they term as ‘johad’, or outside of their village boundaries however proper
waste collection and waste disposal system is lacking in the area.
0.1
20
3
0.1
45
9
0.0
47
3
0.0
72
2
0.0
06
9
0.0
07
4
0.1
56
0.2
17
6
0.0
01
9
0.0
08
8
0.0
00
2
0.0
13
7 0.0
57
7
0.0
18
2
0.0
26
7
0.0
99
2
TREES DETAILS

68
7.8.1 Access to common or public owned property
7.8.2 Usage of Public Transport

69
7.8.3 Road connectivity
7.8.4 Visit to nearest market

70
7.8.5 Participation in dairy/agricultural cooperatives
7.8.6 Membership status
A large number of population is using LPG cylinder about 92.21 percent and merely
6.49% of the PAPs using firewood for cooking. Many of them use a combination of
LPG cylinders and firewood for cooking as well. A very nominal number of the

71
households use kerosene fueled burners or other mediums. This suggests that
almost all PAFs have easy access to cylinders or gas connection.
7.8.7 Sources of energy for cooking
Majority of the project affected households have access to electricity (91.3%). A very
few of the households use kerosene fueled lamps (about 6.60%) and the presence
of solar fuel is almost negligible. People do use pumps for irrigation in their fields
and these are mostly fuel based.
7.8.8 Resources of lighting

72
7.8.9 Sources of Drinking Water
Most of PAPs have indoor flush/pucca toilets (93.72%) within their homes. Some of
the people (about 5.5%) still persist with open defecation, and have kutcha or mud
pits for the same, but they are very low in numbers.
7.8.10 Sanitation Facility

73
7.8.11 Bathroom facility
7.9 Common Resources and Public Amenities The four villages “Chamrawali Bodaki- Chitehara – Katehara – Palla” in Dadri
Tehsil, consisting of 293 land plots or gatasankhya have community centers,
religious temples, schools, health facility centers, Anganwadi, PDS as common
resources and public amenities. There are primary, secondary as well as senior
secondary school. However, the villages are not facilitated with proper water supply.
The sewerage system is average and electricity availability is quite good. The road
connectivity is very good however it does not connect to all the houses. The crime
rate is comparatively very low.

74
7.10: Impact analysis of Acquisition of Land, Livelihood and Income 7.10.1 Increase in employment productivity

75
7.10.2: Increase in business opportunity
7.10.3: Increase in land price

76
7.10.4 Increase in public facility
7.10.5: Increase in formal employment productivity

77
7.10.6: Increase in standard of living
7.10.7: Increase in income

78
7.10.8: Increase in food security
7.10.9: Increase in women employment productivity

79
7.10.10: Impact in local economy
7.10.11: Increase in economic dependency

80
7.10.12: Increase in access of productive resources to people
7.10.13: Effect on wildlife

81
7.10.14: Status of wild plants and wild animals
7.10.15 : Specification of wild plants and wild animals
1 Wild Plant Unpamarg, Chirchita, Aankhen, Khajur, Jhund, Neem, Seesam, Keekar, Peepal, Aam, Deshi Medicine, Congresi Grass, Plant, Papri Bhang, Bakand, Jamun, Kattha, Guava, Popular
2. Wild Animal Neelcow, Siyar , Rabbit, Rose, Deer, Wild Pig, Fox, Bull, Lion, Monkey, Tiger, Dog, Snake, Swamp, Deer, Cow, Other Animals

82
7.11 : Impact Analysis of Physical Resources
7.11.1: Impact on soil
7.11.2: Impact on air quality

83
7.11.3 Impact on water source, water reserve and underground water table
7.11.4 Impact on forest reserve

84
7.11.5 Impact on noise pollution
7.11.6 Awareness of land acquisition

85
7.12 The Collective Inferences:
The total land required for the project is 87.8624 Hectares carved out of the four
villages “Chamrawali Bodaki- Chitehara – Katehara – Palla” Dadri Tehsil,
consisting of 293 land plots or gatasankhya mainly private agricultural land
plots with some 10-15% of PAFs as residential structure which is to be
subsumed under the Direct Impact Zone. This affected area is a small village
primarily engaged in agricultural activities along with animal husbandry with 10-15%
human inhabitants. The socio-economic and demographics of the village can be
summarized as follows with the help of primary data collection from the area:
I. The total area of land to be acquired for the project is 87.8624 Hectares. Almost
the entire land is currently used for the purposes of agriculture. The change in
land use, from agricultural to transport, specifically for the purposes of
establishing Delhi-Mumbai corridor has been granted by the government of Uttar
Pradesh.
II. The agricultural lands are irrigated lands in the four demarcated villages
‘Chamrawali Bodaki- Chitehara – Katehara – Palla’ located in Tehsil Dadri. The
landholding pattern indicates that majority of the landholders are small and
marginal farmers. This also resonates with the district level data.
III. The land though is use for agricultural purpose primarily however there are few
residential structures and livestock cottages in the land. The PAFs use these
livestock for milking and dairy purpose which is a major source of income for
them.
IV. The gender distribution of PAPs is not deviated on one side. However the
landowners are primarily male members of the family. The females though
almost equal in number is not the earning member of the family and they are
primarily engaged in household activities. All the PAFs are Hindu by religion.
There is a significant presence of other backward classes with a small presence
of scheduled castes and negligible presence of scheduled tribes in the project
impact area.

86
V. A large percentage of the population falls substantially in the range of upto 35
years indicating that the project affected households have a significant number
of young, employable as well as dependent population.
VI. The youth (19-35 years) of the project affected area of the four villages consist
of a substantial population which is 32.54%. During SIMP, it is important to
engage this youth in various jobs according to their educational profile and skill
levels. They can be employed as per their competency and qualification.
VII. The overall level of literacy of the area is high with 72% being literate. A
substantial population is well educated at primary and secondary level with a
good number of graduates and few postgraduates. Women record lower levels
of literacy as compared to the men.
VIII. The income level of the affected population is low with major proportion (36.45%)
belonging to up to Rs 4000/- per month, given the small size of land holdings.
And also 16.5% of them have no stable income. The occupational data also
shows that a large number of the people are dependent on their lands for their
livelihood- farming and allied work, there are only a few who have listed their
occupations and source of income from private services and government
services.
IX. Women’s occupation and income levels remain behind in the data collected. This
could be due to the fact that women work on their own farms, and rarely go out
to earn. Women’s occupation has mostly been recorded as housewives, as their
labor within the house and on their fields is not reflected as paid work.
X. Nearly two-third of the population lies in the category of APL whereas some of
them (25.91%) are also availing ‘Antyodaya Scheme’. There are a few
households which are headed by single or widowed women, which were also
mentioned in the course of community consultations.
XI. For the water supply, the major dependency is on hand pumps. Majority of the
population has access to private toilets. Open defecation is not extinct yet,
however prevalent in a very small number. Most of the PAPs use LPG and also
firewood as medium of cooking. Waste disposal is lacking in the area as there
is no prescribed method of collection, sorting or disposal of waste. PAPs usually

87
dump garbage into dirty drains, or at the ‘pokhars’ which are small rain-fed ponds
that form; or they dump it outside the boundaries of their own villages. The
people of DIZ essentially use two-wheelers for regular commuting and few of
them possess cars and tractors also. Amongst the cattle, the buffalo population
is the highest. They also have cows for dairy purpose. The cows and buffalos
are their major source of income.
XII. For the purpose of SIMP, it is significant to note that a 27% of PAPs are engaged
at the Elementary Occupation level (i.e. Skill I level) and almost 51% of them are
engaged at 6th category level-Skilled Agricultural and Animal Husbandry (i.e.
Skill II level) and around 22% of them are engaged at 4th & 5th Category level –
Clerks and as Service Workers and Shop & Market Sales Workers (i.e. Skill II
level) as defined by NCO-2015 report. It is thereby important to constructively
engage them in the prospective employment as per their skills and education.
XIII. The women in DIZ are highly vulnerable, owing to their illiteracy and status of
non-working population. For SIMP, their hidden skills need to be identified and
required training may be imparted for their social upliftment.
8. Public Consultations - FGD
8.1. Need for Focus Group - Public Consultations
In infrastructure and development projects that entail any relocation of population,
livestock and livelihood requires robust and socio-economically sound responses
from policy framing bodies. In this context, the Public consultation is an imperative
part of any development project and refers to the two-way transfer of information or
joint discussion between project proponent and the community. Such consultations
are required to make the project inclusive and responsive towards local population
and social ecology. It brings together all stakeholders, policy framing body and
various agencies to discuss and address key concerns and arrive at mutually
satisfying outcome. It is an approach of involving various stakeholders, particularly
local communities by providing them with a platform to express their views, concerns
and apprehensions on issues and/or activities, etc. that might affect them positively

88
or adversely and thereby enable them to influence the decision making processes.
Besides helping to identifying certain intangible impacts and plan effectively, it also
helps to communicate information, allay their fears and also helps build rapport with
the communities, which is very essential to smooth implementation of such projects.
The goal of such stakeholder participation is primarily to promote public
understanding and acceptance of a developmental activity or a project by minimizing
potential perceived environmental impacts through education and open discussion.
In return, public feedback can be used as constructive input into improving the
project design.
8.2 Focus Group - Research Design and Data Collection
Qualitative research followed exploratory research design. The SIA team has
conducted focus group discussions and in depth interviews with the villagers of
“Chamrawali Bodaki- Chitehara – Katehara – Palla” for qualitative study. This in
turn helped to extract explicitly many relevant issues related to their land acquisition,
livelihood, employment, social structure, living standard there upon etc.
Focus Group discussions, a kind of in- depth interview conducted in a group (a form
of group interview) are helpful in generating ideas for further investigations in the
study. Data collection for qualitative study was done through in-depth interviews and
focus group discussions. Focus Group application was particularly helpful in
furnishing information about how people think, feel, or act regarding a specific topic.
The moderator had a semi- structured, open ended set of questions and detailed
discussion with senior residents/farmer/head along with group participants where
these participants shared their opinion and ideas about the proposed land acquisition
for DMIC (Multi-Model Logistic Hub & Integrated Transport Hub and Approach
Track). They also shared their viewpoint and comments on each other’s answers.
Focus was on interaction inside the group. Five focus group discussions were
conducted in these villages with villagers. The focus group consisted of 8-10
participants.

89
To analyze the results of interviews and focus group, a mixture of techniques were
used like ethnography, content analysis, relational analysis. Ethnographic summary
means direct citations of group discussion. In content analysis, keywords and
themes were outlined and concepts were found, relational analysis where ideas were
examined, relationships between the concepts were explored and analyzed in order
to find commonalities and differences. These all approaches of qualitative data
analysis are complementary to each other.
It is interesting to note that, in the duration of conducting the survey as well as the
focused group discussions, all the PAFs agreed to the proposed DMIC project.
Majority of the people see it as a source of development, jobs, area development,
source of increase in land value in the surrounding areas, and a means of bringing
about urbanization. The survey teams and the members conducting the FGDs did
not face any difficulty during the collection of information or during the consultations.
The major concerns of the PAFs converge around a sense of loss their land,
livelihood and social ecology coupled with apprehension over the compensation
packages and the timely payment of such. Awareness regarding the project was
widespread and respondents even asked about when the DMIC would become
operational. It would be fair to say that the PAPs are not against the project, rather
they are looking forward to the development that will take place after the project in
the surrounding areas. The team found an overwhelming sense of curiosity to see
this project to be fully operational at the earliest possible.
8.3 Focus Group Study of “Chamrawali Bodaki- Chitehara –
Katehara – Palla”
The objective of Focused Group Discussions (FGDs) was to gather as much
information as possible about the lives of the Project Affected Families (PAF) about
the areas they live in, and their land-use arrangements, etc. FGDs with project-
affected people were carried out to get the community feedback to understand the
existing socio-economic conditions of the community, particularly of the vulnerable
group of the “Chamrawali Bodaki- Chitehara – Katehara – Palla” villages in Dadri

90
Block, Gautam Budha Nagar. It was carried out Gata wise respondents on during 23
- 31 October 2020.
The issues raised especially about nature of source of income, whether it is
agriculture or Non agriculture and proportion of non-agriculture, role of
Women in Family, use of their private assets for the domestic use or
Commercial purpose, level of poverty and BPL/APL card.
The participants were asked about the source of income of the PAF, they have
responded that agriculture and animal husbandry are the only source of income. In
agriculture, they are mainly growing crops such as; Wheat, rice/Paddy, Tilhan, Millet,
Barley, Pea and some other cash crops and involved in working in their own fields
and/or renting some fields to other villagers. In totality, they are using their land
entirely for the personal/domestic use and majority of them have APL card. Some
PAFs are also engaged in the low scale business activities like dairy, small scale
industry, small shops at the village level. Around 70 percent of PAF belongs to an
unskilled category and around 30 percent skilled, out of these skilled categories, they
are possessing B.Tech, ITI, B, Pharma, B.Ed, B.T.C, BBA, and Computer Diploma
holders. Under the skilled category around 10 percentare engaged in the
government sector and 20 percent in the private sector. The majority of women in
these villages are solely home maker i.e. working as a housewife and helping in
agriculture activity of their family, very few are engaged in government and private
sector jobs. In the government sector jobs includes Aanganbadi, ASHA worker and
school teachers.
FGD was focused on impact/effect of Land Acquisition in their PAPs
Employability, on earning capability, social position, Cultural ethos, Family
structure, mental wellness and ecological wellness.
Majority of them have negative perception about employability and fear about losing
jobs/engagement i.e. will get unemployed by losing lands.

91
The acquisition of living space and farming land will have hard effects on their
livelihood. Most of them have opined that after losing land will get dependent on the
market for the things they are getting from the fields free of costs like Milk,
Vegetables, and Grains etc. Acquisition of land will badly affect us and will change
lives drastically. With the expansion of the business sector, social status will be
adversely affected. ‘Our identity and that of the village will be destroyed which will
ruin our social life’ was the general perception.
‘Land acquisition will weaken the economic situation, which will adversely affect our
social life and role of Panchayati Raj culture will be weaken, which has so far have
importance in our lives’.
‘Giving land to the government means the dispersal of families as there will be no
reason for the generations to stay back. After the land acquisition the coming
generations will migrate to other cities in search of employment. Acquisition will be
the main reason for the breakdown of the family’.
Inconsequence, mental stress will increases, future worries will begin to persecute
and in fights under families will increases with compensation in monetary terms. The
future generations will get more money and their chances of deterioration in family
values increases. Ecology will be adversely affected, pollution will increase.
Their opinions/perceptions were discussed and sought regarding an increase
in employment productivity, business opportunity, land price, public facility,
formal employment productivity, standard of living in the affected area.
‘If the government ensures to give us employment in the proposed scheme, then our
employment will increase but if government fails to give us employment then we will
lose employment completely in this area’.

92
The proposed scheme will increase the industrial opportunities in the area, but the
rural people will be benefitted only if the government ensures at least 40% of our
participation in the scheme, otherwise the increase in industrial opportunities will not
be beneficial for the rural people i.e. PAPs.
This project will increase the income of the government and industrial houses but it
will not have any effect on the income of the rural people living in the surrounding
areas and there is more possibility of having its negative impact.
All of them were echoed that land prices will increases with the commencement of
the proposed scheme under project and there be an increase in public facilities, but
many of them shared on their past experience of earlier land acquisition, that the
industrial houses will exploit direct benefit from the project. As the common
perception prevails strongly that wherever the land had been acquired in the past,
the situation remains became adverse related to lively hood and employability and
its impact persist for even today.
Their opinion/perceptions were discussed and sought regarding an increase
in food security in the affected area, women employment productivity,
standard of living,
The acquisition of agricultural land will completely eliminate the food security of the
region. Most of the women here are engaged in agricultural work, so the employment
productivity of women will be adversely affected by the formation of the proposed
project, and since they lack vocational training and skills their future prospect also
may get suffered. Since, agriculture and animal husbandry is the main source of
income in these villages, the acquisition of agricultural land for the proposed project
will negatively affect their standard of living.
FGD was held and concerned about acquisition effect on the local economy of
the area, economic dependency,

93
Land acquisition will likely to destroy the basic structure of local economy although
new kind of opportunity may arises but as the villagers are not well qualified and
skilled and heavily dependent on agriculture and animal husbandry, switch over to
other form of earning will become difficult and in turn land acquisition will increase
their economic dependence for lively hood.
The status of wild plant and wild animal in the affected area, project impact on
the soil of the surrounding area, air quality of the surrounding area
Wildlife animals such as deer, reindeer, rabbit, peacock, and monkeys are found.
Some medicinal tree, and plants such as Neem, Katha, Arjun's Bark, Date and Palm
are found in abundance in this area.
The proposed project will adversely affect the soil of the surrounding area. This
project will increase the amount of pollution in the soil, the fertility of the soil will be
lost, and carbon emissions are likely to have a negative impact on the soil.
The proposed project will increase air pollution in the region. Companies use other
polluted fuel in place of electricity to reduce their fuel costs such as diesel and
kerosene, causing more pollution.
DMIC’s Project impact on the issues like the water source, water reserve and
underground water level of the surrounding area and the forest reserve in the
project area also raised and discussed in FGD.
Canals, ponds, tube wells, and hand pump etc. are found in abundance in this area
as a source of water, but the formation of the proposed project will have a negative
impact on the water sources of this area. The amount of pollution in the water will
increase, groundwater levels also will go down, natural water sources will be
destroyed, and these will have a very adverse effect on water sources of this area.

94
With the arrival of this project, the wet land area of our village will be completely
destroyed, the birds will start dying here and the birds coming from abroad will stop
here, which will be a great loss for this village ecosystem.
The impact of this project in the noise pollution in the surrounding area, health
facility/hospital in the affected area was also raised.
The project is proposed as Delhi Mumbai Logistic Hub which will include the loading
and unloading work in this area. This will also increase the traffic in the area as more
number of heavy vehicles will come and go from here. With the increase in traffic the
noise pollution of the region will automatically increase.
Most of them were of the opinion that the project has nothing to do with the growth
of health facilities and hospitals.
The impact of this project on an increase in educational
facility/schools/colleges and in transportation and road facility in the area?
‘No, this project has nothing to do with the increase in the number of schools and
colleges’. In case for some reasons even if there will be an increase in the number
of schools and colleges in this area, then the local people will not get the benefit of
these because the fees of these institutions will be very high which cannot be
afforded by the locals.
The proposed project is a corridor between Delhi to Mumbai that has no connection
with local traffic or road facilities.
The impact of this project on an increase in housing capacity and electricity
availability / facility, supply of local services/house help in the area?
After the land acquisition for the proposed project, there will be a reduction in housing
capacity as land will not be available for housing. Also, the facilities that will be made

95
available due to the proposed project will be outside the purchasing power of the
local people, which will not benefit the local people.
Yes, there is a possibility of increase in the supply of domestic helpers and local
services with the coming of this project but the local people will not get the benefit of
this services.
Yes, the proposed project will increase the power supply capacity of the area, but it
will not increase for the rural areas. It will be limited only to the industrial sector as
well as the rate of electricity bill will also increase in this area, which will increase an
economic burden on the local people.
On the issue of an improvement in the availability of resources to people and
an increase in value of private asset in the area;
Most of them were convinced that, due to the proposed scheme, the availability of
resources in this area will increase, but the local people will not have sufficient funds
to use those resources. However, the value of private asset in this area will increase
due to the proposed project.
In general, any other opinion/observation about project were also discussed
and raised in FGD.
The facilities of those who are not involved in the project should also be taken care
of. After the land acquisition for the project, the remaining land should be distributed
equally among all the villagers so that all people can have a relationship with the
village as well as to reduce the economic inequality arising out of the project. It is
very important to maintain transparency in the process related to the project by the
concerned authorities, which is far below the expected level. So we all hope that the
concerned authorities maintain transparency in the process related to the project.

96
For the entire land to be acquired for the project, land should be acquired in the same
manner. Section 46 of the Act has been misused by the concerned authority to
acquire the land for the proposed project. So the concerned authority should follow
section 46 properly and all the people's lands should be acquired in the same
manner. At present, Gram Panchayat is working in the area affected by the project,
so this entire area should be declared as rural area and the rates of compensation
should be fixed according to the rural area.
The land should be leased instead of acquiring the land for the proposed project.
The participation of at least 40% of all affected families in the proposed project
should be ensured. Provision of appropriate facilities as per the Act should also be
made available for the landless, dependent, poor people of the project affected area.
Necessary measures should be adopted to preserve the available natural water
resources, wildlife and wetland areas in the area affected by the project. Thank you
so much to all of you for your active participation and cooperation with us.
Overall Likely impact on the Community wellbeing and Livability -
The participants were concerned about the likely impacts on community wellbeing
and liva bility, they responded that there will be much impact on people’s life. It is
also responded that around 90 percent of the agricultural land has been acquired by
the government which was the main source of their livelihood. It is also responded
that around 80 percent of PAF will be more affected by this land acquisition. The
project will upset the social and cultural life of the people because their lifestyle could
be completely changed after the project. They are very skeptical to lose their native
traditional village culture and joint family structure. They have responded that their
livelihood is mainly based on agriculture, which provides the equal distribution of the
income among the family members but after the loss of land, we would be forced to
do some kind of business for their survival which would affect the joint family
structure.

97
When the participants were asked about the likely impact on the environment, they
said that any kind of construction will change the topography of the area and the
environmental effect will be there because the trees will be cut and the land will be
dug. Problems will be there during the construction phase if they leave the soil in the
open without covering or proper disposal.
The expectation from the said project
When the participants were asked about their aspirations and fears on the proposed
project or if they would like to share anything with relation to this proposed project,
the participants welcome this development in their village and they believe that the
government is working for the betterment and security of the people. They all agreed
that it would generate more employment for men and women and increase more
opportunities in the area. The project will also improve the quality of life in the sense
of availability of electricity and basic amenities.
If the landowners give away the land to the government for the construction of the
project then the Government should employ at least one member from the land
owner’s family after the completion of the project or the government could also
provide alternative land to the PAFs. They are also expecting good compensation
against land acquisition.
Picture: Showing the Focus Group Discussion held in Bodaki Village on 27th October
2020.

98

99
Picture: Focus Group Discussion held in Chitehra Village on 28th October 2020.

100
9. Public Consultations - Public Hearing
9.1. Need for Public Consultations - Public Hearing
Sr. No. Date Village concerned Venue of the public Hearing Time
1.
To
be
pro
po
se
d
Chamrawali Bodaki
2. Chithara
3. Katehara
4. Palla
9.2. Details of the Public Consultations
9.3 Key Concerns and Recommendations
9.4. Pictures from the Project Site
9.5. Pictures from the Public Hearings

101
10. Social Impact Analysis of DMIC
10.1. Potential Positive Impacts
The development of the proposed Delhi Mumbai Industrial Corridor will not only bring
about economic benefits but also help in the social elevation of the people in the
direct as well as indirect influence zone. It is estimated that the project will foster
growth in the area with the following perceived benefits:
Enhance the socio-economic conditions of the local residential settlements-
directly due to compensation from the purchase of land and also indirectly
from the ancillary services like transport, hotel, the rise of associated small
businesses, etc. as an outcome of the project.
Provide the opportunities for economic development not only in the Dadri area
in Gautam Budha Nagar but also in the adjoining area with the employment
opportunities with the increased demand of skilled, educated as well as
unskilled people which will eventually improve the standard of living.
The industry sector will get a boost in Uttar Pradesh especially in the adjoining
area of NCR.
The area will witness commercial development in the form of the market
zones and will support the socio-economic elevation of the resident.
The women will witness more opportunities to educate and train themselves
and make themselves worthy of the employment generated and become
independent.
Overall, the project will result in the increased mobility, enhanced employment,
improved education, the rise of small-scale entrepreneurs, better living, and above
all will connect the area with major markets and trade centers within and outside the
district and will result in sustained economic growth.
10.2 Positive Impacts Perceived by PAFs
The primary survey was conducted to understand the impacts of the project as
perceived by PAFs. The residents seemed to be hopeful about their socio-economic

102
development with the construction of the DMIC. The PAPs had the realization that
the proposed project will bring about employment opportunities and increase the
business and trade in the area and also will increase the value of land around the
proposed site. They could also envisage that the ancillary services around the area
will facilitate them with better roads, schools, transport, and medical facilities. The
following figure details the positive impacts of the proposed project as perceived by
PAFs.
Fig 10.2 Different positive impacts perceived by PAPs (Source: primary survey)
10.3 Impact on Poverty Reduction
The establishment of the proposed project is believed to support poverty alleviation
by providing employment opportunities to both skilled and non-skilled people. The
enhanced connectivity of roads, improved public transportation, restaurants, health
and other basic amenities in the area of the vicinity will provide the alternative means
of livelihood to the residents.
The rise of business and trade will also increase the demand for various goods and
services in the area of housing, education, health, and transport which in turn will
have multifold positive effects on income and employment. Thus, the development
of the project is expected to reduce the poverty level of the area by offering
30%
18%15%
8%
9%
4%
6%
10%
Different positive impacts perceived by PAFs
Increase in employment
Increase in business opportunity
Increase in land price
Increase in public facility
Increase in standard of living
Increase in food security
Increase in local economy of thearea
Increase in access to productiveresources

103
employment not only during the construction phase but also thereafter through the
associated ancillary services.
10.4 Key Adverse Impacts
The socio-economy primary survey revealed that there are some negative impacts
due to the construction of the proposed project site. The estimated adverse effects
could be on the land, community, property sources, soil, agriculture, and livelihood,
etc.
10.4.1 Impact on Land
The total area of the land of the affected DMIC project 87.8624 hectares. The land
of villages used for the project is very fertile and used solely for agricultural purposes.
The loss of the land can be a cause of displeasure to the landowners as land is the
most viable fixed asset of the villagers and continued source of living. As also
observed during survey data collection and public hearing, the PAPs have shown
their concern about their compensation. These concerns should be taken care of by
having an organized system of administering the compensation and R&R scheme.
10.4.2 Impact on Common Structures
The acquired land four villages do not have any common structures like samadhi
sthals, temple, Gram Sabha, or Panchayat Ghar. The acquired land is entirely
agricultural and used for farming specially Bajra, Wheat, and Rice/Paddy. And as
such, there is no permanent structure except for a few tube-wells, boring
connections, and hand pumps.
10.4.3 Impact on Fixed Assets and Occupational Structure
The site of the DMIC project does not have any permanent structure in terms of
housing as the entire land is primarily agricultural however since the land is a direct
source of income for the villagers, the land acquisition will adversely impact those
households who are solely dependent on the area for their livelihood, more than
households who have other sources of income as well in terms of jobs and
businesses. Apart from the land, there are few other fixed assets such as wells, tube-

104
wells, and hand-pumps which will also be displaced due to land acquisition. The
restoration plan should thereby include the assurance of the continued usage of
these assets. Also, there needs to be an income restoration plan for affected PAPs.
The resettlement program should include activities like training, employment from
jobs at the project, directed credit, small businesses, and enterprise development for
job creation. However, there is also a section of the households that are not directly
dependent on this agricultural land and work in the private and government sector
or have small businesses. It can thereby be inferred that PAPS do have some
exposure to other avenues of generating livelihood and by orienting and training
them to such other ventures, the impact on the occupational structure and livelihood
dependency can be reduced considerably. The direct interaction with them also
points out that PAPs are looking forward to the jobs in the service sector which they
believe that, will bring stability in their lives.
10.4.4 Impact on Livestock and Crops
All four villagers of the project have much livestock for the support in farming and
animal husbandry like buffaloes, cows, goats, horses, etc. The resettlement of these
livestock should also be ensured so that they continue to be the source of their
income. Moreover, the acquired land being primarily agricultural has substantial
growth of many crops such as wheat, bajra, jowar, and paddy/rice, etc. which is an
indirect source of income for villagers in the form of edibles and thereby the resettle
plan and compensation package should also consider this indirect source of
dependency of villagers.
10.4.5 Impact on the People in the Adjacent Area
The development of this project will not only impact the PAFs but also have an
indirect or direct impact on the population of the adjoining area considered as the
project influence area. The development of the DMIC project could harm
groundwater, surface water, air, and noise in the adjacent areas. The over depletion
of groundwater can cause water issues. The increased vehicle movements will lead
to a significant adverse impact on the local air quality as well as noise pollution. The

105
construction phase itself can result in noise and air pollution and bring about
disturbance to settlements around. The train route will contribute to an increase in
ambient noise quality in and around.
10.5 Concerns Perceived by the PAPs
The socio-economic survey also recorded the concerns of PAPs with the proposed
project. The major one remained the loss of land itself. Other concerns included
conflict with the outsiders, the influx of migrants impacting their employment
opportunities. They want a properly laid compensation plan against the loss of their
lands. Overall, the PAPs believe to experience more positive impacts with the
development of the DMIC project however they shared these concerns primarily as
apprehensions about the compensation plan rather than a voice against the
construction of the proposed project.
Figure 10.5: Concerns perceived by PAPs
38%
17%
18%
7%
8%
12%
Concerns perceived by PAFs
Loss of land
Compensation plan
Livelihood insecurities
Conflict with outsiders onemployment opportunities
Affect on family structure
Affect on mental wellness

106
11. Social Impact Management Plan
11.1 Approach to Mitigation Measures
The compensation for the PAPs is proposed to be laid out based on RFCTLAR (UP)
Rules, 2016, and also at par with the compensation of the acquired land of the four
villages. Due care needs to be taken to compensate each affected family according
to associated losses- land, structure, movable/immovable assets, etc. The act
ensures that proper compensation is given to PAPs and all their related concerns
are taken care of. We have tried to map the concerns raised by PAPs during public
consultation with the provision in the Act. The proposed measures thereby identified
for the welfare of the project affected people in the RFCTLAR (UP) Rules, 2016 are:
Social Impact Assessment before the land acquisition process
More monetary benefit and listing of the landholding, movable/immovable
assets in the affected area.
Right to dissent
Mandatory R&R Package beyond Acquisition including livelihood plan,
gender plan, etc.
Timeline for payments before R&R
Due diligence to social impacts
Transparency and participatory approach
Curbing misuse of land
The option of the lease
Institutional mechanism- National/ state monitoring authorities for
disposal of disputes/ commissioner R&R/ administrator
A primary survey was conducted exclusively for the PAPs to have firsthand opinions
and concerns of PAPs and map them to have a more effective Social management
plan.
Apart from ensuring the implementation of RFCTLAR (UP) Rules, 2016 for the
compensation plan, there should be some institutional mechanism for the timely and

107
justifiable implementation of the same. The project implementing agency is thereby
suggested to undertake the following:
Grievance redressal mechanism needs to be developed and a committee
should be instituted headed by a senior officer for the timely settlement of
the grievances related to land acquisition and R&R settlement. It should
exist from the start to the end of the project.
Evaluation of R&R should be done by some external agency and the
result should be used for any further action is required.
Besides complying with the required provisions of the act, the project executing
agency should try to accommodate maximum or all the project affected people for
the jobs created at and around the DMIC project. The agency should also try to make
an effort to provide relevant jobs based on individual skills and education.
11.2 Impact and Management Plan
This section talks about various impacts which the proposed project is perceived to
have on the life of PAPs and also discusses the respective management plan to curb
those impacts as follows:
The first and foremost important impact on PAPs is the permanent
acquisition of their land. The management plan for this impact is to
provide rich compensation to them as per on RFCTLAR (UP) Rules, 2016,
and also at par with the compensation of the acquired four villages of the
Dadri Tehsil.
There is a significant number of people who are dependent on the land to
support their livelihood and with the land being acquired, they will lose the
livelihood opportunity. Since the entire land of four villages is agricultural,
there will be an absolute loss of farm produce on the land used up for
farming. On one hectare of land, the average approximate production of

108
wheat is 3217 kg/hectare and the approximate farm income (Profit) is INR
10/kg (as per public consultation with PAPs). To compensate for this
continued source of income from their land, the impact management plan
should prioritize the Project affected people for the job. The project
executing agency should employ PAPs as per the skills, education,
willingness, and suitability for the job. Project executing agencies should
also help in the skill development of PAPs and make them suitable for the
jobs taken.
11.3 Gender Plan
The socio-economic profile of PAPs reveals that there is a significant gender gap in
literacy, women’s workforce participation and recognition, and their access to
ownership of assets. Low awareness level coupled with insignificant roles in financial
decision making at household and community level further restrict the women from
accessing the benefits created by the project equitably. The compensation amount
in maximum possibility will be controlled by men whom they might misuse due to low
literacy levels and existing bad habits like drinking alcohol rather than saving or
investing for long-term benefits. In that scenario, women may have to face the
additional burden of running a household on limited income and resources. It is
therefore important to assess the status of the project affected women and
accordingly devise the management plan.
11.3.1 Management Plan for Women
As observed during the survey, women in the village are not well educated and are
home-makers. The potential impact on women because of the proposed project
could be the loss of long-term security associated with the fixed assets in the form
of land. The management plan should focus on empowering the project affected
women to equip them with financial sustainability. Employment opportunities need
to be provided to them to uplift their present status. However, there needs to be strict
vigilance of safety and security where women will be employed through the project.

109
The participation of women in the project needs to be envisaged from the project
preparation to the construction phase and also in the operation phase. The following
systematic measures can be taken to ensure that women also become the equal
beneficiary of the management plan:
In the project preparation stage, the participation of women was ensured
during the survey and consultation.
The executing agency will also take pro-active initiatives so that women
are properly consulted and invited to participate in group-based activities
to gain access to resources.
Women also need to be engaged during the construction phase and also
during the operation phase as per their existing or developed skills.
The participation of women is equally required for monitoring and
evaluation activities that will make the process more transparent to them.
It is expected that women will be encouraged to evaluate the project
outputs and bring forward their valuable suggestions for necessary
actions towards further modifications in the project creating a better and
congenial situation for increasing their participation.
During the construction activities, a high number of skilled and unskilled labor forces
will be required that will be from the close-by area and will comprise of both men and
women. The construction camps need to be provided considering the involvement
of women both directly and indirectly during the construction phase. These
construction camps need to be designed for the welfare of women and children.
These construction camps should provide temporary housing at the labour camp
site. These camps should also be equipped with the necessary health care facilities,
Day Crèche facilities, and education facilities. The schedule of working hours also
needs to be planned to exempt women from night shifts.

110
11.4 Training Need Assessment
The Social Impact Management Plan has to strategize for the economic sustenance
of the PAPs. They need to be trained to help them improve their production level to
make them impart new skills or upgrade their existing skills through training. As the
PAPs are mostly dependent on agriculture for their primary livelihood, training is
thereby a very important component for their income restoration. For PAPs who
intend to diversify their economic activity, suitable various training needs have to be
identified to engage them in income generation according to their preferences.
Besides the training programs aimed to impart skills, general entrepreneurship
development also needs to be assessed and such development programs should
also be a part of the training program which might aim to improve the managerial
capabilities of PAPs. Also, capacity enhancing assistance needs to be provided to
improve the access of women towards certain skills such as tailoring and weaving,
small good shops, marketing-buying and selling local produce, etc. which can act as
a supplementary source of income for women. Vocational training may also be
imparted to the project affected women and children. These training programs would
be imparted through the existing government schemes specifically meant for the
development and welfare of the women community and supplementary funds could
be relocated from the project towards facilitating the setting-up of the training-related
activities. There are various NGOs and government schemes that can be contacted
and utilized for this purpose such as Self Help Groups, Support for women and child
development, Women empowerment programs in different villages, etc.
11.5 Livelihood Restoration and Income Generation Strategy via Skill Mapping
The project is expected to provide income generation opportunities by way of skill
development training and linkage with the ongoing government schemes at the
Tehsil level. The executing agency will play a proactive role in mobilizing various
government schemes for the benefits of PAPs. The executing agency will work with
the PAPs and line department of the Tehsil to deliver the maximum benefits of the
training programs.

111
A very important aspect of income restoration activities involves skill mapping of
PAPs whose livelihood is directly impacted due to land acquisition. The skill
development option linked to the resource base of the area and availability of the
market shall be discussed with PAPs to ascertain their preferences in selecting
certain skill development training. PAPs will be encouraged to participate in
developing feasible long-term income-generating schemes instead of a short-term
arrangement. Such schemes will be identified by the executing agency in
consultation with PAPs, district administration, and other stakeholders in institutional
financing and marketing federations to prepare a feasible sustainable proposal for
PAPs.
Greater Noida Industrial Development Authority should facilitate the inclusion of
PAPs in the government-sponsored poverty alleviation program in the area as per
the eligibility criteria of each program. GNIDA may also facilitate training for skills
development. There should be a strong emphasis on imparting vocational training to
the unskilled youth by collaborating with the institutions providing vocational training
and government schemes such as Skill Development Mission.
The project should also try to match the existing skills with the requirement of the
work during the construction phase. In the case of non-existent of the required skills
but the dire need of PAPs to get work, the project should also facilitate on-the-job
training with the consultation of the contractor.
Moreover, during the implementation of the project, skills training, and job
opportunities could be offered to PAFs. The PAFs can also be engaged in the allied
agriculture activities such as dairy, poultry, cattle rearing, etc. which will also take
care of the existing live-stock of PAFs.
The project should also focus on helping the PAFs in providing opportunities for
quality education with the help of various organizations such as Satyam Foundations

112
Sarvodaya Educational and Welfare Society etc. that will make them eligible for long-
term employment and will contribute to poverty alleviation of PAFs.
The Social Impact Management Plan should thereby ensure a livelihood mapping
exercise, to ascertain the type of skill required in the area of PAPs for the jobs that
would be created. For the purpose, a comprehensive survey should be conducted
to identify the people who want to participate in livelihood and skill development
training and thereby categorizing their areas of interest to find the suitable and
courses and classes. The agency may also identify suitable training institutes,
classes, and organizations in the vicinity of the project affected area as extended
support to PAPs.

113
Annexure
12.1Land Owners Details [Scale of Measurement (in Hectare)]
S.N
o.
an
d
Qu
estion
na
ire
Num
be
r
Ga
ta N
o
No o
f L
and
Se
pa
rate
La
nd
Tota
l A
rea S
ca
le o
f
Me
ase
rme
nt (in
He
cta
re)
Use
d A
rea S
ca
le o
f
Me
ase
rme
nt (in
He
cta
re)
Ap
plic
ant
No
To
tal C
laim
an
t
To
tal N
o. o
f
Ap
plic
ant
who h
ave
fille
d q
ue
stio
nn
aire
Ap
plic
ant
Nam
e
Rem
ark
s (
All
info
rma
tio
n h
ave
be
en
me
ntio
ned
as
pe
r
Kh
ato
ni/P
rovid
ed
list)
193 111
1
111 0.35000 0.35000 A
3 3
ROOPVATI All members have been filled questionnaire 198 111 B SANJAY SINGH
199 111 C DEEPAK SINGH BHATI
247 277 1 277 0.79400 0.26460 A 1 1 DEVENDRA SINGH Mr. Devendra Singh is land owner
238 317 1 317 0.02900 0.02900 A 7 1 DHARMENDRA BHATI
Remaining members have not fill questionnaire
263 318 1 318 0.12100 0.12100 A 1 1 JAGVIR SINGH Mr. Jagvir Singh is land owner
246 323 1 323 0.08100 0.04050 A 1 1 SATVATI Mrs. Satvati is land owner
312 409 1 409 A JAI KISHAN Khasra no 409 is not mentioned in provided list
284 445 1 445 0.09300 0.09300 A 24 11 SHYAM VEER SINGH

114
286 445 B SATENDRA SINGH BHATI
1. Mr. Shyamveer Singh is not mentioned in provided list. 2. Remaining members have not fill questionnaire
287 445 C UPENDRA SINGH BHATI
288 445 D SARMINDRA SINGH BHATI
289 445 E PUSHPENDRA SINGH BHATI
302 445 F HARENDRA SINGH BHATI
308 445 G SHYAM SINGH
320 445 H SATYAVEER SINGH
325 445 I KAMLESH
327 445 J VIJAY
360 445 K PREMCHAND
321 446
1 446
0.43600 0.43600 A
5 6
SATISH KUMAR 1. Mr. Deepak and Arun Kumar are not mentioned in provided list. 2. Remaining members have not fill questionnaire
342 446 B DEEPAK
343 446 C ARUN KUMAR
357 446 D AJAD
358 446 E PRAMOD
359 446 F SUBHASH
305 447 1 447
0.10900 0.10900 A 2 2
SUBE SINGH BHATI Mr. Sube Singh Bhati and Mr. Atar Singh are land owner 330 447 B ATAR SINGH
303 448
1
448 0.36500 0.36500 A
7 4
NIKKI 1. Remaining members have not fill questionnaire 304 448 B GYANVATI
326 448 C KAVINDRA
328 448 D RAM BHAROSE
338 455 1 455 0.29100 0.29100 A 2 2 RISHIPAL

115
339 455 B MANIRAM Mr. Rishipal and Maniram are land owner.
294 457
1
457 0.50700 0.50700 A
3 5
SUNEEL BANSAL Mr. Suneel, Mr. Jagpal, Mr. Joginder and Pushpendra are not mentioned in provided list.
341 457 B JAGPAL
345 457 C RAJPAL
353 457 D JOGINDER SINGH
354 457 E PUSHPENDRA SINGH
344 462 1 462 0.13900 0.13900 A 1 1 TEJPAL SINGH Mr. Tejpal Singh is land owner
324 465 1 465 0.29500 0.29500 A 1 1 MANVEER SINGH Mr. Manveer Singh is land owner
351 473 1 473 0.28100 0.27860 A 1 1 JAYPAL SINGH Mr. Jaypal is land owner.
168 474
1
474 0.67300 0.67300 A
4 2
BIJENDRA Remaining members have not fill questionnaire and Mr. Bijendra is not mentioned in provided list 191 474 B DEVINDRA
352 477 1 477 0.61200 0.31560 A 2 1 BASERAM Mr. Aasheram is not fill questionnaire
290 490
1
490 0.25400 0.63700 A
3 9
SURESH Mr. Jay Singh, Ajeet and Satish are only land owner of khasra no 490 but Satish is not fill questionnaire.
291 490 B SHEELA
292 490 C MAHESH CHAND
295 490 D SUBHASH
296 490 E JAI SINGH
301 490 F AJEET SINGH
306 490 G RAJKUMAR
310 490 H NARESH
311 490 I MUKESH
317 494 1 494 0.51600 0.50960 A 3 2 RAJKUMAR

116
318 494 B PAWAN KUMAR Mrs. Dariyai is not fill questionnaire
313 495
1
495 0.51500 0.34340 A
4 4
ARUN KUMAR All members are land owner
316 495 B BASANTI
319 495 C VINOD KUMAR
329 495 D DHARMRAJ
165 498 1 498 1.62000 0.40500 A 1 1 HATAM SINGH Mr. Hatam Singh is land owner
298 501 1 501 0.40000 0.13340 A 2 1 YOGESH KUMAR Mrs. Suresh Devi is not fill questionnaire
232 522 1 522 0.11700 0.11700 A 3 1 AJAB SINGH Remaining members have not fill questionnaire
178 537
1
537 0.43700 0.43700 A
2 3
RAMPAT Mr. Rampat is not mentioned in provided list 206 537 A JAYVIR SINGH
208 537 B VIJENDRA SINGH
212 540 1 540 0.29900 0.29900 A 1 2 SANJAY SINGH Mr. Sanjay Singh & Mr. Bhagwati are not mentioned in provided list. 174 540 B BHAGWATI
115 557 1 557 0.16400 0.16400 A 1 ASHOK Land owner is Mr. Ashok
229 596 1 596 1.17500 1.17500 A 1 1 BRAHAM SINGH Mr. Braham Singh is land owner
167 603 1
603 0.59500 0.59500 A 5 2
MANJU Remaining Members have not filled questionnaire 202 603 B AJAB SINGH
130 610 1 610 0.24600 0.24600
A 35 2 MANOJ Mr. Vijay is not mention in provided list 138 610 B VIJAY
40 619 1 619 1.12600 0.61980 A 1 1 KAVALJEET Mr. Kavaljeet is not mention in provided list.
56 626 1 626 0.15200 0.07410 A 10 1 RAJVIR SINGH Remaining Members have not filled questionnaire

117
163 746 1 746 0.11400 0.07220 A 18 1 NEERAJ PRADHAN Remaining Members have not filled questionnaire
76 889 1 889 1.37900 0.25300 A 1 1 SATVEER SINGH BHATI
Mr. Ashok is land owner.
32 908 1 908 1.04000 0.39000 A 2 1 MUKHIRAM Mr. Santram is not fill questionnaire.
11 926
1 926
0.72400 0.43610 A 3 3 MANIRAM Mr. Devendra is not mention in provided list and Mrs. Mamta in not fill questionnaire.
38 926 B DEVENDRA SINGH
373 926 C DHANIRAM
49 937 1
937 0.74600 0.12540 A 2 2
NARENDRA Mr. Narendra and Dharmendra are land owner. 50 937 B DHARMENDRA
72 999
1
999 1.95400 1.62860 A
16 4
RATANLAL Mr. Shyam Singh is not mention in provided list and remaining members are not fill questionnaire.
151 999 B SANDEEP BHATI
152 999 C SHYAM SINGH
390 999 D BABU RAM
73 1028 1 1028 0.26600 0.08760 A 6 3 SAVITA Mrs. Savita, Mr. Jitendra Kumar and Mr. Devendra are not mention in provided list and list members are not fill questionnaire.
74 1028 B JITENDRA KUMAR
104 1028 C DEVENDRA
375 762,881,890
890 0.64500 0.19360 A 3 1 RAJESH Khasra no 76, 28, 81 are not mentioned is provided list.
210 103M, 200
2 103 1.39300 0.34820 A 1 1 SUNDER Mr. Sunder is not mention in provided list in khasra no 200M and Mr. Surendra has not fill questionnaire of Khasra no 200M.
209 200M 1 200 0.43800 0.21900 A 2 2 JITENDRA SINGH

118
133
108, 181, 1210, 906
4 906 1.24000 0.52770 A 17 1 VEER SINGH BHATI
Khasra no 108, 181, 1210 are not mentioned is provided list.
172 110, 201
2 110 0.43300 0.21650 A 1 2 INDRAJEET 1. Mr. Indrajeet and Mr. Rajendra Singh are not mentioned is provided list in khasra no 110, 201, 202. 2. Remaining Members have not fill questionnaire.
203 110M, 201
201 1.42100 1.42100 B 2 SAVITRI RANA
171 110, 201, 202
3 202 0.26000 0.26000 A 1 1 RAJENDRA SINGH
204 201 A 1 1 MUKESH
227
114M, 538, 576M, 577M
4
114M 0.63000 0.16200 A 2 1 DHARM SINGH Remaining members have not fill questionnaire of khasra no 114, 538
538 0.39600 0.39600 2
576 0.37100 0.12370 1
577 0.39700 0.13230 1
216
119M, 452M, 495M, 552M, 557M
5 119 0.63000 0.15750 A 1 1 VIJAY PAL SINGH
1. Mr. Vijay Pal Singh has not mentioned in provided list in khasra no 552. 2. Remaining members have not fill questionnaire.
217 452M, 495M
2
452 0.52000 0.10400 A 5 4 DHANNO DEVI
218 452M, 495M
495 1.07600 0.39470 B 6 SATENDRA BHATI

119
219 452M, 495M
552 1.76700 0.36420 C 3 SATPAL
220 452M, 495M
557 1.11000 0.16850 D 1 TITU SINGH
207 552 1 A 1 KASHMIRI
200 128M 1 128 0.14100 0.14100 A 2 2 SATENDRA Mr. Satendra and Mr. Upendra are land owner. 201 128M B UPENDRA
166 16M, 35M, 80M
3 16M 0.77700 0.38850 A 2 1 RAMU Mr. Dharmvir has not fill questionnaire of khasra no 16M.
35M 0.67600 0.25350 1
196 80M 1 80M 1.02700 0.51360 A 2 1 DHARMVIR
244 265M 1 265M 1.01500 1.01320 A 1 1 RAMPAL Mr. Rajpal is land owner
243 267M 1 267M 0.69900 0.13980 A 1 1 JAGAT SINGH Mr. Jagat Singh is land owner
234 268M
1 268M
0.67300 0.33650 A
57 39
ROOP SINGH BHATI 1. All members are land owner. 2.Remaining members have not filled questionnaire
271 268M AA MEERA RAI
272 268M AB SUNIL KUMAR RAI
273 268M AC KOMAL KUMAR YADAV
274 268M AD HARI SINGH VERMA
275 268M AE PARVATI
276 268M AF BHAGYA NARAYAN SHARMA
277 268M AG AASNARAYAN SHARMA
278 268M AH NIRMLA DEVI
279 268M AI REETA

120
280 268M AJ MUNNI DEVI
281 268M AK MAMTA SHUKLA
282 268M AL PREM SHEELA DEVI
283 268M AM ASHOK KUMAR
237 268M B SANNO DEVI
240 268M C BRAJESH DEVI
245 268M D BHAVANA
248 268M E JAGAT KUMAR
249 268M F RAMAKANT YADAV
250 268M G NAGENDRA KUMAR YADAV
251 268M H GANESH SINGH
252 268M I SUNAINA DEVI
253 268M J USHA PAL
254 268M K INDU DEVI
255 268M L BABULAL CHAUHAN
256 268M M RAKESH
257 268M N MANJU SINGH
258 268M O LOVE KUSH
259 268M P SATENDRA PRASAD
260 268M Q MANOJ KUMAR RAI
261 268M R MEERA SHARMA
262 268M S RAJKUMAR BHAGAT
264 268M T DHARMENDRA VERMA
265 268M U HEERALAL GUPTA

121
266 268M V DURGA
267 268M W SHOBHA
268 268M X SHASHIRANI
269 268M Y PRADEEP KUMAR SINGH
270 268M Z NISHA
235 287M
1
287M 0.11500 0.38400 A
3 3
SHRIPAL All Members are land owner
236 287M B MAHIPAL BHATI
242 287M C VINOD
239 313M 1 313M
1.02900 0.06200 A 3 2
MONU Mrs. Suman is not fill questionnaire. 241 313M B SONU
211 501, 508, 550
3 501 0.03800 0.03170 A 2 1 HARI KRISHAN 1. Mr. Harprasad is not mentioned in provided list in khasra no 501, 508. 2. Remaining members have not fill questionnaire. 3. Khasra no 316, 318 are not mentioned in provided list.
233
316, 318, 501, 508
4 508 0.05100 0.04250 A 2 1 HARPRASAD
550 0.51500 0.51500 3
293 417 1
417 0.03800 0.03800 A 11 2 SATYAVEER SINGH BHATI
1. Mr. Brahamjeet and Jagveer Singh are not mentioned in provided list in khasra no 460. 2. Remaining members have been not fill questionnaire.
346 417 B INDRAJEET
366 417, 460
2 460 0.03500 0.03500 A 8 1 RATI
364 417, 460, 461
3 461 0.13700 0.13700 B 1 1 BRAHAMJEET

122
347 417, 460, 463
463 0.28200 0.28200 A 1 1 JAGVEER SINGH
367 417, 460, 464
464 0.27500 0.27500 A 1 1 MAHAVIR
323 418M, 439, 456
3
418M 0.03000 0.01890 A 6
4
JASWANTI 1. Mrs. Jaswati is not mentioned in provided list in khasra no 439, 456. 2. Mr. Likha is only land owner of khasra no 456, but he/remaining member are not fill questionnaire.
355 418M, 439, 456
439 0.58300 0.51010 B 8 RAM RATAN
356 418M, 439, 456
456 0.29200 0.29200 C 1 MAHESH
361 418M, 439, 456
D JAGRITI
314 436M
1
436 0.58800 0.38920 A
12 6
RISHIPAL Remaining members have not fill questionnaire. 315 436M B HARISH
331 436M C NARENDRA
332 436M D AAZAD
335 436M E BEERWATI
340 436M F SANJAY K BHATI
214 444M 1 444M 1.68400 0.69380 A 3 1 SUNIL KUMAR Remaining members have not fill questionnaire.
297 450 1 450 0.19100 0.19100 A 2 1 VIKENDRA SINGH Mr. Ram Lakhan and Vikendra are land owner.
369 449, 450
2 449 0.19000 0.19000 A 1 1 RAM LAKHAN

123
348 452, 453
2
452 0.12700 0.12700 A 4
3
JAGRAM 1. Mr. Karamveer is not mentioned is provided list in khasra no 454. 2. Remaining members have not fill questionnaire.
349 452, 453
453 0.12700 0.12700 B 7 MASTRAM
350 452, 453
C GAJENDRA
309 454, 453
2 454 0.12700 0.12700 A 3 1 KARMVEER
333 453 1
A 2
CHARAN SINGH
334 453 B PRAKASHO DEVI
300 454 1 A 1 KUSUM
226 456M 1 456 0.34700 0.11580 A 1 1 JAY SINGH Mr. Jay Singh is land owner.
362 466M
1
466 0.31200 0.09300 A
3 3
POONAM DEVI 1. Mrs. Poonam, Mrs. Suneeta and Mrs. Susheela Devi are land owner but Mrs. Suneeta is not fill questionnaire. 2. Mrs. Susheela Devi is not mentioned in provided list on khasra no 466M.
363 466M B ANEETA DEVI
365 466M C SUSHEELA DEVI
336 472M 1 472 0.37600 0.19040 B 2 1 KARAN SINGH Mr. Saurabh is not fill questionnaire
185 475M 1 475 1.17700 0.33720 A 2 1 AJAB SINGH Mr. Shrichand is not fill questionnaire
224 477M 1 477 1.49800 0.33000 A 2 1 BRIJPAL SINGH Remaining members have not fill questionnaire in khasra no 528 225
477M, 528M
2 528 0.73100 0.68080 A 9 1 MAMCHAND
182 528M A MANGERAM BHATI
223 528M B MANISH BHATI

124
337 488, 489, 497
3
488 0.28600 0.13860 A 1 5 JITENDRA 1. Mr. Rajpal is only land owner of khasra no 488, but not fill questionnaire. 2. Mr. Jogendra is only land woner of khasra no 489. 3. Mr. Jitendra, Mr. Virendra, Rajvir are not mention in provided list in khasra no 497
368 488, 489, 497
489 0.33700 0.13860 B 1 JOGENDRA
370 488, 489, 497
497 0.53300 0.09050 C 11 RAMNARESH
371 488, 489, 497
D VIRENDRA
372 488, 489, 497
E RAJVIR
307 488, 497M
2 A 1 VEERENDRA SINGH
283A 497M, 491
2 491 0.33700 0.33700 A 1 RAMVEER
Mr. Prem Singh is only land owner of khasra no 491, but not fill questionnaire
299 497M, 491
B OMVEER
186 494M 1 494 0.38300 0.15150 A 1 RAJVIR SINGH Mr. Rajvir Singh is land owner.
285
509, 521
2
509 0.45000 0.02260 A 6
1
SUSHEEL 1. Mr. Susheel is not mentioned in provided list in khasra no 509. 2. Remaining members are not fill questionnaire.
521 0.03800 0.01900 3
322 518M 1 518 0.07500 0.03400 A 2 1 SAHAB SINGH Mrs. Munesh is not fill questionnaire
188 526M
1
526 1.05500 1.01660 A
3 3
BRAHAM SINGH All members are land owner.
189 526M B DHARMVIR
190 526M C JILE SINGH

125
215 543M
1
543 2.08200 0.11990 A
6 4
KAVAR SINGH Remaining members are not fill questionnaire 221 543M B VIKAS BHATI
222 543M C SHYAMA
228 543M D INDRAJEET SINGH
97
545, 547, 549, 567, 568
5
545 0.74600 0.74600 B
8
ROHIT BHATI
1. All member have been fill Questionnaire of 545, 567. 2. Total members of 545 & 567 are 11. 3. Khasra no 547 land is transfer to GNOIDA. 4. Mr. Hardwari and Parmal Singh are fill questionnaire of land 549, 568. 5. Leelchand, Hardwari Lal, Parmal, Yashpal, Dhanno Devi have been land of 545 and 567.
98
545, 547, 549, 567, 568
547 0.01900 0.01900 C VIRENDRA SINGH
99
545, 547, 549, 567, 568
549 0.05100 0.05100 D ANKUR BHATI
100
545, 547, 549, 567, 568
567 0.20000 0.20000 E DHANNO
101
545, 547, 549, 567, 568
568 0.44600 0.44600 F GUDDI
119 545, 547, 549,
G PARMAL SINGH

126
567, 568
120
545, 547, 549, 567, 568
H HARDWARI LAL
58
545, 547M, 549, 567, 568
A SWAMI RAM
143 545, 567
2
545 A
3
DHANNO DEVI
148 545, 567
567 B LILCHAND
154 545, 567
C YASHPAL
164A 546M 1
546 0.55200 0.36800 A 2 2
NARESH Mr. Naresh and Mr. Rajesh Kumar are land owner 181 546M B RAJESH KUMAR
6
556M, 562M, 563M
3
556M 0.12600 0.06310
A
1
SUNDAR SINGH 1. Mrs. Munesh, Ajay have not fill questionnaire against 556M. 2. Mr. Sunder is land owner of khasra no 556, 562, 563.
562M 0.17000 0.17000
563M 1.10700 0.55350
80
579, 582, 630, 634, 635, 643
6
579 1.05000 0.40830
A
5
1
RAJPAL 1. Mr. Rajpal is not mentioned in provided list on Khasra no 579, 582, 630. 2. Mr. Hariram is not mentioned in provided list on Khasra no 579.
582 0.04400 0.01830 6
630 0.50600 0.23910 8
634 0.49300 0.49300 6
635 0.37000 0.31760 6
643 2.69200 1.08920 8

127
92 579, 630, 643
3
579 1.05000 0.40830
A
1
HARIRAM
630 0.50600 0.50600
643 2.69200 2.69200
43
580, 627, 704, 757, 825
5
580 0.87300 0.24580 C 10
3
OM PRAKASH
1. Khasra no 704, 825 are not mentioned in provided list. 2. Three questionnaire filled in khasra no 757. 3. Remaining members have not filled questionnaire.
8
627, 580, 757, 825, 704
627 2.10600 0.59280 B 11 GYAN CHAND SHARMA
5
627, 580, 825, 757, 704
704 A VED PRAKASH SHARMA
757 0.02500 0.02000 22
825 - -
29 587 K
1
587 0.55600 0.40810 A 7
4
GYAN CHAND SHARMA
Hari Chand, Chameli Devi, Ajay Kumar have not fill questionnaire.
42 587 K B RAM DUTTA SHARMA
44 587 K C BRAHMA DATT SHARMA
45 587 K D RAJESH SHARMA
27 588, 615, 977
3 588 0.29700 0.03650 B 2 3 RAVINDRA PAL 1. Mr. Ravindra Pal is not mentioned in provided list.

128
37 588, 615, 977
615 2.68200 0.32600 C BHAGWAT SINGH
7 588,615, 977
977 0.29100 0.03570 A RAJPAL SINGH
169 588M
1
588 0.27700 0.27700 A
3 4
BHAGWAT SINGH Mrs. Poonam is not mentioned in provided list 170 588M B GYANVATI DEVI
187 588M C POONAM
197 588M D RAMPAL SINGH
137
579, 630, 635, 643, 646, 925
6
579 1.05000 0.40830
A
1
RAMVIR 1. Mr. Ramvir has not mentioned in provided list on khasra no 925, 646.
630 0.50600 0.23910 8
635 0.37000 0.31760 6
643 2.69200 1.08920 8
646 0.03800 0.00630 2
925 0.31860 0.02680 3
14 591M 1 591M 0.89800 0.07280 A 3 1 PRATAP SINGH Mrs. Dhannu and Dhanpal are not fill questionnaire.
13 592M 1 592M 0.75900 0.37950 A 1 1 MAYA DEVI
Mrs. Maya Devi has filled questionnaire but name is not mentioned in provided list.
105 596M, 979d
2
596 0.49900 0.12950 A
3
RISHI 1. Remaining Members have not filled questionnaire of khasra no 979. 2. As per provide list, Mr. Sunder is only land owner of 106
596M, 979d
979 2.05500 1.90850 B 8 PRAVEEN

129
107 596M, 979d
C ATRI khasra no 596 but not fill questionnaire.
127 979d 1 A 1 KARTAR SINGH
112 600d&[k] 602]
2 600 1.08800 0.02170
A 6
1 DHOOM SINGH Mr. Dhoom Singh is not
mantioned in provided list. 602 0.15200 0.04750 6
179 610M
1
610M 1.13400 0.89500 A
12 3
GYANI 1. Remaining members are not fill questionnaire. 2. Mr. Rajesh is not mentioned in provided list.
180 610M B YOGESH KUMAR
205 610M C RAJESH
183 613M
1
613 1.40800 0.92550 A
14 3
RAJ SINGH Remaining members are not fill questionnaire 184 613M B MAHIPAL
213 613M C MISHRO
22 616, 974
2
616 1.58700 0.39660
A
3
1
DHANNU 1. Two members have not filled questionnaire of khasra no 616. 2. Two members have not filled questionnaire of khasra no 974.
974 0.99300 0.24840 3
36 617, 978
2
617 1.46100 0.73050
A
2
1
KUNWAR SINGH 1. Mr. Hem Singh has not filled questionnaire of khasra no 617. 2. Five members have not filled questionnaire of khasra no 978
978 0.30400 0.30400 6
59 624M, 981M
2 624 0.75900 0.27430 A 9 2 DINESH KUMAR SHARMA
Remaining Members have not filled questionnaire of both khasra
95 624M, 981M
981 0.45500 0.39370 B 17 VIDYAWATI SHARMA
18 649, 892,
4 649 2.24100 0.33340 A 23 3 JAGWATI Remaining members have not filled questionnaire.

130
895, 899
46
649, 892, 895, 899
892 0.24000 0.03790 B 13 ASHOK KUMAR
51
649, 892,895,899
895 0.68300 0.09170 C 13 MANOJ KUMAR
899 0.12700 0.01680 13
85 651, 939, 940
3 651 0.81600 0.62900 A 3
3
RAJESH 1. Mr. Rajesh has filled questionnaire but not mentione in provided list in khasra no. 651. 2. Remaining members have not filled questionnaire.
89 651, 939, 940
939 1.11400 0.85870 B 4 DHANNU
90 651, 939, 940
940 0.17700 0.13650 C 4 SARDAR
128 653M 1 653
0.86000 0.65360 A 2 2
OM PRAKASH All members have been filled questionnaire. 164 653M B SAHIRAM
192 712M
1
712 0.65000 0.10700 A
3 3
KRISHNAPAL All members are land owner.
230 712M B RAVINDRA SINGH BHATI
231 712M C INDERJEET SINGH BHATI
135
729, 877, 880, 891, 930,
8
729 A
1
RAJNESH Khasra no 729 is not mentioned in provided list and remaining members have not filled questionnaire. 877 0.08200 0.08200 15

131
759, 728, 881
134 762, 881
6
762 0.40200 0.12060 A 3 1 OM PRAKASH Mr. Om Prakash has not filled questionnaire of khasra no 883, 890
82
762, 881, 883, 890
881 2.91800 1.77000 A 41
1
KESHRAM Remaining members have not filled questionnaire. 883 0.02800 0.02700 41
890 0.64500 0.19360 3
17 881, 883, 995
3 995 0.98000 0.96640 A 4 1 KESHVATI Remaining members have not filled questionnaire.
33
881, 883M, 257, 1239
4
257 A KALU
1. Khasra no 257, 1239 are not mentioned in provided list. 2. Remaining members have not filled questionnaire. 3. Kalu is not mentioned in provided list.
131
881,883 M,257,1239
1239 A BHAGWAT
380 763K, 763KH
1 763 1.31500 1.15080
A
19 14
JITENDRA Remaining members have not filled questionnaire.
381 763K, 763KH
B RAMSINGH
376 763K,KH
A HARKALI
377 763K,KH
B AJAY KUAMR

132
378 763K,KH
C CHAHT RAM
379 763K,KH
D SATISH KUMAR
382 763K,KH
E SHREPAL
383 763K,KH
F AHSOK KUMAR
384 763K,KH
G BHAGMAL
386 763K,KH
H BALVIR SINGH
388 763K,KH
I NEKIRAM
389 763K,KH
J SARDAR
385 763 A BRAHMPAL
387 763 B DAYARAM
194 81M 1 81M
0.83800 0.55870 A 2 2
RAJAN Mr. Ramchandra and Mr. Rajan are land owner. 195 81M B RAMCHANDRA
67 876 1 876 0.80300 0.40160 A
8 2
INDRESH Mrs. Indresh has not mentioned in provided list and remaining members have not filled questionnaire 129 876M 1 A VINOD KUMAR
136
880,891, 930, 759, 728, 881
6 728 A 3 VIJENDRA SINGH
1. Khasra no 728 is not mentioned in proveded list. 2. Remaining members have not filled questionnaire.

133
139
880,891, 930, 759, 728, 881
759 0.45500 0.32850 B 11 ANOOP SINGH
140
880,891, 930, 759, 728, 881
880 0.35800 0.25870
C
11 SAROJ DEVI
881 2.91800 1.77000 41
891 0.64500 0.46590 11
930 0.30400 0.21960 11
121 900M
1 900M 1.15100 0.68550
C
7 5
BALESHWARI 1. Mrs. Baleshwari is not mentione in provied list. 2. Remaining members have not filled questionnaire.
122 900M D AADESH KUMAR
142 900M E MAHAVIR
109 900M A AKASH BHATI
114 900M B SACHIN BHATI
68 902, 955
2 902 0.91100 0.39850 A 9 5 RATTO 1. Remaining members have not filled questionnaire.
69 902, 955
955 0.49300 0.21580 B 7 SANJAY BHATI
70 902, 955
C SACHIN KUMAR BHATI
71 902, 955
D VIPIN KUMAR BHATI
155 902, 955
E ANAND
23 955M 1 A 1 DAYARAM
3 902M 1 902 0.91100 0.39850 A 9 1 DAYARAM

134
9 904M, 928M
2 904 0.64500 0.53750 A 5
2
SANJAY KUMAR 1. Mr. Madan is not mentioned in provided list in khasran no 928. 2. Remaining members have not filled auestionnaire. 28
904M, 928M
928 1.26500 0.92630 B 34 MADAN
60 906M
1
906 1.24000 0.52770 A
17 9
RAJ SINGH 1. Mr. Mahendra, Hansraj, Rajesh Bhati are not mentioned in provided list. 2. Remaining members have not filled auestionnaire.
61 906M B GYANVATI DEVI
62 906M C SUBHASH
63 906M D MAHESH SINGH
64 906M E MAHARAJ SINGH
86 906M F RANSINGH BHATI
87 906M G MAHENDRA
113 906M H HANS RAJ
158 906M I RAJESH BHATI
102 908, 953
2 953 0.27400 0.10300 A 2 1 RAJENDRA SINGH BHATI
1. Mr. Madan is not mentioned in provided list in khasran no 908, 953.
91
911, 911 K, 922, 945, 957
4 911 1.20700 0.04060 A 5 1 RAJESHWAR BHATI 1. Remaining members have not filled questionnaire. 922 0.59500 0.01990 5
945 0.68300 0.02290 5
957 0.20800 0.01080 5
66 931 1 A 2 GYASI RAM 1. Mrs Kamlesh Devi & Mr. Kapil Bhati are not mentioned in provided list on Khasra no 918, 931. 2. Remaining members have not filled questionnaire.
75 931 B SARDAR
146 931, 918
B KAPIL BHATI
132 918, 931
2 918 1.60700 1.51780 A 22 1 KAMLESH DEVI

135
21
931, 918, 947, 948
D SHARDA
116
918, 931, 943, 947
931 0.45500 0.40450 B 20 RANVEER SINGH BHATI
108
918, 931, 947, 948
4 947 0.03800 0.03380 A 21 3 RAMPAL
374
918, 931, 947, 948
948 0.13000 0.38220 C 21 JUGLA
110 947, 948
2 A 1 KELA
83 919, 921
2
919 0.67000 0.67000 A 29 6 KULDEEP BHATI 1. Remaining members have not filled questionnaire.
88 919, 921
921 0.34200 0.34200 B 29 BIJENDRI
111 919, 921
D PRADEEP KUMAR
118 919, 921
E RAHUL BHATI
159 919, 921
F SAHIRAM
96 919, 921 K
C RAME
19 919 1 A 1 SUKHVEER SINGH

136
26 919A+919B
1 A 1 BRAHAM SINGH
84 928 1 928 1.26500 0.92630 C 34 14 PRATHI SINGH 1. Remaining members have not filled questionnaire. 2. Mr. Prathi Singh is not fill questionnaire of khasra no 935, 936. 3. Mr. Chandra Pal Singh Bhati is not mentioned in khasra no 969, 997, 935, 936. 4. Mr. Ram Kumar is not mentioned in khasra no 928, 935, 936.
47 928, 935, 936
3
935 0.07600 0.07390 A 39 10 SANJEEV KUMAR
48 928, 935, 936
936 0.20200 0.19640 B 39 10 DHANPALI
52 928, 935, 936
C VIRENDRA
77 928, 935, 936
D NABAV SINGH BHATI
124 928, 935, 936
E RAJKUMAR
125 928, 935, 936
F JEETU
153 928, 935, 936
G RAM KUMAR
156 928, 935, 936
H VEERENDRA
65 935, 936
2 A 2 HARI
93 935, 936
B DHARMENDRA SINGH

137
78
928, 935, 936, 969, 997
5
969 0.69400 0.40490 A 3 2 MAMCHAND SINGH
79
928, 935, 936, 969, 997
997 0.73900 0.45780 B 7 2 CHANDRA PAL SINGH BHATI
20 928M
1
A PARMESHWARI
30 928M B JAGRITI
57 928M C KAMAL
94 929, 934, 951
3
929 0.11400 0.00840 A 6 3 BALRAM BHATI 1. Khasra No 951 is not mentioned in provided list. 2. Remaining members have not filled questionnaire.
117 929, 934, 951
934 1.07500 0.12000 B 6 3 SATTO
149 929, 934, 951
951 C VED PAL SINGH
31 932, 971
2
932 0.26600 0.26600 A 53 2 SANJEEV KUMAR 1. Remaining members have not filled questionnaire. 2. Mr. Bhanwar Singh, Mr. Hem Singh, Mr. Udayvir Singh is not mentioned in provided list in khasra no 973.
39 932, 971
971 3.69800 3.38640 B 53 SHYAMI
10 932, 971, 990
3 990
1.67360 1.67360 A
59
9 MEGHRAM
12 932, 971, 990
B KARAN SINGH

138
15 932, 971, 990
C AJEET SINGH
16 932, 971, 990
D BRAHAM SINGH
34 932, 971, 990
E HEMRAJ
35 932, 971, 990
F SONU BHATI
145 932, 971, 990
G ANKIT BHATI
1
990M, 971M, 932
H BIRENDRA SINGH
2
990M, 971M, 932
I JITENDRA
81 971, 990
2 A 1 REETU
25 990M
1
C
4
VIJAY BHATI
144 990M D RAJWATI
157 990M E RAJVEER
162 990M F RAJESH KUMAR
53 932, 973, 990
3 973 1.34100 0.77770 A 14 3 BHANWAR SINGH

139
54 932, 973, 990
B HEM SINGH
55 932, 973, 990
C UDAYVIR SINGH
123 973 1
A 2
SATENDRA
126 973 B JUGENDRA
147
961M, 967M
2 961 0.05100 0.02990 A 21 1
SUMAN DEVI 1. Remaining members have not filled questionnaire.
967 0.69400 0.40490 21
24 964 A+964B 1
964 0.22800 0.13160 A 3 2 JAIBHAGWAN Mr. Ram Chander has not filled questionnaire
103 964d, 964[k
B RAMDAS
4
973M, 881M
2 973 1.34100 0.77700 A 14 1 GYANI 1. Some members are filled questionnaire but remaining members are not filled questionnaire. 2. Mr. Gyani is not mentioned in provided list in khasra no 881.
881 2.91800 1.77000 41
150 976, 978
2 976 0.29100 0.15180 A 6 RAJ SINGH 1. Remaining members have not filled questionnaire. 2. Mr. Raj Singh is not mentioned in provided list in khasra no 976, 978.
160 976, 978
978 0.30400 0.30400 B 7 BALESHWAR
161 976, 978
C BALRAM
173 97M 1 97M 0.74700 0.16600 A 2 1 SATYAPAL SINGH Mr. Brajpal has not fill questionnaire

140
141 980M 1 980 0.45500 0.02480 A 15 1 BHANWAR SINGH Remaining members have not filled questionnaire.
41 998M 1 998 1.08800 0.28600 A 8 1 DHARMVEER SINGH Remaining members have not filled questionnaire.
Source: Primary Survey and Bhulekh Record at villages of “Chamrawali Bodaki- Chitehara – Katehara – Palla” - DIZs
12.2 Annexure: Survey Questionnaire
12.3 Orders and Letters
12.4 Census Details of Dadri Tehsil
12.5 Design layout of MMTH and Freight Village

Page | 1
Gautam Buddha University, Greater Noida, U.P. xkSre cq) fo”ofo|ky;] xzsVj uks,Mk] m0iz0
Delhi-Mumbai Industrial Corridor Project
SOCIAL IMPACT ASSESSMENT
Lkkekftd lek?kkr fu/kkZj.k
Questionnaire (iz’ukoyh)
QUESTIONNAIRE NUMBER iz’ukoyh la[;k…………….. DATE frfFk………………..
A. DETAILS OF AREA {ks= dk C;kSjk
Village/ xkWao
Tehsil / rglhy Gautam Budh Nagar xkSre cq) uxj
District / ftyk Gautam Budh Nagar xkSre cq) uxj
State/ jkT; Uttar Pradesh mRrj izns’k
B. DETAILS OF RESPONDENT mRrjnkrk dk C;kSjk
1. Name (Head of the Family) uke ¼ifjokj dk eqf[k;k½ -
2. Age (Year) mez ¼o”kZ½
Less than 40 40-60 60-80 80 and above
3. Gender fyax Male iq:”k Female efgyk Other vU;
4. Educational Qualification ‘kSf{kd ;ksX;rk (Qualification Profile)
Uneducated ¼vf’kf{kr½ Upto 8th ¼ikWapoh ls de½ 10
th ¼nloh½ 12
th ¼ckjoh½
Graduate ¼iwoZLukrd½ Postgraduate ¼ijk&Lukrd½ Any Other Skill Development Programme,
specify name……………………………
5. Contact Details ¼laidZ lw=½
6. Aadhar Details ¼vk/kkj fooj.k½
7. Category oxZ
SC ¼vuqlwfpr tkfr½ ST ¼vuqlwfpr tutkfr½ OBC ¼vU; fiNM+k oxZ½ General ¼lkekU;½
8. Caste ¼tkfr½
9. Religion ¼/keZ½
Hindu ¼fgUnw½ Muslim ¼eqfLye½ Sikh ¼fl[k½ Christian ¼bZlkbZ½ Other (Specify) vU; ¼Li”V djsa½
10. Monthly income (in Rupees Thousands) –
1. No Stable Income ¼dksbZ LFkk;h vk; ugha½
2. Less than Rs. 4000/- month ¼:- 4]000 gtkj izfr ekg ls de½
3. Rs. 4- 10 Thousands ¼:- 4&10 gtkj izfr ekg½
4. Rs. 10 – 20 Thousands ¼:- 10&20 gtkj izfr ekg½
5. Rs. 20 – 50 Thousands ¼:- 20&50 gtkj izfr ekg½
6. Rs. 50 Thousand and above ¼:- 50 gtkj izfr ekg vkSj mlls vf/kd½
11. Source of income: a. Agriculture ¼d`f”k½ b. Non-Agriculture ¼vU; Jksr½ c. Unemployed ¼csjkstxkj½
Photo ¼rLohj½

Page | 2
11.a If agriculture, exact nature of source of income; ¼d`f”k vk; Jksr ds vk/kkj ij½
i. Agriculture labour ¼[ksfrgj etnwj½
ii. Cultivator ¼[ksfrgj@d`”kd½
iii. Any other, please specify ¼vU;] Li”V djs½
11.b If Non-agriculture: exact nature of source of income, Please specify
i. Govt. Service ¼ljdkjh lsok½
ii. Private Service ¼futh lsok½
iii. Business (Nature of Business) –¼O;kikj½
iv. Artisan f’kYidkj½
v. Labour ¼etnwj½
vi. Other source of income (specify) ¼vU;½
C. Details of Family Members including the Head of the family ifjokj ds eqf[k;k ,oa lnL;ksa
dk fooj.k along with INVOLVEMENT OF FAMILY IN ECONOMIC ACTIVITIES
vkfFkZd vk; dh izfØ;kvksa esa ifjokj dh lgHkkfxrk
1. Name of Member lnL;dk uke
1 2 3 4 5 6 7 8 9 10 11 12
2. Name (to be written
vertically) uke ¼yEcor fy[ksa½
Write down the name of all
members/persons who live
and eat together in the
household starting with
Head.¼lHkh lnL;ksa@ O;fDr;ksa dk uke nsa tks
lkFk jgrs gSaA eqf[k;k ls
izkjEHk djsA½
3. Relationship with
head of the family ¼ifjokj ds eqf[k;k
ds lkFk fj’rk½
4. Gender ¼fyax½ 1. Male
2. Female
3. Other
5. Age (Year) mez ¼o”kZ½ 1. 0-18
2. 18-35
3. 35-50
4. 50-60
5. Greater than 60
6. Marital status ¼oSokfgd fLFkfr½
1. Married
2. Unmarried
3. Divorce
4. Separated
5. Widow
6. Widower
7. Education
qualifications ¼’kSf{kd ;ksX;rk½
1. Uneducated/Illiterate
2. Upto 8th
3. 10th
4. 12th
5. Graduate
6. Postgraduate
7. Any Other Skills

Page | 3
7A. 12th
Stream 1. Science
2. Arts
3. Commerce
4. Any other
7 B. Graduate ¼Lukrd½
1. Science
2. Arts
3. Commerce
4. Medical
5. Engineering
6. Any other
7C. Post
Graduate ¼ijkLukrd½
1. Science (M.Sc.)
2. Arts (M.A.)
3. Commerce (M.Com)
4. Medical (MD/MS)
5. Engineering
(M.Tech.)
6. Any other
8. Occupation ¼O;olk;½ 1. Agriculture Cultivator
2. Business
3. Govt. Service
4. Private Service
5. Artisan
6. Labour
7. Agriculture Labour
8. Unemployed*
9. Other (Specify)
*Unemployment Status
(in months)
9. Classification of
Occupations - NCO-
2015
1. Legislators, Senior
Officials, and Managers –
ND
2. Professional -IV
3. Associate Professionals -
III
4. Clerks - II
5. Service Workers and
Shop & Market Sales
Workers - II
6. Skilled Agricultural and
Fishery Workers - II
7. Craft and related Trades
Workers -II
8. Plant and Machine
Operators and
Assemblers - II
9. Elementary Occupations
–I
10. Not Applicable (NA)
10. Monthly income
(Rs. in thousand) ¼ekfld vk;½
1. No stable income
2. Less than 4000/- month
3. 4- 10 Thousands

Page | 4
¼:- gtkj esa½
4. 10 – 20 Thousands
5. 20 – 50 Thousands
6. 50 Thousand and above
11. Family Total income ¼ifjokj dh dqy vk;½
(Amount in Rs) 1. BPL
2. Less than 1 Lakh
3. 1-3 Lakh
4. 3-5Lakh
5. 5-8 Lakh
6. 8-10 Lakh
7. 10 Lakh and above
12. Role of Women in
Family ¼ifjokj esa L=h dh Hkwfedk½
1. Head¼eqf[k;k½
2. Homemaker¼x`g.kh½
3. Any Others ¼vU;½
13. Any Disease ¼dksbZ
chekjh½/Chronic
Ailment ¼iqjkuh
chekjh½ /
Malnourished ¼dqiksf”kr½
Please specify below
14. Any Health Insurance ¼LokLF; chek½
Yes¼gkWa½ No ¼ugh½
D. INFORMATION REGARDING LAND AND LIVELIHOOD ¼Hkwfe vkSj vkthfodk ls lEcaf/kr
tkudkjh½
1 How much total area of land owned by household ¼ifjokj ds ikl ekStwn tehu½
Net Agricultural Use (Acre) [ksrh ;ksX; tehu ¼,dM+½
Non-agricultural Use; Barren (Acre) vd`f”k&;ksX;( catj½ tehu ¼,dM+½
Gross (Acre) dqy ¼,dM+½
2 How much of the PAF’ agricultural land belong to the following categories? [ksrh ;ksX; tehu dk {ks= fuEu Jsf.k;ksa esaA
Irrigated
Land (Acre) flfpr Hkwfe
¼,dM+½
No irrigated
Land (Acre) vflafpr Hkwfe
¼,dM+½
Fertile (Acre) lokZf/kd mitkÅ
¼,dM+½
Non- Fertile
(Acre) de mitkÅ ¼,dM+½
Orchard/
Tree
Plantation
(Acre) ckx@ o`{kkjksi.k
¼,dM+½
Water Source
(Acre) ikuh dk Jksr
¼,dM+½
3 How do you use your private assets? vki viuh O;fDrxr lEifRr dk mi;ksx dSls djrs gS\
Agriculture¼[ksrh½ Plantation ¼o`{kkjksi.k½ Commercial ¼O;kolkf;d½ Industry/MSME m|ksx@NksVs vkSj ek/;e m|ksx
Domestic ¼futh½ Others (Specify) vU; Li”V djsa
4 Do you own cottage for your livestock? D;k vkids ikl eosf’k;ksa ds fy, >ksiM+h gS\
Yes¼gkWa½ No ¼ugh½
If yes, mention the total area and no of cottages. ;fn gkWa] rks dqy {ks=Qy vkSj >ksifM+;ksa dh la[;k crk;saA
5 Number of livestock owned by the household. ifjokj ds ikyrw eosf’k;ksa dh la[;k
Cow ¼xk;½ Buffalo ¼HkSal½ Goat ¼cdjh½ Horse¼?kksM+k½ Others ¼vU;½ Total ¼dqy½

Page | 5
6 Number of people migrated from family to other places for ifjokj ls fuEu voljksa gsrq foLFkkfir lnL;ksa dh la[;k
Education ¼f’k{kk½
Employment ¼jkstxkj½ Others ¼vU;½ Total ¼dqy½
7 Do you have your own house? D;k vkids ikl viuk edku gS\
Yes ¼gkWa½ No¼ugha½
If yes, mention the total area and no of huts/houses ¼;fn gkWa rks dqy {ks=Qy vkSj >ksifM+;ksa@edku dh
la[;k crk,saA½
8 Number of private vehicles owned. futh okguksa dh la[;kA
2 Wheeler ¼nqifg;k½
4 Wheeler ¼pkjifg;k½
Tractor ¼VªSDVj½ Others ¼vU;½ Total ¼dqy½
9 Do you own agricultural equipments and other machinery? D;k vkids ikl [ksrh djus ds fy;s lgk;d midj.k RkFkk vU; e’khujh gS\
Yes¼gkWa½ No¼ugha½
If yes, specify the details. ;fn gkWa rks fooj.k nsaA
E. INFORMATION ABOUT TREES ON LAND Hkwfe ij isM+ksa ls lEcfU/kr tkudkjh
Name of the Tree ¼isM+ dk uke½
No. ¼la[;k½
Girth Size (in cm) ifjf/k dh uki ¼ls-
eh-½
Name of the tree ¼isM+ dk uke½
No. ¼la[;k½
Girth size (in cm) ifjf/k dh uki
¼ls-eh-½
1. 5
2 6
3. 7
4. 8.
F. INFORMATION ABOUT CROPS / Qlyksa dk fooj.k
S. No.
dz- la-
Main Crops Grown mxkbZ tkus okyh
eq[; Qlysa
Average yield/hectare vkSlr mit@gsDVs;j
1.
2.
3.
4.
5.
G. Vulnerability Status of Family -
1. Economic Status
AAY (ANTYODAYA Anna Yojana) ¼vUR;ksn;½ BPL ¼xjhch js[kk ls uhps½
APL ¼xjhch js[kk ds Åij½
Yellow Card Red Card Orange Card
WIDOW¼fo/kok½ DIIFERENTLY ABLE¼fnO;kax½ ORPHAN¼vukFk½
ELDERLY (ABOVE 60 YEARS WITHOUT DEPENDENT) ofj”B ¼60 lky ls Åij] ftudk dksbZ vkfJr ugha gSA½
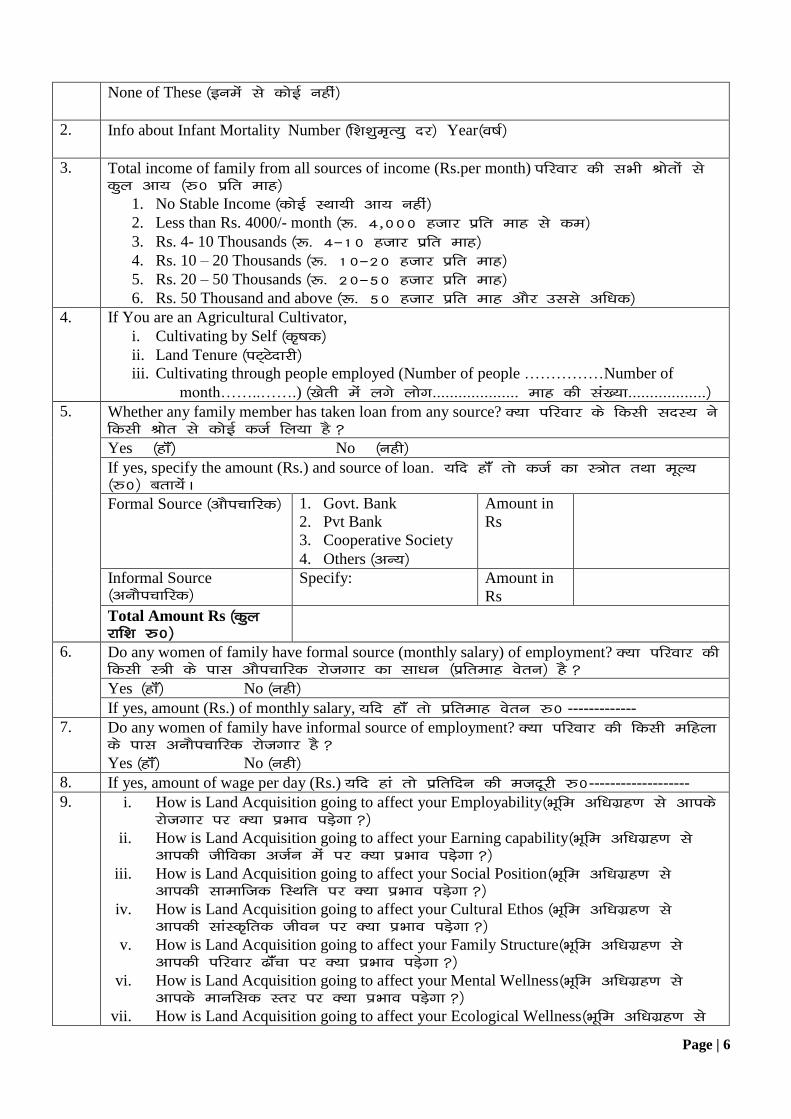
Page | 6
None of These ¼buesa ls dksbZ ugha½
2. Info about Infant Mortality Number ¼f’k’kqe`R;q nj½ Year¼o”kZ½
3. Total income of family from all sources of income (Rs.per month) ifjokj dh lHkh Jksrksa ls dqy vk; ¼#0 izfr ekg½
1. No Stable Income ¼dksbZ LFkk;h vk; ugha½
2. Less than Rs. 4000/- month ¼:- 4]000 gtkj izfr ekg ls de½
3. Rs. 4- 10 Thousands ¼:- 4&10 gtkj izfr ekg½
4. Rs. 10 – 20 Thousands ¼:- 10&20 gtkj izfr ekg½
5. Rs. 20 – 50 Thousands ¼:- 20&50 gtkj izfr ekg½
6. Rs. 50 Thousand and above ¼:- 50 gtkj izfr ekg vkSj mlls vf/kd½
4. If You are an Agricultural Cultivator,
i. Cultivating by Self ¼d`”kd½
ii. Land Tenure ¼iV~Vsnkjh½
iii. Cultivating through people employed (Number of people ……………Number of
month……..…….) ¼[ksrh esa yxs yksx-------------------- ekg dh la[;k------------------½
5. Whether any family member has taken loan from any source? D;k ifjokj ds fdlh lnL; us fdlh Jksr ls dksbZ dtZ fy;k gS\
Yes ¼gkWa½ No ¼ugh½
If yes, specify the amount (Rs.) and source of loan- ;fn gkWa rks dtZ dk L=ksr rFkk ewY; ¼#0½ crk;saA
Formal Source ¼vkSipkfjd½
1. Govt. Bank
2. Pvt Bank
3. Cooperative Society
4. Others ¼vU;½
Amount in
Rs
Informal Source ¼vukSipkfjd½
Specify: Amount in
Rs
Total Amount Rs ¼dqy jkf’k #0½
6. Do any women of family have formal source (monthly salary) of employment? D;k ifjokj dh fdlh L=h ds ikl vkSipkfjd jkstxkj dk lk/ku ¼izfrekg osru½ gS\
Yes ¼gkWa½ No ¼ugh½
If yes, amount (Rs.) of monthly salary, ;fn gkWa rks izfrekg osru #0 -------------
7. Do any women of family have informal source of employment? D;k ifjokj dh fdlh efgyk ds ikl vukSipkfjd jkstxkj gS\
Yes ¼gkWa½ No ¼ugh½
8. If yes, amount of wage per day (Rs.) ;fn gka rks izfrfnu dh etnwjh #0-------------------
9. i. How is Land Acquisition going to affect your Employability¼Hkwfe vf/kxzg.k ls vkids jkstxkj ij D;k IkzHkko iM+sxk\½
ii. How is Land Acquisition going to affect your Earning capability¼Hkwfe vf/kxzg.k ls vkidh thfodk vtZu esa ij D;k IkzHkko iM+sxk\½
iii. How is Land Acquisition going to affect your Social Position¼Hkwfe vf/kxzg.k ls vkidh lkekftd fLFkfr ij D;k IkzHkko iM+sxk\½
iv. How is Land Acquisition going to affect your Cultural Ethos ¼Hkwfe vf/kxzg.k ls vkidh lkaLd`frd thou ij D;k IkzHkko iM+sxk\½
v. How is Land Acquisition going to affect your Family Structure¼Hkwfe vf/kxzg.k ls vkidh ifjokj <kWapk ij D;k IkzHkko iM+sxk\½
vi. How is Land Acquisition going to affect your Mental Wellness¼Hkwfe vf/kxzg.k ls vkids ekufld Lrj ij D;k IkzHkko iM+sxk\½
vii. How is Land Acquisition going to affect your Ecological Wellness¼Hkwfe vf/kxzg.k ls

Page | 7
vkidh ikfjLFkfrd dY;k.k ij D;k IkzHkko iM+sxk\½
10. What are preferred rehabilitation/resettlement measures? iquZokl @ iquZLFkkiu mik;ksa esa D;k izkFkkfdrk gS\
Measure ¼mik;½ 1- 2- 3-
H. HOW OFTEN DO YOU ACCESS NATURAL OR COMMON RESOURCES?
lkoZtfud vFkok izkd`frd lalk/kuksa dk mi;ksx djus dh vko`fRr
1 How do you often access common or public owned property (canals, ponds, tube wells, etc)? vki lkoZtfud lalk/kuksa dk mi;ksx fdruk djrs gSa ¼ugj] tyk’k;] V;wcsy] vkfn½\
Rarely ¼dHkh&dHkh½ Mostly ¼T;knkrj½ Don’t Use ¼mi;ksx ugh djrs½
2 How often do you use public transport facilities (buses, etc)? vki lkoZtfud ;krk;kr dk iz;ksx fdruk djrs gS\
Rarely ¼dHkh&dHkh½ Mostly ¼T;knkrj½ Don’t Use ¼mi;ksx ugh djrs½
3 How is road connectivity in your area? vkids {ks= esa lM+d lqfo/kk dSlh gS\
Good ¼vPNh½ Bad ¼cqjh½ Don’t Know ¼irk ugh½
4 How regular do you go to the nearest market? vki utnhdh cktkj esa fdl varjky ij tkrs gS\
Rarely ¼dHkh&dHkh½ Mostly ¼T;knkrj ½ Daily ¼izfrfnu½
5 Have you ever participated in dairy cooperatives/agricultural cooperatives? D;k vkius nw/k vFkok d`f”k dh lgdkfjrk ;kstukvksa esa dHkh Hkkx fy;k gS\
Yes ¼gkWa½ No ¼ugh½ Don’t Remember ¼;kn ugh½
6 Have you ever been a member of D;k vki dHkh% Lo;a lgk;rk lewg ;k ,sls vU; laxBu ds lnL; jgs gSa\
1. ‘Self Help Group’ (SHG) Yes /No
2. Any other such associations? Yes /No [If Yes, please specify……………………]
7 What are the sources of energy for cooking? [kkuk idkus esa iz;qDr ÅtkZ dk Jksr D;k gS\
LPG Cylinder ¼flfyaMj½
Firewood ¼ydM+h½
Kerosene oil feVVh dk rsy
Leaf/Straw ifRr;kWa@iqvky
Others vU;
8 Resources of lighting ¼mtkys dk Jksr½
Electricity ¼fctyh½
Kerosene ¼feV~Vh dk rsy½
Battery ¼cSVjh½ Solar Energy ¼lkSj&ÅtkZ½
Others ¼vU;½
9 Sources of Drinking Water ¼is; ty dk Jksr½
PHED Supply
Water ¼ih-,p-bZ-Mh-vkiwfrZ½
Hand Pump ¼gSaM iEi½
Well ¼dqvkWa½ Stream/Pond ¼unh] rkykc½
Others ¼vU;½
10 Sanitation Facility ¼LoPNrk lqfo/kk½
Community
Toilet ¼lkeqnkf;d
‘kkSpky;½
Flush/Pucca Toilet ¼Qy’k@iDdk
‘kkSpky;½
Kutcha/Pit ¼dPpk@xM~<+k½
Open Defecation ¼[kqys esa eyR;kx½
Others ¼vU;½
11 Do you have bathrooms? ¼D;k vkids ;gkWa Lukukxkj gS\½
Inside House ¼?kj ds Hkhrj½
Outside House¼?kj ds ckgj½
Community Bathroom¼lkeqfgd Lukukxkj½

Page | 8
I. COMMON RESOURCES AND PUBLIC AMENITIES ¼lkekftd lalk/ku ,oa lqfo/kk,sa½
1 Are you aware of land acquisition in this area? D;k vki bl {ks= Hkwfe vf/kxzg.k ls voxr gaS\
Yes ¼gkWa½ No ¼ugha½ Don’t Know ¼irk ugha½
2 Is there any community center and civic space in this area? D;k bl {ks= esa dksbZ lkeqnkf;d dsUnz ;k ukxfjd LFkku gS\
Yes ¼gkWa½ No ¼ugha½ Don’t Know ¼irk ugha½
3 Is there any temple/mosque /any other such religious place present in this area? D;k bl {ks= esa dksbZ dksbZ eafnj@ efLtn vFkok dksbZ vU; /kkfeZd LFkku miyC/k gS\
Yes ¼gkWa½ No ¼ugh½ Don’t Know ¼irk ugh½
4 Is there proper water supply facility available in this area? D;k bl {ks= esa ty forj.k dh leqfpr O;oLFkk miyC/k gS\
Yes ¼gkWa½ No ¼ugha½ Don’t Know ¼irk ugh½
5 Is there proper sewage system available to every house in this area? D;k bl {ks= ds izR;sd ?kj esa lhost ¼ey½ O;oLFkk gS\
Yes ¼gkWa½ No ¼ugha½ Don’t Know ¼irk ugh½
6 Is there proper electricity distribution system in this area? D;k bl {ks= esa fo|qr dh leqfpr forj.k O;oLFkk miyC/k gS\
Yes ¼gkWa½ No ¼ugh½ Don’t Know ¼irk ugha½
7 Is electricity available to this area (24*7)? D;k bl {ks= esa iwjs lIrkg esa 24 ?k.Vs fctyh miyC/k gS\
Yes ¼gkWa½ No ¼ugh½ Don’t Know ¼irk ugh½
8 Are better roads provided to connect every house in this area? D;k bl {ks= esa izR;sd ?kj rd igqWapus ds fy, vPNh lM+das miyC/k gSa\
Yes ¼gkWa½ No ¼ugh½ Don’t Know ¼irk ugh½
9 Is there any school available in this area? D;k bl {ks= esa dksbZ fo|ky; miyC/k gS\
Yes ¼gkWa½ No ¼ugh½ Don’t Know ¼irk ugh½
If yes, specify the details of school.;fn gkWa rks fo|ky; dk fooj.k nsaA
Primary izkFkfed Secondary ek/;fed Senior Secondary mPp ek/;fed
10 Is there health facility center or hospital available in this area? D;k bl {ks= esa LokLF; lqfo/kk dsUnz ;k vLirky miyC/k gS\
Yes ¼gkWa½ No ¼ugh½ Don’t Know ¼irk ugh½
11 Is there any ANGANAWADI center in this area? D;k bl {ks= esa dksbZ vkxuokM+h dsUnz gS\
Yes ¼gkWa½ No ¼ugh½ Don’t Know ¼irk ugh½
12 Is there any fair public distribution system (PDS) available in this area? D;k bl {ks= esa lkoZtfud forj.k dsUnz dh lqfo/kk miyC/k gS\
Yes ¼gkWa½ No ¼ugh½ Don’t Know ¼irk ugh½
13 Is there any social gathering center available for women in this area? D;k bl {ks= esa efgykvksa ds fy;s dksbZ lkoZtfud ,df=r {ks= gS\
Yes ¼gkWa½ No ¼ugh½ Don’t Know ¼irk ugh½
14 What is the crime rate in this area? bl {ks= esa vijk/k nj fdruh gS\
Low Medium High

Page | 9
J. IMPACT ANALYSIS OF ACQUISTION ON LAND, LIVELIHOOD AND INCOME
Hkwfe vf/kxzg.k] thou ;kiu rFkk vk; ij izHkko dk fo’ys”k.k
1 Do you think there will be increase in employment productivity in the area? D;k {ks= esa jkstxkj mRikndrk esa o`f) gksxh\
Yes ¼gkWa½ No ¼ugha½ Can’t Say ¼dg ugh ldrs½
2 Do you think there will be an increase in business opportunity in the area? D;k {ks= esa vkS/kksfxd volj esa o`f) gksxh\
Yes ¼gkWa½ No ¼ugha½ Can’t Say ¼dg ugh ldrs½
3 Do you think there will be increase in land price in the area?D;k {ks= esa Hkwfe dh dher esa o`f) gksxh\
Yes ¼gkWa½ No ¼ugha½ Can’t Say ¼dg ugh ldrs½
4 Do you think there will be an increase in public facility in the area?D;k{ks= esa lkoZtfud lqfo/kk esa o`f) gksxh\
Yes ¼gkWa½ No ¼ugha½ Can’t Say ¼dg ugha ldrs½
5 Do you think there will be an increase in formal employment productivity in the area? D;k {ks= esa vkSipkfjd jkstxkj mRikndrk esao`f) gksxhA\
Yes ¼gkWa½ No ¼ugha½ Can’t Say ¼dg ugha ldrs½
6 Do you think there will be an increase in standard of living in the area? D;k {ks= esa jgus ds ekud esa o`f) gksxh\
Yes ¼gkWa½ No ¼ugh½ Can’t Say ¼dg ugh ldrs½
7 Do you think there will be an increase in standard of living in the area? D;k {ks= esa O;fDr ds vk; esa o`f) gksxh\
Yes ¼gkWa½ No ¼ugh½ Can’t Say ¼dg ugh ldrs½
8 Do you think there will be an increase in food security in the area?D;k{ks= esa [kk| lqj{kk esa o`f) gksxh\
Yes ¼gkWa½ No ¼ugh½ Can’t Say ¼dg ugh ldrs½
9 Do you think there will be an increase in women employment productivity in the area? D;k {ks= esa efgykvksa ds jkstxkj mRikndrk esa o`f) gksxh\
Yes ¼gkWa½ No ¼ugh½ Can’t Say ¼dg ugh ldrs½
10 Do you think there will be an increase in standard of living in the area? D;k bl {ks= esa thou ekud esa o`f) gksxh\
Yes ¼gkWa½ No ¼ugh½ Can’t Say ¼dg ugh ldrs½
11 Does acquisition affect the local economy of the area? D;k vf/kdj.k {ks= dh vkfFkZdh dks izHkkfor djrk gS\
Yes ¼gkWa½ No ¼ugh½ Can’t Say ¼dg ugh ldrs½
12 Do you think there will be an increase in economic dependency in the area? D;k {ks= esa vkfFkZd fuHkZjrk esa o`f) gksxh\
Yes ¼gkWa½ No ¼ugh½ Can’t Say ¼dg ugh ldrs½
13 Do you think there will be an increase in access of productive resources to people in the area? D;k {ks= esa yksxksa dks mRikn lalk/kuksa dh miyC/krk esa o`f) gksxh\
Yes ¼gkWa½ No ¼ugh½ Can’t Say ¼dg ugh ldrs½
14 How does acquisition affect the wildlife (if any) of the area? vf/kxzg.k fdl izdkj {ks= ds oU;thou ¼;fn gks½ dks izHkkfor djrk gS\
Yes ¼gkWa½ No ¼ugh½ Can’t Say ¼dg ugh ldrs½

Page | 10
15 Are there any wild plant and wild animal in the area? D;k bl {ks= esa taxyh ikS/ks vkSj taxyh tkuoj gS\
Yes ¼gkWa½ No ¼ugh½ Can’t Say ¼dg ugh ldrs½
If yes, specify. ;fn gkWa rks crk,a%
Wild Plant taxyh ikS/ks Wild Animal taxyh tkuoj
K. IMPACT ANALYSIS OF PHYSICAL RESOURCES
HkkSfrd lalk/kuksa ij izHkko dk fo’ys”k.k
1 How might this project impact the soil of the surrounding area? ;g ifj;kstuk vklikl ds {ks= dh feV~Vh dks dSls izHkkfor djsxh\
Positive ¼ldkjkRed½ Negative ¼udkjkRed½ Can’t Say ¼dg ugh ldrs½
2 How might this project impact the air quality of the surrounding area? bl ifj;kstuk dk vklikl ds {ks= ds gokbZ feJ.k ij D;k izHkko iMs+xk\
Positive ¼ldkjkRed½ Negative ¼udkjkRed½ Can’t Say ¼dg ugh ldrs½
3 How might this project impact the water source, water reserve and underground water table of
the surrounding area? ;g ifj;kstuk vkl&ikl ds {ks= ds ty Jksr] ikuh Hk.Mkj vkSj Hkwfexr ty rkfydk dks dSls izHkkfor djsxh\
Positive ¼ldkjkRed½ Negative ¼udkjkRed½ Can’t Say ¼dg ugh ldrs½
4 How might this project impact the forest reserve, if any, of the surrounding area? ;g ifj;kstuk vkl&ikl ds {ks= ds lqjf{kr oUkdks] ;fn miyC/k gks] dSls izHkkfor djsxh\
Positive ¼ldkjkRed½ Negative ¼udkjkRed½ Can’t Say ¼dg ugh ldrs½
5 Do you think that this project may increase the noise pollution in the surrounding area? D;k vkidks yxrk gS fd ;g ifj;kstuk vkl&ikl ds {ks= esa /ofu iznw”k.k c<+k;sxh\
Yes ¼gkWa½ No ¼ugh½ Can’t Say ¼dg ugh ldrs½
L. IMPACT ANALYSIS OF PRIVATE ASSETS, PUBLIC SERVICES AND UTILITIES
O;fDrxr lEifŸk] lkoZtfud lsokvksa rFkk mi;ksfxrkvksa ij izHkko dk fo’ys”k.k
1 Do you think there will be an increase in health facility/hospital in the area? D;k vkidks yxrk gS fd {ks= esa LokLF; lqfo/kkvksa@vLirky esa c<ksRrjh gksxh\
Yes ¼gkWa½ No ¼ugh½ Can’t Say ¼dg ugh ldrs½
2 Do you think there will be an increase in educational facility/schools/colleges in the area? D;k vkidks yxrk gS fd {ks= esa f’k{kk lqfo/kkvksa@Ldwyksa@dkWystksa esa c<+ksRrjh gksxh\
Yes ¼gkWa½ No ¼ugh½ Can’t Say ¼dg ugh ldrs½
3 Do you think there will be an increase in housing capacity and facility in the area? D;k vkidks yxrk gS fd {ks= esa vkokl {kerk rFkk lqfo/kk esa o`f) gksxh\
Yes ¼gkWa½ No ¼ugh½ Can’t Say ¼dg ugh ldrs½
4 Do you think there will be an increase in supply of local services/house help in the area? D;k vkidks yxrk gS fd {ks= esa LFkkuh; lsokvksa@?kjsyw lgk;dksa dh vkiwfrZ c<+sxh\
Yes ¼gkWa½ No ¼ugh½ Can’t Say ¼dg ugh ldrs½
5 Do you think there will be an increase in electricity availability in the area? D;k vkidks yxrk gS fd {ks= esa fo|qr vkiwfrZ c<s+xh\
Yes ¼gkWa½ No ¼ugh½ Can’t Say ¼dg ugh ldrs½

Page | 11
6 Do you think there will be an increase in value of private asset in the area? D;k vkidks yxrk gS fd {ks= esa O;fDrxr laifRr dk ewY; c<s+xk\
Yes ¼gkWa½ No ¼ugh½ Can’t Say ¼dg ugh ldrs½
7 Do you think there will be an improvement in the availability of resources to people in the
area? D;k vkidks yxrk gS fd {ks= esa yksxksa ds fy, vPNs lalk/kuksa dh miyC/krk c<s+xh\
Yes ¼gkWa½ No ¼ugh½ Can’t Say ¼dg ugh ldrs½
8 Do you think there will be an increase in transportation and road facility in the area? D;k vkidks yxrk gS fd {ks= esa vkokxeu vkSj lM+d lqfo/kk,sa c<s+xh\
Yes ¼gkWa½ No ¼ugh½ Can’t Say ¼dg ugh ldrs½
M. AWARENESS ABOUT PROJECT ifj;kstuk ds ckjs esa tkudkjh
Does the respondent know about
the project? D;k mRrjnkrk dks ifj;kstuk
dh tkudkjh gS\
Yes ¼gkWa½ No ¼ugh½
If Yes, Means of Awareness ;fn gkWa] rks tkudkjh dk Jksr
1. Newspaper lekpkj i=
2. TV nwjn’kZu
3. Word of Mouth fdlh ds }kjk
4. Govt. officials ljdkjh vf/kdkfj;ksa ls
5. Others vU;

Page | 1
Gautam Buddha University, Greater Noida, U.P. xkSre cq) fo”ofo|ky;] xzsVj uks,Mk] m0iz0
Delhi-Mumbai Industrial Corridor Project SOCIAL IMPACT ASSESSMENT
Lkkekftd lek?kkr fu/kkZj.k
Focus Group Discussion (FGD)
A. DETAILS OF AREA / RESPONDENT (Gata No.) {ks= dk C;kSjk
Village/xkWao 1.
2.
3.
4.
5.
6.
7.
8.
Gata No
B. Basic Details
1 What is your source of income?
2 If agriculture, exact nature of source of income;
3 If Non-agriculture: exact nature of source of income;
4 Describe role of Women in Family
5 Do you use your private assets for the domestic use or Commercial purpose?
6 What type of card do you have?
AAY¼vUR;ksn;½-BPL ¼xjhch js[kk ls uhps½APL ¼xjhch js[kk ds Åij½
Yellow Card Red Card Orange Card
7 i. How is Land Acquisition going to affect your Employability¼Hkwfe vf/kxzg.k ls vkids jkstxkj ij D;k IkzHkko iM+sxk\½

Page | 2
ii. How is Land Acquisition going to affect your Earning capability¼Hkwfe vf/kxzg.k ls vkidh thfodk vtZu esa ij D;k IkzHkko iM+sxk\½
iii. How is Land Acquisition going to affect your Social Position¼Hkwfe vf/kxzg.k ls vkidh lkekftd fLFkfr ij D;k IkzHkko iM+sxk\½
iv. How is Land Acquisition going to affect your Cultural Ethos ¼Hkwfe vf/kxzg.k ls vkidh lkaLd`frd thou ij D;k IkzHkko iM+sxk\½
v. How is Land Acquisition going to affect your Family Structure¼Hkwfe vf/kxzg.k ls vkidh ifjokj <kWapk ij D;k IkzHkko iM+sxk\½
vi. How is Land Acquisition going to affect your Mental Wellness¼Hkwfe vf/kxzg.k ls vkids ekufld Lrj ij D;k IkzHkko iM+sxk\½
vii. How is Land Acquisition going to affect your Ecological Wellness¼Hkwfe vf/kxzg.k ls vkidh ikfjLFkfrd dY;k.k ij D;k IkzHkko iM+sxk\½
C. OPINION ABOUT IMPACT OF ACQUISTION ON LAND, LIVELIHOOD AND
INCOME (Hkwfe vf/kxzg.k] thou ;kiu rFkk vk; ij izHkko dk fo’ys”k.k½
1 Do you think there will be increase in employment productivity in the area? D;k {ks= esa jkstxkj mRikndrk esa o`f) gksxh\
2 Do you think there will be an increase in business opportunity in the area? D;k {ks= esa vkS/kksfxd volj esa o`f) gksxh\
3 Do you think there will be increase in land price in the area?D;k {ks= esa Hkwfe dh dher esa o`f) gksxh\
4 Do you think there will be an increase in public facility in the area?D;k{ks= esa lkoZtfud lqfo/kk esa o`f) gksxh\
5 Do you think there will be an increase in formal employment productivity in the area? D;k {ks= esa vkSipkfjd jkstxkj mRikndrk esao`f) gksxhA\

Page | 3
6 Do you think there will be an increase in standard of living in the area? D;k {ks= esa jgus ds ekud esa o`f) gksxh\
7 Do you think there will be an increase in standard of living in the area? D;k {ks= esa O;fDr ds vk; esa o`f) gksxh\
8 Do you think there will be an increase in food security in the area?D;k{ks= esa [kk| lqj{kk esa o`f) gksxh\
9 Do you think there will be an increase in women employment productivity in the area? D;k {ks= esa efgykvksa ds jkstxkj mRikndrk esa o`f) gksxh\
10 Do you think there will be an increase in standard of living in the area? D;k bl {ks= esa thou ekud esa o`f) gksxh\
11 Does acquisition affect the local economy of the area? D;k vf/kdj.k {ks= dh vkfFkZdh dks izHkkfor djrk gS\
12 Do you think there will be an increase in economic dependency in the area? D;k {ks= esa vkfFkZd fuHkZjrk esa o`f) gksxh\
13 Do you think there will be an increase in access of productive resources to people in the area? D;k {ks= esa yksxksa dks mRikn lalk/kuksa dh miyC/krk esa o`f) gksxh\
14 How does acquisition affect the wildlife (if any) of the area? vf/kxzg.k fdl izdkj {ks= ds oU;thou ¼;fn gks½ dks izHkkfor djrk gS\
15 Are there any wild plant and wild animal in the area? D;k bl {ks= esa taxyh ikS/ks vkSj taxyh tkuoj gS\

Page | 4
D. OPINION ABOUT IMPACT ON PHYSICAL RESOURCES (HkkSfrd lalk/kuksa ij izHkko
dk fo’ys”k.k½
1 How might this project impact the soil of the surrounding area? ;g ifj;kstuk vklikl ds {ks= dh feV~Vh dks dSls izHkkfor djsxh\
2 How might this project impact the air quality of the surrounding area? bl ifj;kstuk dk vklikl ds {ks= ds gokbZ feJ.k ij D;k izHkko iMs+xk\
3 How might this project impact the water source, water reserve and underground water table of
the surrounding area? ;g ifj;kstuk vkl&ikl ds {ks= ds ty Jksr] ikuh Hk.Mkj vkSj Hkwfexr ty rkfydk dks dSls izHkkfor djsxh\
4 How might this project impact the forest reserve, if any of the surrounding area? ;g ifj;kstuk vkl&ikl ds {ks= ds lqjf{kr oUkdks] ;fn miyC/k gks] dSls izHkkfor djsxh\
5 Do you think that this project may increase the noise pollution in the surrounding area? D;k vkidks yxrk gS fd ;g ifj;k stuk vkl&ikl ds {ks= esa /ofu iznw”k.k c<+k;sxh\
E. OPINION ABOUT IMPACT ON PRIVATE ASSETS, PUBLIC SERVICES AND
UTILITIES (O;fDrxr lEifŸk] lkoZtfud lsokvksa rFkk mi;ksfxrkvksa ij izHkko dk fo’ys”k.k½
1 Do you think there will be an increase in health facility/hospital in the area? D;k vkidks yxrk gS fd {ks= esa LokLF; lqfo/kkvksa@vLirky esa c<ksRrjh gksxh\
2 Do you think there will be an increase in educational facility/schools/colleges in the area? D;k vkidks yxrk gS fd {ks= esa f’k{kk lqfo/kkvksa@Ldwyksa@dkWystksa esa c<+ksRrjh gksxh\
3 Do you think there will be an increase in housing capacity and facility in the area? D;k vkidks yxrk gS fd {ks= esa vkokl {kerk rFkk lqfo/kk esa o`f) gksxh\
4 Do you think there will be an increase in supply of local services/house help in the area? D;k vkidks yxrk gS fd {ks= esa LFkkuh; lsokvksa@?kjsyw lgk;dksa dh vkiwfrZ c<+sxh\

Page | 5
5 Do you think there will be an increase in electricity availability in the area? D;k vkidks yxrk gS fd {ks= esa fo|qr vkiwfrZ c<s+xh\
6 Do you think there will be an increase in value of private asset in the area? D;k vkidks yxrk gS fd {ks= esa O;fDrxr laifRr dk ewY; c<s+xk\
7 Do you think there will be an improvement in the availability of resources to people in the
area? D;k vkidks yxrk gS fd {ks= esa yksxksa ds fy, vPNs lalk/kuksa dh miyC/krk c<s+xh\
8 Do you think there will be an increase in transportation and road facility in the area? D;k vkidks yxrk gS fd {ks= esa vkokxeu vkSj lM+d lqfo/kk,sa c<s+xh\
F. ANY OTHER OPINION/OBSERVATION ABOUT PROJECT IMPACT ON
WELLBEING OF THE PROJECT AFFECTED FAMILIES (PAFs)

44
TABLE 30: NUMBER AND PERCENTAGE OF MAIN WORKERS, MARGINAL WORKERS, AND NON-WORKERS BY SEX IN TAHSILS, 2011
Serial number
Name of Tahsil Persons / Males / Females
Total population
Main workers Marginal workers Total workers (Main and marginal)
Non workers
Number Percentage Number Percentage Number Percentage Number Percentage 1 2 3 4 5 6 7 8 9 10 11 12 1 Dadri Persons 1110093 327863 29.53 65044 5.86 392907 35.39 717186 64.61
Males 601465 269586 44.82 40113 6.67 309699 51.49 291766 48.51 Females 508628 58277 11.46 24931 4.90 83208 16.36 425420 83.64
2 Gautam Buddha Nagar Persons 316790 80782 25.50 22938 7.24 103720 32.74 213070 67.26 Males 169959 66558 39.16 12920 7.60 79478 46.76 90481 53.24 Females 146831 14224 9.69 10018 6.82 24242 16.51 122589 83.49
3 Jewar Persons 221232 49847 22.53 22635 10.23 72482 32.76 148750 67.24 Males 118790 41731 35.13 12476 10.50 54207 45.63 64583 54.37 Females 102442 8116 7.92 10159 9.92 18275 17.84 84167 82.16 District: Gautam Buddha Nagar Persons 1648115 458492 27.82 110617 6.71 569109 34.53 1079006 65.47
Males 890214 377875 42.45 65509 7.36 443384 49.81 446830 50.19 Females 757901 80617 10.64 45108 5.95 125725 16.59 632176 83.41
Table 30 gives the number and percentage of main workers, marginal workers and non-workers by sex at tahsil level in the district as per 2011 Census. The proportion of the total workers works out to 34.53 per cent of the total population in the district. The total workers are comprised of 27.82 per cent of main workers and 6.71 per cent of marginal workers and the remaining 65.47 per cent are non-workers. Among the main workers, male participation rate in the district is 42.45 per cent and 10.64 per cent of females. Male and female marginal workers account for 7.36 and 5.95 per cent respectively. The percentage of female marginal workers is lower than males. Total workers (main and marginal) among tahsils varies from 32.74 per cent in Gautam Buddha Nagar tahsil to 35.39 per cent in Dadri tahsil.
TABLE 31: NUMBER AND PERCENTAGE OF MAIN WORKERS, MARGINAL WORKERS, AND NON-WORKERS BY SEX IN C. D. BLOCKS, 2011
Serial number
Name of C.D. block
Persons / Males / Females
Total Population
Main workers Marginal workers Total workers (Main and marginal )
Non workers
Number Percentage Number Percentage Number Percentage Number Percentage 1 2 3 4 5 6 7 8 9 10 11 12 1 Bisrakh Persons 137747 31066 22.55 11458 8.32 42524 30.87 95223 69.13
Males 73400 26311 35.85 6953 9.47 33264 45.32 40136 54.68 Females 64347 4755 7.39 4505 7.00 9260 14.39 55087 85.61
2 Dadri Persons 194979 46251 23.72 15776 8.09 62027 31.81 132952 68.19 Males 103362 38147 36.91 9208 8.91 47355 45.81 56007 54.19 Females 91617 8104 8.85 6568 7.17 14672 16.01 76945 83.99
3 Dankaur Persons 184567 43271 23.44 14850 8.05 58121 31.49 126446 68.51 Males 98561 36203 36.73 7686 7.80 43889 44.53 54672 55.47 Females 86006 7068 8.22 7164 8.33 14232 16.55 71774 83.45
4 Jewar Persons 156513 35722 22.82 18279 11.68 54001 34.50 102512 65.50 Males 84282 29109 34.54 9486 11.26 38595 45.79 45687 54.21 Females 72231 6613 9.16 8793 12.17 15406 21.33 56825 78.67
Total Persons 673806 156310 23.20 60363 8.96 216673 32.16 457133 67.84 Males 359605 129770 36.09 33333 9.27 163103 45.36 196502 54.64 Females 314201 26540 8.45 27030 8.60 53570 17.05 260631 82.95
Table 31 shows C.D. block-wise number and percentage of main workers, marginal workers and non-workers for rural population of the district. Of the 673806 total rural population of the district, 23.20 per cent has been categorised as main workers and the marginal workers constitute 8.96 per cent and the remaining 67.84 per cent fall in the category of non-workers. The sex-wise break up at the district level shows that 36.09 per cent males and 8.45 per cent females are in the category of main workers. Male and
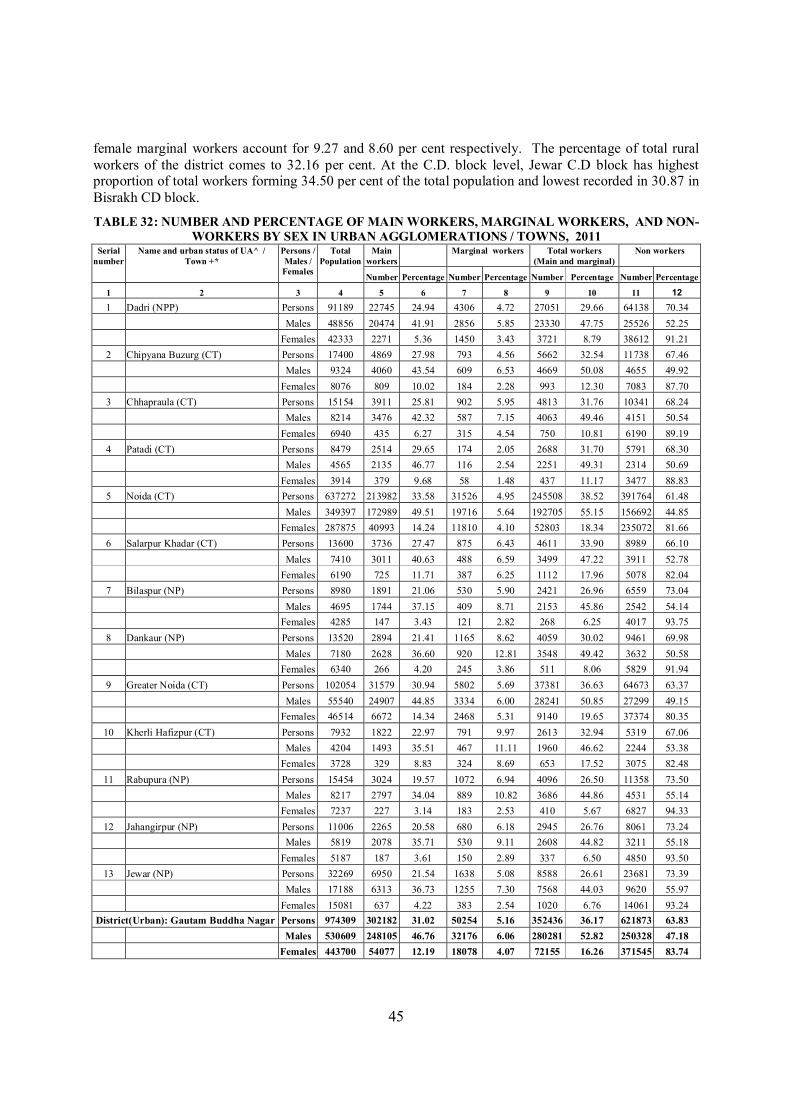
45
female marginal workers account for 9.27 and 8.60 per cent respectively. The percentage of total rural workers of the district comes to 32.16 per cent. At the C.D. block level, Jewar C.D block has highest proportion of total workers forming 34.50 per cent of the total population and lowest recorded in 30.87 in Bisrakh CD block.
TABLE 32: NUMBER AND PERCENTAGE OF MAIN WORKERS, MARGINAL WORKERS, AND NON-WORKERS BY SEX IN URBAN AGGLOMERATIONS / TOWNS, 2011
Serial number
Name and urban status of UA^ / Town +*
Persons / Males / Females
Total Population
Main workers
Marginal workers Total workers (Main and marginal)
Non workers
Number Percentage Number Percentage Number Percentage Number Percentage
1 2 3 4 5 6 7 8 9 10 11 12 1 Dadri (NPP) Persons 91189 22745 24.94 4306 4.72 27051 29.66 64138 70.34 Males 48856 20474 41.91 2856 5.85 23330 47.75 25526 52.25 Females 42333 2271 5.36 1450 3.43 3721 8.79 38612 91.21
2 Chipyana Buzurg (CT) Persons 17400 4869 27.98 793 4.56 5662 32.54 11738 67.46 Males 9324 4060 43.54 609 6.53 4669 50.08 4655 49.92 Females 8076 809 10.02 184 2.28 993 12.30 7083 87.70
3 Chhapraula (CT) Persons 15154 3911 25.81 902 5.95 4813 31.76 10341 68.24 Males 8214 3476 42.32 587 7.15 4063 49.46 4151 50.54 Females 6940 435 6.27 315 4.54 750 10.81 6190 89.19
4 Patadi (CT) Persons 8479 2514 29.65 174 2.05 2688 31.70 5791 68.30 Males 4565 2135 46.77 116 2.54 2251 49.31 2314 50.69 Females 3914 379 9.68 58 1.48 437 11.17 3477 88.83
5 Noida (CT) Persons 637272 213982 33.58 31526 4.95 245508 38.52 391764 61.48 Males 349397 172989 49.51 19716 5.64 192705 55.15 156692 44.85 Females 287875 40993 14.24 11810 4.10 52803 18.34 235072 81.66
6 Salarpur Khadar (CT) Persons 13600 3736 27.47 875 6.43 4611 33.90 8989 66.10 Males 7410 3011 40.63 488 6.59 3499 47.22 3911 52.78 Females 6190 725 11.71 387 6.25 1112 17.96 5078 82.04
7 Bilaspur (NP) Persons 8980 1891 21.06 530 5.90 2421 26.96 6559 73.04 Males 4695 1744 37.15 409 8.71 2153 45.86 2542 54.14 Females 4285 147 3.43 121 2.82 268 6.25 4017 93.75
8 Dankaur (NP) Persons 13520 2894 21.41 1165 8.62 4059 30.02 9461 69.98 Males 7180 2628 36.60 920 12.81 3548 49.42 3632 50.58 Females 6340 266 4.20 245 3.86 511 8.06 5829 91.94
9 Greater Noida (CT) Persons 102054 31579 30.94 5802 5.69 37381 36.63 64673 63.37 Males 55540 24907 44.85 3334 6.00 28241 50.85 27299 49.15 Females 46514 6672 14.34 2468 5.31 9140 19.65 37374 80.35
10 Kherli Hafizpur (CT) Persons 7932 1822 22.97 791 9.97 2613 32.94 5319 67.06 Males 4204 1493 35.51 467 11.11 1960 46.62 2244 53.38 Females 3728 329 8.83 324 8.69 653 17.52 3075 82.48
11 Rabupura (NP) Persons 15454 3024 19.57 1072 6.94 4096 26.50 11358 73.50 Males 8217 2797 34.04 889 10.82 3686 44.86 4531 55.14 Females 7237 227 3.14 183 2.53 410 5.67 6827 94.33
12 Jahangirpur (NP) Persons 11006 2265 20.58 680 6.18 2945 26.76 8061 73.24 Males 5819 2078 35.71 530 9.11 2608 44.82 3211 55.18 Females 5187 187 3.61 150 2.89 337 6.50 4850 93.50
13 Jewar (NP) Persons 32269 6950 21.54 1638 5.08 8588 26.61 23681 73.39 Males 17188 6313 36.73 1255 7.30 7568 44.03 9620 55.97 Females 15081 637 4.22 383 2.54 1020 6.76 14061 93.24
District(Urban): Gautam Buddha Nagar Persons 974309 302182 31.02 50254 5.16 352436 36.17 621873 63.83 Males 530609 248105 46.76 32176 6.06 280281 52.82 250328 47.18 Females 443700 54077 12.19 18078 4.07 72155 16.26 371545 83.74

46
Table 32 shows number and percentage of main workers, marginal workers and non-workers by sex in urban agglomerations/towns in 2011 Census. In urban areas of the district the proportion of total workers is 36.17 per cent, which comprises of 31.02 per cent main worker and 5.16 per cent marginal workers. The sex wise breakup in urban area shows that 46.76 per cent male and 12.19 per cent females are in category of main workers, proportion of male and female marginal workers accounts to 6.06 percent and 4.07 percent respectively.
TABLE 33: DISTRIBUTION OF WORKERS BY SEX IN FOUR CATEGORIES OF ECONOMIC ACTIVITY IN TAHSILS, 2011
Serial number
Name of Tahsil Persons / Males / Females
Total Population
Total number of workers (Main +
Marginal)
Category of workers Cultivators Agricultural
Labourers Household
Industry workers
Other workers
1 2 3 4 5 6 7 8 9 1 Dadri Persons 1110093 392907 27760 18250 21594 325303
(35.39) (7.07) (4.64) (5.50) (82.79)
Males 601465 309699 22037 14028 14874 258760
(51.49) (7.12) (4.53) (4.80) (83.55)
Females 508628 83208 5723 4222 6720 66543
(16.36) (6.88) (5.07) (8.08) (79.97)
2 Gautam Buddha Nagar Persons 316790 103720 21926 13573 7896 60325
(32.74) (21.14) (13.09) (7.61) (58.16)
Males 169959 79478 17915 9403 3991 48169
(46.76) (22.54) (11.83) (5.02) (60.61)
Females 146831 24242 4011 4170 3905 12156
(16.51) (16.55) (17.20) (16.11) (50.14)
3 Jewar Persons 221232 72482 22982 17022 5910 26568
(32.76) (31.71) (23.48) (8.15) (36.65)
Males 118790 54207 18851 12067 2913 20376
(45.63) (34.78) (22.26) (5.37) (37.59)
Females 102442 18275 4131 4955 2997 6192
(17.84) (22.60) (27.11) (16.40) (33.88) District: Gautam Buddha Nagar Persons 1648115 569109 72668 48845 35400 412196
(34.53) (12.77) (8.58) (6.22) (72.43) Males 890214 443384 58803 35498 21778 327305
(49.81) (13.26) (8.01) (4.91) (73.82) Females 757901 125725 13865 13347 13622 84891
(16.59) (11.03) (10.62) (10.83) (67.52) Note: Percent of Worker to total worker are given in brackets
It can be seen from the Table 33, that the economy of the district is primarily agricultural
as supported by the fact that cultivators constitute 12.77 per cent of the total workers ( main + marginal) and remaining 8.58 per cent of total workers are engaged as agricultural labourers, 6.22 per cent, household industry workers and 72.43 other workers in this district. The distribution of workers by four categories of economic activity at tahsil level shows very high dependence of population on agriculture sector absorbing large number of workers. The

47
proportion of cultivators varies between 7.07 per cent in Dadri tahsil and 31.71 per cent in Jewar. These variations within the district may be due to cropping and land holding patterns. The percentage of females cultivators is 11.03 per cent which is lower as compared to 13.26 per cent of male cultivators in the district. The percentage of agricultural labourers and household industry workers is very low in the district as stated above.
TABLE 34 : DISTRIBUTION OF WORKERS BY SEX IN FOUR CATEGORIES OF ECONOMIC
ACTIVITY IN C.D. BLOCKS, 2011 Serial number
Name of C. D. block Persons / Males / Females
Total population
Total number of workers
(Main + Marginal)
Category of workers Cultivators Agricultural
Labourers Household Industry workers
Other workers
1 2 3 4 5 6 7 8 9 1 Bisrakh Persons 137747 42524 8026 4722 3439 26337 (30.87) (18.87) (11.10) (8.09) (61.93)
Males 73400 33264 6167 3285 2259 21553 (45.32) (18.54) (9.88) (6.79) (64.79) Females 64347 9260 1859 1437 1180 4784 (14.39) (20.08) (15.52) (12.74) (51.66)
2 Dadri Persons 194979 62027 14318 8039 3959 35711 (31.81) (23.08) (12.96) (6.38) (57.57)
Males 103362 47355 11621 6074 2503 27157 (45.81) (24.54) (12.83) (5.29) (57.35) Females 91617 14672 2697 1965 1456 8554 (16.01) (18.38) (13.39) (9.92) (58.30)
3 Dankaur Persons 184567 58121 20988 10412 3652 23069 (31.49) (36.11) (17.91) (6.28) (39.69)
Males 98561 43889 16839 6900 1939 18211 (44.53) (38.37) (15.72) (4.42) (41.49) Females 86006 14232 4149 3512 1713 4858 (16.55) (29.15) (24.68) (12.04) (34.13)
4 Jewar Persons 156513 54001 20363 13913 4518 15207 (34.50) (37.71) (25.76) (8.37) (28.16)
Males 84282 38595 16810 9569 1792 10424 (45.79) (43.55) (24.79) (4.64) (27.01) Females 72231 15406 3553 4344 2726 4783 (21.33) (23.06) (28.20) (17.69) (31.05)
Total Persons 673806 216673 63695 37086 15568 100324 (32.16) (29.40) (17.12) (7.19) (46.30) Males 359605 163103 51437 25828 8493 77345 (45.36) (31.54) (15.84) (5.21) (47.42) Females 314201 53570 12258 11258 7075 22979
(17.05) (22.88) (21.02) (13.21) (42.90) Note: Percent of Worker to total worker are given in brackets
Table 34 presents C.D. block-wise distribution of workers by sex in four categories of economic activity. In the rural areas of the district total workers (main+marginal) are 32.16 per cent of total population. Among these workers, cultivators constitute 29.40 per cent, 17.12 per cent agricultural labourers, 7.19 per cent household industry workers and 46.30 per cent other workers. The other works play a major role in providing employment to the working force of rural population. Household industries also could not make much progress in rural areas as reflected in the data and these household industries

48
employ only 7.19 per cent workers of the total working force. Therefore surplus working force has to depend on primary activities. Among cultivators, the percentage of males (31.54 per cent) is higher than females (22.88 per cent) in the rural areas of the district. The proportion of cultivators and other workers differ considerably from one C.D. block to other. The proportion of cultivators varies between 18.87 per cent in Bisrakh C.D. block to 37.71 per cent in Jewar C.D. block. Similarly for other workers, the lowest proportion is 28.16 per cent in Jewar C.D. block while 61.93 per cent is the highest in Bisrakh C.D. block. The percentage of female agricultural labourers and household industry workers is 21.02 and 13.21 per cent respectively in the district. The percentage of agricultural labourers is highest in Jewar (25.76 per cent) C.D. block and is followed by Dankaur (17.91). Similarly, a household industry worker varies in C.D. blocks between 6.28 per cent in Dankaur and 8.09 per cent in Bisrkh C.D. Block.
TABLE 35 : DISTRIBUTIONOF WORKERS BY SEX IN FOUR CATEGORIES OF ECONOMIC ACTIVITY OF URBAN AGGLOMERATIONS/TOWNS,2011
Serial number
Name and urban status of UA / Town
Persons / Males / Females
Total population
Total number of workers (Main
+ Marginal)
Category of workers Cultivators Agricultural
Labourers Household
Industry workers
Other workers
1 2 3 4 5 6 7 8 9 1 Dadri (NPP) Persons 91189 27051 453 694 1847 24057 (29.66) (1.67) (2.57) (6.83) (88.93)
Males 48856 23330 392 584 1360 20994 (47.75) (1.68) (2.50) (5.83) (89.99) Females 42333 3721 61 110 487 3063 (8.79) (1.64) (2.96) (13.09) (82.32)
2 Chipyana Buzurg (CT) Persons 17400 5662 158 192 617 4695 (32.54) (2.79) (3.39) (10.90) (82.92)
Males 9324 4669 136 166 162 4205 (50.08) (2.91) (3.56) (3.47) (90.06) Females 8076 993 22 26 455 490 (12.30) (2.22) (2.62) (45.82) (49.35)
3 Chhapraula (CT) Persons 15154 4813 58 235 463 4057 (31.76) (1.21) (4.88) (9.62) (84.29)
Males 8214 4063 50 199 399 3415 (49.46) (1.23) (4.90) (9.82) (84.05) Females 6940 750 8 36 64 642 (10.81) (1.07) (4.80) (8.53) (85.60)
4 Patadi (CT) Persons 8479 2688 17 55 47 2569 (31.70) (0.63) (2.05) (1.75) (95.57)
Males 4565 2251 15 49 38 2149 (49.31) (0.67) (2.18) (1.69) (95.47) Females 3914 437 2 6 9 420 (11.17) (0.46) (1.37) (2.06) (96.11)
5 Noida (CT) Persons 637272 245508 5157 5046 11107 224198 (38.52) (2.10) (2.06) (4.52) (91.32)
Males 349397 192705 4035 4056 8070 176544 (55.15) (2.09) (2.10) (4.19) (91.61) Females 287875 52803 1122 990 3037 47654 (18.34) (2.12) (1.87) (5.75) (90.25)
6 Salarpur Khadar (CT) Persons 13600 4611 148 144 176 4143 (33.90) (3.21) (3.12) (3.82) (89.85)
Males 7410 3499 122 124 137 3116 (47.22) (3.49) (3.54) (3.92) (89.05) Females 6190 1112 26 20 39 1027 (17.96) (2.34) (1.80) (3.51) (92.36)
7 Bilaspur (NP) Persons 8980 2421 139 270 85 1927 (26.96) (5.74) (11.15) (3.51) (79.60)
Males 4695 2153 126 248 81 1698 (45.86) (5.85) (11.52) (3.76) (78.87) Females 4285 268 13 22 4 229 (6.25) (4.85) (8.21) (1.49) (85.45)

49
TABLE 35 Cont….. Serial
number Name and urban status
of UA / Town Persons / Males / Females
Total population
Total number of workers (Main +
Marginal)
Category of workers Cultivators Agricultural
Labourers Household
Industry workers
Other workers
1 2 3 4 5 6 7 8 9 8 Dankaur (NP) Persons 13520 4059 69 282 274 3434 (30.02) (1.70) (6.95) (6.75) (84.60)
Males 7180 3548 59 241 220 3028 (49.42) (1.66) (6.79) (6.20) (85.34) Females 6340 511 10 41 54 406 (8.06) (1.96) (8.02) (10.57) (79.45)
9 Greater Noida (CT) Persons 102054 37381 1305 1804 3598 30674 (36.63) (3.49) (4.83) (9.63) (82.06)
Males 55540 28241 1124 1420 1584 24113 (50.85) (3.98) (5.03) (5.61) (85.38) Females 46514 9140 181 384 2014 6561 (19.65) (1.98) (4.20) (22.04) (71.78)
10 Kherli Hafizpur (CT) Persons 7932 2613 166 382 323 1742 (32.94) (6.35) (14.62) (12.36) (66.67)
Males 4204 1960 123 250 142 1445 (46.62) (6.28) (12.76) (7.24) (73.72) Females 3728 653 43 132 181 297 (17.52) (6.58) (20.21) (27.72) (45.48)
11 Rabupura (NP) Persons 15454 4096 431 995 331 2339 (26.50) (10.52) (24.29) (8.08) (57.10)
Males 8217 3686 407 835 297 2147 (44.86) (11.04) (22.65) (8.06) (58.25) Females 7237 410 24 160 34 192 (5.67) (5.85) (39.02) (8.29) (46.83)
12 Jahangirpur (NP) Persons 11006 2945 353 599 375 1618 (26.76) (11.99) (20.34) (12.73) (54.94)
Males 5819 2608 298 544 324 1442 (44.82) (11.43) (20.86) (12.42) (55.29) Females 5187 337 55 55 51 176 (6.50) (16.32) (16.32) (15.13) (52.23)
13 Jewar (NP) Persons 32269 8588 519 1061 589 6419 (26.61) (6.04) (12.35) (6.86) (74.74)
Males 17188 7568 479 954 471 5664 (44.03) (6.33) (12.61) (6.22) (74.84) Females 15081 1020 40 107 118 755 (6.76) (3.92) (10.49) (11.57) (74.02) District (Urban): Gautam Buddha Nagar
Persons 974309 352436 8973 11759 19832 311872 (36.17) (2.55) (3.34) (5.63) (88.49)
Males 530609 280281 7366 9670 13285 249960 (52.82) (2.63) (3.45) (4.74) (89.18) Females 443700 72155 1607 2089 6547 61912
(16.26) (2.23) (2.90) (9.07) (85.80) Table 35 presents distribution of workers by sex in four categories of economic activity in urban
areas of the district. It can be observed from the table that the four categories of economic activity are cultivators, agricultural labourers, household industry workers and other workers. Figures in the table has been given for total number of workers including main and marginal workers. At the district level, urban areas recorded highest percentage of other workers (88.49), followed by Household Industry with 5.63 per cent (4.74 per cent male and 9.07 per cent female). If we observe each town, the table reveals that highest percentage of cultivators (11.99) is recorded in Jahangirpur (N.P). In the agriculture labourers category Patadi (CT) recorded very low percentage (2.01 percentage).

50
(ix) Brief analysis of the Village Directory and Town Directory data based on inset tables 36 to 45
One of the major parts of the District Census Handbook is Village and Town Directories. These are non-census data incorporated showing educational, medical, drinking water, banking facilities, communication facilities and other such developmental indicators in the towns and villages. From this non-census data certain inset tables have been generated and reproduced below showing major trends in the availability of above amenities.
TABLE 36 : DISTRIBUTION OF VILLAGES ACCORDING TO AVAILABILITY OF DIFFERENT AMENITIES, 2011 Serial
number Name of C. D. block Number
of inhabited villages
Type of amenity available Type of amenity available Education Medical Improved
drinking water*
Post Office
#
Telephone Transport communications
$
Banks Agricultural Credit
Societies
Approach by pucca
road
Power supply
1 2 3 4 5 6 7 8 9 10 11 12 13
1 Bisrakh 52 41 31 49 21 52 25 9 5 39 47
(78.85) (59.62) (94.23) (40.38) (100) (48.08) (17.31) (9.62) (75) (90.38)
2 Dadri 71 67 52 69 17 71 28 6 3 69 69
(94.37) (73.24) (97.18) (23.94) (100) (39.44) (8.45) (4.23) (97.18) (97.18)
3 Dankaur 104 88 23 98 9 ( 104 47 2 2 78 97
(84.62) (22.12) (94.23) (8.65) (100) (45.19) (1.92) (1.92) (75) (93.27)
4 Jewar 77 73 27 77 14 77 27 5 6 49 76
(94.81) (35.06) (100) (18.18) (100) (35.06) (6.49) (7.79) (63.64) (98.7)
Total 304 269 133 293 61 304 127 22 16 235 289 (88.49) (43.75) (96.38) (20.07) (100) (41.78) (7.24) (5.26) (77.3) (95.07) Note : - Percentages are given in brackets.
* Based on the improved drinking water source, drinking water supply has been classified as `Improved ' or otherwise. If the household has access to drinking water supplied from a tap or a hand pump / tube well
situated within or outside the premises it is considered as having access to `Improved drinking water source'.
However, the concept of improved drinking water is state specific and this is to be considered accordingly. # Post office includes Post office, telegraph office and Post and telegraph office.
$ Transport communication includes bus service, rail facility and navigable waterways.
Table 36 deals with the C.D. block-wise distribution of villages according to the availability of different amenities like educational, medical, improved drinking water, post office, telephone, transport, communications, banks, agricultural credit societies, approach by pucca road and power supply within the village. Out of 304 inhabited villages in the district, 269 villages (88.49 per cent) have been provided with the educational facility of one type or the other. Similarly 133 villages in the district constituting 43.75 per cent have medical facility of one type or the other. Improved drinking water facility is available in 293 (96.38 per cent) villages. As regards, post office facility, which includes facilities like telegraph office and post and telegraph, 61 villages constituting 20.07 per cent of villages have been provided with this facility within the village. 304(100 per cent) villages have been provided with the telephone facility, 127 (41.78 per cent) with transport facility, 22 (7.24 per cent) villages with bank facility and 16 (5.27 per cent) with agricultural credit societies. There are 235 (77.3 per cent) villages which have been linked with the pucca road. Total 289 (95.07 per cent) of villages have been provided with the electricity supply. Almost similar pattern of distribution of villages by availability of amenities in the villages at CD block has been found with slight variation. Jewar CD block has the highest percentage (94.81 percent) of villages where educational facility is available and lowest (78.85 per cent) is found in Bisrakh. Medical facility is highest in Dadri (73.24) and lowest (22.12 per cent) in Dankaur CD block. Telephone facility is available to cent percent villages in all CD blocks. Similarlry remaining availability of different amenities in CD blocks also we can see in above table.

51
TABLE 37 : NUMBER AND PERCENT OF RURAL POPULATION SERVED BY DIFFERENT AMENITIES, 2011 Serial
number Name of C. D. block Total
population of
inhabited villages
Type of amenity available Type of amenity available Education Medical Improved
drinking water*
Post Office #
Telephone Transport communications
$
Banks Agricultural Credit
Societies
Approach by pucca
road
Power supply
1 2 3 4 5 6 7 8 9 10 11 12 13
1 Bisrakh 137747 135688 108508 137651 79608 137747 98066 32962 13944 132647 137623
(98.51) (78.77) (99.93) (57.79) (100) (71.19) (23.93) (10.12) (96.3) (99.91)
2 Dadri 194979 194790 165788 194973 90028 194979 107760 42290 12492 192534 194973
(99.9) (85.03) (100) (46.17) (100) (55.27) (21.69) (6.41) (98.75) (100)
3 Dankaur 184567 179306 61237 184418 35843 184567 97826 12271 12271 164576 184387
(97.15) (33.18) (99.92) (19.42) (100) (53) (6.65) (6.65) (89.17) (99.9)
4 Jewar 156513 154593 82535 156513 59770 156513 82355 18331 18999 118965 156469
(98.77) (52.73) (100) (38.19) (100) (52.62) (11.71) (12.14) (76.01) (99.97)
Total 673806 664377 418068 673555 265249 673806 386007 105854 57706 608722 673452 (98.6) (62.05) (99.96) (39.37) (100) (57.29) (15.71) (8.56) (90.34) (99.95) Note : - Percentages are given in brackets. * Based on the improved drinking water source, drinking water supply has been classified as `Improved ' or otherwise. If the household has access to drinking water supplied from a tap or a hand pump / tube well situated within or outside the premises it is considered as having access to `Improved drinking water source'. However, the concept of improved drinking water is state specific and this is to be considered accordingly. # Post office includes Post office, telegraph office and Post and telegraph office. $ Transport communication includes bus service, rail facility and navigable waterways.
Table 37 depicts the number and proportion of rural population served by different kinds of amenities.
Out of total rural population of 673,806 persons in the district, 664,377 (98.6 per cent) have educational
facility of one or the other type. Similarly 418,068 (62.05 per cent) population has medical facilities while
almost cent percent have got improved drinking water facility. Post office facilities are available to
265,249 (39.37 per cent) population. Telephone facility is available to 100 per cent polulation. Transport
communications facility is available to 386,007 (57.29 per cent) persons. Bank facility is available to
105,854 (15.71 per cent) whereas 57,706 (8.56 per cent) have been provided with the facility of
agricultural credit societies. 608,722 (90.34 per cent) have been provided with the facility of approach by
pucca road. Power supply is available to 673,452 (99.95 per cent) rural population in the district. Similar
pattern of availability of facilities is visible in rural population at C.D. block level.

N
E
W
B
O
R
A
K
I R
A
IL
W
A
Y
S
T
A
T
IO
N
D
F
C
C
&
IN
D
IA
N
R
A
IL
W
A
Y
T
R
A
C
K
S
I
S
B
T
+
L
B
T
COMMERCIAL &
HOTELS
LAM
DA
-II
GREEN
DFCC TRACKS
NEW BORAKI STATION
MRTS LINE
IRRIGATION CANAL
LEGEND
GREEN AREA
LAMDA COMMERCIAL AREA AS
PER GNIDA MASTER PLAN 2021
ZONE II
COMMERCIAL
&
RETAIL
ZO
N
E I
6
0
m
W
ID
E
R
O
A
D
6
0
m
W
ID
E
R
O
A
D
LAMDA-I
POND
10
5
m
W
ID
E
R
O
A
D
TEMPLE
KABRISTAN
ISBT + LBT
BUS PARKING
M
R
T
S
L
I
N
E
S
ENTRY TO
MRTS
Pa
rk
in
g
N

Proposed Road Connectivity to the Freight Village
Image Source: [For detailed design information and descriptions, see the Project Report for Multi Modal Logistics Hub (MMLH)/ Freight Village and Multi Modal
Transport Hub (MMTH) at Greater Noida in Uttar Pradesh under DMIC Project submitted on 12th February 2018 to Delhi Mumbai Industrial Corridor Development
Corporation Limited]
NOT TO SCALE