So you want to swim across the Atlantic? - GODAE
11
So you want to swim across the Atlantic? Graig Sutherland 1 , Christopher Subich 1 , Heidi Levasseur 2 , Greg Smith 1 , Fraser Davidson 3 and Corinne Bourgault-Brunelle 4 1 Environment and Climate Change Canada, Dorval, Canada, 2 Nage vers tes rêves inc., Trois-Rivières, Canada, 3 Department of Fisheries and Oceans, St. John’s, Canada, 4 Department of Fisheries and Oceans, Dorval, Canada May 6, 2019
-
Upload
khangminh22 -
Category
Documents
-
view
3 -
download
0
Transcript of So you want to swim across the Atlantic? - GODAE

So you want to swim across the Atlantic?
Graig Sutherland1, ChristopherSubich1, Heidi Levasseur2, GregSmith1, Fraser Davidson3 andCorinne Bourgault-Brunelle4
1Environment and Climate Change Canada,Dorval, Canada, 2Nage vers tes rêves inc.,Trois-Rivières, Canada, 3Department of Fisheriesand Oceans, St. John’s, Canada, 4Department ofFisheries and Oceans, Dorval, Canada
May 6, 2019
Introduction
Heidi Levasseur plans to swim from Dakar, Senegal toRecife, Brazil starting in January 2020Shortest distance is 3374 kmAssume swim speed of 2 knots (100 cm/s), 8 hours a day, 6days a weekTest for sensitivity to interannual variability in currentsAssess route sensitivity to a slower swimming speed (80cm/s)With no currents, it would take 137 days swimming 100 cm/sor 171 days swimming at 80 cm/sCan we use available data to optimize swimming route andpossibly decrease swimming time?
Method
Use globcurrent database of Ekman + geostrophic velocitiesat surface (www.globcurrent.org)Currents available on a 0.25◦ global gridHave data from 2002 to end of 2013Calculate daily means from 3 hour resolution currentsRoute finding using Dijkstra’s algorithmGraph for method is the same 0.25◦ grid as currents

Dijkstra’s algorithm
Use Dijkstra’s algorithm to find the shortest durationbetween Dakar, Senegal and Recife, BrazilUse 1/4 degree grid and daily mean currentsTime is scaled to simulate 8 hours swimming per day, 6days a week
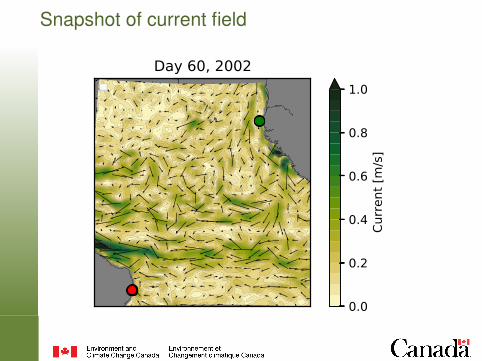
Snapshot of current field
Day 60, 2002
0.0
0.2
0.4
0.6
0.8
1.0
Curre
nt [m
/s]

Mean current on 1 day over all years
Day 60, mean
0.0
0.2
0.4
0.6
0.8
1.0
Curre
nt [m
/s]

Variability of current on 1 day over all years
Day 60, std
0.0
0.1
0.2
0.3
0.4
0.5
Curre
nt [m
/s]
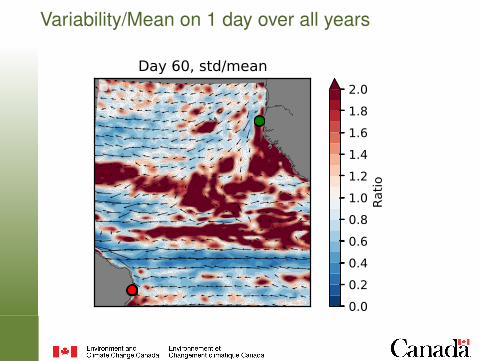
Variability/Mean on 1 day over all years
Day 60, std/mean
0.00.20.40.60.81.01.21.41.61.82.0
Ratio
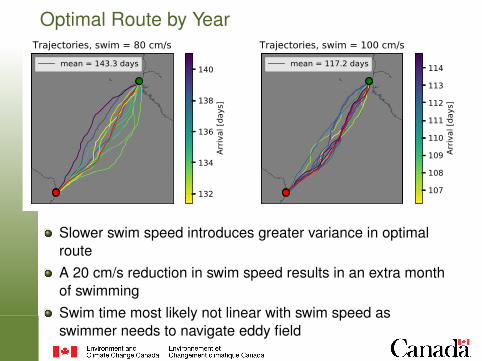
Optimal Route by YearTrajectories, swim = 80 cm/s
mean = 143.3 days
132
134
136
138
140
Arriv
al [d
ays]
Trajectories, swim = 100 cm/smean = 117.2 days
107
108
109
110
111
112
113
114
Arriv
al [d
ays]
Slower swim speed introduces greater variance in optimalrouteA 20 cm/s reduction in swim speed results in an extra monthof swimmingSwim time most likely not linear with swim speed asswimmer needs to navigate eddy field
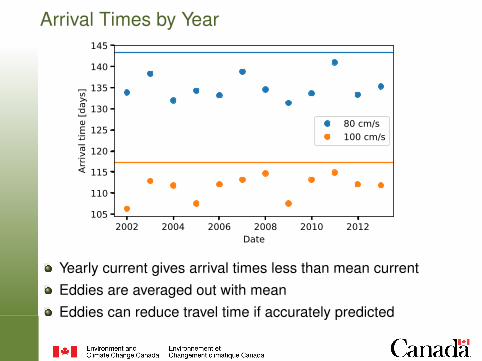
Arrival Times by Year
2002 2004 2006 2008 2010 2012Date
105
110
115
120
125
130
135
140
145
Arriv
al ti
me
[day
s]
80 cm/s100 cm/s
Yearly current gives arrival times less than mean currentEddies are averaged out with meanEddies can reduce travel time if accurately predicted

Summary
Route is sensitive to swimming speed and eddy fieldEddies act to reduce swimming timeLarger variability in optimal routes for slower swim speedCould possibly include wave effects:
Swim speed varies with sea stateStokes drift
Could try and include diurnal variability (diurnal jet)?Wind effects?Add tides