Snapshot of Global PV Markets - 2020 - IEA-PVPS
23
fc Snapshot of Global PV Markets 2022 Report IEA-PVPS T1-42: 2022 Task 1 Strategic PV Analysis and Outreach PVPS
-
Upload
khangminh22 -
Category
Documents
-
view
1 -
download
0
Transcript of Snapshot of Global PV Markets - 2020 - IEA-PVPS

fc
Snapshot of Global PV Markets 2022
Report IEA-PVPS T1-42: 2022
Task 1 Strategic PV Analysis and Outreach
PV
PS

Task 1 Strategic PV Analysis and Outreach – 2020 Snapshot of Global PV Markets
What is IEA PVPS TCP?
The International Energy Agency (IEA), founded in 1974, is an autonomous body within the framework of the Organization
for Economic Cooperation and Development (OECD). The Technology Collaboration Programme (TCP) was created with
a belief that the future of energy security and sustainability starts with global collaboration. The programme is made up of
6000 experts across government, academia, and industry dedicated to advancing common research and the application
of specific energy technologies.
The IEA Photovoltaic Power Systems Programme (IEA PVPS) is one of the TCPs within the IEA and was established in
1993. The mission of the programme is to “enhance the international collaborative efforts which facilitate the role of photovoltaic solar energy as a cornerstone in the transition to sustainable energy systems.” In order to achieve this, the Programme’s participants have undertaken a variety of joint research projects in PV power systems applications. The overall programme is headed by an Executive Committee, comprised of one delegate from each country or organisation
member, which designates distinct ‘Tasks,’ that may be research projects or activity areas.
The IEA PVPS participating countries are Australia, Austria, Belgium, Canada, Chile, China, Denmark, Finland, France,
Germany, Israel, Italy, Japan, Korea, Malaysia, Mexico, Morocco, the Netherlands, Norway, Portugal, South Africa, Spain,
Sweden, Switzerland, Thailand, Turkey, and the United States of America. The European Commission, Solar Power
Europe, the Smart Electric Power Alliance (SEPA), the Solar Energy Industries Association and the Copper Alliance are
sponsor members.
Visit us at: www.iea-pvps.org
What is IEA PVPS Task 1?
The objective of Task 1 of the IEA Photovoltaic Power Systems Programme is promoting and facilitating the exchange
and dissemination of information on the technical, economic, environmental and social aspects of PV power systems.
Task 1 activities support the broader PVPS objectives: to contribute to cost reduction of PV power applications, to increase
awareness of the potential and value of PV power systems, to foster the removal of both technical and non-technical
barriers and to enhance technology co-operation.
Authors
➢ Data: IEA PVPS Reporting Countries, Becquerel Institute (BE). For the non-IEA PVPS countries: Izumi Kaizuka (RTS
Corporation), Arnulf Jäger-Waldau (EU-JRC), Jose Donoso (UNEF).
➢ Analysis: Gaëtan Masson, Elina Bosch (Becquerel Institute).
➢ Editor: Gaëtan Masson, IEA PVPS Task 1 Operating Agent.
➢ Design: IEA PVPS
DISCLAIMER
The IEA PVPS TCP is organised under the auspices of the International Energy Agency (IEA) but is functionally and legally autonomous.
Views, findings and publications of the IEA PVPS TCP do not necessarily represent the views or policies of the IEA Secretariat or its
individual member countries Data for non-IEA PVPS countries are provided by official contacts or experts in the relevant countries. Data
are valid at the date of publication and should be considered as estimates in several countries due to the publication date.
COVER PICTURE
Expo 2020 Dubai, Solar Flowers.
ISBN 978-3-907281-31-4: 2022 Snapshot of Global PV Markets
INTERNATIONAL ENERGY AGENCY
PHOTOVOLTAIC POWER SYSTEMS PROGRAMME
IEA PVPS Task 1
Strategic PV Analysis and Outreach
Report IEA-PVPS T1-42:2022 April 2022
ISBN 978-3-907281-31-4

Task 1 Strategic PV Analysis and Outreach – 2021 Snapshot of Global PV Markets
5
TABLE OF CONTENTS
Table of Contents .............................................................................................................. 5
Executive summary ........................................................................................................... 6
1 Snapshot of the Global PV Market in 2021 ............................................................ 9
2 The Top 10 Markets in 2021 .................................................................................. 11
3 AC or DC Numbers ................................................................................................ 13
4 market Segmentation ............................................................................................. 14
5 Cumulative Installed Capacity in the World ............................................................ 15
6 Electricity Production from PV ............................................................................... 18
7 Policy & Markets Trends ........................................................................................ 19
7.1 Competitive Tenders & Merchant PV ......................................................... 19
7.2 Prosumers Policies..................................................................................... 19
7.3 Local manufacturing policies ...................................................................... 20
8 PV in the Broader Energy Transition ...................................................................... 21
8.1 PV and Other Renewable Energy Evolutions ............................................. 21
8.2 Impact of PV Development on CO2 Emissions ........................................... 22
8.3 PV Fostering Development of a Cleaner Energy System............................ 22

Task 1 Strategic PV Analysis and Outreach – 2021 Snapshot of Global PV Markets
6
EXECUTIVE SUMMARY
Despite a second year of COVID-19 pandemic, preliminary reported market data shows that the global PV market again grew significantly in 2021. At least 175 GW of PV systems have been installed and commissioned in the world last year which means that the total cumulative installed capacity for PV at the end of 2021 reached at least 942 GW. While these data will have to be confirmed in the coming months, some important trends can already be extracted:
• The Chinese PV market grew again in 2021, despite shortages observed in the value chain during the year and was the largest market in terms of annual installed capacity. In 2021, 54,9 GW of PV were installed, compared to 48,2 GW in 2020 and 30,1 GW in 2019. China remains the leader in terms of cumulative capacity with 308,5 GW installed, almost one third of the global PV installed capacity.
• In addition to China, the rest of the global PV market grew significantly from 97 GW in 2020, to at least 120 GW in 2021, a 24% increase year on year.
o The US market saw its market increasing to 26,9 GW which allowed it to overtake the European Union that was ranked second last year. Utility-scale installations accounted for about 75% of the new additions.
o The European Union lost its position as the second global PV market and ranked third in 2021 by installing close to 26,8 GW. Outside of the EU, the rest of Europe added around 3 GW. The largest European market in 2021 was again Germany (5,3 GW), followed by Spain (4,9 GW), France (3,4 GW) the Netherlands (3,3 GW), Poland (3,3 GW), Greece (1,2 GW), Italy (944 MW) and Belgium (850 MW).
o India and Japan rank third and fourth with respectively an estimated 13 GW and 6,5 GW annual installed capacity.
o Some growing key markets contributed significantly to new additions in 2021, Brazil (5,5 GW, fifth), Australia (4,6 GW, eighth), Korea (4,2 GW, ninth), Mexico (1,8 GW). Preliminary numbers show that Taiwan, Pakistan each have installed close to 2 GW.
o Among the top 10 countries, there are now five Asia-Pacific countries (Australia, China, India, Japan, Korea), three European countries (Germany, Spain and France) and two countries in the Americas (Brazil and the USA).
• The level to enter the top 10 global markets in 2021 was around 3,0 GW; a stable level compared to 2020 and twice the level needed in 2019.
• The top 10 countries represented around 74% of the global annual PV market, a slight decrease compared to 2020.

Task 1 Strategic PV Analysis and Outreach – 2021 Snapshot of Global PV Markets
7
• Australia, Spain, Greece, Honduras, the Netherlands, Chile and Germany now have enough PV capacity to theoretically1 produce more than 10% of their annual electricity demand with PV. PV covers around 5% of the global electricity demand.
The contribution of PV to decarbonizing the energy mix is progressing, with PV saving as much as 1 100 million tons of CO2eq. However, much remains to be done to fully decarbonize and PV deployment should increase by at least one order of magnitude to cope with the targets defined during the COP21 in Paris, France.
1 Based on end-of year PV installed capacity’s theoretical production

Task 1 Strategic PV Analysis and Outreach – 2021 Snapshot of Global PV Markets
8

Task 1 Strategic PV Analysis and Outreach – 2021 Snapshot of Global PV Markets
9
1 SNAPSHOT OF THE GLOBAL PV MARKET IN 2021
IEA PVPS has distinguished itself throughout the years by producing unbiased reports on the development of PV all over the world, based on information from official government bodies and reliable industry sources. This 10th edition of the “Snapshot of Global PV Markets” aims at providing preliminary information on how the PV market developed in 2021. The 27th edition of the PVPS complete “Trends in Photovoltaic Applications” report will be published in Q4 2022.
At least 175 GWdc of PV systems have been commissioned in the world last year of which the IEA PVPS countries represented 132 GWdc.
The IEA PVPS countries represented 767 GW of cumulative PV at the end of 2021, which is at least 81% of the global PV capacity.
Next to the members of the IEA PVPS programme, the other major markets in the world represent at least 175 GW cumulative installed capacity at the end of 2021.
At present, it appears that around 922 GW represents the minimum installed by the end of 2021, with a firm level of certainty in the IEA PVPS countries and the other major markets. Remaining markets account for an estimated additional 20 GW that could bring the total cumulative installed capacity to around 942 GWdc. The installations in third countries without a robust reporting system are growing significantly, leading to increased uncertainties on the total installed capacity.
In 2021, at least 20 countries installed more than 1 GW. Fifteen countries now have more than 10 GW of total cumulative capacity, five have more than 40 GW. China alone represented 308,5 GW followed by the European Union (as EU27), which used to lead the rankings for years, but ranks second since 2015 (178,7 GW), the USA ranks third (123 GW) and Japan fourth (78,2 GW). IEA-PVPS numbers comprise the entire EU, not only the PVPS-member states which are part of the programme directly.
Source: IEA PVPS
0 0 0 0 1 1 1 26 8
17
31 3038 40
50
77
103 104111
145
175
0
20
40
60
80
100
120
140
160
180
200
2000 2001 2002 2003 2004 2005 2006 2007 2008 2009 2010 2011 2012 2013 2014 2015 2016 2017 2018 2019 2020 2021
GWp FIGURE 1: EVOLUTION OF ANNUAL PV INSTALLATIONS
Non IEA PVPS Countries IEA PVPS Countries Japan USA European Union China

Task 1 Strategic PV Analysis and Outreach – 2021 Snapshot of Global PV Markets
10
Evolution of regional PV markets The majority of the growth of the PV market in 2021 came from China, the US, Europe, India and emerging countries. Other markets saw some additions, too. Figure 2 below illustrates the changing dynamics of the global PV market, and the huge influence of the Chinese PV market. However, the positive dynamics of the other countries show a constant progress in the last years, despite some localized negative effects, which have been limited in 2021 compared to 2020.
Source: IEA PVPS
Impact of international trade disruptions
Identifying the impact of the pandemic on the PV market in 2021 is a difficult exercise. While the market continued its development, one might consider that it could have grown even more without the impact on international trade and in some cases on local PV manufacturing. However, the impacts seen in China in 2021 were not directly correlated to the pandemic itself and reflect more the growing part of PV in the economy, especially regarding raw material consumption.
In 2021, polysilicon and glass, but also aluminium, saw prices surges, which impacted the end-user price of PV modules. This led to contract cancellations and price increases for developers, and with a possible slowed down market development in many locations as a result. The additional shipping costs incurred in 2021 due to the pandemic also contributed to PV components price increases and possibly terminate some very competitive business models.
At the same time, the increases in costs of energy, and specifically electricity prices, have enhanced the PV competitiveness in numerous countries. It is difficult to distinguish if this acceleration effect is stronger or weaker than the braking effect of higher PV hardware prices.
Overall, we can consider that the COVID-19 pandemic did not significantly impact market development in 2021. The national market regressions or stagnations discussed above can be linked to regulatory burdens. But in a nutshell, most key markets progressed.
The resiliency of the PV market despite the major economic and logistic disruptions is remarkable and shows the potential of the technology to limit the economic downturn and social damage brought by the COVID-19 pandemic. This shows that national green recovery plans and better regulations could propel the PV industry far beyond the current installation trends (which is needed to achieve the Paris Climate Agreement).

Task 1 Strategic PV Analysis and Outreach – 2021 Snapshot of Global PV Markets
11
2 THE TOP 10 MARKETS IN 2021
The Chinese market grew again with 54,9 GW installed in 2021. This represented 31% of the global market. Behind China, the USA ranked second with around 26,9 GW of annual installations in 2021. The European Union followed with an increased market of 26,8 GW, followed by India where an estimated 13 GW were installed. Japan closes the top five with an estimated 6,5 GW.
Behind these countries, some changes were quite visible: Brazil installed 5,5 GW, sementing its title as the most dynamic market in Latin America. Korea (stable) and Australia (growing) respectively installed 4,2 GW and 4,6 GW. Looking a bit more in depth at European Union countries, Germany experienced another growth year, with about 5,3 GW of additional capacities installed, Spain installed 4,9 GW, setting a new annual solar PV installed capacity record while France saw its market more than triple with 3,4 GW installed. Notable growth was also observed in Portugal (572 MW compared to 151 MW in 2020), in Austria (720 MW compared to 340 MW in 2020) and to a lesser extent in Italy (944 MW compared to 785 MW 2020). The Netherlands continued to massively install PV, with 3,3 GW after 3 GW in the previous year and Poland continues its GW-scale expansion. Greece restarted PV installations after years of pause and in general, the European market benefited from a, overall growth.
As in 2020, top 10 markets for PV in 2021 have installed at least 3 GW of PV systems, compared to 1,5 GW in 2018. Several countries which in previous years installed significant capacities have left the top 10 for annual installed capacities, such as Vietnam. These countries still experienced significant market developments, however, not enough to stay in the top 10. The top 10 of total cumulative installed capacities shows more inertia due to past levels of installations: Italy and the UK have left the top countries in terms of annual installations several years back. If Italy’s past developments still allow it to stay in the top 10 for cumulative installed capacity, the UK exited the top 10 for cumulative installed capacity this year and was replaced by Spain.
As mentioned in the next section, capacities for a few countries that report PV installations in AC power, have been converted into DC power to ease comparison. This can lead to discrepancies with official PV data in several countries such as Japan or India.
Source: IEA PVPS
* The European Union grouped 27 European countries in 2021, out of which Germany, Spain, France, the Netherlands and Italy also appear in the Top 10, either for the installed capacity

Task 1 Strategic PV Analysis and Outreach – 2021 Snapshot of Global PV Markets
12
or the annual installations. The EU is a member of IEA-PVPS through its Joint Research Centre (EU-JRC).

Task 1 Strategic PV Analysis and Outreach – 2021 Snapshot of Global PV Markets
13
3 AC OR DC NUMBERS
IEA PVPS counts all PV installations, both grid-connected and off-grid, when numbers are reported. By convention, the numbers reported refer to the nominal power of PV systems installed. These are expressed in W (or Wp). Some countries are reporting the power output of the PV inverter (the device converting DC power from the PV system into AC electricity compatible with standard electricity networks) or the grid connection power level. The difference between the standard DC power (in Wp) and the AC power can range from as little as 5% (conversion losses, inverter set at the DC level) to as much as 60%. For instance, some grid regulations limit output to as low as 70% of the peak power from the residential PV systems installed in the last years. Most utility-scale plants built in 2021 have an AC-DC ratio between 1,1 and 1,6. For some countries, numbers indicated in this report have been transformed to DC numbers to maintain the coherency of the overall report.
In general, IEA PVPS recommends registering PV systems with both the DC power and the AC value. DC power gives a precise idea of the installed capacity, regardless of the grid connection (if any) and allows a reliable calculation of the energy production. On the other hand, AC power allows grid operators to better understand the maximum power output of the PV fleet. However, the AC value must be defined precisely since the AC output of many inverters can exceed the nominal value during small periods of time. On the other side, AC limits on the grid connection side do not always reflect the nominal capacity of PV plants. More information about recommendations to properly register PV plants can be found in the following report:
IEA PVPS Report:
Data Model and Data Acquisition for PV Registration Schemes and Grid Connection – Best Practice and Recommendations
Download the report:
https://iea-pvps.org/
or scan the QR code

Task 1 Strategic PV Analysis and Outreach – 2021 Snapshot of Global PV Markets
14
4 MARKET SEGMENTATION
Preliminary data show that the utility-scale PV market increased in absolute numbers compared to 2020. This trend was observed in many countries, due to the easiness to develop utility-scale PV compared to the difficulties or setting-up sound regulations for distributed PV under self-consumption and even more in energy communities. The rooftop market grew in 2021 in absolute terms, due growth in China, Australia, Germany, and the United States. Important growth of the distributed market was also observed in Spain (+100% compared to 2020). However, the relative shares of rooftop PV and utility-scale PV remained similar in 2021 compared to previous year.
Source: IEA PVPS, Becquerel Institute
The market has also started to diversify in terms of type of applications, with floating PV adding to utility-scale and BIPV starting to complement BAPV in the built environment. Other emerging segments such as agricultural PV are hardly visible yet but are attracting a growing interest and progressing fast. From a technology point of view, some evolutions have been notable, such as the start of bifacial PV development. PV integrated in vehicles, or VIPV/VAPV, is showing the potential for further diversification of PV components, but its current market level remains too low to be considered in this publication.
0
20
40
60
80
100
120
140
160
180
200
2011 2012 2013 2014 2015 2016 2017 2018 2019 2020 2021
GWp FIGURE 3: SEGMENTATION OF PV INSTALLATION 2011 - 2021
ROOFTOP UTILITY SCALE

Task 1 Strategic PV Analysis and Outreach – 2021 Snapshot of Global PV Markets
15
5 CUMULATIVE INSTALLED CAPACITY IN THE WORLD
As illustrated in Figure 4, the total cumulative installed capacity at the end of 2021 globally amounted to at least 942 GW.
China continues to lead with a cumulative capacity of 308,5 GW, followed by the European Union (178,7 GW), the USA (122,9 GW), Japan (78,2 GW) and India (60,4 GW). In 2021, Australia reached 25,4 GW cumulative installations and Korea 21,5 GW.
In the European Union, Germany leads with 59,2 GW, followed by Italy (22,6 GW), Spain (18,5 GW), France (14,3 GW) and the Netherlands (13,2 GW).
Source: IEA PVPS
Decommissioning, Repowering and Recycling
So far, numbers published by IEA PVPS consider the annual installations and total installed capacities based on official data in reporting countries. Several countries already incorporate decommissioning of PV plants in their total capacity numbers by reducing the total cumulative number. However, it is believed that many countries do not track decommissioning properly, and even more problematic, repowering.
It is assumed that real decommissioning is relatively unusual given the age of the oldest installations, since the real market started around 2005. Replacement of components, and in particular, PV modules and inverters are part of the usual maintenance and operation business, but in general it does not impact the total capacity. Recycling numbers can provide a glimpse of what is happening in this field. However, recycling schemes are not yet common, and the availability of data must be improved.
In the coming years, IEA PVPS will follow the dynamic evolution of decommissioning, repowering and recycling closely, with the expected impact on the installed capacity, market projections for repowering and the decline in PV performances due to ageing PV systems.
4 6 8 14 22 3970
100137
177
228
304
407
511
622
767
942
0
100
200
300
400
500
600
700
800
900
1.000
2005 2006 2007 2008 2009 2010 2011 2012 2013 2014 2015 2016 2017 2018 2019 2020 2021
GWp FIGURE 4: GLOBAL EVOLUTION OF CUMULATIVE PV INSTALLATIONS
Non IEA PVPS Countries IEA PVPS Countries

Task 1 Strategic PV Analysis and Outreach – 2021 Snapshot of Global PV Markets
16
Evolution of Regional PV Installations While Europe played a key pioneering role in the early developments of PV, Asia’s share started to grow rapidly in 2012 and it has not stopped since then (see Figure 5). Driven by China, India, Japan, Korea and more recently Vietnam, Asia represented around 57% of the total cumulative installed capacity in 2021 - a similar share compared to previous year. In the other continents and regions, PV installations were distributed similarly to previous year. Europe represented 21% of the global cumulative PV market (out of which the European Union accounted for 92%) despite the renewed and significant growth for the fourth year in a row. The Americas represented 16%, thanks to the USA and some Latin American countries such as Brazil, while the remaining 6% came from the MEA region and the rest of the world (unidentified installations).
Source: IEA PVPS
Asia continues to dominate the global PV market, with China as a global leader. Some already established major Asian markets, such as China, India Japan, Korea, Taiwan or Malaysia, experienced a growth in 2021. The development in other markets, such as Thailand, Singapore, Indonesia and the Philippines has been slow or intermittent over the years. Vietnam now ranks amongst the top markets for the third year in a row, but it is unsure whether such an installation level will be sustained, as the significant decline in 2021 illustrates. Asian markets represented around 52% of the annual global PV market in 2021, a slight decrease compared to the level in 2020, but in line with previous years.
In the Americas, the market increased, mainly through the US market which experienced accelerated growth (26,9 GW) in 2021. Brazil is the second market with around 5,5 GW installed in 2021, followed by Mexico which installed around 1,8 GW, Chile with 1,3 GW and Argentina installed around 200 MW, a level comparable to 2020. The market in Canada grew
0
100
200
300
400
500
600
700
800
900
1.000
2001 2002 2003 2004 2005 2006 2007 2008 2009 2010 2011 2012 2013 2014 2015 2016 2017 2018 2019 2020 2021
GWp FIGURE 5: EVOLUTION OF REGIONAL PV INSTALLATIONS
Europe Asia Pacific Africa & Middle East RoW The Americas

Task 1 Strategic PV Analysis and Outreach – 2021 Snapshot of Global PV Markets
17
at around 400 MW installed capacity in 2021. The Americas represented around 21% of the annual global PV market in 2021.
In the European Union, Germany took the lead with 5,3 GW, a significant increase for the fourth year in a row. Spain took the second place with 4,9 GW, an important growth compared to 2020. France took the third place thanks to 3,4 GW installed which represented around a threefold increase compared to previous year. The Netherlands ranked fourth with 3,3 GW installed, a comparable level to 2020. They are followed Poland with 3,3 GW and Greece (1200 MW). A few countries were just below the GW mark such as Italy (944 MW), Belgium (850 MW) and Hungary (800 MW). The ranking continued with Austria (720 MW), Portugal (572 MW), Sweden (500 MW), Denmark (312 MW) and Czech Republic (68 MW).
Outside of the EU, Norway installed 45 MW in 2021. Other countries in Europe, experienced interesting developments in 2021: one can cite Switzerland (616 MW). It is also worth mentioning Ukraine which saw significant amounts of PV installed in the last years. Europe represented slightly more than 17% of the annual global PV market in 2021.
In the Middle East and Africa, Israel installed an additional 935 MW, a significant increase compared to the previous year. In the United Arab Emirates, very few projects came online despite the tenders in the previous years but prospects for growth are positive. Turkey installed again around 1 GW - a stable market level compared to 2020.
Africa and the Middle East represented around 3% of global PV installations in 2021 with off-grid installations growing rapidly and rooftop PV outside of any regulatory scheme are progressing in many countries rapidly.
Task 1 Strategic PV Analysis and Outreach – 2021 Snapshot of Global PV Markets
18
6 ELECTRICITY PRODUCTION FROM PV
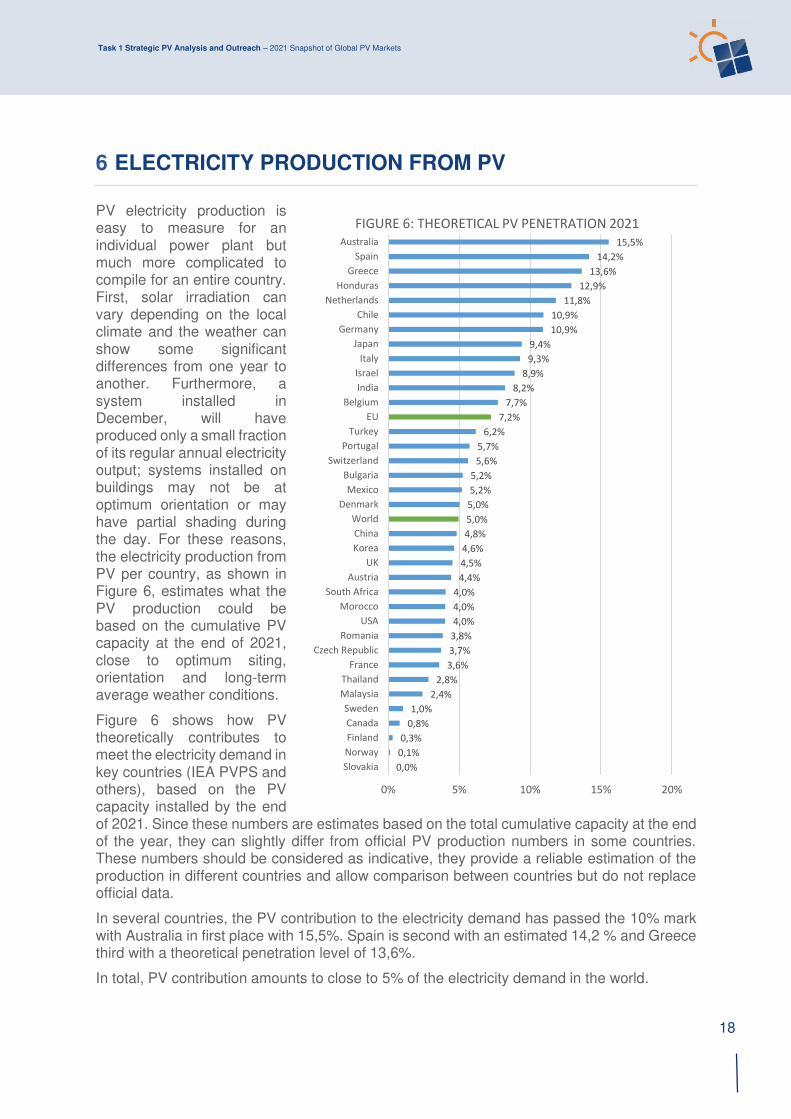
PV electricity production is easy to measure for an individual power plant but much more complicated to compile for an entire country. First, solar irradiation can vary depending on the local climate and the weather can show some significant differences from one year to another. Furthermore, a system installed in December, will have produced only a small fraction of its regular annual electricity output; systems installed on buildings may not be at optimum orientation or may have partial shading during the day. For these reasons, the electricity production from PV per country, as shown in Figure 6, estimates what the PV production could be based on the cumulative PV capacity at the end of 2021, close to optimum siting, orientation and long-term average weather conditions.
Figure 6 shows how PV theoretically contributes to meet the electricity demand in key countries (IEA PVPS and others), based on the PV capacity installed by the end of 2021. Since these numbers are estimates based on the total cumulative capacity at the end of the year, they can slightly differ from official PV production numbers in some countries. These numbers should be considered as indicative, they provide a reliable estimation of the production in different countries and allow comparison between countries but do not replace official data. In several countries, the PV contribution to the electricity demand has passed the 10% mark with Australia in first place with 15,5%. Spain is second with an estimated 14,2 % and Greece third with a theoretical penetration level of 13,6%.
In total, PV contribution amounts to close to 5% of the electricity demand in the world.
0,0%
0,1%
0,3%
0,8%
1,0%
2,4%
2,8%
3,6%
3,7%
3,8%
4,0%
4,0%
4,0%
4,4%
4,5%
4,6%
4,8%
5,0%
5,0%
5,2%
5,2%
5,6%
5,7%
6,2%
7,2%
7,7%
8,2%
8,9%
9,3%
9,4%
10,9%
10,9%
11,8%
12,9%
13,6%
14,2%
15,5%
0% 5% 10% 15% 20%
Slovakia
Norway
Finland
Canada
Sweden
Malaysia
Thailand
France
Czech Republic
Romania
USA
Morocco
South Africa
Austria
UK
Korea
China
World
Denmark
Mexico
Bulgaria
Switzerland
Portugal
Turkey
EU
Belgium
India
Israel
Italy
Japan
Germany
Chile
Netherlands
Honduras
Greece
Spain
Australia
FIGURE 6: THEORETICAL PV PENETRATION 2021

Task 1 Strategic PV Analysis and Outreach – 2021 Snapshot of Global PV Markets
19
7 POLICY & MARKETS TRENDS
7.1 Competitive Tenders & Merchant PV
Tenders have driven PV development in the last years and continued to be granted in several places in the world with extremely competitive prices, well below 20 USD/MWh in the sunniest places. Winning bids down to almost 10 USD/MWh have been reported in the Middle East, while some tenders with prices below 14 USD/MWh have been recorded in Europe (but these can be questioned). The decreasing price trend halted in 2021 due to module prices hikes, and most believe that prices will hardly continue to go down in the coming years, at least until the raw material crisis can be solved.
In some countries, cost-based tenders evolve towards multiple-factors tenders. Environmental or industrial constraints are introduced to give an advantage to local companies or to favour a better environmental footprint of the products.
Merchant PV, with PV electricity sold on electricity markets or through PPAs has been seen in an increasing number of countries in 2021 (e.g. 100% of the ground-mounted installed capacity in 2021 in Spain (3,5 GW) was developed through PPAs), with perspectives for further development in the coming years, especially if higher market prices for electricity remain, which would change completely the competitiveness question. Therefore, in addition to tenders, utility-scale PV starts to develop outside of the framed tenders and similar policies, thereby bringing cheap electricity to the world.
7.2 Prosumers Policies
The idea that PV producers could be considered as “prosumers” – both producers and consumers of energy – is evolving rapidly and policies are being adapted accordingly in several countries.
The first set of policies used to develop the market of small-scale PV installations on buildings were called “net-metering” policies and were adopted in a large number of countries, however, with different definitions. The genuine “net-metering” which offers credits for PV electricity injected into the grid, have previously supported market development in Belgium, Canada, Denmark, the Netherlands, Portugal, Korea and the USA, but such policies are increasingly replaced by self-consumption policies favouring real-time consumption of PV electricity, often completed with a feed-in tariff (or feed-in premium added on top of the spot price) for the excess PV electricity fed into the grid. This is for example the case in Spain. As a result, self-consumption is becoming a major driver of distributed PV installations.
The use of self-consumption in collective buildings is not yet widespread but exists in the Netherlands, Spain, Austria, Sweden, France, Switzerland, Germany or Italy to mention a few.
Decentralized or distributed self-consumption is starting to develop with the idea to disconnect production and consumption of PV electricity. This would allow one or several PV producers (even utility-scale plants) to feed one or more consumers at a reasonable distance so that the use of the public grid is minimized. Such disconnection between production and consumption would help to alleviate the constraint of the local self-consumption ratio and allow for a better use of available space on roofs or land. France, the Netherlands and Australia allow it under different forms, mostly for small-scale installations.

Task 1 Strategic PV Analysis and Outreach – 2021 Snapshot of Global PV Markets
20
In many countries, such policies encounter a fierce resistance from many distribution system operators who fear for their future financing. With a growing share of distributed generation and self-consumption, the question of grid finance is a key issue to address, together with other new uses of distribution grids to charge EV or for heating through heat-pumps.
In the Clean energy for all Europeans package, the European Union introduced the concept of Renewable Energy Communities (REC) and of Citizen Energy Communities (CEC). REC should allow citizens to sell renewable energy production to their neighbours, while some crucial components are the definition of the perimeter and the tariffication for grid use. Those key components are defined in the national implementation in the member states. This concept of energy communities is likely to expand existing PV market segments and to allow cost reductions for consumers not able to invest in a solar installation themselves.
7.3 Local manufacturing policies
2021 has seen numerous initiatives favouring local manufacturing at various steps of the PV value chain. The increasing importance of PV in the energy sector, and its expected growth are pushing numerous governments to support local manufacturing through policies, subsidies and regulations.
While trade conflicts have diminished in intensity in the last years, the willingness to support local production has increased with initiatives in Europe, the USA, India, Morocco or Saudi Arabia. This reflects the growing perception of the importance that PV could take in the coming years and the willingness to secure strategic production in some countries.
This trend is increasing globally, often without a clear understanding of the industry dynamics and the complexities of PV manufacturing, which will lead to less real projects than what some governments would like to see.
In addition to this, the growing share of PV in the production of some components, like glass sheets for instance, starts to represent a growing share of the total production, with local and global impacts in case of shortage as seen in China in 2021. In that respect, local manufacturing will imply the access to global value chains and the role of already existing global actors shouldn’t be neglected.

Task 1 Strategic PV Analysis and Outreach – 2021 Snapshot of Global PV Markets
21
8 PV IN THE BROADER ENERGY TRANSITION
8.1 PV and Other Renewable Energy Evolutions
PV will play a key role in the energy transition. This trend is already visible when looking at the evolution of the renewable energy technologies as shown in Figure 7. In the last 15 years, PV technology has shown an ever-increasing market growth thanks to technology and price development. In the last three decades, PV has gone from being a niche technology, mostly used for electricity production either in space or in remote places, to a mainstream energy source.
Sources: compilation of IEA PVPS, BNEF, GWEC, IRENA and estimations for 2021
In 2021, solar PV stood for approximately 40% of the total renewable electricity production from new production assets. The difference with the figure above is due to the different capacity factors of renewable technologies. Whereas biomass installations can virtually produce all day and all year-round, wind and solar installations’ outputs strongly depend on the available resources that can vary locally.
Sources: IEA PVPS, BNEF, GWEC and estimations for 2021
0
50
100
150
200
250
300
350
2010 2011 2012 2013 2014 2015 2016 2017 2018 2019 2020 2021
GWp FIGURE 7: EVOLUTION OF RENEWABLE ENERGY ANNUAL INSTALLATIONS
Wind Solar Hydro Other renewables (non hydro)
FIGURE 8: ELECTRICITY PRODUCTION OF THE
RENEWABLE ENERGY CAPACITY INSTALLED IN 2021
Wind offshore
Wind onshore
Solar PV
Hydro

Task 1 Strategic PV Analysis and Outreach – 2021 Snapshot of Global PV Markets
22
8.2 Impact of PV Development on CO2 Emissions
Global energy related CO2eq emissions have been around 33 Gt in 2021.2 This represented a 7% year on year growth mainly due to economic rebound after the historic decrease in the previous year. Indeed, the energy related CO2eq emissions decrease in 2020 was mainly to be incurred to the COVID-19 pandemic which severely impacted the global energy demand, both in transport as in the industry. The total emissions of the electricity and heat sector have reached close to 14,6 Gt of CO2eq in 2021, almost 1 000 MT of CO2eq more than the previous year. 3
The role played by PV in the reduction of the CO2 emissions from electricity is continuously increasing. Based on the total electricity generated by the cumulative PV capacity installed globally at the end of 2021, around 1 100 Mt of annual CO2 emissions were avoided. This amount is calculated based on the emissions that would have been generated from the same amount of electricity produced by the different grid mixes in all countries, and taking into consideration life cycle emissions of PV systems. This represents around 7,5% of the total electricity and heat sector emissions and 3% of all energy emissions.
8.3 PV Fostering Development of a Cleaner Energy System
In addition to directly fighting rising CO2 emissions by offering an alternative to fossil-based electricity production, the deployment of PV technology can also work as a catalyst for other technologies with a potential to tackle climate change. Indeed, PV is now the most competitive electricity source in some market segments. The availability of this cheap electricity is starting to allow the breakthrough of “green” synthetic fuels.
Given the need for seasonal storage, one key technology for the energy transition, is probably green hydrogen production. After years of research and pilot projects, the first commercial green hydrogen plants are being built all over the world. While green hydrogen can be the final product and be used in the industry instead of hydrogen produced from fossil fuels, it can also
2 IEA, Global Energy Review, CO2 Emissions (https://www.iea.org/reports/global-energy-review-
2021/co2-emissions)
3 IEA, Global Energy Review: CO2 Emissions in 2021, March 2022 (https://www.iea.org/reports/global-
energy-review-co2-emissions-in-2021-2)

Task 1 Strategic PV Analysis and Outreach – 2021 Snapshot of Global PV Markets
23
produce other fuels, which prove to be transportable in an easier way: ammonia, methanol, toluene or similar.
Another example of synergies between PV and other sectors are electric vehicles (EV).
The electrification of transport is accelerating in many countries; and almost all of which are active in the IEA PVPS Technology Collaboration Programme. The link between PV development and EVs is not straightforwardly understood yet, but it is simply becoming a reality with the growth of self-consumption policies. Charging EVs during peak load hours implies to rethink power generation, while concepts such as virtual self-consumption could rapidly provide a framework for rapid PV development. The accelerated development of the EV market could be compared to the development of the PV market. With close to 7 million EVs sold in 2021 alone, with an increase of more than 100% compared to 2020, the penetration of EVs is likely to breakthrough more quickly than PV did initially.
Source : IEA PVPS & EV Volumes
0
1
2
3
4
5
6
7
0
20
40
60
80
100
120
140
160
180
200
2008 2009 2010 2011 2012 2013 2014 2015 2016 2017 2018 2019 2020 2021
EV
sa
les
(mil
lio
ns)
PV
in
sta
lla
tio
n (
GW
)
FIGURE 9: EVOLUTION OF EV AND PV ANNUAL GROWTH
PV installation (GW) EV sales (millions)

Task 1 Strategic PV Analysis and Outreach – 2021 Snapshot of Global PV Markets
24