a snapshot of current situation FINAL REPORT
64
EAA/UTT Study – Final report 1 Fate of aluminium contained in commercial vehicles leaving the fleet in Europe: a snapshot of current situation FINAL REPORT Study done by: Troyes University of Technology 12, Rue Marie Curie - BP 2060 F-10010 Troyes Cedex – France http://www.utt.fr Fabrice Mathieux Youcef Bouzidi Magali Outters Artur Tavares Daniel Froelich (ENSAM Chambéry) For: European Aluminium Association 12 Avenue de Broqueville B-1150 Brussels - Belgium http://www.eaa.net Bernard Gilmont Marlen Bertram November 2006
-
Upload
khangminh22 -
Category
Documents
-
view
1 -
download
0
Transcript of a snapshot of current situation FINAL REPORT

EAA/UTT Study – Final report 1
Fate of aluminium contained in commercial vehicles leaving the fleet in Europe: a snapshot
of current situation
FINAL REPORT
Study done by:
Troyes University of Technology
12, Rue Marie Curie - BP 2060 F-10010 Troyes Cedex – France
http://www.utt.fr
Fabrice Mathieux
Youcef Bouzidi
Magali Outters
Artur Tavares
Daniel Froelich (ENSAM Chambéry)
For:
European Aluminium Association
12 Avenue de Broqueville
B-1150 Brussels - Belgium
http://www.eaa.net
Bernard Gilmont
Marlen Bertram
November 2006

EAA/UTT Study – Final report 2
Executive Summary
AIM OF THE STUDY
The aim of this study was to understand better current and future end-of-life treatment of aluminium parts coming from commercial vehicles (CV) such as: tractors, rigid-trucks, aluminium-constructed trailers and semi-trailers and steel-constructed trailers and semi-trailers.
METHODS
Very limited information relevant to the study was encountered in the literature analysis. The study was therefore carried out using two approaches in parallel. The first one was quantity-oriented and aimed at analysing available statistics to establish the quantity of CV leaving the fleets in EU-15 and EU-10 countries, and the quantity of CV being exported within and outside EU-25. The second approach was field-oriented and aimed at analysing through interviews and surveys of relevant actors the real and current practice of industries in Europe. The second approach aimed at gathering crucial information that is not available in the statistics.
From this data and information, the last part of the study aimed at compiling quantitative and qualitative information in order to obtain reasonable values of aluminium mass balances between the recovery processes.
RESULTS
Concerning the quantitative approach, statistics of various qualities and completeness have been analysed from several sources. They have been processed to produce quantities of aluminium leaving the fleet of CV in EU-25. Quantities of aluminium coming from CV imported/exported from/to EU-25 countries have also been suggested.
Concerning the qualitative approach, despite initial limited cooperation from some partners, a representative European network has finally been consulted and some relevant conclusions concerning the fate of aluminium from various types of CV were drawn.
Some meetings involving the authors of the study led to the compilation of qualitative and quantitative information and to a consensus concerning input/output values of all the recovery processes. From these values, some graphical representations of Material Flow Analysis of aluminium coming from all types of CV were realised.
Finally, some recommendations for further work were formulated.

EAA/UTT Study – Final report 3
Table of contents
EXECUTIVE SUMMARY ............................................................................................ 2
TABLE OF CONTENTS ............................................................................................. 3
LIST OF FIGURES ..................................................................................................... 5
LIST OF TABLES ...................................................................................................... 6
LIST OF ACRONYMS ................................................................................................ 7
ACKNOWLEDGMENTS............................................................................................. 7
I. INTRODUCTION: CONTEXT AND OBJECTIVES OF THE STUDY............... 8
I.1. Growing commercial transport in Europe ............................................................................. 8
I.2. Aluminium in commercial vehicles ........................................................................................ 9
I.3. Fate of aluminium from end-of-life commercial vehicles ..................................................... 9
I.4. Objectives of the study .......................................................................................................... 10
II. DEFINITIONS AND METHODOLOGY .......................................................... 11
II.1. Definitions ............................................................................................................................... 11
II.2. Methodology ........................................................................................................................... 11
1. Literature review ....................................................................................................................... 11
2. Quantitative approach .............................................................................................................. 12
3. Qualitative approach ................................................................................................................. 12
4. Combining quantitative and qualitative approaches ................................................................. 13
5. Summary of the methodology .................................................................................................. 13
III. MAIN FINDINGS OF THE QUANTITATIVE APPROACH ............................. 14
III.1. Evaluation of the quantity of CV leaving the fleet in EU-25 ............................................... 14
1. Methodology ............................................................................................................................. 14
2. Analysis of the French statistics ............................................................................................... 15
3. Extrapolation / extension to the EU-25 countries ..................................................................... 19
III.2. Main export destinations for CV leaving the fleet to be re-used in another country ...... 24
1. Methodology ............................................................................................................................. 24
2. Results of the statistics analysis ............................................................................................... 25
III.3. Summary ................................................................................................................................. 28

EAA/UTT Study – Final report 4
IV. MAIN FINDINGS OF THE QUALITATIVE APPROACH ............................... 29
IV.1. Methodology ........................................................................................................................... 29
1. Why leading a qualitative approach? ....................................................................................... 29
2. Classification of consulted actors ............................................................................................. 29
3. Sampling and representativeness of consulted actors ............................................................. 30
4. List and localisation of consulted actors ................................................................................... 31
IV.2. Results of the interviews / surveys ...................................................................................... 33
1. Points of view of CV manufacturers ......................................................................................... 33
2. Points of view of transport companies ...................................................................................... 35
3. Points of views of sellers/exporters/importers .......................................................................... 38
4. Points of view of CV dismantlers .............................................................................................. 40
5. Points of view shredders and remelters ................................................................................... 43
V. MATERIAL FLOW ANALYSIS OF ALUMINIUM CONTAINED IN COMMERCIAL VEHICLES LEAVING THE FLEETS IN EU-25 COUNTRIES ......... 50
V.1. Introduction ............................................................................................................................. 50
V.2. Basis of the MFA .................................................................................................................... 50
1. Initial situation ........................................................................................................................... 50
2. Structure of the system............................................................................................................. 50
3. Sources of data and compilation .............................................................................................. 51
4. Hypotheses ............................................................................................................................... 53
5. Information on accuracy of data ............................................................................................... 53
V.3. Values used for the MFA........................................................................................................ 53
1. For MCV and steel-constructed NMCV in EU-15 countries ..................................................... 54
2. For aluminium-constructed NMCV in EU-15 countries ............................................................ 54
3. For MCV and steel-constructed NMCV in EU-10 countries ..................................................... 54
4. For aluminium-constructed NMCV in EU-10 countries ............................................................ 54
V.4. Results ..................................................................................................................................... 55
VI. CONCLUSIONS AND RECOMMANDATIONS ............................................. 61
LIST OF REFERENCES .......................................................................................... 62
APPENDIX ............................................................................................................... 64
APPENDIX I – LIST OF CONTACTS .............. ERROR! BOOKMARK NOT DEFINED.
APPENDIX 2 – EXAMPLE OF QUESTIONNAIRES USED FOR INTERVIEWS / SURVEY : DISMANTLER QUESTIONNAIRE ERROR! BOOKMARK NOT DEFINED.

EAA/UTT Study – Final report 5
List of figures Figure 1. Number of new registrations of rigid trucks and tractors in Western Europe from
1985 to 2004 (after [1, 2]). .............................................................................................. 8
Figure 2. Fate of commercial vehicles when leaving the fleet of a company. ....................11
Figure 3. Summary of the methodology adopted for the study. ........................................13
Figure 4. Methodology adopted for the calculation of the number of CV leaving the fleet in EU-25 countries in 2003. ...............................................................................................15
Figure 5. Comparison of the size of fleets of tractors and rigid trucks in France computed using data from “grey card” data and from “technical control” data. ...............................16
Figure 6. Comparison of the size of fleets of trailers and semi-trailers in France computed using data from “grey card” data and from “technical control” data. ...............................16
Figure 7. Number of MCV entering and leaving the fleet in France from 1999 to 2003. ....17
Figure 8. Number of NMCV entering and leaving the fleet in France from 1999 to 2003. .18
Figure 9. Total traffic figures for most EU-25 countries in 2004 (after [16]). .....................19
Figure 10. Ratio Population / New registration of CV vehicles in countries representing 82% of the registration in EU-25 (after [1, 16, 20]). ........................................................20
Figure 11. Number of CV leaving the fleet of EU-25 countries in 2003 for each type of CV: tractors, rigid trucks, semi-trailers and trailers. ........................................................22
Figure 12. Share of tractors in the fleet being older than 10 years old in 1999 and 2003 in thirteen EU-25 countries. ...............................................................................................27
Figure 13. Share of rigid trucks in the fleet being older than 10 years old in 1999 and 2003 in thirteen EU-25 countries. ..................................................................................28
Figure 14. Actors along the typical life cycle of commercial vehicles. .............................30
Figure 15. Geographical localisation of consulted actors in Europe. ...............................33
Figure 16. Repartition of transport companies according to the number of employees in three countries: Czech Republic, France and Poland in 2004 (after [16]). .....................36
Figure 17. A 1988 Ova trailer in use at a small transport company in the North of Poland. The tipping body is made of aluminium while the chassis is made of steel. ...................38
Figure 18. Detail of the 1988 Ova trailer. ........................................................................38
Figure 19. Several Aluminium trailers stored on the Fruehauf plant in Auxerre, France..39
Figure 20. A view of an indoor dismantling plant for MCV located in Evreux region, France. 41
Figure 21. An injured MCV as it can be received at a dismantling plant, here in Roncq, France. 42
Figure 22. Some aluminium rims extracted from injured CV ready to be re-sold, here in Roncq, France. ..............................................................................................................42
Figure 23. One aluminium tank extracted from an injured CV, here in Roncq, France. ...42
Figure 24. Bodies of injured CV after the extraction of all valuable parts; the body is ready to be sent to the local shredder; here in Roncq, France. ......................................42
Figure 25. General view of aluminium parts extracted from EoL commercial road vehicles at a local metal dealer in Troyes, France. ......................................................................45
Figure 26. Detail view of some aluminium parts (a tipper body) extracted from EoL commercial road vehicles at a local metal dealer in Troyes, France. .............................45
Figure 27. One section of aluminium boards from EoL commercial road vehicles encountered at a local metal dealer in Troyes, France. .................................................45
Figure 28. Another section of aluminium boards from EoL commercial road vehicles encountered at a local metal dealer in Troyes, France. .................................................45

EAA/UTT Study – Final report 6
Figure 29. Detail view of some aluminium parts (a door) extracted from EoL commercial road vehicles at a local metal dealer in Troyes, France. ................................................46
Figure 30. Detail view of some aluminium parts (a tipper body) extracted from EoL commercial road vehicles at a metal dealer in Troyes, France. .....................................46
Figure 31. A shearer in use at a local metal trader in Troyes, France. Such machines are used to prepare large parts of Aluminium extracted from CVs. ......................................46
Figure 32. A “ball” used in many local metal dealer to liberate metals in parts like motors, gear boxes, etc. .............................................................................................................46
Figure 33. Laminated parts as input of an aluminium preparation plant in Paris region, France. It was observed that this flow contains some parts coming from CV. ................47
Figure 34. Foundry part as input of an aluminium preparation plant in Paris region, France. 47
Figure 35. Aluminium concentrated fraction coming from shredders, in Paris region, France. 47
Figure 36. Aluminium-concentrated parts coming from public works equipment at an aluminium preparation plant in Paris region, France. .....................................................47
Figure 37. Structure of the EU-15 system considered ....................................................51
Figure 38. Summary of methodology to define trustable values to be used in MFA. .......51
Figure 39. Illustration of the influence of expert views in the determination of output share for each process of the MFA – Case of aluminium NMCV leaving the fleet in EU-15. ....52
Figure 40. Simplified MFA representation of aluminium coming from 100 tons of aluminium-constructed NMCV leaving the fleet in EU-15 countries. ..............................53
Figure 41. Material Flow Analysis graph summarising the fate of aluminium coming from MCV leaving the fleet of EU-15 and EU-10 (tons in 2003). ............................................56
Figure 42. Material Flow Analysis graph summarising the fate of aluminium coming from steel-constructed NMCV leaving the fleet of EU-15 and EU-10 (tons in 2003). ..............57
Figure 43. Material Flow Analysis graph summarising the fate of aluminium coming from aluminium-constructed NMCV leaving the fleet of EU-15 and EU-10 (tons in 2003). .....58
Figure 44. Material Flow Analysis graph summarising the fate of aluminium coming from all types of CV fleet in EU-25 (tons in 2003). .................................................................59
List of tables Table 1. Weight, aluminium weight and aluminium share in four types of CV put on the
market today [6]. ............................................................................................................ 9
Table 2. Number of MCV (motorised CV) and NMCV (non-motorised CV) leaving the French fleet from 1999 to 2003. .....................................................................................17
Table 3. Average annual decay of CV leaving the fleet in France from 1999 to 2003. .....18
Table 4. Calculation of ratio to be applied for the calculation of output fleet for the 10 new accessing countries of EU-25. .......................................................................................20
Table 5. Estimation of the number of CV vehicles leaving the fleet in all countries of EU-15, EU-10, and EU-25 in 2003.......................................................................................21
Table 6. Share of aluminium estimated for the two categories of CV put on the market in 2005 and during 1990-1995 period (after [6]..................................................................23
Table 7. Average weight, average weight of aluminium and share of the market observed for NMCV today and in 1990-1995 (after [6]). ................................................................24
Table 8. Estimation of the quantity of aluminium (in tons) leaving the fleet in all countries of EU-15, EU-10, and EU-25 in 2003, for all types of CV. ..............................................24

EAA/UTT Study – Final report 7
Table 9. Main destinations (and share of them) of exported tractors from EU-15 and EU-10 to EU-15, EU-10 and outside of EU-25 in 2003 (after [21]). ......................................25
Table 10. Three main destinations (and share of them) for used tractors from six EU-15 countries in 2004 (after [21]). .........................................................................................25
Table 11. Three main origins (and share of them) for importation of used tractors to three EU-10 countries in 2004. ...............................................................................................25
Table 12. Share of NMCV coming from EU-15 and EU-10 countries exported to EU-15, EU-10 and outside of EU-25 (after [21]) ........................................................................26
Table 13. Three main destinations (and share of them) for used trailers and semi-trailers from six EU countries in 2004. .......................................................................................26
Table 14. Three main origin (and share of them) for importation of used trailers and semi-trailers from three new accessing countries to EU-25 in 2004. ......................................26
Table 15. List of interviewed actors. ..................................................................................32
Table 16. Input / output values validated by experts for each process for MCV and steel-constructed NMCV leaving the EU-15 fleet. ...................................................................54
Table 17. Input / output values validated by experts for each process for aluminium-constructed NMCV leaving the EU-15 fleet. ...................................................................54
Table 18. Input / output values validated by experts for each process for MCV and steel-constructed NMCV leaving the EU-10 fleet. ...................................................................54
Table 19. Input / output values validated by experts for each process for aluminium-constructed NMCV leaving the EU-10 fleet. ...................................................................54
Table 20. List of persons and companies contacted during the study.Error! Bookmark not defined.
List of acronyms CV: Commercial vehicle
EoL: end-of-life
NMCV: non-motorised commercial vehicle: trailers and semi-trailers
MCV: motorised commercial vehicle: tractors and rigid trucks
MFA: Material Flow Analysis
EU-25: 25 countries forming the European Union from May, 1st 2004
EU-15: 15 countries forming the European Union until May, 1st 2004
EU-10: 10 countries that joined the European Union from May, 1st 2004
EU-6: Belgium, France, Germany, Italy, Luxembourg, the Netherlands
Acknowledgments
Authors would like to thank all the persons from several European countries who answered our (numerous) questions. This study would not exist if they hadn’t kindly cooperated.

EAA/UTT Study – Final report 8
I. Introduction: context and objectives of the study
I.1. Growing commercial transport in Europe Due to increasing economic activity, market liberalisation and growing international goods exchanges, the number quantity of commercial vehicles (CV) like tractors, rigid trucks, trailers and semi-trailers in use in EU-25 is growing. Figure 1 illustrates the trends of new registrations of tractors and rigid trucks in a few Western Europe countries.
0
20 000
40 000
60 000
80 000
100 000
1985 1987 1989 1991 1993 1995 1997 1999 2001 2003
Qu
an
tity
(U
nit
s)
Germany Benelux Spain France Italy United Kingdom Other countries
Germany
France
U.K.
Spain
Italy
Benelux
Other countries
Austria, Denmark, Finalnd,
Greece, Irland, Norway,
Portugal, Sweden,
Switzerland
Figure 1. Number of new registrations of rigid trucks and tractors in Western Europe from 1985 to 2004 (after [1, 2]).
According to Figure 1, new registrations of motorised CV have been on the whole growing in Western Europe even if strong variations can be observed. Variations in new registrations of commercial vehicles (CV) seem linked to the economic activity of countries:
• if the economic situation improves, there is an increase in the number of CV registration,
• if the economic situation gets worse, there is a decrease in the number of CV registration.
For example, in 1998-2000 period, the improvement of the economic situation in the EU-15 leads to higher registration of CV, first in Germany; this registration growth is then observed one or two years later in other large CV user countries, i.e. France, UK, Italy, Spain, the Benelux.
Since their accession to EU-25, and even during the accession preparation, new EU countries like Poland or Czech Republic, have been strongly developing their commercial goods transport industry. This seems mainly due to (after the interviews reported in Section 4):
• new commercial exchange axis for these countries, in particular with Germany and France,
• lower labour costs that make their activity more competitive than Western neighbours,

EAA/UTT Study – Final report 9
• a lower competitiveness of rail goods transport that used to be dominant in the past.
I.2. Aluminium in commercial vehicles Increased road transport might imply higher greenhouse gas emissions and there are therefore strong incentives to improve commercial vehicles performances, for example by improving engine efficiency or by lightering vehicles [3]. For the latter, aluminium or aluminium alloys are currently gaining in popularity for engine parts, components and parts, accessories and for structures / superstructures of CV [3]. According to A. Gesing, transportation indeed drives the growth of aluminium consumption [4].
Indeed, since its first use in Parisian buses in 1910, aluminium has been more and more used in CV. It can be used today in [5]:
• components for trucks (e.g. cabin, doors, powertrain),
• superstructures, complete or as components (e.g. van box, tipping body, silo, tank),
• structures (e.g. chassis of semi-trailer),
• accessories (e.g. fuel tank, wheels, air pressure vessels),
• engine parts.
It is estimated that for an average fleet put on the European market today, a tractor contains 250 kg of Aluminium, a rigid truck 500 kg, a semi-trailer 530 kg and a drawbar-trailer 315 kg [6]. This is summarised in Table 1. Since statistics on castings do not separate transport applications into automotive and other road transport the used data could potentially be too low. Nevertheless, these figures suggested by EAA seem coherent with figures obtained from tractors manufacturers (cf. for example [7, 8]).
Average weight
Average quantity
of Al (2005)
Share of Al
(2005)
Tractors 7000 250 3,6%
Rigid trucks 8500 500 5,9%
Trailer 4200 315 7,5%
Semi-trailer 7000 530 7,6%
Table 1. Weight, aluminium weight and aluminium share in four types of CV put on the market today [6].
Thanks to the development of aluminium applications in CV, CO2 emissions reduction and fuel saving are being achieved [9]. However, environmental benefits of using aluminium in CV strongly depend on end-of-life recycling efficiency. Unfortunately, very little has been known so far on end-of-life treatment of CV in Europe.
I.3. Fate of aluminium from end-of-life commercial vehicles
Collection and recycling systems of end-of-life (EoL) vehicles are being implemented worldwide mainly due to regulations. Recovery/recycling of EoL vehicles is in reality a system of many different processes, including in particular: manual dismantling, depollution, spare parts extraction, shredding, material sorting, material recycling and even marketing recycled materials [4, 10]. Aluminium is one of the numerous materials that can be recovered by EoL vehicles recycling systems. Some even argue that EoL vehicles contain an important fraction of recycled aluminium that can be recovered for recycling from EoL products [4].
As pointed out by A. Gesing, considering that the recycling system is today globalised, it is usually difficult to assess performances of EoL vehicles recycling systems [4]. This affirmation was verified by us at the start of the project when we found out that not much was known on the fate of CV that leave fleets of European countries as very few reports or statistics are today available. A few contacts taken in June-July 2005 with EoL vehicles and

EAA/UTT Study – Final report 10
aluminium experts in Europe confirmed this lack of knowledge. Many think that most CV end their technical life in other markets, in particular in Africa. Others think that some vehicles, like aluminium-road tankers, end as fixed storage of goods in the transporters yard. The aim of the project is indeed to find out more on this actual fate of aluminium-constructed CV that leave the European fleets.
I.4. Objectives of the study The general aim of the present study is to reveal a first snapshot of what is the current fate of commercial vehicles that leave European fleets, with a special focus on aluminium parts. In particular, it aims at:
• knowing and understand better current and future treatment (re-use, storage, recycling, etc.) of CV and embodied aluminium parts in EU-25.
• establishing preliminary Material Flow Analysis (MFA) models for aluminium from CV in EU-25.
It was decided to present results in the form of MFA, as, according to P.H. Brunner [11],:
• when information is hardly available, MFA makes it possible to estimate some missing material flows by mass-balancing the adjacent processes,
• it can allow early recognition of environmental issues, in the present case accumulation or escape of aluminium in/from EU-25,
• it allows efficient environmental monitoring, and in the long run, it could be used to assess/predict the efficiency of possible future regulation, and above all,
• it allows efficient presentation of results.
As argued by the same P.H. Brunner [11], as the MFA is performed for the first time in this field, the results of the study should indeed be considered as a first attempt.
The present report is organised as follows: next section aims at introducing the methodology that was elaborated and used. Section 3 and 4 reports the results of the quantitative and qualitative approaches respectively. Section 5 explains how results of the two approaches are combined and synthesises results of the study in the format of four MFA graphs. The last section focuses on conclusions of the study and on recommendations for further work.

EAA/UTT Study – Final report 11
II. Definitions and methodology
II.1. Definitions Several types of commercial vehicles (CV) are considered in this study:
• motorised CV (MCV), i.e. tractors and rigid trucks; only MCV with Maximum Gross Vehicles Weight superior to 3.5 tons were considered,
• non-motorised CV (NMCV), i.e. trailers and semi-trailers.
Buses are not considered.
When leaving the fleet of a company, a CV can (see Figure 2):
• either remain in the fleet of the country while re-used by another company,
• or leave the fleet of a country and therefore:
o either sold to be used in the fleet of another country,
o or dismantled and/or recycled in the country.
CV in use in
country A
CV in use in country
B
End-of-life treatment
in country A
Remain in the
country’s fleetLeave the country’s
fleet
Figure 2. Fate of commercial vehicles when leaving the fleet of a company.
II.2. Methodology The following methodology was adopted for the present study:
1. Literature review
The project was initiated by a literature review. After Internet search, the journal and conference paper database Compendex has been used to identify relevant past papers. The keywords “commercial vehicles”, “trucks”, “trailers”, “recycling”, “aluminium” have been used. A list of papers have been identified as possibly interesting for the study. However, as only one paper was specifically focusing on our objectives, it was decided to contact the main authors of the papers by email and/or by phone to find out if they knew about past studies with similar objectives as ours. Unfortunately, the feedback from these authors has been without any value for this study.
Only one study focusing on the fate of Commercial Vehicles has been identified. This study [12] has been led in 1998 by a consulting company for the ADEME, the French Environmental Protection Agency. Although interesting, especially for the methodology adopted, this study was little usable because:
• it only focused on the French situation,
• results are quite old (1998) , when no legislation on EoL vehicles was implemented,
• it did not focus specially on aluminium parts,

EAA/UTT Study – Final report 12
• it included little analysis of the real industrial practices (in dismantling and recycling plants).
This literature review has been completed by a consultation by phone of a few experts of aluminium and of EoL vehicle treatment: this approach confirmed that no study with similar objectives had been led in the past and that one of the experts had clear ideas on the subject.
2. Quantitative approach
The quantitative approach aims at exploring and identifying all available relevant data from various databases (ministries of transport, customs, association of manufacturers, Eurostat) in order to answer the question posed by EAA.
In order to validate the quantitative approach, it was decided to start with France because:
• the data are reputed of good quality [6],
• the data are easily accessible for the leaders of the study.
After this, the approach has been extended to EU-25.
The main objectives of the quantitative approach were the following:
• to quantify as much as possible the amount (units and mass) of CV coming to end-of-life in EU-25 in 2004;
• to analyse 2004 quantities and comparing it to quantities from previous years in order to analyse the trends;
• when possible, to establish inter-border movements (within EU-25 and outside EU-25).
3. Qualitative approach
Unfortunately, quantitative information is not available for all aspects covered by the study. Examples are:
• establishing aluminium-constructed CV specific information: NMCV statistics do not separate between aluminium-constructed CV and steel-constructed CV, and therefore do not establish whether the former are more to be exported or recycled than the latter;
• establishing routes during the EoL treatment: treatment of EoL vehicles is a peculiar activity and although it has been more and more studied and even modelled in the last 10 to 15 years (see e.g. [10, 13, 14]), the routes of products and materials (pollutant extraction, dismantling, shredding, sorting) is not well documented yet and not well known, except by dismantlers and recyclers; in this context, there is today no reliable statistics establishing the share of dismantling and shredding for EoL vehicles, the quantity extracted, etc.
It was therefore decided to lead a qualitative approach that aims at determining real practices in the industry, through survey and interviews of relevant actors based on original questionnaires.
The main objectives of the qualitative approach were the following:
• to know better fate of “CV leaving the fleet” and “aluminium-dominated parts” in France,
• to suggest a semi-quantitative MFA model for “CV leaving the fleet” and Al-dominated parts in France,
• to know better fate of “CV leaving the fleet” and “aluminium-dominated parts” in EU-25,
• to suggest a semi-quantitative MFA model for “CV leaving the fleet” and Al-dominated parts in EU-25.

EAA/UTT Study – Final report 13
4. Combining quantitative and qualitative approaches
The results of the present study are therefore a mix of a quantitative approach, based on the analysis of statistical data, and of a semi-quantitative/qualitative approach, based on the analysis of real practices in the industry observed during surveys and interviews.
In order to synthesise and homogenise the information collected in these two complementary approaches, a so called “expert meeting” grouping the persons involved in the data collection was organised in order to set consensual (and hopefully reliable) values to be used in MFA.
5. Summary of the methodology
The general methodology of the present study is presented in Figure 3.
Validation of questionnaires
Survey
Synthesis of findings
Expert decision on MFA values
Analysis of literature
Analysis of data
Number of CV
leaving the fleet
in EU-25
Number of CV
exported within /
from EU-25Summary of
findings
MFA for Alu from MCV MFA for Alu from NMCV
“Quantitative” “Qualitative”
Filled-in
questionnaires
Figure 3. Summary of the methodology adopted for the study.

EAA/UTT Study – Final report 14
III. Main findings of the quantitative approach The objective of this approach is to analyse available statistics in order to establish the quantity of all type of CV leaving the fleet in EU-25 countries and the transboundary movements of CV within EU-25 as well as between EU-25 and other countries. This paragraph aims at presenting the main results.
Initial findings of the study showed that EU-15 and EU-10 countries seem to have very different behaviour in term of use of commercial vehicles. In most of the Sections of this quantitative approach, there are therefore clearly distinguished.
III.1. Evaluation of the quantity of CV leaving the fleet in EU-25
1. Methodology
The number of vehicles leaving the fleet in a country is usually not available in national statistics. To deal with such data gap, it was decided to use for any country the mass balance-based equation that was already used in the past in similar studies (cf. e.g. [12, 15]):
)g_Fleet(CV_Leavin Y )()() Y1YY onregistrati-NewFleet(Fleet (1)
where:
• (CV_Leaving_Fleet Y) is the number of CV leaving the fleet of a country in the Year Y,
• (Fleet Y) is the size (in units) of the CV fleet of the country in the Year Y,
• (New_registrationY) in the number of CV newly registered (i.e. entering the fleet) in the Year Y.
To obtain the number of CV leaving the fleet in a country in a certain year, registration and fleet size data are therefore necessary. During our researches, we were easily able to access the data for France using national statistics. Looking at European statistics, we found several sources for the data:
• data from Eurostat, the European Bureau of statistics [16],
• data from ACEA, the European Automotive Manufacturers Association [1].
However, we identified strong limitations of these statistics:
• concerning data on the size of fleet:
o data for tractors, trailers and semi-trailers is available through Eurostat in 2003 for only 13 countries of the EU-25,
o data for rigid trucks is not available through Eurostat as such (it is mixed with other data, i.e. lorry data),
• concerning data on new registrations:
o there are no data for rigid trucks through Eurostat as such,
o data from ACEA do not adopt the CV classification tractors / rigid trucks and does not cover trailers and semi-trailers.
Considering these important data gaps and heterogeneities, a methodology based on the extrapolation of figures obtained from French statistics was adopted. More information on the extrapolation will be given in Section 3.
The methodology for this Section is presented in Figure 4.

EAA/UTT Study – Final report 15
Analysis of the French statistics
Calculation of the number of CV leaving the fleet in France in 2003
Number of 4 types of CV leaving thefleet in France in 2003
Extrapolation of French figures to EU-25 countries
Total number of CV leaving the fleetin EU-25 countries in 2003
EU-25 population data
Calculation of 4 types of CV leavingthe fleet in EU-25
Number of 4 types of CV leaving thefleet in EU-25 countries in 2003
Share of 4 CV types registrations in EU-25 countries
Information on dynamic behavior
Figure 4. Methodology adopted for the calculation of the number of CV leaving the fleet in EU-25 countries in 2003.
2. Analysis of the French statistics
CV statistics from France are reputed reliable in EU-25 [6], and it was therefore decided to analyse them in details.
a) Availability and quality of data
According to equation (1), two types of data are necessary to compute the quantity of CV leaving a country fleet:
• the number of new registration in a certain year: the data were obtained from ACEA and CLCCR [1, 17]; they were considered as reliable;
• the size of the fleet in a certain year and in the year after.
For the latter data, two sources of information exist in France:
1. data called “Grey Card” data, i.e. the data supplied by the French Ministry of Transport statistics: they rely on the date of the first registration of a CV and on the average life duration of the type of CV [18]; the equation used is :
YearNLDYearNY
YYearN onregistratiNewFleet)(
)_( (2)
where:
• FleetYearN is the size of the fleet in the year YearN,
• New_registrationY is the number of new registration in the year Y,
• LD is the expected (theoretical) life expectation of the CV.
The data can therefore be considered as “theoretical”. After verification, the data are the one communicated to Eurostat by the French government.
2. data called “Technical Control” data, i.e. data supplied by the DRIRE (Regional Direction for Industry, Research and the Environment, affiliated to the French Ministry of Industry and the Ministry of Environment) : they sum-up the number of compulsory technical checks done for each type of vehicle in a certain year [18].

EAA/UTT Study – Final report 16
In Figures 5 and 6 below, data obtained from the two sources for MCV and NMCV are compared.
0
50000
100000
150000
200000
250000
300000
350000
400000
1999 2000 2001 2002 2003 2004Years
Quantity (units)
tractors (grey card) Tractors (technical control) Rigid trucks (grey card) Rigid trucks (technical Control)
Figure 5. Comparison of the size of fleets of tractors and rigid trucks in France computed using data from “grey card” data and from “technical control” data.
0
50000
100000
150000
200000
250000
300000
350000
1999 2000 2001 2002 2003 2004Years
Quantity (units)
Semi-trailers (grey card) Semi-trailers (technical Control) Trailers (grey card) Trailers (technical control)
Figure 6.Comparison of the size of fleets of trailers and semi-trailers in France computed using data from “grey card” data and from “technical control” data.
After analysis of the previous figures, it can be concluded that variations between the two types of figures are between 1% and up to 20% for all types of CV with an average of 10%.

EAA/UTT Study – Final report 17
Considering the definition of the data, and as suggested by previous similar study [12], “technical control” data are considered as more reliable and accurate than “grey card data” because it is based on real world measures and not on theoretical values. “Technical control” data are therefore chosen for the present study.
Since “Technical control” data were only available until the year 2004, the quantity of CV leaving the fleet was only calculated until 2003.
b) Results
Absolute figures
The number of motorized and non-motorized CV leaving the fleet in France from 1999 to 2003 is now computed using equation (1). The results are summarized in Table 2.
Table 2. Number of MCV (motorised CV) and NMCV (non-motorised CV) leaving the French fleet from 1999 to 2003.
Year MCV NMCV
1999 42 676 19 156
2000 64 308 29 744
2001 68 139 33 074
2002 53 855 25 351
2003 36 548 16 853
Trends
Figure 7 and 8 below compares, for MCV as well as NMCV, the number of CV leaving the fleet in France with new registration of non motorized CV between 1999 and 2003.
35000
40000
45000
50000
55000
60000
65000
70000
1999 2000 2001 2002 2003
Year
Qu
an
tité
(U
nit
és
)
New registration
Leaving the fleet
Figure 7. Number of MCV entering and leaving the fleet in France from 1999 to 2003.

EAA/UTT Study – Final report 18
15000
20000
25000
30000
35000
1999 2000 2001 2002 2003
Year
Qu
an
tity
(u
nit
s)
New registration
Leaving the fleet
Figure 8. Number of NMCV entering and leaving the fleet in France from 1999 to 2003.
There are obviously strong variations in the number of CV leaving the fleet in France. For example, the number of CV leaving the fleet in 2003 is around 50% lower than it was in 2001. We were not able to identify objectives reasons for this (stricter emission norms for new vehicles for example). Analysis of the previous graphs shows a good correlation between number of CV registration and the number of CV leaving the fleet of a country, and, as seen in Section I.1, therefore with the economic situation. Such behaviour can be explained as follows: with good economic activity, many transport companies wish to renew their fleet; some companies do replace their used CV by new ones, some other replace their used CV by newer, and more CV leave logically the fleet.
We therefore conclude that there is in France a good correlation between the economic activity and the number of CV leaving the fleet: the better the economic situation is, the higher the number of CV leaving the fleet.
As showed in Table 3, it seems that between 1999 and 2003 there is a trend to a slight decrease of the number of CV leaving the fleet in France, in particular for rigid trucks and for trailers. This might be explained by longer life expectation for CV. It is however difficult to generalise trends using such a small number of years and it is difficult to generalise trends for Europe.
Table 3. Average annual decay of CV leaving the fleet in France from 1999 to 2003.
Trend (%/year) between 1999 and 2003
Tractors -2%
Rigid Trucks -6%
Semi-trailers -2%
Trailers -8%

EAA/UTT Study – Final report 19
3. Extrapolation / extension to the EU-25 countries
a) Total number of CV leaving the fleet in EU-25 countries
Data not available in all EU-25 countries
New registration data for CV are unfortunately only available for a limited number of EU-25 countries. Moreover, for many countries except Germany and France, the data quality is largely at stake [6]. Also, the “technical control” data are unfortunately not available everywhere in Europe. In some countries, e.g. Poland, this type of control simply does not exist [19]!
To cope with this data unavailability, it was decided to extrapolate French data.
Possible extrapolation procedure
For the extrapolation, data concerning Total Traffic (expressed in million tonnes * km) available from Eurostat could be used. For illustration, the total transport figures in 2004 are presented in Figure 9 below:
0
50000
100000
150000
200000
250000
300000
350000
Belgium
Cze
ch R
epub
lic
Den
mar
k
Ger
man
y
Eston
ia
Spa
in
Franc
e
Ireland
Italy
Cyp
rus
Latvia
Lith
uania
Luxe
mbo
urg
Hun
gary
Net
herla
nds
Aus
tria
Polan
d
Por
tuga
l
Slove
nia
Slova
kia
Finland
Swed
en
Unite
d Kingd
om
To
tal
tra
ffic
(in
Mio
To
n.k
m)
Figure 9. Total traffic figures for most EU-25 countries in 2004 (after [16]).
However, we found the following limitations:
• the oldest data are from 1999 and therefore cannot capture the situation when CV coming to end-of-life today were firstly registered,
• there are no data on EU-10 countries before 2004,
It was therefore decided to not use these data for the extrapolation.
Adopted extrapolation procedure
It was therefore decided to use population data for the extrapolation, using the following equation:
France
CountryFrance
CountryPopulation
PopulationFleetLeavingCVFleetLeavingCV
1995
1995____
(3)
The population data of 1995 are chosen instead of data from 2003 as CV leaving the fleet today are supposed to have been put on the market between 8 to 10 years before, i.e. in 1995.

EAA/UTT Study – Final report 20
Such population ratio is however arguable if considering that EU-15 countries have been developing very strongly their transport sectors in the last years, and they surely were under-equipped in the nineties compared to EU-15 countries. Such variations between EU-15 countries and EU-10 countries can be observed in Figure 10 where population in 1995 and 2004 is compared to new registration in 2004 for main European CV users: countries like Czech Republic and above all Poland are clearly under-equipped.
0
500
1000
1500
2000
2500
3000
3500
Ger
man
y
France
Unite
d Kin
gdomIta
ly
Spai
n
The Net
herla
nds
Bel
gium
Pola
nd
Cze
ch R
epublic
Ave
rage
Po
pu
lati
on
/ r
eg
istr
ati
on
(-)
Using population 1995
Using population 2004
Figure 10. Ratio Population / New registration of CV vehicles in countries representing 82% of the registration in EU-25 (after [1, 16, 20]).
The following correction is therefore applied to new EU Member States:
• the theoretical fleet of CV vehicles computed from 1995 population figures is compared with 1999 fleet figures obtained from Eurostat; ratio obtained is multiplied to the number of CV leaving the fleet,
• for countries without any data on fleet (i.e. Estonia and Malta), the average ratio (i.e. 54%) is applied.
Adopted correction ratios are presented in Table 4 below.
Table 4. Calculation of ratio to be applied for the calculation of output fleet for the 10 new accessing countries of EU-25.
Theoretical fleet calculated based on 1995 population
Fleet in 1999 (Source: Eurostat)
Ratio Theoretical Fleet in 1995 / Fleet in 1999
Ratio to be applied for the calculation of output fleet
Czech Republic 99 9473 404 100 40% 40%
Estonia 140 066 No data - 54%
Cyprus 62 426 113 174 181% 181%
Latvia 241 869 144 265 60% 60%
Lithuania 352 367 112 197 32% 32%
Hungary 99 9812 427 354 43% 43%
Malta 35 739 No data - 54%
Poland 3 731 690 2 387 850 64% 64%
Slovenia 192 433 79 745 41% 41%

EAA/UTT Study – Final report 21
Slovakia 518 075 169 624 33% 33%
It should be recalled that this correction applied to new EU member countries has limited implication on the whole EU-25 figures as the fleet of these countries represent a small share of the whole European fleet.
The total numbers of CV leaving the fleet for each EU-25 country are presented in Figure 11 (cumulated figures).
b) Number of CV leaving the fleet per category
It was decided to take into account national preferences of using trucks, rigid trucks, trailers and semi-trailers. For this purpose, the ratio of tractors, rigid trucks, trailers and semi-trailers put on the market in 1999 in the major CV users (i.e. Germany, Spain, the Netherlands and Italy; together with France, these countries represent around 63% of registration of CV in EU-25) are used. It was indeed not possible to apply those ratios to all EU-25 countries as data from CLCCR-VDA (Liaison Committee of the Body and Trailer Building Industry) [2] communicated by EAA were not complete and fully trustable [6].
Results for each category of CV and each country are presented in Figure 11. Table 5 summarises the number of each category of CV leaving the fleet in EU-15, EU-10 and EU-25.
Table 5. Estimation of the number of CV vehicles leaving the fleet in all countries of EU-15, EU-10, and EU-25 in 2003.
Fleet ouput of tractors
Fleet ouput of rigid trucks
Fleet ouput of semi-trailers
Fleet ouput of trailers
EU-15 160 508 77 484 89 870 15 356
EU-10 19 707 6 030 11 084 783
TOTAL EU-25 180 215 83 514 100 954 16 139

EAA/UTT Study – Final report 22
0
10000
20000
30000
40000
50000
60000
70000
80000
Bel
gium
Cze
ch R
epublic
Den
mar
k
Ger
man
y
Est
onia
France
Gre
ece
Spai
n
Irel
and
Italy
Cyp
rus
Latvi
a
Lithuan
ia
Luxem
bourg
Hungar
y
Mal
ta
Net
herla
nds
Aust
ria
Pola
nd
Port
ugal
Slo
venia
Slo
vaki
a
Finla
nd
Swed
en
Unite
d Kin
gdom
Qu
an
tity
(U
nit
s)
Fleet ouput of tractors (2003) Fleet ouput of rigid trucks (2003)
Fleet ouput of semi-trailers (2003) Fleet ouput of trailers (2003)
75 395
53 401
36 344
52 563
22 831
54 092
Figure 11. Number of CV leaving the fleet of EU-25 countries in 2003 for each type of CV: tractors, rigid trucks, semi-trailers and trailers.

EAA/UTT Study – Final report 23
c) Quantity of aluminium leaving the fleets per CV category
The aluminium output flows from commercial vehicles are assessed as follows: output is calculated as the number of used CV times the concentration of aluminium in a CV. The concentrations were obtained for all types of CV from EAA and are presented in the paragraphs below
Concentration of aluminium in MCV
For MCV, aluminium is distributed in all vehicles of the fleet. In vehicles put on the market in 2005, it is estimated that 3,6% of the weight of a tractor and 5,9% of the weight of a rigid truck is made of aluminium. EAA estimates that this quantity grew by 15% compared to the 1990-1995 period, thanks to a higher number of functions that are made of aluminium [6]. This growth is taken into account as vehicles coming to end-of-life in 2003 were put on the market at this time. As shown in Table 6, it is therefore considered that for CV leaving the fleet in 2003, respectively 3% of the weight of tractors and 5% of the weight of rigid trucks are made of aluminium.
Table 6. Share of aluminium estimated for the two categories of CV put on the market in 2005 and during 1990-1995 period (after [6].
Type pf MCV
Average weight [kg]
Average quantity of Al* in
2005 [kg] Share of Al in 2005 [%]
Average quantity of Al* in 1990-1995
[kg]
Share of Al in 1990-1995 [%]
Tractors 7 000 250 3,6% 212,5 3,0%
Rigid trucks 8 500 500 5,9% 425 5,0%
Concentration of aluminium in NMCV
Aluminium is concentrated in a few types of NMCV, namely large volume tipper, public work tipper, powder silos and fuel tanks, these represent all together 16% of the fleet [6]. EAA suggested to consider aluminium concentration in these vehicles and their market shares as stable since 1990-1995. Smaller shares of aluminium are also present in steel-concentrated NMCV that represent around 84% of the market share.
Average weight, average weight of aluminium and share of the market considered in this study are presented in Table 7.
* Since statistics on castings do not separate transport applications into automotive and other road transport the used data could potentially be too low.

EAA/UTT Study – Final report 24
Table 7. Average weight, average weight of aluminium and share of the market observed for NMCV today and in 1990-1995 (after [6]).
Type of NMCV Average
weight (T) Weight of
aluminium (T) Share of the market (%)
Semi-trailers
Large volume tipper
7 3 7%
Public work tipper 7 2 4%
Powder silos 7 2 3%
Fuel tank 7 1,35 2%
Others 7 0,25 84%
Trailers
Large volume tipper
4,2 1,8 7%
Public work tipper 4,2 1,2 4%
Powder silos 4,2 1,2 3%
Fuel tank 4,2 0,81 2%
Others 4.2 0.15 84%
Quantity of aluminium leaving the fleet in EU-25
The computed quantity of aluminium leaving the fleet in 2003 in EU-15, EU-10 and EU-25 is computed in Table 8.
Table 8. Estimation of the quantity of aluminium (in tons) leaving the fleet in all countries of EU-15, EU-10, and EU-25 in 2003, for all types of CV.
System Tractors
(T) Rigid
trucks (T) Al-constructed
semi-trailers (T) Al-constructed
trailers (T)
Steel-constructed
semi-trailers (T)
Steel-constructed trailers (T)
TOTAL (T)
EU-15 34 108 32 931 33 881 3 474 18 873 1 935 125 201
EU-10 4 188 2 563 4 179 177 2328 99 13 533
TOTAL EU-25
38 296 35 493 38 060 3 651 21 200 2 034 115 499
III.2. Main export destinations for CV leaving the fleet to be re-used in another country
As defined in Section II.1, a CV leaving the fleet of a country is either exported for re-use in another country or treated locally for the recovery of its parts and materials. This Section aims at determining the share of CV leaving the fleet of EU-25 countries (calculated in Section III.1) that is actually exported for re-use in other countries.
1. Methodology
Import/export data obtained from Eurostat are presented and discussed here. It was in particular possible to extract from Eurostat database the following data for the year 2003 [16]:
• for tractors, trailers and semi-trailers from EU-15:
o number of used CV entering EU-15 countries from EU-15 countries;
o number of used CV entering EU-10 countries from EU-15 countries;
o number of used CV entering countries outside EU-25 from EU-15 countries;
• for tractors, trailers and semi-trailers from EU-10:

EAA/UTT Study – Final report 25
o number of used CV entering EU-15 countries from EU-10 countries;
o number of used CV entering countries outside EU-25 from EU-10 countries;
2. Results of the statistics analysis
a) For used MCV
General data
Data obtained from Eurostat concerning the main destination of tractors exported are summarised in Table 9.
Table 9. Main destinations (and share of them) of exported tractors from EU-15 and EU-10 to EU-15, EU-10 and outside of EU-25 in 2003 (after [21]).
Tractors leaving the fleet of EU-15 countries
Tractors leaving the fleet of EU-10 countries
Share exported to EU-15
27% 10%
Share exported to EU-10
18% 9%
Share exported outside of EU-25
55% 81%
TOTAL 100% 100%
Comparing the absolute values of the MCV export with previous calculation presented in Table 5, it was determined that exported MCV from EU-15 countries represent in 2003 75% of the MCV leaving the fleet in EU-15 countries. In EU-10 countries, this share was estimated to 53%.
Detailed export data from a few EU-15 countries
Table 10 summarises some more detailed information on destinations for export of tractors for 6 large EU-15 countries in 2004.
Table 10. Three main destinations (and share of them) for used tractors from six EU-15 countries in 2004 (after [21]).
Origin country
1st rank 2nd rank 3 rd rank
Country % Country % Country %
Germany Poland 10,2 Russia 10,2 Jordan 9,4
France Poland 23 Belgium 12 Germany 9
UK Malaysia 15,4 Tanzania 10,9 Kenya 9,6
Spain Morocco 25,5 Syria 16 Netherlands 14,3
Netherlands Russia 15,8 United Arab
Emirates 9,2 Nigeria 8,7
Belgium No data No data No data
Detailed import data into a few EU-10 countries
Statistics of only three EU-10 countries (i.e. Poland, Czech Republic and Hungary) have been analysed. Their population in 1995 represented more than 78% of the population of EU-10 group, and they should therefore be representative of the situation in the region.
Table 11.Three main origins (and share of them) for importation of used tractors to three EU-10 countries in 2004.
1st rank 2nd rank 3 rd rank
Destination country
Origin country
% Origin
country %
Origin country
%

EAA/UTT Study – Final report 26
Poland France 35 Germany 30 Netherlands 14
Czech republic
Germany 51 Belgium 13 Slovakia 12
Hungary Germany 47 France 14 Netherlands 13
b) For used NMCV
General data
Table 12.Share of NMCV coming from EU-15 and EU-10 countries exported to EU-15, EU-10 and outside of EU-25 (after [21])
Trailers and semi-trailers leaving the fleet
of EU-15 countries
Trailers and semi-trailers leaving the fleet of EU-10
countries
To EU-15 32% 10%
To EU-10 21% 10%
Outside EU-25 47% 80%
TOTAL 100% 100%
Comparing the absolute values of the NMCV export with previous calculation presented in Table 5, it was determined that exported NMCV from EU-15 countries represent in 2003 57% of the NMCV leaving the fleet in EU-15 countries. In EU-10 countries, this share was estimated to 53%.
It should be recalled that these data will be adapted in the following sections by experts views to be specific to aluminium-concentrated NMCV.
Detailed export data for a few EU-15 countries
Table 13.Three main destinations (and share of them) for used trailers and semi-trailers from six EU countries in 2004.
Origin country
1st rank 2nd rank 3 rd rank
Country % Country % Country %
Germany Poland 16,6 Russia 12,9 Netherlands 10,9
France Poland 20 Germany 9 Spain 8
UK Ireland 28,7 United Arab
Emirates 12,3 Russia 6,7
Spain Morocco 59,8 Algeria 9,6 Italy 4,1
Netherlands Russia 22,7 Ukraine 8,8 Poland 5,8
Belgium Netherlands 15,3 Russia 6,1 Poland 6,1
Detailed import data into a few EU-10 countries
Table 14.Three main origin (and share of them) for importation of used trailers and semi-trailers from three new accessing countries to EU-25 in 2004.
1st rank 2nd rank 3 rd rank
Destination country
Origin country %
Origin country
Destination country
Origin country %
Poland Germany 26 Belgium 21 Russia 12
Czech republic Slovakia 30 Syria 22 Germany 19
Hungary Belgium 60 Slovenia 16 Germany 14

EAA/UTT Study – Final report 27
c) Main conclusions concerning trade and use of CV from EU-25
After the analysis of import/export data (in particular summarised in Tables 10, 11, 13 and 14), four categories of countries in the EU-15 can be identified:
• countries (e.g. France) that imports very few used CV vehicles and export a lot of them; most of the fleet output seems to be exported,
• countries (e.g. UK) that import and export a lot of used CV vehicles,
• countries (e.g. Germany, the Netherlands) that import a lot of used CV vehicles and export also a lot of them; they can even export more CV vehicles than actually do leave the fleet: it is highly possible that such countries do lead very active trading activities between some EU-25 countries and some less developed countries (e.g. Africa),
• countries (e.g. Spain) that imports a lot of used CV vehicles and export very few of them; in these countries, it seems that most of CV vehicles are used until they reach their technical end-of-life.
The differences in behaviours for using CV among EU-25 countries seem confirmed by figures about the age of CV in use in EU-25 countries. After the analysis of Figure 12 and 13, several categories of EU-10 countries can be identified:
• group of countries (e.g. Lithuania, Latvia, Poland, Hungary), with quite old CV vehicles,
• group of countries (e.g. Italy, Spain, U.K., Belgium, Czech Republic) with younger CV vehicles,
• group of countries (e.g. Germany, France, the Netherlands) with recent CV vehicles.
0%
10%
20%
30%
40%
50%
60%
70%
80%
90%
100%
Bel
gium
Cze
ch re
public
Ger
man
y
Spai
n
France
Italy
Latvi
a
Lithuan
ia
Luxem
bourg
Hungar
y
Net
herla
nds
Pola
ndU.K
.
1999
2003
Figure 12. Share of tractors in the fleet being older than 10 years old in 1999 and 2003 in thirteen EU-25 countries.

EAA/UTT Study – Final report 28
0%
10%
20%
30%
40%
50%
60%
70%
80%
90%
100%
Bel
gium
Cze
ch re
public
Ger
man
y
Spai
n
France
Italy
Latvi
a
Lithuan
ia
Luxem
bourg
Hungar
y
Net
herla
nds
Pola
ndU.K
.
1999
2003
Figure 13.Share of rigid trucks in the fleet being older than 10 years old in 1999 and 2003 in thirteen EU-25 countries.
After the previous paragraphs, the following conclusions can be drawn:
• there are some important inter-borders movement between EU-15 countries (e.g. between France and Belgium, France and Spain, Germany and the Netherlands),
• Poland is the biggest importer of used CV from former EU-15 countries,
• Russia is the biggest trading partner for these countries, followed by Ukraine, African countries, and Middle East countries.
III.3. Summary In this Section, the data obtained from statistics were used to calculate the following figures:
• the number of CV (and quantity of aluminium embodied) leaving the fleets in France and in EU-25 countries;
• the number of CV (and quantity of aluminium embodied) exported from EU-25 countries for re-use in other countries.

EAA/UTT Study – Final report 29
IV. Main findings of the qualitative approach
IV.1. Methodology
1. Why leading a qualitative approach?
After a first analysis of obtained quantitative information and first consultation of experts, we quickly understood that collecting and analysing quantitative information would not be enough to lead our study because:
• crucial information is not included in statistics: for example, there is no statistics for the quantity of CV stored on transport companies yards and on the duration of this storage; moreover, very limited information on processes like dismantling and shredding is available in the literature,
• statistics do not report specific information for aluminium from CV,
• recent as well as future trends are hardly captured by statistics,
• reasons for current practices can only be understood through consultation of relevant actors and experts.
Therefore, we decided to lead a wide consultation of actors to collect their point of views. This consultation was very rich in terms of relevant information collected and we therefore decided to report it in this section as much accurately as possible.
2. Classification of consulted actors
Several categories of actors were consulted. These categories are relevant for each stage of the life cycle of CV, namely:
• for the production and distribution stages of new CV: manufacturers of CV;
• for the use stage: users of CV, i.e. transport companies;
• for the distribution stage of second-hand CV: re-seller/exporters of CV;
• for the EoL stage: dismantlers of CV; shredder/metal traders; aluminium refiner/remelters.
These life cycle stages and actors are summarised in Figure 14.

EAA/UTT Study – Final report 30
Production /
Distribution of new CV
Use
Distribution of
second-hand CV
End-of-life
• Manufacturer
• Transporter
• Re-seller /
exporter
• Dismantler
• Shredder
• Metal trader
• Refiner/Remelter
Typical life cycle stages
of a commercial vehicle
Actors involved along the
commercial vehicle life cycle
Figure 14. Actors along the typical life cycle of commercial vehicles.
Moreover, “experts” of the EoL vehicles and aluminium recycling issues, i.e. persons who are knowledgeable but who do not actively take part to any stage of the CV life cycle) have been consulted. These experts are: Carcoserco, the French Federation of NMCV manufacturers [22]; BVSF, the British Vehicles Salvage Federation [23]; the CNPA, the French National Council for automotive professions [24]; the Polish Academy of Science [25] and Tuvpol [19] that led in the past some work on EoL vehicles in Poland; Autonomous University of de Barcelona (Spain), that leads some studies on EoL vehicles in Spain [26]. Many other experts of EoL vehicles and aluminium recovery have been consulted by emails or by phone but their feedback was very limited and are therefore not included into this report.
3. Sampling and representativeness of consulted actors
The sampling method and representativeness of the sample is always a key issue of any survey study. It is discussed in this paragraph.
a) Countries considered
Many interviews and visits of actors were organised in France. We explained our choice by the following facts:
• France is today one of the three largest user of CV in Europe, with Germany and the UK (after [1]),
• France is the most important user of aluminium NMCV in Europe [6],
• more pragmatically, as the team leading this study is located in France and knows well the French EoL vehicles recovery system, it was decided to first validate the methodology on a small-scale system (i.e. France) before extending it to EU-25; using such an approach, we also were able to identify relevant contacts in foreign countries while keeping costs at an acceptable level.
Germany, UK and Italy that are three major CV users were not deeply consulted although a few contacts were taken.
Countries like the Netherlands and Belgium were considered. Although they are not major CV user in Europe (they were sixth and seventh in number of registrations in 2005 respectively [1]), these countries traditionally are very dynamic in the transport sector, in the vehicles trading activity, as well as in the recycling activity.

EAA/UTT Study – Final report 31
Spain, that is today the fourth largest CV user (after [1]), was chosen since the country was characterised in the nineties by a very strong growth in the transport industry. Spain used to be a major importer of used CV from Germany and France [27]. Spain is also a typical country from Southern Europe. However, although we contacted major companies like the NMCV manufacturer Leciñena, the shredder Viuda de Lauro Clariana in Barcelona, the dismantler Autorec in Barcelona, we had very little cooperation from Spanish actors. According to our European experience on recycling, a limited cooperation of companies from countries like Italy, Spain or Portugal is usual and is always disappointing compared to the cooperation from Northern countries like Germany, Belgium or the Netherlands.
After analysis of statistics and of the first round of consultation, it quickly appeared that Poland is a main destination for used CV in Europe. It was therefore decided to lead a detailed survey in this country. Poland is also –by far- the most populated country in EU-10 and is therefore representative of theses countries.
Manufacturers from Sweden were also consulted.
b) Method
For the identification of relevant actors, we used the following methodology:
• we consulted our contacts known from conference, literature (for example [28]) or previous projects to get relevant information and contacts; we also used contacts communicated by EAA; for countries like Poland and Spain, we used in particular our academic network; internet search were made to identify relevant CV retailers;
• after identification of an interesting actor, a first phone conversation was organised; through a limited number of questions, the relevance and the willingness to cooperate of the actor was assessed, and if found relevant, a visit or an interview was organised;
• during visits or interviews, questionnaires (cf. examples of questionnaires in Appendix 2) were filled-in; if possible, information (in particular name and localisation) on competitors, suppliers and customers were collected;
• the relevance of the partners was later assessed using simple criteria like: position on the national / European market; size of the activity; share of the market; age of the company; ISO 90000 / ISO 14001 certification; etc. In case of necessity, this information could be used to identify the most representative or trustable actor.
In the presentation of results in the following paragraphs, when available, information on the relevance of consulted actors is given.
The approach we led is therefore a mix of survey and enquiry.
4. List and localisation of consulted actors
Lists of actors that accepted to answer our questions are presented in Table 15. Geographical localisation of these actors is represented in Figure 15.

EAA/UTT Study – Final report 32
Table 15. List of interviewed actors.
Manufacturer
Transport
company Dismantler
Shredder/ Metal
trader
Seller/
exporter Expert Motorised CV Non-motorised CV
1 Autos Poland ✓ ✓ ✓ Visit
2 Bartin France ✓ ✓ Visit
3 Benalu France ✓ ✓ Visit by EAA
4 Bourbie France ✓ ✓ ✓ ✓ ✓ Phone interview
5 BVSF UK ✓ ✓ ✓ Phone interview
6 CARCOSERCO France ✓ ✓ Phone interview
7 CE.DE.RE France ✓ ✓ ✓ Phone interview
8 CFF Recycling France ✓ ✓ ✓ Visit
9 Fruehauf France ✓ Visit
10 Galoo Recycling France ✓ ✓ ✓ Visit
11 Godefroy France ✓ ✓ ✓ Phone interview
12 ICC France ✓ ✓ Phone interview
13 Kleyn Trucks Netherlands ✓ ✓ ✓ Phone interview
14 Lecineña Spain ✓ ✓ Phone interview
15 Mabo France ✓ ✓ ✓ Visit
16 Meierling Germany ✓ ✓ Phone interview
17 Menci Italy ✓ ✓ Phone interview
18 Noetzel Poland ✓ ✓ ✓ Visit
19 Polish Academy of Science Poland ✓ Visit
20 Poulalion France ✓ ✓ ✓ ✓ Phone interview
21 Renault Trucks - Brittany France ✓ ✓ Phone interview
22 Renault Trucks - Lyon France ✓ ✓ Visit
23 Scania France ✓ ✓ Phone interview
24 SITRA France France ✓ ✓ ✓ Visit
25
Skawina / Institutre of Non-
Ferrous Metal Poland ✓ ✓ ✓ Phone interview
26 STAS Belgium ✓ ✓ Visit
27 Turbo-Hoet France ✓ ✓ ✓ Visit
28 Turbo-Hoet Belgium ✓ ✓ ✓ ✓ ✓ Visit
29 Tuvpol Poland ✓ ✓
30
Universidad Autonoma de
Barcelona Spain ✓ ✓ ✓ Visit
31 Volvo Trucks Sweden ✓ ✓ Phone interview
Interview/ visit# Name
Type of CV
Country
Type of activity

EAA/UTT Study – Final report 33
1,18
2,9, 20
3,10, 11,12, 24, 27
4, 22
5 6,8,14, 15
21
13
16 29 19,25
7
14 30
17
23
26,28 31
Figure 15. Geographical localisation of consulted actors in Europe.
IV.2. Results of the interviews / surveys Results of the survey are presented in this paragraph for each category of actors.
1. Points of view of CV manufacturers
a) Consulted companies
Manufacturers of CV do usually control distribution networks and therefore represent the production and distribution stages. In this paragraph, points of view of manufacturers of MCV and of manufacturers of NMCV are presented separately.
The following MCV manufacturers have been consulted: Renault Trucks, Scania and Volvo. In 2005, these manufacturers were respectively fifth, seventh and fourth manufacturers of MCV in Europe (after [1]). Moreover, Scania and Volvo are known to be the most advanced manufacturers for the use of aluminium in CV [6].
The following NMCV manufacturers have been consulted: Benalu, Leciñena2, Meierling, Menci and Stas. It is estimated by EAA that around 25 manufacturers of aluminium-concentrated NMCV do operate in Europe [6]. Benalu and Stas are known to be the number one and the number two of the activity in Europe, while Leciñena, Meierling and Menci are number 1 respectively in Spain, Germany and Italy.
b) Fate of MCV
Lives of CV
2 During the study, Leciñena was in the process of transferring its aluminium chassis production line to its partner Granalu. This transfer has been completed mid-2006.

EAA/UTT Study – Final report 34
Manufacturers do usually keep strong maintenance contacts with their customers as up to 30% of customers do have maintenance contracts [7]. However, most (if not all) manufacturers of CV do not have a clear picture about the fate of used MCV in Europe. In particular, they do not know how many MCV are actually recycled in EU every year. It seems that for manufacturers’ distribution networks, CV older than 5 years are usually not anymore interesting in Western Europe [8]. According to manufacturers, a MCV can cover more than 1,000,000 km during its life.
It is believed by most manufacturers that MCV put on the market in Western Europe do usually have several lives (after [7, 29, 30]):
• a first life of 3 to 5 years in Western Europe, when there are used intensively for long distance transport; during this period, the maintenance is limited and the average distance covered is 150,000 km per year; they are usually sold to avoid long maintenance halting;
• then:
o either a second life of 6 to 7 years in Western Europe when they are used less intensively and for shorter distance; this is due to increased maintenance; the average distance covered is 50 000 km per year; the share of MCV having this second life is estimated to around 60% [29];
o or a second life in Eastern Europe (i.e. new EU-25 members or Russia and Ukraine) when they are used less intensively as low labour costs compensate longer maintenance periods; the share of MCV having this second life is estimated to around 40% [29];
• then, if the MCV stays in Western Europe for its second life, it can have a third life in Eastern Europe or in Africa. An internal study by Renault Trucks showed that 80% of the MCV are exported for re-use after their second life; the rest is either stored, as a source of second-hand part, or dismantled/recycled [7].
Other manufacturers develop long duration leasing activity [30], especially for large transport companies. In such an economic system, MCV are used during three to four years. After this period, for example in France, around 40-45% of the MCV are re-used in the same country, while 55-60% is exported. Most of these exports (around 90%) are sent to Poland and Russia, and the rest to other EU-25 countries or to Northern or Sub-Saharian Africa [30].
Extraction of parts from MCV
The extraction of parts and its re-use as “standard exchange” is encouraged by a few manufacturers: for example, Renault Trucks owns a dismantling plant in Limoges (France) for this purpose [7]. However, no quantitative information is available on the size of the activity.
Future trends for treatment of MCV
Concerning future development, some think that some transport regulations (e.g. Maximum Gross Vehicles Weight regulations, and EURO 4 & 5 emissions standards), could favour tractors with new engine technologies and therefore imply an acceleration of some MCV obsolescence [7]. This would imply periodic discharges of used MCV in other countries.
Few manufacturers have clear ideas on whether EoL commercial vehicles should be treated by specific recovery networks or if it should be treated by EoL passenger cars recovery networks, obviously after little adaptations. Renault Trucks seems to favour the second option [7].
c) Fate of NMCV
All consulted manufacturers did declare to have either no [31] or little information [32, 33] on the fate of used and EoL trailers and semi-trailers. Indeed, NMCV manufacturers very rarely takes back trailers from customers after their first use [22, 32]. Benalu thinks that

EAA/UTT Study – Final report 35
aluminium concentrated NMCV are after their use either exported, or used for storage, or cut into pieces and recycled. According to Meierling, NMCV are mainly exported for re-use [33].
After some telephone exchanges with Leciñena, we understood that this manufacturer regularly takes back trailers from customers and re-sells them [34]. However, we were not able to visit the plant and it was not possible to estimate the flows and the destinations. Apparently, Menci leads the same activity with its semi-trailers in Italy, but again it was not possible to estimate the flows [35].
d) General comments
Although manufacturers do announce large recycled contents for aluminium materials (cf. e.g. [36] and [7]), although they have led some studies in the past (according to [7], Renault Trucks has led in the past some studies where recycling rates were calculated for various types of MCV) and although they do communicate on EoL treatment of CV (cf. [37]), our survey showed that little is known on the actual current EoL treatment of CV. All consulted CV manufacturers therefore declared to be interested by the results of the study.
2. Points of view of transport companies
a) Consulted companies
Points of views of users of CV were also collected through interviews. For this category of actors, we were not able to consider representativeness matters and we used contacts communicated by EAA and other experts.
The following transport companies were consulted: Transport Godefroy (France, using mainly aluminium NMCV), Sitra (France, using mainly steel concentrated NMCV), Noetzel (Poland, using mainly aluminium NMCV). These companies range from small to medium size transport companies and their activity is transport of bulk and of liquid goods. Noetzel is a small family-owned transport company (only 10 MCV and 10 NMCV are owned) and according to an expert, it is representative of the polish transport industry [38]. To illustrate this issue, the repartition of transport companies by size for three European countries (Czech Republik, France and Poland) is represented on Figure 16.
Moreover, the logistic department of the recycling company Bourbié was interviewed, and two transport companies mainly using aluminium NMCV usually contracted by CFF Recycling were consulted by phone during the CFF visit.

EAA/UTT Study – Final report 36
0%
10%
20%
30%
40%
50%
60%
70%
80%
90%
100%
Czech republic France Poland
20 employees and more
Between 10 and 19 employees
Between 1 and 9 employees
Figure 16. Repartition of transport companies according to the number of employees in three countries: Czech Republic, France and Poland in 2004 (after [16]).
b) Considerations on the life duration of CV and on the benefits of aluminium NMCV
In Europe, it is usually acknowledged that NMCV can expect twice the life duration of MCV [6]. This rule was confirmed by a transport company (see [39]). However, there are obviously variations as Godefroy acknowledges to cover around 100,000km / year with its semi-trailers and to usually keep it around 12 years [40], while Sitra and Bourbié keep trailers up to 15 years [39, 41]. The Polish transport company argues that the age and the mileage of the NMCV are not very important: for example it uses today aluminium trailers that were commercialised from 1986 to 1996, and can still cover up to 150 000 km / year. This company renews a trailer only if it is either corroded or cracked. The duration of the NMCV depends indeed on its use and its maintenance [42].
In conclusion, it seems that there is no perfect rule for the NMCV life duration, as it mainly depends upon the way the vehicle is used [22].
c) Considerations on the benefits of aluminium NMCV
The Polish commercial road transport sector has been developing very strongly in the last years. This can be explained by the following reasons:
• since the beginning of the nineties, there has been a switch in Poland main commercial partners: Western Europe (in particular Germany and France) replaced Russia and Czech Republic as main commercial partners [19, 43],
• the economic activity in Poland is not anymore in the north and the south region but is much more diversified in all regions of Poland [42],
• the transport of goods by train is not anymore competitive [25],
• labour costs in Poland are much more competitive in Poland than in Western Europe [25].
Considering the latter, Mr Noetzel argues that polish transport companies are very found of second-hand aluminium NMCV coming from Western Europe as their quality and

EAA/UTT Study – Final report 37
state are usually good for a competitive price. It seems that very few NMCV are bought brand new in Poland [42]. As an example, a used Benalu trailer costs in Poland around 40% of the price of a new one. Maintenance of aluminium NMCV is usually made by transport companies themselves.
Therefore, it seems that the fleet in new EU-25 countries is older than in Western Europe. This is confirmed in the figures 12 and 13 presented in Section III.2.
Also, the fact that in Poland, transport costs are calculated only in function of weight for mass transport, and not in function of the transport mileage, is a very good driver for the development of aluminium NMCV. A recent law voted in 2003 decreased the weight limit from 42 tons to 40 tons for NMCV first registered in Poland in 2003: this is also a good driver for the development of aluminium concentrated NMCV [38, 42].
Mr Noetzel also argues that to have good quality NMCV, polish transport companies go directly to find them in Western Europe as there are very few sellers of good quality trailers in Poland [42].
Other benefits of using aluminium NMCV are that painting maintenance is usually very limited and that they keep good value with time [42].
d) Fate of used CV
Godefroy company confirms that MCV are usually resold for further use while its aluminium NMCV are usually cut into pieces by its own employees; the obtained aluminium is sold on the market [40]. Sitra confirms that MCV are exported to Eastern Europe for re-use [41].
Noetzel transport acknowledges a similar fate for its CV that are re-exported to Africa for re-use through a Belgian intermediary. Mr Noetzel acknowledges that its aluminium NMCV are used by him until their technical end-of-life and are then sold to the local metal trader; the latter then cuts NMCV into pieces and resells the material on the market for recycling. He thinks that this fate is quite common in Poland and he is not aware of any NMCV re-use network in e.g. Ukraine or Russia [42]. According to two experts, the NMCV fate described by Mr Noetzel seems representative of the situation in Poland as well as in other EU-10 countries [19, 38].
A quick survey among transport companies contracted by CFF confirmed that many transport companies in Western Europe drive aluminium NMCV until the end of their technical life and then cut them by themselves and sell the aluminium on the metal market [44].
It was established during two visits that transport companies can keep for a few years used NMCV on their yards for bulk storage [22, 39, 41]. However, it seems that such storage behaviour is much more important for steel concentrated NMCV than for aluminium-concentrated. We therefore conclude that storage of aluminium NMCV is very rare.
Carcoserco argues that the export for re-use of used MCV is more economically profitable than NMCV [22].

EAA/UTT Study – Final report 38
Figure 17. A 1988 Ova trailer in use at a small transport company in the North of Poland. The tipping body is made of aluminium while the chassis is made of steel.
Figure 18. Detail of the 1988 Ova trailer.
3. Points of views of sellers/exporters/importers
a) Consulted companies
The following sellers, exporters and importers of CV were consulted: Kleyn (the Netherlands), Fruehauf (France), Mabo (France), MVI (France) Poulalion (France), and ICC (France). In term of representativeness, Kleyn is one of the five biggest exporters of CV in Europe, while Fruehauf is one of the three largest sellers of used NMCV in France. Poulalion, Mabo, and ICC were consulted because of their respectability in the profession and/or because of their good knowledge of export of CV to African countries.
b) Age of exported CV and main destinations
According to Kleyn [45]:
• most of tractors are exported after 5 to 7 years of intensive use, i.e. 125,000km/year,

EAA/UTT Study – Final report 39
• most rigid trucks are exported after longer use (i.e. 7 to 9 years) under less intensive use, i.e. 80,000 to 100,000 km/year,
• most trailers and semi-trailers are usually exported when older, respectively 10 to 15 years and 8 to 12 years.
For several exporters, main destination countries seem to be, in order, Eastern Europe, Middle East, Africa and EU-15 countries [45, 46].
A 20 years old steel cittern can still be sold to African countries for 10% of its original price [47]. 20 to 30 years old CV can be sold to African countries where they can be used for another 3 to 6 years [48]. The market for very old CV seems very large in Africa because of very low costs but the offer from Western Europe is not big enough. It is believed that the stock of very old vehicles therefore decreased strongly in the last years in Western Europe [48]. However, some believe that recently young African entrepreneurs have been buying younger CV in preparation of longer use [46].
However, despite these general figures, most exporters argue that the legislation varies strongly among importing countries [45] [47]: for example today, Polish and Senegalese customs only allow the importation of CV younger than 10 years while Tunisia only accepts CV younger than 5 years [47, 48]. Rules in countries like Mali and Congo are much less stringent. In the future, the export of very old CV will probably be harder because of more stringent importing countries legislation [48].
All recognise that Poland is the biggest importer of CV. Some think that this fact is however slowly changing as polish entrepreneurs are now richer and can buy new CV. Such trend is confirmed by a Polish expert [19]. The situation is also evolving as NMCV manufacturing activity is developing in Poland [22, 46].
c) Reasons for aluminium to be appreciated
According to some sellers / exporters, aluminium is a “noble material” that is well appreciated in NMCV by transport companies because of its durability (the resistance to corrosion can bring life duration up to 25 years), because of the weight efficiency, and also because it keeps good value and can be resold to a good price after use [27].
Figure 19. Several Aluminium trailers stored on the Fruehauf plant in Auxerre, France.

EAA/UTT Study – Final report 40
d) Fate of aluminium NMCV after use
Most exporters believe that aluminium NMCV are very seldom stored after use: they are either exported for re-use or recycled [27, 47].
In France, it is estimated that used aluminium NMCV are resold to other users in France (70%) while 30% are reported. The main destinations for this export are Poland (around 45% of the flow), Russia and Ukraine (40% of the flow), Baltic countries and Spain. Spain used to be the most important importer of used NMCV in the nineties but Spanish transport companies are now richer enough to buy new equipments [27]. It is believed that no (or an extremely limited number) aluminium NMCV are exported to Africa: African users do not have maintenance equipment (in particular soldering equipment) for this type of NMCV [27, 47]. One exporter thinks that the market for second-hand aluminium NMCV is however emerging in Africa [47].
Some of them acknowledge to not have clear ideas of the fate of NMCV when they reach the end of their technical life (cf. e.g. [45]).
4. Points of view of CV dismantlers
a) Consulted companies
In France, it is estimated that between 20 to 30 companies do operate dismantling plants for CV [24]. This activity seems to be quite peculiar and when consulting actors by phone it was not easy to get answers: we had very strong difficulties to get in touch with many of them, in particular the largest or the most respected ones. This could be explained by the fact that the dismantling activity usually is not a very qualified activity and is strongly oriented to day-to-day and local business: most dismantlers either do not have time to receive us or do not understand their potential interests of taking part to an academic study. It should also be added that the market of second-hand parts is very lucrative and is not always run into legal limits.
We obtained answers from the following companies: CE.DE.RE (France), Poulalion (France), Turbo Hoet France (France), Turbo Hoet Belgium (Belgium). Major dismantling companies like Autorec located in the vicinity of Barcelona (Spain) and Lacene (close to Toulouse, France) were also contacted but they did not accept to answer our questions. Considering this, representativeness matters were not taken into account for these actors.
It should be added that the CV dismantling activity is facing in France major difficulties due to stricter environmental controls from the authorities [46, 47]. Only one actor spoke up for having all authorisations to operate [49].
It was not possible to get information on the dismantling activity in EU-10 countries. It was found out through expert consultations that there are a large number of dismantlers in Poland but not much information is available on their practices as they are not well professionalized [19]. Also, the great majority of these dismantlers do not operate using environmental standards [25].
b) Information on the dismantling process
CV received by dismantlers are either injured young CV coming from insurance companies [50] or old CV that have been being used on small transport companies yards as bulk storages for many years [49].
After extraction of fluids, valuable parts are usually extracted from MCV, including motors, gear boxes, axles, wheels, tanks, air pressure vessels, braking systems, electrical systems and driver’ cabs [49, 50]. Parts are obviously only extracted if they are easily accessible and if their value is good on the re-use market. The dismantling of some parts can take up to 4 hours [49]. The remaining mass of the carcass can be as low as 45% of the weight of the initial CV if all valuable parts are extracted. All dismantled parts are intended to re-use and not to recycling [49]. For small aluminium components, the cost of extraction is often high and consequently they are left on the body [23].

EAA/UTT Study – Final report 41
In Western Europe, for parts extracted from recent CV, the market for parts is usually the country where the dismantling is happening. However, around 30% of parts are exported, mainly to Eastern Europe (in particular Poland) [50, 51]. The export of parts to countries outside of EU-25 (e.g. Russia or Africa) is usually quite low, i.e. around 5% [51]. There is little export to Africa of new parts because of their too high price. Parts extracted from older CV are only exported to foreign markets, i.e. Eastern Europe, Africa, and the Middle East [50].
Some aluminium concentrated parts, e.g. motors, can be sold to the local metal dealer and sometimes directly to the remelters as furnace feed [49].
After dismantling all the valuable parts for re-use, the body is usually sent to the local shredder (i.e. Galloo for Turbo Hoet [50]) or to the local metal dealer [46, 52] for further treatment: oxyacetylene cutting, shearing or shredding. It is believed that a small fraction of aluminium still remains in this carcass [49].
Such dismantling plants can also rebuild some CV for export [50], and can therefore be considered as exporters.
Unfortunately, few specific information was collected on the dismantling of NMCV.
Figure 20. A view of an indoor dismantling plant for MCV located in Evreux region, France.

EAA/UTT Study – Final report 42
Figure 21. An injured MCV as it can be received at a dismantling plant, here in Roncq, France.
Figure 22. Some aluminium rims extracted from injured CV ready to be re-sold, here in Roncq, France.
Figure 23. One aluminium tank extracted from an injured CV, here in Roncq, France.
Figure 24. Bodies of injured CV after the extraction of all valuable parts; the body is ready to be sent to the local shredder; here in
Roncq, France.

EAA/UTT Study – Final report 43
5. Points of view shredders and remelters
a) Consulted companies
The following companies were consulted: Metal Giron of the Bartin Group (France), Galloo (France), CFF Recycling (France), and Bourbie (France). The three first companies are companies that shred all types of EoL products and vehicles. All of them are leading companies in the shredding activity in France and Europe. The two last companies are specialised in the treatment, the preparation and the trading of aluminium scrap coming form EoL products.
It was originally considered that remelters would not be consulted as they hardly would have any information on CV fates. However, in Poland, we consulted a specialist of the remelting activity, Mr Stuczynski, of the Institute of Non-Ferrous Metals in Skawina (Poland).
b) Information on the processes used for MCV
Shredders acknowledge to treat very small quantity of MCV [53] and other public works equipment, that are always out of order. It is very difficult to establish the quantity as shredders do buy weight and not units of products: therefore accurate products statistics cannot be retrieved. Galloo estimates this quantity to several hundred every year. In the past, one batch of 200 MCV from NATO had been treated at Galloo plant [53].
The cabin of MCV is usually shredded, and the rest is usually cut using oxyacetylene cutting, or sheared. Some aluminium concentrated parts like carters, pistons, radiators, tanks, bumpers are extracted and oriented to the non-ferrous treatment line. It is estimated that around 1% of the aluminium is lost in the sorting processes. Shredding of the whole MCV is indeed not possible because of the thickness of some sheets or because of the presence of fluids and or explosive substances [53].
Large parts of MCV, e.g. motors or gear boxes, seem to be too big to be sent to the shredder [44, 54]: the parts are actually liberated using simple tools like so-called “balls” (cf. Figure 32).
c) Information on the processes used for NMCV
A company declared to sometimes collect NMCV from transport companies, treat and prepare for further treatment large aluminium parts coming from EoL bodywork, extruded sections and tipper bodies. For such event, the company usually brings the portative shearing machine to the supplier’s plant and separates aluminium parts from other parts. The aluminium parts are then brought to the shredding plant where they are prepared (non-aluminium parts are extracted to be conform to scrap standards; large aluminium parts are cut into manageable pieces, i.e. around 40cm X 40cm pieces) and then sent to refiners [54]. The activity is however limited on this site as it is estimated to only 50 to 100 tons per year.
d) Fate of aluminium
Galloo has very few customers for its metal outputs. It sells pure aluminium to the local remelter while the mixed aluminium is sent to China or India as it can only be sorted manually [53].
Preparation plants for aluminium scrap like CFF Recycling do receive three types of inputs: laminated aluminium, foundry aluminium and aluminium-concentrated fraction coming from shredders [44]. These inputs usually come from collection plants.
CFF Recycling acknowledges to probably receiving aluminium parts coming from CV but could not assess how much, as it is extremely rare to receive it as such. It was established during the visit that laminated inputs do indeed contain parts coming from CV (cf. Figure 33). The quantity of parts from CV coming to this plant is probably very small [44]. This situation was confirmed by another aluminium preparation company [39].

EAA/UTT Study – Final report 44
Casting parts, coming in particular from MCV are usually liberated using “ball” equipments. Laminated parts, coming in particular from NMCV, are usually shredded or sheared. Casting parts, laminated parts as well as shredder residues are then orientated to sorting processes, i.e. eddy current and flotation sorting process.
After being treated at the preparation plant, the aluminium produced is usually sold to refiners. For CFF case, 35% is sold to national refiners while 65% is exported to the Euro zone.

EAA/UTT Study – Final report 45
Figure 25. General view of aluminium parts extracted from EoL commercial road vehicles at a local metal dealer in Troyes,
France.
Figure 26. Detail view of some aluminium parts (a tipper body) extracted from EoL commercial road vehicles at a local metal
dealer in Troyes, France.
Figure 27. One section of aluminium boards from EoL commercial road vehicles encountered at a local metal dealer in
Troyes, France.
Figure 28. Another section of aluminium boards from EoL commercial road vehicles encountered at a local metal dealer in
Troyes, France.

EAA/UTT Study – Final report 46
Figure 29. Detail view of some aluminium parts (a door) extracted from EoL commercial road vehicles at a local
metal dealer in Troyes, France.
Figure 30. Detail view of some aluminium parts (a tipper body)
extracted from EoL commercial road vehicles at a metal dealer in Troyes,
France.
Figure 31. A shearer in use at a local metal trader in Troyes, France. Such machines are used to prepare large
parts of Aluminium extracted from CVs.
Figure 32. A “ball” used in many local metal dealer to liberate metals in parts
like motors, gear boxes, etc.

EAA/UTT Study – Final report 47
Figure 33. Laminated parts as input of an aluminium preparation plant in Paris region, France. It was observed that this flow
contains some parts coming from CV.
Figure 34. Foundry part as input of an aluminium preparation plant in Paris region, France.
Figure 35. Aluminium concentrated fraction coming from shredders, in Paris region, France.
Figure 36. Aluminium-concentrated parts coming from public works equipment at an aluminium preparation plant in Paris
region, France.

EAA/UTT Study – Final report 48
e) Treatment of aluminium in Poland
Shredders are not well developed in Poland as only 4 of them are currently in use [19, 55]. However, experts do think that the recycling networks will evolve very quickly in Poland in the next 3 to 5 years to come closer to Western Europe standards [19].
An expert of the treatment of scrap aluminium was consulted in Skawina (Poland). He answered in the name of the Polish aluminium remelting industry [43]. It is believed that remelters do surely treat aluminium parts coming from CV. However, any quantitative data are impossible to get because of the structure of this industrial sector in Poland: most of the numerous (maybe 20 medium size companies and at least 60 small companies) remelting companies are small scale family-owned companies and they do not share information.
Scrap received at remelting plants come from local scrap dealers that are very numerous in Poland (they are estimated to more than 1500 in Poland [55]). Again, it is very difficult to obtain any information about this activity as companies are small and as they are known to run legal as well as illegal activities: the sector is reputed to be “dangerous” [19, 42, 43]. These small companies do use cutting technologies (gas, knives), sorting technologies (based on magnetic separation), and shredding technologies.
Although the flows are difficult to assess, Poland is well known as one of the European leaders in Aluminium remelting activity. Consumption of products being still quite limited in Poland, it is usually very difficult to find stable aluminium scrap inflows for remelters ; therefore, it is highly probable that all aluminium scrap collected by local metal dealers is absorbed by polish remelters.
A large quantity of aluminium produced by refiners is consumed by foundry companies that do supply automotive companies like Volkswagen, Toyota, Delphi or Valeo [43]. A good share of it is also exported, most probably to EU-25 countries, e.g. to France and Germany.
In Poland, there is no specific aluminium preparation plant [43].
It is believed that the situation is quite different in Poland neighbour countries like Czeck Republic, Slovakia, Lithuania, Hungary, Ukraine: the remelting and the collection industry is not as developed as in Poland and some Polish investors are seeking opportunities for building new refiners in these countries. Therefore, Poland probably imports large amount of aluminium scrap from these countries. It is estimated that countries like Ukraine might build its own aluminium remelting industry in the next 15 years [43].
f) General comments
The Director of CFF Recycling can definitely be considered as an expert of the fate of aluminium-concentrated EoL products. From his perspective, aluminium NMCV are either exported for re-use or recycled locally. Considering that very little come to his plant, he argues that most of the aluminium NMCV coming to end-of-life are probably cut by the transport companies and sold on the market. They might be sold in small quantities in police-free centres (where the maximum value for a lot is 750€), that means that this amount of aluminium is never declared, and can therefore never be identified on statitics [44].
Only one company, Galloo, communicated on recycling rates obtained at the plant, especially for EoL vehicles. For the calculation, a comprehensive methodology is used, based on MFAs through shredding and sorting processes [53]. This company would be ready to cooperate with EAA for further study on recycling rates.
A shredder like Gallo thinks that recycling rates of CV products can be very high if they are orientated towards efficient shredding processes. The main issue for EoL CV is more the collection of CV. Galloo therefore argues that the development of legislation is the only driver for a real professionalization of the recycling networks. If no legislation exists, the market will not be organised and CV will be most probably exported [53]. This was confirmed by another actor of the activity that consider that aluminium coming from EoL vehicles, in particular CV, when collected, is well recycled as it is has got an excellent economic value [39].

EAA/UTT Study – Final report 49
Galloo thinks that most used tractors from Western Europe are exported outside EU-6 while it hasn’t got any information on the fate of NMCV [53].
In order to treat larger amount of aluminium NMCV, some argues that they would need adapted shearing press [39]
g) Discussion on representativity
It is believed by most of the companies that the situation in France is quite representative of the situation in Western Europe [44].

EAA/UTT Study – Final report 50
V. Material Flow Analysis of aluminium contained in Commercial Vehicles leaving the fleets in EU-25 countries
V.1. Introduction In this part, the results of the quantitative and of the qualitative studies are compiled into MFA graphs. The chapter is organised according to well known MFA recommendations, like the ones contained in [56].
V.2. Basis of the MFA
1. Initial situation
At the start of this study, little was known or at least documented on the fate of aluminium from commercial vehicles used in EU-25. The aim of this MFA is indeed to set a first snapshot of current fate of aluminium from MCV and NMCV based on the analysis of statistics and observation of the industrial activity.
2. Structure of the system
The considered spatial boundary is EU-25. However, strong differences were observed between countries from EU-15 and countries from EU-10. Also, some import/export flows are observed with countries outside EU-25. Therefore, three sub-systems are considered:
• EU-15 sub-system;
• EU-10 sub-system,
• Import/Export with extra EU-25.
After observation of the industrial practices, and several revision of the model to cope with incomplete information, incompatible or missing data, it was decided to consider in each sub-system the following processes:
• use of CV: CV are being driven on European roads;
• storage: CV are stored in the backyard of transport companies and or not allowed to be driven;
• dismantling: this process aims at depolluting the vehicle, extracting parts for re-use and recycling;
• shredding/sorting: this process aims at depolluting and liberating and sorting materials from the vehicle;
• Al refining/remelting: this process aims at recycling aluminium extracted from EoL vehicles and at producing new material; no information on the fate of the output of this process was collected, therefore no output is presented in the graphs.
The structure of the system is summarised in Figure 37 for the sub-system EU-15.

EAA/UTT Study – Final report 51
NMCV in use
shredding /
sorting / trading
Al refiner/remelter
Dismantling
System boundary EU-15
Storage for
other use
Import / Export
Figure 37.Structure of the EU-15 system considered
For the boundary in time, a period of one year is selected because of the use of anthroposphere data (statistics). The results are presented for the reference year 2003. The study team verified through the analysis of previous year that the year 2003 is globally representative of the situation in EU-25.
3. Sources of data and compilation
Several sources of data have been used, mainly quantitative data and qualitative information reported in the previous parts of this report. By definition, MFA is a multidisciplinary task that requires knowledge, information and support from many fields [11]. For this study, the main involved fields were economic statistics but also points of view of recycling / dismantling / material / transport experts.
Considering that this information could be either incomplete or inhomogeneous, a meeting with the persons involved in the data collection was organised. This so called “Expert meeting” aimed at finding a consensus on the values to be used in the input/output shares of each process of the MFA. The consensus was obtained when confronting quantitative and qualitative information. The obtained values were usually rounded, for example to 10%/90%, 75%/25%, or 50%/50%. This approach is summarised in Figure 38.
Collection and analysis of
quantitative informationCollection and analysis of
qualitative information
Expert meeting to define
most trustable values
Values to be used in MFA
Figure 38. Summary of methodology to define trustable values to be used in MFA.
To illustrate this compilation of quantitative and qualitative information, Figure 39 and 40 show which (and how) output data evolve with the implication of expert views for the fate of aluminium NMCV coming from EU-15:
• after analysis Sections IV.2.2.b., IV.2.3.d and IV.2.4.e by experts, the share of aluminium-concentrated NMCV treated locally was set to 65% (it was 43% for all type of NMCV);
• the share of aluminium-concentrated NMCV leaving the fleet of EU-15 and oriented to storage, dismantling, shredding/sorting and remelting/refining were evaluated by experts after analysis of Sections IV.2.2, IV.2.3 and IV.2.4;

EAA/UTT Study – Final report 52
• the share of aluminium leaving storage, dismantling and shredding were evaluated by experts after analysis of Sections IV.2.2, IV.2.3 and IV.2.4.
to 1.1 to 1.2 to 1.3 to 1.4 to 1.5 to 2.1 to 2.2 to 2.3 to 2.4 to 2.5 to 3.1 to 3.2
I
O 18% NA NA NA NA 12% 27%
I
O
I
O
I
O
I
O
Output values before expert views
To Extra-EU-25
In E
U-1
5
1. Use
2. Storage
3. Dismantling
4. Shredding
/sorting
5. Al
remelting/
refining
To EU-15 To EU-10
Sub-system Process I/O
to 1.1 to 1.2 to 1.3 to 1.4 to 1.5 to 2.1 to 2.2 to 2.3 to 2.4 to 2.5 to 3.1 to 3.2
I
O 10% 5% 5% 20% 35% 15% 10%
I
O 75% 25%
I
O 10% 80% 5% 5%
I
O 90% 5% 5%
I
O
Output values after expert views
In E
U-1
5
1. Use
2. Storage
3. Dismantling
4. Shredding
/sorting
5. Al
remelting/
refining
Sub-system Process I/O
To EU-15 To EU-10 To Extra-EU-25
Exp
ert
vie
ws
Figure 39. Illustration of the influence of expert views in the determination of output share for each process of the MFA – Case of aluminium NMCV leaving the fleet in EU-15.

EAA/UTT Study – Final report 53
3.2 Al remelting/refining
1.1 NMCV in use
1.4 Shredding /
sorting / trading
1.5 Al refiner/remelter
1.3 Dismantling
1. System boundary EU-15
1.2 Storage
2.1 NMCV in use
2.4 Shredding /
sorting / trading
2.5 Al refiner/remelter
2.3 Dismantling
2.2 Storage
2. System boundary EU-10
System boundary EU-25
3.1 NMCV in use
10%
5%
5%
20%
35%
15%
10%
Figure 40. Simplified MFA representation of aluminium coming from 100 tons of aluminium-constructed NMCV leaving the fleet in use in EU-15 countries.
4. Hypotheses
The following hypotheses have been considered:
• MFA graphs are computed for the 2003 reference year and the input of most of the processes is equal to the output : therefore, annual variations of stocks are neglected;
• although losses exist for each processes (cf. for example information on losses in sorting process in [57]), they are not expressed in the graph, as no accurate information was available on the considered processes; their existence should however not be forgotten; a study aiming at quantifying the losses of the recovery processes is currently being launched;
• a “depollution” process is not mentioned in the system; it should however be understood that depollution processes are the initial stages of the dismantling and the shredding processes.
5. Information on accuracy of data
This MFA is a first tentative to understand the fate of aluminium coming form CV in EU-25. It was not possible to collect any information on the accuracy of data used in this report.
Available uncertainty information was reported in Part 1 and it can be concluded that there is at least 20% uncertainty on the results presented here.
Also, as pointed out in Section III.1.2, large variations of the number of CV leaving the fleet between years are highly probable and thus should be remembered for the analysis of the MFA.
V.3. Values used for the MFA The consensual values validated during the expert meeting are now presented for each process of the system, each vehicle type (MCV, steel-constructed NMCV and aluminium-

EAA/UTT Study – Final report 54
constructed NMCV) and for the two sub-systems (EU-15/EU-10). Experts think that steel-constructed NMCV follow the same recovery routes as MCV. The values are presented in tables, similar to the tables presented in Figure 39.
1. For MCV and steel-constructed NMCV in EU-15 countries
Table 16. Input / output values validated by experts for each process for MCV and steel-constructed NMCV leaving the EU-15 fleet.
to 1.1 to 1.2 to 1.3 to 1.4 to 1.5 to 2.1 to 2.2 to 2.3 to 2.4 to 2.5 to 3.1 to 3.5I 100%
O % 20% 2% 8% 15% 15% 40%
I 100% %
O % 75% 25%
I 100% %
O % 10% 80% 5% 5%
I 100% %
O % 90% 5% 5%
I 100% %
O %
Unit
To EU-15 To EU-10 To Extra-EU-25
Sub-system Process I/O Input
In E
U-1
5
1. Use
2. Storage
3. Dismantling
4. Shredding
/sorting
5. Al remelting/
refining
2. For aluminium-constructed NMCV in EU-15 countries
Table 17. Input / output values validated by experts for each process for aluminium-constructed NMCV leaving the EU-15 fleet.
to 1.1 to 1.2 to 1.3 to 1.4 to 1.5 to 2.1 to 2.2 to 2.3 to 2.4 to 2.5 to 3.1 to 3.5I 100%
O % 10% 5% 5% 20% 35% 15% 10%
I 100% %
O % 75% 25%
I 100% %
O % 10% 80% 5% 5%
I 100% %
O % 90% 5% 5%
I 100% %
O %
In E
U-1
5
1. Use
2. Storage
3. Dismantling
4. Shredding
/sorting
5. Al remelting/
refining
Sub-system Process I/O Input Unit
To EU-15 To EU-10 To Extra-EU-25
3. For MCV and steel-constructed NMCV in EU-10 countries
Table 18. Input / output values validated by experts for each process for MCV and steel-constructed NMCV leaving the EU-10 fleet.
to 1.1 to 1.2 to 1.3 to 1.4 to 1.5 to 2.1 to 2.2 to 2.3 to 2.4 to 2.5 to 3.1 to 3.5I 100%
O % 5% 5% 25% 15% 50%
I 100% %
O % 75% 25%
I 100% %
O % 20% 60% 15% 5%
I 100% %
O % 5% 90% 5%
I 100% %
O %
Unit
To EU-15 To EU-10 To Extra-EU-25
Sub-system Process I/O Input
In E
U-1
0
1. Use
2. Storage
3. Dismantling
4. Shredding
/sorting
5. Al remelting/
refining
4. For aluminium-constructed NMCV in EU-10 countries
Table 19. Input / output values validated by experts for each process for aluminium-constructed NMCV leaving the EU-10 fleet.

EAA/UTT Study – Final report 55
to 1.1 to 1.2 to 1.3 to 1.4 to 1.5 to 2.1 to 2.2 to 2.3 to 2.4 to 2.5 to 3.1 to 3.5I 100%
O % 5% 5% 5% 25% 35% 25%
I 100% %
O % 75% 25%
I 100% %
O % 20% 60% 15% 5%
I 100% %
O % 5% 90% 5%
I 100% %
O %
In E
U-1
01. Use
2. Storage
3. Dismantling
4. Shredding
/sorting
5. Al remelting/
refining
Sub-system Process I/O Input Unit
To EU-15 To EU-10 To Extra-EU-25
V.4. Results MFA graphs summarising the fate of aluminium coming from commercial vehicles leaving the fleet in EU-15 and EU-10 in 2003 are presented in Figure 41 (for MCV), 42 (for steel-constructed NMCV), and 43 (for aluminium-constructed NMCV). Figure 44 summarises flows of aluminium coming from all types of CV in EU-25 in 2003.
Figures have been rounded because the hypotheses made before had effect on the accuracy.

EAA/UTT Study – Final report 56
Import / Export
MCV in use
shredding /
sorting / trading
Al refiner/remelter
Dismantling
System boundary EU-15
To:
1. RussiaUkraine
2. Africa
Storage
MCV in use
shredding /
sorting / trading
Al refiner/remelter
Dismantling
Storage
System boundary EU-10
10050
1215
335
637
4774
10050
For 67 000 T of Aluminium leaving the
EU-15 MCV fleet and 6 750 T of
aluminium leaving the EU-10 MCV fleet
System boundary EU-25
3375
338
84
1688
388
1164
1013
13643
5360
26800
1005
318
318
758758
318
253
291
97
2035
113
113
To:1. Russia/Ukraine2. Africa
To:1. Russia/Ukraine2. Africa
Import / Export
13400
338
<1000
1000-5000
5000-1000
10000-15000
>15000
Scale
Figure 41. Material Flow Analysis graph summarising the fate of aluminium coming from MCV leaving the fleet of EU-15 and EU-10 (tons in 2003).

EAA/UTT Study – Final report 57
Import / Export
MCV in use
shredding /
sorting / trading
Al refiner/remelter
Dismantling
System boundary EU-15
To:
1. RussiaUkraine
2. Africa
Storage
MCV in use
shredding /
sorting / trading
Al refiner/remelter
Dismantling
Storage
System boundary EU-10
3121
416
104
198
1483
3121
System boundary EU-25
1213
121
30
607
139
418
364
4237
1664
8323
312
99
99
235235
99
91
105
97
731
41
41
To:1. Russia/Ukraine2. Africa
To:1. Russia/Ukraine2. Africa
Import / Export
4161
121
<1000
1000-5000
5000-1000
10000-15000
>15000
Scale
For 20 808 T of aluminium leaving the
EU-15 Fe-constructed NMCV fleet and
2426 T of aluminium leaving the EU-10
Fe-constructed NMCV fleet
Figure 42.Material Flow Analysis graph summarising the fate of aluminium coming from steel-constructed NMCV leaving the fleet of EU-15 and EU-10 (tons in 2003).

EAA/UTT Study – Final report 58
Import / Export
NMCV in use
shredding /
sorting / trading
Al refiner/remelter
Dismantling
System boundary EU-15
To:
1. Russia
2. Ukraine
To:
1. Ukraine; 2: Russia
Storage for
other use
NMCV in use
shredding /
sorting / trading
Al refiner/remelter
Dismantling
Storage for
other use
System boundary EU-10
5603
1868
467
327
2615
13074
7471
System boundary EU-25
1089
218
54
1524
218
76
2291089
9498
1868
3735
1401
163
163
528528
163
57
19
1235
69
69
Import / Export
For 37 355 T of aluminium leaving the
EU-15 Al-constructed NMCV fleet and
4 356 T of aluminium leaving the EU-10
Al-constructed NMCV fleet
<1000
1000-5000
5000-1000
10000-15000
>15000
Scale3735
218
Figure 43. Material Flow Analysis graph summarising the fate of aluminium coming from aluminium-constructed NMCV leaving the fleet of EU-15 and EU-10 (tons in 2003).

EAA/UTT Study – Final report 59
Import / Export
MCV in use
shredding /
sorting / trading
Al refiner/remelter
Dismantling
System boundary EU-15
Storage
MCV in use
shredding /
sorting / trading
Al refiner/remelter
Dismantling
Storage
System boundary EU-10
18774
3499
906
1162
8872
20642
For 138 695 000 T of Aluminium
leaving the EU-25 CV fleet
System boundary EU-25
5677
677
168
2513
603
1811
2466
27378
9162
38858
2718
580
580
15211521
417
507
453
213
4001
223
223
Import / Export
21296
677
<1000
1000-5000
5000-1000
10000-15000
>15000
Scale
Figure 44. Material Flow Analysis graph summarising the fate of aluminium coming from all types of CV fleet in EU-25 (tons in 2003).

EAA/UTT Study – Final report 60

EAA/UTT Study – Final report 61
VI. Conclusions and recommandations Work achieved
The aim of the study that we were entrusted was to know and understand better current and future EoL treatment of aluminium parts from trucks and trailers used in EU-25. Despite very poor information available in the literature, this study was carried out when leading two parallel approaches: the first one was quantity-oriented and aimed at analysing available statistics to establish the quantity of CV leaving the fleets in EU-15 and EU-10 countries, and the quantity of CV being exported within and outside EU-25; the second one was field-oriented and aimed at analysing through interviews and survey of relevant actors the real and current practice of industries in Europe. The last –but not the least- part of the study aimed at compiling through expert validations quantitative and qualitative information in order to obtain reasonable and consensual (among experts) values of input / output of the processes considered. This study was summarised in two graphs representing Flow Analysis of aluminium coming from CV leaving the fleet in EU-25 in the reference year of 2003.
As it is often the case when MFA are performed in a particular field for the first time, this study has been time and money consuming. However, we hope to have produced a quite accurate snapshot of the current situation of the fate of aluminium from CV.
Recommendations for further work
To refine the reliability/sharpness of the MFA
To be more precise, additional human and financial resources will be needed. However, improvement of the MFA should require much less effort because the system has been set-up and basic data have already been collected.
In particular, considering that the sampling of interviewed companies has been questionable for this study, we suggest to lead other qualitative survey when choosing better the partners and considering a larger size of sample: this could be done in consultation with some syndicate. Also, the uncertainty on the input data and on the output data of the model should be evaluated. It could also be interesting to develop a dynamical model of the aluminium flows.
To calculate aluminium recyclablity rates of some CV in the current practices
To answer this more and more crucial question, we suggest to set-up a part 2 of the project in order to study some practical case studies. We therefore suggest:
• purchasing 6 vehicles for the study (2 MCV (1 tractor, 1 rigid truck): recent, after accident; 4 NMCV (1 trailers, 3 semi trailers): old),
• in cooperation with relevant and willing to cooperate partners (e.g. CeDeRe for the dismantling, and Galloo for the shredding), studying and establishing MFA of each process, including losses and destinations
• analysing and calculating vehicles and material recycling rates using recognised and transparent calculation methods.
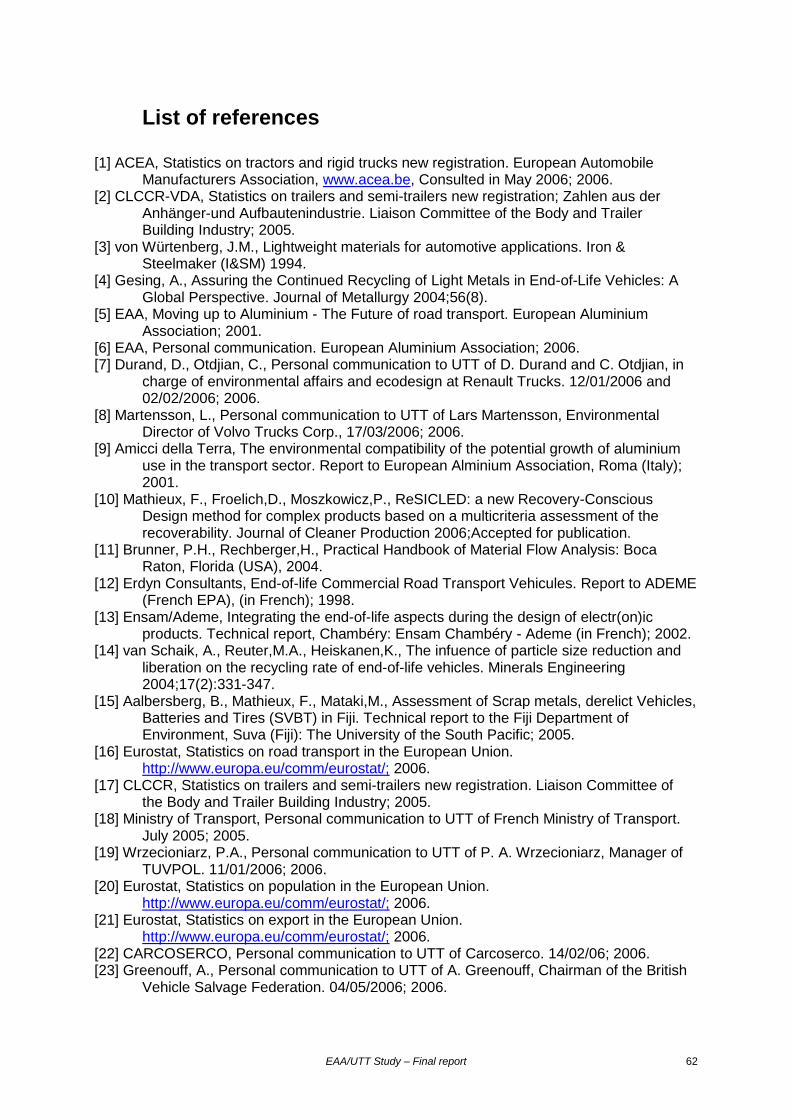
EAA/UTT Study – Final report 62
List of references
[1] ACEA, Statistics on tractors and rigid trucks new registration. European Automobile Manufacturers Association, www.acea.be, Consulted in May 2006; 2006.
[2] CLCCR-VDA, Statistics on trailers and semi-trailers new registration; Zahlen aus der Anhänger-und Aufbautenindustrie. Liaison Committee of the Body and Trailer Building Industry; 2005.
[3] von Würtenberg, J.M., Lightweight materials for automotive applications. Iron & Steelmaker (I&SM) 1994.
[4] Gesing, A., Assuring the Continued Recycling of Light Metals in End-of-Life Vehicles: A Global Perspective. Journal of Metallurgy 2004;56(8).
[5] EAA, Moving up to Aluminium - The Future of road transport. European Aluminium Association; 2001.
[6] EAA, Personal communication. European Aluminium Association; 2006. [7] Durand, D., Otdjian, C., Personal communication to UTT of D. Durand and C. Otdjian, in
charge of environmental affairs and ecodesign at Renault Trucks. 12/01/2006 and 02/02/2006; 2006.
[8] Martensson, L., Personal communication to UTT of Lars Martensson, Environmental Director of Volvo Trucks Corp., 17/03/2006; 2006.
[9] Amicci della Terra, The environmental compatibility of the potential growth of aluminium use in the transport sector. Report to European Alminium Association, Roma (Italy); 2001.
[10] Mathieux, F., Froelich,D., Moszkowicz,P., ReSICLED: a new Recovery-Conscious Design method for complex products based on a multicriteria assessment of the recoverability. Journal of Cleaner Production 2006;Accepted for publication.
[11] Brunner, P.H., Rechberger,H., Practical Handbook of Material Flow Analysis: Boca Raton, Florida (USA), 2004.
[12] Erdyn Consultants, End-of-life Commercial Road Transport Vehicules. Report to ADEME (French EPA), (in French); 1998.
[13] Ensam/Ademe, Integrating the end-of-life aspects during the design of electr(on)ic products. Technical report, Chambéry: Ensam Chambéry - Ademe (in French); 2002.
[14] van Schaik, A., Reuter,M.A., Heiskanen,K., The infuence of particle size reduction and liberation on the recycling rate of end-of-life vehicles. Minerals Engineering 2004;17(2):331-347.
[15] Aalbersberg, B., Mathieux, F., Mataki,M., Assessment of Scrap metals, derelict Vehicles, Batteries and Tires (SVBT) in Fiji. Technical report to the Fiji Department of Environment, Suva (Fiji): The University of the South Pacific; 2005.
[16] Eurostat, Statistics on road transport in the European Union. http://www.europa.eu/comm/eurostat/; 2006.
[17] CLCCR, Statistics on trailers and semi-trailers new registration. Liaison Committee of the Body and Trailer Building Industry; 2005.
[18] Ministry of Transport, Personal communication to UTT of French Ministry of Transport. July 2005; 2005.
[19] Wrzecioniarz, P.A., Personal communication to UTT of P. A. Wrzecioniarz, Manager of TUVPOL. 11/01/2006; 2006.
[20] Eurostat, Statistics on population in the European Union. http://www.europa.eu/comm/eurostat/; 2006.
[21] Eurostat, Statistics on export in the European Union. http://www.europa.eu/comm/eurostat/; 2006.
[22] CARCOSERCO, Personal communication to UTT of Carcoserco. 14/02/06; 2006. [23] Greenouff, A., Personal communication to UTT of A. Greenouff, Chairman of the British
Vehicle Salvage Federation. 04/05/2006; 2006.

EAA/UTT Study – Final report 63
[24] Blut, C., Personal communication to UTT of C. Blut, in charge of Dismantling activity at CNPA, National Council of the Automotive Professions. December 2005; 2006.
[25] Kulczycka, J., Personal communication to UTT of J. Kulczcka, Researcher at the Polish Academy of Science. 10/01/06; 2006.
[26] Munoz, I., Personal communication to UTT and ENSAM of I. Munoz, PhD student ate Autonomous University of Barcelona. October 2005; 2005.
[27] Renault, D., Personal communication to UTT of D. Renault, Director of used vehicles at Fruehauf France. 17/10/05; 2005.
[28] MINEFI, La carosserie industrielle en chiffres - Edition 2005. Caen (France): Ministère de l'Economie et des Finances - Service des Études et des Statistiques Industrielles. ISSN 1625 - 1555; 2005.
[29] Benner, S., Personal communication to UTT of S. Benner, Technical Manager at Renault Trucks Brittany. 26/09/05; 2005.
[30] Iznasmi, K., Baustert, G., Personal communication to UTT of K. Isnasmi, Used Vehicles coordinator and G. Baustert, Communication Manager. 26/09/05; 2005.
[31] Vermoere, K., Personal communication to UTT of Mr Vermoere of N.V. STAS. 09/03/06; 2006.
[32] BENALU, Personal communication to EAA of Benalu. 11/07/05; 2005. [33] Krumsiek, C., Personal communication to UTT of C. Krumsiek, Anhänger- und
Fahrzeugbau Meierling GmbH & Co. 28/02/06; 2006. [34] Dolores, M., Personal communication to ENSAM and UTT of M. Dolores, Export
manager of Lecinena. 2005. [35] Menci, A., Personal communication to UTT of A. Menci, Director of Menci. 15/03/06;
2006. [36] VOLVO, Environmental Product Declaration: Volvo FH12 and Volvo FM12, Euro 3.
http://www.volvo.com/NR/rdonlyres/E8FD3F6B-B06B-4EBE-BA7D-A529AFE0BFD0/0/euro3_03.pdf, accessed on 4/05/06; 2006.
[37] SCANIA, Scania Website - End-of-life treatment. http://www.scania.com/about/the_company/environment/End_of_life_treatment/, accessed on 04/05/2006; 2006.
[38] Albin, W., Personal communication to UTT of W. Albin, Manager of Gdansk branch of Autos, importer of parts for CV. 9/01/06; 2006.
[39] Eglizaud, J., Joumard,D., Personal communication to UTT of J. Eglizaud, Non-ferrous Metals Activity manager, and D. Joumard, Transport Service Manager, at Bourbié. 18/01/06; 2006.
[40] Godefroy, D., Personal communication to UTT of D. Godefroy, Director of Godefroy Transport. 06/10/06; 2005.
[41] Deruyter, M., Personal communication to UTT of M. Deruyter, Plant manager of SITRA France. 16/02/06; 2006.
[42] Noetzel, R., Personal communication to UTT of R. Noetzel, Director of Noetzel Transport. 9/01/06; 2006.
[43] Stuczynski, T., Personal communication to UTT of T. Stuczynski, Project Manager at Institute of Non-Ferrous Metals. 10/01/06; 2006.
[44] Rabotin, H., Personal communication to UTT of H. Rabotin, Manager of the CFF Recyling plant. 13/10/2005; 2006.
[45] Kamsteeg, J., Personal communication to UTT of J. Kamsteeg, Sales Manager at Kleyn Trucks B.V., 15/02/06; 2006.
[46] Poulalion, G., Personal communication to UTT of G. Poulalion, Director og Poulalion S.A., 25/01/06; 2006.
[47] Makharine, A., Personal communication to UTT of A. Makharine, Director of Mabo S.A., 13/10/05; 2005.
[48] ICC, Personal communication to UTT of ICC, exporter of CV. 21/02/2006; 2006. [49] Heuyin, R., Personal communication to UTT of H. Heuyin, Director of CE.DE.RE.
14/02/06; 2005.

EAA/UTT Study – Final report 64
[50] Turbo Hoet France, Personal communication to UTT of Mr Eric, Turbo Hoet France. 12/10/05; 2005.
[51] Vanhoutte, M., Personal communication to UTT of Mr Vanhoutte, Director of Turbo Hoet Belgium. 22/02/06; 2006.
[52] Maire, M., Personal communication to UTT of M. Maire, Director of MVI, Exporter and dismantler of CV. 16/02/2006; 2006.
[53] François, O., Personal communication to UTT of O. François, General Director of Galloo France. 16/02/2006; 2006.
[54] Demazure, M., Personal communication to UTT of M. Demazure, Plant manager of Bartin shredder in Troyes. 04/10/05; 2005.
[55] Wrzecioniarz, P.A., Ambroszko, W., Janusiewicz, L., Laska,D., Oldakowski, K., Concept in vehicles recycling in Poland. In: Proceedings of Global Symposium on Recycling, Waste Treatment and clean Technology (Vol I), 26-29 September 2004. Madrid (Spain); 2004.
[56] OFEFP, Analyse des Flux de Matière au niveau suisse. Berne (Suisse): Office Fédérale de l'environnement, des forêts et du paysage (OFEFP); 1996.
[57] EAA/OEA, Aluminium Recycling. The Road to High Quality Products. European Aluminium Asociation / Organisation of European Aluminium Refiners and Remelters; 2005.