PPAC's Snapshot of India's Oil & Gas data
41
PPAC's Snapshot of India’s Oil & Gas data Abridged Ready Reckoner January, 2020 Petroleum Planning & Analysis Cell (Ministry of Petroleum & Natural Gas) As on 18.02.2020
-
Upload
khangminh22 -
Category
Documents
-
view
3 -
download
0
Transcript of PPAC's Snapshot of India's Oil & Gas data

PPAC's Snapshot of India’s Oil & Gas data
Abridged Ready ReckonerJanuary, 2020
Petroleum Planning & Analysis Cell(Ministry of Petroleum & Natural Gas)
As on 18.02.2020

Index of TablesTable Page
2-3
1 52 6-7
3 94 95 96 107 108 11-129 12
1310 14-1511 16
12 19-2013 2114 2115 21
16 2317 23-2418 25
19 2720 2821 2822 2823 29-3124 32
25 35-36
26 3927 40
DescriptionHighlights for the month
Selected indicators of the Indian economyECONOMIC INDICATORS
CRUDE OIL, REFINING & PRODUCTION
Conversion factors and volume conversion
Ethanol blending programme
Domestic natural gas price and gas price ceiling
Information on prices, taxes and under-recoveries/subsidies
Capital expenditure of PSU oil companies
Natural gas at a glance; GraphCoal Bed Methane (CBM) gas development in India
Existing LNG terminalsStatus of PNG connections, CNG stations and CNG vehicles across India
Major natural gas pipeline network
Industry marketing infrastructure
NATURAL GAS
TAXES & DUTIES ON PETROLEUM PRODUCTS
MISCELLANEOUS
LPG consumption
Region-wise data on LPG marketing; GraphLPG marketing at a glance; Graph
Crude oil, LNG and petroleum products at a glance; Graph
Gross Refining Margins (GRM) of refineries; GraphGRM of North-East refineries excluding excise duty benefit; Graph
Map of crude oil and product pipeline network
NATURAL GAS
Kerosene allocation vs upliftment Production and consumption of petroleum products; GraphCONSUMPTION
Refineries: Installed capacity and crude oil processingCrude oil and product pipeline network
Indigenous crude oil productionDomestic oil & gas production vis-à-vis overseas productionHigh Sulphur (HS) & Low Sulphur (LS) Crude Oil processingQuantity and value of crude oil importsSelf-sufficiency in petroleum products
1 Snapshot of India's Oil & Gas data - January, 2020

•
•
•
•
•
•
•
Indigenous crude oil and condensate production during January 2020 was lower by 5.3% than that of January 2019 ascompared to a de-growth of 7.4% during December 2019. OIL and ONGC registered growth of 1.1% and 1.2% respectivelyduring January 2020 as compared to January 2019. PSC fields registered a de-growth of 21.3% during January 2020 ascompared to January 2019. On cumulative basis indigenous crude oil and condensate production of the country was lowerby 6% during April 2019 - January 2020 as compared to the corresponding period of the previous year.Crude oil processed in refineries during January 2020 was 21.7 MMT, which was 1.2% lower than January 2019. Oncumulative basis total crude oil processed was also lower by 1.2% during April - January 2020 as compared to thecorresponding period of the previous year. Indian refineries processed 76.5% high Sulphur crude during January 2020 ascompared to 74.4% during January 2019.
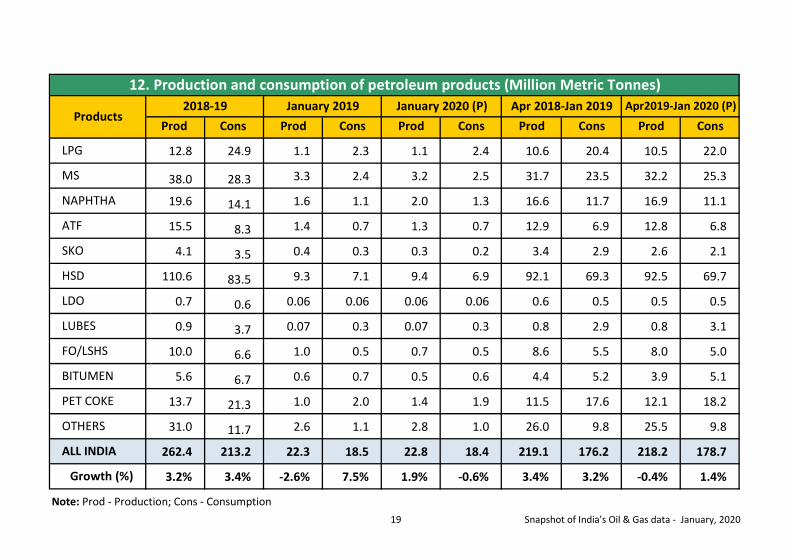
Highlights for the monthPetroleum product consumption during the month of January 2020 registered a drop of 0.6%, as compared to January 2019.Except for SKO, HSD, LDO, FO/LSHS, bitumen, petcoke and products in ‘others’ category all other products registered agrowth during January 2020. A growth of 1.4% was recorded in consumption for the period April 2019-January 2020 ascompared to same period last year. While SKO, ATF, bitumen, FO/LSHS and naphtha recorded a drop, all others productsrecorded a growth during the period April 2019-January 2020.Top gainers in petroleum product consumption during the current month of January 2020 were naphtha 16.9%, Lubes &Greases 11.9%, LPG 6.1%, MS 3.5% and ATF 2.5%. Top gainers in consumption during the period April 2019 to January 2020were MS 7.9%, LPG 7.4%,LDO 6.8%, Lubes & greases 4.8% and Petcoke 3.4%.Blending ethanol with MS during January 2020 was 4.5% and cumulative ethanol blending during December 2019 to January2020 (supply year 2019-20) was 3.8%.SKO consumption registered a drop of 38.3% during January 2020 and a cumulative drop of 28.9% during April 2019-January2020. This was mainly because of reduced PDS SKO allocations to the states and voluntary surrender of the allocation bysome of the states. As of january 2020, state of Punjab, Haryana, Andhra Pradesh and all the UTs except UT of Jammu &Kashmir and UT of Ladakh have become kerosene (PDS) free.Total natural gas consumption (including internal consumption) for the month of January, 2020 was 5306 MMSCM whichwas 6.3% higher than the corresponding month of the previous year. The cumulative consumption of 53104 MMSCM for thecurrent year till January, 2020 was higher by 3.9% compared with the corresponding period of the previous year.
2 Snapshot of India's Oil & Gas data - January, 2020

•
•
•
•
•
•
•
LNG import for the month of January, 2020 was 2778 MMSCM which was 25.1% higher than the corresponding month ofthe previous year. The cumulative import of 27433 MMSCM for the current year till January, 2020 was higher by 12.9%compared with the corresponding period of the previous year.
Exports of POL products increased by 2.3% and 6.4% during January 2020 and April 2019 - January 2020 respectively ascompared to the corresponding period of the previous year. Increase in POL products exports during April 2019 - January2020 was mainly due to increase in exports of naphtha and high speed diesel (HSD).
The price of Brent Crude averaged $63.50/bbl during January, 2020 as against $67.02/bbl during December 2019 and$59.46/bbl during January 2019. The Indian basket crude price averaged $64.31/bbl during January 2020 as against$65.50/bbl during December 2019 and $59.27 /bbl during January 2019.
Production of petroleum products saw a growth of 1.9% during January 2020 over January 2019 as compared to a growth of3% during December 2019. On cumulative basis production of petroleum products saw a de-growth of 0.4% during April -January 2020 as compared to the corresponding period of the previous year.
Gross production of natural gas for the month of January, 2020 was 2607 MMSCM which was lower by 8.3% compared withthe corresponding month of the previous year. The cumulative gross production of natural gas of 26427 MMSCM for thecurrent financial year till January, 2020 was lower by 3.9% compared with the corresponding period of the previous year.
Crude oil imports increased by 0.9% during January 2020 as compared to January 2019. However, crude oil importsdecreased by 0.9% during April 2019 - January 2020 as compared to the corresponding period of the previous year.
POL products imports increased by 51.7% and 35.7% during January 2020 and April 2019 - January 2020 respectively ascompared to the corresponding period of the previous year. Increase in POL products imports during April 2019 - January2020 was due to increase in imports of all POL products except naphtha and aviation turbine fuel (ATF).
3 Snapshot of India's Oil & Gas data - January, 2020
Part A: Economic Indicators
Snapshot of India's Oil & Gas data - January, 2020

Unit/ Base 2014-15 2015-16 2016-17 2017-18 2018-19 2019-20
1 Billion 1.2 - - - - -7.4 8.0 8.2 7.2 6.8 4.8
3rd RE 2nd RE 1st RE PE E (H1)
252.0 251.5 275.1 285.0 285.2 292.02nd AE
Growth % -4.9 -0.2 9.4 3.6 0.1 2.4
4.1 3.9 3.5 3.5 3.4 3.4RE BE
2018-19 2019-20 2018-19 2019-204.4 3.8 2.5* -0.3* 4.7# 0.5#
QE
6 $ Billion 465.6 514.1 41.5 41.1 433.8 398.5
7 $ Billion 303.5 330.1 26.4 26.0 270.5 265.3
8 $ Billion -162.1 -184.0 -15.1 -15.2 -163.3 -133.3
9 $ Billion 424.4 411.9 398.2 471.3 - -
Source: Ministry of Commerce & Industry, Ministry of Statistics and Programme Implementation, Ministry of Agriculture & Farmer's Welfare, Reserve Bank of India
January
@Kharif 2018-19- 141.59 (1st AE ); IIP is for the month of *December, #April-December; @2017-18-as on March 30, 2018, 2018-19-as on March 29, 2019,January 2019- as on January 25, 2019 and January 2020-as on January 31, 2020; E-Estimates; AE-Advanced Estimates; RE-Revised Estimates; QE-QuickEstimates; FE: Final Estimates; PE: Provisional Estimates.
Economic indicators Unit/ Base 2018-19 April-January
Imports
Exports
Trade Balance
Foreign Exchange Reserves @
Index of Industrial Production(Base: 2011-12)
5 Growth %
2017-18
4Gross Fiscal Deficit (as percent of GDP)
%
1. Selected indicators of the Indian economyEconomic indicators
Population (as on 1st May, 2011)
3Agricultural Production(Food grains)
MMT
2GDPat constant (2011-12 Prices)
Growth %
5 Snapshot of India's Oil & Gas data - January, 2020

2018-19 2019-20 (P) 2018-19 2019-20 (P)
1 MMT 35.7 34.2 2.8 2.7 28.8 27.12 MMT 206.2 213.2 18.5 18.4 176.2 178.73 MMT 254.3 262.4 22.3 22.8 219.1 218.24 MMSCM 32,649 32,875 2,841 2,607 27,492 26,4275 MMSCM 59,170 60,798 4,992 5,306 51,120 53,1046
MMT 220.4 226.5 19.7 19.9 190.2 188.4$ Billion 87.8 111.9 8.3 9.4 95.3 87.7
MMT 35.5 33.3 3.0 4.6 26.4 35.8$ Billion 13.6 16.3 1.1 2.1 13.4 15.0
MMT 255.9 259.8 22.7 24.4 216.6 224.2$ Billion 101.4 128.3 9.5 11.5 108.7 102.7
MMT 66.8 61.1 4.5 4.7 51.4 54.7$ Billion 34.9 38.2 2.4 2.6 32.6 31.3MMSCM 27,439 28,740 2,220 2,778 24,300 27,433$ Billion 8.1 10.3 0.8 0.8 8.8 7.9
7 % 21.8 24.9 22.8 28.1 25.1 25.8
8 % 11.5 11.6 8.9 10.2 12.0 11.8
9 % 82.9 83.8 84.8 84.9 83.6 84.9
Petroleum products (POL) imports
Gross petroleum imports (Crude + POL)
Crude oil production in IndiaConsumption of petroleum productsProduction of petroleum products
Imports & exports:
Crude oil imports
Gross natural gas productionNatural gas consumption
2. Crude oil, LNG and petroleum products at a glanceDetails Unit/ Base April-January2017-18 2018-19 January
Note: Crude oil imports ($ Billion) during 2018-19 does not include value of crude oil quantity of 0.8 MMT imported at ISPRL, Mangalore.
Petroleum products exports
Petroleum imports as percentage ofIndia's gross imports (in value terms)Petroleum exports as percentage ofIndia's gross exports (in value terms)Import dependency of crude(on consumption basis)
LNG imports
December 2019-January 2020 data prorated on the basis of December 2018 to November 2019 actual provisional data provided by DGCIS.
6 Snapshot of India's Oil & Gas data - January, 2020

7 Snapshot of India's Oil & Gas data - January, 2020

Part B: Crude Oil, Refining & Production
Snapshot of India's Oil & Gas data - January, 2020

2018-19 2019-20 2019-20 2018-19 2019-20 2019-20(Target)* (P) (Target)* (P)
20.8 19.6 1.6 2.0 1.7 16.4 18.2 16.03.4 3.3 0.3 0.3 0.3 2.8 2.9 2.69.9 9.6 0.8 0.8 0.6 8.1 8.0 7.1
34.0 32.5 2.7 3.1 2.6 27.3 29.0 25.71.5 1.5 0.1 0.1 1.3 1.20.2 0.2 0.03 0.03 0.2 0.21.6 1.7 0.2 0.1 1.4 1.4
35.7 34.2 2.8 3.1 2.7 28.8 29.0 27.1261.6 250.7 20.9 22.6 19.8 211.0 212.7 198.4
*Target is inclusive of condensate.
2018-19 2019-20 (P) 2018-19 2019-20 (P)68.3 67.1 5.7 5.3 56.3 53.522.7 24.7 2.2 2.0 20.6 20.6
33.2% 36.8% 38.9% 38.3% 36.5% 38.4%
2018-19 2019-20 (P) 2018-19 2019-20 (P)1 188.4 194.2 16.3 16.6 162.5 159.52 63.6 63.0 5.6 5.1 52.2 52.6
251.9 257.2 21.9 21.7 214.6 212.174.8% 75.5% 74.4% 76.5% 75.7% 75.2%
4. Domestic oil & gas production vis-à-vis overseas production
Total domestic production (MMTOE)
Source: ONGC Videsh, GAIL, OIL , IOCL, HPCL & BPRL
April-January Details
Overseas production as percentage of domestic productionOverseas production (MMTOE)
2017-18 2018-19 January
Low Sulphur crudeTotal crude processedPercentage share of HS crude in total crude oil processing
5. High Sulphur (HS) & Low Sulphur (LS) crude oil processing (MMT)Details
High Sulphur crude
April-January 2017-18 2018-19 January
3. Indigenous crude oil production (Million Metric Tonnes)April-January
Total (Crude + Condensate) (Million Bbl)
2017-18 January
ONGC condensatePSC condensate
Total Crude Oil
Total condensateTotal (Crude + Condensate) (MMT)
2018-19Details
ONGCOil India Limited (OIL)Private / Joint Ventures (JVs)
9 Snapshot of India's Oil & Gas data - January, 2020

- Crude oil import bill changes by Rs. 2,936 croresIf exchange rate of Rs./$ changes by Rs. 1/$ - Crude oil import bill changes by Rs. 2,729 crores
2018-19 2019-20 (P) 2018-19 2019-20 (P)1 32.8 31.7 2.6 2.6 26.6 24.6
2 30.6 29.6 2.4 2.4 24.8 23.0
3 4.6 4.9 0.4 0.4 4.1 4.0
4 35.2 34.5 2.8 2.8 28.9 26.9
5 206.2 213.2 18.5 18.4 176.2 178.7
17.1% 16.2% 15.2% 15.1% 16.4% 15.1%
2018-192019-20 (Estimated)
6. Quantity and value of crude oil importsYear Quantity (MMT) $ Million Rs. Crore
226.5 1,11,915 7,83,183225.0 105,580 7,43,894
% Self-sufficiency (4 / 5)
Indigenous crude oil processing
Products from indigenous crude(93.3% of crude oil processed)Products from fractionators (Including LPG and Gas)Total production from indigenous crude & condensate (2 + 3)
Total domestic consumption
Note: 2019-20 imports are estimated based on April 2019- December 2019 at actuals and for January 2020- March 2020 ataverage price of Indian basket crude oil $66/bbl and average exchange rate for Rs.71/$.Impact of variation in crude oil price & exchange rate on value of crude oil imports for January 2020 - March 2020 :If crude prices changes by one $/bbl
2017-18 2018-19 April-January 7. Self-sufficiency in petroleum products (Million Metric Tonnes)
Particulars January
10 Snapshot of India's Oil & Gas data - January, 2020

Installedcapacity 2017-18(1.01.2020)
MMTPA2018-19 2019-20
(Target)*2019-20
(P)2018-19 2019-20
(Target)*2019-20
(P)6.0 5.8 6.7 0.6 0.6 0.6 5.5 5.6 5.5
13.7 13.8 13.5 1.2 1.3 1.3 11.4 11.0 10.77.5 7.7 8.0 0.6 0.7 0.3 6.6 5.8 5.48.0 9.2 9.7 0.7 0.8 0.4 8.1 7.2 7.4
15.0 15.7 15.3 1.4 1.4 1.4 13.7 12.9 12.51.0 1.0 0.9 0.00 0.00 0.08 0.7 0.8 0.8
0.65 0.7 0.7 0.06 0.06 0.06 0.6 0.6 0.52.35 2.4 2.5 0.2 0.2 0.1 2.1 1.9 1.815.0 12.7 14.6 1.4 1.4 1.4 11.9 13.2 13.369.2 69.0 71.8 6.2 6.6 5.6 60.6 59.0 58.010.5 10.3 10.3 1.0 0.9 0.9 8.5 8.6 8.61.0 0.5 0.4 0.05 0.0 0.0 0.4 0.0 0.0
11.5 10.8 10.7 1.0 0.9 0.9 8.8 8.6 8.612.0 14.1 14.8 1.2 1.3 1.4 12.2 12.2 12.415.5 14.1 16.1 1.5 1.4 1.5 13.3 13.5 13.8
BORL 7.8 6.7 5.7 0.7 0.7 0.7 4.4 6.5 6.5NRL 3.0 2.8 2.9 0.2 0.3 0.2 2.4 2.3 1.9
38.3 37.7 39.4 3.7 3.6 3.7 32.3 34.5 34.6
Crude oil processing (MMT)January
CBR (1993)CPCL-TOTALMumbai (1955)
Manali (1969)
Bina (2011)
Refinery
Barauni (1964)Koyali (1965)Haldia (1975)Mathura (1982)
Numaligarh (1999)
BPCL-TOTAL
CPCL
BPCL
8. Refineries: Installed capacity and crude oil processing (MMTPA / MMT)Company
April-January2018-19
IOCL
Panipat (1998)Guwahati (1962)Digboi (1901)Bongaigaon(1979)Paradip (2016) IOCL-TOTAL
Kochi (1966)
11 Snapshot of India's Oil & Gas data - January, 2020

2018-19 2019-20(Target)*
2019-20(P)
2018-19 2019-20(Target)*
2019-20(P)
ONGC 0.066 0.080 0.066 0.007 0.004 0.009 0.051 0.038 0.075MRPL 15.0 16.1 16.2 1.5 1.5 1.3 13.5 12.6 11.5
15.1 16.2 16.3 1.5 1.5 1.3 13.5 12.6 11.57.5 8.6 8.7 0.7 0.8 0.7 7.2 5.8 6.68.3 9.6 9.8 0.8 0.8 0.8 8.1 7.6 7.5
HMEL 11.3 8.8 12.5 1.0 0.9 1.1 10.4 9.2 10.227.1 27.1 30.9 2.5 2.5 2.6 25.7 22.6 24.433.0 33.2 31.8 2.2 2.2 3.1 26.9 26.9 27.135.2 37.3 37.4 3.2 3.2 2.6 31.1 31.1 30.6
NEL 20.0 20.7 18.9 1.7 1.7 1.8 15.5 15.5 17.3249.4 251.9 257.2 21.9 22.3 21.7 214.6 210.9 212.1
ONGC OIL Cairn HMEL IOCL BPCL HPCL Others* TotalLength (KM) 1,283 1,193 688 1,017 5,301 937 10,419Cap (MMTPA) 60.6 9.0 10.7 11.3 48.6 7.8 147.9Length (KM) 654 9,104 2,241 3,775 2,395 18,169Cap (MMTPA) 1.7 46.0 19.5 34.7 9.4 111.3
Vadinar (2006)All India
HPCL
*Others include GAIL and Petronet India. HPCL and BPCL lubes pipeline included in products pipeline data
Details
Note: Some sub-totals/ totals may not add up due to rounding off at individual levels.
9. Major crude oil and product pipeline network (as on 01.02.2020)
Crude Oil
Products
RILJamnagar (DTA) (1999)
Jamnagar (SEZ) (2008)
Bathinda (2012)HPCL- TOTAL
Mumbai (1954)Visakh (1957)
Company2017-18
Installed capacity (1.1.2020)
(MMTPA)
ONGC-TOTAL
Tatipaka (2001)Mangalore (1996)
April-JanuaryRefinery Crude oil processing (MMT)
January2018-19
12 Snapshot of India's Oil & Gas data - January, 2020

As of 1.10.2019
Note: Pipelines shown are indicative only.
Pipeline Network
13 Snapshot of India's Oil & Gas data - January, 2020

2.030.23
25.586.208.80
**Not available; # Commissioned in February, 2016; HMEL data not available; ** GRM of North Eastern refineries are including excise duty benefit. For GRM excluding excise duty benefit, refer table 11.
16.771.572.962.683.583.103.330.671.87
NEL
MumbaiWeighted average
Weighted average
10. Gross Refining Margins (GRM) of refineries ($/bbl)H1, 2019-20
1.752.322.212.122.42
17.0620.55
CompanyIOCL
2018-193.864.875.364.654.66
16.35
7.775.16
Paradip #
24.4920.15
4.22
24.86 22.7416.94
5.36
RIL
MRPL
BORLNRL
BinaNumaligarh **
6.858.35
6.447.26
8.49
20.627.02
CPCL
HPCL
Mumbai
Weighted average
6.05Chennai
Visakhapatnam6.955.26
6.20
BPCL Kochi
2016-17 2017-18
6.80
6.527.55
7.017.95
7.09
22.14 21.88
9.446.86
6.60
7.74
8.9511.60
5.51
11.8028.56
6.55
11.7031.92
6.427.54
7.40
9.1411.00
7.75 4.0628.11
9.809.206.97
4.465.414.274.924.585.794.315.013.70
VadinarJamnagar
Mangalore
Refinery
Haldia
BarauniKoyali
MathuraPanipatGuwahati **Digboi **Bongaigaon **
14 Snapshot of India's Oil & Gas data - January, 2020

15 Snapshot of India's Oil & Gas data - January, 2020
0.0
5.0
10.0
15.0
20.0
25.0
30.0
35.0
2016-17 2017-18 2018-19 H1, 2019-20
($/b
bl)
IOCL BPCL HPCL CPCL MRPL BORL RIL NEL NRL

Refinery 2016-17 2017-18 2018-19 H1, 2019-20
Guwahati 1.12 3.70 0.63 -0.24Digboi 7.73 8.27 8.84 6.83Bongaigaon 6.03 6.22 4.21 2.25Numaligarh 8.50 11.43 11.80 9.63
IOCL
NRL
11. GRM of North-East refineries excluding excise duty benefit ($/bbl)Company
-2.0
0.0
2.0
4.0
6.0
8.0
10.0
12.0
14.0
2016-17 2017-18 2018-19 H1, 2019-20
($/b
bl)
IOCL Guwahati IOCL Digboi IOCL Bongaigaon NRL
16 Snapshot of India's Oil & Gas data - January, 2020

17 Snapshot of India's Oil & Gas data - January, 2020

Part C: Consumption
Snapshot of India's Oil & Gas data - January, 2020
Prod Cons Prod Cons Prod Cons Prod Cons Prod Cons
12.8 24.9 1.1 2.3 1.1 2.4 10.6 20.4 10.5 22.0
38.0 28.3 3.3 2.4 3.2 2.5 31.7 23.5 32.2 25.3
19.6 14.1 1.6 1.1 2.0 1.3 16.6 11.7 16.9 11.1
15.5 8.3 1.4 0.7 1.3 0.7 12.9 6.9 12.8 6.8
4.1 3.5 0.4 0.3 0.3 0.2 3.4 2.9 2.6 2.1
110.6 83.5 9.3 7.1 9.4 6.9 92.1 69.3 92.5 69.7
0.7 0.6 0.06 0.06 0.06 0.06 0.6 0.5 0.5 0.5
0.9 3.7 0.07 0.3 0.07 0.3 0.8 2.9 0.8 3.1
10.0 6.6 1.0 0.5 0.7 0.5 8.6 5.5 8.0 5.0
5.6 6.7 0.6 0.7 0.5 0.6 4.4 5.2 3.9 5.1
13.7 21.3 1.0 2.0 1.4 1.9 11.5 17.6 12.1 18.2
31.0 11.7 2.6 1.1 2.8 1.0 26.0 9.8 25.5 9.8
262.4 213.2 22.3 18.5 22.8 18.4 219.1 176.2 218.2 178.7
3.2% 3.4% -2.6% 7.5% 1.9% -0.6% 3.4% 3.2% -0.4% 1.4%
Note: Prod - Production; Cons - Consumption
HSD
12. Production and consumption of petroleum products (Million Metric Tonnes)
Products2018-19 January 2019 January 2020 (P) Apr 2018-Jan 2019 Apr2019-Jan 2020 (P)
LPG
MS
NAPHTHA
ATF
SKO
ALL INDIA
Growth (%)
LDO
LUBES
FO/LSHS
BITUMEN
PET COKE
OTHERS
19 Snapshot of India's Oil & Gas data - January, 2020

Petroleum Products: April 2019-January 2020 (MMT)
10.5
32.2
16.912.8
2.6
92.5
0.5 0.8
8.03.9
12.1
25.522.0
25.3
11.16.8
2.1
69.7
0.53.1 5.0 5.1
18.2
9.8
0.0
10.0
20.0
30.0
40.0
50.0
60.0
70.0
80.0
90.0
100.0
LPG MS NAPHTHA ATF SKO HSD LDO LUBES FO/LSHS BITUMEN PET COKE OTHERS
(MM
T)
Production Consumption
20 Snapshot of India's Oil & Gas data - January, 2020

Allocation Upliftment Allocation Upliftment Allocation Upliftment Allocation Upliftment*
69,33,030 66,78,447 50,21,828 46,69,160 44,32,994 41,52,112 31,21,328 24,12,706
IOCL BPCL HPCL RIL NEL SHELL Others Total
125 78 84 18 3 - 6 314
119 58 43 31 - - 1 252
28,790 15,814 16,194 1,400 5,649 178 7 68,032
8,386 2,586 3,774 127 1,955 26 - 16,854
3,882 1,001 1,638 - - - - 6,521
ParticularsEthanol Supply Year *
Ethanol received by PSU OMCs under EBP Program (in Cr. Litrs)Average Percentage of Blending Sales (EBP%)* Ethanol Supply Year : Ethanol supplies take place between 1st December of the present year to 30th November of the following year.
2016-17 2017-18 2018-19 (P)2019-20 (P)
(Dec 2019-Jan 2020)
66.5 150.5 188.6 24.1
2.0% 4.2%
PDS Kerosene
*Upliftment of PDS kerosene for duraton April 2019 to January 2020; whole allocation is for April/March'20
14. Ethanol blending programme
13. Kerosene allocation vs upliftment (Kilo Litres)Product 2016-17 2017-18 2018-19 2019-20 (P)
5.0% 3.8%
out of which Rural ROs
Note: With effect from 01.04.2019, EBP Programme has been extended to whole of India except UTs of Andaman and Nicobar Islands and Lakshadweep.
SKO/LDO agencies (Nos.)$(RIL= 5 terminals and 13 depots, Others=4 MRPL & 2 NRL); @(Others=ShellMRPL -1); ^(Others=MRPL-7)
15. Industry marketing infrastructure (as on 01.02.2020) (Provisional)Particulars
POL Terminal/ Depots (Nos.)$
Aviation Fuel Stations (Nos.)@
Retail Outlets (total) (Nos.),^
21 Snapshot of India's Oil & Gas data - January, 2020

Part D: LPG
Snapshot of India's Oil & Gas data - January, 2020

Gr (%) Gr (%)
LPG-Packed Domestic 5.5 7.3LPG-Packed Non-Domestic 17.7 16.1LPG-Bulk -21.5 -11.4Auto LPG -1.3 -1.8Sub-Total (PSU Sales) 6.3 7.92. Direct Private Imports* -11.8 -25.2Total (1+2) 6.1 7.4
Particulars (As on 1st of April)
Unit 2008 2009 2010 2011 2012 2013 2014 2015 2016 2017 2018 2019 1.1.2020 (P)
(Lakh) 1486 1663 1988 2243 2654 2759Growth 11.9% 19.6% 12.8% 18.3% 9.4%(Percent) 56.2 61.9 72.8 80.9 94.3 96.9Growth 10.1% 17.6% 11.1% 16.5% 7.8%(Lakh) 200.3 356 719 802.9Growth 77.7% 101.9% 35.1%(No.) 9365 9366 9686 10541 11489 12610 13896 15930 17916 18786 20146 23737 24382Growth 0.0% 0.0% 3.4% 8.8% 9.0% 9.8% 10.2% 14.6% 12.5% 4.9% 7.2% 17.8% 7.6%(No.) 327 447 536 604 652 667 678 681 676 675 672 661 658Growth 48.6% 36.7% 19.9% 12.7% 7.9% 2.3% 1.6% 0.4% -0.7% -0.1% -0.4% -1.6% -0.8%(No.) 181 182 182 183 184 185 187 187 188 189 190 192 195Growth 0.0% 0.6% 0.0% 0.5% 0.5% 0.5% 1.1% 0.0% 0.5% 0.5% 0.5% 1.1% 2.1%
Bottling Plants
17. LPG marketing at a glance
LPG Active Domestic Customers
LPG Coverage (Estimated)
PMUY Beneficiaries
LPG Distributors
Auto LPG Dispensing Stations
16. LPG consumption (Thousand Metric Tonne)2017-18 January April-January
24,906.8316.0
29.515.3
2,011.8227.9
20,351.82,085.8355.4184.4
22,977.4364.5
23,341.8
2018-19
21,728.02,364.4318.1180.3
24,590.8 2,284.624.2
2,308.8
2018-19 2019-20 (P)
2,121.9268.323.215.1
2,428.521.4
2,449.9
2018-19
17,825.71,925.2259.4151.0
20,161.4
*December 2019-January 2020 import data are prorated on the basis of December 2018 to November 2019 actual data provided by DGCIS.
1. PSU Sales :
LPG category
1.All growth rates as on 1.1.2020 are w.r.t figures as on 1.1.2019.All growth rates as on 1 April of any year are w.r.t. figures as on 1 April of previous year.2. LPG coverage has been estimated based on active domestic LPG connections of PSU OMCs divided by households estimated by extrapolating decadal growth of 2001-11 on households in 2011 as per Census 2011 figures.
Source: PSU OMCs (IOCL,BPCL and HPCL)
273.820,435.1
2019-20 (P)
19,132.12,235.7229.9148.3
21,746.0204.7
21,950.7
23 Snapshot of India's Oil & Gas data - January, 2020

14.8616.63
19.8822.43
26.5427.59
1.4.15 1.4.16 1.4.17 1.4.18 1.4.19 1.1.20
Growth trend in active LPG domestic customers (In Crore)
56.2%61.9%
72.8%80.9%
94.3% 96.9%
1.4.15 1.4.16 1.4.17 1.4.18 1.4.19 1.1.20
Growth trend in LPG coverage
9365 9366 9686 10541 11489 12610 1389615930
17916 18786 20146
23737 24382
2008 2009 2010 2011 2012 2013 2014 2015 2016 2017 2018 2019 1.1.2020
Growth trend in LPG distributors (Nos.)
24 Snapshot of India's Oil & Gas data - January, 2020

Particulars North North-East East West South Total
LPG Active Domestic Customers (in Lakh) 841.5 96.1 535.1 585.1 701.4 2759.2
LPG Coverage (Estimated) 110.7% 90.0% 83.5% 88.1% 103.8% 96.9%
PMUY Beneficiaries (in Lakh) 249.7 42.1 254.6 175.2 81.3 802.9
Non-domestic LPG customers (in Lakh) 6.2 0.7 3.1 8.0 13.6 31.7
LPG Distributors (Numbers) 8083 1025 4729 5205 5340 24382
Auto LPG Dispensing Stations (Numbers) 119 0 52 147 340 658
Bottling Plants* (Numbers) 60 13 26 45 51 195
18-Region-wise data on LPG marketing (As on 1.1.2020)
*Includes Numaligarh BP, Duliajan BP and CPCL BP.
25 Snapshot of India's Oil & Gas data - January, 2020

Part E: Natural Gas
Snapshot of India's Oil & Gas data - January, 2020

2018-192019-20 (Target)
2019-20 (P)
2018-192019-20 (Target)
2019-20 (P)
32,649 32,875 2,841 3,013 2,607 27,492 28,645 26,42723,429 24,677 2,170 2,294 2,051 20,586 21,305 19,970
2,881 2,722 222 265 208 2,283 2,798 2,2566,338 5,477 449 455 347 4,623 4,542 4,202
31,731 32,058 2,772 2,528 26,820 25,672
27,439 28,740 2,220 2,778 24,300 27,433
59,170 60,798 4,992 5,306 51,120 53,104
59.2 60.8 5.0 5.3 51.1 53.1
46.4 47.3 44.5 52.4 47.5 51.7
OIL's October 2019 production data has been considered for the month of November 2019.
(b) Net production (excluding flare gas and loss)(c) LNG import(d) Total consumption including internal consumption (b+c)(e) Total consumption (in BCM)(f) Import dependency based on consumption (%), {c/d*100} Note: November-December 2019 private import (LNG) quantity is prorated on the basis of November 2018-October 2019 actual data provided by DGCIS.
(a) Gross production- ONGC- Oil India Limited (OIL)- Private / Joint Ventures (JVs)
19. Natural gas at a glance(MMSCM)
Details 2017-18 2018-19 January April-January
32649 3287526427
59170 6079853104
0
20000
40000
60000
80000
2017-18 2018-19 2019-20 (Apr-Jan)
Gross natural gas production (MMSCM) Natural gas consumption (MMSCM)
27 Snapshot of India's Oil & Gas data - January, 2020

Reliance GSPL IOCL Total
1,774 2,692 140 16,98184 43 10 387
DahejHaziraDabholKochiEnnore Indian Oil LNG Pvt Ltd 5 MMTPA 7.0
Blocks awarded 33 Nos.Production of CBM gas January 2019 (P) 55.6 MMSCM
Petronet LNG Ltd (PLL) 16.3 MMTPA 105.7 Shell Energy India Pvt. Ltd. 5 MMTPA 94.6
Total available coal bearing areas 26,000 Sq. KMExploration initiated 16,613 Sq. KM
Total Capacity 36.3 MMTPA* To increase to 5 MMTPA with breakwater
20. Coal Bed Methane (CBM) gas development in IndiaPrognosticated CBM resources 92 TCFEstablished CBM resources 9.9
RGPPL (GAIL - NTPC JV) 5 MMTPA 17.0Petronet LNG Ltd (PLL) 5 MMTPA 15.7
TCF
22. Existing LNG terminalsLocation Promoters Capacity as on 01.01.2020 Capacity utilisation in %
April-December 2019 (P)
Production of CBM gas 540.7 MMSCMApril-January 2019 (P)
5^Excludes CGD pipeline network
21. Major natural gas pipeline network as on 01.02.2020Nature of pipeline GAIL ARN^
Natural gas Length (KM) 12,160 215Cap (MMSCMD) 246
28 Snapshot of India's Oil & Gas data - January, 2020

CNG No. of CNG stations vehicles Domestic Commercial Industrial
Andhra Pradesh
Bhagyanagar Gas Ltd, GodavariGas Pvt.Ltd., Megha Engineering& Infrastructures Ltd.
Kakinada, Vijaywada, East/WestGodavari, Krishna district GA (excludingareas already authorized)
59 25,186 100,461 177 11
Assam Assam Gas Co. Ltd Upper Assam GA 1 46 34,730 1,132 404
Bihar GAIL (India) Ltd. Patna 4 3,624 736 5 0
Chandigarh Indian Oil-Adani Gas Pvt. Ltd. Chandigarh 11 7,500 17,941 10 1
Daman and Diu Indian Oil-Adani Gas Pvt. Ltd. Daman 4 1,000 1,474 23 13
Delhi Indraprastha Gas Ltd . NCT of Delhi (Including Noida & Ghaziabad) 502 10,76,461 13,01,118 3,058 2,325
Gujarat & DNH
Sabarmati Gas Ltd, Gujarat GasLtd, Adani Gas Ltd, Vadodara GasLtd, Hindustan PetroleumCorporation Ltd, Charotar GasSahakari Mandal Ltd, IRM EnergyLtd.
Gandhinagar, Mehsana & SabarkantaGA, Patan district GA, Surat-Bharuch-Ankleswar GA, Nadiad GA, Navsari GA,Rajkot GA, Surendranagar GA, HaziraGA, Valsad GA, Jamnagar GA,Bhavnagar GA, Kutch (West) GA, AmreliDistrict GA, Dahej Vagra Taluka GA,Dahod District GA, Panchmahal DistrictGA, Anand (excluding area authorised)district GA, Ahmedabad city andDaskroi area (excluding area alreadyauthorised) GA, Vadodara district,Vadodara Rural, Ahmedabad districtGA, Anand area including Kanjari andVadtal villages GA and Palanpur, Dadraand Nagar Haveli-Silvassa
605 10,16,710 22,21,049 19,382 5,113
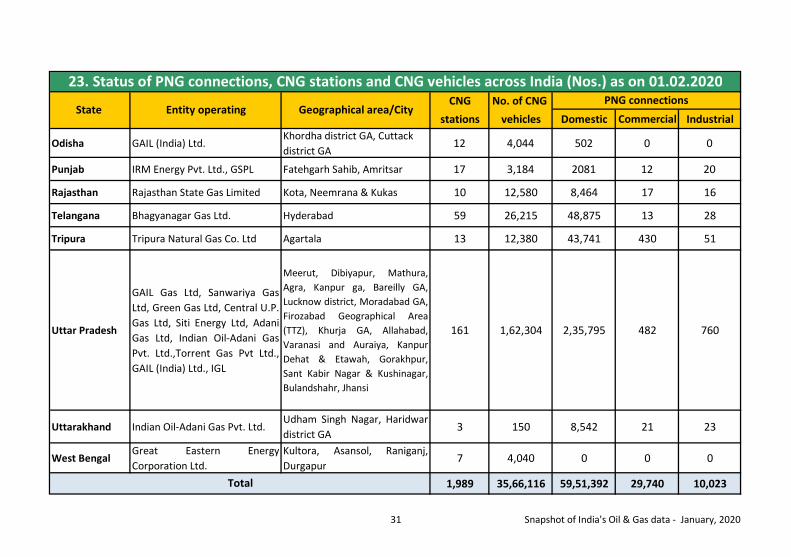
23. Status of PNG connections, CNG stations and CNG vehicles across India (Nos.) as on 01.02.2020
State Entity operating Geographical area/CityPNG connections
29 Snapshot of India's Oil & Gas data - January, 2020

CNG No. of CNG stations vehicles Domestic Commercial Industrial
Haryana
Haryana City GasDistribution Ltd., AdaniGas Ltd., GAIL Gas Ltd.,Indraprastha Gas Ltd. ,Indian Oil-Adani Gas Pvt.Ltd.
Sonipat, Faridabad, Gurgaon, Rewari,Panipat, Nuh & Palwal, Karnal
88 1,62,801 133,497 312 613
Jharkhand GAIL (India) Ltd. Ranchi 3 1,112 775 0 0
KarnatakaGail Gas Ltd., Megha Engineering & Infrastructures Ltd.
Bengaluru rural and urban districts GA, Tumkur district GA, Belgaum district GA, Dharwad
19 1,895 37,199 210 120
KeralaIndian Oil-Adani Gas Pvt. Ltd.
Ernakulam 7 1100 1,608 7 4
Madhya Pradesh
Aavantika Gas Ltd, GAILGas Ltd
Dewas, Vijaipur, Gwalior GA, Indore GAincluding Ujjain city
49 37,017 78,051 148 226
Maharashtra
Mahanagar Gas Ltd,Maharashtra Natural GasLtd, Gujarat Gas Limited,Mahesh Gas Ltd, UnisonEnviro Private Limited
Mumbai, Greater Mumbai, Thane Urban,Mira Bhayender, Navi Mumbai,Ambernath, Bhiwandi, Kalyan, Dombivli,Badlapur, Ulhasnagar, Panvel, Kharghar& Taloja, Pune City including Pimpri-Chinchwad along with adjoiningcontiguous areas of Hinjewadi, Chakan &Talegaon GA, Raigarh District GA excl.areas already authorized, Palghar districtand Thane Rural GA, Pune (excludingarea already authorised), Ratnagiri
355 10,06,767 16,74,753 4,301 295
23. Status of PNG connections, CNG stations and CNG vehicles across India (Nos.) as on 01.02.2020
State Entity operating Geographical area/CityPNG connections
30 Snapshot of India's Oil & Gas data - January, 2020
CNG No. of CNG
stations vehicles Domestic Commercial Industrial
Odisha GAIL (India) Ltd.Khordha district GA, Cuttack district GA
12 4,044 502 0 0
Punjab IRM Energy Pvt. Ltd., GSPL Fatehgarh Sahib, Amritsar 17 3,184 2081 12 20
Rajasthan Rajasthan State Gas Limited Kota, Neemrana & Kukas 10 12,580 8,464 17 16
Telangana Bhagyanagar Gas Ltd. Hyderabad 59 26,215 48,875 13 28
Tripura Tripura Natural Gas Co. Ltd Agartala 13 12,380 43,741 430 51
Uttar Pradesh
GAIL Gas Ltd, Sanwariya GasLtd, Green Gas Ltd, Central U.P.Gas Ltd, Siti Energy Ltd, AdaniGas Ltd, Indian Oil-Adani GasPvt. Ltd.,Torrent Gas Pvt Ltd.,GAIL (India) Ltd., IGL
Meerut, Dibiyapur, Mathura,Agra, Kanpur ga, Bareilly GA,Lucknow district, Moradabad GA,Firozabad Geographical Area(TTZ), Khurja GA, Allahabad,Varanasi and Auraiya, KanpurDehat & Etawah, Gorakhpur,Sant Kabir Nagar & Kushinagar,Bulandshahr, Jhansi
161 1,62,304 2,35,795 482 760
Uttarakhand Indian Oil-Adani Gas Pvt. Ltd. Udham Singh Nagar, Haridwardistrict GA
3 150 8,542 21 23
West Bengal Great Eastern EnergyCorporation Ltd.
Kultora, Asansol, Raniganj,Durgapur
7 4,040 0 0 0
1,989 35,66,116 59,51,392 29,740 10,023Total
23. Status of PNG connections, CNG stations and CNG vehicles across India (Nos.) as on 01.02.2020
State Entity operating Geographical area/CityPNG connections
31 Snapshot of India's Oil & Gas data - January, 2020

Period
November 2014 - March 2015April 2015 - September 2015 October 2015 - March 2016 April 2016 - September 2016 October 2016 - March 2017 April 2017 - September 2017 October 2017 - March 2018 April 2018 - September 2018 October 2018 - March 2019 April 2019 - September 2019 October 2019 - March 2020
24. Domestic natural gas price and gas price ceiling (GCV basis)
3.69
2.893.06
3.823.062.5
Domestic Natural Gas price in US$/MMBTU
5.054.66
Gas price ceiling in US$/MMBTU
---
6.615.3
3.23 8.43
5.566.3
7.679.32
3.366.78
2.48
32 Snapshot of India's Oil & Gas data - January, 2020

33 Snapshot of India's Oil & Gas data - January, 2020

Part F: Taxes & Duties on Petroleum Products
Snapshot of India's Oil & Gas data - January, 2020

2017-18 2018-19 January 2019 Petrol* Diesel*56.43 69.88 64.31 33.11 36.9867.83 75.58 69.11 19.98 15.8368.19 82.51 73.35 3.56 2.5067.65 82.24 72.70 15.29 9.56
485.92 526.00 580.00 71.94 64.87327.50 420.93 301.61494.73 573.72 514.70 Subsidised
64.45 69.89 71.31 Domestic LPG*31.80 755.77
Basic customs 2.60 61.84 duty # 1.72 40.892.50% Rs 19.98/Ltr ** 36.12 858.502.50% Rs 15.83/Ltr **
Nil 5.00%5.00% 18.00%Nil*** 5.00%5.00% 18.00%5.00% 18.00%4.00% 18.00%5.00% 11% * **
Rs.1/MT+ Cess@20% +
Rs.50 /-MT NCCD
0.45 140 0.49 15010.22 1430 8.37 1,170
- 1,570 - 1,320
Note: The above calculations are based on RTP for February 2020.
PDS SKODomestic LPGTotal
price by $1per bbl / $10per MT
**
Domestic LPGNon Domestic LPG
Per unit impact
(₹/lit./cyl.)
Annualised financial
impact (₹crore)
Impact of changes in product price by $1 per bbl for PDS SKO and $10/MT for Domestic LPG & change in exchange rate by ₹1 per $
*2% for scheduled commuter airlines from regional connectivity scheme airports **GST Council shall recommend the date on which GST shall be levied on petroleumcrude , HSD, MS, natural gas and ATF; # Social welfare surcharge @ 3% on petroland diesel and 10% on other products is levied on aggregate duties of Customsexcluding CVD in liue of IGST.*** Customs duty is Nil for import of Domestic LPGsold to household consumers (including NDEC) by PSU OMCs. Customs duty rate is5% for other importers of domestic LPG.
Furnace Oil (Non-Fert)Impact of change in
exchange rate by ₹ 1/$
Product
Naphtha (Non-Fert)ATF
Per unit impact (₹/lit./cyl.)
Annualised financial
impact (₹crore)
Impact of change in product
Rs.1/MT+ Rs.50/-MT as
NCCDCrude Oil
PetrolDieselPDS SKO
Not Applicable
Non-PDS SKO
Exchange (Rs./$)
GST (incl GST on dealers'/distributors' commission)Retail Selling Price
Customs, excise duty & GST rates Price before taxes and dealers'/distributors' commissionDealers'/distributors' commissionProduct Excise duty GST rates
*Petrol and diesel at Delhi as per IOCL are as on 12th February 2020. PDS SKO at Mumbai as on 1st February 2020 and Subsidised Domestic LPG at Delhi as on 12th February 2020
Particulars PDS SKO*
25. Information on Prices, Taxes and Under-recoveries/SubsidiesInternational FOB prices/ Exchange rates ($/bbl) Price buildup of petroleum products (Rs./litre/Cylinder)
Particulars ParticularsCrude oil (Indian Basket) Price charged to dealers (excluding Excise Duty and VAT)
Petrol Excise DutyDiesel Dealers' Commission (Average)Kerosene
Naphtha ($/MT)
VAT (incl VAT on dealers' commission) LPG ($/MT) Retail Selling PriceFO ($/MT)
35 Snapshot of India's Oil & Gas data - January, 2020

Turnover PAT Turnover PAT
Product 2017-18 2018-19 9M, 2019-20 (P) 1,97,468 35,332 93,501 15,771
Rs./Crore 12,33,019 30,055 5,81,353 8,807Under recovery 4,672 5,950 1,651 1,40,614 2,087 59,464 -715Subsidy under DBTK # 113 117 25 4,00,986 35,163 1,90,830 18,738Total 4,785 6,067 1,676
Mar`18 Mar`19 H1, Mar`2058,030 86,359 80,38223,351 29,099 31,75620,991 27,240 29,759
2017-18 2018-19 9M, 2019-20 (P)
Rs./Crore 2016-17 2017-18 2018-19DBTL subsidy 20,880 31,447 15,348 3,35,175 3,36,162 3,48,041PME &IEC^ 25 92 51 24% 23% 20%Total 20,905 31,539 15,399 1,89,770 2,06,864 2,27,591
9% 9% 8%2017-18 2018-19 9M, 2019-20 (P) 5,24,945 5,43,026 5,75,632
Rs./CrorePMUY claims 2,496 5,489 1,232PME & IEC^ 63 34 43 2015-16 2016-17 2017-18Total 2,559 5,523 1,275 0.25 0.18 0.17
State Governments
Particulars
IOCLBPCLHPCL
Central Government% of total revenue receipts
Domestic LPG under DBTL (Direct benefit transfer for LPG)Petroleum sector contribution to Central/State Govt.
Particulars
25. Information on Prices, Taxes and Under-recoveries/SubsidiesUnder-recoveries/subsidy & burden sharing Sales & profit of petroleum sector (Rs. Crores)
Particulars 2018-19 H1, 2019-20PDS Kerosene
Upstream/midstream Companies (PSU)Downstream Companies (PSU)Standalone Refineries (PSU)Private-RIL
Borrowings of OMCs (Rs. Crores), As on
#DBTK subsidy excludes cash incentive/assistance forestablishment of institutional mechanisam for directtransfer of subsidy paid to States/UTs.
Company
ParticularsPetroleum subsidyNote: GDP figure for 2015-16 and 2016-17 are Revised Estimates and 2017-18 are Provisional Estimates
% of total revenue receiptsPMUY (Pradhan Mantri Ujjwala Yojana)Total (Rs. Crores)Particulars
Subsidy as a percentage of GDP (at current prices)
^ on payment basis (PME & IEC- Project Management Expenditure & Information Education and Communication)
36 Snapshot of India's Oil & Gas data - January, 2020

37 Snapshot of India's Oil & Gas data - January, 2020

Part G: Miscellaneous
Snapshot of India's Oil & Gas data - January, 2020

Target April-January
28,010 72,383 28,738 32,921 21,303
18,360 6,240 6,013 5,161 4,524
10,514 8,395 3,702 4,105 3,046
2,180 3,613 5,958 5,339 3,174
21,918 20,345 26,548 25,084 20,766
5,861 7,134 11,689 9,500 10,703
16,810 8,161 10,084 7,900 7,905
614 1,281 1,072 818 1,073
1,293 963 1,208 1,105 891
500 387 459 455 376
73 78 125 40 29
- - 87 1212 79
1,06,133 1,28,981 95,684 93,639 73,869
Includes expenditure on investment in JV/subsidiaries. (P) Provisional; # Included from 2018-19.
Bharat Petroleum Corp. Ltd (BPCL)
Mangalore Refinery & Petrochem Ltd (MRPL)
Chennai Petroleum Corp. Ltd (CPCL)
Numaligarh Refinery Ltd (NRL)
Balmer Lawrie Co. Ltd (BL)
Total
Engineers India Ltd (EIL) #
Hindustan Petroleum Corp. Ltd (HPCL)
26. Capital expenditure of PSU oil companies(Rs in crores)
Company 2016-17 (P) 2017-18 (P) 2019-20 (P)
ONGC Ltd
ONGC Videsh Ltd (OVL)
Oil India Ltd (OIL)
GAIL (India) Ltd
Indian Oil Corp. Ltd. (IOCL)
2018-19 (P)
39 Snapshot of India's Oil & Gas data - January, 2020

Weight (MT)
Volume (KL)
Barrel (bbl)
1 1.844 11.601 1.411 8.881 1.210 7.611 1.285 8.081 1.288 8.101 1.172 7.371 1.0424 6.741 1.170 7.33
200 Nautical Miles
4,541 SCM/day
1 Standard Cubic Metre (SCM) 35.31 Cubic Feet
220 MW
1 MMBTUGCV (Gross Calorific Value)NCV (Net Calorific Value)Gas required for 1 MW power generationPower generation from 1 MMSCMD of gas
370.4 Kilometers 1 Kilowatt-hour (kWh)
1 MT of LNG 1,325 SCM
3,412 Btu
Natural gas conversions
1 Million Metric Tonne Per Annum (MMTPA) of LNG
3.60 MMSCMD
1 Billion Cubic Metres (BCM)/year of Gas 2.74 MMSCMD1 Trillion Cubic Feet (TCF) of Gas Reserve 3.88 MMSCMD
25.2 SCM @10000 kcal/SCM
10,000 kcal/SCM90% of GCV
3.968 BtuExclusive Economic Zone 1 Kilowatt-hour (kWh) 860 kcal
Aviation Turbine Fuel (ATF) 1 Million barrels per day 49.8 MMTPALight Diesel Oil (LDO) Energy conversionFurnace Oil (FO) 1 Kilocalorie (kcal) 4.187 kJCrude Oil 1 Kilocalorie (kcal)
Diesel (HSD) 1 US Gallon 3.78 litresKerosene (SKO) 1 Kilo litre (KL) 6.29 bbl
LPG 1 US Barrel (bbl) 159 litresPetrol (MS) 1 US Barrel (bbl) 42 US Gallons
27. Conversion factors and volume conversionWeight to volume conversion Volume conversion
Product From To
40 Snapshot of India's Oil & Gas data - January, 2020