Smoking impact on oral candidiasis in HIV- infected patients
204
See discussions, stats, and author profiles for this publication at: https://www.researchgate.net/publication/286946600 Smoking impact on oral candidiasis in HIV- infected patients Article · January 2015 CITATIONS 0 READS 326 5 authors, including: Some of the authors of this publication are also working on these related projects: Infections in patients with chronic hepatitis C treated with pegylated-Interferon View project community-acquired pneumonia View project Iosif Marincu Victor Babes University of Medicine and Phar… 114 PUBLICATIONS 341 CITATIONS SEE PROFILE Emilian Damian Popovici Victor Babes University of Medicine and Phar… 17 PUBLICATIONS 95 CITATIONS SEE PROFILE Stefan Mihaicuta Victor Babes University of Medicine and Phar… 131 PUBLICATIONS 125 CITATIONS SEE PROFILE Daliborca Cristina Vlad Victor Babes University of Medicine and Phar… 52 PUBLICATIONS 99 CITATIONS SEE PROFILE All content following this page was uploaded by Iosif Marincu on 02 February 2016. The user has requested enhancement of the downloaded file.
-
Upload
khangminh22 -
Category
Documents
-
view
0 -
download
0
Transcript of Smoking impact on oral candidiasis in HIV- infected patients

Seediscussions,stats,andauthorprofilesforthispublicationat:https://www.researchgate.net/publication/286946600
SmokingimpactonoralcandidiasisinHIV-infectedpatients
Article·January2015
CITATIONS
0
READS
326
5authors,including:
Someoftheauthorsofthispublicationarealsoworkingontheserelatedprojects:
InfectionsinpatientswithchronichepatitisCtreatedwithpegylated-InterferonViewproject
community-acquiredpneumoniaViewproject
IosifMarincu
VictorBabesUniversityofMedicineandPhar…
114PUBLICATIONS341CITATIONS
SEEPROFILE
EmilianDamianPopovici
VictorBabesUniversityofMedicineandPhar…
17PUBLICATIONS95CITATIONS
SEEPROFILE
StefanMihaicuta
VictorBabesUniversityofMedicineandPhar…
131PUBLICATIONS125CITATIONS
SEEPROFILE
DaliborcaCristinaVlad
VictorBabesUniversityofMedicineandPhar…
52PUBLICATIONS99CITATIONS
SEEPROFILE
AllcontentfollowingthispagewasuploadedbyIosifMarincuon02February2016.
Theuserhasrequestedenhancementofthedownloadedfile.

1024
* For correspondence.
Journal of Environmental Protection and Ecology 16, No 3, 1024–1032 (2015)
Biochemical and bio-protection
NON-WOOD FOREST PRODUCTS FROM THE UNDERSTORY AND IMPLICATIONS FOR RURAL DEVELOPMENT: THE CASE OF A BROADLEAF DECIDUOUS OAK FOREST (Quercus frainetto T e n.) IN CHALKIDIKI, GREECE
E. M. ABRAHAMa*, Κ. THEODOROPOULOSb, Ε. ELEFTHERIADOUb, A. RAGKOSc, Α. P. KYRIAZOPOULOSd, Ζ. Μ. PARISSIa, G. ARABATZISe, K. SOUTSASf
aLaboratory of Range Science, Department of Forestry and Natural Environment, AUTh, 54 124 Thessaloniki, Greece E-mail: [email protected] bLaboratory of Forest Botany – Geobotany, Department of Forestry and Natural Environment, AUTh, 54 124 Thessaloniki, Greece cDepartment of Agricultural Technology, ATEI, 57 400 Sindos, Thessaloniki, Greece dLaboratory of Range Science, Department of Forestry and Management of the Environment and Natural Resources, DUTh, 193 Pantazidou Street, 68 200 Orestiada, Greece eLaboratory of Forest Economics, Department of Forestry and Management of the Environment and Natural Resources, DUTh, 193 Pantazidou Street, 68 200 Orestiada, Greece fLaboratory of Forest Policy, Department of Forestry and Management of the Environment and Natural Resources, DUTh, 193 Pantazidou Street, 68 200 Orestiada, Greece
Abstract. Forest products can be distinguished into wood and non-wood. Non-wood forest products are defined as all the products other than wood derived from forests, shrubs and tree plantations. The main sources of these products are trees, understory plants, mushrooms, and animals. The purpose of the present study was to record the herbaceous and woody taxa of the understory of a deciduous oak forest in Cholomon Chalkidiki, Greece and to classify them into the following categories based on their potential use according to the FAO criteria: (1) Edible; (2) Medicinal and aromatic; (3) Forage; (4) Ornamental, and (5) Dyes. A total of 275 herbaceous and woody taxa were recorded. The majority (76%) of the recorded taxa was classified in one or more of the above categories and their economic value was assessed in terms of their potential uses. Then, the implications of the potential develop-ment of commercial activities based on these plants were investigated with a SWOT (Strengths, Weaknesses, Opportunities and Threats) analysis. It is demonstrated that there are opportunities for the sector which would be beneficial for the local population.
Keywords: medicinal and aromatic species, edible, forages, dyes, FAO criteria, regional develop-ment, local products.
1025
AIMS AND BACKGROUND
Non-wood forest products (NWFP) according to definition of FAO (Ref. 1) are ‘products of biological origin other than wood, derived from forests, shrublands and tree plantations’. These products are produced from trees, understory plants, fungi or animals and collected from forests or cultivated. Many of the NWFP have commercial value and important contribution to the economy on local and national level. The non-wood plant species of commercial importance worldwide are estimated to be 4000 to 6000 (Ref. 2). In some areas of the Mediterranean basin, NWFP such as cork, mushrooms and pine nuts are more profitable than timber3.
Despite the importance of NWFP, the sustainable management of forests has been traditionally focused on timber production. However, in the recent decades the interest for NWFP has been increased, as a result of the international shift to multifunctional sustainable forest management, which aims at optimising the provision of multiple goods and services, while maintaining the equilibrium of forest ecosystems. Within this framework the promotion and utilisation of NWFP is identified as a priority area by the FAO (Ref. 4). However, the particularities in harvesting these products distinguish their management from that of timber. For example, some NWFP have short harvesting period and products perish soon after this period3. Additionally, their frequent, uncontrollable and illegal harvest may have negative effects on the forest ecosystem3.
Oak forests provide a great number of NWFP, many of which have been used by people for thousands of years and have commercial value. A lot of these products provided by the understory plants are edible, ornamental and medicinal or aromatic. Additionally, the understory vegetation is grazed or browsed by live-stock as the majority of the oak forests are considered as agroforestry systems5. Lately, the recognition of the multiple uses and commercial value of NWFP has provided the grounds for support and development of systematic economic activi-ties at the local level based on their processing and marketing. The introduction of such activities constitutes an example of a development process which takes advantage of local resources and know-how6. This may in turns shape a part of an area identity, rather than induces the introduction of new activities, which may not be compatible with local culture and particularities. European Union (EU) poli-cies for rural development, recently reformed and expressed through Regulation EC/1305/2013, encourage such activities which contribute to the diversification of the rural economy at the local level and the provision of additional income7. The role of NWFP in rural development has been acknowledged since over 20 years8 and relevant paradigms have been reported for developing countries9. In Greece, there are limited data regarding the actual commercial use of NWFP, nonetheless empirical evidence reveals only little expansion, as such activities are scattered and mainly undertaken by individuals who seek to ensure additional incomes.

1026
The aim of the present study was to record the understory taxa in an oak forest in Cholomon mountain, to classify them in categories according to their use and to investigate the possibilities of development of commercial activities at the area based on the processing of these products.
EXPERIMENTAL
The research was conducted in the University forest of Taxiarchis-Vrastama, Chalkidiki, northern Greece (longitude: 23ο28′–23ο34′, latitude: 40ο23′–40ο28′). The oak forest (pure or mixed with beech) covers an area of 1951 ha. The bio-climate of the study area is classified as Mediterranean wet with harsh winters10. The natural potential vegetation belongs to the alliance Quercion confertae, order Quercetalia pubescentis11.
The two communities of Taxiarchis and Vrastama, with a population of 1898 people12, are situated near Polygyros town, which is the administrative center of the area, about 60 km from the local economic centre of Thessaloniki and very near to the heavily developed coastal zone of Chalkidiki. Nonetheless, they ex-hibit poor economic performance, as the sources of income and employment are limited and tourist activities can not be supported. The main economic activity is agriculture and livestock farming, at a smaller extent, while forestry contributes only trivially to the local economy.
The first step of the study was the formulation of species list of the understory plants based on the phytosociological data of Quercus frainetto University forest of Taxiarchis-Vrastama, Chalkidiki, Greece11. Nomenclature of families, species and subspecies was updated following Dimopoulos et al.13 A review of the Greek14 and the international literature of printed15–17 and online databases18 followed in order to investigate the potential uses of the listed herbaceous and woody taxa of the understory. The taxa were classified into the following categories based on their potential use according to the FAO criteria: (1) Edible; (2) Medicinal and Aromatic; (3) Forage; (4) Ornamental, and (5) Dye.
The possibilities of introduction of economic activities based on NWFP were investigated with a SWOT (Strengths, Weaknesses, Opportunities and Threats) analysis19. This method constitutes a tool for a qualitative approach of a project or an issue and is based on recording factors from the internal and the external environ-ment20. The former factors were categorised as Strengths and Weaknesses, while the latter as Opportunities and Threats, with the initials of each category of factors formulating the name of the method. The internal environment was described in terms of comparative advantages and disadvantages linked to the implementation of a project. The external environment was analysed through existing advantages, which can be used to benefit the project, and of potential problems that may arise in the future, in order to mitigate their adverse effects. One of the main advantages

1027
of this method is its ability to assist the analysis of a situation even in cases where only little relevant data are available.
RESULTS AND DISCUSSION
The taxa (species and subspecies) recorded in the understory of the Cholomon oak forest were 275 and were categorised to 57 families. The taxa that were classified in one or more of the above categories according to their use were 208, i.e. 76% of the plant species list. Specifically, 98 were categorised as edible, 123 as medicinal and aromatic, 80 as forage, 141 as ornamental and 25 as dyes; their respective percentages on the total of taxa was 36, 45, 29, 51 and 9%, respectively. Arbutus unedo, Cistus creticus, Quercus coccifera, Q. ilex and Q. pubescens were included in all the categories.
The Rosaceae family was represented in all the categories, while the Fabaceae and Poaceae were dominated to the forages (Table 1). The families Aceraceae, Al-liaceae, Aquifoliaceae, Araceae, Asparagaceae, Boraginaceae, Convolvulaceae, Cu-pressaceae, Dioscoraceae, Fumariaceae, Iridaceae, Orobanchaceae, Polygonaceae, Polypodiaceae, Ruscaceae and Scrophulariaceae that were represented in one or more categories with only one taxon were not reported in Table 1. Additionally, the families Chenopodiaceae, Cornaceae, Juglandaceae and Plantaginaceae were represented in all the categories except the forage by the taxa Chenopodium album, Cornus mas, Juglans regia and Plantago lanceolata, respectively.
Many of the taxa presented above have alternative uses and are endowed with commercial value (Table 2). For example, the economic and environmental value of chestnut and walnut in agroforestry systems is known in Europe and other places of the world21,22. The fruits of A. unedο, C. mas, and Rubus canescens are consumed raw or are used for jams and liqueurs. These products are channeled to markets, contributing to the increase of the tourism in the rural areas and to the establishment of social movements such as the Slow Food23. In particular, the fruits of A. unedο are used in yoghurt, in cereals for breakfast and in cooking as pigment24. Additionally, the fruits of A. unedο are of high nutritive value as they contain a wide range of antioxidants including vitamin C and E, carotenoids and polyphenolic compounds25. Similarly, the fruits of C. mas are considered as a source of mineral elements for human consumption26.

1028
Table 1. Number of taxa per family and category of useFamily Edible Medicinal
and aromaticForage Ornamental Dyes
Apiaceae 3 4 2Asphodelaceae 2 5 6 1Asteraceae 5 2 1 9 1Brassicaceae 3 2 1Campanulaceae 1 2Caprifoliaceae 1 2 2Caryophyllaceae 3 2 3Cistaceae 2 2 2 2 1Convalariaceae 1 1 2Crassulaceae 3 2 4Ericaceae 4 3 2 4 1Fabaceae 8 8 38 8Fagaceae 6 7 4 7 3Geraniaceae 5 2 1Hyacinthaceae 2 2 2Hypericaceae 1 2 2 1Lamiaceae 6 6 6 2Liliaceae 1 1 2Oleaceae 4 2 2 2Orchidaceae 2 3 5Poaceae 6 19 7Primulaceae 3 4 5Ranunculaceae 1 3 4Rosaceae 15 15 11 15 3Rubiaceae 3 3 4 3Saxifragaceae 2Valerianaceae 2 2 1Veronicaceae 2 5 5Violaceae 2 2 3 1

1029
Table 2. Main taxa with commercial value per category of useEdible Medicinal and
aromaticForage Ornamental Dyes
Arbutus unedo Arbutus unedo Dactylis glomerata
Briza media Arbutus unedo
Asparagus acuti-folius
Crataegus mo-nogyna
Medicago spp.
Campanula spp. Cistus creticus
Castanea sativa Digitalis lanata Poa spp. Crocus pulchellus Hedera helixCornus mas Dioscorea com-
munisTrifolium spp.
Cyclamen hederi-folium
Juglans regia
Fragaria vesca Hypericum perfo-ratum
Vicia spp. Dianthus cruentus Prunus spp.
Juglans regia Origanum vulgare Geranium spp. Quercus spp.Malus domestica Thymus sibthorpii Ilex aquifoliumOriganum vulgare Lilium martagonRubus canescens Lonicera caprifo-
liumThymus sibthorpii Poa pratensis
Primula spp.Sanguisorba minorTrifolium repensViola spp.
The harvesting and consumption of edible and aromatic plant species such as Asparagus acutifolius, Origanum vulgare and Thymus sibthorpii is a common practice in the Mediterranean basin27,28. A. acutifolius is an excellent food in all the Mediterranean countries29 and its nutritive value is higher than that of the cultivated Asparagus officinalis30.
Medicinal plant species are used in traditional medicine but also are essential ingredients of the synthetic drugs for pharmacological treatment. According to the World Health Organisation, about 11% of the basic and essential drugs are exclusively of plant origin such as the digoxin of Digitalis spp.31 There is a grow-ing interest in therapeutic use of natural products derived from plants in Europe. Hypericum perforatum is among the ten plant species with the higher use32.
Many of the plant species of the understory are used as ornamental such as the Ilex aquifolium especially during the Christmas days in Greece. Moreover, there is a growing interest for products with natural dyes mainly for handmade tour-ist and folklore products33. Finally, the understory plants of the broadleaved oak forests are used as forages7. The forage nutritive value is highly related with the species composition of the understory. The taxa categorised as forages in Τable 2 are palatable plant species with high nutritive value for livestock.
According to the above presentation the understory plant species, which are usually gathered by local people of rural areas either for their own use or for com-

1030
mercial purposes, provide a broad range of products. As mentioned above, limited official data regarding their trade in Greece exist but the recognition of particular uses of these products increases their market value and highlights their potential systematic commercial use, with considerable benefits within a generalised rural development framework.
The SWOT analysis of the potential development of commercial activities, based on NWFP (Table 3), illustrates that these products are endowed with con-siderable comparative advantages, mainly linked to their beneficial attributes and the generation of income and employment in the area. The rich biodiversity of the understory of the local forest constitutes a serious strength. Disadvantages are detected in the lack of infrastructure and know-how, which may burden production costs. Nonetheless, among the opportunities for such a project are the considerable policy incentives, through which financial support can be obtained. The external environment also provides opportunities for the marketing of NWFP by taking advantage of the large market of Thessaloniki, through a campaign focusing on the local nature of the products and on specific segments of the market, within which there is increased demand. Threats in the external environment include the economic crisis, the competition from imported products and, more important, the formulation of the proper institutional environment which would ensure the sustainable use of NWFP. For this reason, the legislative framework should be properly revised in order to accommodate all the alternative uses of the forest and to allow the development of sustainable commercial activities, such as the ones described here. It has to be noted that uncontrolled harvesting is actually observed, although the local forest services have set out regulations about the season, the method and the quantity of gathering for each product.
Table 3. SWOT analysis of the development of commercial activities based on NWFP in the study areaStrengths– Use of labour available in the area and ad-ditional income for locals– High quality of products and considerable biodiversity, which results in the availability of numerous products– NWFP are endowed with therapeutic, or-namental and aromatic attributes
Weaknesses– Lack of proper know-how for manufactur-ing of products– High production costs– Lack of infrastructure
Opportunities– Developing market– Marketing based on the origin of the products – The adjacent large market of Thessaloniki– Favourable policies in force (Reg. EC/1305/2013) and government incentives– Development of culinary activities using NWFP
Threats– Competition from imported products from countries with already developed activities based on NWFP– Environmental restrictions and lack of legislative framework– Economic crisis– Unsustainable harvesting of NWFP for commercial purposes
1031
CONCLUSIONS
The majority (76%) of the recorded taxa were classified in one or more of the po-tential use categories. Many of these plant species have commercial value, thus they could essentially contribute to the increase of the income of the local communities. Sustainable multifunctional forest management is required for the improved har-vesting and the sustainable use of NWFP. The introduction of commercial activities is feasible, as demonstrated in the SWOT analysis, with considerable advantages and few institutional problems to deal with. Market-based activities using forest resources in a sustainable manner may provide local populations with additional income and employment, thus contributing directly to rural development.
REFERENCES1. FAO: Resource Assessment of Non-wood Forest Products. Source: http://www.fao.org/forestry
(1999).2. SCBD (Secretariat of the Convention on Biological Diversity): Sustainable Management of Non-
timber Forest Resources. CBD Technical Series 6. Secretariat of the Convention on Biological Diversity, Montreal, Canada, 2001.
3. R. CALAMA, M. TOMÉ, M. SÁNCHEZ-GONZÁLEZ, J. MIINA, K. SPANOS, M. PALAHÍ: Modelling Non-wood Forest Products in Europe: A Review. Forest Syst, 19, 69 (2010).
4. FAO: Non-wood Forest Products. Source: http://www.fao.org/forestry (2002).5. V. P. PAPANASTASIS, K. MANTZANAS, O. DINI-PAPANASTASI, I. ISPIKOUDIS: Tradi-
tional Agroforestry Systems and Their Evolution in Greece. In: Agroforestry in Europe: Current Status and Future Prospects (Eds A. Rigueiro-Rodríguez, J. McAdam, M. R. Mosquera-Losada). Advantages in Agroforestry, 6, 89 (2008).
6. P. LOWE, H. BULLER, N. WARD: Setting the Next Agenda? British and French Approaches to the Second Pillar of the Common Agricultural Policy. J Rural Stud, 18, 1 (2002).
7. L. BUTTOLPH, E. T. JONES: Forest Transplants: A Brief Introduction to Marketing Understory Plants from Small Private Forestlands in the Pacific Northwest. Income Opportunities for Small Woodland Owners: Fact Sheet Series No 14, November 2012. Retrieved 15/7/2014 from http://www.ntfpinfo.us/ docs/ifcae/Buttolph2012-FactsheetNTFPTransplantsv112412.pdf (2012).
8. FAO: Non-wood Forest Products for Rural Income and Sustainable Forestry. http://www.me-konginfo.org/assets/midocs/0001410-environment-non-wood-forest-products-for-rural-income-and-sustainable-forestry.pdf (1995).
9. L. LINTU: Trade and Marketing of Non-wood Forest Products. In: Report of the International Expert Consultation on Non-wood Forest Products, Yogyakarta, Indonesia, 17-27/1, Rome, 1995, 195–222.
10. L. EMBERGER: Une classification biogeographique des climats. Rec Trav Lab Bot Geol, 7, 3 (1955).
11. K. G. THEODOROPOULOS: Classification of Vegetation in Taxiarchis University Forest. Chalkidiki Sci Ann Depart Forest and Nat Environ (Thessaloniki), 22 (18), 200 (1991) (in Greek).
12. ELSTAT (Helenic Statistic Authority): Results of the 2011 Population Census. Retrieved from http://www.statistics.gr/portal/page/portal/ESYE/PAGE-census2011 on 16/7/2014 (2014).
13. P. DIMOPOULOS, T. RAUS, E. BERMEIER, TH. CONSTANTINIDIS, G. IATROU, S. KOK-KINI, A. STRID, D. TZANOUDAKIS: Vascular Plants of Greece: An Annotated Checklist. Botanischer Garden und Botanisches Museum Berlin-Dahlem, Berlin, Hellenic Botanical Society, Athens (Englera 31), 2013. 372 p.
14. E. PAPADAKI: Dyeing Plants of Crete and Painting Techniques. Ph. D. Thesis, TEI of Crete, 2010. 59 p.

1032
15. G. FISCHER, E. KRUG: Heilkräuter und Arzneipflanzen: Bennenung, Vorkommen, Inhalt, Heilwirkung und Anwendung der Heilpflanzen der europ., subtrop., trop. und übersee. Flora. Haug Verlag, Heidelberg, 1978. 327 p.
16. A. DELLA, D. PARASKEVA-HADJICHAMBI, A. HADJICHAMBIS: An Ethnobotanical Survey of Wild Edible Plants of Paphos and Larnaca Countryside of Cyprus. J Ethnobiol Ethnomed, 2, 34 (2006).
17. A. C. HADJICHAMBIS, D. PARASKEVA-HADJICHAMBI, A. DELLA, M. E. GIUSTI, C. de PASQUALE, C. LENZARINI, E. CENSORII, M. R. GONZALES-TEJERO, C. P. SANCHEZ-ROJAS, J. M. RAMIRO-GUTIERREZ, M. SKOULA, C. JOHNSON, A. SARPAKI, M. HMAMOUCHI, S. JORHI, M. El-DEMERDASH, M. El-ZAYAT, A. PIERONI: Wild and Semi-domesticated Food Plant Consumption in Seven Circum-Mediterranean Areas. Int J Food Sci Nutr, 59 (5), 383 (2008).
18. PFAF: http://www.pfaf.org/user/plantsearch.aspx (2013).19. T. HILL, R. WESTBROOK: SWOT Analysis: It’s Time for a Product Recall. Long Range Plann,
30, 46 (1997).20. B. N. JYOTHI, G. R. BABU, I. V. M. KRISHNA: Object Oriented and Multi-scale Image
Analysis: Strengths, Weaknesses, Opportunities and Threats – A Review. J Comput Sci, 4, 706 (2008).
21. G. H. Mc GRANAHAN, C. LESLIE: Walnuts (Juglans). Acta Hort, 290, 905 (1990). 22. G. BOUNOUS: The Chestnut: A Multipurpose Resource for the New Millennium. Acta Hort,
693, 33 (2005).23. SLOW FOOD: Slow Food International. http://www.slow food.com (accessed March, 2014)
(2014).24. M. L. C. M. M. ALARCÃO-E-SILVA, E. B. LEITÃO, H. G. AZINHEIRA, M. C. A. LEITÃO:
The Arbutus Berry: Studies on Its Colour and Chemical Characteristics at Two Mature Stages. J Food Compos Anal, 14, 27 (2001).
25. L. BARROS, A. M. CARVALHO, J. S. MORAIS, I. C. F. R. FERREIRA: Strawberry-tree, Blackthorn and Rose Fruits: Detailed Characterisation in Nutrients and Phytochemicals with Antioxidant Properties. Food Chem, 120, 247 (2010).
26. M. KROSNIAK, M. GASTOŁ, M. SZAŁKOWSKI, P. ZAGRODZKI, M. DERWISZ. 2010. Cornelian Cherry (Cornus mas L.) Juices as a Source of Minerals in Human Diet. J Toxicol Environ Health A, 73 (17–18), 1155 (2010).
27. K. KARABODUK, O. KARABACAK, H. KARABODUK, T. TEKINAY: Chemical Analysis and Antimicrobial Activities of the Origanum vulgare subsp. hirtum. J Environ Prot Ecol, 15 (3A), 1283 (2014).
28. G. OZDEMIR, C. SAGLAM: Sustainable Use of Medicinal Aromatic Plants and Employment of Women in Its Production: Case of Kumbag–Ucmakdere Area. J Environ Prot Ecol, 11 (4), 1382 (2010).
29. M. MOLINA, M. PARDO-de-SANTAYANA, E. GARCÍA, L. ACEITUNO-MATA, R. MO-RALES, J. TARDÍO: Exploring the Potential of Wild Food Resources in the Mediterranean Region: Natural Yield and Gathering Pressure of the Wild Asparagus (Asparagus acutifolius L.). Span J Agr Res, 10 (4), 1090 (2012).
30. L. FERRARA, R. DOSI, A. di MARO, V. GUIDA, G. CEFARELLI, S. PACIFICO, C. MAS-TELLONE, A. FIORENTINO, A. ROSATI, A. PARENTE: Nutritional Values, Metabolic Profile and Radical Scavenging Capacities of Wild Asparagus (A. acutifolius L.). J Food Compos Anal, 24 (3), 326 (2011).
31. S. M. K. RATES: Plants as Source of Drugs. Toxicon, 39, 603 (2001).32. J. GRÜNWALD, C. JÄNICKE: Grüne Apotheke. Gräfe und Unzer, München, 2004. 416 p. 33. D. J. HILL: Is There a Future in Natural Dyes? Color Technol, 27, 18 (1997).
Received 28 May 2015 Revised 11 June 2015
1033
* For correspondence.
Journal of Environmental Protection and Ecology 16, No 3, 1033–1040 (2015)
Biochemical and bio-protection
DETERMINANTS OF SUSTAINABLE INNOVATIVE BEE PRODUCTS IN FRANCE AND ROMANIA
A. A. POPOVICIa, L. AL. MARGHITASa, D. S. DEZMIREANa, M. ILEAb*aDepartment of Apiculture and Sericulture, University of Agricultural Sciences and Veterinary Medicine, 3–5 Calea Manastur, 400 372 Cluj-Napoca, Romania bDepartment of Economics, University of Agricultural Sciences and Veterinary Medicine, 3–5 Calea Manastur, 400 372 Cluj-Napoca, Romania E-mail: [email protected]
Abstract. The attention towards environmentally sustainable innovative products and sustainable consumption has significantly increased in the last decade. Practicing beekeeping is a sustainable activity as it contributes to the conservation of biodiversity and safeguarding ecosystem services, along with the development of communities. Based on data from 160 apicultural enterprises from Romania and 100 from France, the present paper emphasizes the fact that innovative bee products are environmentally sustainable products. The research identifies similarities regarding the determinants of sustainable innovative bee products in the two countries. The search for new markets, proactiveness, discovery and exploitation of opportunities, investments in promotion and advertising, risk taking, higher turnover and the diversification of distribution channels and sold products were identified as determinants of innovative bee products in both countries. The findings of the research suggest that in France the customer orientation and the size of the apiary influence the creation of sustainable innovative bee products. In Romania, apicultural enterprises that have sustainable innovative bee products practice organic beekeeping. Innovative bee products represent an essential component of sustainability and should be promoted as they provide value for consumers and the environment.
Keywords: sustainable innovative bee products, customer orientation, organic beekeeping.
AIMS AND BACKGROUND
The aim of the present paper is to emphasise the fact that innovative bee products are sustainable products. Moreover, the purpose of the research is to identify the determinants of sustainable innovative bee products within apicultural enterprises from France and Romania.
The business management is currently adopting environmental practices that are less detrimental to the natural environment1. Firms concern towards the environ-ment can be observed2, as the economic development should imply the harmonious combination of actions directed towards profit and the environmental protection3. As for the consumers, there has recently been an increase in the interest in healthy foods and organic products4. Consumers demand for food that is obtained using
1034
sustainable practices is growing5. Environmentally sustainable innovative products provide customer and business value, while decreasing the environmental impact6.
The role of bees in agriculture, in maintaining biodiversity, sustainable livelihoods and food security has been widely prooved7. Beekeeping preserves the ecosystem and brings economic benefits to rural communities8. Beekeeping can be an important sustainable and alternative source of income in rural areas9. The capitalisation of the local beekeeping potential leads to the implementation of strategies for the sustainable development of rural communities10. Apicultural enterprises are small food firms which are considered a means of achieving sus-tainable economic growth in local economies11.
Various determinants and success factors of environmentally sustainable product innovation have been identified in the literature: consumers willing and able to acquire such innovations12,13, customer requirements13,14, market knowledge and organisational adaptation towards market characteristics1,15,16, proactive firms17, new markets13, discovery and exploitation of opportunities18, higher turnover13, propensity for risk-taking19, firm size20,21.
The present study fills a gap in the literature on eco-innovative products as there is a lack of econometric analyses recognizing common cross-country deter-minants of these products.
EXPERIMENTAL
Data were collected by means of an email survey sent to the owners of 1300 apicultural enterprises in France and 1300 apicultural enterprises from Romania, from July until October 2014. A number of 100 valid responses from France and 160 from Romania were obtained and were analysed using SPSS statistical pro-gram v. 19 (Ref. 22). The survey included questions related to the production of innovative bee products, customer orientation, apiary size (number of honeybee colonies), type of beekeeping practiced, the diversification of the distribution chan-nels and sold products. The production and selling of innovative bee products was measured using a five-point Likert-type scale and the statement: ‘The enterprise has company-specific innovative products that it currently sells’.
The present study identifies what mainly triggers the creation of innovative bee products by testing the association between several variables and the innovative bee products, using the Pearson χ2 (chi square) test. The following variables are tested: type of beekeeping practiced, apiary size, turnover increase, introducing new products ahead of competition, discovery and exploitation of opportunities, investments in promotion and advertising, search for new markets, propensity for high risk projects, customer orientation. Thus, the following two hypotheses are formulated: the null hypothesis H0: there is no significant association between

1035
the variables, and the alternative hypothesis – H1: there is significant association between the variables.
Also, the univariate analysis is applied in the case of the quantitative variables. In order to test whether the mean of the quantitative variables differs significantly in the two categories of apicultural enterprises (the category of apicultural enter-prises that has innovative products and the category of apicultural enterprises that does not have innovative products), the Student t-test was applied23. The catego-risation was performed following the answers to the statement: ‘The enterprise has company-specific innovative products that it currently sells’. The enterprise which stated that it totally or partially agreed with this statement was included in the category ‘has innovative products’ and the enterprise which stated that it does not agree was included in the category ‘does not have innovative products’. Therefore, the impact of the number of bee products sold (honey, pollen, propolis, royal jelly, wax, venom, swarms, queens, honeycombs, beekeeping equipment) and the number of distribution channels (selling to friends and acquaintances, selling to the local market, selling in specialised shops, selling in one’s own shop, selling to processors, selling to retail chains, online) upon innovative bee products is analysed. The following two hypotheses are formulated – H0: the mean of the variable in the case of apicultural enterprises that have innovative products does not differ significantly from the mean of the variable in the case of apicultural enterprises that do not have innovative products, and H1: the mean of the variable in the case of apicultural enterprises that have innovative products differs signifi-cantly from the mean of the variable in the case of apicultural enterprises that do not have innovative products.
RESULTS AND DISCUSSION
Innovative bee products are environmentally sustainable products because they are market-oriented, cause the minimum environmental impact possible15,24, provide healthy high-nutrient food and safe medicines (apitherapy)9. Innovative bee prod-ucts can be considered eco-innovations as they aim at significant and demonstrable progress towards the goal of sustainable development, through reducing impacts on the environment25.
Following the χ2 test, the obtained significance levels are less than 0.05, which demonstrates that there is a significant connection between the variables and the development of innovative bee products (Tables 1 and 2).
Table 1 presents the main factors that influence the development of innovative bee products within Romanian apicultural enterprises.

1036
Table 1. Determinants of innovative bee products in RomaniaVariable χ2 df Asymp. sigType of beekeeping practiced (Organic/Conventional) 67.094 8 0.000Turnover increase 14.451 4 0.006Propensity for high risk projects 40.477 16 0.001Introducing new products ahead of competition (Proac-
tiveness)129.080 16 0.000
Discovery and exploitation of opportunities 32.887 16 0.008Promotion and advertising 40.455 16 0.001Search for new markets 28.544 16 0.027df – degrees of freedom. Source: own calculations based on the survey.
In Romania, the development of innovative bee products is influenced by the practice of organic beekeeping as organic farming is based on the principles of en-vironment protection, saving of the non-renewable energy resources, protection of population health as well as preserving farming jobs and maintaining biodiversity4.
In France, a significant relationship exists between customer orientation (‘understanding of customers’ needs’, ‘poll customers to assess the quality of the products’, ‘customer monitoring’) and innovative bee products, as demonstrated by the scientific literature12–14 (Table 2).
Table 2. Determinants of innovative bee products in France Variable χ2 df Asymp. sigSize of the apiary (No. of honeybee colonies) 29.429 16 0.021Turnover increase 28.996 4 0.000Propensity for high risk projects 46.034 16 0.000Introducing new products ahead of competition (Proactiveness) 69.905 16 0.000Discovery and exploitation of opportunities 44.894 16 0.000Promotion and advertising 40.399 16 0.001Search for new markets 43.756 16 0.000Understanding of customers needs 59.326 16 0.000Poll customers to assess the quality of the products 33.208 16 0.007Customer monitoring 27.873 16 0.033Source: own calculations based on the survey.
Sustainable product innovation is influenced by an increase in the consumer involvement, supporting more effectively the benefits of sustainable food products and promoting more sustainable lifestyles26. There is also a strong connection between the size of the apiary and the development of innovative bee products within French apicultural enterprises. The larger the apicultural enterprise, the more innovative bee products it has. Eco-innovations seem to be more often realised by bigger firms as they have more resources to develop innovations20,21. A similarity
1037
between the two countries regarding the determinants of sustainable innovative bee products was found regarding the investments in promotion and advertising, search for new markets, introducing new products ahead of competition (proac-tiveness), discovery and exploitation of opportunities and the propensity for high risk projects with chances of very high returns.
The discovery and exploitation of opportunities influence the creation of sustainable innovative bee products, as these strategies are considered to be at the core of sustainable entrepreneurship18. There is a significant connection between apicultural enterprises willingness to take risks and sustainable innovative bee products, as these firms should have the skills, resources, and willingness to accept the risk presented by the environmental opportunity19. Finally, these apicultural enterprises are rewarded with high returns and turnover increase. The results of the study show that there is a strong connection between sustainable innovative bee products and the increase of the enterprises turnover in both countries. A connection between eco-innovations and a higher turnover was also found by Horbach et al.13.
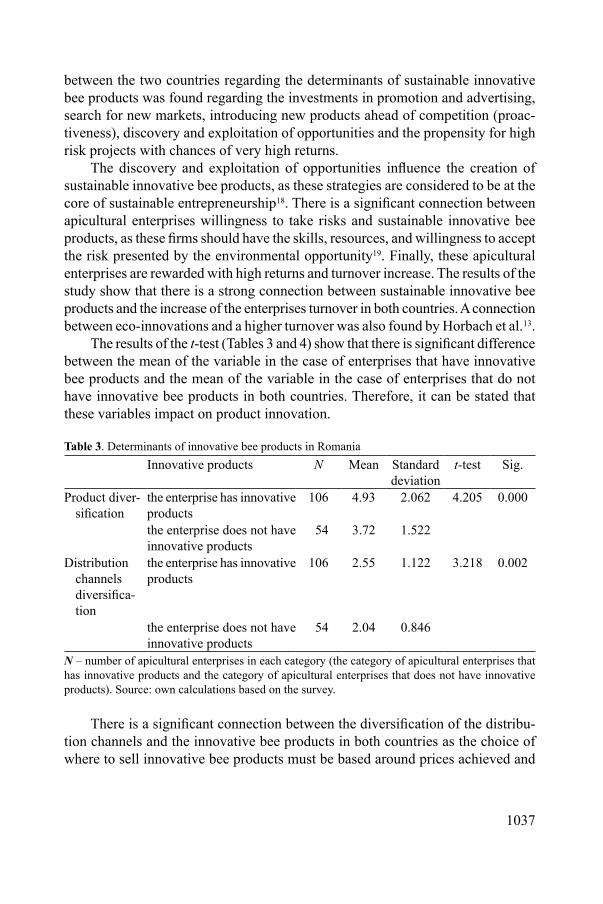
The results of the t-test (Tables 3 and 4) show that there is significant difference between the mean of the variable in the case of enterprises that have innovative bee products and the mean of the variable in the case of enterprises that do not have innovative bee products in both countries. Therefore, it can be stated that these variables impact on product innovation.
Table 3. Determinants of innovative bee products in RomaniaInnovative products N Mean Standard
deviationt-test Sig.
Product diver-sification
the enterprise has innovative products
106 4.93 2.062 4.205 0.000
the enterprise does not have innovative products
54 3.72 1.522
Distribution channels diversifica-tion
the enterprise has innovative products
106 2.55 1.122 3.218 0.002
the enterprise does not have innovative products
54 2.04 0.846
N – number of apicultural enterprises in each category (the category of apicultural enterprises that has innovative products and the category of apicultural enterprises that does not have innovative products). Source: own calculations based on the survey.
There is a significant connection between the diversification of the distribu-tion channels and the innovative bee products in both countries as the choice of where to sell innovative bee products must be based around prices achieved and
1038
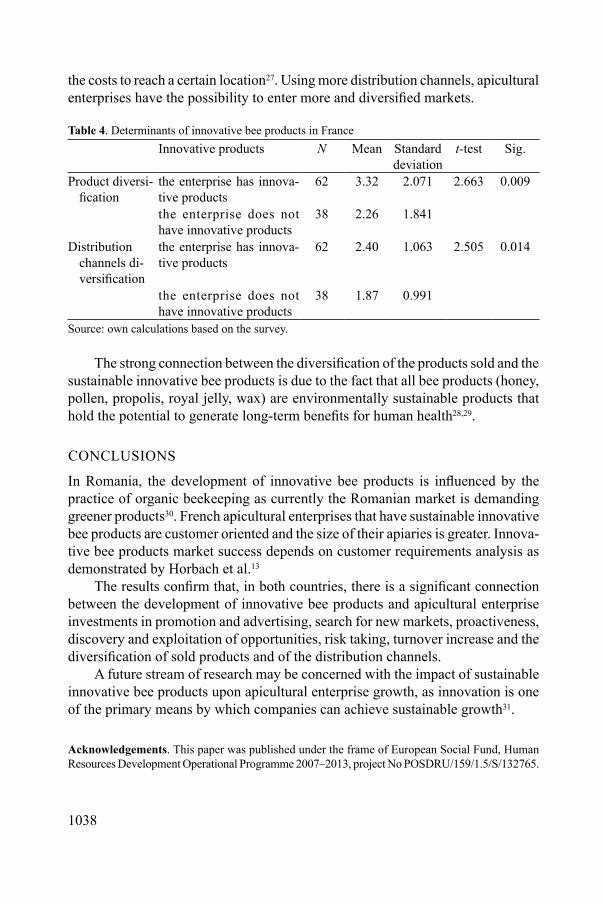
the costs to reach a certain location27. Using more distribution channels, apicultural enterprises have the possibility to enter more and diversified markets.
Table 4. Determinants of innovative bee products in FranceInnovative products N Mean Standard
deviationt-test Sig.
Product diversi-fication
the enterprise has innova-tive products
62 3.32 2.071 2.663 0.009
the enterprise does not have innovative products
38 2.26 1.841
Distribution channels di-versification
the enterprise has innova-tive products
62 2.40 1.063 2.505 0.014
the enterprise does not have innovative products
38 1.87 0.991
Source: own calculations based on the survey.
The strong connection between the diversification of the products sold and the sustainable innovative bee products is due to the fact that all bee products (honey, pollen, propolis, royal jelly, wax) are environmentally sustainable products that hold the potential to generate long-term benefits for human health28,29.
CONCLUSIONS
In Romania, the development of innovative bee products is influenced by the practice of organic beekeeping as currently the Romanian market is demanding greener products30. French apicultural enterprises that have sustainable innovative bee products are customer oriented and the size of their apiaries is greater. Innova-tive bee products market success depends on customer requirements analysis as demonstrated by Horbach et al.13
The results confirm that, in both countries, there is a significant connection between the development of innovative bee products and apicultural enterprise investments in promotion and advertising, search for new markets, proactiveness, discovery and exploitation of opportunities, risk taking, turnover increase and the diversification of sold products and of the distribution channels.
A future stream of research may be concerned with the impact of sustainable innovative bee products upon apicultural enterprise growth, as innovation is one of the primary means by which companies can achieve sustainable growth31.
Acknowledgements. This paper was published under the frame of European Social Fund, Human Resources Development Operational Programme 2007–2013, project No POSDRU/159/1.5/S/132765.

1039
REFERENCES1. O. GONZÁLEZ-BENITO, J. GONZÁLEZ-BENITO: Implications of Market Orientation on the
Environmental Transformation of Industrial Firms. Ecol Econ, 64 (4), 752 (2008).2. J. KRAUSE, M. TONDLOVA: Importance of Environmental Factors for the Competitiveness
of Firms. J Environ Prot Ecol, 15 (1), 374 (2014).3. M. BOTEZATU, J. ANDREI: Implications of the Environmental Factors on the Economic Ef-
ficiency of Capital Investments. A Romanian Perspective in Terms of a Sustainable Economy. J Environ Prot Ecol, 13 (1), 382 (2012).
4. M. ZAMKOVA, V. BLASKOVA: The Differences in the Marketability of Organic Products in Greece and the Czech Republic. Agric Econ – Czech, 59, 219 (2013).
5. K. G. GRUNERT: Sustainability in the Food Sector: A Consumer Behaviour Perspective. Int J Food System Dynamics, 2, 207 (2011).
6. C. FUSSLER, P. JAMES: Eco-innovation: A Breakthrough Discipline for Innovation and Sus-tainability. Pitman Publishing, London, 1996.
7. N. BRADBEAR: Beekeeping and Sustainable Livelihoods. Food and Agriculture Organization of the United Nations, Rome, 2004, p. 17.
8. B. G. KARLSSON: Ecodevelopment in Practice: Buxa Tiger Reserve and Forest People. Econ Pol Weekly, 34 (30), 2087 (1999).
9. C. LIETAER: Impact of Beekeeping on Forest Conservation, Preservation of Forest Ecosystems and Poverty Reduction. In: Proc. of the XIII World Forestry Congress, Buenos Aires, Argentina, October 18–23, 2009, p. 1.
10. D. JITARIU, M. POPESCU, I. MOISE, C. URDEA: Rural Sustainable Development Op-portunity by Exploiting the Melliferous Resources – Case Study: the Ciucurova Village, Tulcea County, Romania. J Environ Prot Ecol, 15 (3), 1074 (2014).
11. P. McDONAGH, P. COMMINS: Globalisation and Rural Development: Demographic Revitalisa-tion, Entrepreneurs and Small Business Formation in the West of Ireland. In: Local Responses to Global Integration (Eds C. Kasimis, A. G. Papadopoulos). Ashgate, Aldershot, 1999, 179–202.
12. J. CARRILLO-HERMOSILLA, P. RÍO, T. KÖNNÖLÄ: Diversity of Eco-innovations: Reflec-tions from Selected Case Studies. J Clean Prod, 18 (10–11), 1073 (2010).
13. J. HORBACH, C. RAMMER, K. RENNINGS: Determinants of Eco-innovations by Type of Environmental Impact – the Role of Regulatory Push/Pull. Technology Push and Market Pull. Ecol Econ, 78, 112 (2012).
14. J. DORAN, G. RYAN: Regulation and Firm Perception, Eco-innovation and Firm performance. Eur J Innov Manag, 15 (4), 421 (2012).
15. W. E. BAKER, J. M. SINKULA: Environmental Marketing Strategy and Firm Performance: Effects on New Product Performance and Market Share. J Acad Market Sci, 33 (4), 461 (2005).
16. J. F. D. MEDEIROS, J. L. D. RIBEIRO, M. N. CORTIMIGLIA: Success Factors for Environmen-tally Sustainable Product Innovation: a Systematic Literature Review. J Clean Prod, 65, 76 (2014).
17. E. KESIDOU, P. DEMIREL: On the Drivers of Eco-innovations: Empirical Evidence from the UK. NUBS Research Paper Series No 2010-03. Nottingham University Business School, Not-tingham, UK, 2010, p. 7.
18. T. J. DEAN, J. S. MCMULLEN: Toward a Theory of Sustainable Entrepreneurship: Reducing Environmental Degradation through Entrepreneurial Action. J Bus Ventur, 22 (1), 50 (2007).
19. B. MENGUC, L. K. OZANNE: Challenges of the ‘Green Imperative’: A Natural Resource Based Approach to the Environmental Orientation-Business Performance Relationship. J Bus Res, 58, 430 (2005).
20. J. HORBACH, V. OLTRA, J. BELIN: Determinants and Specificities of Eco-innovations Com-pared to Other Innovations – An Econometric Analysis for the French and German Industry Based on the Community Innovation Survey. Ind Innov, 20 (6), 523 (2013).

1040
21. J. HORBACH: Do Eco-innovations Need Specific Regional Characteristics? An Econometric Analysis for Germany. Rev of Regional Research, 34 (1), 23 (2014).
22. R. LEVESQUE, SPSS Inc.: SPSS Programming and Data Management. 3rd ed. A Guide for SPSS and SAS Users. SPSS Inc., Chicago, 2006.
23. T. HILL, P. LEWICKI: Statistics: Methods and Applications: A Comprehensive Reference for Science, Industry, and Data Mining. StatSoft, Inc., Tulsa, 2006.
24. D. MAXWELL, R. VAN DER VORST: Developing Sustainable Products and Services. J Clean Prod, 11 (8), 883 (2003).
25. European Commission: Competitiveness and Innovation Framework Programme (2007 to 2013). Brussels, 2007.
26. A. ANNUNZIATA, D. SCARPATO: Factors Affecting Consumer Attitudes towards Food Products with Sustainable Attributes. Agric Econ – Czech, 60, 353 (2014).
27. M. HILMI, N. BRADBEAR, D. MEJIA: Beekeeping and Sustainable Livelihoods. FAO, Rome, 2011, p. 53.
28. J. M. ALVAREZ-SUAREZ, S. TULIPANI, S. ROMANDINI, E. BERTOLI, M. BATTINO: Con-tribution of Honey in Nutrition and Human Health: a Review. Mediterr J Nutr Metab, 3, 15 (2010).
29. L. A. MARGHITAS, O. G. STANCIU, D. S. DEZMIREAN, O. BOBIS, O. POPESCU, S. BOG-DANOV, M. G. CAMPOS: In vitro Antioxidant Capacity of Honeybee-collected Pollen of Selected Floral Origin Harvested from Romania. Food Chem, 115, 878 (2009).
30. V. DANCIU: The Organic Products in the Green Marketing Laboratory. Theor Appl Econ, 1 (518), 11 (2008).
31. M. E. PORTER, C. Van Der LINDE: Green and Competitive: Ending the Stalemate. Harv Bus Rev, 73, 120 (1995).
Received 9 June 2015 Revised 23 July 2015
1041
* For correspondence.
Journal of Environmental Protection and Ecology 16, No 3, 1041–1048 (2015)
Biochemical and bio-protection
STUDIES REGARDING BIOLOGICAL ASPECTS OF ANCHOVY (Engraulis encrasicolus L i n n a e u s, 1758) FROM THE ROMANIAN BLACK SEA COAST
M. GALATCHIa,b*, G. RADUa, T. ZAHARIAa, A. TOTOIUa, D. COPREANb,c
a‘Grigore Antipa’ National Institute for Marine Research and Development, 300 Mamaia Blvd., Constanta, Romania bOvidius University, 220 Aurel Vlaicu Blvd., Constanta, Romania cAcademy of Romanian Scientists, 54 Splaiul Independentei, Bucharest, Romania E-mail: [email protected]; [email protected]
Abstract. Anchovy (Engraulis encrasicolus L i n n a e u s, 1758) is a pelagic, gregarious species and plays a key role in the general circulation of organic matter in the Black Sea. As the main con-sumer of plankton, anchovy is, in its turn, food for other species such as horse mackerel, whiting, dolphins. In recent years, the anchovy stock in the Black Sea has suffered greatly, especially as a result of overexploitation. The study of the behaviour of anchovy (migration, feeding, reproduc-tion) is important for understanding the impact on populations and finding sustainable solutions to manage these problems. The preference for certain areas of distribution, for feeding and breeding was determined by analysing samples collected by passive fishing (pound nets from the Romanian Black Sea coast). Temperature, salinity and food supply are the main determinants of the migration phenomenon of anchovy, thereby the preferred grounds for feeding and breeding are coastal areas.
Keywords: Black Sea, anchovy, behaviour, biometrics, age, fisheries.
AIMS AND BACKGROUND
Changes in the ichthyofauna composition of the Black Sea have primarily involved alterations in the number of individuals in specific populations. For many species, fish populations have declined so sharply that they have lost their importance for commercial fishing, and remain within the Black Sea ichthyofauna only as zoo-logical representatives of the species1. In recent years, the anchovy stock in the Black Sea has suffered greatly, especially as a result of overexploitation (Table 1).
Anchovy represents the subject of both artisanal (with coastal trap nets and beach seines mainly in Bulgaria, Romania and Ukraine) and commercial purse-seines fishery on the wintering grounds, mainly in Turkey.
1042
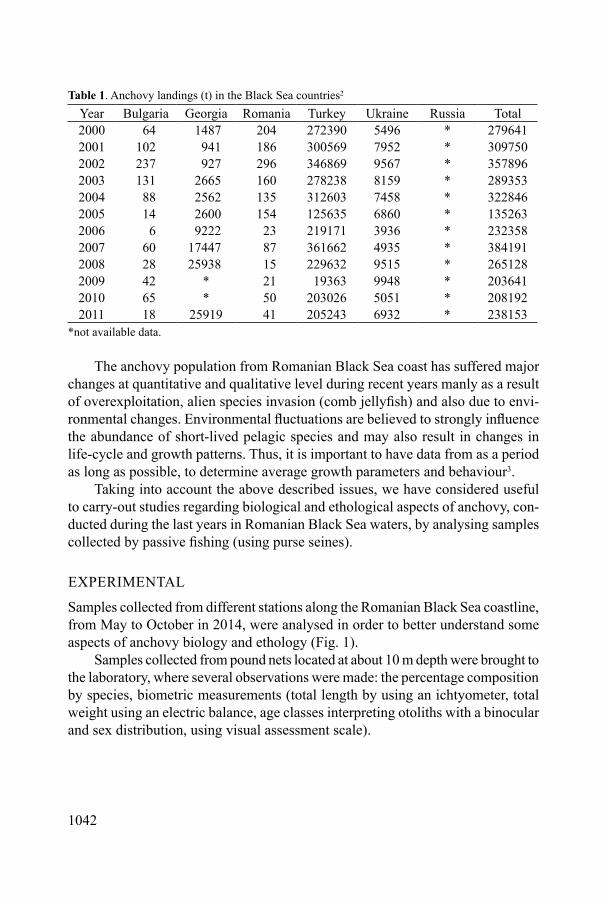
Table 1. Anchovy landings (t) in the Black Sea countries2
Year Bulgaria Georgia Romania Turkey Ukraine Russia Total2000 64 1487 204 272390 5496 * 279641 2001 102 941 186 300569 7952 * 309750 2002 237 927 296 346869 9567 * 357896 2003 131 2665 160 278238 8159 * 289353 2004 88 2562 135 312603 7458 * 322846 2005 14 2600 154 125635 6860 * 135263 2006 6 9222 23 219171 3936 * 232358 2007 60 17447 87 361662 4935 * 384191 2008 28 25938 15 229632 9515 * 265128 2009 42 * 21 19363 9948 * 2036412010 65 * 50 203026 5051 * 2081922011 18 25919 41 205243 6932 * 238153
*not available data.
The anchovy population from Romanian Black Sea coast has suffered major changes at quantitative and qualitative level during recent years manly as a result of overexploitation, alien species invasion (comb jellyfish) and also due to envi-ronmental changes. Environmental fluctuations are believed to strongly influence the abundance of short-lived pelagic species and may also result in changes in life-cycle and growth patterns. Thus, it is important to have data from as a period as long as possible, to determine average growth parameters and behaviour3.
Taking into account the above described issues, we have considered useful to carry-out studies regarding biological and ethological aspects of anchovy, con-ducted during the last years in Romanian Black Sea waters, by analysing samples collected by passive fishing (using purse seines).
EXPERIMENTAL
Samples collected from different stations along the Romanian Black Sea coastline, from May to October in 2014, were analysed in order to better understand some aspects of anchovy biology and ethology (Fig. 1).
Samples collected from pound nets located at about 10 m depth were brought to the laboratory, where several observations were made: the percentage composition by species, biometric measurements (total length by using an ichtyometer, total weight using an electric balance, age classes interpreting otoliths with a binocular and sex distribution, using visual assessment scale).

1043
Fig. 1. Sampling stations along the Romanian Black Sea coast
RESULTS AND DISCUSSION
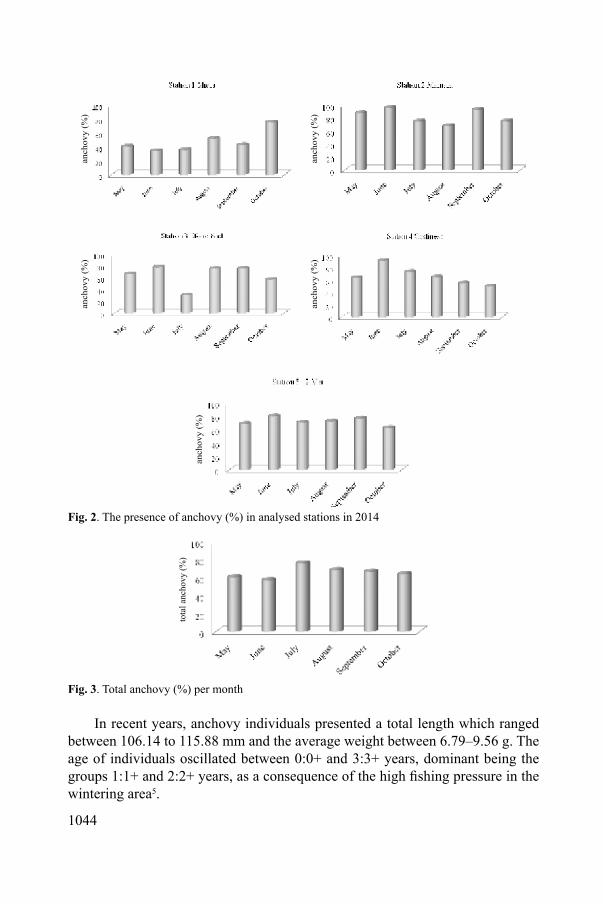
In order to identify the areas preferred by anchovy for feeding and reproduction the parameter dominance was calculated. The dominance is the ratio of the number of a species from the total number of all the species in the studied area4. This index is calculated by dividing the total number of individuals of a particular species, by the total number of all the representative of all the species in the sample, multiplied by 100. According to the percentage value, the species are divided according to their dominance in subrecedent species (>1.1%), recedent species (1.2–2%), subdomi-nant species (2.1–5%), dominant species (5.1–10%) and eudominant species (> 10.1%). Anchovy is the dominant species, in all the sampled stations it has been identified in amounts exceeding 30% (Fig. 2).
Regarding the months in which anchovy was identified in samples in the larg-est proportions (Fig. 3), these are July and August.
1044
anch
ovy
(%)
anch
ovy
(%)
anch
ovy
(%)
anch
ovy
(%)
anch
ovy
(%)
Fig. 2. The presence of anchovy (%) in analysed stations in 2014
tota
l anc
hovy
(%)
Fig. 3. Total anchovy (%) per month
In recent years, anchovy individuals presented a total length which ranged between 106.14 to 115.88 mm and the average weight between 6.79–9.56 g. The age of individuals oscillated between 0:0+ and 3:3+ years, dominant being the groups 1:1+ and 2:2+ years, as a consequence of the high fishing pressure in the wintering area5.

1045
In 2014, in May and July were predominant individuals with length between 90–110 mm, and weight of 6.83–8.41 g and from August and September predomi-nated individuals with length between 80–100 mm and weight between 5.21–7.43 g.
At the Turkish Black Sea coast, in the period 1998–2000, it was found that more than 80% of fish were between 80–120 mm3, in Romanian Black Sea coast, in 2014 the individuals were smaller, more than 50% of fish captured by passive fishing were between 80–100 mm.
By 2008, the composition on age-class shows the presence of individuals with ages comprised between 0:0+ to 4:4+ years, the classes 0:0+, 1:1+ and 2:2+ years prevailing and the 3:3+ and 4:4+ ages almost disappeared. During this period, the anchovy stock suffered very much due to the overexploitation1.
In 2014, the status recorded some changes, the age classes that were pre-dominant are included between 1:1+ and 2:2+ years and the age class 3:3+ years represented a small percentage; age class 4:4+ years were not identified in any fixed fishing station, but that does not mean that disappeared (Fig. 4).
age
clas
s (%
)
age
clas
s (%
)
age
clas
s (%
)
age
clas
s (%
)
age
clas
s (%
)
years years
yearsyears
years
Fig. 4. Percentage on age classes of anchovy by month, in 2014
1046
Some biological aspects were analysed by correlation. It has been calculated the average length and average weight by age classes in samples collected from the fixed fishing points in 2014 (Table 2). A strong increase in length and weigh is observed t in the first year of life and then a slower growth is achieved.
Table 2. Analysis by age classes, medium length (Lm (cm)) and average weight (Gm (g)) on anchovy collected from passive fishing in 2014
Age 0+ 1:1+ 2:2+ 3:3+Lm (cm) 6.73 9.87 11.89 12.16Gm (g) 2.98 5.37 8.81 11.41
Is well recognised that fish in general are very much influenced by environ-mental factors in their life cycle, so further compared studies (at regional level, Black Sea riparian countries) regarding anchovy age are needed.
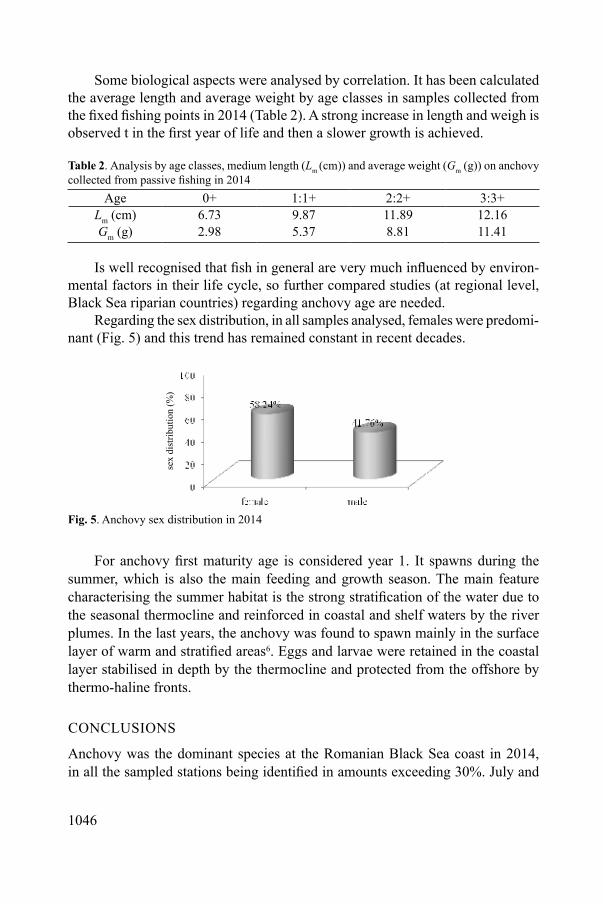
Regarding the sex distribution, in all samples analysed, females were predomi-nant (Fig. 5) and this trend has remained constant in recent decades.
sex
dist
ribut
ion
(%)
Fig. 5. Anchovy sex distribution in 2014
For anchovy first maturity age is considered year 1. It spawns during the summer, which is also the main feeding and growth season. The main feature characterising the summer habitat is the strong stratification of the water due to the seasonal thermocline and reinforced in coastal and shelf waters by the river plumes. In the last years, the anchovy was found to spawn mainly in the surface layer of warm and stratified areas6. Eggs and larvae were retained in the coastal layer stabilised in depth by the thermocline and protected from the offshore by thermo-haline fronts.
CONCLUSIONS
Anchovy was the dominant species at the Romanian Black Sea coast in 2014, in all the sampled stations being identified in amounts exceeding 30%. July and
1047
August are the months in which anchovy was identified in samples in the largest proportions.
In 2014, in May and July individuals with length between 90–110 mm, and weight 6.83–8.41 g were prevailing, and from August to October individuals with length between 80–100 mm and weight between 5.21–7.43 g were dominant.
Regarding the age, in 2014, the status remained similar, the dominant age classes were between 1:1+ and 2:2+ and the age class 3:3+ represented a small percentage; age class 4:4+ were not identified in any fixed fishing station, but that does not mean that disappeared.
Concerning the sex distribution, in all samples analysed, females were pre-vailing.
The study results reinforce the knowledge on anchovy behaviour to approach the coast for feeding and reproduction. However, further studies are needed to highlight the preferences for a certain type of food.
Analysing data on some aspects of the anchovy biology captured in Romanian Black Sea waters with those obtained by analysing biology aspects of anchovy collected from Turkish Black Sea waters3 it can be observed slight differences in size of individuals by age classes, of course environmental conditions are slightly varied at Turkish Black Sea coast, however, a joint study could highlight the spe-cific differences observed.
As anchovy is an economically valuable species and an important food source for people7, both locally and regionally, a common ecosystem approach of the studies on this species population is necessary.
Acknowledgements. This research was completed within the Ph.D. research program of the Doctoral School of Applied Sciences, ‘Ovidius’ University of Constanta, Romania, with the full support of colleagues from NIMRD ‘Grigore Antipa’ Constanta, Romania.
REFERENCES1. G. RADU, V. MAXIMOV, E. ANTON, M. CRISTEA, G. TIGANOV. A. TOTOIU, A. D. SPANU:
State of the Fishery Resources in the Romanian Marine Area. Marine Research (Cercetari Marine), 43, 268 (2013).
2. Scientific, Technical and Economic Committee for Fisheries (STECF): Black Sea Assessments (STECF-14-14). Publications Office of the European Union, Luxembourg, JRC 92436, 2014. 255 p.
3. O. SAMSUN, N. SAMSUN, F. KALAYCI, S. BILGIN: Study on Recent Variations in the Population Structure of European Anchovy (Engraulis encrasicolus L., 1758) in the Southern Black Sea. EU J Fisheries & Aquatic Sci, 23 (4), 301 (2006).
4. M.-T. GOMOIU, M. SKOLKA: Ecology – Methodologies for Ecological Studies. Ovidius University Press, Constanta, 2001, 112–115 (in Romanian).

1048
5. V. MAXIMOV, E. PATRAS, L. OPREA, T. ZAHARIA, G. RADU, C. SION (BADALAN): Analysis of Quantitative and Qualitative Evolution of Fishing Main Fish Species of Commercial Value in the Last Two Decades in the Romanian Sector of the Pontic Basin. J Environ Prot Ecol, 12 (3), 1007 (2011).
6. G. RADU, E. ANTON, M. GOLUMBEANU, V. RAYKOV, M. YANKOVA, M. PANAYOTOVA, V. SHLYAHOV, M. ZENGIN: State of the Main Black Sea Commercial Fish Species Correlated with the Ecological Conditions and Fishing Effort. J Environ Prot Ecol, 12 (2), 549 (2011).
7. L. D. GALATCHI, D. L. MIHALACHE: Food Chain Security in Romania. Food Chain Security, Springer, The Netherlands, 2010, 59–78.
Received 17 June 2015 Revised 15 July 2015
1049
* For correspondence.
Journal of Environmental Protection and Ecology 16, No 3, 1049–1060 (2015)
Clean technologies
NO3– REMOVAL FROM AQUEOUS SYSTEMS BY
SORPTION-FLOTATION
C. CALIN, L. STOICA, C. CONSTANTIN*
Faculty of Applied Chemistry and Material Science, Politechnic University of Bucharest, 1 Polizu Street, 011 061 Bucharest, Romania E-mail: [email protected]
Abstract. The aim of this study is the possibility to remove NO3– anion by sorption-flotation, using
a surfactant modified natural zeolite as adsorbent. Adsorption influencing factors such as adsorbent dose, NO3
– initial concentration, mass ratio Cion:Cads, stirring rate, dynamic and static contact times were investigated. The experimental data indicated the increase of adsorbent separation efficiency with 23.5% more than natural zeolite. Four theoretical adsorption isotherms, i. e. Langmuir, Freundlich, Redlich-Peterson and Temkin were used to describe the experimental results. Effluents resulted from adsorption were flotated in order to increase more removal efficiency. For this reason some flotation influencing factors were studied: pressure in the pressure vessel, dilution ratio Vsample:Vwater, flotation time, and finally were established the separation parameters. After applying sorption-flotation tech-nique the maximum NO3
– removal efficiency obtained was 75%.
Keywords: nitrate removal, adsorption-flotation, modified natural zeolite.
AIMS AND BACKGROUND
Water resources are polluted by several nitrogen containing compounds, such as NO3
–, NO2–, and NH4
+, which may cause severe environmental problems including eutrophication1,2 and/or impact on animal health3.
Due to industrial and agricultural activities, the NO3– concentration in surface
and underground waters have increased in many regions of Romania4,5. Romanian legislation in force has the allowable limit for NO3
– 25 mg/l (Refs 6 and 7).There are different techniques for the removal of NO3
– from water such as: biological denitrification8, chemical reduction9, reverse osmosis, electrodialysis10, ion exchange11,12 and adsorption13. Each technique provides a different and unique approach and perhaps certain advantages over others for a particular situation, es-pecially when a large volume of water content of toxic elements should be treated. NO3
– can not be removed from aqueous solutions by precipitation method. For this reason the NO3
– removal from polluted water was proposed by sorption-flotation technique. First it was investigated the adsorption process followed by flotation
1050
(dissolved air flotation technique (DAF) with controlled diameter of micro bub-bles) a real possibility to apply in industrial scale.
EXPERIMENTAL
Reagents and solutions. NaNO3 (Merk); A stock NO3– solution of 1000 mg/l con-
centration was prepared and the working solutions (NO3– solutions of different
concentrations) were made by diluting with distilled water; clinoptilolite (natural zeolite) from Persani, Romania; 0.2 mm particle size; hexadecyltrimethylam-monium bromide (Merck) (HDTMABr); impregnation solution of 3000 mg/l for zeolite was prepared by dissolving in distilled water; FR2510 (Henkel); anionic flocculent (polyacrylamide type) 0.2% was prepared by dissolving in distilled water.
Equipments. INO LAB ISE 740, NO3– concentrations were determined by ion
selective electrode (ISE) method; the pH values of solutions were measured by a pH-meter Orion 420A; dissolved air flotation (DAF) unit14 was used in flotation experiments (the cell dimensions: h = 30 cm, F = 4.5 cm).
Sorption-flotation experiments. Adsorption experiments were performed by shak-ing (different dynamic time contact and stirring rate) of adsorbent known amounts with 100 ml NO3
– solution specified for each investigation to resulted pH ≈ 7.4. After that the solutions stay for equilibrium install in various static contact times. Adsorbent loaded with NO3
– was separated by decantation and lower NO3– con-
centrations in aqueous – phases were analysed with ISE. The percentage removal of nitrate (%R) was calculated from the relationship:
%R = Ci – Cf × 100,
Ci
where Ci is the initial pollutant concentration, mg/l; Cf – final pollutant concentra-tion, mg/l.
The liquid phase containing known amount of NO3– specified for each in-
vestigation was mixed with a known amount of flocculent. After that the solution was transferred into the flotation cell. Distilled water was introduced in pressure vessel of DAF unit and also compressed air. The result was the pressurized water saturated with air and keeping it at a pressure of 4×10⁵ N/m2. An aliquote part of these was passing to the base of flotation cell and generated uniform bubbles size which adhere to the solid phase and rise to the top of the flotation cell column.
1051
RESULTS AND DISCUSSION
ADSORBENT SELECTION
Clinoptilolite (natural zeolite from Persani area) was chosen in this study because of its large availability in Romania. In common with other zeolites, clinoptilolite has a cage-like structure consisting of SiO4 and AlO4 tetrahedral joined by shared oxygen atoms15 and due to their high cation-exchange ability as well as molecular sieve properties showed special importance in water purification.
The chemical composition of Persani natural zeolite (wt.%) is: SiO2 67.38; Al2O3 1.43; Fe2O3 1.84; FeO 1.58; MgO 1.71; MnO 3.05; K2O 2.1; Na2O 0.43 (Ref. 16). For determination of separation efficiency of this natural zeolite were done experiments with NO3
– by sorption – flotation process. The NO3– final con-
centrations obtained are higher than admissible limit of Romanian legislation16.Recent studies16,17 regarding NO3
– adsorption onto natural clinoptilolite show that surfactant modified clinoptilolite with a positive charge will attract anionic contaminants like NO3
– by electrostatic interactions. For this reason HDTMABr was selected for modification of clinoptilolite. Use of HDTMABr in the adsorption process has eliminated the collector in flotation process which is an advantage due to the decreasing of chemical used.
The experimental data indicate that separation efficiency of NO3– removal
increases with 23.5% in case of HDTMABr modified clinoptilolite.
NO3– ADSORPTION PROCESS
Adsorption process can be described by various models. Distribution of adsorbate between adsorbent and adsorbate in aqueous solution at the moment of equilibrium system is important in adsorption capacity determination.
Maximum adsorption capacity (qe) or Q is an important parameter for char-acterise the performance of an adsorbent. Adsorption capacity is based on mass balance in the system adsorbent – adsorbate, considering that the adsorbate which is not found in the solution is retained by the adsorbent and is calculated with equation16:
qe =V (Ci – Ce) ,
m
where V is the sample volume (l); Ci – NO3– initial concentration (mg/l), Ce – equi-
librium NO3– concentration (mg/l); m – weight of clinoptilolite (mg).
The analysis of the isotherm data by fitting to different isotherm models such as Langmuir, Freundlich, Redlich–Peterson and Temkin is a step to appreciate well correlations and find the suitable model that can be used for design purposes. The results are presented in Figs 1–5.
1052
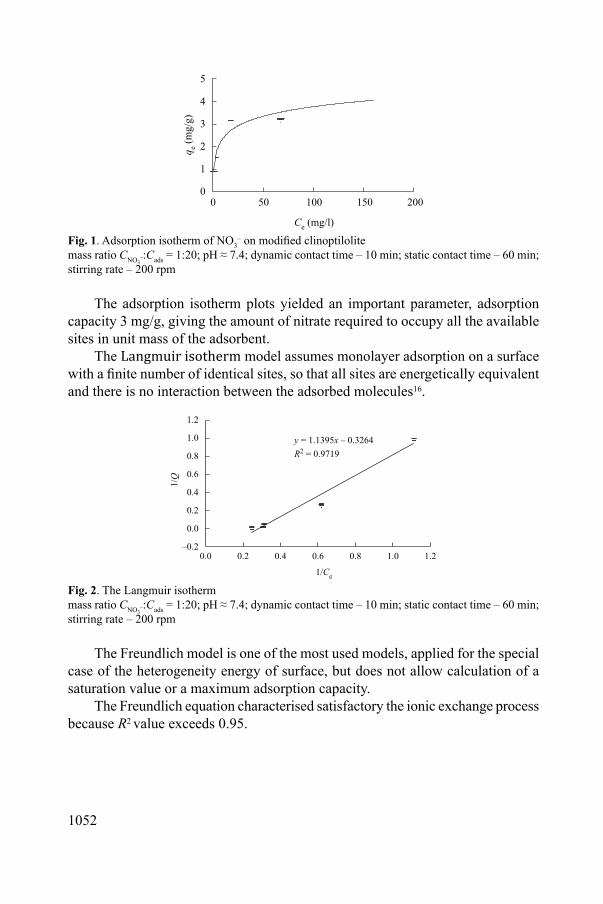
Fig. 1. Adsorption isotherm of NO3– on modified clinoptilolite
mass ratio CNO3–:Cads = 1:20; pH ≈ 7.4; dynamic contact time – 10 min; static contact time – 60 min;
stirring rate – 200 rpm
The adsorption isotherm plots yielded an important parameter, adsorption capacity 3 mg/g, giving the amount of nitrate required to occupy all the available sites in unit mass of the adsorbent.
The Langmuir isotherm model assumes monolayer adsorption on a surface with a finite number of identical sites, so that all sites are energetically equivalent and there is no interaction between the adsorbed molecules16.
Fig. 2. The Langmuir isotherm mass ratio CNO3
–:Cads = 1:20; pH ≈ 7.4; dynamic contact time – 10 min; static contact time – 60 min; stirring rate – 200 rpm
The Freundlich model is one of the most used models, applied for the special case of the heterogeneity energy of surface, but does not allow calculation of a saturation value or a maximum adsorption capacity.
The Freundlich equation characterised satisfactory the ionic exchange process because R2 value exceeds 0.95.

1053
Fig. 3. The Freudlich isotherm mass ratio CNO3
–:Cads = 1:20; pH ≈ 7.4; dynamic contact time – 10 min; static contact time – 60 min; stirring rate – 200 rpm
The Redlich–Peterson isotherm model combines elements from both the Lang-muir and Freundlich equations, and the mechanism of adsorption is a hybrid unique and does not follow ideal monolayer adsorption. The Redlich–Peterson equation is widely used as a compromise between Langmuir and Freundlich systems.
Fig. 4. The Redlich–Peterson isotherm mass ratio CNO3
–:Cads = 1:20; pH ≈ 7.4; dynamic contact time – 10 min; static contact time – 60 min; stirring rate – 200 rpm
The Temkin isotherm model assumes that the adsorption energy decreases linearly with the surface coverage due to adsorbent–adsorbate interactions.
The regression of the data revealed that the adsorption of NO3– on HTMABr
modified clinoptilolite was fitted better on the Redlich–Peterson model (R2 = 0.991) than other adsorption models used in this study (R2 = 0.9473 for the Temkin iso-therm, 0.9839 for the Freundlich isotherm and 0.9719 for the Langmuir model).
1054
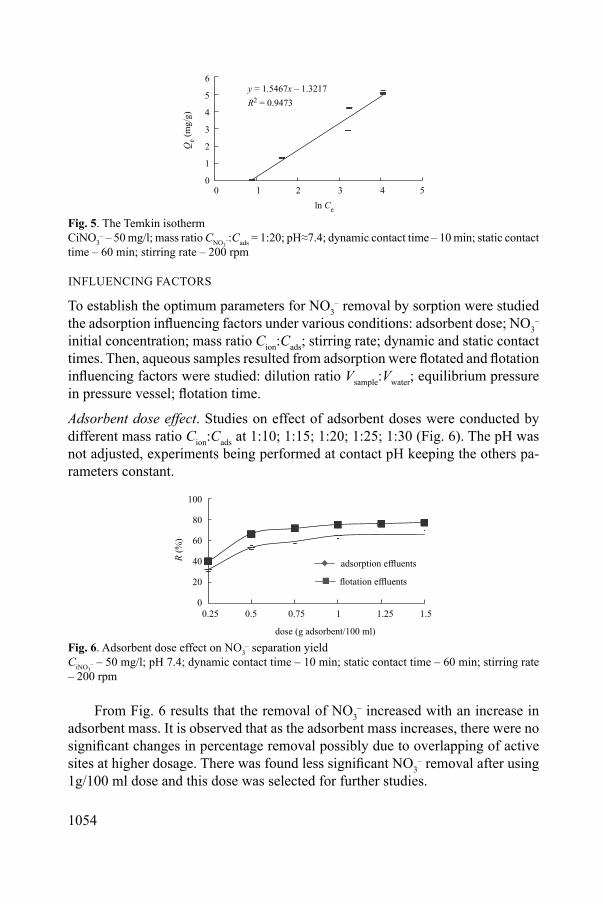
Fig. 5. The Temkin isotherm CiNO3
– – 50 mg/l; mass ratio CNO3–:Cads = 1:20; pH≈7.4; dynamic contact time – 10 min; static contact
time – 60 min; stirring rate – 200 rpm
INFLUENCING FACTORS
To establish the optimum parameters for NO3– removal by sorption were studied
the adsorption influencing factors under various conditions: adsorbent dose; NO3–
initial concentration; mass ratio Cion:Cads; stirring rate; dynamic and static contact times. Then, aqueous samples resulted from adsorption were flotated and flotation influencing factors were studied: dilution ratio Vsample:Vwater; equilibrium pressure in pressure vessel; flotation time.
Adsorbent dose effect. Studies on effect of adsorbent doses were conducted by different mass ratio Cion:Cads at 1:10; 1:15; 1:20; 1:25; 1:30 (Fig. 6). The pH was not adjusted, experiments being performed at contact pH keeping the others pa-rameters constant.
Fig. 6. Adsorbent dose effect on NO3– separation yield
CiNO3– – 50 mg/l; pH 7.4; dynamic contact time – 10 min; static contact time – 60 min; stirring rate
– 200 rpm
From Fig. 6 results that the removal of NO3– increased with an increase in
adsorbent mass. It is observed that as the adsorbent mass increases, there were no significant changes in percentage removal possibly due to overlapping of active sites at higher dosage. There was found less significant NO3
– removal after using 1g/100 ml dose and this dose was selected for further studies.
1055
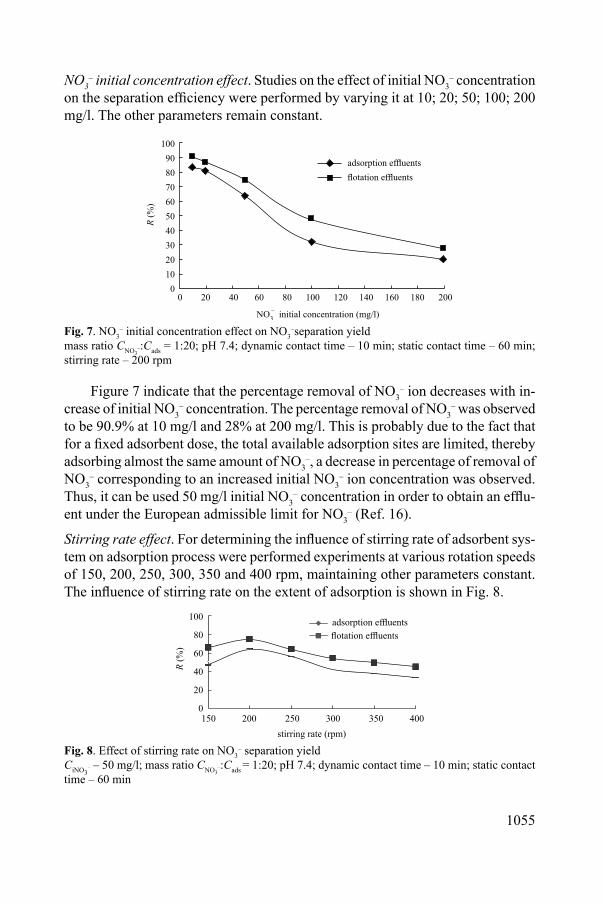
NO3– initial concentration effect. Studies on the effect of initial NO3
– concentration on the separation efficiency were performed by varying it at 10; 20; 50; 100; 200 mg/l. The other parameters remain constant.
Fig. 7. NO3– initial concentration effect on NO3
–separation yieldmass ratio CNO3
–:Cads = 1:20; pH 7.4; dynamic contact time – 10 min; static contact time – 60 min; stirring rate – 200 rpm
Figure 7 indicate that the percentage removal of NO3– ion decreases with in-
crease of initial NO3– concentration. The percentage removal of NO3
– was observed to be 90.9% at 10 mg/l and 28% at 200 mg/l. This is probably due to the fact that for a fixed adsorbent dose, the total available adsorption sites are limited, thereby adsorbing almost the same amount of NO3
–, a decrease in percentage of removal of NO3
– corresponding to an increased initial NO3– ion concentration was observed.
Thus, it can be used 50 mg/l initial NO3– concentration in order to obtain an efflu-
ent under the European admissible limit for NO3– (Ref. 16).
Stirring rate effect. For determining the influence of stirring rate of adsorbent sys-tem on adsorption process were performed experiments at various rotation speeds of 150, 200, 250, 300, 350 and 400 rpm, maintaining other parameters constant. The influence of stirring rate on the extent of adsorption is shown in Fig. 8.
Fig. 8. Effect of stirring rate on NO3– separation yield
CiNO3– – 50 mg/l; mass ratio CNO3
–:Cads = 1:20; pH 7.4; dynamic contact time – 10 min; static contact time – 60 min
1056
Figure 8 show that the stirring rate has a substantial effect on the separation efficiency. Separation efficiency was found to decrease with increasing stirring rate more than 200 rpm and hence stirring rate of 200 rpm, were %R, for flotation effluents of 75%, was considered for further study.
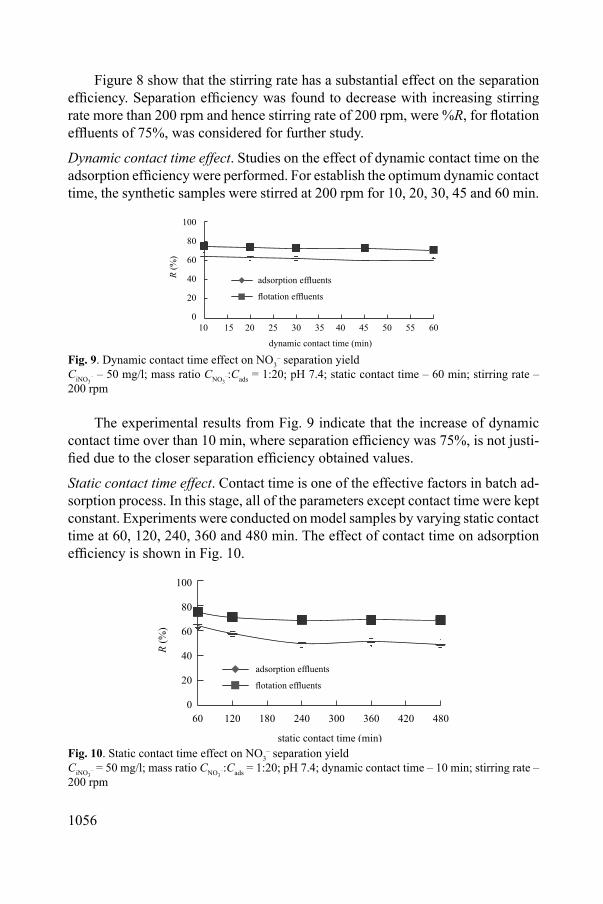
Dynamic contact time effect. Studies on the effect of dynamic contact time on the adsorption efficiency were performed. For establish the optimum dynamic contact time, the synthetic samples were stirred at 200 rpm for 10, 20, 30, 45 and 60 min.
Fig. 9. Dynamic contact time effect on NO3– separation yield
CiNO3– – 50 mg/l; mass ratio CNO3
–:Cads = 1:20; pH 7.4; static contact time – 60 min; stirring rate – 200 rpm
The experimental results from Fig. 9 indicate that the increase of dynamic contact time over than 10 min, where separation efficiency was 75%, is not justi-fied due to the closer separation efficiency obtained values.
Static contact time effect. Contact time is one of the effective factors in batch ad-sorption process. In this stage, all of the parameters except contact time were kept constant. Experiments were conducted on model samples by varying static contact time at 60, 120, 240, 360 and 480 min. The effect of contact time on adsorption efficiency is shown in Fig. 10.
Fig. 10. Static contact time effect on NO3– separation yield
CiNO3– = 50 mg/l; mass ratio CNO3
–:Cads = 1:20; pH 7.4; dynamic contact time – 10 min; stirring rate – 200 rpm
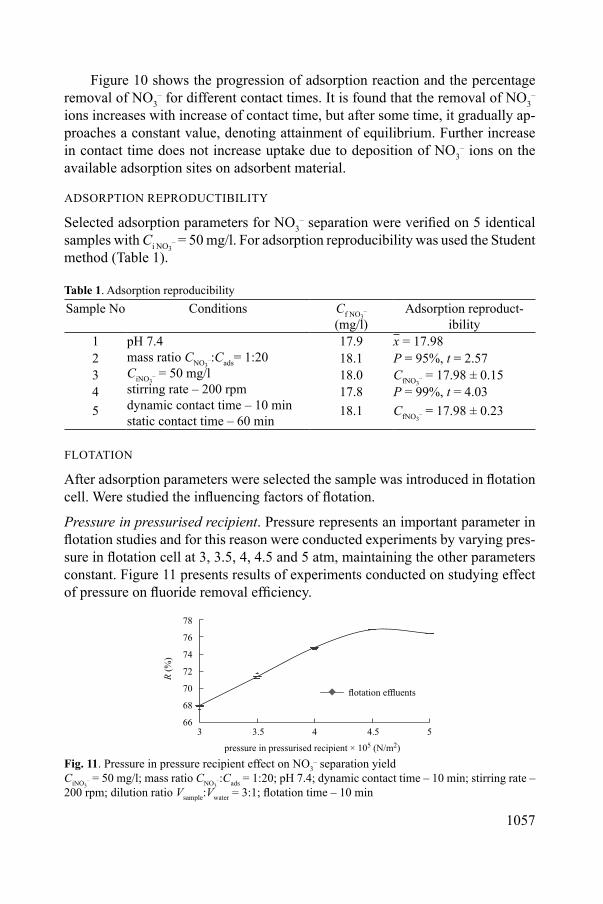
1057
Figure 10 shows the progression of adsorption reaction and the percentage removal of NO3
– for different contact times. It is found that the removal of NO3–
ions increases with increase of contact time, but after some time, it gradually ap-proaches a constant value, denoting attainment of equilibrium. Further increase in contact time does not increase uptake due to deposition of NO3
– ions on the available adsorption sites on adsorbent material.
ADSORPTION REPRODUCTIBILITY
Selected adsorption parameters for NO3– separation were verified on 5 identical
samples with Ci NO3– = 50 mg/l. For adsorption reproducibility was used the Student
method (Table 1).
Table 1. Adsorption reproducibilitySample No Conditions Cf NO3
– (mg/l)
Adsorption reproduct-ibility
1 pH 7.4mass ratio CNO3
–:Cads= 1:20CiNO3
– = 50 mg/lstirring rate – 200 rpmdynamic contact time – 10 minstatic contact time – 60 min
17.9 x = 17.982 18.1 P = 95%, t = 2.573 18.0 CfNO3
– = 17.98 ± 0.154 17.8 P = 99%, t = 4.035 18.1 CfNO3
– = 17.98 ± 0.23
FLOTATION
After adsorption parameters were selected the sample was introduced in flotation cell. Were studied the influencing factors of flotation.
Pressure in pressurised recipient. Pressure represents an important parameter in flotation studies and for this reason were conducted experiments by varying pres-sure in flotation cell at 3, 3.5, 4, 4.5 and 5 atm, maintaining the other parameters constant. Figure 11 presents results of experiments conducted on studying effect of pressure on fluoride removal efficiency.
Fig. 11. Pressure in pressure recipient effect on NO3– separation yield
CiNO3– = 50 mg/l; mass ratio CNO3
–:Cads = 1:20; pH 7.4; dynamic contact time – 10 min; stirring rate – 200 rpm; dilution ratio Vsample:Vwater = 3:1; flotation time – 10 min

1058
The results from Fig. 11 show that pressure in pressure recipient has a major effect on removal efficiency. The separation yield increase with the increase of pressure up to 4 × 10⁵ N/m2 and then remains more or less constant.
Dilution ratio (sample volume: water volume). Another factor which influences the flotation process is the dilution ratio Vsample :Vwater. Dilution ratio Vsample:Vwater was investigated by varying it at 1:1; 2:1; 3:1; 4:1; 5:1. Figure 12 shows the influence of dilution on NO3
– separation efficiency.
Fig. 12. Effect of dilution ratio Vsample:Vwater on NO3– separation yield
CiNO3– = 50 mg/l; mass ratio CNO3
–:Cads = 1:20; pH 7.4; dynamic contact time – 10 min; static contact time – 60 min; stirring rate – 200 rpm; flotation time – 10 min; p = 4 × 10⁵ N/m2
As expected with increasing of the amount of added water the removal effi-ciency grows up to 89% at Vsample:Vwater 1:1 dilution ratio, but for economical reasons we will take into consideration for further studies the dilution ratio Vsample:Vwater 1:3 with %R = 76%.
Flotation time. The influence of flotation time on NO3– removal efficiency is an-
other important factor that influences the separation efficiency and hence various flotation times (2, 5, 10, 15 and 20 min) were studied maintaining other parameters constant. Obtained data are presented in Fig. 13.
Fig. 13. Effect of flotation time on NO3– separation yield
CiNO3– = 50 mg/l; mass ratio CNO3
–:Cads = 1:20; pH 7.4; dynamic contact time – 10 min; static contact time – 60 min; stirring rate – 200 rpm; dilution ratio Vsample:Vwater= 3:1; p = 4×10⁵ N/m2

1059
From Fig. 13 it can be observed that the separation process is very fast. In only 5 min is achieved a removal efficiency of 75%.
SORPTION – FLOTATION OPTIMUM PARAMETERS
Based on studied influencing factors, were established the optimum separation parameters for adsorption process (pH = 7.4; CiNO3
– – 50 mg/l; mass ratio CNO3–:Cads
= 1:20; pH – 7.4; dynamic contact time – 10 min; static contact time – 60 min; stirring rate – 200 rpm; dilution ratio Vsample:Vwater= 3:1; p = 4×10⁵ N/m2; flotation time – 10 min.
CONCLUSIONS
NO3– adsorption experiments showed that surfactant modification of zeolite using
hexadecyltrimethyl ammonium bromide resulted in a significant increase in the adsorption capacity of the adsorbent.
Considering the experimental results gathered to date and the low cost of clinoptilolite, is a promising technology for NO3
– removal from water.The study demonstrates that clinoptilolite impregnated with hexadecyltrime-
thyl ammonium bromide could be used as an effective adsorbent for NO3– reduction
since the adsorbent removal capacity is 64% (Rads = 64%; Rads+flotation = 75%) and the NO3
– final concentration is below the European legal limit. Modified clinoptilolite maximum adsorption capacity for NO3
– ion is app. 3 mg/g.Also, zeolite modification with HDTMABr eliminates the stage of using for
flotation of a collector, which represents an advantage due to the reduction of chemicals used.
The combined adsorption-flotation method applied increase the separation yields for NO3
– ion with maximum 10% compared with the use of adsorption as single separation technique.
REFERENCES1. H. S. PEAVY, D. R. ROWE, G. TCHOBANOGLOUS: Environmental Engineering. McGraw-
Hill Book Company, New York, 696, (1985).2. F. VOSNIAKOS, V. GABRIELA, J. PETRE, L. CRUCERU, M. NICOLAU, M. MITRITA,
V. IANCU, I. CRUCERU, L. A. VARGA, M. GOLUMBEANU: Assessment of the Quality of the Danube Delta Aquatic Ecosystem-Surface Water and Sediment. J Environ Prot Ecol, 9 (2), 255 (2008).
3. M. D. CODREAN, D. POPA, I. CODREANU, M. TURCITU: Study Concerning the Eco-toxicological Impact of Nitrates-Nitrites Fertilisers on Animal Health. J Environ Prot Ecol, 14 (1), 116 (2013).
4. L. CALIN, A. IRIMESCU, A. JADANEANT: Research Regarding the Reduction of Nitrate Concentration in Wastewater Discarded by the Industry in the Timis Hydrological Area. J Environ Prot Ecol, 11 (4), 1222 (2010).
1060
5. M. CIOROI: Studies on Nitrate Levels in Drinking Water of Galati Country Private Wells. J Environ Prot Ecol, 13 (3), 1253 (2012).
6. L. A. SCHIPPER, M. VOJVODIC-VUKOVIC: Five Years of Nitrate Removal, Denitrification and Carbon Dynamics in a Denitrification Wall. Water Res, 35 (3), 347 (2001).
7. H. Y. HU, N. GOTO, K. FUJIE: Effect of pH on the Reduction of Nitrite in Water by Metallic Iron. Water Res, 35 ( 2001).
8. A. PINTER, J. BATISTA: Improvement of an Integrated Ion-exchange/Catalytic Process for Nitrate Removal by Introducing a Two-stage Denitrification Step. Appl Cat B: Environ, 63, 150 (2006).
9. B. U. BAES, Y. H. JUNG, W. W. HAN, H. S. SHIN: Improved Brine Recycling during Nitrate Removal Using Ion Exchange. Water Res, 36, 3330 (2002).
10. B. KOUMANOVA, M. JITARU: Adsorption on Natural Materials from Balkan Area- Alternative Methods Applied for the Environmental Protection. J Environ Prot Ecol, 8 (1), 35 (2007).
11. L. STOICA: Ion and Molecular Flotation, Theoretical Basis, Methods and Applications. Ed. Didactical and Pedagogical, R.A., Bucharest, 1997.
12. L. LAZAR, A. CEICA, L. BULGARIU, I. BALASANIAN, L. PASCU, I. CRETESCU: Removal of Nitrate Ions from Water Using Non-selective Purolite A847 Resin. J Environ Prot Ecol, 15 (4), 1564 (2014).
13. W. G. POND, F. A. MUMPTON: The Role of Natural Zeolites in Agriculture and Aquaculture in Zeo-Agriculture: Use of Natural Zeolites in Agriculture and Aquaculture. Westview Press, Boulder, Colorado, 1983.
14. A. MAZEIKIENE, M. VALENTUKEVICIENE, M. RIMEIKA, A. BRONISLOVAS: Removal of Nitrates and Ammonium Ions from Water Using Natural Sorbent Zeolite (Clinoptilolite). J Environ Eng Landscape Manage, 16 (1), 38 (2008).
15. M. MASUKUME, A. ESKANDARPOUR, M. S. ONYANGO, A. OCHIENG, F. OTIENO: Treating High Nitrate Groundwater Using Surfactant Modified Zeolite in Fixed Bed Column. Separ Sci Technol, 46 (7), 1131 (2011).
16. L. STOICA, C. CONSTANTIN: Aqueous Systems Depolution I. Ed. Politehnica Press, Bucharest, 2010.
17. Y. XING, X. SUN, B. LI Poly(methacrylic acid)-modified Chitosan for Enhancement Adsorption of Water-soluble Cationic Dyes. Polym Eng Sci, February (2009).
Received 28 May 2015 Revised 30 June 2015

1061
Journal of Environmental Protection and Ecology 16, No 3, 1061–1069 (2015)
Clean technologies
RESEARCHES REGARDING THE DECANTING POND ‘VALEA SALISTEI’, IN VIEW OF AREAL REHABILITATION AND RETURNING IT TO THE AGRICULTURAL CIRCUIT
A. B. UNGUR
‘1 Decembre 1918’ University of Alba Iulia, 11–13 Gabriel Bethlen Street, 510 009 Alba Iulia, Romania E-mail: [email protected]
Abstract. At the time of commencement of the documentation and investigation activity on the problem of critical statuses of the tailings dump and decanting ponds at Rosia Montana, with special reference to the decanting ponds ‘Valea Salistei’, the subject, respectively the study area presented an accelerated dynamic as regards the degradation of the environmental components. Against the background of the phenomenon, with broad social implications, from the point of view of the condi-tion of environmental components, it opens an optimum way for activities of areal rehabilitation and the reintroduction of the decanting pond ‘Valea Salistei’ into the agricultural circuit. For this purpose was carried out topographical survey and a series of proposals for rehabilitation of the area and for the reintroduction of the decanting pond into the agricultural circuit were made.
Keywords: decanting pound, topographical survey, rehabilitation.
AIMS AND BACKGROUND
The decanting pond ‘Valea Salistei’, though in a state of conservation, as the mine was closed in 2006, is affected by erosion and landslide processes, presenting the highest risk of failure among the 11 tailings in the middle basin of the Aries River1.
Information gathered from the technical and environmental documentation prepared in previous years and a site visit revealed an extremely precarious state of the decanting pond, in terms of safety.
Against the background of the phenomenon, with broad social implications, it was imposed topographical survey in the area and a series of proposals for rehabilitation.
The decanting pond is a way of storage wet tailings derived from the ore preparation activities. Its size can vary widely and is directly proportional to the size of exploitation.
EXPERIMENTAL
The decanting pond ‘Valea Salistei’ (Fig. 1) is located in the valley with the same name. It is a valley decanting pond with an upstream elevation. It spreads over an
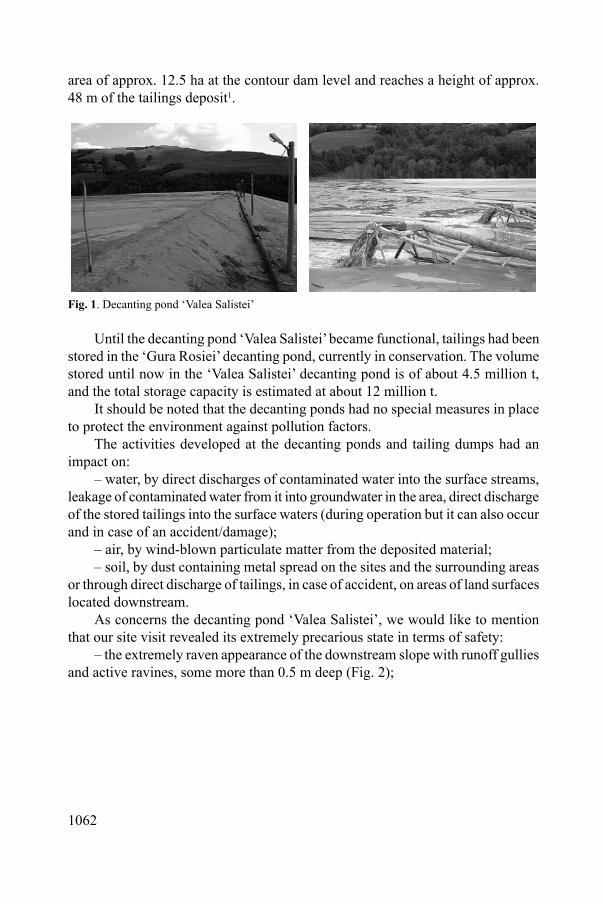
1062
area of approx. 12.5 ha at the contour dam level and reaches a height of approx. 48 m of the tailings deposit1.
Fig. 1. Decanting pond ‘Valea Salistei’
Until the decanting pond ‘Valea Salistei’ became functional, tailings had been stored in the ‘Gura Rosiei’ decanting pond, currently in conservation. The volume stored until now in the ‘Valea Salistei’ decanting pond is of about 4.5 million t, and the total storage capacity is estimated at about 12 million t.
It should be noted that the decanting ponds had no special measures in place to protect the environment against pollution factors.
The activities developed at the decanting ponds and tailing dumps had an impact on:
– water, by direct discharges of contaminated water into the surface streams, leakage of contaminated water from it into groundwater in the area, direct discharge of the stored tailings into the surface waters (during operation but it can also occur and in case of an accident/damage);
– air, by wind-blown particulate matter from the deposited material;– soil, by dust containing metal spread on the sites and the surrounding areas
or through direct discharge of tailings, in case of accident, on areas of land surfaces located downstream.
As concerns the decanting pond ‘Valea Salistei’, we would like to mention that our site visit revealed its extremely precarious state in terms of safety:
– the extremely raven appearance of the downstream slope with runoff gullies and active ravines, some more than 0.5 m deep (Fig. 2);

1063
Fig. 2. Raven aspect of the downstream slope with runoff gullies and active ravines
– the downstream slope had many water springs, some located very high (even on the upper third of the slope). It should be noted that although during the field visit coincided with a very dry season, many water heads were active (Fig. 3);
Fig. 3. Water springs on the downstream slope
– there was a relatively high flow of water leaking from the place where the tailings deposit were embedded in the slope;
– the ballasting prism partly built to strengthen the deposit also exhibited areas with active gullies and streams;
– very loose consistency of the downstream slope, that gave the impression of walking on a waterbed;
– artesian waters occurring in wells downstream of the decanting pound (in-formation from the locals).
All these non-quantifiable arguments add to the results of stability calcula-tions performed during a safety expertise for the ‘Valea Salistei’ decanting pond, according to which, the stability coefficient in the current state varies between Fc = 1.112 for the current operating hypothesis and Fc = 0.789 for the hypothesis of

1064
operation under dynamic loading. These coefficients are much lower than normal coefficients for this type of facilities1,2.
By correlating the results of these calculations with our observations on site, we believe that immediate measures must be taken to secure the safety of the decanting pond ‘Valea Salistei’.
As a result, it was imposed topographical survey and a series of proposals for rehabilitation of the area and for the reintroduction of the decanting pond into the agricultural circuit.
PERFORMING TOPOGRAPHICAL SURVEY
In view of the areal rehabilitation and for the reintroduction of the decanting pond ‘Valea Salistei’ into the agricultural circuit, a topographic survey was performed using the total station Leica TCR 407.
Given the conditions on the ground, in this case, was performed a closed circuit polygonal method, starting with point S102 with target on point S101 (Fig. 4).
Fig. 4. Sketch of poligonal traverse
The points of poligonal traverse were marked by metal bolts located in areas protected as to be preserved for a longer period of time. For every new station points were drawn sketches of locating.
Surveying the details was performed by the polygonal with radiate method. In Table 1 is presented an extract from book field.

1065
Table 1. Extract from book field
After the measurements, the data were processed using version TopoSys 4.2 (Fig. 5).
After processing data were obtained the point coordinates. In Table 2 is pre-sented an extract from coordinates inventory.
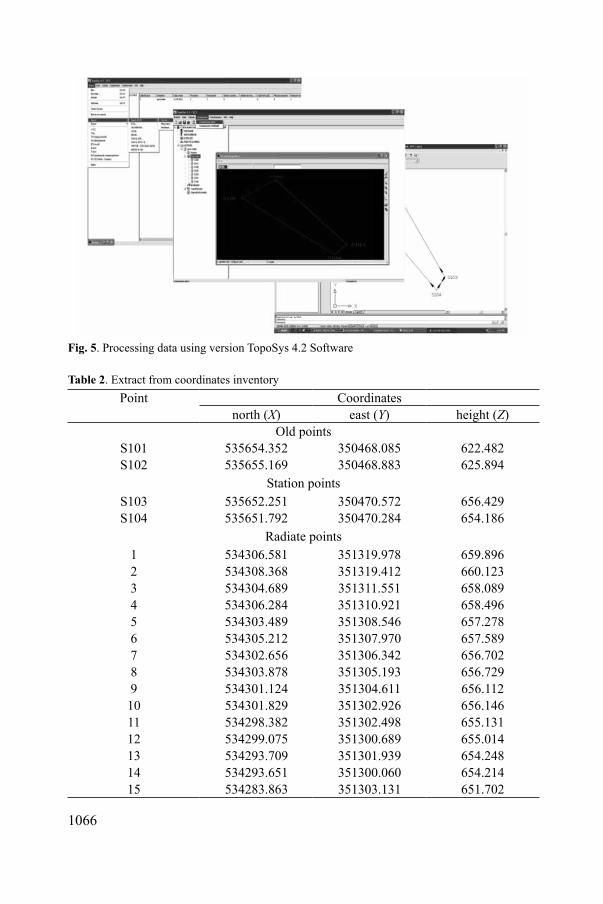
1066
Fig. 5. Processing data using version TopoSys 4.2 Software
Table 2. Extract from coordinates inventory Point Coordinates
north (X) east (Y) height (Z)Old points
S101 535654.352 350468.085 622.482S102 535655.169 350468.883 625.894
Station pointsS103 535652.251 350470.572 656.429 S104 535651.792 350470.284 654.186
Radiate points1 534306.581 351319.978 659.896 2 534308.368 351319.412 660.1233 534304.689 351311.551 658.089 4 534306.284 351310.921 658.496 5 534303.489 351308.546 657.278 6 534305.212 351307.970 657.589 7 534302.656 351306.342 656.702 8 534303.878 351305.193 656.729 9 534301.124 351304.611 656.11210 534301.829 351302.926 656.14611 534298.382 351302.498 655.13112 534299.075 351300.689 655.014 13 534293.709 351301.939 654.248 14 534293.651 351300.060 654.214 15 534283.863 351303.131 651.702

1067
Cadastral plans were prepared using AutoCAD 2000i Software. Thus, after data processing, the points were imported into AutoCAD 2000i and based on the field sketch the points were united (Fig. 6).
Fig. 6. Cadastral plan obtained using AutoCAD 2000i
Also, in AutoCAD 2000i Software, the longitudinal and transverse profiles were completed (Fig. 7).
PROPOSALS FOR REHABILITATION OF ‘VALEA SALISTEI’ DECANTING POND
Proposals for the stability of decanting pond3,4: – Drainage of natural valleys, depressions or foundation areas; – Scarification of bedrock; – Inserting of supports at the bottom of the dumps; – Laying permeable (sandy) materials on the foundation and drain networks
using classic machines to ensure rapid intake and disposal of water from the dump material foundation.
1068
Fig. 7. Examples of longitudinal profiles
Proposals for preventing plastic sliding at flowing through the body slips dump: – End dumping which does not produce local sliding or of the basic ground; – Stack dumping and twinning with dump slopes; – Material dumping at normal humidity (w) (18–26%), avoiding dry materials
dumping w < 18%, or soft materials dumping w > 26%; – Creating the dumping at partial or complete dump angles to ensure stability. Follow-up proposals for dumps behaviour: – Regular follow-up of the slopes, during stacking; – Registration of any tendency of sliding, falling, collapsing, swelling, and
taking the necessary actions.
CONCLUSIONS
Against the background of the phenomenon, with broad social implications, from the point of view of the conditions of environmental components, it opens an optimum way for activities of areal rehabilitation and the reintroduction of the decanting pond ‘Valea Salistei’ in to the agricultural circuit.

1069
For this purpose was carried out a topographical survey and were made a series of proposals for rehabilitation of the area and for the reintroduction of the decanting pond in to the agricultural circuit.
The rehabilitation should be made based on environmental and reconstruction maps, in several stages, in chronological order as follows3,4:
– Reclamation of decommissioned industrial areas, based on environmental maps of the surface areas;
– Neutralisation of hazardous storage areas (fuels, acids, reagents); – Preservation of infrastructure and providing a new destination for existing
spaces; – Slope stabilisation within the industrial premises and stabilisation of sterile
material;– Slope stabilisation; – Change the land morphology; – Implementation of agro-hydraulic measures to remove the excess of moisture
or add the deficit, as appropriate; – Agricultural soil amendment; – Stop the evolution of ravines;– Torrent planning; – Seeding the areas. The development of the Rosia Montana Project, as proposed by RMGC, will
deliver solutions entirely compatible with the principles of sustainable development that will in turn lead to the re-birth of a sustainable environment in Rosia Montana5.
REFERENCES1. Insemex Petrosani: The Environmental Balance Report, Level 1 – for the Activity Undertaken
through Exploitation and Preparation of Ores from the ROSIAMIN Branch, Petrosani. 2005.2. L. DIMEN: Environmental Mapping of Critical Areas. Zlatna Areal. Aeternitas Publ. House,
Alba Iulia, 2007.3. V. BUDIU, D. MURESAN: Land Improvement – Draining and Fighting Soil Erosion. Genesis
Publ. House, Cluj-Napoca, 1996.4. A. B. UNGUR: Topographical Survey and Proposals Concerning the Rehabilitation of the Tail-
ings Dump in Gura Rosiei in View of Returning It to the Agricultural Circuit. J Environ Prot Ecol, 14 (3), 1041(2013).
5. J. ASTON, J. KNIGHT: Development and Environmental Sustainability: The Case of Rosia Montana. J Environ Prot Ecol, 6 (2), 241 (2005).
Received 9 June 2015 Revised 25 July 2015
1070
* For correspondence.
Journal of Environmental Protection and Ecology 16, No 3, 1070–1081 (2015)
Clean technologies
THE POWER OF INTERCONNECTIVITY IN INTELLIGENT TECHNOLOGIES AS A WAY TO INCREASE ENVIRONMENTAL PROTECTION AWARENESS AND IMPLICATION
G. ORZAN*, L.-A. BOBOC, I. BURGHELEA, L.-D. STUPU
Bucharest University of Economic Studies, 6 Romana Square, Bucharest, Romania E-mail: [email protected]; [email protected]; [email protected]; [email protected]
Abstract. Environmental protection has always been an important subject matter to be addressed in the way to sustainable development. However, in our current fast-paced environment, dominated by speed and an increasing number of responsibilities, people find it more and more difficult to figure out the time and motivation to get involved in this area. In a marketing environment dominated by social media and online interactions, intelligent technologies prove to be a very useful and audience-centered tool for this matter. Particularly, the increasing number of smartphone users leads the way to a faster, innovative and well targeted solution, such as the use of both interactive and personalised mobile applications. The current paper aims to emphasise the impact that a mobile application, founded on the grounds of interconnectivity and geo-location, would have on increasing the engagement of us-ers regarding environmental protection awareness and implication. For this purpose, the marketing research conducted in order to study the opinions, attitudes and possible behaviours of smartphone users towards integrating intelligent technologies in the area of environmental protection confirms the positive outcomes and serves as a baseline for further development and implementation of such a mobile application.
Keywords: environmental protection, marketing research, pilot mobile application, intelligent tech-nologies, viral marketing.
AIMS AND BACKGROUND
The purpose of this paper is to highlight the impact of using intelligent technolo-gies as a way to increase environmental protection awareness and implication. Consequently, a marketing research was conducted in order to study the opinions, attitudes and behaviour of smartphone users from Romania regarding the integration of smart technologies as a way to increase engagement in environmental protection.
The key objectives of this marketing research were to identify the level of user involvement in using such a mobile application, the main areas of interest in protecting the environment, determine the main functionalities of this pilot mobile
1071
application, the conceptual ideas regarding branding and design of the user inter-face, as well as evaluating the impact of viral marketing in developing the level of awareness of such a mobile application. By taking advantage of the whole range of benefits and possibilities offered by intelligent technologies and developing a well-targeted mobile application according to user preferences, both the awareness and engagement in the area of environmental protection could significantly increase.
Protecting the environment is essential nowadays. The humanity must think to the needs of future generations also they are becoming stressed because of the promotion of life quality. more and more of the natural resources and endanger environmental systems (water, soil and air)1.
The most known topics regarding environmental protection and involvement refer to: electricity, pollution, food, water, rubbish, rainforests (deforestation). Education should contribute to the intellectual and emotional development of students and raise their environmental awareness education providing experiences of problem-solving, decision-making and participation, with considerations based on ecological, political, economic, social, aesthetic and ethical aspects2.
The concept of environmental protection refers to a practice of protecting the natural environment by individuals, organisations or governments, for the advan-tage of both the natural environment and humans. Due to the pressures of people and advanced technology, the biophysical environment is being degraded, sometimes entirely. Because it is the most important factor that influences our lives and entire society the preservation and quality improvement of the environment we live in gained a well de-served importance in the last years. In this process are involved private persons, non-profit associations, companies, universities, research centres, national and international institutions. This phenomenon has been acknowledged and governments, different institutions or non-governmental organisations (NGO) specialised in environmental protection have begun placing restraints on activities that cause environmental degradation3.
Environmental protection is affected by three factors: legislation, ethics and education. Each of those factors influence national-level environmental decisions and personal-level environmental values and behaviours. For environmental pro-tection to become a real interest for societies, it is important to develop each of these issues which, together, will conduct efficiency in environmental decisions4.
The topic of this paper reflects different aspects regarding environmental protection and the way intelligent technologies could increase awareness and en-gagement regarding the issue of environmental protection. Mobile devices using intelligent technologies become more and more powerful and offer continuously growing capabilities in terms of computing capability, size of screen, available memory, etc.5
In this contextual situation, researchers found ways to prevent pollution by using mobile applications such as CitiSense and CommonSense6 that employ
1072
personal sensors carried by people to monitor air pollution. The main purpose of these projects was the use of technologies to conduct awareness among users and encourage citizens to participate in the environmental protection process, as well as to learn more about their environment by providing them with real-time feedback.
OpenSense is a project that began in 2010 and was created by the Swiss Federal Institute of Technology (ETH), in Zurich. The project employs custom-manufactured platforms based on the use of low cost electrochemical and metal oxide sensors. The platforms were displayed on trams, with data being accessible via a website7.
Another intelligent system developed was Citi-Sense-MOB which is com-posed of sensors installed on mobile platforms (e.g. buses, bicycles, cars, etc.). The continuously gathered data is then transmitted to a server for processing (e.g. automatic quality control, generation of maps and graphics, etc.). The processed data are sent back to the stakeholders and presented in an user-friendly and visu-ally informative layout using both web solutions and mobile phone apps. The Citi-Sense-MOB architecture is founded on three pillars: (1) sensor platforms; (2) information and communication technologies; (3) citizens8.
EXPERIMENTAL
Taking into consideration the fact that we now live in an era where the impact of technology is constantly increasing, we’ve come across the need to research if the integrated smart technologies, in particular a mobile application with a user-friendly interface, could also help to improve the current issues and challenges that the environment is facing nowadays.
To this purpose, an exploratory research was conducted, aiming to analyse the opinions, attitudes and behaviour of smart phone users from Romania regarding the integration of smart technologies in order to increase environmental protec-tion awareness and implication. This research aims to offer both useful insights to further develop such a pilot mobile application and useful understanding of the positive impact that this kind of interactive app could have upon the issues of environmental protection.
The research was based on the survey method, involving the design and use of a questionnaire to collect data from respondents, via the esurveyspro.com platform.
The respondents were targeted mostly online, the questionnaire link being distributed through the use of social networks and e-mails, but also through SMS and other interactive mobile applications. Through this snowball method, 83 re-spondents have filled in the study.
The questionnaire consists of 13 questions, developed according to the purpose of research. It begins with a filter question designed to select the individuals of interest to this research, smartphone users in particular, and ends with descriptive
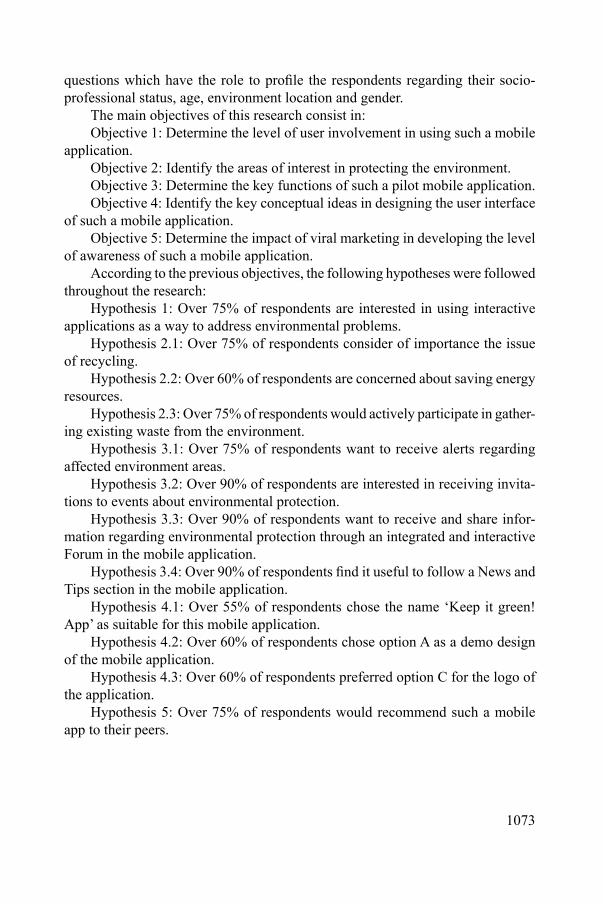
1073
questions which have the role to profile the respondents regarding their socio-professional status, age, environment location and gender.
The main objectives of this research consist in:Objective 1: Determine the level of user involvement in using such a mobile
application.Objective 2: Identify the areas of interest in protecting the environment.Objective 3: Determine the key functions of such a pilot mobile application.Objective 4: Identify the key conceptual ideas in designing the user interface
of such a mobile application.Objective 5: Determine the impact of viral marketing in developing the level
of awareness of such a mobile application.According to the previous objectives, the following hypotheses were followed
throughout the research:Hypothesis 1: Over 75% of respondents are interested in using interactive
applications as a way to address environmental problems.Hypothesis 2.1: Over 75% of respondents consider of importance the issue
of recycling.Hypothesis 2.2: Over 60% of respondents are concerned about saving energy
resources.Hypothesis 2.3: Over 75% of respondents would actively participate in gather-
ing existing waste from the environment.Hypothesis 3.1: Over 75% of respondents want to receive alerts regarding
affected environment areas.Hypothesis 3.2: Over 90% of respondents are interested in receiving invita-
tions to events about environmental protection.Hypothesis 3.3: Over 90% of respondents want to receive and share infor-
mation regarding environmental protection through an integrated and interactive Forum in the mobile application.
Hypothesis 3.4: Over 90% of respondents find it useful to follow a News and Tips section in the mobile application.
Hypothesis 4.1: Over 55% of respondents chose the name ‘Keep it green! App’ as suitable for this mobile application.
Hypothesis 4.2: Over 60% of respondents chose option A as a demo design of the mobile application.
Hypothesis 4.3: Over 60% of respondents preferred option C for the logo of the application.
Hypothesis 5: Over 75% of respondents would recommend such a mobile app to their peers.
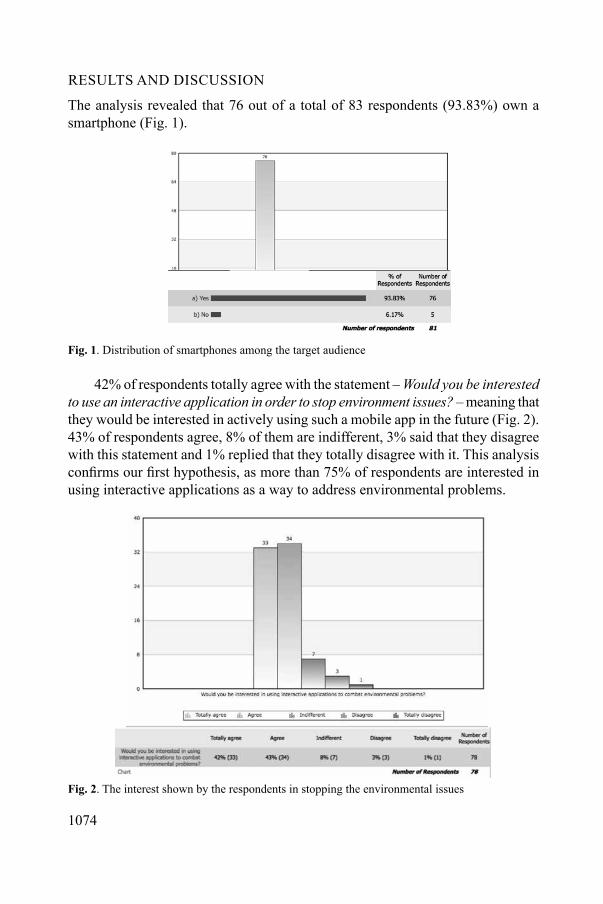
1074
RESULTS AND DISCUSSION
The analysis revealed that 76 out of a total of 83 respondents (93.83%) own a smartphone (Fig. 1).
Fig. 1. Distribution of smartphones among the target audience
42% of respondents totally agree with the statement – Would you be interested to use an interactive application in order to stop environment issues? – meaning that they would be interested in actively using such a mobile app in the future (Fig. 2). 43% of respondents agree, 8% of them are indifferent, 3% said that they disagree with this statement and 1% replied that they totally disagree with it. This analysis confirms our first hypothesis, as more than 75% of respondents are interested in using interactive applications as a way to address environmental problems.
Fig. 2. The interest shown by the respondents in stopping the environmental issues
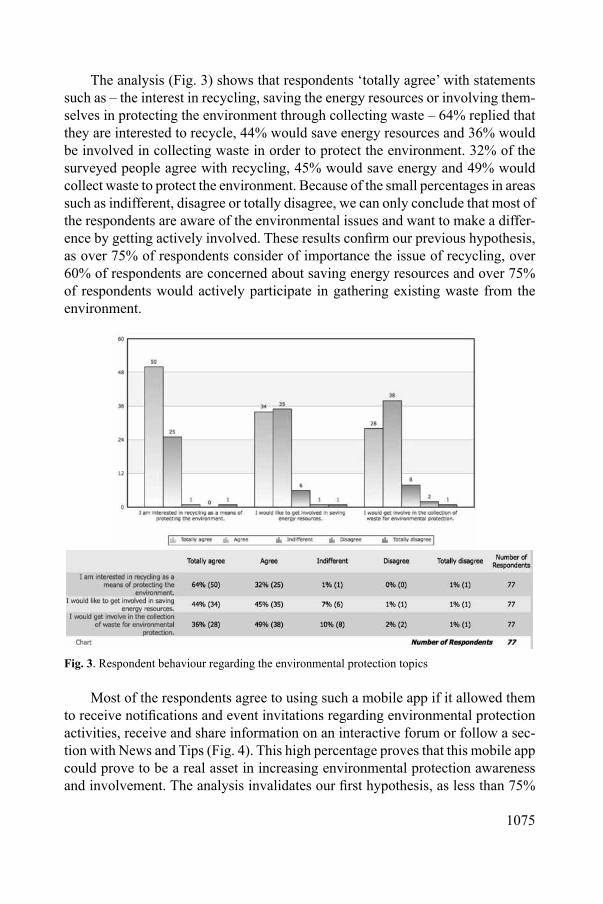
1075
The analysis (Fig. 3) shows that respondents ‘totally agree’ with statements such as – the interest in recycling, saving the energy resources or involving them-selves in protecting the environment through collecting waste – 64% replied that they are interested to recycle, 44% would save energy resources and 36% would be involved in collecting waste in order to protect the environment. 32% of the surveyed people agree with recycling, 45% would save energy and 49% would collect waste to protect the environment. Because of the small percentages in areas such as indifferent, disagree or totally disagree, we can only conclude that most of the respondents are aware of the environmental issues and want to make a differ-ence by getting actively involved. These results confirm our previous hypothesis, as over 75% of respondents consider of importance the issue of recycling, over 60% of respondents are concerned about saving energy resources and over 75% of respondents would actively participate in gathering existing waste from the environment.
Fig. 3. Respondent behaviour regarding the environmental protection topics
Most of the respondents agree to using such a mobile app if it allowed them to receive notifications and event invitations regarding environmental protection activities, receive and share information on an interactive forum or follow a sec-tion with News and Tips (Fig. 4). This high percentage proves that this mobile app could prove to be a real asset in increasing environmental protection awareness and involvement. The analysis invalidates our first hypothesis, as less than 75%

1076
of respondents want to receive alerts regarding affected environment areas, less than 90% of respondents are interested in receiving invitations to events about environmental protection, less than 90% of respondents want to receive and share information regarding environmental protection through an integrated and inter-active Forum in the mobile application and less than 90% of respondents find it useful to follow a News and Tips section in the mobile application.
Fig. 4. Respondent opinion regarding the application features
33.5% of respondents are willing to provide their e-mail as a personal contact information, whereas only 28.29% are willing to share their name and surname (Fig. 5). Only 14.47% of respondents want to share their geolocation, 16.45 % their Facebook id in order to log in to the app and only 7.24% would provide their personal phone number.
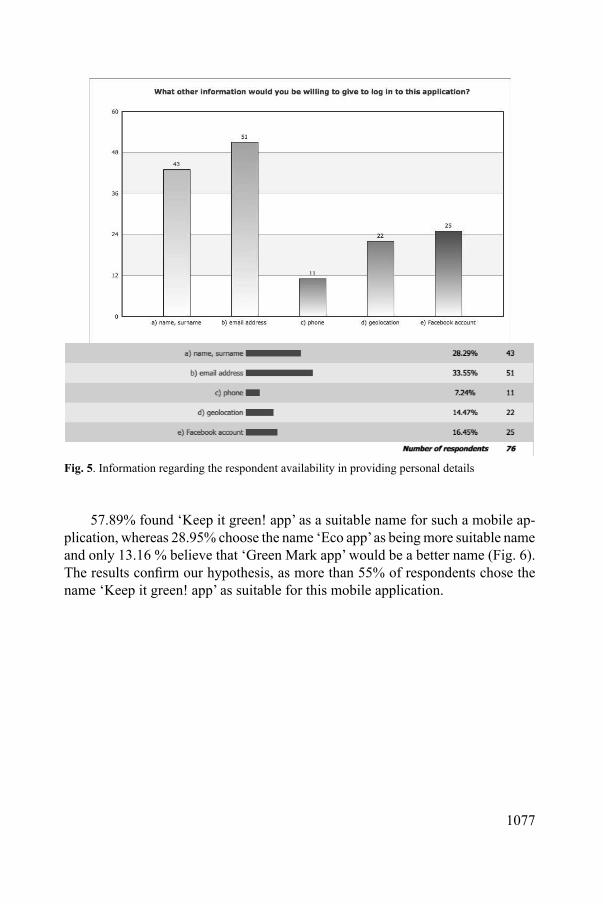
1077
Fig. 5. Information regarding the respondent availability in providing personal details
57.89% found ‘Keep it green! app’ as a suitable name for such a mobile ap-plication, whereas 28.95% choose the name ‘Eco app’ as being more suitable name and only 13.16 % believe that ‘Green Mark app’ would be a better name (Fig. 6). The results confirm our hypothesis, as more than 55% of respondents chose the name ‘Keep it green! app’ as suitable for this mobile application.
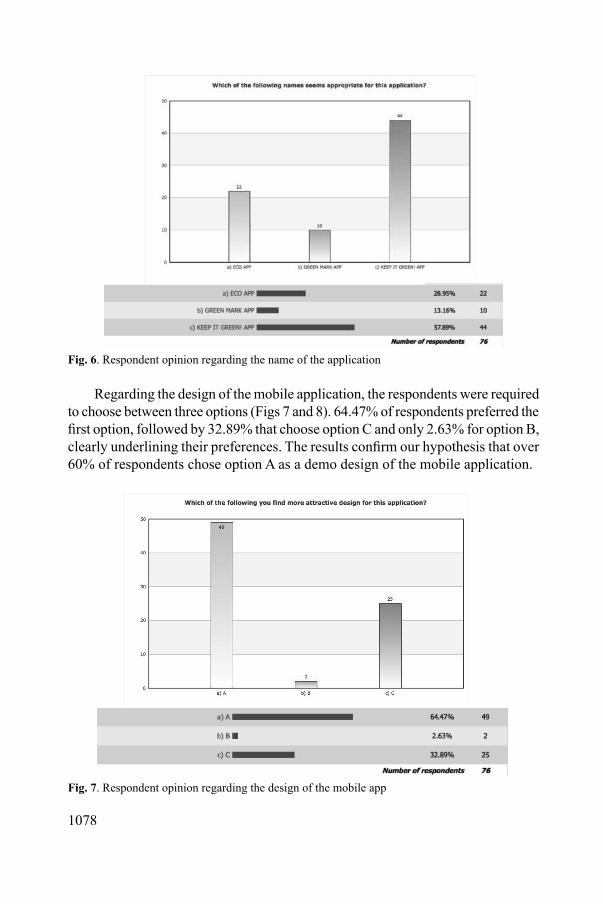
1078
Fig. 6. Respondent opinion regarding the name of the application
Regarding the design of the mobile application, the respondents were required to choose between three options (Figs 7 and 8). 64.47% of respondents preferred the first option, followed by 32.89% that choose option C and only 2.63% for option B, clearly underlining their preferences. The results confirm our hypothesis that over 60% of respondents chose option A as a demo design of the mobile application.
Fig. 7. Respondent opinion regarding the design of the mobile app
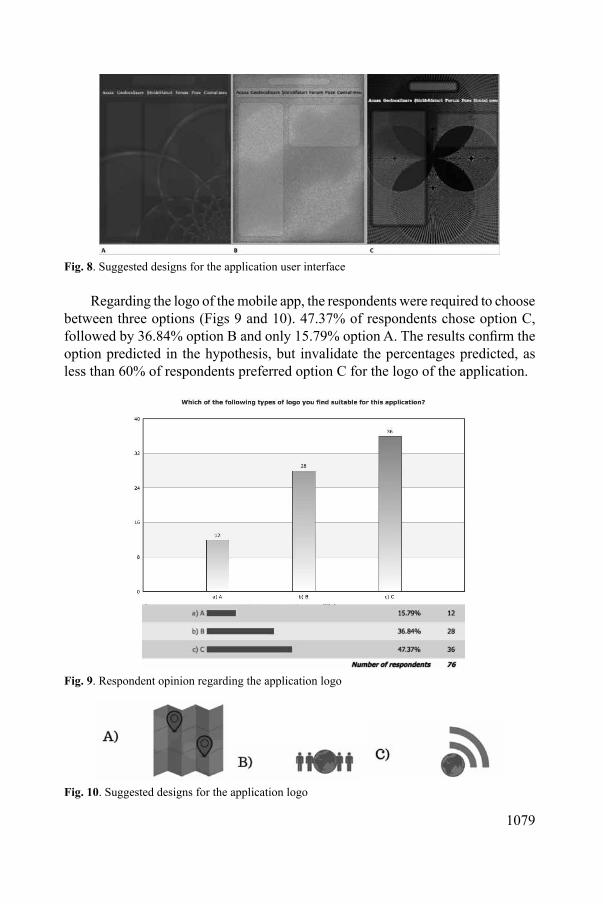
1079
Fig. 8. Suggested designs for the application user interface
Regarding the logo of the mobile app, the respondents were required to choose between three options (Figs 9 and 10). 47.37% of respondents chose option C, followed by 36.84% option B and only 15.79% option A. The results confirm the option predicted in the hypothesis, but invalidate the percentages predicted, as less than 60% of respondents preferred option C for the logo of the application.
Fig. 9. Respondent opinion regarding the application logo
Fig. 10. Suggested designs for the application logo
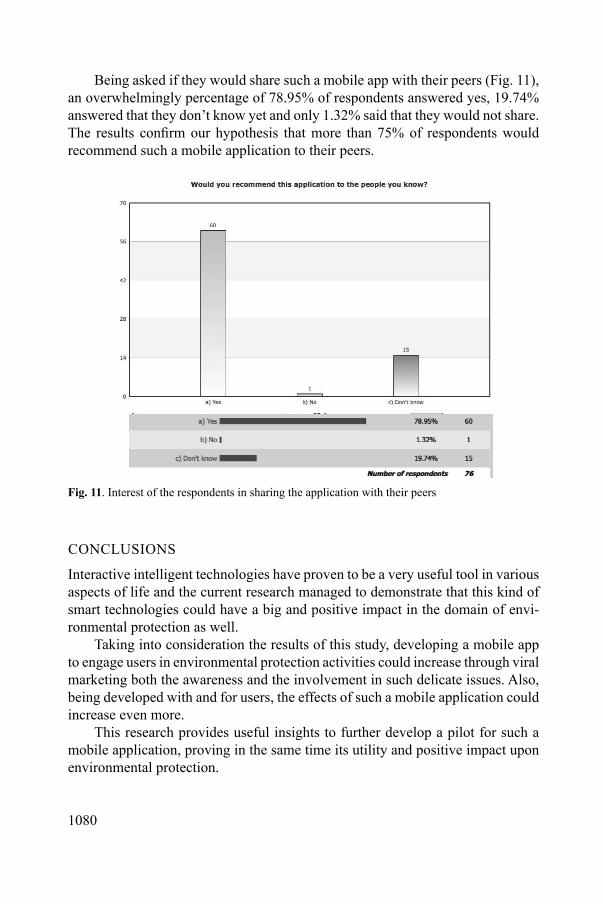
1080
Being asked if they would share such a mobile app with their peers (Fig. 11), an overwhelmingly percentage of 78.95% of respondents answered yes, 19.74% answered that they don’t know yet and only 1.32% said that they would not share. The results confirm our hypothesis that more than 75% of respondents would recommend such a mobile application to their peers.
Fig. 11. Interest of the respondents in sharing the application with their peers
CONCLUSIONS
Interactive intelligent technologies have proven to be a very useful tool in various aspects of life and the current research managed to demonstrate that this kind of smart technologies could have a big and positive impact in the domain of envi-ronmental protection as well.
Taking into consideration the results of this study, developing a mobile app to engage users in environmental protection activities could increase through viral marketing both the awareness and the involvement in such delicate issues. Also, being developed with and for users, the effects of such a mobile application could increase even more.
This research provides useful insights to further develop a pilot for such a mobile application, proving in the same time its utility and positive impact upon environmental protection.
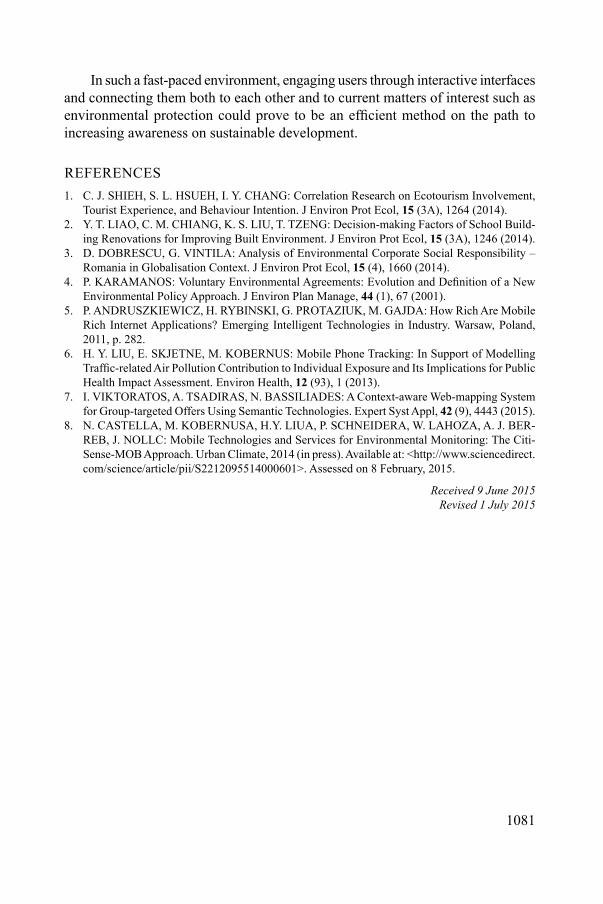
1081
In such a fast-paced environment, engaging users through interactive interfaces and connecting them both to each other and to current matters of interest such as environmental protection could prove to be an efficient method on the path to increasing awareness on sustainable development.
REFERENCES1. C. J. SHIEH, S. L. HSUEH, I. Y. CHANG: Correlation Research on Ecotourism Involvement,
Tourist Experience, and Behaviour Intention. J Environ Prot Ecol, 15 (3A), 1264 (2014).2. Y. T. LIAO, C. M. CHIANG, K. S. LIU, T. TZENG: Decision-making Factors of School Build-
ing Renovations for Improving Built Environment. J Environ Prot Ecol, 15 (3A), 1246 (2014).3. D. DOBRESCU, G. VINTILA: Analysis of Environmental Corporate Social Responsibility –
Romania in Globalisation Context. J Environ Prot Ecol, 15 (4), 1660 (2014).4. P. KARAMANOS: Voluntary Environmental Agreements: Evolution and Definition of a New
Environmental Policy Approach. J Environ Plan Manage, 44 (1), 67 (2001).5. P. ANDRUSZKIEWICZ, H. RYBINSKI, G. PROTAZIUK, M. GAJDA: How Rich Are Mobile
Rich Internet Applications? Emerging Intelligent Technologies in Industry. Warsaw, Poland, 2011, p. 282.
6. H. Y. LIU, E. SKJETNE, M. KOBERNUS: Mobile Phone Tracking: In Support of Modelling Traffic-related Air Pollution Contribution to Individual Exposure and Its Implications for Public Health Impact Assessment. Environ Health, 12 (93), 1 (2013).
7. I. VIKTORATOS, A. TSADIRAS, N. BASSILIADES: A Context-aware Web-mapping System for Group-targeted Offers Using Semantic Technologies. Expert Syst Appl, 42 (9), 4443 (2015).
8. N. CASTELLA, M. KOBERNUSA, H.Y. LIUA, P. SCHNEIDERA, W. LAHOZA, A. J. BER-REB, J. NOLLC: Mobile Technologies and Services for Environmental Monitoring: The Citi-Sense-MOB Approach. Urban Climate, 2014 (in press). Available at: <http://www.sciencedirect.com/science/article/pii/S2212095514000601>. Assessed on 8 February, 2015.
Received 9 June 2015 Revised 1 July 2015
1082
* For correspondence.
Journal of Environmental Protection and Ecology 16, No 3, 1082–1090 (2015)
Environmental management
SYSTEM MODELLING FOR ENVIRONMENTAL MANAGEMENT OF MINING AND ENERGY COMPLEX BASED ON THE STRATEGY PRINCIPLES OF SUSTAINABLE BALANCED SCORECARD METHOD (SBSC)
J. M. NIKOLICa, I. RISTOVICb, D. VASOVICa*aFaculty of Occupational Safety in Nis, University of Nis, 10a Carnojevica Street, 18 000 Nis, Serbia bFaculty of Mining and Geology, University of Belgrade, 7 Dusiina Street, 11 000 Belgrade, Serbia E-mail: [email protected]
Abstract. System modelling for environmental management of mining and energy complex, based on the analysis of the consequences of exploitation and coal combustion, is a prerequisite for the reduc-tion of cross-border pollution and preserving the quality of air, water and soil. This paper analyses the impact of air pollution by the energy complex ‘TE Kostolac’ from the Republic of Serbia. Analytical hierarchical method is used for ranking the aspects of air quality in relation to: failures in organisation of the protection system, the lack of financial resources for the implementation of standard measures of precautions and reactions of environmental organisations. Paper considers the influence of surface mines and power plants on: quality of the air environment, employees, stakeholders and financial situation in the event of a hazardous situation. We ranked the scores of consequences of the surface mines and power plants operations as the basis for the application of multi-criteria decision-making in the process of solving high priority problems of air environment pollution. The results of the analy-sis of impact of power plants on ambient air quality and calculation of weighted coefficients form the basis for the application of balanced scorecard method. Systematic approach to environmental management planning for mining and energy complex, based on the application of AHP method in combination with BSC method, provides an opportunity for a more realistic view of the situation and mitigates the subjective attitudes in decision-making. The paper used a clear strategy of Sustainable balanced scorecard method (SBSC). Environmental management procedure in the energy complex is based on the partial method and the method of shared services. Proposal of protection measures and the development of strategies to protect the environment contribute to better international coopera-tion and reducing the level of cross-border air pollution. Realisation of presented solutions depends on the financial possibilities of mining and energy complex and the willingness of management to take significant steps in solving environmental problems, implementing the principle of sustainable development and improving the environmental safety of cross-border regions.
Keywords: protection models, management, SBSC, mining and energy complexes.

1083
AIMS AND BACKGROUND
Within the overall primary energy consumption in Serbia (by energy source), fossil fuels are prevalent. Reports on the state of the environment in Serbia indicate that thermal power stations are the dominant sources of air pollution. This paper consid-ers the impact of the mining and energy complex in Kostolac, which incorporates three surface mines (Cirikovac, Klenovik, and Drmno) and two thermal power stations (TE ‘Kostolac A’ (100 MW) and TE ‘Kostolac B’ (2×348.5 MW)) (Ref. 1).
Based on the Reports on Emission Values it can be concluded that the smoke channels of thermal stations TE ‘Kostolac A’, Block 1, Boiler 1; TE ‘Kostolac A’, Block 1, Boiler 2; TE ‘Kostolac A’, Block 2; TE ‘Kostolac B’, Block 1; and TE ‘Kostolac B’, Block 2 have higher sulphur dioxide mass concentration values than the emission limit value (ELV) and that values in excess of the ELV for solid particulates is often registered2.
Improvement of the environmental management system in the ‘Kostolac’ min-ing and energy complex should be aimed toward enhancing the level of control efficiency, introducing modern safety measures, and reducing the possibility of cross-border propagation of air pollution. Objective assessment of the effects of coal exploitation and combustion are required3,4. Use of a multi-criteria approach to decision-making and implementation of advanced management strategies forms a basis for the realisation of the adopted environmental policy for mining and energy complexes5.
RESULTS AND DISCUSSION
ANALYTIC HIERARCHY PROCESS IN THE ENVIRONMENTAL MANAGEMENT SYSTEM OF MINING AND ENERGY COMPLEXES
Management of environmental systems based on the Analytic Hierarchy Process (AHP) increases the level of objectivity and reduced personal views to a minimum. Thomas Saaty developed the concept of this model in 1978 (Ref. 6). It includes a definition of hierarchy, selection of elements (criteria, sub-criteria, and attributes), comparison of significance of all same-level elements in relation to priorities (higher-level elements), calculation of weight coefficients, and creation of a list of priorities.
A modern environmental management system (EMS) requires the identification of environmental aspects and causes of air pollution. The assessed environmen-tal aspects are the effects of surface mining of coal (dust dispersal from surface mine slopes – E1; dust and exhaust emission during the operation of mining and transport machinery – E2; coal dust dispersal from access and transport roads – E3; and emission of gases from spontaneous coal combustion – E4) and of coal combustion (incomplete coal combustion – E1; irregular filter replacement – E2;
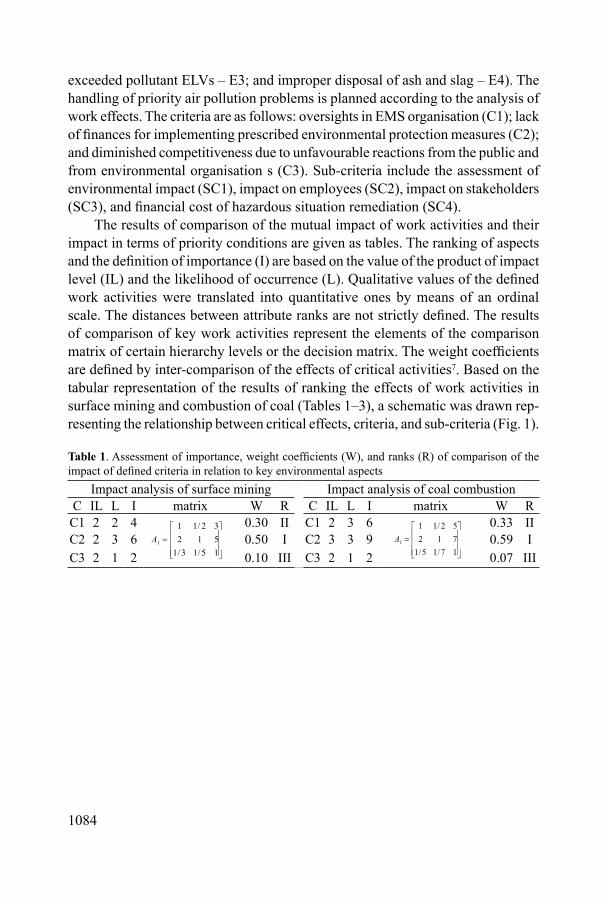
1084
exceeded pollutant ELVs – E3; and improper disposal of ash and slag – E4). The handling of priority air pollution problems is planned according to the analysis of work effects. The criteria are as follows: oversights in EMS organisation (C1); lack of finances for implementing prescribed environmental protection measures (C2); and diminished competitiveness due to unfavourable reactions from the public and from environmental organisation s (C3). Sub-criteria include the assessment of environmental impact (SC1), impact on employees (SC2), impact on stakeholders (SC3), and financial cost of hazardous situation remediation (SC4).
The results of comparison of the mutual impact of work activities and their impact in terms of priority conditions are given as tables. The ranking of aspects and the definition of importance (I) are based on the value of the product of impact level (IL) and the likelihood of occurrence (L). Qualitative values of the defined work activities were translated into quantitative ones by means of an ordinal scale. The distances between attribute ranks are not strictly defined. The results of comparison of key work activities represent the elements of the comparison matrix of certain hierarchy levels or the decision matrix. The weight coefficients are defined by inter-comparison of the effects of critical activities7. Based on the tabular representation of the results of ranking the effects of work activities in surface mining and combustion of coal (Tables 1–3), a schematic was drawn rep-resenting the relationship between critical effects, criteria, and sub-criteria (Fig. 1).
Table 1. Assessment of importance, weight coefficients (W), and ranks (R) of comparison of the impact of defined criteria in relation to key environmental aspects
Impact analysis of surface mining Impact analysis of coal combustionC IL L I matrix W R C IL L I matrix W R
C1 2 2 4
=
15/13/151232/11
1A
0.30 II C1 2 3 6
=
17/15/171252/11
1A
0.33 IIC2 2 3 6 0.50 I C2 3 3 9 0.59 IC3 2 1 2 0.10 III C3 2 1 2 0.07 III
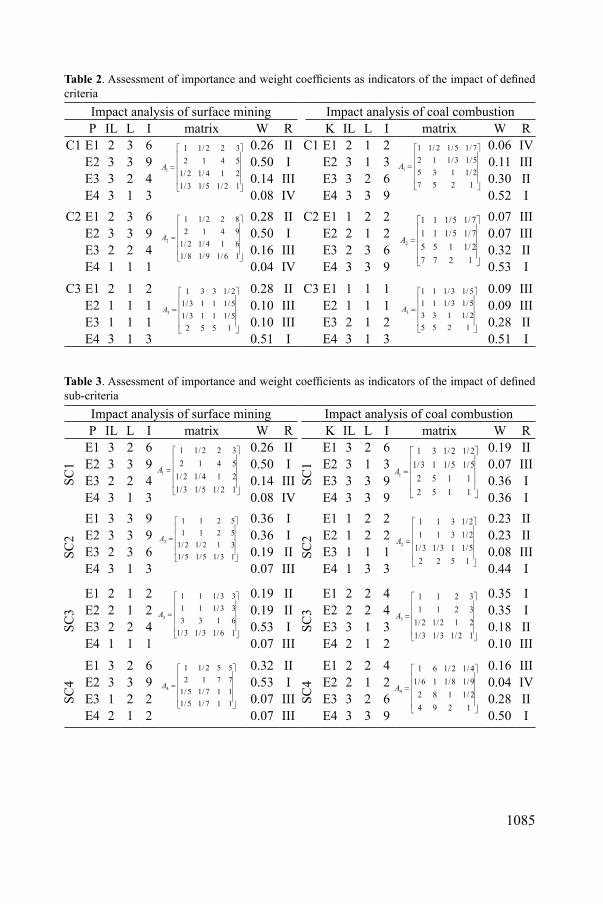
1085
Table 2. Assessment of importance and weight coefficients as indicators of the impact of defined criteria
Impact analysis of surface mining Impact analysis of coal combustionP IL L I matrix W R K IL L I matrix W R
C1 E1 2 3 6
=
12/15/13/1214/12/15412322/11
1A
0.26 II C1 E1 2 1 2
=
12572/11355/13/1127/15/12/11
1A
0.06 IVE2 3 3 9 0.50 I E2 3 1 3 0.11 IIIE3 3 2 4 0.14 III E3 3 2 6 0.30 IIE4 3 1 3 0.08 IV E4 3 3 9 0.52 I
C2 E1 2 3 6
=
16/19/18/1614/12/19412822/11
2A
0.28 II C2 E1 1 2 2
=
12772/11557/15/1117/15/111
2A
0.07 IIIE2 3 3 9 0.50 I E2 2 1 2 0.07 IIIE3 2 2 4 0.16 III E3 2 3 6 0.32 IIE4 1 1 1 0.04 IV E4 3 3 9 0.53 I
C3 E1 2 1 2
=
15525/1113/15/1113/12/1331
3A
0.28 II C3 E1 1 1 1
=
12552/11335/13/1115/13/111
3A
0.09 IIIE2 1 1 1 0.10 III E2 1 1 1 0.09 IIIE3 1 1 1 0.10 III E3 2 1 2 0.28 IIE4 3 1 3 0.51 I E4 3 1 3 0.51 I
Table 3. Assessment of importance and weight coefficients as indicators of the impact of defined sub-criteria
Impact analysis of surface mining Impact analysis of coal combustionP IL L I matrix W R K IL L I matrix W R
SC1
E1 3 2 6
=
12/15/13/1214/12/15412322/11
1A
0.26 II
SC1
E1 3 2 6
=
115211525/15/113/12/12/131
1A
0.19 IIE2 3 3 9 0.50 I E2 3 1 3 0.07 IIIE3 2 2 4 0.14 III E3 3 3 9 0.36 IE4 3 1 3 0.08 IV E4 3 3 9 0.36 I
SC2
E1 3 3 9
=
13/15/15/1312/12/152115211
2A
0.36 I
SC2
E1 1 2 2
=
15225/113/13/12/13112/1311
2A
0.23 IIE2 3 3 9 0.36 I E2 1 2 2 0.23 IIE3 2 3 6 0.19 II E3 1 1 1 0.08 IIIE4 3 1 3 0.07 III E4 1 3 3 0.44 I
SC3
E1 2 1 2
=
16/13/13/1613333/11133/111
3A
0.19 II
SC3
E1 2 2 4
=
12/13/13/1212/12/132113211
3A
0.35 IE2 2 1 2 0.19 II E2 2 2 4 0.35 IE3 2 2 4 0.53 I E3 3 1 3 0.18 IIE4 1 1 1 0.07 III E4 2 1 2 0.10 III
SC4
E1 3 2 6
=
117/15/1117/15/17712552/11
4A
0.32 II
SC4
E1 2 2 4
=
12942/11829/18/116/14/12/161
4A
0.16 IIIE2 3 3 9 0.53 I E2 2 1 2 0.04 IVE3 1 2 2 0.07 III E3 3 2 6 0.28 IIE4 2 1 2 0.07 III E4 3 3 9 0.50 I

1086
C 1 C 3 C 2
Identification of priority preventive measures of environmental protection for the purpose of modelling the environmental protection system in mining and energy complexes
SC 2 SC 3 SC 4 SC 1
C1C2
C3
SC1SC2
SC3SC4
E1* E1** E2* E2** E3* E3** E4* P4**
Fig. 1. Identification of problems in the functioning of the environmental protection system in min-ing and energy complexes and the basis for protection system modelling and selection of priority preventive measures of environmental protection (*Impact analysis of surface mining; **Impact analysis of coal combustion)
Assessment of environmental aspect importance suggests a need for priority resolution of the following problems: coal dust emission, coal combustion, and improper disposal of ash and slag. The results of the AHP form the basis for a consideration of management strategy selection of strategic perspectives, and im-plementation of balanced scorecards for the environmental impact of coal mining and combustion8,9.
MODELLING OF ENVIRONMENTAL MANAGEMENT SYSTEMS FOR MINING AND ENERGY COMPLEXES BASED ON THE STRATEGIES OF THE SUSTAINABILITY BALANCED SCORECARD
System management using the Balanced Scorecard (BSC) was defined by Kaplan and Norton in 1992 (Ref. 10). It is based on choosing a company strategy accord-ing to the financial data, customers, business organisation, and preparedness for learning and development. The selection of AHP priority measures using BSC as a strategy organisation method has been discussed by the following authors: Pan11 on the adequacy of proposed activities noticed by management, Lee12 on facilitating decision making in the processing industry, Varma13 on performance assessment of a petroleum industry supply chain, Jovanovic and Krivokapic14 on the selection of indicator importance for indicators pertaining to the attainment of adopted company goals, and Huang15 on strategic planning.
Environmental and social aspects are the integral part of the key strategic per-spectives (SP) of the Balanced Scorecard: finance (F), users (U), internal processes (IP), and learning and development (LD) (Ref. 16). Table 4 provides a proposal for the integration of environmental and social aspects (ESA) and the introduction

1087
of a derived, market-oriented, environmental-social perspective (ESP) within the EMS and its subsystem for air quality preservation.
Table 4. Proposal for integration of environmental and social aspects (ESA) into key strategic perspectives
BSC type SP Proposal for the integration of environmental and social aspectsIntegration of
ESAF allocation of finances for the monitoring of air pollution propaga-
tionU regular air quality control and stakeholder notification regarding
the resultsIP regular implementation of internal air monitoring processesLD personnel training for internal control of air quality and report
writingIndependentESP
F higher profit and preservation of coal reserves coupled with envi-ronmental quality preservation
U reduced amount of pollutants per unit of distributed energyIP monitoring of air quality and exceeded limit valuesLD education of employees for planning and use of alternative energy
sources
The defined proposal of integration of ESA given in Table 4 increases the reputation of any mining and energy complex without any significant financial investment. The market-oriented derived environmental perspective requires state support and guarantees in terms of initial capital and resolution of environmental issues. It is one the most complex forms of balanced scorecard implementation and it enables business operation in accordance with the principles of sustainable development.
Table 5 provides a proposal of the integration of environmental (E), social (S), or environmental-social (E-S) aspects, in parallel with the key perspectives.
Table 5. Proposal of introduction of environmental-social perspective (E-S, E, or S) of environmental managementSP Goals of new environmental-social perspectives of environmental managementE-S Internal monitoring of air and, if necessary, public notificationE Internal monitoring of air and determination of pollutant concentrationsS Financial support to persons suffering from respiratory diseases and public warn-
ings
This proposal is an important step towards determining the actual state of the environment and mitigating the effects of coal mining and combustion.
Integrating elements of sustainable development into the balanced scorecard requires a systems approach to management. Figge et al.17 base the inclusion of elements of sustainable development on the integration of new environmental
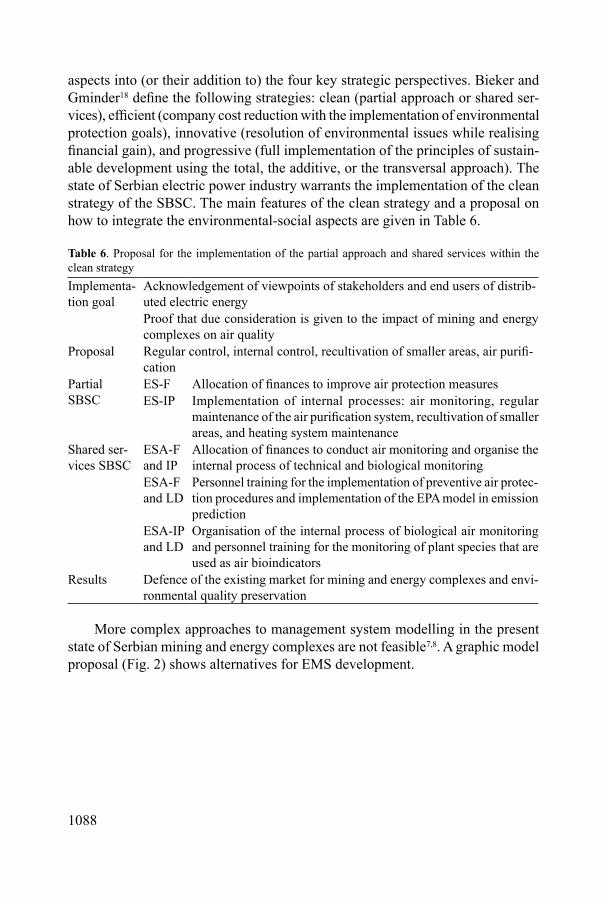
1088
aspects into (or their addition to) the four key strategic perspectives. Bieker and Gminder18 define the following strategies: clean (partial approach or shared ser-vices), efficient (company cost reduction with the implementation of environmental protection goals), innovative (resolution of environmental issues while realising financial gain), and progressive (full implementation of the principles of sustain-able development using the total, the additive, or the transversal approach). The state of Serbian electric power industry warrants the implementation of the clean strategy of the SBSC. The main features of the clean strategy and a proposal on how to integrate the environmental-social aspects are given in Table 6.
Table 6. Proposal for the implementation of the partial approach and shared services within the clean strategyImplementa-tion goal
Acknowledgement of viewpoints of stakeholders and end users of distrib-uted electric energyProof that due consideration is given to the impact of mining and energy complexes on air quality
Proposal Regular control, internal control, recultivation of smaller areas, air purifi-cation
PartialSBSC
ES-F Allocation of finances to improve air protection measuresES-IP Implementation of internal processes: air monitoring, regular
maintenance of the air purification system, recultivation of smaller areas, and heating system maintenance
Shared ser-vices SBSC
ESA-F and IP
Allocation of finances to conduct air monitoring and organise the internal process of technical and biological monitoring
ESA-F and LD
Personnel training for the implementation of preventive air protec-tion procedures and implementation of the EPA model in emission prediction
ESA-IP and LD
Organisation of the internal process of biological air monitoring and personnel training for the monitoring of plant species that are used as air bioindicators
Results Defence of the existing market for mining and energy complexes and envi-ronmental quality preservation
More complex approaches to management system modelling in the present state of Serbian mining and energy complexes are not feasible7,8. A graphic model proposal (Fig. 2) shows alternatives for EMS development.
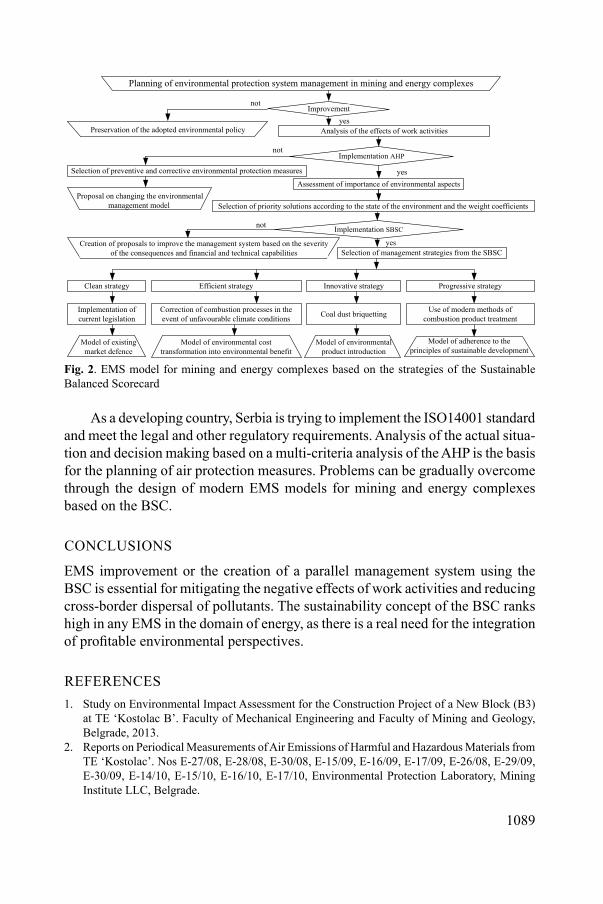
1089
Clean strategy Efficient strategy Innovative strategy Progressive strategy
Improvement
Analysis of the effects of work activities
Implementation AHP
Assessment of importance of environmental aspects
Selection of preventive and corrective environmental protection measures
Selection of priority solutions according to the state of the environment and the weight coefficients
Implementation SBSC
Preservation of the adopted environmental policy
Proposal on changing the environmental management model
Creation of proposals to improve the management system based on the severity of the consequences and financial and technical capabilities Selection of management strategies from the SBSC
Implementation of current legislation
Correction of combustion processes in the event of unfavourable climate conditions Coal dust briquetting Use of modern methods of
combustion product treatment
Model of existingmarket defence
Model of environmental cost transformation into environmental benefit
Model of environmental product introduction
Model of adherence to the principles of sustainable development
Planning of environmental protection system management in mining and energy complexes
yes
yes
yes
not
not
not
Fig. 2. EMS model for mining and energy complexes based on the strategies of the Sustainable Balanced Scorecard
As a developing country, Serbia is trying to implement the ISO14001 standard and meet the legal and other regulatory requirements. Analysis of the actual situa-tion and decision making based on a multi-criteria analysis of the AHP is the basis for the planning of air protection measures. Problems can be gradually overcome through the design of modern EMS models for mining and energy complexes based on the BSC.
CONCLUSIONS
EMS improvement or the creation of a parallel management system using the BSC is essential for mitigating the negative effects of work activities and reducing cross-border dispersal of pollutants. The sustainability concept of the BSC ranks high in any EMS in the domain of energy, as there is a real need for the integration of profitable environmental perspectives.
REFERENCES1. Study on Environmental Impact Assessment for the Construction Project of a New Block (B3)
at TE ‘Kostolac B’. Faculty of Mechanical Engineering and Faculty of Mining and Geology, Belgrade, 2013.
2. Reports on Periodical Measurements of Air Emissions of Harmful and Hazardous Materials from TE ‘Kostolac’. Nos E-27/08, E-28/08, E-30/08, E-15/09, E-16/09, E-17/09, E-26/08, E-29/09, E-30/09, E-14/10, E-15/10, E-16/10, E-17/10, Environmental Protection Laboratory, Mining Institute LLC, Belgrade.

1090
3. N. R. GRUJIC, M. TRIFUNOVIC, Z. PESIC: Electrical Energy Production from Coal and Its Impacts on Environment. J Environ Prot Ecol, 15 (1), 16 (2014).
4. A.-D. GHEORGHIU, Z. TOROK, A. OZUNU: How Can Existing Risk Assessment Method-ologies Be Based in Systematic Maner, in the Extractive Mining Industry? J Environ Prot Ecol, 14 (4), 1597 (2013).
5. G. JANACKOVIC, S. SAVIC, M. STANKOVIC: Multi-criteria Decision Analysis in Occupa-tional Safety Management Systems. Safety Engineering – Journal for Scientists and Engineers (University of Nis, Faculty of Occupational Safety), 1 (1), 17 (2011).
6. T. L. SAATY: A Scaling Method for Priorities in Hierarchical Structures. J Math Psychol, 1, 57 (1978).
7. F. PEKERA, Y. KURUCUB, H. H. TOKC, E. SAYGILIA, E. TOKD: An Aplication of GIS-supported Analytic Hierarchy Process to Determine the Ecological Thresholds in the Edirne Province. J Environ Prot Ecol, 14 (2), 713 (2013).
8. L. CONSTANTIN, M. TEODORESCU: Implementation of Environmental Management Ac-counting Systems in Romanian Companies – Methodology and Case Studies. J Environ Prot Ecol, 13 (1), 319 (2012).
9. G. WILKINSON, B. DALE: Integrated Management Systems: A Model Based on Total Quality Approach. Managing Service Quality, 11 (5), 318 (2001).
10. R. S. KAPLAN, D. P. NORTON: The Balanced Scorecard -Measures that Drive Performance. Harvard Bus Rev, 70 (1), 71 (1992).
11. F. C. PAN: Escalate BSC Power by AHP: Innovative Approach for Strategy Implementation. Int J Manag Decision Making, 7 (2–3), 337 (2006).
12. A. H. I. LEE, W. C. CHEN, C. J. CHANG: A Fuzzy AHP and BSC Approach for Evaluating Performance of IT Department in the Manufacturing Industry in Taiwan. Expert Syst Appl, 34 (1), (2008).
13. S. VARMA, S. WADHWA, S. G. DESHMUKH: Evaluating Petroleum Supply Chain Perfor-mance: Application of Analytical Hierarchy Process to Balanced Scorecard. Asia Pac J Market Logist, 20 (3), 343 (2008).
14. J. JOVANOVIC, Z. KRIVOKAPIC: AHP in Implementation of Balanced Scorecard. Int J Qual Res, 2 (1), 59 (2008).
15. H. C. HUANG: Designing a Knowledge-based System for Strategic Planning: A Balanced Scorecard Perspective. Expert Syst Appl, 36 (1), 209 (2009).
16. I. DIAS, L. REJINDERS, P. ANTUNES: From Environmental Performance Evaluation to Eco-efficiency and Sustainability Balanced Scorecard. Wiley InterScience, 2003.
17. F. FIGGE, T. HAHN, S. SCHALTEGGWR, M. WAGNER: The Sustainability Balanced Scorecard – Linking Sustainability Management to Business Strategy. Business Strategy and the Environment, 11, 269 (2001).
18. T. BIEKER, C.U. GMINDER: Towards a Sustainability Balanced Scorecard. Institute for Economy and the Environment, University of St. Galen, 2001.
Received 9 June 2015 Revised 25 July 2015
1091
* For correspondence.
Journal of Environmental Protection and Ecology 16, No 3, 1091–1100 (2015)
Environmental management
ENVIRONMENTAL CHANGES AND THEIR INFLUENCES ON PERFORMANCE OF A COMPANY BY USING ECO-DASHBOARD
S. CAPUSNEANUa*, R. IVANb, D. I. TOPORc, D.-M. OPREAd, A. MUNTEANb
aDimitrie Cantemir Christian University, Bucharest, Romania E-mail: [email protected] b‘1 Decembrie 1918’ University of Alba Iulia, Alba Iulia, Romania E-mail: [email protected]; [email protected] cHyperion University, Bucharest, Romania E-mail: [email protected] dBucharest University, Bucharest, Romania E-mail: [email protected]
Abstract. This article highlights the influences which occur on environmental reports due to changes in the environment by using eco-dashboard as a tool for monitoring, measuring and reporting envi-ronmental performance. At the basis of this study were three hypotheses. Based on the data collected through questionnaires it passed to the selection of environmental performance indicators, their calculation and interpretation. Information provided by them formed the basis of analysis and the foundation of decision taken by the managers of the company subjected to analysis by our study. The authors concluded that the proper implementation of eco-dashboard in an economic entity leads to obtaining reliable information necessary for management, coordination and harmonisation of internal activities, which ultimately contribute to improved financial performance of the entity.
Keywords: eco-dashboard, environment performances, environment indicators, green accounting, environmental management accounting.
AIMS AND BACKGROUND
Many specialists in the formulation of environmental legislation are leading a lack of information in terms of understanding the impact that the environment has on the decisions of managers at both micro and macro level, and the implications that the environment has on natural resources. Environmental accounting can provide key information necessary for understanding by the specialists of the environmental status, its evolution and its consequences on the option of certain decisions. The main objectives of this work are to identify a tool for monitoring and measuring the environmental performance of a company in the field of metallurgy, the selec-
1092
tion of performance indicators that contribute to an accurate and real image of the environment and the viability of their use in decision making process at the senior management level.
In the national and international literature, many professors and specialists in ecology discussed and published numerous studies on how to report the environ-mental information, some with a greater degree of acceptance among managers than the directors of departments. To meet the information demands from clients and from the management of the entity and to provide reliable and relevant infor-mation it is impetuous that the current reporting model of information to transcend beyond the traditional financial reporting still practiced by many economic entities. Some of the authors have analysed in their studies the practices of environmental reporting through the characteristics of entities that present environmental infor-mation1. Other authors have conducted studies on the analysis of the link between environmental performance and environmental disclosure2.
Regardless of the area of analysis of the specialists these studies revealed a series of advantages but also disadvantages for the adoption documents and envi-ronmental reporting. A number of specialists have examined in their studies also the environmental variation in reporting entities in different countries3 or variation in environmental reporting in a country for various entities in the same or different sectors4. Due to the lack of generally accepted reporting standards, most companies have tried a number of methods adopted by their own unique such as eco-balance reporting (Kunert, Germania or NSK-RHP, UK) or reporting based on performance (British Airways, BT, UK, Neste Fortum, Finland or Novo Nordisk, Danemarca). The two models are joined by a third model, not enough used but that can be a very useful model for future for the concentration of environmental information needed to conduct a company. Eco-dashboard is a tool that allows the selection, arrangement and presentation of environmental performance indicators, and also allows the visualisation of the objectives, contributing thereby to synthesising environmental information necessary for piloting the performance of a company. The form of presentation of eco-dashboard differs depending on the goals that it establishes and follows a company.
Many specialists in Romania studied dashboard which they assigned the following meanings: a tool for coordination between hierarchical levels, a set of indicators organised in a system pursued by the same team or the same responsi-ble, allowing launching decisions, coordinating and controlling the actions of a department, responsibility centre. Due to the functions that the dashboard fulfill, through the indicators they include, it often allows drawing early conclusions and identifying indicators that reached a critical level. This allows acknowledging the interactions between indicators and thus identifying and eliminating those condi-tions that are passed on to indicators and gives synoptic expression to key pieces of information needed for a driver to ensure operationally, driven object motion
1093
according to trajectory traced through program activity. Strategy of making deci-sion of any entity is based primarily on financial reporting and within them an important part it is the annual financial situations and the dashboard is a modern tool to achieve an efficient management.
EXPERIMENTAL
Research hypotheses. Based on theoretical and practical studies, including com-ments provided by specialists, we constructed the following hypotheses:
I1: The selection of environmental performance indicators and their concen-tration in the eco-dashboard of a metallurgical company contribute to an accurate image of environmental performance.
I2: Fairness determination by calculations of environmental performance indicators help to ensure relevant and reliable information.
I3: Information provided by eco-dashboard is a real source of analysis for other performance measurement tools and guarantee effective decision making by the management of the company in the metallurgical industry.
Data. Our study is based on a questionnaire with four questions that are based on identifying the main objectives for the evaluation of results. The first part of the questionnaire helps to identify tools to monitor and measure the company environ-mental performance including performance indicators, while the second part helps in determining the characteristics and effects created by environmental performance indicators of the company from the metallurgical industry. Questionnaires were given to the completion to a number of 114 respondents from a company from metallurgical industry. Respondents were divided into two categories: manage-ment (32 persons) and department specialists (82 persons). After collecting the questionnaires, and making centralisation of data, respectively data validation, the situation is as shown in Table 1.
Graphically the situation is presented in Fig. 1.
Fig. 1. Graphical representation of pro answers of the two categories of persons
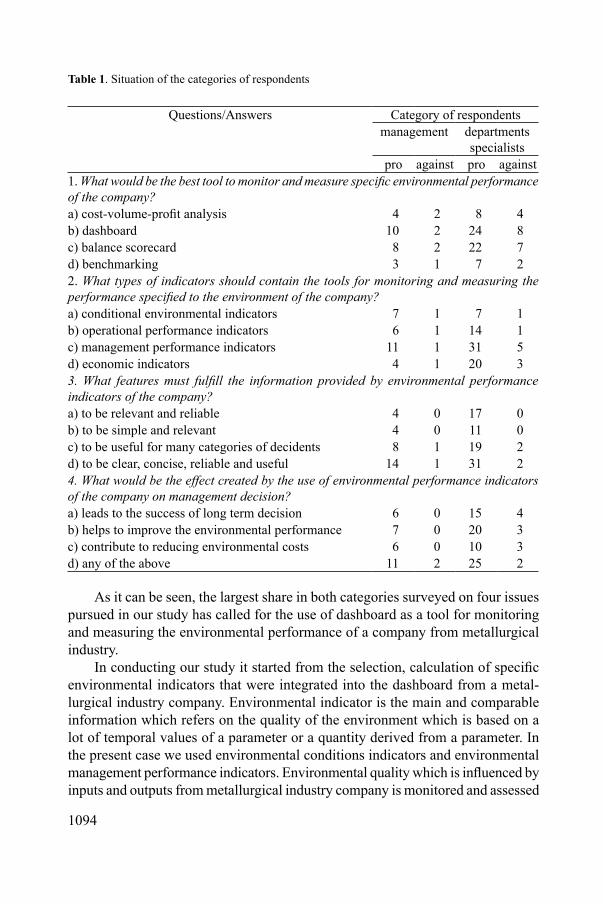
1094
Table 1. Situation of the categories of respondents
Questions/Answers Category of respondentsmanagement departments
specialistspro against pro against
1. What would be the best tool to monitor and measure specific environmental performance of the company?a) cost-volume-profit analysis 4 2 8 4b) dashboard 10 2 24 8c) balance scorecard 8 2 22 7d) benchmarking 3 1 7 22. What types of indicators should contain the tools for monitoring and measuring the performance specified to the environment of the company?a) conditional environmental indicators 7 1 7 1b) operational performance indicators 6 1 14 1c) management performance indicators 11 1 31 5d) economic indicators 4 1 20 33. What features must fulfill the information provided by environmental performance indicators of the company?a) to be relevant and reliable 4 0 17 0b) to be simple and relevant 4 0 11 0c) to be useful for many categories of decidents 8 1 19 2d) to be clear, concise, reliable and useful 14 1 31 24. What would be the effect created by the use of environmental performance indicators of the company on management decision?a) leads to the success of long term decision 6 0 15 4b) helps to improve the environmental performance 7 0 20 3c) contribute to reducing environmental costs 6 0 10 3d) any of the above 11 2 25 2
As it can be seen, the largest share in both categories surveyed on four issues pursued in our study has called for the use of dashboard as a tool for monitoring and measuring the environmental performance of a company from metallurgical industry.
In conducting our study it started from the selection, calculation of specific environmental indicators that were integrated into the dashboard from a metal-lurgical industry company. Environmental indicator is the main and comparable information which refers on the quality of the environment which is based on a lot of temporal values of a parameter or a quantity derived from a parameter. In the present case we used environmental conditions indicators and environmental management performance indicators. Environmental quality which is influenced by inputs and outputs from metallurgical industry company is monitored and assessed
1095
by governmental authorities in the case of Romania by the National Environmental Protection Agency (NEPA). These indicators of environmental conditions overlap with those of the company from metallurgical industry. In conducting our research methodology was used indicators of the environment state and environmental performance indicators, which highlights the efforts of top management to influ-ence the environmental performance of the company from metallurgical industry.
Eco-dashboard and environmental performance indicators. According to experts not only financial information is used in environmental reporting, but also non-financial information5. This aggregated information becomes environmental man-agement accounting source. This covers the identification, collection, estimation, analysis, reporting and the transfer of information about material and energy flows, environmental costs and other information quantifiable as indicators underlying the decision at the entity (organisation). Environmental management accounting inte-grates three fundamental aspects sustainable development-environment-economy encountered in the process of decision making within the company. Eco-dashboard incorporates a wide range of information necessary to support decisions related to environmental management. All this information is collected and processed by an informational system well implemented, helping to improve the area pursued by us-ers: power consumption, material consumption and prevention of global warming, even energy conservation measures. The information is obtained by determining environmental performance indicators which include data about the environment and turn them into critical information allowing the monitoring, setting targets, monitoring performance improvements, their comparative analysis and reporting to senior management, shareholders or customers.
According to ISO 14031, operational performance indicators provide infor-mation about the environmental performance of an organisation operation. They are recommended to each company and represent the basis of evaluation of the environmental aspects, in internal and external communication of data environment, in environmental statements in accordance with environmental regulations or to inform employees. In the specialised literature are used environmental pressure indicators focusing on the elements: air, water, soil. Under current legislation in Romania, operators are required to monitor the environmental impacts of prod-ucts, reporting regularly to state environmental authorities the recorded situation. Determination of emissions can be done by calculations based on standards or other national or international methodologies. Romania uses environmental impact assessment concepts and methodologies similar to those in the European Union.
Also according to ISO 14031, environmental conditional indicators provide information about the local environmental conditions, regional, national or global, directly measuring environmental quality. The information provided is very useful and refers to the changes it undergoes due to the pressure of natural phenomenon and/or anthropic activities. Correct interpretation of conditional environmental

1096
indicators requires complex analysis including a correlation with the pressure indicators related. Development and use of indicators of the environmental status is the task and responsibility of local agencies, national, regional or global, non-governmental organisations and academic and research institutions. From the two categories set for our study we used the following indicators of environmental conditions that refer to the air component in the light imissions: hydrogen fluoride (HF absolute value, expressed in mg/m³, quarterly periodicity); dioxide sulphur (SO2 absolute value, expressed in mg/m³, quarterly periodicity), particulate matter (PM10 absolute value, expressed in mg/m³, quarterly periodicity).
According to ISO14031, management performance indicators provide in-formation on management efforts to influence the environmental performance of the organisation. They measure indirect the environmental efforts taken by the company and the results obtained on the influence of its environmental aspects. They provide useful information on the internal data control quantifiable envi-ronmental management activities (Table 2). They do not provide data about: the external environmental impacts or internal issues or environmental performance.
Table 2. Types of management performance eco-indicatorsIndicator Features Method of calculation
1. Degree of the achievement of the objectives
in absolute values, percent-age, quarterly periodicity, annual
targets achieved × 100number of goals set
2. Frequency of revisions
in number of revisions per year, annual periodicity
number of revisions365 days
3. Unit cost of envi-ronmental protec-tion
in absolute values, mon-etary units, annual perio-dicity
expenses with environmental protection
total production
4. Share of environ-mental programs
in absolute values, percent-age, annual periodicity
environmental expenses to sup-port environmental programs × 100total production expenses
5. Amount of waste-water discharged
in absolute values, 10³ m³, daily periodicity, monthly
amount of wastewater discharged24 h
The values of environmental performance indicators helps to internal control and quantify specific data, but should be used along with indicators of environ-mental pressures or/and the state of the environment, to have an image as close to reality.

1097
RESULTS AND DISCUSSION
According to the calculated data, we obtained the results as demonstrated in Tables 3 and 4.
Table 3. Situation indicators on air imissions for the year 2013Indicator/period Quarter I Quarter II Quarter III Quarter IV Emission
value limitHF (μg/m³) 5.26 5.37 5.21 5.12 15SO2 (μg/m³) 11.64 11.41 11.20 11.50 350PM 10 (μg/m³) 0.01 0.01 0.01 0.01 50Note: Emission – remove pollutants into the atmosphere; imission – transfer pollutants into the atmosphere; EVL 462/1993 and STAS 12574/1987.
Table 4. The situation of indicators on management indicators in 2013Indicator/period Quarter I Quarter II Quarter III Quarter IVDegree of achievement of
objectives (%) 83.33 100.00 100.00 80.00
Revision frequency (days) 0.076 0.071 0.054 0.087Unit cost of environmental
protection (USD/tonne)115.38 118.64 145.16 119.40
Share of environmental pro-grams (%)
66.67 100.00 71.42 80.00
Amount of wastewater dis-charged (m3)
2 200 000 2 500 000 2 250 000 2 350 000
Note: Data were taken from the accounts of the company in the metallurgical industry (centralised in Table 5).
Table 5. The situation of indicators on management indicators in 2013Indicator/period Quarter I Quarter II Quarter III Quarter IVNumber of fixed targets (objec-
tives)5 7 6 4
Targets achieved 6 7 6 5Number of revisions 28 26 20 32Environmental expenses (mil-
lion USD)6 7 9 8
Total production (t primary aluminum)
52000 59000 62000 67000
Environmental expenses to support environmental pro-grams (million USD)
8 10 10 12
Total production expenses (mil-lion USD)
12 10 14 15
Wastewater discharged 1018.5 1157.4 1041.6 1087.9
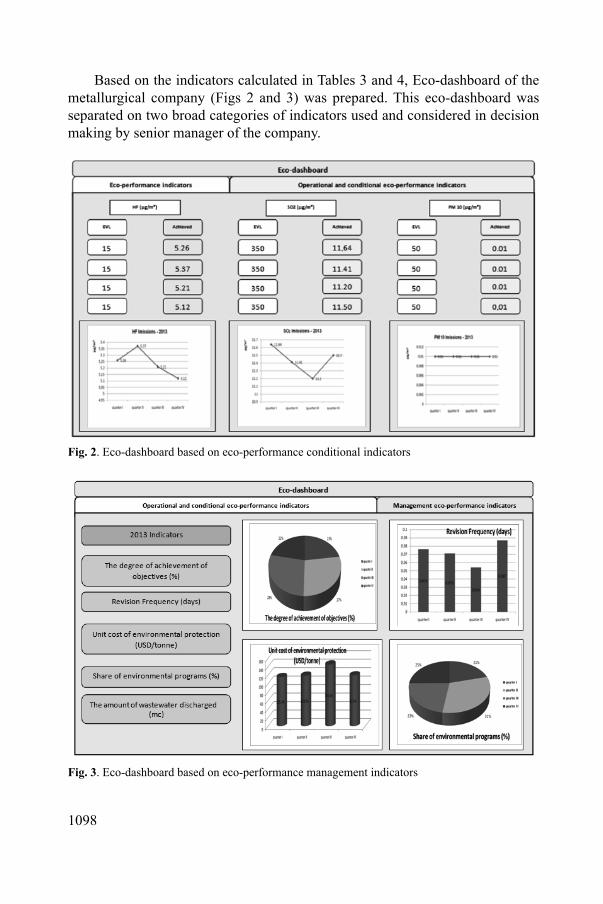
1098
Based on the indicators calculated in Tables 3 and 4, Eco-dashboard of the metallurgical company (Figs 2 and 3) was prepared. This eco-dashboard was separated on two broad categories of indicators used and considered in decision making by senior manager of the company.
Fig. 2. Eco-dashboard based on eco-performance conditional indicators
Fig. 3. Eco-dashboard based on eco-performance management indicators
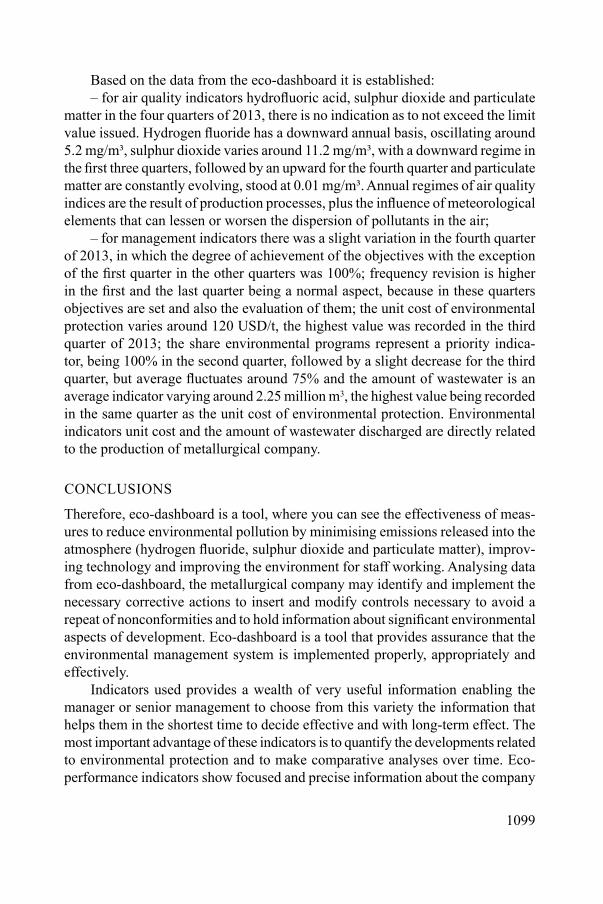
1099
Based on the data from the eco-dashboard it is established:– for air quality indicators hydrofluoric acid, sulphur dioxide and particulate
matter in the four quarters of 2013, there is no indication as to not exceed the limit value issued. Hydrogen fluoride has a downward annual basis, oscillating around 5.2 mg/m³, sulphur dioxide varies around 11.2 mg/m³, with a downward regime in the first three quarters, followed by an upward for the fourth quarter and particulate matter are constantly evolving, stood at 0.01 mg/m³. Annual regimes of air quality indices are the result of production processes, plus the influence of meteorological elements that can lessen or worsen the dispersion of pollutants in the air;
– for management indicators there was a slight variation in the fourth quarter of 2013, in which the degree of achievement of the objectives with the exception of the first quarter in the other quarters was 100%; frequency revision is higher in the first and the last quarter being a normal aspect, because in these quarters objectives are set and also the evaluation of them; the unit cost of environmental protection varies around 120 USD/t, the highest value was recorded in the third quarter of 2013; the share environmental programs represent a priority indica-tor, being 100% in the second quarter, followed by a slight decrease for the third quarter, but average fluctuates around 75% and the amount of wastewater is an average indicator varying around 2.25 million m3, the highest value being recorded in the same quarter as the unit cost of environmental protection. Environmental indicators unit cost and the amount of wastewater discharged are directly related to the production of metallurgical company.
CONCLUSIONS
Therefore, eco-dashboard is a tool, where you can see the effectiveness of meas-ures to reduce environmental pollution by minimising emissions released into the atmosphere (hydrogen fluoride, sulphur dioxide and particulate matter), improv-ing technology and improving the environment for staff working. Analysing data from eco-dashboard, the metallurgical company may identify and implement the necessary corrective actions to insert and modify controls necessary to avoid a repeat of nonconformities and to hold information about significant environmental aspects of development. Eco-dashboard is a tool that provides assurance that the environmental management system is implemented properly, appropriately and effectively.
Indicators used provides a wealth of very useful information enabling the manager or senior management to choose from this variety the information that helps them in the shortest time to decide effective and with long-term effect. The most important advantage of these indicators is to quantify the developments related to environmental protection and to make comparative analyses over time. Eco-performance indicators show focused and precise information about the company
1100
environmental activities. Environmental reporting has become an effective tool of communication to the shareholders of the organisation environmental performance. An environmental report clearly explains the attributes and environmental impacts of the organisation operations and products and demonstrates the organisation com-mitment to reduce them under public disclosure policies, targets or their long-term goals. Basically these reports provide transparency of information not only to the general public but also to the shareholders.
REFERENCES1. C. DASCALU, C. I. LUNGU, Ch. CARAIANI: Eco-cost Challenges for Environmental Protec-
tion. J Environ Prot Ecol, 9 (4), 925 (2008).2. M. HUGHES, S. EVANS, J. WELLS: Establishing Normative Profiles in Performance Analysis.
eIJPAS, 1, 4 (2001).3. M. YAMAMOTO, L. DISTADIO, R. FERNANDES: Environmental Disclosure in the Mining
Sector in Latin America and South Africa. In: Proc. of the 3rd International EA-SDI Conference, Prague, Czech Republic, 2007, 209–235, https://ea-sdi.ujep.cz.
4. C. I. LUNGU, Ch. CARAIANI, C. DASCALU: Reporting Green Information from Environmental Management Perspective. J Environ Prot Ecol, 10 (2), 524 (2009).
5. O. R. IVAN, D. I. TOPOR: Environmental Management Accounting (EMA): the Environmental Cost Inductors in the Accounting Process-Study Case Wine Production. J Environ Prot Ecol, 14 (3), 1195 (2013).
Received 9 June 2015 Revised 22 July 2015
1101
* For correspondence.
Journal of Environmental Protection and Ecology 16, No 3, 1101–1108 (2015)
Environmental education
SUSTAINABLE DEVELOPMENT THROUGH SUSTAINABLE BUSINESSES. AN EMPIRICAL RESEARCH AMONG MASTER STUDENTS
D. BADULESCU, C. BUNGAU*, A. BADULESCU
University of Oradea, 1 Universitatii Street, 410 087 Oradea, Romania E-mail: [email protected]
Abstract. Sustainable development is a key concept and also a real alternative to traditional, unfor-tunately not sustainable, development models. The effective challenge of implementing a sustainable development model is to promote as its main driver sustainability-oriented ventures, i.e. firms meeting both profitability, environmental and social requirements. Nevertheless, as the entrepreneurs of the future are today young people, and given that present entrepreneurial intentions are the best predictor of future entrepreneurial behaviour, we focus in this article on investigating students attitude towards involving in sustainability-related businesses. Therefore, we have developed a survey-based research among master students in Business Administration and Managerial Engineering from a Romanian public university as to reveal their availability for sustainability-related entrepreneurial career, their understanding on what sustainability really means and which specific actions are they expecting to undertake in this direction. Furthermore, we found out that students expect from universities (including academic curricula, specific academic programs, specific lectures, etc.) to be the most important ‘provider’ of adequate entrepreneurial, sustainability-related skills and abilities. Conse-quently, universities should seriously take into consideration adjustments in their strategic actions in the direction of a closer link with the business environment and a more effective involvement in promoting sustainable economic development.
Keywords: sustainable development, businesses, master students.
AIMS AND BACKGROUND
Sustainable development is still a subject of debate in economic, environmental, social and cultural frameworks. A pragmatic decoding of its meaning becomes increasingly important: how sustainable development addresses humanity con-cerns, how it helps to structure responses and who are responsible to promote a new model of economic development? In this respect, private business becomes (together with governmental and individual involvement) a leader in revolutionary innovation that could contribute, at the same time, to sustainable development and increasing social welfare. Therefore, higher education institutions (HEI) play a key role in empowering entrepreneurial intentions, in providing skills necessary to discover and exploit economic opportunities related to sustainable development.

1102
This paper aims at examining how graduate (master) students perceive launch-ing and running (sustainable) businesses as an effective alternative career, which are the directions of this business behaviour and on whom really belongs the main responsibilities in guiding students towards promoting sustainability.
The issue of economic development and its environmental and social implica-tions enjoys a rich and highly diverse literature. Sustainable behaviour has become a reference point and a solution to today’s environmental and societal challenges as it has been clearly stated by Brundlandt Report (WCED – World Commission on Environment and Development), which defines sustainable development as ‘the development that meets the needs of the present without compromising the ability of future generations to meet their own needs’1.
The link between economic behaviour, sustainability and opportunities is widely described2,3, but there are articles that promote the idea of a ‘triple bot-tom line’, where businesses of all sizes can meet the profitability, environmental quality and social justice4. These researches underline that private initiative and the inquisitive nature of the entrepreneur do have the potential to generate radical innovations which can simultaneously contribute to sustainable development and increase social welfare. The majority and, chronologically, the first studies on the relationship between private business and sustainable development outlined the central figure of the environmentally oriented entrepreneurs5–7, those who are using specific business tools to help preserving the environmental quality8. The second school of thinking focuses on the social aspects of sustainability9,10, concerned to find solutions as poor or marginal categories of society could access scarce re-sources, education and innovation11, but in terms of sustainable development. These include, in addition to ‘classic’ entrepreneurs, the private initiative in the social economy and the non-profit ventures12. Integrating researches, which attempted to unify those two streams of sustainability (i.e. environmental and social), have focused on the essential traits of entrepreneurship, i.e. the availability to innovate and the ability to discover opportunities13–15.
Starting from the idea that actual behaviour is best predicted by previous in-tention, a number of features of the entrepreneurial profile was identified, such as: risk taking, optimism, curiosity, interaction with others16,17 and a series of specific contextual factors that either favour or hinder entrepreneurial actions available to young students. Thus, all contextual factors perceived as barriers should be identified and diminished18. At the same time, HEI should encourage support-ing elements moving towards entrepreneurship. The symbiosis between correct understanding of entrepreneurship and inspired educators19–21 will lead to higher levels of entrepreneurial intentions among students22.
Considering the fact that the perception of specific entrepreneurial opportuni-ties depends on prior individual knowledge23, researchers have sought to identify how shaping of sound environmental values generates students involvement in vol-
1103
untary actions to protect the environment, and help the perception of entrepreneurial opportunities resulting from unsustainable economic behaviour15. In a research performed for Higher Education Academy, it was found that 65% of first-year UK students assert that universities should include and promote sustainability in their courses24. A large majority of the students (i.e. around 80% of them) consider that sustainability-related skills are required on labour market; hence, HEI have to prepare their students for the requirements of their future carrier. UNESCO Report ‘Education for Sustainable Development’25 analyses information on how learning processes are aligned with sustainable development and the key processes which enhance the education26 for sustainable development practices27, i.e. cooperation between HEI and business environment, and participatory learning.
EXPERIMENTAL
Aiming at investigating relevant issues concerning entrepreneurial attitudes and sustainability-orientation of post-graduate (master) students, we have conducted during February 2013 and February 2014 an extended survey and developed a sample-based study. In the present article we focus on emphasising students at-titudes concerning sustainability, particularly sustainable business and sustainable entrepreneurship, as to reveal their understanding and propensity to establish and run sustainable ventures. Paper and pencil questionnaires were administered to 174 master students in Business Administration and Managerial Engineering (1st and 2nd year) from a Romanian public university, namely University of Oradea.
RESULTS AND DISCUSSION
The availability of young students for a career directly related to sustainable de-velopment has been revealed by the fact that over 58% of respondents declared to be willing to start a business that takes into account the sustainability related opportunities, while the rest of them (i.e. 42%) did not consider the issues of sustainability for their future business or career plan. For this second category of respondents, the business they would develop or the desired job will not necessar-ily be opposed or insensitive to sustainability. They simply perceive their future business or job as circumstantial and adapted to realities and moment timelines, rather than strictly following ethical, environmental or social principles.
The significant percentage of masters students ‘neutral’ to sustainable develop-ment, both as a business opportunity and as general behaviour , makes us to inquire to what extent the interviewed students (as a whole group) actually understand the concept of ‘sustainable business’, and how they express sustainability in business terms. Thus, for the first part of the question we found that 65 respondents (i.e. 37%) agree they are mostly familiar with the concept of sustainable businesses, 74 respondents (i.e. 43%) ‘do have some idea’, while 35 respondents (i.e. 20%)
1104
admit they do not know what the sustainability concept actually means. Even the cumulative percentage of the first two options (‘yes’ and ‘I have some idea’) are comfortable (i.e. 80% of the responses), when looking deeper, the situation is not as optimistic. Obviously, neither the option ‘in a large extent’, and even less ‘I have some idea’ are not sufficient to indicate a significant knowledge of the principles of sustainable business. The target group consists of master students in Business Administration and Managerial Engineering, whose training curricula and individual options clearly indicate a certain orientation towards business op-portunities, and sustainable and innovative ventures.
Beyond the responses to the four above alternatives, it is very suggestive how respondents describe their understanding of sustainable business. Here are some selected answers provided by respondents on the question on ‘what do you mean by sustainability in business’: ‘Businesses supporting environmental protection, trying to maximise the operating period’ (male, 1st year master student in Busi-ness Administration); ‘Long-term business using local resources, promoting local goods’ (female, 2nd year masters student in Business Administration); ‘Businesses that promote ecological products and services’ (female, 1st year master student in Business Administration); ‘Business, different than usual ones, and based on new ideas and innovations’ (male, 1st year master student in Business Administration); ‘A long-term profitable business with low cost of resources’ (male, 1st year master student in Managerial Engineering); ‘A business of the future, that brings sufficient income for the entrepreneur but also capable to protect the environment in which it operates’ (male, 1st year master student in Managerial Engineering).
Like most studies cited in literature and reviewed in the dedicated sections of this article, much of the understanding of sustainable business is circumscribed to ecology and environmental issues. The concept of sustainable development is overlapped to the concept of environmental sustainability. The efficiency of us-ing existing resources, and the social, community or business ethics issues occur less frequently among responses. Respondents tend to consider sustainability is-sues as not related to the whole economy, but rather limited to specific business models or to certain economic sectors, e.g. sectors based on exploiting natural and cultural resources and ‘green’ products, such as tourism, personal care and services, agriculture, etc. Moreover, the opinions considering sustainability as a new business paradigm should be appreciated. For these respondents, sustainability does not mean improving ‘classic business’ through environmentalism or social voluntarism insertions, but rather addressing real challenges of the contemporary world. Consequently, the ‘unsustainable’ behaviour is both a danger and a business opportunity for the ‘entrepreneurs of sustainability’.
With regard to students’ perception on the necessity to protect the environment and the natural resources (i.e. agreement with the statement ‘it is important that my business protect the environment’), over two thirds of the respondents declare a
1105
‘strongly’ agreement; when cumulating both ‘strongly’ and ‘partial’ agreement, the percentage becomes over 93%. Furthermore, we have investigated how prospec-tive entrepreneurs do understand to implement the principles of sustainability into practical and specific forms, and to move to specific, ‘real actions’. Summing up the responses of ‘strongly agree’ and ‘partial agree’ also for the following options, we note that prospective entrepreneurs are interested to use renewable energy (i.e. 85% of them), to recycle products (i.e. 88%), to use local products (i.e. 76%) and to employ local workforce in their future businesses (i.e. 88%).
Interestingly, the agreement on the requirements of sustainability-guided busi-nesses appears to be stronger for the general principle (i.e. 92% of the respond-ents expressing strongly or partially agreement) than for specific, ‘real actions’ (such as using renewable energy, using recycle products, using local products or employing local work force). Certainly, this difference can be explained at first sight by the contrast between declarative statements and practical implementa-tion of sustainability. Furthermore, a multitude projections of future business and strategies is actually involved, very specific to the sector within the venture will effectively operate: while in certain sectors saving energy or recycling prevail, in other sectors entrepreneurs valorise the use of local products or resources. The future entrepreneurs must prepare their future businesses by integrating the theo-retical and practical aspects, when they found and exploit opportunities related to sustainable development.
Finally, when asked about the persons or entities entitled to promote and foster the implementation of sustainable businesses, the highest expectations of students on providing skills for sustainable business or to maximise chances for a successful insertion on labour market are related to universities. More specific, 81% of the respondents express their agreement (either strong or partial) that universities are expected to get them ‘endowed’ with the abilities and competen-cies necessary for a future business orientation for sustainability. Students expect that the knowledge and skills acquired during academic stages do maximise their chances for starting and running their own business, or for successful insertion into the labour market. The fact that universities and business environment are connected together and indicated as main responsible actors for students training represents a highly honourable yet challenging duty. Certainly, this responsibil-ity does not exclude any other solutions, used by HEI to meet expectations and individual needs of their students.
CONCLUSIONS
Sustainable development is a referential point, equally inspiring and controversial, of contemporary economic, social and political life. In this context, entrepreneur-

1106
ship is increasingly regarded as a solution for a sustainable transformation of products and business processes, to environmental, social or community challenges.
Studies have shown that actual behaviour is predicted by prior intentions, and perception of specific entrepreneurial opportunities depends on individual knowledge previously accumulated. Consequently, policy makers and HEI are facing a considerable challenge: what should they do to encourage both general entrepreneurial intentions and the orientation to identify and exploit economic opportunities related to sustainable development.
Our research revealed a widespread acceptance of the imperatives of sustain-able development in students future career, even the concept and practical imple-mentation of ‘sustainability’ is sometimes confused or circumscribed to activities essentially related to natural resources, environmental quality and preservation of traditional communities. The large majority of respondents anticipate that the businesses they will manage (as future managers or entrepreneurs) will be strongly concerned by saving energy, recycling, valorising local resources and workforce, and other sustainability-related practices. At the same time, respondents display modest propensity and ability to find new opportunities correcting unsustainable economic behaviour or changing the traditional business model, less environmen-tally friendly with small communities.
The paper also analysed students expectations regarding the responsibilities to prepare them for future sustainable business models. Personal responsibility plays an important part, but the main role is assigned to universities, closely followed by business environment or employers. Similar to other research results conducted in academic institutions, students expect that universities should develop tailored, adapted programs, where scientific information is combined with practical skills. Students expectations are going especially for a creative collaboration with busi-nesses in order to set up really useful graduates programs for the real world and economy.
So, the authors suggest that education for sustainable development should encourage students to put critical questions and think in a practical and innova-tive manner. The report also highlights the need to find the optimum combination between formal education (i.e. based on irrefutable scientific results), informal education and learning experiences28.
To what extent HEI and businesses are actually prepared for fast and efficient transformations may be the topic of further investigation and future research.
REFERENCES 1. World Commission on Environment and Development. Our Common Future, Oxford University
Press, 1987.2. S. SHANE, S. VENKATARAMAN: The Promise of Entrepreneurship as a Field of Research.
Acad Manage Rev, 25 (1), 217 (2000).
1107
3. G. TSEKOUROPOULOS, Z. ANDREOPOULOU, V. SAMATHRAKIS, F. GRAVA: Sustain-able Development through Agriculture Entrepreneurship Opportunities: Introducing Internet Consulting for Market Places. J En vi ron Prot Ecol, 13 (4), 2240 (2012).
4. J. ELKINGTON: Cannibals with Forks. The Triple Bottom Line of 21st Century Business. New Society Publishers, Stoney Creek CT, 1998.
5. U. STABER: An Ecological Perspective on Entrepreneurship in Industrial Districts. Entrepre-neurship and Regional Development, 24 (1), 37 (1997).
6. E. WALLEY, D. TAYLOR: Opportunists, Champions, Mavericks? A Typology of Green Entre-preneurs. Greener Management International, 38, 31 (2000).
7. M. SCHAPER: Making Ecopreneurs: Developing Sustainable Entrepreneurship. Ashgate, Aldershot, U.K., 2005.
8. T. ANDERSON, D. LEAL: Enviro-capitalists. Doing Good while Doing Well. Rowman & Lit-tlefield, Lanham MD, 1997.
9. C. PRAHALAD: The Fortune at the Bottom of the Pyramid: Eradicating Poverty through Profits, The Wharton School, Philadelphia PA, 2005.
10. J. MAIR, J. ROBINSON, K. HOCKERTS: Social Entrepreneurship. Palgrave Macmillan, New York, 2006.
11. G. DESA, S. KOTHA: Ownership Mission and Environment: an Exploratory Analysis into the Evolution of a Technology Social Venture. Social Entrepreneurship (Eds J. Mair, J. Robertson, K. Hockerts). Palgrave Macmillan, New York, 2006, 155–179.
12. S. ZAHRA, E. GEDAJLOVIC, D. NEUBAUM, J. SHULMAN: A Typology of Social Entrepre-neurs: Motives, Search Processes and Ethical Challenges. J Bus Venturing, 24 (6), 519 (2009).
13. M. BHAVE: A Process Model of Entrepreneurial Venture Creation. J Bus Venturing, 9 (3), 223 (1997).
14. B. HOPWOOD, M. MELLOR, G. O’BRIEN: Sustainable Development: Mapping Different Approaches. Sustain Dev, 13, 38 (2005).
15. T. DEAN, J. MCMULLEN: Toward a Theory of Sustainable Entrepreneurship: Reducing Environmental Degradation through Entrepreneurial Action. J Bus Venturing, 22, 50 (2007).
16. S. FRASER, F. GREENE: The Effects of Experience on Entrepreneurial Optimism and Uncer-tainty. Economica, 73, 169 (2006).
17. W. GARTNER: ‘Who is an Entrepreneur?’ Is the Wrong Question. Am J Small Bus, 12, 11 (1998).18. C. LÜTHJE, N. FRANKE: The ‘Making’ of an Entrepreneur: Testing a Model of Entrepreneurial
Intent among Engineering Students at MIT. R & D Manage, 33 (2), 135 (2003).19. S. BUNGAU, C. BUNGAU: The Influence of Specialized University Studies on Self-medication.
Revista Română de Bioetică, 13 (1), 153 (2015). 20. L. DIMEN, I. IENCIU, N. LUDUSAN, M. POPA, L. OPREA: Possibilities of Integrating Sus-
tainable Development in Higher Education Curricula. J Environ Prot Ecol, 13 (1), 368 (2012).21. F. OZTAS, H. TANRIVERDIB, H. OZTAS: School Students Dilema about Environmental Rules
and Attitudes. Do They Realy Feel Responsibility for the Environment?. J Environ Prot Ecol, 15 (3A), 1482 (2014).
22. V. SOUITARIS, S. ZERBINATI, A. AL-LAHAM: Do Entrepreneurship Programmes Raise En-trepreneurial Intention of Science and Engineering Students? The Effect of Learning, Inspiration and Resources. J Bus Venturing, 22, 566 (2007).
23. S. SHANE: Knowledge and the Discovery of Entrepreneurial Opportunities. Organ Sci, 11 (4), 448 (2000).

1108
24. E. BONE, J. AGOMBAR: First-year Attitudes towards, and Skills in Sustainable Development. The Higher Education Academy, Heslington, York, 2011.
25. UNESCO: Education for Sustainable Development: An Expert Review of Processes and Learn-ing, Division of Education for Peace and Sustainable Development, Paris, 2011.
26. M. GOLUMBEANU, S. NICOLAEV, T. ZAHARIA, F. K. VOSNIAKOS: Tool of Training as an Important Component of the Environmental Education and Public Awareness. J Environ Prot Ecol, 13 (2A), 1139 (2012).
27. A. M. MUNTEANU, T. J. EHLINGER, M. GOLUMBEANU, L TOFAN: Network Environ men tal Governance in the EU as a Framework for trans-Boundary Sturgeon protection and Cross-border Sustainable Management. J Environ Prot Ecol, 14 (2), 685 (2013).
28. C. BUNGAU, A. BADULESCU, D. BADULESCU: Assessing the Effectiveness of Mobility and Study abroad Stages during Doctoral Programs: A Case Study. In: Proc. of the 13th European Conference on Research Methodology for Business and Management Studies, London, 2014.
Received 5 June 2015 Revised 18 July 2015

1109
* For correspondence.
Journal of Environmental Protection and Ecology 16, No 3, 1109–1116 (2015)
Public health – environmental medicine
COMPARATIVE in vitro STUDY ON THE BOND STRENGTH OF TWO ORTHODONTIC ADHESIVES AFTER DENTAL BLEACHING
A. LABUNETa, C. OLTEANUb, G. NICULAc*, M. BADEAd
aDepartment of Dental Materials, School of Dentistry, Iuliu Hatieganu University of Medicine and Pharmacy, Cluj-Napoca, Romania bDepartment of Orthodontics and Dento-Facial Orthopaedics, School of Dentistry, Iuliu Hatieganu University of Medicine and Pharmacy, Cluj-Napoca, Romania cDepartment of Molecular and Cellular Biology, School of Dentistry, Iuliu Hatieganu University of Medicine and Pharmacy, Cluj-Napoca, Romania E-mail: [email protected] dDepartment of Preventive Dentistry, School of Dentistry, Iuliu Hatieganu University of Medicine and Pharmacy, Cluj-Napoca, Romania
Abstract. The aim of the paper is identifying differences in bracket bond strength between bleached and non-bleached teeth when using two different adhesives. Forty human premolars have been divided in four groups: two control groups were bonded using 2 different adhesives Transbond XT (3M) and Light Bond (Reliance Ortho) and two test groups that have been bleached with 35% hydrogen peroxide and preserved for one week prior to bonding with the two adhesives. After debonding, Shear bond strength (SBS) was calculated, Adhesive remnant index (ARI) scores were evaluated and certain surfaces were examined under Scanning electronic microscopy (SEM). SBS values obtained for the two adhesives are similar. There is no difference between SBS of unbleached and bleached teeth seven days after the procedure using 35% hydrogen peroxide. ARI scores are significantly different for bleached teeth showing lower values, meaning higher prevalence of adhesive fracture at the enamel-adhesive interface.
Keywords: bracket, adhesive, bonding, curing.
AIMS AND BACKGROUND
Esthetic aspect is growing in relevance as a factor in choosing the type of fixed appliance, especially for adult and teenage patients. Dental colour and alignment are considered important in the esthetics of smiles1. Some patients choose to have their teeth bleached before the application of the fixed appliance. This procedure may affect bracket-tooth bond strength.
Research studies have tested the hypothesis that some degree of modification in bracket-tooth adhesion occurs after dental bleaching procedures2–9. Some stud-

1110
ies2–5 found no alterations in the bond strength, while others6–9 notice a reduction in the adhesive bond strength at different time intervals after bleaching. These opposing results led to our approach of this topic.
The particularities of our study include using newly extracted human premolars that have been kept in 9% saline solution to simulate conditions as similar as pos-sible to those in the dental practice. We have also chosen to compare two adhesives that are frequently used – golden standard in bracket bonding TransBond XT (3M) and Light Bond (Reliance), both of them using an etch and rinse adhesive system that has proven to be more effective on enamel than self-etch adhesive systems10.
The hypotheses chosen for this study state that: (1) There is a significant dif-ference between the two adhesives tested, with higher values for Transbond XT; (2) There is no significant difference between shear bond strength (SBS) values for unbleached and bleached teeth seven days after the procedure with similar Adhesive remnant indices between the groups.
The present study also focuses on enamel surface after debonding via scan-ning electronic microscopy.
EXPERIMENTAL
Forty human premolars were selected similarly to the study published in 1998 by Bishara et al.9 Roth 0.022 metal brackets Ormco (Italy) with a bracket base of 9.63 mm2 were used and teeth were randomly divided into 4 groups:
Group 1 – bonding metallic brackets with Light bond (Reliance ortho). Bond-ing procedures according to producer’s indications were the following: 35% or-thophosphoric acid etching for 15 s, rinsing and drying, application of Light bond primer and 20 s light curing, application of the composite resin on the bracket base, application of the bracket on the vestibular surface and excess removal, light curing for 10 s in 4 directions.
Group 2 – bonding of metallic brackets with TransBond XT (3M), bonding procedure according to producer indication, similar to Group 1.
Group 3 – bleaching procedure using Pola Office 35% (SDI) two sessions 8 min each, followed by preservation of the teeth in a distilled water medium at 37oC for 24 h. Then, two more bleaching sessions have been applied. Teeth have been kept in the thermostat for six more days and metallic brackets have been bonded using Light bond system following the same procedure as Group 1.
Group 4 – bleaching procedure following the description for Group 3 and bonding using TransBond XT system as described for Group 2.
After bracket bonding, the teeth were mounted in acrylic resin and adhesive bond strength was tested, using an universal testing machine Instron (Instron Corp, USA) (Fig. 1).
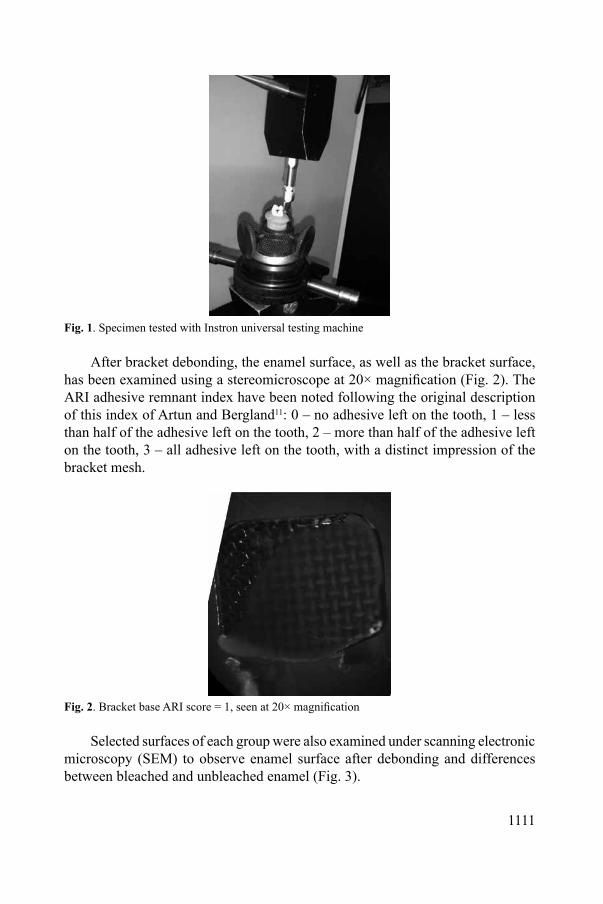
1111
Fig. 1. Specimen tested with Instron universal testing machine
After bracket debonding, the enamel surface, as well as the bracket surface, has been examined using a stereomicroscope at 20× magnification (Fig. 2). The ARI adhesive remnant index have been noted following the original description of this index of Artun and Bergland11: 0 – no adhesive left on the tooth, 1 – less than half of the adhesive left on the tooth, 2 – more than half of the adhesive left on the tooth, 3 – all adhesive left on the tooth, with a distinct impression of the bracket mesh.
Fig. 2. Bracket base ARI score = 1, seen at 20× magnification
Selected surfaces of each group were also examined under scanning electronic microscopy (SEM) to observe enamel surface after debonding and differences between bleached and unbleached enamel (Fig. 3).
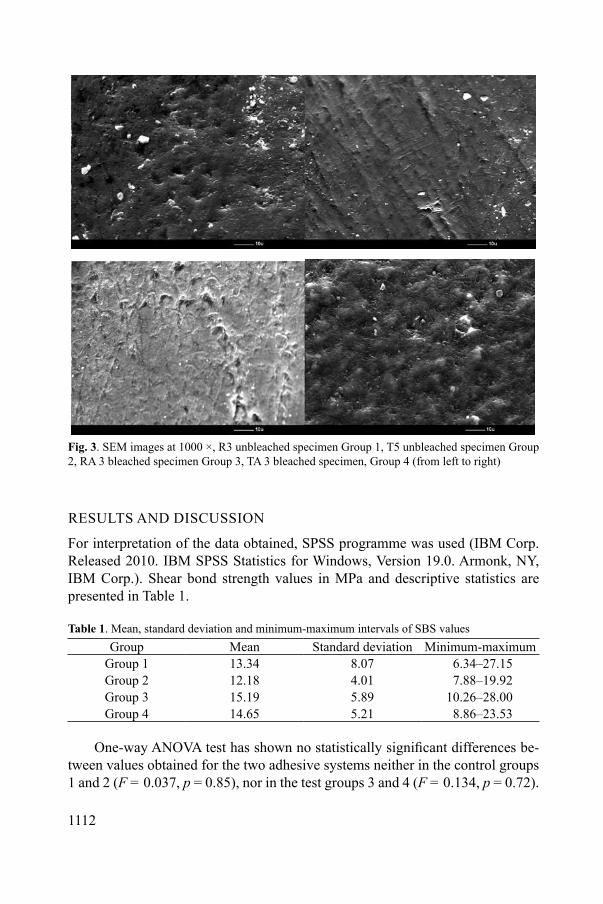
1112
Fig. 3. SEM images at 1000 ×, R3 unbleached specimen Group 1, T5 unbleached specimen Group 2, RA 3 bleached specimen Group 3, TA 3 bleached specimen, Group 4 (from left to right)
RESULTS AND DISCUSSION
For interpretation of the data obtained, SPSS programme was used (IBM Corp. Released 2010. IBM SPSS Statistics for Windows, Version 19.0. Armonk, NY, IBM Corp.). Shear bond strength values in MPa and descriptive statistics are presented in Table 1.
Table 1. Mean, standard deviation and minimum-maximum intervals of SBS valuesGroup Mean Standard deviation Minimum-maximum
Group 1 13.34 8.07 6.34–27.15Group 2 12.18 4.01 7.88–19.92Group 3 15.19 5.89 10.26–28.00Group 4 14.65 5.21 8.86–23.53
One-way ANOVA test has shown no statistically significant differences be-tween values obtained for the two adhesive systems neither in the control groups 1 and 2 (F = 0.037, p = 0.85), nor in the test groups 3 and 4 (F = 0.134, p = 0.72).

1113
No statistically significant differences have been obtained between values gathered for bleached teeth seven days after bleaching compared to teeth that have not underwent this procedure (F = 1.109, p = 0.30).
Adhesive Remnant Index (ARI) values for the four groups are summarised in Table 2.
Table 2. Adhesive remnant index values for the four groupsARI score 0 1 2 3Group 1 0 25% 50% 25%Group 2 12.5% 37.5% 50% 0Group 3 0 75% 25% 0Group 4 0 100% 0 0
By comparing ARI scores between the groups, the chi-square test has shown a statistically significant difference between the control and test groups by disregard-ing adhesive type. ARI scores have been significantly lower for bleached teeth.
The two adhesives used for comparison in our study showed similar values in bond strength, proving that Light bond (Reliance ortho) is similar in results to golden standard Transbond XT (3M), which had the highest values in many studies12–14.
Some studies have shown a significant reduction of SBS values at different time intervals following bleaching procedures6–9. This may be related to the modifica-tions occurring in enamel surface and/or composition resulting from bleaching15.
Morphologic alterations might appear as a result of the reaction between peroxide and the organic materials on the surface of enamel16. Residual oxygen from the bleaching agent might inhibit resin polymerisation17–19.
Several studies focus on time intervals between dental bleaching and bracket bonding, attempting to find the most suitable amount of time after bleaching in order to regain similar SBS values to unbleached teeth. The study published by Bishara et al.2 showed no significant differences between at home or in office bleaching agents (10% carbamide peroxide, respectively 20% hydrogen peroxide and light activation) 7 or 14 days after bleaching.
The study published by do Rego and collaborators5 shows that seven days after the bleaching procedure, shear bond strength returned to similar values to those of unbleached teeth, whereas after 24 h SBS values were significantly lower. The results are consistent with the present study.
The study published by Ozdemir et al.20 concludes that ‘in-office bleaching with 38% hydrogen peroxide resulted in dramatic reduction of shear bond strength of orthodontic attachments, with ARI scores indicating that the failure site switched from within the adhesive to the enamel-adhesive interface in the acid-etched teeth.’ However, after 3 weeks, the bond strength values were similar to those obtained for unbleached enamel surfaces20. Differences in bond strength may also appear in

1114
other tooth modifications, such as fluorosis21 or related to general state of health, that may be caused by factors such as pollution, food pathological aspects22.
Reynolds23 suggested that a minimum bond strength of 6 to 8 MPa is adequate for clinical orthodontic routine use. However, it is important that the bond strength is not too high in order not to damage enamel and not low in order to avoid frequent debonding that causes delays in treatment.
The differences between results obtained in different in studies may be caused by variations in some procedures, such as different types of teeth used bovine or human, fluoridation differences in the study design, substances used for both bleaching, etching and obtaining adhesion, treatment duration and application, the use of different light curing techniques or lamps.
Although there has been no statistically significant difference between bond strengths of bleached and unbleached enamel, ARI scores have been significantly lower for bleached teeth, as the Chi-square test illustrates. The percentage of ARI scores of 1 is 75% for Group 3 – Reliance adhesive and bleached teeth – and 100% for Group 4 – Transbond and bleached teeth, compared to 25% for Group 1 and 37.5% for Group 2 of unbleached teeth. This shows that the adhesive bond to bleached enamel is lower than the adhesive bond to unbleached enamel, mean-ing that there is a higher probability of adhesion damage at this level. This may be somewhat beneficial for enamel clean up procedures that will be shorter and faster to perform. The lower ARI score is accompanied by a higher incidence of failure at enamel–adhesive interface. The greater the probability of failure at enamel–adhesive interface, the greater are the damages on the enamel surface. Bennett et al.24 claim that bond failure in adhesive–bracket interface leads to less enamel damages.
The SEM findings, obtained with a technique similar to the article published by Nicula et al.25, that examined seventeen surfaces of the four groups and 3 control teeth, that have only been kept in saline solution, showed a slightly more porous aspect of bleached enamel upon qualitative comparison. Nevertheless, enamel quality was not highly affected, as it was also shown in the study published by D’Amario et al.26 and Rajesh et al.27
CONCLUSIONS
The hypothesis that there is a difference in SBS of the two adhesives is rejected by this study: the values obtained for Reliance light bond and Transbond XT are similar. The hypothesis that there is no difference between SBS values of un-bleached and bleached teeth seven days after the procedure using 35% hydrogen peroxide is confirmed.
ARI scores are significantly different for bleached teeth showing lower values, meaning higher prevalence of adhesive fracture at the enamel-adhesive interface.
1115
Acknowledgements. This paper was published within the frame of European Social Fund, Human Re-sources Development Operational Programme 2007–2013, project No POSDRU /159/1.5/S/138776.
REFERENCES1. D. DUDEA, J. F. LASSERRE, C. ALB, B. CULIC, I. S. POP CIUTRILA, H. COLOSI:
Patients’ Perspective on Dental Aesthetics in South-Eastern European Community. J Dent, 40 (Suppl. 1), e72 (2012).
2. S. E. BISHARA, C. OONSOMBAT, M. M. SOLIMAN, R. AJLOUNI, J. F. LAFFOON: The Effect of Tooth Bleaching on the Shear Bond Strength of Orthodontic Brackets. Am J Orthod Dentofacial Orthop, 128, 755 (2005).
3. T. UYSAL, F. A. BASCIFTCI, S. USUMEZ, Z. SARI, A. BUYUKERKMEN: Can Previously Bleached Teeth Be Bonded Safely? Am J Orthod Dentofacial Orthop, 123, 628 (2003).
4. M. M. MARTINS, M. A. de OLIVEIRA ALMEIDA, C. N. ELIAS, A. de MORAES MENDES: Bleaching Effects on Shear Bond Strengths of Orthodontic Brackets. Prog Orthod, 13 (1), 23 (2012).
5. M. V. DO REGO, R. M. DOS SANTOS, L. M. LEAL, C. G. BRAGA: Evaluation of the Influ-ence of Dental Bleaching with 35% Hydrogen Peroxide in Orthodontic Bracket Shear Bond Strength. Dental Press J Orthod, 18 (2), 95 (2013).
6. H. TURKKAHRAMAN, N. ADANIR, A. Y. GUNGOR: Bleaching and Desensitizer Application Effects on Shear Bond Strengths of Orthodontic Brackets. Angle Orthod, 77, 489 (2007).
7. T. UYSAL, A. SISMAN: Can Previously Bleached Teeth Be Bonded Safely Using Self-etching Primer Systems? Angle Orthod, 78, 711 (2008).
8. A. Y. GUNGOR, E. OZCAN, H. ALKIS, H. TURKKAHRAMAN: Effects of Different Bleaching Methods on Shear Bond Strengths of Orthodontic Brackets. Angle Orthod, 83 (4), 686 (2013).
9. S. E. BISHARA, V. V. GORDAN, L. VONWALD, M. E. OLSON: Effect of an Acidic Primer on Shear Bond Strength of Orthodontic Brackets. Am J Orthod Dentofacial Orthop, 114, 243 (1998).
10. R. L. SAKAGUCHI, J. M. POWERS: Craig’s Restorative Dental Materials. 13th ed. Elsevier, 2012.
11. J. ARTUN, S. BERGLAND: Clinical Trials with Crystal Growth Conditioning as an Alternative to Acid-etch Enamel Pretreatment. Am J Orthod, 85, 333 (1984).
12. S. SUDHIR, T. PRADEEP, N. AMIT, P. S. GYAN, S. ALKA, K. C. VINAY: A Comparison of Shear Bond Strength of Orthodontic Brackets Bonded with Four Different Orthodontic Adhesives. J Orthod Sci, 3 (2), 29 (2014).
13. L. BRAUCHLI, M. STEINECK, J. BALL: Shear Bond Strength of a Novel Silorane Adhesive to Orthodontic Brackets and Unprepared Bovine Enamel. J Adhes Dent, 15 (1), 7 (2013).
14. C. T. MACHADO, B. C. BORGES, G. J. ARAUJO, A. J. DOS SANTOS, F. R. DAMETTO, F. H. PINHEIRO: Influence of Adhesion Promoters and Curing-light Sources on the Shear Bond Strength of Orthodontic Brackets. Indian J Dent Res, 23 (6), 747 (2012).
15. K. TITLEY, C. D. TORNECK, D. SMITH: The Effect of Concentrated Hydrogen Peroxide Solutions on the Surface Morphology of Human Tooth Enamel. J Endod, 14, 69 (1988).
16. C. HEGEDUS, T. BISTEY, E. FLORA-NAGY, G. KESZTHELYI, A. JENEI: An Atomic Force Microscopy Study on the Effect of Bleaching Agents on Enamel Surface. J Dent, 27, 509 (1999).
17. P. G. MILES, J. P. PONTIER, D. BAHIRAEI, J. CLOSE: The Effect of Carbamide Peroxide Bleach on the Tensile Bond Strength of Ceramic Brackets: an in vitro Study. Am J Orthod Dentofacial Orthop, 106, 371 (1994).
18. K. C. TITLEY, C. D. TORNECK, N. D. RUSE: The Effect of Carbamide Peroxide Gel on the Shear Bond Strength of a Microfill Resin to Bovine Enamel. J Dent Res, 71, 20 (1992).

1116
19. M. TURKUN, A. D. KAYA: Effect of 10% Sodium Ascorbate on the Shear Bond Strength of Composite Resin to Bleached Bovine Enamel. J Oral Rehabil, 31, 1184 (2004).
20. F. OZDEMIR, U. CAKAN, N. GONUL, C. D. GERMEC: Orthodontic Bonding to Acid- or Laser-etched Prebleached Enamel. Korean J Orthod, 43 (3), 141 (2013).
21. A. BECHIR, R. SIRBU, E. S. BECHIR, M. PACURAR, D. L. GHERGIC, O. C. ARGHIR: Dental Fluorosis as Result of Cumulated Exposure. J Environ Prot Ecol, 13 (4), 2161 (2012).
22. L. GITIN, R. ALEXANDRU, O. BUZIA, M. DEJU: Food Pathological Aspects Concerning the Health State of the Population in Galati Area. J Environ Prot Ecol, 12 (2), 526 (2011).
23. I. R. REYNOLDS: A Review of Direct Orthodontic Bonding. Br J Orthod, 2, 171 (1975).24. C. G. BENNETT, C. SHEN, J. M. WALDRON: The Effects of Debonding on the Enamel Surface.
J Clin Orthod, 18, 330 (1984). 25. G. Z. NICULA, M. L. VICA, D. POPA, St. BALICI, H. MATEI, C. SISERMAN: Aspects of
Particulate Matter in Cigarette Smoke and Car Engines Emission Fuelled by Gasoline Observed by Scanning Electron Microscopy. J Environ Prot Ecol, 15 (1), 23 (2014).
26. M. D’AMARIO, M. D‘ATTILIO, M. BALDI, F. de ANGELIS, G. MARZO, M. VADINI, G. VARVARA, C. D‘ARCANGELO: Histomorphologic Alterations of Human Enamel after Repeated Applications of a Bleaching Agent. Int J Immunopathol Pharmacol, 25 (4), 1021 (2012).
27. A. G. RAJESH, L. M. RANGANATH, K. S. KUMAR, B. S. RAO: Surface Morphological Changes in Human Enamel Following Bleaching: An in vitro Scanning Electron Microscopic Study. J Contemp Dent Pract, 13 (3), 405 (2012).
Received 9 June 2015 Revised 9 July 2015

1117
* For correspondence.
Journal of Environmental Protection and Ecology 16, No 3, 1117–1124 (2015)
Public health – environmental medicine
PREVALENCE OF URINARY TRACT INFECTIONS IN SOME GROUP OF POPULATION IN ALBANIA, 2012–2013
A. BAKAJ (CIZMJA)a*, M. LIKA (CEKANI)b, I. MALOLLARIc
aDepartment of Biology, Faculty of Technical Sciences, ‘Ismail Qemali’ University of Vlora, 9401 Vlora, Albania E-mail: [email protected] bDepartment of Biology, Faculty of Natural of Sciences, University of Tirana, Zog I Blvd., Tirana, Albania E-mail: [email protected] cDepartment of Chemistry, University of Tirana, Faculty of Natural Sciences, Zog I Blvd., Tirana, Albania
Abstract. UTI is defined as bacteriuria along with urinary symptoms. It may involve only the lower urinary tract or may involve both the upper and lower tract. The prevalence of UTIs in the referral Public Health Directory was 38.07%. The incidence was higher in females with a prevalence rate of 54.25%, while in males the recorded value was 45.75%. Gram-negative isolates had a prevalence of 89.27%, while gram-positive isolates had 10.73%. The study was conducted in two years. As the ground for planting urine was used blood agar, endo agar, McConkey, etc. The bacteria isolated in order of ranking were E. coli (27.2%), S. saprophyticus (3.94%), P. vulgaris (2.51%), group B Streptococcus (2.39%), Klebsiella spp. (1.35%) and P. aeruginosa (0.68%). The highest proportion of isolates were E. coli (27.2%), S. saprophyticus (3.94%), P. vulgaris (2.51%), and group B Streptococ-cus (2.39%), accounting for 95.2% of the total number of isolates recovered from the urine samples. Other less-frequent isolates in aggregate caused 4.8% of infections. Women are more susceptible to urinary tract infections, especially against Escherichia coli, resulting positive in 34% of cases; while Staphylococcus saprophyticus has a female percentage of 2.5%. In this study are presented significant data showing univariante analysis that accompanying leukocyturia with Eschericia coli is significant.
Keywords: Escherichia coli, Staphylococcus saprophyticus, Proteus vulgaris, Pseudomonas aer-uginosa.
AIMS AND BACKGROUND
Urinary tract infection (UTI) refers to an inflammation of the urinary tract in re-sponse to the presence of microbial pathogens. UTI is the most common bacterial infection leading to substantial morbidity and considerable health care expenditures across all ages1.
The main parts of the urinary system are as follows: two kidneys, two ureters, a single urinary bladder and a single urethra. Our kidneys are two bean-shaped or-

1118
gans. They are located in the abdomen on either side of the spine. The kidneys filter your blood to remove excess water, salt, potassium, urea and other substances2–4. The ureters conduct urine from the kidneys to the urinary bladder. Urinary bladder receives and stores the urine brought to it by the two ureters. Urethra conducts urine from the bladder to the outside of the body for elimination3,5. The urethra in women is far shorter than it is in men. In men, it has to pass through the prostate and the penis6.
A UTI causes lower tummy (abdominal) discomfort, a burning sensation when you pee (urinate) and the need to go urgently and often. The urine may look cloudy or have blood in it. Your doctor can perform a urine test and may suggest an antibiotic medicine if needed. Some women get repeated infections after the menopause7,8.
Most UTI is caused by bacteria emanating from the gastrointestinal tract crossing the perineum and colonising the external genitalia prior to retrograde invasion of the urethra and bladder against the flow of urine9,10. Bacteria from the large intestine, such as E. coli, are in the perfect position to escape from the anus and invade the urethra11. Further ascending colonisation of the ureters and kidneys can occur but this is relatively uncommon. Development of UTI depends upon the balance between infectious agents and host resistance, and the status of host defense mechanisms appears to be important in the pathogenesis of UTI.
Infection is most commonly caused by Gram-negative aerobic bacteria12. Es-cherichia coli accounts for about 75–80% of community-acquired infections12–14 and the remainder are caused by Proteus spp. (more common in boys)13–15, Klebsiella spp., Pseudomonas spp., 15 and Gram-positive Enterococcus spp.15 Occasionally, infection may be caused by other Gram-positive bacteria including Staphylococ-cus spp.14
Uncomplicated UTI occurs in patients who have a normal, unobstructed genitourinary tract, who have no history of recent instrumentation, and whose symptoms are confined to the lower urinary tract. Uncomplicated UTIs are most common in young, sexually active women. The prevalence of UTIs among women is thought to increase even further with age, with bacteriuria occurring in 10–15% of women aged 65–70 years and 15–20% of women aged 80 years15–17.
While UTIs can affect both men and women, they are far more prevalent in females18, because the urethra is shorter in females than males and is easily more readily transversed by microorganisms. Approximately 50% of adult women report having had one or more UTIs, and some of these women will develop a history of repeated infections18,19.
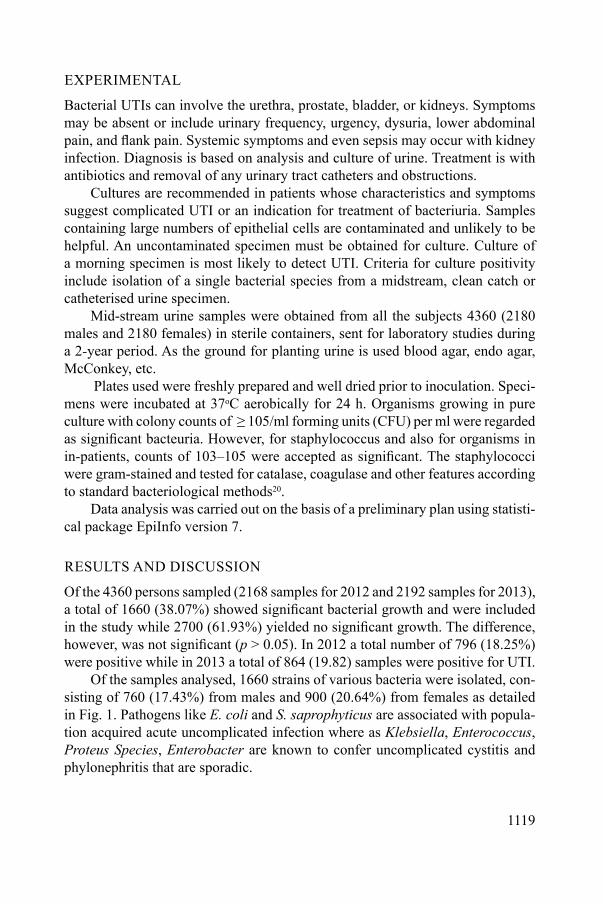
1119
EXPERIMENTAL
Bacterial UTIs can involve the urethra, prostate, bladder, or kidneys. Symptoms may be absent or include urinary frequency, urgency, dysuria, lower abdominal pain, and flank pain. Systemic symptoms and even sepsis may occur with kidney infection. Diagnosis is based on analysis and culture of urine. Treatment is with antibiotics and removal of any urinary tract catheters and obstructions.
Cultures are recommended in patients whose characteristics and symptoms suggest complicated UTI or an indication for treatment of bacteriuria. Samples containing large numbers of epithelial cells are contaminated and unlikely to be helpful. An uncontaminated specimen must be obtained for culture. Culture of a morning specimen is most likely to detect UTI. Criteria for culture positivity include isolation of a single bacterial species from a midstream, clean catch or catheterised urine specimen.
Mid-stream urine samples were obtained from all the subjects 4360 (2180 males and 2180 females) in sterile containers, sent for laboratory studies during a 2-year period. As the ground for planting urine is used blood agar, endo agar, McConkey, etc.
Plates used were freshly prepared and well dried prior to inoculation. Speci-mens were incubated at 37oC aerobically for 24 h. Organisms growing in pure culture with colony counts of ≥ 105/ml forming units (CFU) per ml were regarded as significant bacteuria. However, for staphylococcus and also for organisms in in-patients, counts of 103–105 were accepted as significant. The staphylococci were gram-stained and tested for catalase, coagulase and other features according to standard bacteriological methods20.
Data analysis was carried out on the basis of a preliminary plan using statisti-cal package EpiInfo version 7.
RESULTS AND DISCUSSION
Of the 4360 persons sampled (2168 samples for 2012 and 2192 samples for 2013), a total of 1660 (38.07%) showed significant bacterial growth and were included in the study while 2700 (61.93%) yielded no significant growth. The difference, however, was not significant (p > 0.05). In 2012 a total number of 796 (18.25%) were positive while in 2013 a total of 864 (19.82) samples were positive for UTI.
Of the samples analysed, 1660 strains of various bacteria were isolated, con-sisting of 760 (17.43%) from males and 900 (20.64%) from females as detailed in Fig. 1. Pathogens like E. coli and S. saprophyticus are associated with popula-tion acquired acute uncomplicated infection where as Klebsiella, Enterococcus, Proteus Species, Enterobacter are known to confer uncomplicated cystitis and phylonephritis that are sporadic.
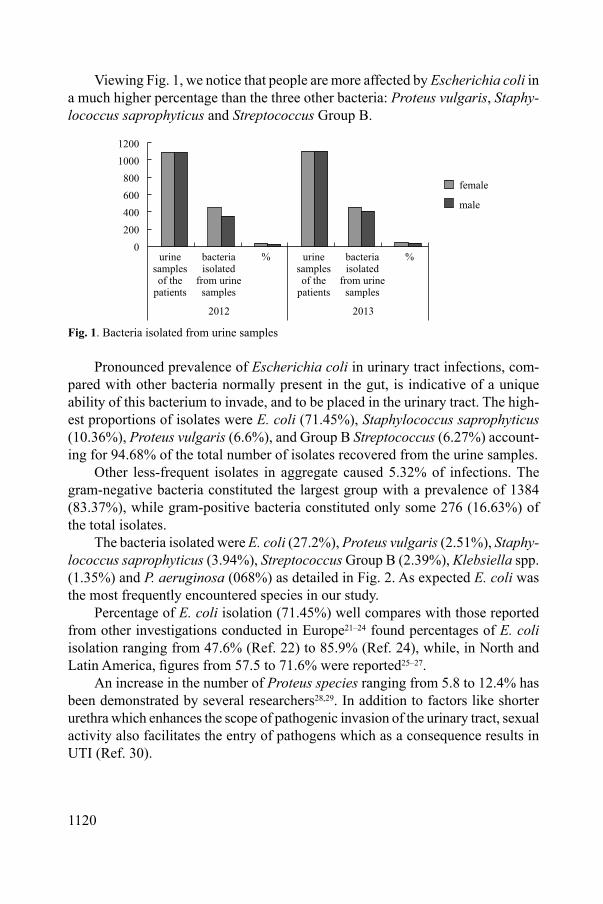
1120
Viewing Fig. 1, we notice that people are more affected by Escherichia coli in a much higher percentage than the three other bacteria: Proteus vulgaris, Staphy-lococcus saprophyticus and Streptococcus Group B.
Fig. 1. Bacteria isolated from urine samples
Pronounced prevalence of Escherichia coli in urinary tract infections, com-pared with other bacteria normally present in the gut, is indicative of a unique ability of this bacterium to invade, and to be placed in the urinary tract. The high-est proportions of isolates were E. coli (71.45%), Staphylococcus saprophyticus (10.36%), Proteus vulgaris (6.6%), and Group B Streptococcus (6.27%) account-ing for 94.68% of the total number of isolates recovered from the urine samples.
Other less-frequent isolates in aggregate caused 5.32% of infections. The gram-negative bacteria constituted the largest group with a prevalence of 1384 (83.37%), while gram-positive bacteria constituted only some 276 (16.63%) of the total isolates.
The bacteria isolated were E. coli (27.2%), Proteus vulgaris (2.51%), Staphy-lococcus saprophyticus (3.94%), Streptococcus Group B (2.39%), Klebsiella spp. (1.35%) and P. aeruginosa (068%) as detailed in Fig. 2. As expected E. coli was the most frequently encountered species in our study.
Percentage of E. coli isolation (71.45%) well compares with those reported from other investigations conducted in Europe21–24 found percentages of E. coli isolation ranging from 47.6% (Ref. 22) to 85.9% (Ref. 24), while, in North and Latin America, figures from 57.5 to 71.6% were reported25–27.
An increase in the number of Proteus species ranging from 5.8 to 12.4% has been demonstrated by several researchers28,29. In addition to factors like shorter urethra which enhances the scope of pathogenic invasion of the urinary tract, sexual activity also facilitates the entry of pathogens which as a consequence results in UTI (Ref. 30).

1121
Fig. 2. Type of infection isolated from total urine samples
The microbes responsible for causing the infection are considered to be highly consistent and involve the microbial colonisation of the perineum as a consequence of coliform bacteria which accounts to 80% of the infection where as S. sapro-phyticus constitutes to 5 to 10% followed by the other gram-negative rods which are sporadic in conferring the infection31.
Correlation analysis between gender and E. coli is done in order to understand if these parameters have a significant correlation. The Pearson correlation = 0.33; p = 0.05, shows a significant correlation between these parameters. Frequency of isolation of all six main species was found to be statistically different between females and males (Table 1) (Refs 32 and 33). On the basis of the urine samples we conclude that women support better growth of E. coli compared to the male urine samples. In our study females are affected with E. coli by 46.66% compared to men who are affected only 29.13% (Refs 32 and 33).
Table 1. Type of infection according by genderType of infection Female (%) Male (%)E. coli 28.66 25.75Group B Streptococcus 2.75 2.02Klebsiella spp. 1.47 1.24Negative 58.69 65.17Proteus vulgaris 2.71 2.29Pseudomonas aeruginosa 0.78 0.60Staphylococcus saprophyticus 4.95 2.94
These differences between the sexes have to do with the pH of the urine and its osmolarity and this reinforces the hypothesis that among other factors, urinary tract infections occur more often in women.
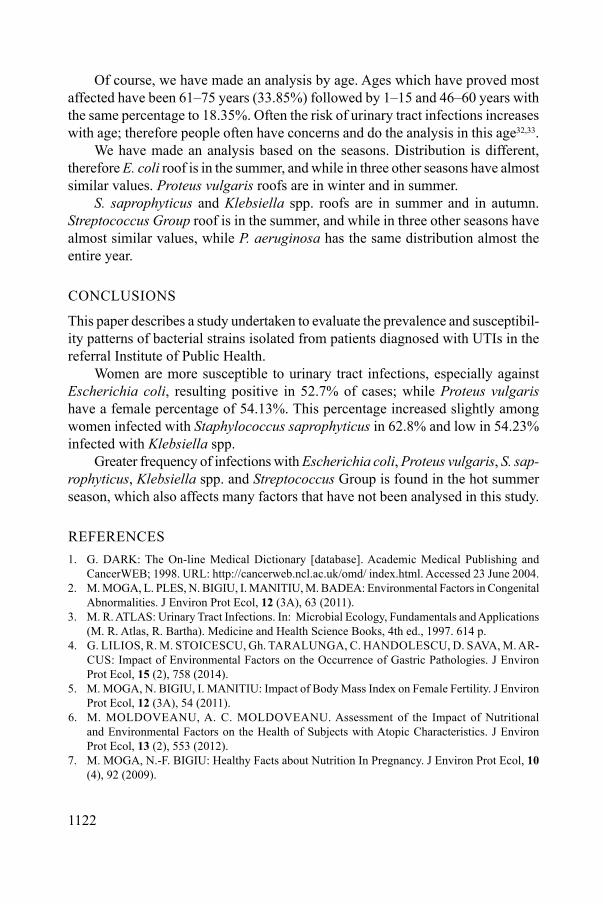
1122
Of course, we have made an analysis by age. Ages which have proved most affected have been 61–75 years (33.85%) followed by 1–15 and 46–60 years with the same percentage to 18.35%. Often the risk of urinary tract infections increases with age; therefore people often have concerns and do the analysis in this age32,33.
We have made an analysis based on the seasons. Distribution is different, therefore E. coli roof is in the summer, and while in three other seasons have almost similar values. Proteus vulgaris roofs are in winter and in summer.
S. saprophyticus and Klebsiella spp. roofs are in summer and in autumn. Streptococcus Group roof is in the summer, and while in three other seasons have almost similar values, while P. aeruginosa has the same distribution almost the entire year.
CONCLUSIONS
This paper describes a study undertaken to evaluate the prevalence and susceptibil-ity patterns of bacterial strains isolated from patients diagnosed with UTIs in the referral Institute of Public Health.
Women are more susceptible to urinary tract infections, especially against Escherichia coli, resulting positive in 52.7% of cases; while Proteus vulgaris have a female percentage of 54.13%. This percentage increased slightly among women infected with Staphylococcus saprophyticus in 62.8% and low in 54.23% infected with Klebsiella spp.
Greater frequency of infections with Escherichia coli, Proteus vulgaris, S. sap-rophyticus, Klebsiella spp. and Streptococcus Group is found in the hot summer season, which also affects many factors that have not been analysed in this study.
REFERENCES 1. G. DARK: The On-line Medical Dictionary [database]. Academic Medical Publishing and
CancerWEB; 1998. URL: http://cancerweb.ncl.ac.uk/omd/ index.html. Accessed 23 June 2004.2. M. MOGA, L. PLES, N. BIGIU, I. MANITIU, M. BADEA: Environmental Factors in Congenital
Abnormalities. J Environ Prot Ecol, 12 (3A), 63 (2011).3. M. R. ATLAS: Urinary Tract Infections. In: Microbial Ecology, Fundamentals and Applications
(M. R. Atlas, R. Bartha). Medicine and Health Science Books, 4th ed., 1997. 614 p.4. G. LILIOS, R. M. STOICESCU, Gh. TARALUNGA, C. HANDOLESCU, D. SAVA, M. AR-
CUS: Impact of Environmental Factors on the Occurrence of Gastric Pathologies. J Environ Prot Ecol, 15 (2), 758 (2014).
5. M. MOGA, N. BIGIU, I. MANITIU: Impact of Body Mass Index on Female Fertility. J Environ Prot Ecol, 12 (3A), 54 (2011).
6. M. MOLDOVEANU, A. C. MOLDOVEANU. Assessment of the Impact of Nutritional and Environmental Factors on the Health of Subjects with Atopic Characteristics. J Environ Prot Ecol, 13 (2), 553 (2012).
7. M. MOGA, N.-F. BIGIU: Healthy Facts about Nutrition In Pregnancy. J Environ Prot Ecol, 10 (4), 92 (2009).
1123
8. M. MOGA, Gh. PREDA, L. MARCEANU, R. MICLAUS, N. BAGIU. Lifestyle Factors Related to Bone Mineral Density in Postmenopausal Women. J Environ Prot Ecol, 9 (1), 92 (2008).
9. M. LIKA: Urinary System. Histology, JULVIN 2, Tirana, 274 (2007).10. M. LIKA (CEKANI), I. MALOLLARI, V. LAJQI (MAKOLLI). Microbiological Contami-
nation of Vegetable Food as Risk Factor for Human Population. J Environ Prot Ecol, 15 (2), 764 (2014).
11. R. TOMESCU, R. SARBU, G. STANCIU, C.-L. TOMESCU. Primary Outcomes of the Methotrexate Treatment according to the Initial Value of HCG Hormone in Ectopic Pregnancy. J Environ Prot Ecol, 15 (1), 303 (2014).
12. Urinary Tract Infections: Bacterial Infections. Merck, 2001. URL: http://www.merck.com/pubs/mmanual/section17/chapter227/227a.htm. Accessed 11January 2002.
13. J. LARCOMBE: Urinary Tract Infection. In: Clinical Evidence. Issue 7. BMJ Publishing, Lon-don, 2002, 377–385.
14. The Management of Urinary Tract Infection in Children. Drug Ther Bull, 5, 65 (1997). doi:10.1136/dtb.1997.35965-69 doi:10.1136/dtb.1997.35965.
15. I. E. NYGAARD, J. M. JOHNSON: Urinary Tract Infection in Elderly Women. Am Fam Physi-cian, 53, 175 (1996).
16. L. E. NICOLLE: Urinary Tract Infection in the Elderly. J Antimicrob Chemother, 33 (Suppl. A), 99 (1994).
17. J. A. BOSCIA, W. D. KOBASA, R. A. KNIGHT, E. ABRUTYN, M. E. LEVISON, D. KAYE: Epidemiology of Bacteriuria in an Elderly Ambulatory Population. Am J Med, 80, 208 (1986).
18. A. S. KOLAWALE, O. M. KOLAWALE, Y. T. KANDAKI-OLUKEMI, S. K. BABATUNDE, K. A. DUROWADE, C. F. KPLAWALE: Prevalence of Urinary Tract Infections among Patients Attending Dalhatu Araf Specialist Hospital, Lafia, Nasarawa State, Nigeria. Int J Med Med Sci, 1 (5), 163 (2009).
19. R. T. DIPIRO, G. YEE, G. MATZKE, B. WELLS, L. M. POSEY: Pharmacotherapy: A Patho-physiologic Approach. McGraw-Hill Medical, New York, 2011.
20. M. CHEESBROUGH: Microbiological Tests. In: District Laboratory Practice in Tropical Coun-tries. 3rd ed. Cambridge University Press, Great Britain, 2000, p. 266.
21. G. C. SCHITO, K. G. NABER, H. BOTTO, J. PALOU, T. MAZZEI, L. GUALCO, A. MARCHES: The ARESC Study: An International Survey on the Antimicrobial Resistance of Pathogens In-volved in Uncomplicated Urinary Tract Infections. Int J Antimicrob Agents, 34 (5), 407 (2009).
22. F. W. GOLDSTEIN: Antibiotic Susceptibility of Bacterial Strains Isolated from Patients with Community-acquired Urinary Tract Infections in France. Eur J Clin Microbiol Infectious Dis-eases, 19 (2), 112 (2000).
23. D. J. FARRELL, I. MORRISSEY, D. de RUBEIS, M. ROBBINS, D. FELMINGHAM: A UK Multicentre Study of the Antimicrobial Susceptibility of Bacterial Pathogens Causing Urinary Tract Infection. J Infection, 46 (2), 94 (2003).
24. L. S. STRATCHOUNSKI, V. V. RAFALSKI: Antimicrobial Susceptibility of Pathogens Isolated from Adult Patients with Uncomplicated Community-acquired Urinary Tract Infections in the Russian Federation: Two Multicentre Studies, UTIAP-1 and UTIAP-2. Int J Antimicrob Agents, 28 (Suppl. 1), 4 (2006).
25. G. G. ZHANEL, T. L. HISANAGA, N. M. LAING, M. R. DECORBY, K. A. NICHOL, B. WESHNOWESKI, J. JOHNSON, A. NOREDDIN, D. E. LOW, J. A. KARLOWSKY: Anti-biotic Resistance in Escherichia coli Outpatient Urinary Isolates: Final Results from the North American Urinary Tract Infection Collaborative Alliance (NAUTICA). Int J Antimicrob Agents, 27 (6), 468 (2006).
26. C. R. V. KIFFER, C. MENDES, C. P. OPLUSTIL, J. L. SAMPAIO: Antibiotic Resistance and Trend of Urinary Pathogens in General Outpatients from a Major Urban City. International Brazilian Journal of Urology, 33 (1), 42 (2007).
1124
27. T. BERGSTROM: Sex Differences in Childhood Urinary Tract Infection. Archives of Disease in Childhood, 47 (252), 227 (1972); S. MODARRES, N. N. OSKOII: Bacterial Etiologic Agents of Urinary Tract Infection in Children in the Islamic Republic of Iran. Eastern Mediterranean Health J, 3 (2), 290 (1997).
28. N. KASHEF, G. E. DJAVID, S. SHAHBAZI: Antimicrobial Susceptibility Patterns of Commu-nity-acquired Uropathogens in Tehran, Iran. J Infect Dev Ctries, 4 (4), 202 (2010).
29. R. CHAKUPURAKAL, M. AHMED, D. N. SOBITHADEVI, S. CHINNAPPAN, T. REYN-OLDS: Urinary Tract Pathogens and Resistance Pattern. J Clin Pathol, 63 (7), 652 (2010).
30. D. C. FEITOSA, M. G. DA SILVIA, C. M. de LIMA PARADA: Accuracy of Simple Urine Tests for Diagnosis of Urinary Tract Infections in Low-risk Pregnant Women. Rev Lat Am Enfermagem, 17 (4), 507 (2009).
31. A. ZALMANOVICI TRESTIOREANU, H. GREEN, M. PAUL, J. YAPHE, L. LEIBOVICI: Antimicrobial Agents for Treating Uncomplicated Urinary Tract Infection in Women. Cochrane Database Syst Rev, (10), (2010).
32. A. BAKAJ: A Prospective Study of Urinary Tract Infections in Some Group of Population in Tirana. Albania Online International Interdisciplinary Research Journal, IV (II), (2014).
33. A. BAKAJ, ENTELA RUCI (KULLA), M. LIKA (CEKANI): The Study of Infectious Agents of the Urinary Tract Infections in Durres, Albania. Albanian Journal of Agricultural Science (AJAS), 12 (3), 441 (2013).
Received 1 May 2015 Revised 22 May 2015
1125
* For correspondence.
Journal of Environmental Protection and Ecology 16, No 3, 1125–1131 (2015)
Public health – environmental medicine
SMOKING IMPACT ON ORAL CANDIDIASIS IN HIV-INFECTED PATIENTS
I. MARINCUa*, E. POPOVICIa, S. MIHAICUTAa, D. C. VLADb, R. M. STOICESCUc
aDepartment of Infectious Diseases, Epidemiology, Pneumology and Parasitology, ‘Victor Babes’ University of Medicine and Pharmacy Timisoara, 2 Eftimie Murgu Square, Timisoara, Romania E-mail: [email protected] bDepartment of Pharmacology, ‘Victor Babes’ University of Medicine and Pharmacy Timisoara, 2 Eftimie Murgu Square, Timisoara, Romania cFaculty of Pharmacy, ‘Ovidius’ University Constanta, 1 University Alley, Corp. B, Campus, Constanta, Romania
Abstract. With all benefits of highly active antiretroviral therapy (HAART) therapy in Human Im-munodeficiency Virus (HIV)-infected patients, oral candidiasis (OC) remains a significant health problem in these patients. The aim of the study was to determine the impact of smoking on oral candidiasis in HIV patients. We retrospectively analysed a group of 84 HIV-infected patients with OC, hospitalised and monitored in Clinic of Infectious Diseases Timisoara, Romania. Positive diagnosis was based on physical examination and laboratory data. Identification was performed by API Candida system, ATB Fungus 2 for antifungal susceptibility testing and direct microscopic examination of fungal species. There were registered 50 patients (59.52%) smokers, and 34 (40.47%) nonsmokers. In smoking group were recorded: 13 patients with lingual erythematous candidiasis, 14 with lingual pseudomembranous candidiasis, 6 with pharyngeal candidiasis, 12 with cheilitis and other 8 with oral hairy leukoplakia. In non smoking group there were 30 patients with erythematous candidiasis and 4 with lingual pseudomembranous candidiasis. Candida albicans was isolated in majority cases in both studied groups. Candida nonalbicans was isolated in 13 patients from smoking group, and in 4 patients from nonsmoking group. Association of smoking with increasing number of OC clini-cal forms, required implementation of antismoking counseling programs in HIV-infected patients.
Keywords: Candida albicans, Candida nonalbicans, smoking, HIV, fungal therapy.
AIMS AND BACKGROUND
Although the introduction of HAART in HIV-infected patients lead to reducing the incidence of opportunistic infections, OC remains an important health problem for these patients at high risk for fungal infections.
1126
Several multicenter trials have shown that 21% of USA adults are active smokers. In HIV-infected population groups, the reported smokers rate is 2–3 times higher (46–76%) (Refs 1–3).
Despite the use of HAART, more than 50% of HIV/AIDS patients are diag-nosed with opportunistic infections in the oral cavity4. With an incidence of 9.3 per 1000 patients, OC is the most frequent opportunistic fungal infection among HIV-infected patients. Chattopadhyay et al.5 have shown that smoking is an inde-pendent risk factor for OC in HIV-infected patients.
The results of the studies shown that the mortality and the morbidity rates among smokers with HIV infection are higher than in the general population. In addition, smoking can significantly reduce the benefits of HAART in HIV-infected patients1.
The purpose of this study was to determine the impact of smoking on oral candidiasis (OC) in a group of HIV-infected patients.
EXPERIMENTAL
The authors retrospectively analysed the data from 84 HIV-infected patients with OC, that were hospitalised and monitored clinically and therapeutically in the Clinic of Infectious Diseases from Timisoara, Romania.
The positive diagnosis was based on clinical examination (tongue whitish deposits, dysphagia, odynophagia, bitter taste, local burning sensation, pain and/or burning at the corners of the mouth, fatigue, loss of appetite, eating difficulty, weight loss, fever, headache, etc.), and laboratory data (white blood cells, eryth-rocyte sedimentation rate, fibrinogen, glycemia, cholesterol, triglycerides, elec-trophoresis, bloodcultures, throat swabs, lingual swabs and CHROME-agar or Sabouraud cultures). The identification was performed using API Candida system and ATB Fungus 2 in order to test the susceptibility to antifungal drugs and the direct microscopic examination of fungal species. The statistical data was obtained using the Epi Info program.
RESULTS AND DISCUSSION
In the studied group, 46 patients (54.76%) were male and 38 (45.23%) were female, with an average age of 32.13 years with limits between 18 and 49 years old. 50 patients (59.52%) were registered as active smokers and 34 (40.47%) non-smokers (p < 0.04). From the active smokers group, 30 patients were male and 20 were female. In the of non-smokers were registered 16 men and 18 women (Fig. 1).
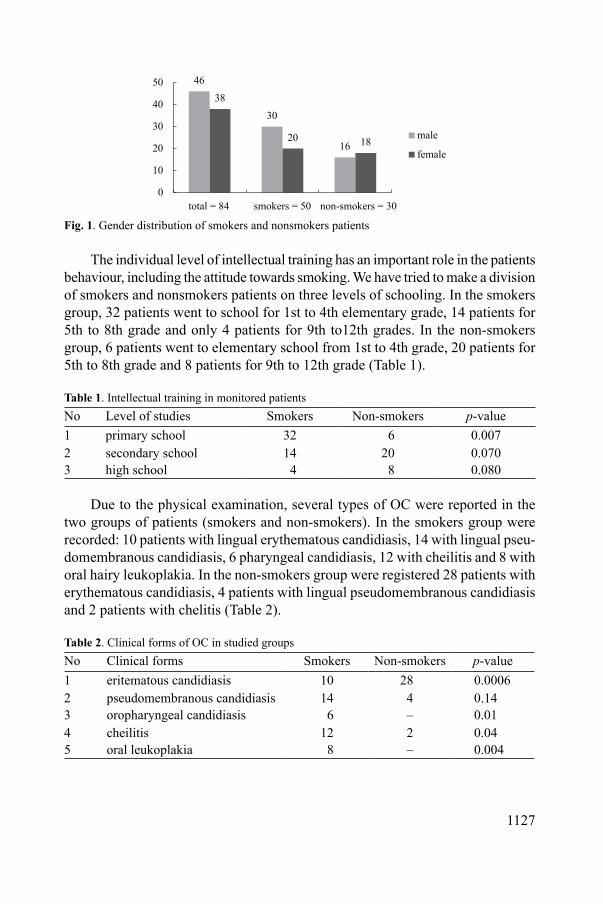
1127
46
30
16
38
20 18
0
10
20
30
40
50
total = 84 smokers = 50 non-smokers = 30
male
female
Fig. 1. Gender distribution of smokers and nonsmokers patients
The individual level of intellectual training has an important role in the patients behaviour, including the attitude towards smoking. We have tried to make a division of smokers and nonsmokers patients on three levels of schooling. In the smokers group, 32 patients went to school for 1st to 4th elementary grade, 14 patients for 5th to 8th grade and only 4 patients for 9th to12th grades. In the non-smokers group, 6 patients went to elementary school from 1st to 4th grade, 20 patients for 5th to 8th grade and 8 patients for 9th to 12th grade (Table 1).
Table 1. Intellectual training in monitored patients No Level of studies Smokers Non-smokers p-value1 primary school 32 6 0.0072 secondary school 14 20 0.0703 high school 4 8 0.080
Due to the physical examination, several types of OC were reported in the two groups of patients (smokers and non-smokers). In the smokers group were recorded: 10 patients with lingual erythematous candidiasis, 14 with lingual pseu-domembranous candidiasis, 6 pharyngeal candidiasis, 12 with cheilitis and 8 with oral hairy leukoplakia. In the non-smokers group were registered 28 patients with erythematous candidiasis, 4 patients with lingual pseudomembranous candidiasis and 2 patients with chelitis (Table 2).
Table 2. Clinical forms of OC in studied groupsNo Clinical forms Smokers Non-smokers p-value1 eritematous candidiasis 10 28 0.00062 pseudomembranous candidiasis 14 4 0.143 oropharyngeal candidiasis 6 – 0.014 cheilitis 12 2 0.045 oral leukoplakia 8 – 0.004
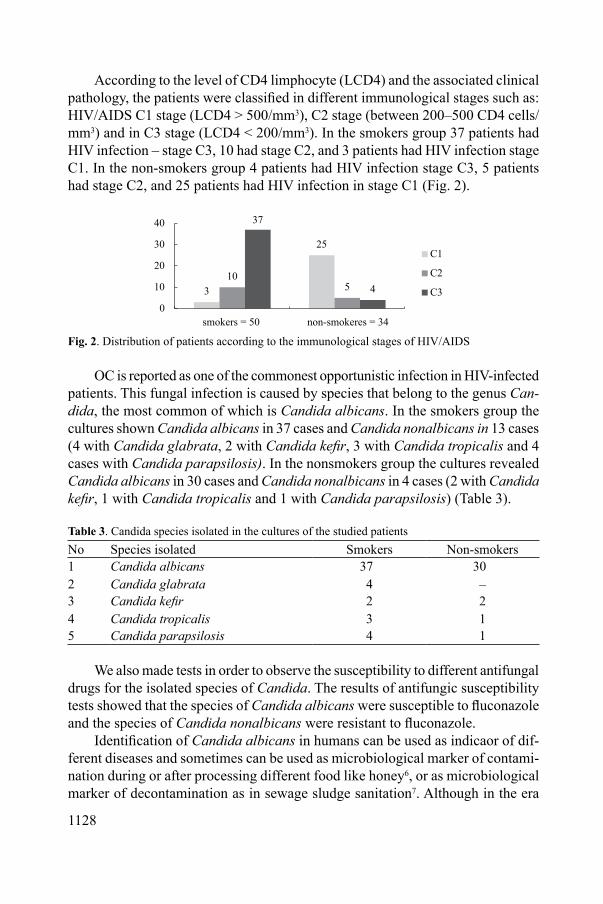
1128
According to the level of CD4 limphocyte (LCD4) and the associated clinical pathology, the patients were classified in different immunological stages such as: HIV/AIDS C1 stage (LCD4 > 500/mm3), C2 stage (between 200–500 CD4 cells/mm3) and in C3 stage (LCD4 < 200/mm3). In the smokers group 37 patients had HIV infection – stage C3, 10 had stage C2, and 3 patients had HIV infection stage C1. In the non-smokers group 4 patients had HIV infection stage C3, 5 patients had stage C2, and 25 patients had HIV infection in stage C1 (Fig. 2).
3
25
105
37
4
0
10
20
30
40
smokers = 50 non-smokeres = 34
C1
C2
C3
Fig. 2. Distribution of patients according to the immunological stages of HIV/AIDS
OC is reported as one of the commonest opportunistic infection in HIV-infected patients. This fungal infection is caused by species that belong to the genus Can-dida, the most common of which is Candida albicans. In the smokers group the cultures shown Candida albicans in 37 cases and Candida nonalbicans in 13 cases (4 with Candida glabrata, 2 with Candida kefir, 3 with Candida tropicalis and 4 cases with Candida parapsilosis). In the nonsmokers group the cultures revealed Candida albicans in 30 cases and Candida nonalbicans in 4 cases (2 with Candida kefir, 1 with Candida tropicalis and 1 with Candida parapsilosis) (Table 3).
Table 3. Candida species isolated in the cultures of the studied patientsNo Species isolated Smokers Non-smokers1 Candida albicans 37 302 Candida glabrata 4 –3 Candida kefir 2 24 Candida tropicalis 3 15 Candida parapsilosis 4 1
We also made tests in order to observe the susceptibility to different antifungal drugs for the isolated species of Candida. The results of antifungic susceptibility tests showed that the species of Candida albicans were susceptible to fluconazole and the species of Candida nonalbicans were resistant to fluconazole.
Identification of Candida albicans in humans can be used as indicaor of dif-ferent diseases and sometimes can be used as microbiological marker of contami-nation during or after processing different food like honey6, or as microbiological marker of decontamination as in sewage sludge sanitation7. Although in the era

1129
of HAART there has been a lowering incidence of OC, it still remains a common opportunistic infection in HIV-infected patients. Results from studies performed on large groups of HIV-infected patients show that smoking is an independent risk factor for OC (Ref. 5).
In HIV population like in general population8–10 smoking can favourise different respiratory disease or diseases at the level of oral mucosa. The most known and the most serious disease caused by smoking behaviour is lung cancer11. In a study performed by Mann et al. they found that smoking behaviour is formed in high school with a prevalence of 89.15%. Campaign anti smoking in high school and among students are required in order to decreased this behaviour8. Environmental tabacco smoking home exposure is significantly related to a higher prevalence of respiratory diseases among primary school children. Asthma was identified in the group pre-natal smoking mothers9. Smoking affects the inflammatory and immune responses in the oral cavity, reducing the cell-mediated and humoral immunity in the infected patients5.
Cigarette smoke suppresses the local or the systemic immunologic defenses against Candida1. This fact leads to chronic inflammation on the oral mucosae, the reduction of immunity processes against pathogens and the inhibition of the growth cells through the mechanism of apoptosis. The effects of smoking deter-mine the reduction of the salivary enzymes and the production of lymphocytes and immunoglobulins, perturbing the microflora of the oral cavity4.
The results of the studies performed on Brazilian samples showed that elevated viral load levels and low CD4+ counts in patients with low income and schooling are risk factors for OC and hairy leukoplakia4. In the studied group, the authors registered significant differences between the number of smoking and nonsmok-ing patients correlated with the level of schooling. In our study we noticed that the number of nonsmoking patients is proportional with their level of schooling.
In the smoking HIV-infected patients, the severity and chronicity of OC has been associated with low CD4 cell counts and the increasing of the virulence factors of the candida pathogen. Moreover, the risk for OC among smokers with low CD4 cell count has been four times higher than in nonsmoking patients with low CD4 cell count. These results suggest that the level of immunological status of the HIV infected patients can reduce the risk of developing different forms of OC (Ref. 5).
In the investigated patients, we noticed that smoking patients showed much more clinical forms of OC, compared to the nonsmoking ones. At the same time, the number of smoking patients with balanced immune status is significantly lower (C1 = 3 patients), compared to the number of the nonsmoking patients (C1 = 25 patients). The number of smoking patients in advanced stages of immunosup-pression is significantly higher (C3 = 37 patients), compared to the number of nonsmoking patients (C3 = 4 patients).

1130
Smoking increases the risk of bacterial or fungal infections in HIV- infected patients. Tobacco smoke alters the antibacterial function of leukocytes, including neutrophils, monocytes, T-cells, and B-cells, leading to the development of dif-ferent infections5.
Multiple studies made on groups of HIV-infected patients demonstrate that smoking is associated with increased levels of morbidity and mortality in this type of population1,3. In this way the number of life-years lost due to smoking is higher than the number of life-years lost due to HIV/AIDS infection3. In our study, in the smokers group were isolated among the species of Candida albicans, 13 other species of Candida nonalbicans. By selecting the strains that are resistant to fluconazole therapy, these species can create real difficulties in the treatment of HIV-infected smoking patients. Therefore, the development of Candida non-albicans species in smoking patients may be considered an important risk factor for the high level of morbidity and mortality.
CONCLUSIONS
Because smoking is associated with elevated rates of OC in HIV-infected patients, it is necessary to implement antismoking counseling programs in this category of patients with HIV infection.
Smoking contributes to the widening of the spectrum of comorbidities in the HIV infected patients, influencing their morbidity and mortality.
In this context, the counseling for smoking cessation and the medical edu-cation become essential components in the clinical management of HIV/AIDS infected patients.
REFERENCES 1. A. R. LIFSON, J. NEUHAUS, J. R. ARRIBAS, M. van den BERG-WOLF, A. M. LABRIOLA,
T. R. READ: Insight Smart Study Group. Smoking-related Health Risks among Persons with HIV in the Strategies for Management of Antiretroviral Therapy clinical trial. Am J Public Health, 100 (10), 1896 (2010).
2. N. PETROSILLO, S. CICALINI: Smoking and HIV: Time for a Change? BMC Med, 22 (11), 16 (2013).
3. D. K. SHIRLEY, R. J. KANER, M. J. GLESBY: Effects of Smoking on Non-AIDS-related Morbidity in HIV-infected Patients. Clin Infect Dis, 57 (2), 275 (2013).
4. M. N. PETRUZZI, K. CHERUBINI, F. G. SALUM, M. A. FIGUEIREDO: Risk Factors of HIV-related Oral Lesions in Adults. Rev Saude Publica, 47 (1), 52 (2013).
5. A. CHATTOPADHYAY, L. L. PATTON: Smoking as a Risk Factor for Oral Candidiasis in HIV-infected Adults. J Oral Pathol Med, 42 (4), 302 (2013).
6. M. POPA, M. VICA, R. AXINTE, M. GLEVITZKY, S. VARVARA: Correlations on the Mi-crobiological and Physicochemical Characteristics of Different Types of Honey. J Environ Prot Ecol, 10 (4) 1113 (2009)
7. B. NEGREANU-PIRJOL, T. NEGREANU-PIRJOL, N. BADEA, G. M. PARACHIVG, E. GORUN, R. SIRBU, A. MEGHEA: Physicochemical and Microbiological Characterisation

1131
of Municipal Sludge from Romanian Black Sea Coast Wastewater Treatment Plants. J Environ Prot Ecol, 13 (4) 2232 (2012).
8. M. A. MANN, A. BLAGA, A. TROFOR, C. CIOBOTARU, S. C. CAMBREA, S. HALICHIDIS, O. C. ARGHIR: Smoking Behaviour among Teenagers in Two North-Western Romanian Cities. Archives of the Balqan Medical Union, 49 (1), 43, (2014).
9. O. C. ARGHIR, E. DANTES, R. STOICESCU, I. BAICU, S. HALICHIDIS, C. CIOBOTARU, M. A. MANN, S. C. CAMBREA: Parenteral Environmental Tobacco Smoking and Prevalence of Respiratory Diseases in Primary School Children. Pneumologia, 62 (3), 178 (2013).
10. G. LILIOS, C. FARCAS, M. SARBU, Z. NICULESCU, V. SAPIRA, A. BECHIR: Evaluation of Antioxidant Status in Passive Smokers. J Environ Prot Ecol, 14 (1) 335 (2013).
11. O. C. ARGHIR, S. HALICHIDIS, S. C. CAMBREA, M. V. RUTA, C. CIOBOTARU, M. A. MAN: Environmental Risk Factors for Lung Cancer in Never-smokers. J Environ Prot Ecol, 15 (1) 348 (2014).
Received 1 May 2015 Revised 19 May 2015

1132
* For correspondence.
Journal of Environmental Protection and Ecology 16, No 3, 1132–1141 (2015)
Public health – environmental medicine
SICK BUILDING SYNDROME – A REALITY AND A CHALENGE FOR PHYSICIANS
A. RASCUa, L. MOISEa, E. NAGHIa, O. C. DELEANUb*, O. C. ARGHIRc
aOccupational Department of Colentina Clinical Hospital, 19–21 Stefan cel Mare Street, Bucharest, Romania b‘Marius Nasta’ Pneumology Institute, 90 Viilor Street, Bucharest, Romania E-mail: [email protected] cClinical Pneumophtisiology Hospital, 40 Sentinelei Street, 900 002 Constanta, Romania
Abstract. Sick building syndrome (SBS) is a healthy concern but a poorly understood phenomenon. Since the 1970s, researchers have tried to define what causes Sick building syndrome, but no single cause has been identified. Most experts believe that SBS consists in a mixture of different risk factors related to working stress, caused by an adverse indoor environment. Workers in the same building environment may react differently. Some may have acute different nonspecific symptoms caused by working such as headaches, dizziness, nausea, aches, pains, fatigue, poor concentration, shortness of breath or chest tightness, others may develop allergic rhinitis, skin irritation, irritation of mucous membranes. Symptoms related to the building, as a workplace, have no other identifiable cause of disease, may vary day by day and usually disappear if the working conditions are improving, or if the person leaves the building. The purpose of this case report is to present later diagnosis of SBS in a young nonsmoker male exposed to an unhealthy indoor environment. SBS is considered a real challenge for all physicians and especially for the occupational health doctors. A number of measures must be taken at workplace in order to help preventing the symptoms of this syndrome.
Keywords: sick building syndrome, workplace, indoor air pollution, diagnostic.
AIMS AND BACKGROUND
The economic growth and industrial development continuously bring problems of climate change1 as an outdoor air contamination and interfere with indoor air pollution. New domains of industrial activity have appeared and new important technological leaps have led to the developping and perfectionning of the building materials, work processes and productivity. Obviously, we have to acknowledge the fact that all these progresses may be followed by the occurence of a new type of environmental risk factors that will generate new pathologic entities.
Occupational health specialists have an important role in reducing profes-sional exposure and creating an optimum indoor environment in order to ensure a corresponding level of safety and healthcare.

1133
Sick building syndrome (SBS) is a modern occupational ill health issue as-sociated with various risk environment factors as inapropiate building materials, inadequate ventilation, second-hand smoking or air climatisation, indoor physical, chemical and biological contaminants, electromagnetic or radioactive radiation, inappropriate lighting (poor or excesive) in the absence of sunlight, bad acoustics, poor ergonomics, high or low temperature, reduced humidity, as well as psyho-logical factors2–4.
The main indicators supporting the positive diagnosis of SBS include com-plaints of a building inhabitant with reference to acute onset of illness or work discomfort with unknown cause and possible sudden remission of all accuses after exiting the building5–7. Complaints as lacrimation or eye dryness, sore throat, bron-chial irritation and asthma-like symptoms, cephaleea, dizziness, dry or itchy skin, high sensitivity to odors, weakness, tiredness, sleepiness or insomnia, and others may be associated by exposed individuals with a a particular room or work area7.
SBS had been reported since 1970s but after 1983, when WHO firstly de-fined SBS, it became a public health concern and epidemiological investigations started4–9. It consists in a complex of clustered symptoms apparently non-specific, reported by occupants of a particular building, without a specific cause of illness. These symptoms seem to be directly associated with the time spent by the occupant inside the building because they may disappear or relief after lefting the building8.
SBS represents a red flag for analysing the unhealthy environmental work conditions and diagnosing repetitive work building related injuries by environ-mental medicine. It must be promptly recognised, diagnosed and cured. Although numerous controversies exist concerning the existence of risk factors in work building environment and their impact on workers health4–7, SBS is not sufficiently known by medical community. This is the purpose of this case report to reveal. SBS is a reality and may occur soon enough after exposure and even in young and healthy indivisuals.
CASE REPORT
We are presenting the case of a young healthy male, 26-year old, graduate of Informatics Faculty of Informatics, non-smoker, occasional alcohol consumer, who was employed in February 2014 as a sound engineer of an advertising Public Relations Company from Bucharest, Romania. His previous jobs consisted in 2 years of sales representative and one year as a TV production assistant. When he started as a sound engineer employer, he was declared healthy and fit for work by medical examination.
His work activity started at 8 a.m., ended no earlier than 6 p.m. and encom-passed: (1) setting up, branching and plugging video and audio equipment (com-puters, video projectors, lights and sound mixers, sound and light amplifiers, etc.);
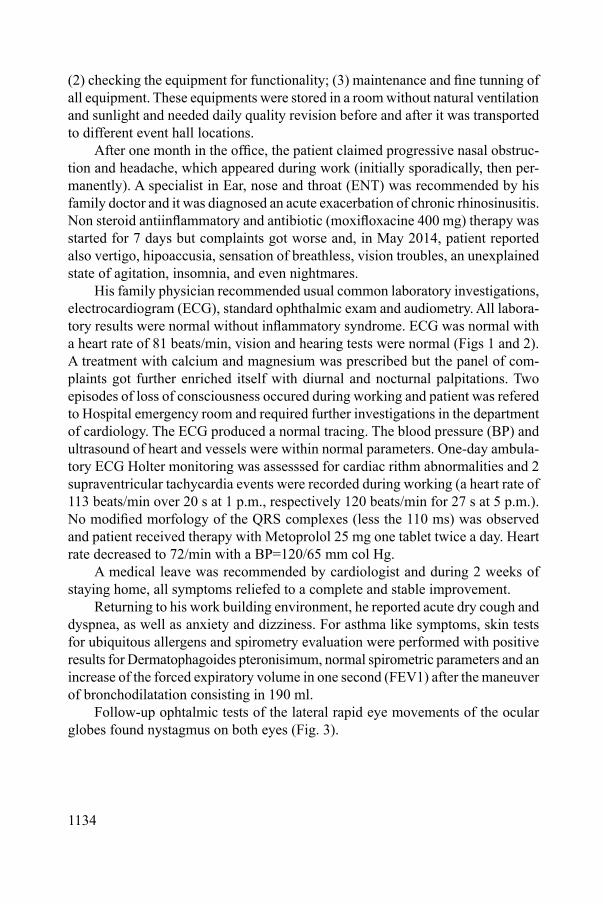
1134
(2) checking the equipment for functionality; (3) maintenance and fine tunning of all equipment. These equipments were stored in a room without natural ventilation and sunlight and needed daily quality revision before and after it was transported to different event hall locations.
After one month in the office, the patient claimed progressive nasal obstruc-tion and headache, which appeared during work (initially sporadically, then per-manently). A specialist in Ear, nose and throat (ENT) was recommended by his family doctor and it was diagnosed an acute exacerbation of chronic rhinosinusitis. Non steroid antiinflammatory and antibiotic (moxifloxacine 400 mg) therapy was started for 7 days but complaints got worse and, in May 2014, patient reported also vertigo, hipoaccusia, sensation of breathless, vision troubles, an unexplained state of agitation, insomnia, and even nightmares.
His family physician recommended usual common laboratory investigations, electrocardiogram (ECG), standard ophthalmic exam and audiometry. All labora-tory results were normal without inflammatory syndrome. ECG was normal with a heart rate of 81 beats/min, vision and hearing tests were normal (Figs 1 and 2). A treatment with calcium and magnesium was prescribed but the panel of com-plaints got further enriched itself with diurnal and nocturnal palpitations. Two episodes of loss of consciousness occured during working and patient was refered to Hospital emergency room and required further investigations in the department of cardiology. The ECG produced a normal tracing. The blood pressure (BP) and ultrasound of heart and vessels were within normal parameters. One-day ambula-tory ECG Holter monitoring was assesssed for cardiac rithm abnormalities and 2 supraventricular tachycardia events were recorded during working (a heart rate of 113 beats/min over 20 s at 1 p.m., respectively 120 beats/min for 27 s at 5 p.m.). No modified morfology of the QRS complexes (less the 110 ms) was observed and patient received therapy with Metoprolol 25 mg one tablet twice a day. Heart rate decreased to 72/min with a BP=120/65 mm col Hg.
A medical leave was recommended by cardiologist and during 2 weeks of staying home, all symptoms reliefed to a complete and stable improvement.
Returning to his work building environment, he reported acute dry cough and dyspnea, as well as anxiety and dizziness. For asthma like symptoms, skin tests for ubiquitous allergens and spirometry evaluation were performed with positive results for Dermatophagoides pteronisimum, normal spirometric parameters and an increase of the forced expiratory volume in one second (FEV1) after the maneuver of bronchodilatation consisting in 190 ml.
Follow-up ophtalmic tests of the lateral rapid eye movements of the ocular globes found nystagmus on both eyes (Fig. 3).

1135
Fig. 1. ECG tracing reveals normal sinus rhythm at 81 bpm
Fig. 2. Eye movement pattern in eye tracking test reveals a saccadic vertical eye movement as shown in the lower plot of the figure versus normal sinusoidally movements in the upper part of the figure
1136
Fig. 3. Audiometry summarises the normal results of the conventional audiometric assessment
Psychologic evaluation revealed extended monotonous work 2 or more hours linked with a job stressed of daily routine activity. In this moment, the patient was refered to an occupational health specialist, who assessed a standardized question-naire. It was applied a modified NIOSH Indoor Air quality questionnaire10 which provided answers (Table 1) highly suggestive of SBS diagnosis. The workplace related risk factors were systematically investigated after. The investigational of environmental working and building conditions revealed that electronic equip-ment was stored and daily checked in a room with increased temperature (range of values between 23 and 27oC), low humidity (22%), in the absence of natural ventilation and sunlighting. All values were out of range. So, it was diagnosed an

1137
adverse indoor environment, and the occupational health specialist indicated the change in the work place and profile of activity. The employee was transferred to the P.R. company main office, in a different building, in the IT department and one month later, he was interviewed. A signficant improvement of the health status clinical was reported with a complete remission of symptoms.
Table 1. Questionnaire: modified after NIOSH indoor air quality questionnaire indoor air quality questionnaireDepartmentx 1 Conference and event
management company
□ 2□ 3□ 4□ 5□ 6
Work conditionsYes, often
Yes, some-times
No, seldom
No, never
Do you regard your work as interesting and stimulating? □ 1 □ 2 x 3 □ 4
Do you have too much work to do? x 1 □ 2 □ 3 □ 4
Do you have any opportunity to influence your working conditions?
□ 1 □ 2 □ 3 x 4
Do your fellow workers help you with problems you may have in your work?
□ 1 x 2 □ 3 □ 4
Work environmentHave you been bothered during the last three months by any of the following factor sat your work place?
Yes, often (every week)
Yes, some-times
No, never
Draft □ 1 □ 2 x 3
Room temperature too high x 1 □ 2 □ 3
Varying room temperature □ 1 x 2 □ 3
Room temperature too low □ 1 x 2 □ 3
Stuffy ‘bad’ air x 1 □ 2 □ 3
Dry air □ 1 x 2 □ 3
Unpleasant odor x 1 □ 2 □ 3
Static electricity, often causing shocks □ 1 x 2 □ 3
Second-hand smoke □ 1 x 2 □ 3
Noise □ 1 x 2 □ 3
Light that is dim or causes glare and/or reflections □ 1 x 2 □ 3
Dust and dirt □ 1 x 2 □ 3
Background factors
Age: 26 years
Occupation: sound technician
How long have you bee nat your present place of work: 4 moths
Sex:x 1 male□ 2 female
Do you smoke?
□ 1 yesx 2 no
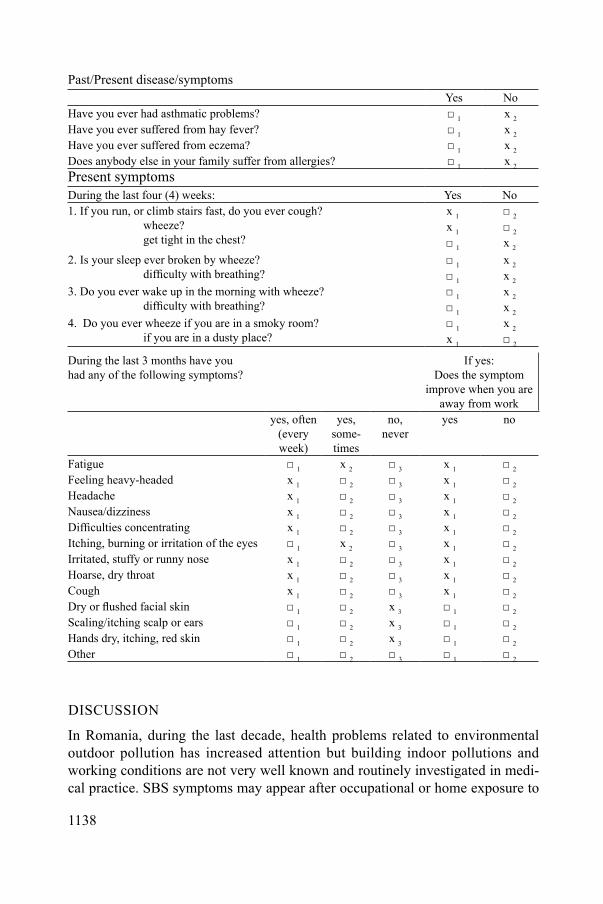
1138
Past/Present disease/symptomsYes No
Have you ever had asthmatic problems? □ 1 x 2
Have you ever suffered from hay fever? □ 1 x 2
Have you ever suffered from eczema? □ 1 x 2
Does anybody else in your family suffer from allergies? □ 1 x 2
Present symptomsDuring the last four (4) weeks: Yes No1. If you run, or climb stairs fast, do you ever cough?
wheeze?get tight in the chest?
x 1 □ 2
x 1 □ 2
□ 1 x 2
2. Is your sleep ever broken by wheeze?difficulty with breathing?
□ 1 x 2
□ 1 x 2
3. Do you ever wake up in the morning with wheeze?difficulty with breathing?
□ 1 x 2
□ 1 x 2
4. Do you ever wheeze if you are in a smoky room?if you are in a dusty place?
□ 1 x 2
x 1 □ 2
During the last 3 months have youhad any of the following symptoms?
If yes:Does the symptom
improve when you areaway from work
yes, often (every week)
yes, some-times
no, never
yes no
Fatigue □ 1 x 2 □ 3 x 1 □ 2
Feeling heavy-headed x 1 □ 2 □ 3 x 1 □ 2
Headache x 1 □ 2 □ 3 x 1 □ 2
Nausea/dizziness x 1 □ 2 □ 3 x 1 □ 2
Difficulties concentrating x 1 □ 2 □ 3 x 1 □ 2
Itching, burning or irritation of the eyes □ 1 x 2 □ 3 x 1 □ 2
Irritated, stuffy or runny nose x 1 □ 2 □ 3 x 1 □ 2
Hoarse, dry throat x 1 □ 2 □ 3 x 1 □ 2
Cough x 1 □ 2 □ 3 x 1 □ 2
Dry or flushed facial skin □ 1 □ 2 x 3 □ 1 □ 2
Scaling/itching scalp or ears □ 1 □ 2 x 3 □ 1 □ 2
Hands dry, itching, red skin □ 1 □ 2 x 3 □ 1 □ 2
Other □ 1 □ 2 □ 3 □ 1 □ 2
DISCUSSION
In Romania, during the last decade, health problems related to environmental outdoor pollution has increased attention but building indoor pollutions and working conditions are not very well known and routinely investigated in medi-cal practice. SBS symptoms may appear after occupational or home exposure to
1139
physical, chemical, biologic factors present in an unhealthy environment, known as indoor air pollutants (IAP). Suggestive for SBS diagnosis is the work-related symptomatology with no other identifiable cause of disease or disorder. In this case report, symptoms were aggravated from a month to another and disappeared during 2 weeks of medical leave.
As a peculiar characteristic of case reported was the presence of nystagmus. Based on existing literature, nystagmus is considered a clue for vestibulary ataxia diagnosis which may appear in conditions of exposure to chemical pollutants, most cited being the volatile organic compounds7.
The applied modified NIOSH Indoor Air quality questionnaire10 could be very usefull for positive diagnosis of SBS. It was used a questionnaire structured in four parts regarding personal info, general info regarding the work place and condi-tions, data regarding any previous personal medical history (before employment).
Most experts consider SBS a result of different environmental and personal risk factors action related to the exposure to certain types of ‘unhealthy’ buildings: (1) mechanical ventilation, (particularly air conditioning) and illumination, indoor temperature and humidity, volatile organic compounds, other chemical compounds, noise; (2) subordinate position in the work hierarchy; (3) female gender; (4) tobacco smoking; (5) atopic disease history, and (6) psychosocial discomfort11. Others considere if more than 20% of workers in a building have suggestive symptoms which disappear or decrease suddenly after leaving the building, than SBS could be suspected12. Sometimes, work building investigational findings are not conclusive, even contradictory, so diagnosis and corrective measures are difficult to establish.
In the presented case report, the investigational work building conditions performed by occupational medicine physician was relevant for multiple risk factors of SBS:
(1) Physical indoor pollutants identified consisted in: – no natural sunlight and ventilation which were not compensated by the air
conditionning (A/C) ventilation and electric lighting;– a reduced quantity of fresh air (below recommended 20 m3/worker);– inadequate heating by HVAC (heating, ventilating and air conditioning)
systems without an efficient and uniforme distribution of air for all the occupants of the building working area;
– inadequate continuous electric lightning in the absence of natural light.(2) Chemical indoor pollutants consisted in the presence of volatile organic
compounds (VOC), mostly as ingredients in adhesifs, cleansing products, dyes from the wall paint, rugs and carpets, substances used for equipment maintenance, furniture lacques and dyes.
(3) Presence of airborne microorganisms as possible biologic contaminants (viruses, bacterias, mold) were disscused because the A/C filters were not cleaned
1140
with lots of dust which could be responsible for the series of respiratory and ocular symptoms.
(4) Psyhosocial component induced by the stress of an increased work load with extended work routine shifts, the absence of daily work satisfaction because of monotonous activities in the case of Informatics Faculty graduate young man could be also involved.
All presented physical, chemical and biological factors are implied in trigger-ing the SBS and are frequently cited in literature8,11. There are authors that have identified the work related stress as the main contributing factor in the developpe-ment of SBS (Refs 13 and 14). This syndrome could be an unknown cause drop in work productivity and lost work hours. In our case report, complaints in excess with a progressive deterioration of health did not correlated with an increase of sickness absence.
The practical solutions for personal safety of the work environment, and SBS prevention represent quite an incomplete chapter and requires further studies. It is important to inform all building occupants about the risks of indoor pollutants, and to promote the reduction of all possibler polluting sources through an adequate maintenance. For instance, the evaluation of ventilation tubes, the replacement of the HVAC systems could be done by an adequate natural ventilation in rooms containg air polluting sources or by an increased ventilation rate via A/C for a better distribution of the air; and better devices for filtering and level control of air particles and germs5,6,8,15. The list of prevention measures for SBS remains open and is imperiously necesary to keeping forward improving it. So, even eecological analysis of building elements could be an useful preventive measure16. A multi-disciplinary technical team, very well trained and informed, actively involved, planning correctly and coherently its actions could represent the best prevention solution to resolve problems. The first step is the awareness of SBS, then systematic analysis of all work related risk factors, the assesment of building materials and design configurations, as well as habitat conditions for occupants, work comfort and productivity in indoor environment must be investigated17.
The suspicion of SBS is raised ussually based on the correlation of existing data: polymorphic clinical symptomatology that is related with work exposure to an unhealthy building environment and no specific for other disease12. So, the positive diagnosis is usually a diagnosis of exclusion.
CONCLUSIONS
The delayed diagnosis of ‘sick building syndrome’ was generated by the nonspecific symptoms reported by a young healthy male worker, the lack of knowledges at different medical levels, and difficulty of establishing the diagnosis. Specific tools of occupational health medicine consisting in investigational analysis of building
1141
work conditions and the applied modified NIOSH Indoor air quality questionnaire are very usefull for positive diagnosis of SBS.
REFERENCES1. S. APAKA, A. KASMAN, P. BAL, E. TORUN: Estimating Time-varying Conditional Correla-
tions between Economic Growth and Carbon Dioxide Emissions Volume. J Environ Prot Ecol, 12 (4), 1601 (2011).
2. P. TEARLE: The Sick Building Syndrome. Commun Dis Public Health, 2 (4), 303 (1999).3. P. SARAFIS, K. SOTIRIADOU, D. DALLAS, P. STAVRAKAKIS, M. CHALARIS: Sick-
Building Syndrome. J Environ Prot Ecol, 11 (2), 515 (2010).4. World Health Organization (WHO): Indoor Air Pollutants: Exposure and Health Effects. Report
on a WHO Meeting. WHO Regional Office for Europe Copenhagen. EURO Reports and Studies No 78, Denmark, 1983.
5. N. A. NELSON, J. D. KAUFMAN, J. BURT, C. KARR: Health Symptoms and the Work En-vironment in Four Nonproblem United States Office Buildings. Scand J Work Environ Health February, 21 (1), 51 (1995).
6. R. NUR FADILAH, J. JALALUDIN: Indoor Air Quality (IAQ) and Sick Buildings Syndrome (SBS) among Office Workers in New and Old Building in Universiti Putra Malaysia, Serdang. Health Environ J, 2 (3), 98 (2012).
7. S. ISHIKAWA, M. MYIATA: Chemical Sensitivity: Diagnosis and the Clinical Test. Allergy Immunol, 6, 990 (1999).
8. A. APTER, A. BRACKER, M. HODGSON, J. SIDMAN, L. WING-YAN: Epidemiology of the Sick Building Syndrome. J Allergy Clin Immunol, 94, 277 (1994).
9. World Health Organization (WHO): International Programme on Chemical Safety; Environmental Health Criteria 27 Guidelines on Studies in Environmental Epidemiology. Published under the Joint Sponsorship of the United Nations Environment Programme, the International Labour Organization, and the World Health Organization. WHO, Geneva, 1983.
10. K. ANDERSSON, G. STRIDH, I. FAGERLUND, B. LARSSON: The MM-questionnaires. A Tool When Solving Indoor Climate Problems. Department of Occupational and Environmental Medicine, Örebro University Hospital, Örebro, Sweden, 1993.
11. A. THORN: Case Report on a Sick Building: Analysis and Interpretation in the Context of Its Disease History. Scand J Soc Med, 22, 228 (1994).
12. D. ROSNER: Sick Building Syndrome and the Problem of Uncertainty. J Hist Med All Sci, 62 (3), 376 (2007).
13. G. KINMAN, M. GRIFFIN: Psychosocial Factors and Gender as Predictors of Symptoms As-sociated with Sick Building Syndrome. Stress Health, 11 (24), 165 (2008).
14. J. A. STOLWIJK: Commentary: Sick-Building Syndrome. Environ Health Persp, 95, 99 (1991).15. R. MENZIES, R. TAMBLYN, J. P. FARANT: The Effect of Varying Levels of Outdoor-Air
Supply on the Symptoms of the Sick Building Syndrome. N Engl J Med, 328, 821 (1993).16. T. ESIN, I. YUKSEK: Ecological Analysis of Building Elements of Traditional Buildings in the
Rural Area of Thrace Region (Turkey). J Environ Prot Ecol, 11 (2), 471 (2010).17. J. SINGH: Health, Comfort and Productivity in the Indoor Environment. In: Indoor and Built
Environment. Karger Publications, 1996, 22–34.
Received 28 July 2015 Revised 15 August 2015

1142
* For correspondence.
Journal of Environmental Protection and Ecology 16, No 3, 1142–1148 (2015)
Public health – environmental medicine
CONSUMER PREFERENCES FOR ORGANIC FOOD. A CASE STUDY OF NEUROMARKETING METHODS AND TOOLS
I. STOICAa*, M. POPESCUa, M. ORZANb
a‘Dimitrie Cantemir’ Christian University, 176 Splaiul Unirii Street, District 4, Bucharest, Romania bFaculty of Marketing, Bucharest University of Economic Studies, 13–15 Mihai Eminescu Street, District 1, Bucharest, Romania E-mail: [email protected]; [email protected]; [email protected]
Abstract. The world we are living is dominated by advanced technology in Information Technol-ogy and Communication (IT & C) that brings new benefits to simplify the various actions that for individuals could mean waste of time. Time is a precious resource and consumers needs must be satisfied in high conditions. How can we find out what lies in the consumer ‘black box’? In our century, organisations can appeal to modern tools and methods to investigate factors which influence consumer buying decisions. Very important is the correlation of the results obtained after applying neuromarketing methods and tools with demographic information of individuals. The brain is an amazing organ with great complexity, which can by receive and/or transmit signals and influence the buying behaviour process. Companies should exploit this ‘fertile ground’ that provides incred-ible opportunities and could influence the profit obtained by offering products intentionally created on consumers desires and needs. This paper is a presentation of most modern methods and tools for investigating consumer behaviour using neuromarketing field. Also, the paper presents a quantitative study on consumer preferences for organic products. In the conducted survey, were performed both univariate and bivariate analysis and the hypothesis were tested using Chi-square. Data collected were interpreted using SPSS.
Keywords: consumer behaviour, organic food, neuromarketing, marketing research.
AIMS AND BACKGROUND
Worldwide interest in the cognitive-behavioural sciences (the study and integration of neuroscience, psychology, and sociology) is increasing as new technologies emerge. Some of the most exciting of these technologies access the brain using noncontact, noninvasive breakthroughs at the nexus of physics, imaging process-ing, and neurophysiology1.
Human cognition, like all organismal traits, must be accounted for by some combination of ancestral and derived brain processes, attempts to decompose human mental processes into functional components whose features have been shaped by the process of natural selection – that is, adaptations – have been highly contested and controversial2.
1143
Studies with functional MRI and single-unit recording have shown that hu-mans and other primates possess brain regions that are differentially sensitive to faces, particularly the so-called facial fusiform area (FFA) in the fusiform gyrus3.
NEUROMARKETING RESEARCH – METHODS AND TOOLS
The human brain reacts to stimuli coming from the information received by the five senses – visual, auditory, olfactory, taste and touch, which influences the emo-tional side of the individual, that being in the position of the consumer is forced to make a decision. The fundamentals underlying the decision to purchase are more emotional than rational and it has been demonstrated over time by various studies. Over time, researchers have sought information about the human brain and the mechanisms of activation of neural networks.
By understanding the neural activity to certain stimuli marketers can under-stand the origin of our mental abilities4. Through traditional marketing research, specialists have asked individuals about influence factors and motivations in terms of purchasing decisions, stimuli were analysed only through the answers given by them. But doing quantitative research using surveys, represent only the declared consumer behaviour and the interest must be represented by the emotional be-haviour, those gestures or emotions who betrays the consumer unconscious when choosing to buy or not to buy a product.
We can say that in terms of consumer purchasing decisions are not as they appear at first glance, conscious, rational but, are emotionally based in the highest proportion5.
Subliminal aspects of everything that happens to us apparently plays an in-significant role in our daily lives. But, they are rooted, almost invisible, conscious of our thoughts6.
Understanding consumer behaviour is a current issue and it is important to analyse the behaviour of organic food consumers. Price greatly influence the buying decision of organic food, but the individual will take into account other aspects such as: taste, the term of validity, accessibility to the product itself, how it can be cooked or how much time does it takes to prepare it, if it is coming from genetically unmodified cultures, etc. Very few consumers are educated within the meaning of the label or maybe just to read a little bit the characteristics and ingredients of products, the repercussions of that product consumption, most of them unconsciously choosing emotionally the food products. But, for this, the only responsible is the brain, which is the most complex organ structure, composition and operation mechanism.
The human brain is composed of three parts:● The neocortex is positioned on the outside of the brain, the brain known as
rational; it covers the largest part of the brain is made up of six hundred thinner, five of which contain nerve cells and neural projections linking the inner layers7.
1144
● The limbic is found in the middle and is responsible for the emotional, known as emotional brain.
● The reptilian brain is the most primitive part of the brain that plays a role in making decisions but helps us survive.
The main part of the human brain is divided into two cerebral hemispheres, each hemisphere is divided into four lobes, the splitting being made of skull bones and lobes in turn are covered with an outer layer of convolutions round about the thickness of a table napkin8.
NEUROMARKETING METHODS AND TOOLS
Neuromarketing uses various technologies in the medical field but also modern de-vices investigation. Some methods are used fMRI (functional Magnetic Resonance Imaging), EEG (Electroencephalograma), MEG (Magnetoencephalograma), ERP (Event-related Potentials the recording), study lesions, PET (Positron Emission Tomography), SST (Steady State Topography), Single Cell Recording.
Also, we can talk about non-neurological investigation techniques which are also called biometric and among the most important are: galvanic skin level that is used in measuring electrical change properties of the skin by sweating, heart rhythm, breathing rhythm, these two being analyzed per minute, voice analyzer when the subject is exposed to stimuli.
Neuromarketing is an extremely wide field, the fact is that no matter how many methods of investigation we use, the result is always the same: the brain is making the decision to purchase. Lately, increasingly more companies are using neuromarketing techniques to influence sales, but without taking into account that the products affects the consumer bodies, they lead to obesity and other such negative effects. It is important to use these methods and modern tools of inves-tigation with morality, responsibility and respect for the consumer, because the person will become addicted to these products, but other consumers will see the effects, and there is possible that the brain of others decide with determination not to consume that negative product. The more the consumer will receive the goods or services in the manner in which he wants, without adverse effects, the more it will be satisfied and will recommend it to others. Neuromarketing can be used for the benefit of consumers and they can be educated in the direction of consumption of healthy foods and products that make them feel good about themselves and be happy with themselves.

1145
QUANTITATIVE RESEARCH REGARDING CONSUMER PREFERENCES FOR ORGANIC FOOD
In Bucharest was conducted a survey regarding the attitudes and perceptions of consumers regarding organic food. The research was developed in three months, between 6 October and 20 December 2014.
The quantitative research was conducted on a sample of 305 respondents and although the sample is not representative, following the analysis and interpreta-tion of information collected from respondents, the results are valuable if they are corroborated by other studies previously conducted market.
The study was conducted through face to face survey method as a tool based on a questionnaire consisting of 20 questions. Information collected from respondents were entered into SPSS 20.0 using descriptive statistics and interpreted offered by the software.
Table 1. Are you interested in organic food?Respondents interested for organic food
Frequency Percent Valid percent Cumulative percent
Valid yes 305 100.0 100.0 100.0
As we can see, in Table 1, all the respondents declared their interest regarding the organic food.
In this study, most of respondents were female – 64% and male 36% (Fig. 1).
Fig. 1. Gender of respondents
In Fig. 2 we can observe that most of respondents are aged between 18 and 22 years (47%), 29% of respondents were aged between 23–25 years, 10% of re-spondents were aged between 26–30 years, 9% of respondents were aged between 31–40 years, 4% were aged between 41–50 years and just 1% of respondents were aged between 41–50 years.
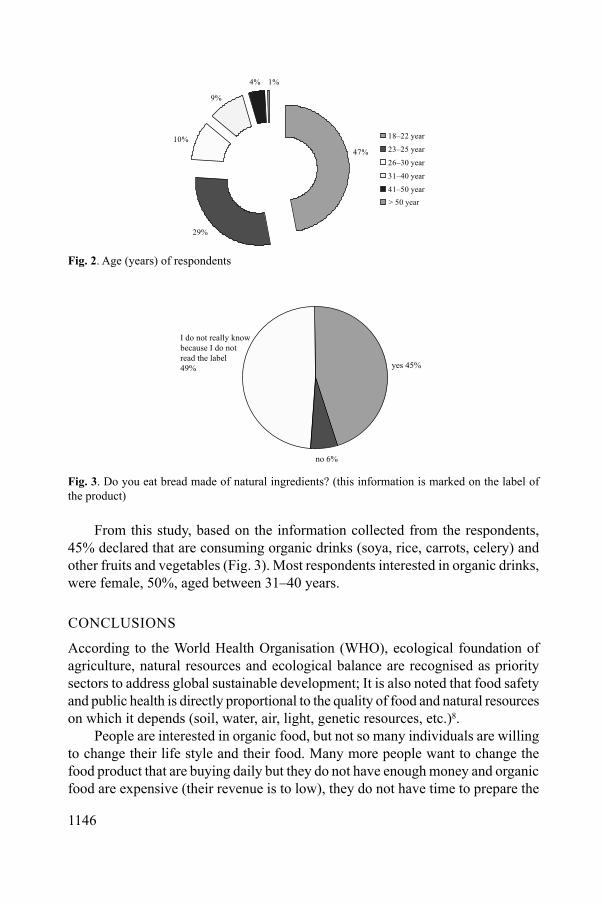
1146
9%
10%
29%
47%
1%4%
18–22 year
23–25 year
26–30 year
31–40 year
41–50 year> 50 year
Fig. 2. Age (years) of respondents
yes 45%
no 6%
I do not really knowbecause I do notread the label49%
Fig. 3. Do you eat bread made of natural ingredients? (this information is marked on the label of the product)
From this study, based on the information collected from the respondents, 45% declared that are consuming organic drinks (soya, rice, carrots, celery) and other fruits and vegetables (Fig. 3). Most respondents interested in organic drinks, were female, 50%, aged between 31–40 years.
CONCLUSIONS
According to the World Health Organisation (WHO), ecological foundation of agriculture, natural resources and ecological balance are recognised as priority sectors to address global sustainable development; It is also noted that food safety and public health is directly proportional to the quality of food and natural resources on which it depends (soil, water, air, light, genetic resources, etc.)8.
People are interested in organic food, but not so many individuals are willing to change their life style and their food. Many more people want to change the food product that are buying daily but they do not have enough money and organic food are expensive (their revenue is to low), they do not have time to prepare the
1147
food (drinks, vegetables, fruits) and they are very comfortable in buying the food/drink already done or they are not well informed and they eat because the taste is stronger than the motivation of being health.
The promotion of environmental protection action has become the international mainstream issue in the new century9. Although boron toxicity alters a number of physiological processes, its mechanism of action is still not clear and remains an open question10. If enterprises want to survive, they need to take customers value into account11.
In fact, the neuromarketing techniques, methods and tools are more efficient in promoting organic food and the reason is that is in the benefit of both sides, because it is a win-win situation. Consumers life will be improved and happy consumers bring higher profit to the business and also for the environment, but the Romanian lows and the bureaucracy are getting in the way of farmers and small business, in our country being sustained the imports. Neuromarketing techniques bring more efficacy to the business environment, because of the information collected right form the consumer brain which quantitative marketing research does not. We must sustain the subliminal to make people happy and to help business environment to grow, instead of creating junk food in beautiful packaging, because we must think, in the first place to the consumer, as Kotler said.
Acknowledgements. This work was co-financed from the European Social Fund through Sec-toral Operational Programme Human Resources Development 2007–2013, project number POSDRU/159/1.5/S/137926 ‘Routes of Academic Excellence in Doctoral and Postdoctoral research’ – READ – for postdoctoral studies.
REFERENCES1. Emerging Cognitive Neuroscience and Related Technologies, Committee on Military and Intel-
ligence Methodology for Emergent Neruophysiological and Cognitive/Neural Research in the Next Two Decades. National Research Council, The National Academies Press, Washington D.C., 2008, p. 15, http://www.nap.edu/catalog/12177.html, accessed on 20.02.2015.
2. D. BULLER: Adapting Minds: Evolutionary Psychology and the Persistent Quest for Human Nature. MIT Press, Cambridge, MA, 2005.
3. N. KANWISHER, G. YOVEL: The Fusiform Face Area: A Cortical Region Specialized for the Perception of Faces. Philos Trans R Soc Lond B Biol Sci, 361, 2109 (2006).
4. F. M. BEAR, W. B. CONNORS, A. M. PARADISE: Neuroscience. Exploring the Brain. 3rd ed. Lippincot Williams & Willkins, Philadelphia, US, 2006, p. 24.
5. M. LINDSTROM: Buyology: Truth and Lies about What We Buy. Crown Publishing Group, a Division of Random House, Inc, 2010, p. 70.
6. C. G. JUNG: Dream Analysis, Text Selection, Introduction and Handnotes by Jean Chiriac. Aropa Publishing, Bucharest, 1998, p. 55.
7. L. MLODINOV: Subliminal – How It Determine Unconscious Our Behaviour. Humanitas, Bucharest, 2012, p. 49.
8. http://www.maia.gov.md/, accessed on 20.02.2015.

1148
9. C. J. SHIEH: Effects of Behavioural Norm Cognition on Tourist Satisfaction with Ecotourism. J Environ Prot Ecol, 15 (3A), 1273 (2014).
10. S. ERDALA, M. KIZILKAYAA, E. GENCA, Y. DEMIRB, A. KARAMANA, D. YANMISA, F. K. KHOSROUSHAHIA: Differential Responses of Two Wheat Varieties to Increasing Boron Toxicity. Changes on Antioxidant Activity, Oxidative Damage and DNA Profile. J Environ Prot Ecol, 15 (3A), 1217 (2014).
11. A. X. XU, R. W. SHI, W. H. LIN: Empirical Study of the Store Image on Customer Loyalty Based on the Xiamen Large Shopping Supermarket. J Environ Prot Ecol, 15 (3A), 1367 (2014).
Received 9 June 2015 Revised 22 July 2015
1149
* For correspondence.
Journal of Environmental Protection and Ecology 16, No 3, 1149–1159 (2015)
Wetlands – animal welfare – reserved area
LEGAL AND INSTITUTIONAL FRAMEWORK FOR INTEGRATED GOVERNANCE IN A BIOSPHERE RESERVE
N. VAIDIANUa*, L. TOFANb, C. BRAGHINAa, A. SCHVABa
aInterdisciplinary Centre for Advanced Research on Territorial Dynamics, University of Bucharest, 4–12 Regina Elisabeta Street, Bucharest, Romania E-mail: [email protected] bFaculty of Natural and Agricultural Sciences, Ovidius University, Constanta, Romania
Abstract. Wetlands provide a wide range of benefits to human communities. Better cooperation between governing bodies and human communities is essential for the optimum functioning of these wetlands and for their ongoing management. This paper aims to provide a clear understand-ing of the multi-level governance process by describing the management structure in the context of sustainable development, considering the main challenges arising from the co-existence of the human communities in Danube Delta Biosphere Reserve (DDBR) and the administration body, namely Danube Delta Biosphere Reserve Authority (DDBRA). We also underline the institutional and legal changes induced by the shift of government schemes over the last century. In particular, the paper outlines the link between the perceptions of different stakeholders regarding the value of this area and the investments made by the Romanian government for the development and implementa-tion of management plans. Decision-making authority concerning DDBR management still resides with the central government. This top-down approach causes conflicts and the flexibility required to respond to local problems is lacking. At the local community level, better legal and institutional support is needed for community-based management, especially of fisheries and tourism. At the highest level, there is a need for a permanent inter-institutional coordination arrangement to deal with the harmonisation of laws and operational practices and to clarify the conflicting roles of the various government agencies concerned with DDBR management.
Keywords: communities, regulations, conflicts, Danube Delta Biosphere Reserve, Romania.
AIMS AND BACKGROUND
About one third of the EU population lives within 50 km from the coastline and anthropogenic activities, such as expanding urban development through wetland loss are increasingly putting under pressure the diversity of ecosystems found in these regions. Moreover, climate change, with its associated impacts such as sea-level rise and more frequent extreme storms and storm surges, will put more pressure on coastal environment. People living in coastal and deltaic areas will also become more vulnerable to the effects of climate change1.
1150
Historically speaking, for a long time, humans utilised a range of goods and services that have been derived directly or indirectly from the marine environ-ment and they have exploited resources without the implementation of adequate management strategies that aimed to ensure the sustainability of these systems2. The lack of management strategies has led to the decline of resources and to high levels of pollution due to the public access to goods and benefits provided by the sea (www.prb.org/Publications/Reports/2003/RippleEffectsPopulationandCoast-alRegions.aspx). Nowadays, there is an urgent need to design and implement ef-ficient management policies that could/should prevent the excessive degradation of wetland resources and their services. This can be done through the full value establishment of wetland services and the incorporation of their values into ap-propriate decision-making processes3.
The Danube Delta is one of European most important wetlands with rich biodiversity and a habitat for endangered bird species. Nowadays, the existence of this biological diversity is negatively influenced by human interventions and excessive exploitation of resources has declined many species` natural habitat. The Danube Delta has a population of over 13 500 inhabitants, concentrated in one town (Sulina) and 24 villages, grouped in 7 communes (Fig. 1).
A literature review on communities living within a protected area was made by Schröter et al.4 and is generally written from the perspective of conservationists5 or anthropologists6,7. Only a few contributions advocate a balanced and differenti-ated perspective on the role of communities in protected areas. However, these studies focus mainly on the conflict between conservation and development8–11; other works focus on community perception12 or participation13,14, but do not take into account the context of protected areas.
The Danube Delta area is characterised by conceptual and practical changes made during the planning of economic activities and their impact on demographic component. This shows that the supremacy of the development concepts or plan-ning rules adopted over the years failed to stabilise win-win solutions and to define a harmonious/sustainable development15.
A key element to understanding the dynamics of human settlements in a reserve is to monitor processes on short, medium and long term, subsequent investigation of behaviour patterns that emerge from the data analysis and stakeholder involve-ment for the management of future actions. Although in other deltas in the world, management plans are designed with the views of all parties concerned, in the case of Danube Delta, the approach was done from top to bottom and from the upper level to the local level so far. The interference between the land and the sea environments, fertile soil and unique character led to thinking that terrains can be intensively used. However, it is important to realise that this natural system of the delta is highly affected by intensive human activities and should be planned according to the natural recovery capacity of its physical and ecological system.
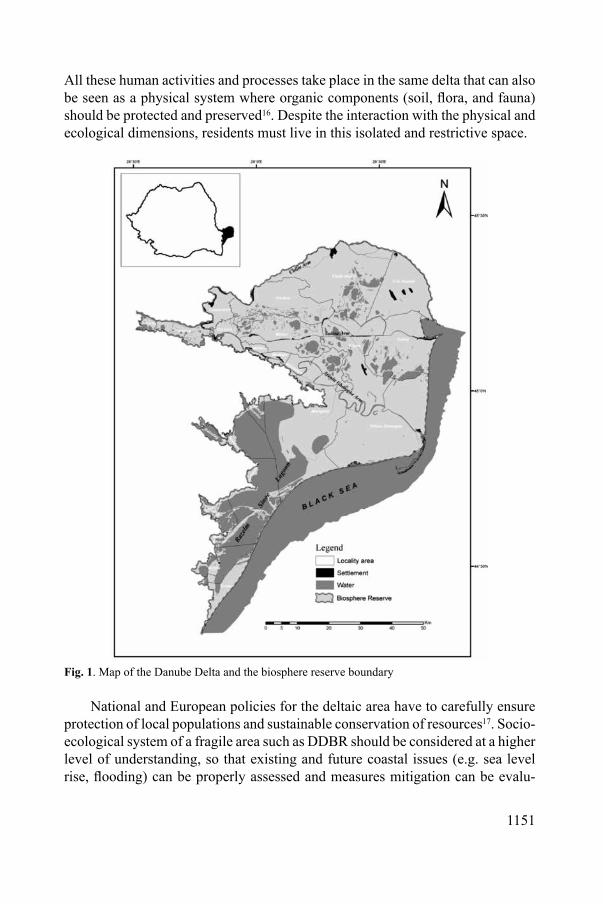
1151
All these human activities and processes take place in the same delta that can also be seen as a physical system where organic components (soil, flora, and fauna) should be protected and preserved16. Despite the interaction with the physical and ecological dimensions, residents must live in this isolated and restrictive space.
Fig. 1. Map of the Danube Delta and the biosphere reserve boundary
National and European policies for the deltaic area have to carefully ensure protection of local populations and sustainable conservation of resources17. Socio-ecological system of a fragile area such as DDBR should be considered at a higher level of understanding, so that existing and future coastal issues (e.g. sea level rise, flooding) can be properly assessed and measures mitigation can be evalu-

1152
ated according to their effectiveness. A profound understanding of the processes governing the protected area dynamics and the capacity to predict this behaviour is thus of great importance when it comes to minimise human and economic losses.
Concept. The conservation success of biosphere reserves depends on the ap-propriateness of their governance and management systems (e.g. organisational structure, adaptive planning tools) with regard to the local context and on broader economic and governance issues18. The concept of ‘governance’ has grown in importance during the last decade, describing the structures and processes used by a variety of social actors to influence and make decisions on matters of public concern (www.iccaconsortium.org/?page_id=991). Within the paper ‘Evaluating Governance. A handbook to accompany a participatory process for a protected area, draft for field testing’19, the authors explained in detail the term ‘governance’, which depicts the way people interact and create policies and rules to guide their behaviour . Governance is not a synonym of ‘government’; it is more than a set of official bodies or people working as government staff. Governance is the interaction among institutions, processes and traditions that determine the way the power is exercised, how decisions are taken on issues of public and often private concern and how citizens or other stakeholders have their say20,21.
In a protected area context, a basic understanding of governance refers to ‘who holds management authority and responsibility and can be held account-able according to legal, customary or otherwise legitimate rights’22. The specific ecological, historical, and political contexts and the variety of worldviews, values, knowledge, skills, policies and practices that contribute to conservation should be reflected in different governance regimes in different regions and countries, and even among different protected areas in the same country23.
Multi-level governance is the best concept for a space so complex like DDBR and it refers to directing and coordinating the interdependencies between different territorial levels based on negotiation and competition through public and private actors who are embedded in an institutional system within each level. Examination of the various levels of government in order to understand the system as a whole is essential, because there are institutions and regulations and actors at different levels, which should help in the process of collaborative management24.
This paper presents a study regarding the integrated governance in the Danube Delta area, in order to consolidate the scientific background and to foresee the perspectives of political and institutional governance in a biosphere reserve. Our main objective is to provide new approaches with a significant impact on other isolated communities, which can serve as lessons learned and best practices for similar areas.

1153
EXPERIMENTAL
This research contains a significant number of approaches, methods, and original techniques developed within a unitary concept. Our analysis is based on theoretical approaches to the governance of protected areas by studying European and national legislative documents (especially from DDBRA) and qualitative approaches, through participatory observation and interviews. Documents reviewed were pur-chased mainly from DDBRA, but also from other institutions like Danube Delta National Institute for Research and Development, SC NAVROM Delta Tulcea, National Agency for Fishing and Aquaculture, World Wild Fund for Nature. The administrative framework is described and the role of local government is high-lighted as a major impact of the enforcing laws. Interviews (17) were applied in Sfântu Gheorghe village on locals and representatives of the institutions mentioned above, in Romanian and lasted between 15 and 40 min. Interviews structure tried to capture the degree of involvement or satisfaction/dissatisfaction related to cur-rent reserve management and the factors affecting the successful implementation and coordination.
RESULTS AND DISCUSSION
GOVERNANCE STRUCTURES
A review of historical deltaic profiles revealed a great debate about current sys-tem dynamics and how this system might respond to future changes. Resilience theory highlights the importance of investigating the historical relationships between societies and their environments. This information is an essential part of understanding the complexity of social-ecological systems and identifying the root causes of environmental problems25. From this point of view, it is estimated that more than 50% of the entire Danube Delta wetlands were lost during the Communist Period because of agriculture and aquaculture arrangements between 1950 and1990 (Ref. 26).
The present governance process in the Danube Delta Biosphere Reserve is still routed in the formal centralised system and is reflected in the scheme presented in Fig. 2.
One central authority, the Ministry of Environment and Climate Change, plays the most important role in the decision-making process concerning the biosphere reserve management. DDBRA was established in 1990 and its structure and attribu-tions were defined by Government Decision No 248/1994. This Decision stipulates in Art. No 5 that ‘The mission of the Reserve Administration consists in creating and applying a special regime of management in order to conserve and protect the biodiversity in the natural ecosystems of the reserve, to develop human settlements and to organize economic activities in correlation with the support capacity of these

1154
ecosystems’. The area within the reserve boundary has about 580 000 ha, defined by law, bringing together several protected areas declared between 1938 and the date of designation as a biosphere reserve. The DDBRA is the only Management Body directly subordinated to the ministry and it is the only site in Romania that has an annual budget from the state and a special law that governs it27.
Fig. 2. Present governance in the Danube Delta Biosphere Reserve
The DDBRA is led by a Governor, appointed by the prime-minister, who has the position of state sub-secretary. Unfortunately, this situation translates into strong political influence on decisions and confers high instability because of the government changes every 4 years or even more often.
Within the designation law, there were defined two councils which have to be called and consulted in order to decide the enforcing legislation and to manage the natural and cultural assets for ensuring the leadership together with the Governor: the Consultative Council and the Scientific Council. As shown in Fig. 2, there are many institutions that share the delta and their resources, but, unfortunately, their tasks usually overlap and multiple impacts are restated as a consequence of lack of communication, lack of functionality or disorganisation and general chaos, conduct-ing to uncertainty regarding the future optimum development of the delta. DDBRA has a complex duty because it is in charge for two different actions: ‘governing’ and ‘managing’ the DDBR. According to Borrini-Feyerabend et al.22,23, ‘manag-ing’ means taking a variety of actions to reach given objectives, while ‘governing’ means defining those objectives and taking decisions about them.
NORMATIVE DOCUMENTS AND INTERVIEWS ANALYSES
More than 70 laws and regulations approved and implemented after 1993 were analysed in this study. These dictate that all social and economic activities must

1155
fall in line with biodiversity conservation and protection measures. Main activities regulated over time are: fishing, tourism, hunting, reed harvesting, deltaic archi-tecture, and access to the reserve.
After the designation, DDBR was listed within the most important interna-tional environmental protection networks: The International Convention for the Protection of the World Cultural and Natural Heritage (1990), The Convention of Wetland Zones of World Importance (RAMSAR Convention – 1991) and The International Biosphere Network (UNESCO – M&B program).
In 1996, the Government established a plan of measures to promote the devel-opment of the DDBR area, by which residents of the DDBR are granted several facilities, including the right to family fishing, tax deductions, wage increases for specialists employed in the Delta (teachers, doctors, civil servants), subventions for transportation, electricity, heating, gas and water. In 1997, the Government and the DDBRA initiated a regulation plan for fishing activities, requiring individual permits for all professional fishermen. Fishing is further regulated by the Law of Fishing and Aquaculture in 2001. In 2002, the Government decided the conces-sion of fishing and reed collection activities in the DDBR. Since then, the DDBRA establishes yearly sustainable harvest levels (quotas) for commercial species of fish, based primarily on reported capture levels from the previous year.
According to the DDBRA website (www.ddbra.ro), the following rules re-garding tourism in the DDBR are in place: (i) tourists access in DDBR is allowed only on the basis of an access permit and it is conditioned by the payment of an access fee, which is 5.00 lei/person/day, 15.00 lei/person/week, 30.00 lei/person/year; (ii) collection of entry tax for tourists set according to ORD No 610/19 May 2009 of the Ministry of Environment and Climate Change can be done on the DDBRA premises: Monday–Thursday: 08.00–16.30; Friday: 08.00–14.00; (iii) DDBRA recommends, as transport means, using of small capacity boats with electric propulsion; (iv) the access outside the main routes is only allowed by row boats; (v) camping is allowed only in specially designated areas; (vi) the floating hotels, used for transport and tourist accommodation, should have storage tanks and containers for liquid and solid waste; (vii) the tourist transport ships must have special systems for collecting residues and any other waste; (viii) individual tourists must take out of the Reserve all plastic, paper, metal wrappings, bottles or other containers used for food transport; (ix) it is forbidden for the tourists to enter the bird colonies or to disturb solitary nests or chicks. DDBRA recommends the use of birds observation towers; (x) it is forbidden to cut trees or pick plants of any kind; (xi) sport fishing is organised by legally constituted angling associations and is allowed only in approved areas, as well as sport hunting. It is also specified that for any other information concerning the DDBR, as well as practical information on tourism, one can contact the DDBRA information centres in Crisan, Sulina, Uzlina, Tulcea (Fig. 3).

1156
Fig. 3. Information and visitor centers in DDBR (www.ddbra.ro)
After a careful review of legal and institutional documents, the most important identified issues are: inefficient policy implementation and the lack of institutions responsibilities. The first two points, related to tourist access, are welcomed in order to get additional fundraising and to increase tourists responsibility in DDBR, but the access fee payment is collected on tourist will and only in the DDBRA premises (Tulcea), although it is well-known that many tourists enter the reserve in other points than Tulcea. Moreover, the schedule is very limited during the weekdays (08.00–16.30, Friday till 14.00) and there is no program during weekends, when the flow of tourists is very high. A viable solution could be to introduce this tax in the price of the transportation. In addition, immediate actions must be taken because the money is collected by the Ministry of Environment and Climate Change, but these amounts are not redirected to the DDBRA, so they are not used to improve the management of this sensitive area.
Some of the rules mentioned above are very well-designated, but the im-plementation is recognised as a failure because of the low number of DDBRA agents responsible with the verification of prohibited activities. Only 40 agents are currently involved in biosphere reserve protection and regulation, while their number should be at least 3 or 4 times higher. During the interviews, DDBRA agents recognised that the institutions responsible for protecting the delta are not involved enough in achieving their duties. In the same time, they believe that there
1157
are external factors that degrades delta, which they cannot control, such as politics and political pressure, market forces, the application levels of laws, dams, pollution.
Other categories of stakeholders, like investors or tourists, wish to see a management structure that is responsive to their needs and is financially effec-tive. Locals wish to see good levels of public participation in management, with an overall consensus orientation within an accepted strategic vision. The NGOs representatives consider that giving reserve visitors a direct role in management, through involvement in organised activities or events on environmental education programs, provides more positive perception of governance. These results offer valuable information that can be used in different ways on behalf of the different stakeholders directly or indirectly related to the decision-making process28,29.
As we have already seen, the analysis revealed that starting with the 1990s, Danube Delta faced a complicated socio-economic and demographic transition, aggravated by the urban and industrial focus of the territorial policy of those years. Natural resource systems, including protected areas, have complex social, politi-cal, cultural and ecological dimensions and they have not been fully understood by local population. Moreover, the strategies and the DDBR master plan (2007), designed in order to cope with changing conditions, were not adaptive, and their efficacy has not been evaluated. In this context, the identification of conditions that may facilitate or limit the adaptability and resilience of the municipalities to the encountered problems or interact with socio-economic changes becomes fundamental. In order to preserve these values, we need to reconsider the way we perceive the governing protected areas due to the following needs: the ecosystem-based and adaptive management approaches, more effective representation of citizens interests in policy and decision-making; indigenous and local ecological knowledge; government pressure to reduce management costs, etc. Many develop-ment programs, focused on changing behaviour s and perceptions rather than just providing technical advice and incentives, should be promoted.
CONCLUSIONS
The results showed that DDBR sustainability requires political leadership and that integration of various sectors is critical to make the governance process suc-cessful. Lack of integration between executive and legislative branches, as well as a failure to involve stakeholders, can slow down these processes. A clearer delineation of DDBRA jurisdiction needs to be reconsidered. Transparency is also a central issue in order to establish integration between levels of government and also with the stakeholders. In Romania, part of the management process is still kept behind closed doors, sometimes leading to disgruntled stakeholders. In contrast, all meetings should be open and all documents should be public, leading to more transparency and a better cooperation throughout the governance process.
1158
But it would be difficult without working on the issue of local representation and awareness rising among stakeholders and visitors related to the importance of biodiversity conservation and to ensure long-term sustainability.
Acknowledgements. This work has been supported from the strategic grant POSDRU/159/1.5/S/ 133391, Project ‘Doctoral and Post-doctoral programs of excellence for highly qualified human resources training for research in the field of Life sciences, Environment and Earth Science’ co-financed by the European Social Fund within the Sectorial Operational Program Human Resources Development 2007 – 2013.
REFERENCES1. Science for Environment Policy: European Commission DG Environment News Alert Service,
edited by SCU, The University of the West of England, Bristol. http://ec.europa.eu/environ-ment/integration/research/newsalert/pdf/new_web_tool_supports_integrated_coastal_zone_management_46si10_en.pdf. Accessed on 15 December 2014.
2. A. R. FRAU: Socioeconomic Valuation of the Marine Environment in Wales: Implications for Coastal Management. Ph.D. Thesis, School of Ocean Sciences, Bangor University, 2010.
3. AGENDA 21: United Nations Conference on Environment & Development Rio de Janeiro, http://sustainabledevelopment.un.org/content/documents/Agenda21.pdf, Brazil, June 1992.
4. B. SCHRÖTER, K. SESSIN-DILASCIO, C. MEYER, B. MATZDORF, C. SATTLER, A. MEYER, G. GIERSCH, C. JERICÓ-DAMINELLO, L. WORTMANN: Multi-level Governance through Adaptive Co-management: Conflict Resolution in a Brazilian State Park. Ecol Proc, 3, 6 (2014).
5. K. BRANDON: People, Parks, Forests or Fields. A Realistic View of Tropical Forest Conserva-tion. Land Use Policy, 12 (2), 137 (1995).
6. D. WOOD: Conserved to death: are tropical forests being over-protected from people? Land Use Policy, 12 (2), 115 (1995).
7. M. DOWIE: Conservation Refugees. When Protecting Nature Means Kicking People Out. Orion Magazine November/December, 2005, 16–27.
8. S. ABAKERLI: A Critique of Development and Conservation Policies in Environmentally Sensitive Regions in Brazil. Geoforum, 32, 551 (2001).
9. J. A. PUPPIM De OLIVEIRA: Implementing Environmental Policies in Developing Countries through Decentralization: The Case of Protected Areas in Bahia, Brazil. World Develop, 30 (10), 1713 (2002).
10. N. JONES, J. R. A. CLARK, M. PANTELI, M. PROIKAKI, P. G. DIMITRAKOPOULOS: Lo-cal Social Capital and the Acceptance of Protected Area Policies: An Empirical Study of Two Ramsar River Delta Ecosystems in Northern Greece. J Environ Manage, 96, 55 (2012).
11. L. M. NORDLUND, U. KLIOBER, E. CARTER, S. RIEDMILLER: Chumbe Island Coral Park – Governance Analysis. Mar Pol, 41, 100 (2013).
12. J. R. MATTA, J. R. R. ALAVALAPATI: Perceptions of Collective Action and Its Success in Community Based Natural Resource Management: An Empirical Analysis. Forest Pol Econ, 9, 274 (2006).
13. E. D. G FRASER, A. J. DOUGILL, W. E. MABEE, M. REED, P. McALPHINE: Bottom-up and Top-down: Analysis of Participatory Processes for Sustainability Indicator Identification as a Pathway to Community Empowerment and Sustainable Environmental Management. J Environ Manag, 78, 114 (2006).
14. H. SUICH: The Effectiveness of Economic Incentives for Sustaining Community Based Natural Resource Management. Land Use Policy, 31, 441 (2013).
15. N. VAIDIANU, M. C. ADAMESCU, M. WILDENBERG, C. TETELEA: Understanding Public Participation and Combining Perceptions of Stakeholders’ for a Better Management in Danube
1159
Delta Biosphere Reserve (Romania) (Ed. E. Papageorgiou). Fuzzy Cognitive Maps for Applied Sciences and Engineering, Springer, 2014.
16. M. E. SIDOROFF, S. LITESCU: Biodiversity Issue on Danube River–Danube Delta– Black Sea System. International Centre for Advanced Studies – Proposed Structure to Support Solutions on Environmental Issues. J Environ Prot Ecol, 13 (3A), 1768 (2012).
17. A. M. MUNTEANU, T. J. EHLINGER, M. GOLUMBEANU, L. TOFAN: Network Environ-mental Governance in the EU as a Framework for Trans-boundary Sturgeon Protection and Cross-border Sustainable Management. J Environ Prot Ecol, 14 (2), 685 (2013).
18. S. STOLL-KLEEMANN, M. BERTZKY, A. C. de la VEGA-LEINERT, N. FRITZ-VIETTA, N. LEINER, M. HIRSCHNITZ-GARBERS, M. MEHRING, T. REINHOLD, R. SCHLIEP: The Governance of Biodiversity (GoBi) Project. A Vision for Protected Area Management and Governance. Hoffmann-Druck GmbH, Wolgast, Germany, 2008, p. 24.
19. P. ABRAMS, G. BORRINI-FEYERABEND, J. GARDNER, P. HEYLINGS: Evaluating Gov-ernance. A Handbook to Accompany a Participatory Process for a Protected Area. Draft for Field Testing, Parks Canada and TILCEPA; http://cmsdata.iucn.org/downloads/evaluating_gov.ernance_handbook.doc (2003).
20. Institute on Governance: Governance Principles for Protected Areas in the 21st Century. Discus-sion Paper for Parks Canada. Ottawa, Canada, 2002.
21. M. LOCKWOOD: Good Governance for Terrestrial Protected Areas: A Framework, Principles and Performance Outcomes. J Environ Manage, 91, 754 (2010).
22. G. BORRINI-FEYERABEND, J. JOHNSTON, D. PANSKY: Governance of Protected Areas. In: Managing Protected Areas: A Global Guide (Eds Lockwood, Worboys, Kothari). Earthscan UK and USA. 2006, 116–145.
23. G. BORRINI-FEYERABEND, N. DUDLEY, T. JAEGER, B. LASSEN, N. PATHAK BROOME, A. PHILLIPS, T. SANDWITH: Governance of Protected Areas – from Understanding to Action. IUCN Gland, Switzerland, 2013.
24. A. BENZ: Multilevel Governance – Governance in Mehrebenensystemen. Governance – Regieren in Komplexen Regelsystemen (Eds A. Benz, N. Dose). Eine Einführung, VS-Verlag, Wiesbaden, 2010, 111–135.
25. J. A. GONZÁLEZ, C. MONTES, J. RODRÍGUEZ, W. TAPIA: Rethinking the Galapagos Islands as a Complex Social-ecological System: Implications for Conservation and Management. Ecol Soc, 1 (2), 13 (2008).
26. P. GASTESCU, R. STIUCA: Danube Delta. Biosphere Reserve. CD Press Publishing, Bucharest, 2008 (in Romanian).
27. E. STANCIU, A. IONITA: Governance of Protected Areas in Eastern Europe – Overview on Dif-ferent Governance Types, Case Studies, and Lessons Learned. Study Commissioned to ProPark, Romania, by the German Federal Agency for Nature Conservation (BfN). BfN-Skripten, 2013.
28. M. GOLUMBEANU, S. NICOLAEV, T. ZAHARIA, F. K. VOSNIAKOS: Tool of Training as an Important Component of the Environmental Education and Public Awareness. J Environ Prot Ecol, 13 (2A), 1139 (2012).
29. F. TUDOR: Short Considerations about the Opportunities and the Threats Regarding the Devel-opment of Living Aquatic Resources. J Environ Prot Ecol, 13 (3A), 1933 (2012).
Received 3 June 2015 Revised 23 July 2015

1160
* For correspondence.
Journal of Environmental Protection and Ecology 16, No 3, 1160–1167 (2015)
Environmental friendly construction materials – fly ash in concrete
INVESTIGATION OF FROST RESISTANCE OF FLY ASH CONCRETE WITH AIR-ENTRAINING ADMIXTURE
B. LANGIER*, J. HALBINIAK, J. ADAMUS
Czestochowa University of Technology, Faculty of Civil Engineering, 69 Dabrowskiego Street, 42 201 Czestochowa, Poland E-mail: [email protected]
Abstract. In the paper the impact of the simultaneous action of fly ash and air entraining admixture on the concrete frost durability has been presented. The experiment included 12 series of concrete, which contained a variable amount of air-entraining admixture and fly ash. Some characteristics of freshly mixed concrete such as consistency and air content were assessed. Tests of the hardened concrete included compressive strength and frost resistance. Furthermore, the pore structure of concrete was tested. Parameters such as: the total air content in concrete A, average spacing factor between air voids _L and content of micropores A300 were determined. Based on the obtained results, it was found that the fly ash and air entraining admixture are essential for concrete durability during cyclic freezing and thawing. The relationship between the directly tested concrete frost resistance and air void structure in hardened concrete was shown. The conducted tests confirmed that fly ash concrete obtains proper frost resistance thanks to the appropriate use of air entraining admixture.
Keywords: concrete, frost resistance, compressive strength, pore structure, air-entraining admixture.
AIMS AND BACKGROUND
The tests aim to analyse an influence of both fly ash and air-entraining admixture on the concrete frost resistance.
The development of concrete technology is closely connected with the devel-opment of chemistry and use of new versions of modifiers. Admixtures allow for modification of properties of both the concrete mixture and hardened concrete. On the market there are a lot of additives having different composition and proper-ties and therefore different effect on concrete1,2. Additive effectiveness depends on many technological factors thus their optimum application is one of the major tasks for scientific centres investigating concrete technology3,4. Concrete exposed to harmful weather conditions must have high resistance to frost. According to the PN-EN 206 standard, design of concrete exposed to cyclic freezing and thawing requires the use of air-entraining admixtures. They change the concrete microstruc-ture affecting improvement in the frost resistance5–7. Entraining admixtures cause formation of many tiny air bubbles in the concrete mixture, which then transform
1161
into a system of air pores in the hardened concrete. The air pores reduce or ab-sorb stresses from freezing water occupying capillary pores8,9. Generally, the air pores affecting the increase in the frost resistance have a spherical shape of size 10–300 μm and are uniformly distributed. Evaluation of porosity structure giving reproducible results is done by automatic image analysis10,11. Currently, testing of concrete pore structure is one of the basic methods allowing for assessment of the concrete frost resistance12–15. The pores which are smaller than 10 μm or greater than 300 μm impair the concrete mechanical properties. As reported in Ref. 16, it is believed that the increase in the amount of air by 1% causes a decrease in compressive strength of about 4–5.5%.
Concrete provides great opportunity to utilise waste materials. Apart from the conventional ingredients, siliceous fly ashes are the most widely used addi-tives17,18. Appropriate and effective use of fly ashes in concrete production is a part of a strategy for sustainable development19. The PN-EN 450-1:2012 standard describes the requirements that must be met by fly ashes to be used as the additives to concrete. However, it must be remembered that silica fly ash affects concrete characteristics essentially. In Ref. 20 it was emphasised that concrete, in which fly ash replaces a large portion of cement may show the reduced frost resistance.
EXPERIMENTAL
The following components: natural aggregates with grain size of 16 mm and a sand point PP = 40%, CEM I 42.5 R cement, silica fly ash according to PN-EN 450-1:2012, plasticisers based on polycarboxylate and air-entraining admixture were used for concrete production. The plasticisers and air-entraining admixture came from the same producer in order to ensure their compatibility.
The base concrete mixture (A-0 series) with the water-cement ratio W/C = 0.55 was designed using experimental method, and subsequently it was modified by introduction of fly ash in the amount corresponding to the half (B-0 series) and the 100% (C-0 series) of the maximal level specified by the standard. Then these three concrete series (A-0, B-0 and C-0) were modified by air-entraining admixture in the amount corresponding to 0.2, 0.4 and 0.6% of cement mass. Thus, 12 series of concrete mixture were created. Their composition is given in Table 1.
All concrete mixtures were prepared using a concrete mixer with a forced mix-ing for 90 s. After the preparation the concrete mixtures underwent the following tests: the air content in the concrete mixture, the concrete slump test, compressive strength after 28 days of curing, and resistance to 150 cycles of freezing and thaw-ing. Concrete pore structure was determined on the basis of the total air content in the hardened concrete A, average spacing factor between air pores L and content of micropores A300.
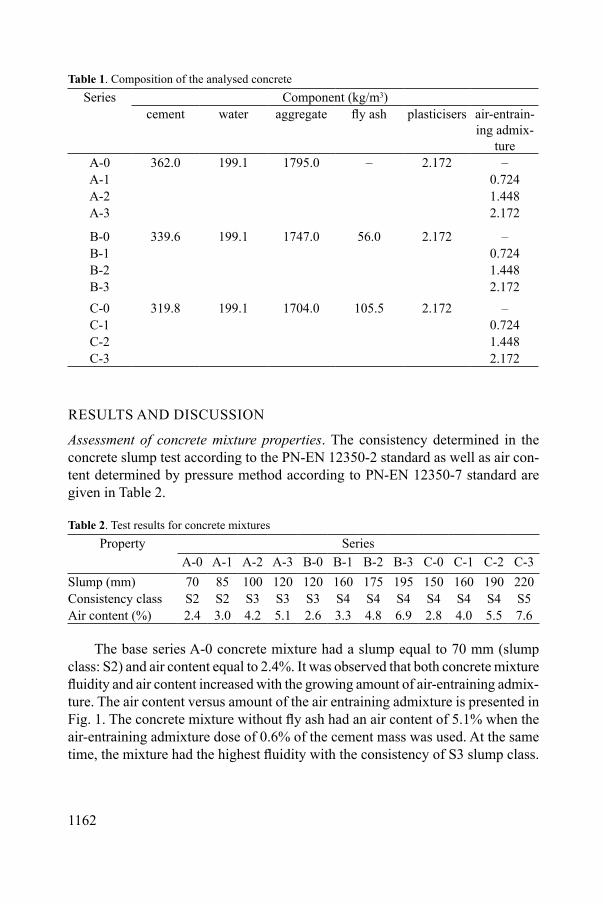
1162
Table 1. Composition of the analysed concreteSeries Component (kg/m3)
cement water aggregate fly ash plasticisers air-entrain-ing admix-
tureA-0 362.0 199.1 1795.0 – 2.172 –A-1 0.724A-2 1.448A-3 2.172
B-0 339.6 199.1 1747.0 56.0 2.172 –B-1 0.724B-2 1.448B-3 2.172C-0 319.8 199.1 1704.0 105.5 2.172 –C-1 0.724C-2 1.448C-3 2.172
RESULTS AND DISCUSSION
Assessment of concrete mixture properties. The consistency determined in the concrete slump test according to the PN-EN 12350-2 standard as well as air con-tent determined by pressure method according to PN-EN 12350-7 standard are given in Table 2.
Table 2. Test results for concrete mixturesProperty Series
A-0 A-1 A-2 A-3 B-0 B-1 B-2 B-3 C-0 C-1 C-2 C-3Slump (mm) 70 85 100 120 120 160 175 195 150 160 190 220Consistency class S2 S2 S3 S3 S3 S4 S4 S4 S4 S4 S4 S5Air content (%) 2.4 3.0 4.2 5.1 2.6 3.3 4.8 6.9 2.8 4.0 5.5 7.6
The base series A-0 concrete mixture had a slump equal to 70 mm (slump class: S2) and air content equal to 2.4%. It was observed that both concrete mixture fluidity and air content increased with the growing amount of air-entraining admix-ture. The air content versus amount of the air entraining admixture is presented in Fig. 1. The concrete mixture without fly ash had an air content of 5.1% when the air-entraining admixture dose of 0.6% of the cement mass was used. At the same time, the mixture had the highest fluidity with the consistency of S3 slump class.
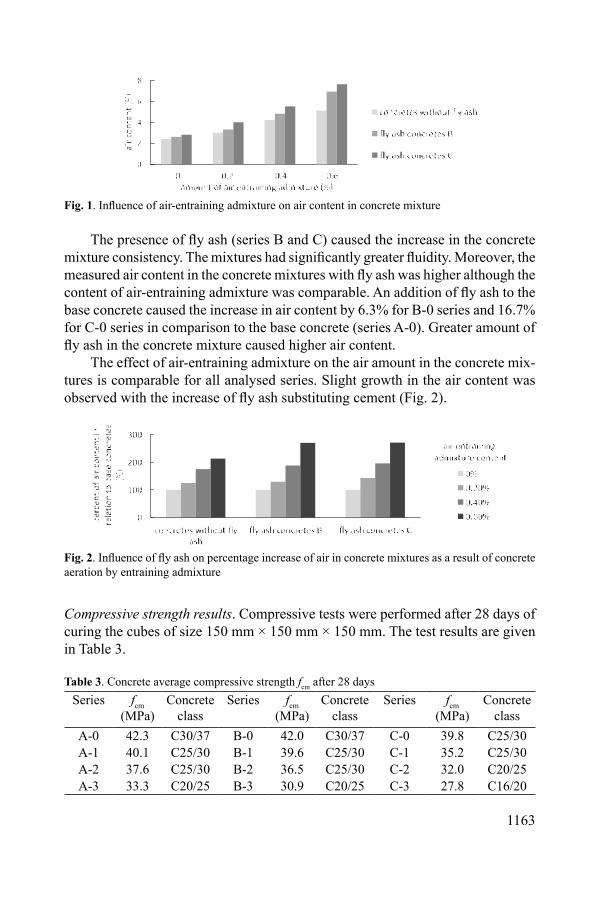
1163
Fig. 1. Influence of air-entraining admixture on air content in concrete mixture
The presence of fly ash (series B and C) caused the increase in the concrete mixture consistency. The mixtures had significantly greater fluidity. Moreover, the measured air content in the concrete mixtures with fly ash was higher although the content of air-entraining admixture was comparable. An addition of fly ash to the base concrete caused the increase in air content by 6.3% for B-0 series and 16.7% for C-0 series in comparison to the base concrete (series A-0). Greater amount of fly ash in the concrete mixture caused higher air content.
The effect of air-entraining admixture on the air amount in the concrete mix-tures is comparable for all analysed series. Slight growth in the air content was observed with the increase of fly ash substituting cement (Fig. 2).
Fig. 2. Influence of fly ash on percentage increase of air in concrete mixtures as a result of concrete aeration by entraining admixture
Compressive strength results. Compressive tests were performed after 28 days of curing the cubes of size 150 mm × 150 mm × 150 mm. The test results are given in Table 3.
Table 3. Concrete average compressive strength fcm after 28 daysSeries fcm
(MPa)Concrete
classSeries fcm
(MPa)Concrete
classSeries fcm
(MPa)Concrete
classA-0 42.3 C30/37 B-0 42.0 C30/37 C-0 39.8 C25/30A-1 40.1 C25/30 B-1 39.6 C25/30 C-1 35.2 C25/30A-2 37.6 C25/30 B-2 36.5 C25/30 C-2 32.0 C20/25A-3 33.3 C20/25 B-3 30.9 C20/25 C-3 27.8 C16/20
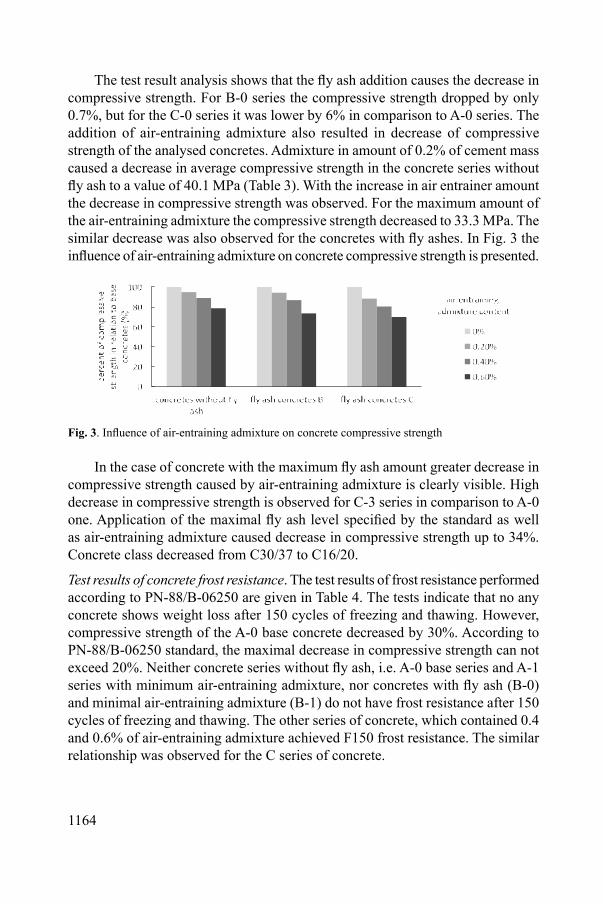
1164
The test result analysis shows that the fly ash addition causes the decrease in compressive strength. For B-0 series the compressive strength dropped by only 0.7%, but for the C-0 series it was lower by 6% in comparison to A-0 series. The addition of air-entraining admixture also resulted in decrease of compressive strength of the analysed concretes. Admixture in amount of 0.2% of cement mass caused a decrease in average compressive strength in the concrete series without fly ash to a value of 40.1 MPa (Table 3). With the increase in air entrainer amount the decrease in compressive strength was observed. For the maximum amount of the air-entraining admixture the compressive strength decreased to 33.3 MPa. The similar decrease was also observed for the concretes with fly ashes. In Fig. 3 the influence of air-entraining admixture on concrete compressive strength is presented.
Fig. 3. Influence of air-entraining admixture on concrete compressive strength
In the case of concrete with the maximum fly ash amount greater decrease in compressive strength caused by air-entraining admixture is clearly visible. High decrease in compressive strength is observed for C-3 series in comparison to A-0 one. Application of the maximal fly ash level specified by the standard as well as air-entraining admixture caused decrease in compressive strength up to 34%. Concrete class decreased from C30/37 to C16/20.
Test results of concrete frost resistance. The test results of frost resistance performed according to PN-88/B-06250 are given in Table 4. The tests indicate that no any concrete shows weight loss after 150 cycles of freezing and thawing. However, compressive strength of the A-0 base concrete decreased by 30%. According to PN-88/B-06250 standard, the maximal decrease in compressive strength can not exceed 20%. Neither concrete series without fly ash, i.e. A-0 base series and A-1 series with minimum air-entraining admixture, nor concretes with fly ash (B-0) and minimal air-entraining admixture (B-1) do not have frost resistance after 150 cycles of freezing and thawing. The other series of concrete, which contained 0.4 and 0.6% of air-entraining admixture achieved F150 frost resistance. The similar relationship was observed for the C series of concrete.

1165
Table 4. Decrease in compressive strength and weight loss after 150 cycles of freezing and thawingSeries
A-0 A-1 A-2 A-3 B-0 B-1 B-2 B-3 C-0 C-1 C-2 C-3Decrease in compressive strength (%)
30 28 13 9 31 26 12 9 32 28 15 12Weight loss
0 0 0 0 0 0 0 0 0 0 0 0Level of frost resistance F150
no no yes yes no no yes yes no no yes yes
Analysis of pore structure. The characteristics of air pores was determined using the automatic system for image analysis of air voids in concrete and the computer system Lucia Concrete according to the PN-EN480-11. Parameters characterising concrete structure such as: total air content in concrete A, average spacing factor between air voids L and content of micropores A300 (18 class) were determined for all tested concrete series (Table 5). The total air content in hardened concrete was higher than in the concrete mixture, which was determined by the pressure method. It can be seen that the addition of the air-entraining admixture in an amount of 0.2% to the concrete with fly ash did not affect the air content significantly. The higher amount of air-entraining admixture (0.4 and 0.6%) caused a significantly higher air content in the hardened concrete (Fig. 4).
Table 5. The characteristics of air poreSeries
A-0 A-1 A-2 A-3 B-0 B-1 B-2 B-3 C-0 C-1 C-2 C-3Total air content in concrete A (%)
3.3 5.6 5.9 7.9 4.7 6.5 9.9 12.4 5.8 8.1 14.3 16Average spacing factor between air voids L (mm)
0.17 0.19 0.14 0.16 0.13 0.11 0.11 0.09 0.13 0.12 0.11 0.10Micropores content A300 (%)
2.2 2.2 4.9 4.1 4.6 6.0 9.7 11.1 5.6 6.7 8.7 13.0
Fig. 4. Influence of air-entraining admixture on the percentage of total air content in concretes with and without fly ash

1166
An average spacing factor between air pores L < 20 mm, which is recom-mended in order to achieve the frost resistance of concrete, was achieved for all tested series.
Content of micropores A300 is higher for concrete with fly ashes in comparison to the concrete without fly ashes (Fig. 5). In the direct test of the frost resistance only concrete with air-entraining admixture in amount of 0.2 and 0.4% of cement mass achieved frost resistance of F150 class.
Fig. 5. Influence of air-entraining admixture on content of micropores A300 (18 class)
CONCLUSIONS
1. The presence of fly ash is important for aeration efficiency of the concrete mixture by an air-entraining admixture. With an increased amount of fly ash replacing the cement, the amount of air in the concrete mixture measured by the pressure method as well as the total content of air in the hardened concrete increases.
2. An air-entraining admixture improves workability and essentially increases the fluidity of the concrete mixture. In order to maintain the initial consistency, a reduction in the amount of plasticiser is required.
3. The simultaneous use of fly ash as a cement replacement and aeration of the concrete mixture results in a significant decrease in compressive strength. A decrease of 35% was observed when compared to the base A-0 and modified C-3 series. The decrease in compressive strength should be taken into consideration already at the design stage of fly ash concrete with the air-entraining admixtures.
4. The air pore property of the hardened concrete is useful in assessing the frost resistance.
REFERENCES1. P. LUKOWSKI: Modern Achievements in the Field of Polymer Admixtures to Concrete. Materi-
als for Civil Engineering, 11, 16 (2014) (in Polish).2. G. BAJOREK: The Role of Concrete Admixtures in Wintertime Works. Materials for Civil
Engineering, 12, 20 (2013) (in Polish).
1167
3. L. CZARNECKI: Chemistry for Civil Engineering in Practice. Materials for Civil Engineering, 2, 22 (2010) (in Polish).
4. J. GOLASZEWSKI: Admixture Collaboration with Cements. Materials for Civil Engineering, 11, 89 (2013) (in Polish).
5. A. NOWAK-MICHTA: Frost Resistance of Fly Ash Concrete in the Presence of De-icers. In: Proc. of the Conference ‘Concrete Days’, Wisla, Poland 2010, 273–281 (in Polish).
6. P. BOSS, Z. GIERGICZNY: Testing the Frost Resistance of Concrete with Different Cement Types – Experience from Laboratory and Practice. Architecture, Civil Eng Environ, 3 (2), 41 (2010).
7. V. EZERSKIY, M. LELUSZ: The Common Impact of Fly Ash Addition and Air-entraing Admix-ture on Kinetics of Hydration Process in Cement Composites. Civil Environ Eng, Civil Environ Eng, 2, 129 (2011) (in Polish).
8. S. SUN, G. W. SCHERER: Effect of Air-voids on Salt Scaling and Internal Freezing. Cement Concrete Res, 40 (2), 260 (2010).
9. B. LAZNIEWSKA-PIEKARCZYK: The Influence of Selected New Generation Admixtures on the Workability, Air–Voids Parameters and Frost-resistance of Self-compacting Concrete. Const Build Mater, 31, 310 (2012).
10. U. H. JAKOBSEN, C. PADE, N. THAULOW, D. BROWN, S. SAHU, O. MAGNUSSON, S. de BUCK, G. de SHUTTER: Automated Air Void Analysis of Hardened Concrete – A Round Robin Study. Cement Concrete Res, 36, 1444 (2006).
11. J. ELSEN: Automated Air Void Analysis on Hardened Concrete Results of a European Inter-comparison Testing Program. Cement Concrete Res, 31, 1027 (2001).
12. J. X. ZHANG, C. WANG, M. Y. GUO: Experimental Investigation on the Influence of Water-Cement Ratio on Air-Void Parameters of Cement Concrete. Adv Mater Res, 771, 29 (2013).
13. B. LAZNIEWSKA PIEKARCZYK: The Influence of Admixtures Type on the Air–Voids Pa-rameters of Non-air-entrained and Air-entrained High Performance SCC. Constr Build Mater, 41, 109 (2013).
14. M. T. HASHOLT: Air Void Structure and Frost Resistance: A Challenge to Powers’ Spacing Factor. Mater Struct, 47, 911 (2014).
15. S. JIN, J. ZHANG, B. HUANG: Fractal Analysis of Effect of Air Void on Freeze–Thaw Resist-ance of Concrete. Constr Build Mater, 47, 126 (2013).
16. A. M. NEVILLE: Concrete Properties. Polish Cement Publishing House, Cement Manufacturers Association, Krakow, Poland, 2012 (in Polish).
17. W. JACKIEWICZ-REK, P. WOYCIECHOWSKI: Carbonation Rate of Air-entrained Fly Ash Concretes. Cement-Lime-Concrete 5, 249 (2011) (in Polish).
18. Q. ZENG, K. LI, T. FEN-CHONG, P. DANGLA: Pore Structure Characterization of Cement Pastes Blended with High-volume Fly-Ash. Cement Concrete Res, 42, 194 (2012).
19. E. GIERGICZNY, Z. GIERGICZNY: Categorization of Fly Ash against the Properties of Cement-Fly Ash Composites. Ceramic Materials, 62 (1), 81 (2010) (in Polish).
20. Z. GIERGICZNY: Fly Ash in Cement and Concrete Composition. Monograph. Silesian Technical University Publishing House, Gliwice, Poland, 2013 (in Polish).
Received 9 June 2015 Revised 22 July 2015

1168
Journal of Environmental Protection and Ecology 16, No 3, 1168–1178 (2015)
Environmental economics
SOCIOECONOMIC DEVELOPMENT AND CLIMATE CHANGE – BASIC COMPONENTS OF SUSTAINABLE DEVELOPMENT IN EUROPEAN UNION COUNTRIES
I. C. IUGA
‘1 Decembrie 1918’ University of Alba Iulia, 11–13 N. Iorga Street, Alba Iulia, Romania E-mail: [email protected]
Abstract. The concept of sustainable development refers to a process involving changes or develop-ment. In order to evaluate whether there has been progress towards sustainable development in the EU, it would be interesting to compare the evolution of the following basic components: Socioeconomic development; Sustainable consumption and production; social inclusion; demographic changes; public health; climate change and energy; sustainable transport; natural resources; global partner-ship; good governance. Sustainable development is not so much a search for a stable balance, as it is a dynamic concept which acknowledges that change is inherent to human society. In this paper, the author envisages to study the link between socioeconomic development and the evolution of climate change in the EU and Romania with the help of econometric model. In order to achieve this goal we will compare two basic indicators: on the one hand, the evolution of the real Gross domestic product (GDP) per capita (which represents a key indicator of socioeconomic development) and on the other hand, greenhouse gas emissions (which is a key indicator of climate change). With the help of the Eviews statistical package, we have performed a series of statistical tests meant to provide a more accurate view on the evolution of both the GDP and the Greenhouse gas emission (GGE) in Romania from 2004 to 2012.
Keywords: greenhouse gas emissions, real GDP per capita, key indicators, econometric model, the Eviews statistical package.
AIMS AND BACKGROUND
This paper contains a few graphical representations of the two basic indicators (the evolution of the real GDP per capita, greenhouse gas emissions), for the period 2004–2012 in Romania and other EU member states. It was studied whether there is a correlation between the GDP and the evolution of the GGE. The influence of the GDP on the evolution of the GGE was analysed. The method proposed for this study, in order to answer the question we are now researching, is the analysis of a unifactorial econometric model.
1169
EXPERIMENTAL
Environmental and economic cooperation among the Balkan countries would be attained by renewable energy zones in the aspect of continuous energy needs1. Energy dependencies for foreign resources, gaps and shortages which are very familiar to the Balkan economies and possible local surplus of the renewable en-ergy zones were supposed to be balanced in between the Balkan countries: large national energy zones (NEZs) in the area.
Some specialised works2 suggest an approach for the negotiations on post-Kyoto climate change that could provide a way out of the apparent deadlock between developed and developing countries. Sathiendrakumar3 argues that there are ways to reduce the total amount of carbon dioxide currently produced, with-out causing a decline in the quality of life (i.e. by maintaining a high level of the GDP per capita), and these ways depend on: the size of the population, energy requirements for production and carbon dioxide emissions per unit of energy use.
Asim et al.4 in their work have identified the major challenges of green energy sources (GES) in future energy systems. They suggested an adequate GES based on the preference of the decision factor with respect to various problems in order to address the challenges. Given the importance of energy, Lansink and Ondersteijn5 have generated in their paper nonparametric measures for energy productivity and other inputs. Profitability of Dutch greenhouse firms is largely dependent on en-ergy costs, and policy makers focus on reducing the use of energy by these firms.
Clark6 argues in his paper that there are three classes of models of renewable resource economics: profit-maximising models, competitive equilibrium models, and cooperative equilibrium models. In his article, the author examines a series of dynamic economic models for exploiting renewable resources.
Vosniakos and Ioannidis7 explain in their paper that ‘While some states certainly do more for and better at environmental protection than others, quite a number of environmental problems, being global or at least international, may be resolved effectively only through cooperation’. Bandoc and Golumbeanu8 highlighted climatic characteristics and climate variability. Stankeviciute and Criqui9 have focused on quantifying the possible interactions between the three European objectives in the horizon of 2020: (1) reduction of 20% of greenhouse gas emissions (GHG); (2) saving of 20% of the European energy consumption, and (3) a share of 20% of renewable energies in the overall energy consumption.
EU policies. In 2020, EU took it upon itself to reduce gas emissions by 20% below the levels reported in 1990. This commitment is one of the main objectives of Eu-rope 2020 growth strategy and is implemented through a binding legislative package mandatory for all member states. For 2050, EU leaders approved the objective of reducing gas emissions in Europe by 80–95% as compared to 1990, as part of the effort of developed countries to reduce their emissions and to level them with those
1170
of other states. Energy consumption control in Europe and increased use of renew-able energy, along with energy economy and the increase in energy efficiency are important components of the necessary measures for reducing greenhouse gases and for respecting the Kyoto Protocol to the United Nations Framework Conven-tion on climate change and other commitments on a community and international level with a view to reducing greenhouse gas emissions (Decision 280/2004/EC of the Council concerning a mechanism for monitoring Community greenhouse gas emissions and for implementing the Kyoto protocol). EU seeks to obtain 20% of its energy from renewable sources until 2020.
The reason we chose to analyse these two indicators is because each of them (the evolution of real GDP per capita and greenhouse gas emissions) puts a consid-erable pressure on the environment, while the stimulation of the renewable energy industry will encourage technological innovation and employment in Europe. These indicators play an important role in: monitoring the strategy for sustainable development in the EU; drafting the report on the inventory of greenhouse gases in EU; formulating a report concerning the tendencies and forecasts on greenhouse gases in Europe, according to the Kyoto Protocol.
The article starts with the graphical representations of the two factors: GDP and Greenhouse Gas Emission (GGE). These graphical representations are of Romania and other EU countries. This is followed by the analysis of the correla-tion between the two indicators. The conclusions are presented in the final section.
This paper focuses on the connection between the GDP and GGE and it seeks to raise awareness with regards to the current state of the two factors in Romania and to the necessity of a strategic approach of these factors in correlation with the EU Europe 2020 strategy. On a theoretical research level, this paper is centered around a deductive approach based on the definition and evolution of the GDP and GGE indicators. On a practical research level, the paper focuses on performing a quantitative study for analysing the connection between these two indicators.
EXPERIMENTAL
Defining the indicators. The annual greenhouse gas (GGE) emissions are estimated and reported under the United Nations Framework Convention on Climate Change (UNFCCC), the Kyoto Protocol and the Decision 280/2004/EC. The so-called Kyoto basket includes six gases: carbon dioxide (CO2), methane (CH4), nitrous oxide (N2O), hydrofluorocarbons (HFCs), perfluorocarbons (PFCs), and sulphur hexafluoride (SF6). GDP includes goods and services that have markets (or which could have markets) and products which are produced by general government and non-profit institutions. Real GDP per capita is calculated as the ratio of real GDP to the average population of a specific year.

1171
Analysis of the evolution of real GDP per capita and greenhouse gases. Since 2007 there have been problems concerning liquidity in the banking system, which have led to a restriction on credit and a decline in asset prices, contributing to a decrease in consumer demand, an increase in household economy, a decline in firm and household investments, in international commerce and implicitly in the real GDP per capita.
From a socioeconomic development standpoint, the key indicator, the real GDP per capita had an upward evolution in the period 2004–2007, while between 2007 and 2008 it reported a linear trend. The economic crisis and recession determined a drop in the real GDP per capita in 2009, until almost at the level reported in 2005. In 2010 there were reports of a slow increase in EU in general (Fig. 1). 5% increase in real GDP per capita in the EU between 2013 and 2004.
21 000
21 500
22 000
22 500
23 000
23 500
24 000
2004 2005 2006 2007 2008 2009 2010 2011 2012 2013
Euro
per
inha
bita
nt
Fig. 1. GDP per capita in EU (28), during 2004–2013 (source: personal processing of data collected from Eurostat)
The evolution of real GDP per capita in all EU member states was negatively influenced by the recent global economic and financial crisis. The Eastern European countries with the highest growth rate were the most affected by this crisis. A slow growth was reported in the majority of EU states during 2010, although Ireland, Greece, Spain and Romania have reported a negative growth. The average real GDP per capita in EU is 161.200 euro per inhabitant. The countries which have exceeded this average in the analyzed period of time (2004–2010) are: Belgium, Denmark, Germany, Ireland, France, Italy, Luxemburg, Holland, Austria, Finland, Sweden, Great Britain (Fig. 2).
As we can observe in Fig. 3, the evolution of greenhouse gas emission in Europe has a declining trend, with a sudden drop in 2009 as compared to 2008 in the absolute value of 364 507 – 1000 t of CO2 equivalent. In 2010 as compared to 2009 the quantity of greenhouse gas emission began to increase, reaching 4 720 878 – 1000 t of CO2 equivalent (it grew in absolute value by 110 998 – 1000 t of CO2 equivalent). 13% less greenhouse gases (GHGs) have been emitted in 2012 compared to 2003 in the EU (28 countries).
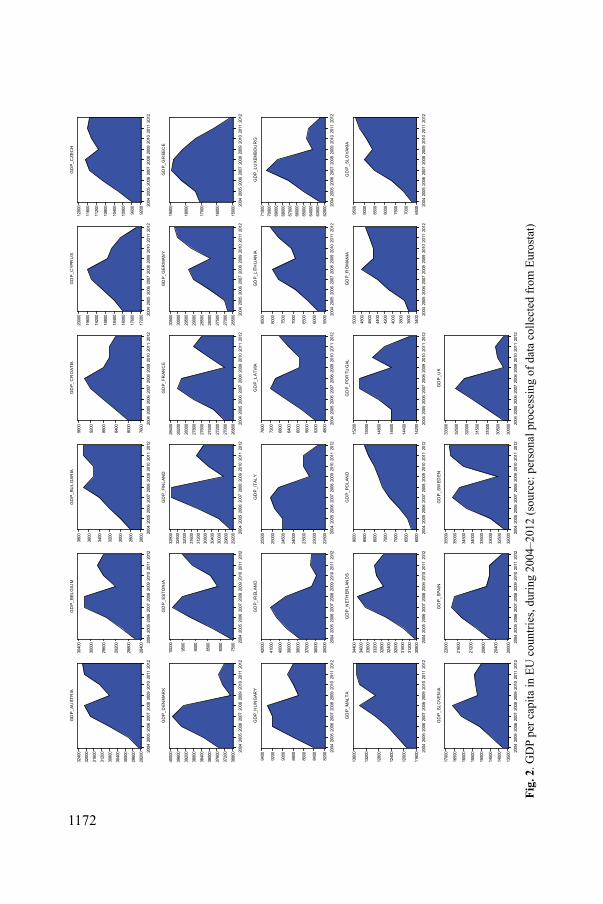
1172
2920
0
2960
0
3000
0
3040
0
3080
0
3120
0
3160
0
3200
0
3240
0 2004
2005
2006
2007
2008
2009
2010
2011
2012
GD
P_AU
STR
IA
2840
0
2880
0
2920
0
2960
0
3000
0
3040
0 2004
2005
2006
2007
2008
2009
2010
2011
2012
GD
P_BE
LGIU
M
2600
2800
3000
3200
3400
3600
3800
2004
2005
2006
2007
2008
2009
2010
2011
2012
GD
P_BU
LGAR
IA
7600
8000
8400
8800
9200
9600
2004
2005
2006
2007
2008
2009
2010
2011
2012
GD
P_C
RO
ATIA
1720
0
1760
0
1800
0
1840
0
1880
0
1920
0
1960
0
2000
0 2004
2005
2006
2007
2008
2009
2010
2011
2012
GD
P_C
YPR
US
9200
9600
1000
0
1040
0
1080
0
1120
0
1160
0
1200
0 2004
2005
2006
2007
2008
2009
2010
2011
2012
GD
P_C
ZEC
H
3680
0
3720
0
3760
0
3800
0
3840
0
3880
0
3920
0
3960
0
4000
0 2004
2005
2006
2007
2008
2009
2010
2011
2012
GD
P_D
ENM
ARK
7500
8000
8500
9000
9500
1000
0 2004
2005
2006
2007
2008
2009
2010
2011
2012
GD
P_ES
TON
IA
2920
029
600
3000
030
400
3080
031
200
3160
032
000
3240
032
800 20
0420
0520
0620
0720
0820
0920
1020
1120
12
GD
P_FI
NLA
ND
2680
0
2700
0
2720
0
2740
0
2760
0
2780
0
2800
0
2820
0
2840
0 2004
2005
2006
2007
2008
2009
2010
2011
2012
GD
P_FR
ANC
E
2650
0
2700
0
2750
0
2800
0
2850
0
2900
0
2950
0
3000
0
3050
0 2004
2005
2006
2007
2008
2009
2010
2011
2012
GD
P_G
ERM
ANY
1500
0
1600
0
1700
0
1800
0
1900
0 2004
2005
2006
2007
2008
2009
2010
2011
2012
GD
P_G
REE
CE
8200
8400
8600
8800
9000
9200
9400
2004
2005
2006
2007
2008
2009
2010
2011
2012
GD
P_H
UN
GAR
Y
3500
0
3600
0
3700
0
3800
0
3900
0
4000
0
4100
0
4200
0 2004
2005
2006
2007
2008
2009
2010
2011
2012
GD
P_IR
ELAN
D
2250
0
2300
0
2350
0
2400
0
2450
0
2500
0
2550
0 2004
2005
2006
2007
2008
2009
2010
2011
2012
GD
P_IT
ALY
4800
5200
5600
6000
6400
6800
7200
7600
2004
2005
2006
2007
2008
2009
2010
2011
2012
GD
P_LA
TVIA
5500
6000
6500
7000
7500
8000
8500
2004
2005
2006
2007
2008
2009
2010
2011
2012
GD
P_LI
THU
ANIA
6200
063
000
6400
065
000
6600
067
000
6800
069
000
7000
071
000 20
0420
0520
0620
0720
0820
0920
1020
1120
12
GD
P_LU
XEM
BOU
RG
1160
0
1200
0
1240
0
1280
0
1320
0
1360
0 2004
2005
2006
2007
2008
2009
2010
2011
2012
GD
P_M
ALTA
3080
031
200
3160
032
000
3240
032
800
3320
033
600
3400
034
400 20
0420
0520
0620
0720
0820
0920
1020
1120
12
GD
P_N
ETH
ERLA
ND
S
6000
6500
7000
7500
8000
8500
9000
2004
2005
2006
2007
2008
2009
2010
2011
2012
GD
P_PO
LAN
D
1420
0
1440
0
1460
0
1480
0
1500
0
1520
0 2004
2005
2006
2007
2008
2009
2010
2011
2012
GD
P_PO
RTU
GAL
3400
3600
3800
4000
4200
4400
4600
4800
5000
2004
2005
2006
2007
2008
2009
2010
2011
2012
GD
P_R
OM
ANIA
6500
7000
7500
8000
8500
9000
9500
2004
2005
2006
2007
2008
2009
2010
2011
2012
GD
P_S
LO
VAKI
A
1350
0
1400
0
1450
0
1500
0
1550
0
1600
0
1650
0
1700
0 2004
2005
2006
2007
2008
2009
2010
2011
2012
GD
P_SL
OVE
NIA
2000
0
2040
0
2080
0
2120
0
2160
0
2200
0 2004
2005
2006
2007
2008
2009
2010
2011
2012
GD
P_SP
AIN
3200
0
3250
0
3300
0
3350
0
3400
0
3450
0
3500
0
3550
0 2004
2005
2006
2007
2008
2009
2010
2011
2012
GD
P_SW
EDEN
3000
0
3050
0
3100
0
3150
0
3200
0
3250
0
3300
0 2004
2005
2006
2007
2008
2009
2010
2011
2012
GD
P_U
K
Fig.
2. G
DP
per c
apita
in E
U c
ount
ries,
durin
g 20
04–2
012
(sou
rce:
per
sona
l pro
cess
ing
of d
ata
colle
cted
from
Eur
osta
t)
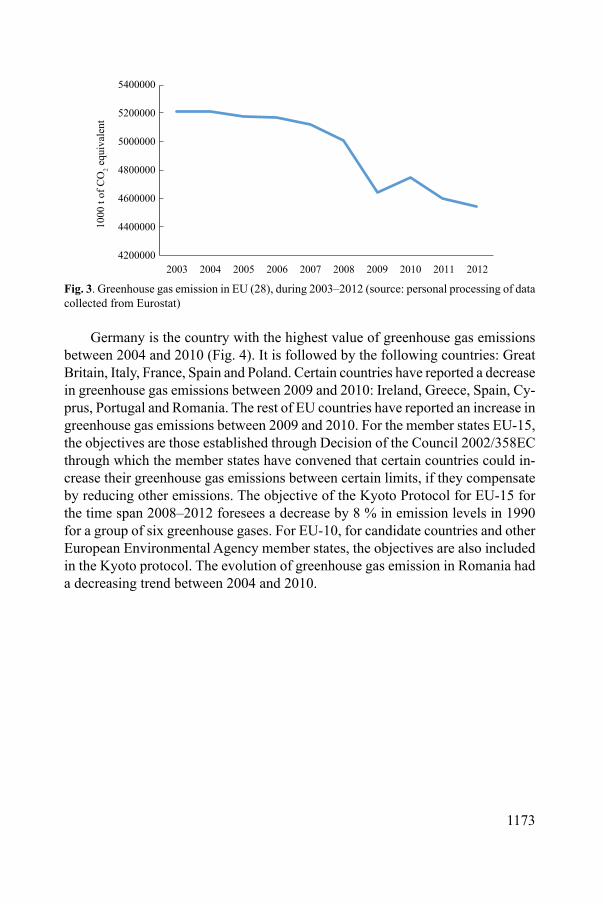
1173
4200000
4400000
4600000
4800000
5000000
5200000
5400000
2003 2004 2005 2006 2007 2008 2009 2010 2011 2012
1000
t of
CO
2 equ
ival
ent
Fig. 3. Greenhouse gas emission in EU (28), during 2003–2012 (source: personal processing of data collected from Eurostat)
Germany is the country with the highest value of greenhouse gas emissions between 2004 and 2010 (Fig. 4). It is followed by the following countries: Great Britain, Italy, France, Spain and Poland. Certain countries have reported a decrease in greenhouse gas emissions between 2009 and 2010: Ireland, Greece, Spain, Cy-prus, Portugal and Romania. The rest of EU countries have reported an increase in greenhouse gas emissions between 2009 and 2010. For the member states EU-15, the objectives are those established through Decision of the Council 2002/358EC through which the member states have convened that certain countries could in-crease their greenhouse gas emissions between certain limits, if they compensate by reducing other emissions. The objective of the Kyoto Protocol for EU-15 for the time span 2008–2012 foresees a decrease by 8 % in emission levels in 1990 for a group of six greenhouse gases. For EU-10, for candidate countries and other European Environmental Agency member states, the objectives are also included in the Kyoto protocol. The evolution of greenhouse gas emission in Romania had a decreasing trend between 2004 and 2010.

1174
7800
0
8000
0
8200
0
8400
0
8600
0
8800
0
9000
0
9200
0
9400
0 2004
2005
2006
2007
2008
2009
2010
2011
2012
GG
E_AU
STR
IA
1160
00
1200
00
1240
00
1280
00
1320
00
1360
00
1400
00
1440
00
1480
00
2004
2005
2006
2007
2008
2009
2010
2011
2012
GG
E_BE
LGIU
M
5600
0
5800
0
6000
0
6200
0
6400
0
6600
0
6800
0
7000
0 2004
2005
2006
2007
2008
2009
2010
2011
2012
GG
E_BU
LGAR
IA
2600
0
2700
0
2800
0
2900
0
3000
0
3100
0
3200
0
3300
0 2004
2005
2006
2007
2008
2009
2010
2011
2012
GG
E_C
RO
ATIA
9200
9400
9600
9800
1000
0
1020
0
1040
0
1060
0 2004
2005
2006
2007
2008
2009
2010
2011
2012
GG
E_C
YPR
US
1280
00
1320
00
1360
00
1400
00
1440
00
1480
00
2004
2005
2006
2007
2008
2009
2010
2011
2012
GG
E_C
ZEC
H
4800
0
5200
0
5600
0
6000
0
6400
0
6800
0
7200
0
7600
0 2004
2005
2006
2007
2008
2009
2010
2011
2012
GG
E_D
ENM
ARK
1600
0
1700
0
1800
0
1900
0
2000
0
2100
0 2004
2005
2006
2007
2008
2009
2010
2011
2012
GG
E_ES
TON
IA
6000
0
6400
0
6800
0
7200
0
7600
0
8000
0
8400
0 2004
2005
2006
2007
2008
2009
2010
2011
2012
GG
E_FI
NLA
ND
4800
00
4900
00
5000
00
5100
00
5200
00
5300
00
5400
00
5500
00
5600
00
2004
2005
2006
2007
2008
2009
2010
2011
2012
GG
E_FR
ANC
E
9000
00
9200
00
9400
00
9600
00
9800
00
1000
000
1020
000
1040
000 20
0420
0520
0620
0720
0820
0920
1020
1120
12
GG
E_G
ERM
ANY
1100
00
1150
00
1200
00
1250
00
1300
00
1350
00
1400
00
2004
2005
2006
2007
2008
2009
2010
2011
2012
GG
E_G
REE
CE
6000
0
6400
0
6800
0
7200
0
7600
0
8000
0 2004
2005
2006
2007
2008
2009
2010
2011
2012
GG
E_H
UN
GAR
Y
5600
0
5800
0
6000
0
6200
0
6400
0
6600
0
6800
0
7000
0 2004
2005
2006
2007
2008
2009
2010
2011
2012
GG
E_IR
ELAN
D
4400
00
4600
00
4800
00
5000
00
5200
00
5400
00
5600
00
5800
00
2004
2005
2006
2007
2008
2009
2010
2011
2012
GG
E_IT
ALY
1080
0
1100
0
1120
0
1140
0
1160
0
1180
0
1200
0 2004
2005
2006
2007
2008
2009
2010
2011
2012
GG
E_LA
TVIA
2000
0
2100
0
2200
0
2300
0
2400
0
2500
0
2600
0
2700
0 2004
2005
2006
2007
2008
2009
2010
2011
2012
GG
E_LI
THU
ANIA
1160
0
1200
0
1240
0
1280
0
1320
0 2004
2005
2006
2007
2008
2009
2010
2011
2012
GG
E_LU
XEM
B
2850
2900
2950
3000
3050
3100
3150
2004
2005
2006
2007
2008
2009
2010
2011
2012
GG
E_M
ALTA
1900
00
1950
00
2000
00
2050
00
2100
00
2150
00
2200
00
2004
2005
2006
2007
2008
2009
2010
2011
2012
GG
E_N
ETH
ERLA
ND
S
3850
00
3900
00
3950
00
4000
00
4050
00
4100
00
4150
00
4200
00
2004
2005
2006
2007
2008
2009
2010
2011
2012
GG
E_PO
LAN
D
6800
0
7200
0
7600
0
8000
0
8400
0
8800
0 2004
2005
2006
2007
2008
2009
2010
2011
2012
GG
E_PO
RTU
GAL
1150
00
1200
00
1250
00
1300
00
1350
00
1400
00
1450
00
1500
00
2004
2005
2006
2007
2008
2009
2010
2011
2012
GG
E_R
OM
ANIA
4200
0
4300
0
4400
0
4500
0
4600
0
4700
0
4800
0
4900
0
5000
0
5100
0 2004
2005
2006
2007
2008
2009
2010
2011
2012
GG
E_SL
OVA
KIA
1850
0
1900
0
1950
0
2000
0
2050
0
2100
0
2150
0 2004
2005
2006
2007
2008
2009
2010
2011
2012
GG
E_SL
OVE
NIA
3400
00
3600
00
3800
00
4000
00
4200
00
4400
00
2004
2005
2006
2007
2008
2009
2010
2011
2012
GG
E_SP
AIN
5600
0
5800
0
6000
0
6200
0
6400
0
6600
0
6800
0
7000
0 2004
2005
2006
2007
2008
2009
2010
2011
2012
GG
E_SW
EDEN
5600
00
5800
00
6000
00
6200
00
6400
00
6600
00
6800
00
7000
00
2004
2005
2006
2007
2008
2009
2010
2011
2012
GG
E_U
K
Fig.
4. G
reen
hous
e ga
s em
issi
on in
EU
cou
ntrie
s, du
ring
2004
–201
2 (s
ourc
e: p
erso
nal p
roce
ssin
g of
dat
a co
llect
ed fr
om E
uros
tat)

1175
MODEL: ANALYSIS OF THE CORRELATION BETWEEN THE GDP AND GREENHOUSE GAS EMISSION IN ROMANIA
In this paper, was studied the relation between socioeconomic development and the evolution of climate change in Romania with the help of the econometric model. In order to accomplish this goal, we analysed the correlation between the evolution of real GDP per capita (which is a key indicator of socioeconomic de-velopment) and greenhouse gas emissions (which is the key indicator of climate change). We calculated the correlation between the GDP and greenhouse gas emissions for each analysed year (2004–2012) and analysed the intensity of the relation between the two indicators. The study is based on data from the period 2004–2012 in Romania and we turned to statistics for their interpretation, which allowed calculating the correlation coefficient for the two variables: the independ-ent variable – GDP_romania, and the dependent variable – Total greenhouse gas emissions – GGE_romania. With the help of the Eviews statistical package, we have performed a series of statistical tests meant to provide a more accurate view on the evolution of both the GDP and the GGE in Romania from 2004 to 2012.
It is noticed that the average value of the GDP indicator for the interval 2004–2012 is 4322.222 euro per inhabitant, with a variation between a minimum of 3600 (recorded at the end of 2004) and a maximum of 4800 euro per inhabitant (recorded at the end of 2008) (Fig. 5).
0
1
2
3
4
5
3500 3750 4000 4250 4500 4750 5000
Series: GDP_ROMANIASample 2004 2012Observations 9
Mean 4322.222Median 4500.000Maximum 4800.000Minimum 3600.000Std. dev. 429.470Skewness –0.723841Kurtosis 2.086934
Jarque-Bera 1.098551Probability 0.577368
Fig. 5. GDP_romania: descriptive statistics (source: personal processing on Eviews software)
The average value for the GGE indicator for the interval 2004–2012 is 131 769.1 (1000 t of CO2 equivalent), with a variation between a minimum of 115 799 (1000 t of CO2 equivalent) (recorded at the end of 2010) and a maximum of 144 777 (1000 t of CO2equivalent) (measured at the end of 2006) (Fig. 6).
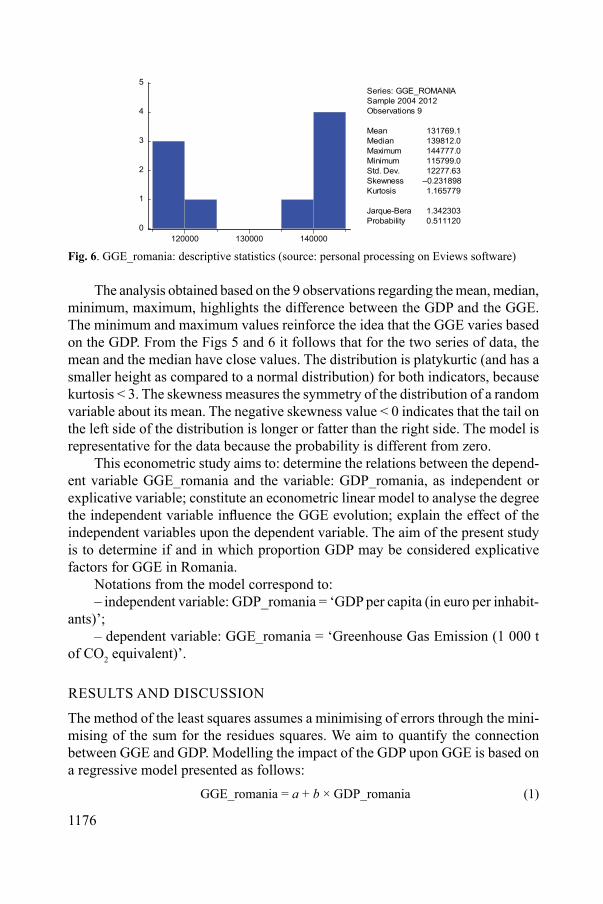
1176
0
1
2
3
4
5
120000 130000 140000
Series: GGE_ROMANIASample 2004 2012Observations 9
Mean 131769.1Median 139812.0Maximum 144777.0Minimum 115799.0Std. Dev. 12277.63Skewness –0.231898Kurtosis 1.165779
Jarque-Bera 1.342303Probability 0.511120
Fig. 6. GGE_romania: descriptive statistics (source: personal processing on Eviews software)
The analysis obtained based on the 9 observations regarding the mean, median, minimum, maximum, highlights the difference between the GDP and the GGE. The minimum and maximum values reinforce the idea that the GGE varies based on the GDP. From the Figs 5 and 6 it follows that for the two series of data, the mean and the median have close values. The distribution is platykurtic (and has a smaller height as compared to a normal distribution) for both indicators, because kurtosis < 3. The skewness measures the symmetry of the distribution of a random variable about its mean. The negative skewness value < 0 indicates that the tail on the left side of the distribution is longer or fatter than the right side. The model is representative for the data because the probability is different from zero.
This econometric study aims to: determine the relations between the depend-ent variable GGE_romania and the variable: GDP_romania, as independent or explicative variable; constitute an econometric linear model to analyse the degree the independent variable influence the GGE evolution; explain the effect of the independent variables upon the dependent variable. The aim of the present study is to determine if and in which proportion GDP may be considered explicative factors for GGE in Romania.
Notations from the model correspond to: – independent variable: GDP_romania = ‘GDP per capita (in euro per inhabit-
ants)’; – dependent variable: GGE_romania = ‘Greenhouse Gas Emission (1 000 t
of CO2 equivalent)’.
RESULTS AND DISCUSSION
The method of the least squares assumes a minimising of errors through the mini-mising of the sum for the residues squares. We aim to quantify the connection between GGE and GDP. Modelling the impact of the GDP upon GGE is based on a regressive model presented as follows: GGE_romania = a + b × GDP_romania (1)

1177
Table 1 shows that for the independent variable GDP_romania.a = 201082.9 and b = –16.03662; this leads to the equation:
GGE_romania= 201082.9 –16.03662 × GDP_romania (2)
Table 1. Characteristics of the regression modelDependent variable – GGE_ROMANIA, method – least squares; date – 03/17/15 time – 17:34; sample: 2004–2012, included observations – 9
Variable Coefficient Std. error t-Statistic Probability C 201082.9 38831.64 5.178328 0.0013GDP_ROMANIA –16.03662 8.945018 –1.792799 0.1161R2 0.314675 mean dependent variable 131769.1Adjusted R2 0.216771 standard deviation depend-
ent variable12277.63
SE of regression 10865.73 Akaike info criterion 21.61775Sum squared residual 8.26E+08 Schwarz criterion 21.66157Log likelihood –95.27986 F-statistic 3.214128Durbin-Watson statistics 0.970944 Probability (F-statistic) 0.116101Source: Data collected by the authors and operated inside Eviews software package; S.E. of regres-sion is a summary measure based on estimated variance of the residuals.
The F-test measures how well the independent variable explains the evolution of the dependent variable. The R2indicator shows whether the regression model is well specified, and what percentage of the total variance of the dependent variable is due to the independent variable. Its value may be between 0 and 1, and the closer its value to 1, the better specified the regression. R2 is 0.314675, which means that 31.46% of the variances of the GGE variable are explained by the GDP. But there are also other influence variables of the GGE, not only the GDP. By analysing the data in Table 2, we conclude that the absolute value of the standard error of the regression coefficient is inferior to the value of the coefficient, which comes to strengthen the truthfulness of its estimation.
The value of the estimated parameter is –16.03662 which means that a growth by 1% in the GDP determines a drop in the GGE by 16.03662. The standard er-ror of the regression is high enough, which indicates that the model explains the dependence of the GGE variable analysed.
The Durbin–Watson test recorded a value of approximately 0.970 (0.970 > 0.50) which indicates that there is a correlation between the GDP and GGE.
CONCLUSIONS
The European Union is preparing to cross the threshold of a unique era in the field of energy policy. Energy markets have somewhat been protected from the recent

1178
effects of turbulences on the world market, as a consequence of liberalisation, significant production and supply capabilities and import possibilities.
As a result of the calculation of the correlation coefficient between the GDP and Total greenhouse gas emissions in Romania between 2004 and 2012, we found that there is indeed a correlation between the two indicators.
The correlation coefficient was calculated by introducing the data (GDP and Total greenhouse gas emissions) from Romania in the time frame 2004–2012. Fol-lowing the analysis of the correlation coefficient between the GDP and the Total greenhouse gas emissions between 2004 and 2012, we conclude that:
● 31.46% of the GGE variable variances are explained by the GDP;● there is a reverse correlation between the GDP and the Total greenhouse gas
emissions in the sense that if the GDP grows, the GGE drops, because the value of the estimated parameter is negative.
● the Durbin–Watson test recorded a value of approximately 0.970 (0.970 > 0.50), which indicates that we have a rather strong correlation between the GDP and the GGE.
Regarding the future directions in research, we envisage to continue monitoring the evolution of the GDP and the Greenhouse Gas Emission in Romania, as well as in other European countries, as well as to study other factors which influence Greenhouse Gas Emission.
REFERENCES1. S. APAK, F. ACIKGOZ: Renewable Energy Zones as a Strategic Alternative with Environmental
and Economic Aspects of Sustainability. The Case of Balkans. J Environ Prot Ecol, 12 (4), 1860 (2011).
2. F. C. MOORE, M. C. MacCRACKEN: Lifetime-leveraging: An Approach to Achieving Interna-tional Agreement and Effective Climate Protection Using Mitigation of Short-lived Greenhouse Gases. Int J Climate Change Strategies Manage, 1 (1), 42 (2009).
3. R. SATHIENDRAKUMAR: Greenhouse Emission Reduction and Sustainable Development. Int J Social Econ, 30 (12), 1233 (2003).
4. D. ASIM, R. AMITAVA, B. GAUTAM, S. HIRANMAY: Green Energy Sources (GES) Selection Based on Multi-criteria Decision Analysis. Int J Energy Sector Manage, 5 (2), 271 (2011).
5. A. O. LANSINK, C. ONDERSTEIJN: Energy Productivity Growth in the Dutch Greenhouse Industry. Am J Agr Econ, 88 (1), 124 (2006).
6. C. W. CLARK: Mathematical Models in the Economics of Renewable Resources. SIAM Review, 21 (1), 81 (1979).
7. F. K. VOSNIAKOS, S. C. IOANNIDIS: The Industrial Society towards Ecology. J Environ Prot Ecol, 4 (1), 153 (2003).
8. G. BANDOC, M. GOLUMBEANU: Climate Variability Influence to the Potential Evapotran-spiration Regime of the Sfantu Gheorghe Delta Shore. J Environ Prot Ecol, 11 (1), 172 (2010).
9. L. STANKEVICIUTE, P. CRIQUI: Energy and Climate Policies to 2020: the Impacts of the European ‘20/20/20’ Approach. Int J Energ Sector Manag, 2 (2), 252 (2008).
Received 9 June 2015 Revised 21 July 2015
1179
* For correspondence.
Journal of Environmental Protection and Ecology 16, No 3, 1179–1193 (2015)
Environmental economics
ENVIRONMENTAL ASSESSMENT OF THE PROJECTS FINANCED BY EUROPEAN UNION IN ROMANIA. EX-POST APPRAISAL AND LESSONS THAT CAN BE LEARNT
A. TAMAS-SZORA, D.-C. DANULETIU*, A. SOCOL, A.-E. DANULETIU
‘1 Decembrie 1918’ University of Alba Iulia, 15–17 Unirii Street, 510 009 Alba Iulia, Romania E-mail: [email protected]
Abstract. The article focuses on the role of the European Union structural funds in the financing of the environmental priorities in Romania. Our overall analysis is based on the results of the European financing policy implementation between 2007–2013 and emphasis on the structure of the eligible environment expenses and on the proportion of the environmental aspects within the evaluation factors of the projects financed in the following operational programmes: the National Rural Development Programme (NRDP), the Sectoral Operational Programme Increase of Economic Competitiveness (SOPIEC) and the Regional Operational Programme (ROP). The paper studied these mentioned operational programmes, in order to identify the quantitative and qualitative aspects regarding the accessing the projects exclusively from environment aspects perspective. The results of the analysis suggest that in the programming exercise 2007–2013 were, in both the conceptual and the practical spheres, impediments in accessing the environment measures of the studied operational programmes. The paper pleads for the reconfiguration of the evaluation criteria of the projects during 2014–2020 for achieving a higher level of the financing of the environment priorities, that will contribute to the sustainable development in Romania.
Keywords: environmental finance, EU Sectoral Operational Programme, assessment criteria.
AIMS AND BACKGROUND
Searching for solutions to the environmental needs and problems does not repre-sent a recent subject for the national authorities or the international institutions. For decades in the last century, this concern preoccupied and aroused the interest of the policy-makers in developing the economic instruments that could sustain and finance the environmental issues. In these circumstances, new concepts arose as elements of the environmental economics area, like ‘environmental finance’, ‘green finance’, ‘green economy’ or the others similar. The 90’ could be identified as a turning point in the environmental economics cares and in the searching for solutions to environmental problems. Major instruments able to distribute funds
1180
for environmental needs are the structural funds of the European Union. In the programming exercise 2007–2013 Romania had the important gaps regarding the environment quality, to which the Sectoral Operational Programme Environment was configured to response for improving of the living standards and the environ-ment, focusing in particular on meeting the environmental EU legislation.
We offer a perspective on the environmental financing issues by the other three programmes active in Romania and inventory the environmental aspects that matter in the financing of the projects by the National Rural Development Programme (NRDP), the Sectoral Operational Programme Increase of Economic Competitive-ness (SOPIEC) and the Regional Operational Programme (ROP). Also, we compare 10 276 representative projects financed in Romania by RNDP (10 238), SOPIEC (27) and ROP (11) in order to find the proportion of the environmental aspects in the assessment grid of the projects and how important were the environmental factors in the projects evaluation before financing them.
Environmental needs in Romania were in 2007, at the moment of EU ac-cession, and still are very important. For solving all the environmental needs is essential to find financial sources and structural funds were one of this source. Generally, Sectoral Operational Programme Environment (SOPE) was created to solve that kind of problems, but also other kind of EU funds could be used to address environmental problems. Environmental problems could be generated by industry, agriculture, daily human activities1,2. There could be also natural disasters that generate important damages. The effects of the environmental problems on the human life quality are very diverse: a scarcity of food, a bad environment for living, natural hazards that could lead to natural disasters, resources abatement, etc. So, there is a necessity to take measures to protect life from negative effects of environmental problems, measures that include earthquake, landslide and flood hazard mitigation3, an optimum management of renewable and exhaustible resources4, using new, efficient and ‘greener’ technologies in agriculture or indus-try2,5,6. Because some of the environmental problems are generated by agriculture or industry, EU tried to address to these problems not just through environmental funds, but also through funds for these sectors, trying to stimulate economic agents to act in a friendly way with the environment.
Some partial analyses for Romania were done by Rotaru7, Neculita and Moga8, CEEweb for Biodivesity9, but our analysis go beyond that, by integrating all the EU funds (RNDP, SOPIEC and ROP, excepting that for environment) which could be used for financing environmental problems and by studying different applica-tions. Our analysis also notices the effect of the low absorption rate (Table 1) on solving environmental problems.
This fact permits us to plead for more importance of the environmental fac-tors in the evaluation criteria of projects financed by RNDP, SOPIEC and ROP.
1181
Table 1. Absorption rate for NRDP, SOPIEC and ROPFund EU allocations (euro) EU payments
(euro, on 28.02.2015)Absorption rate (%)
NRDP 8124198745 7408513388 91.35SOPIEC 2536646054 1454277829 57.33ROP 3966021762 2266258841 57.14
EXPERIMENTAL/APPLICATION
PARTICULARITIES OF THE ENVIRONMENT ASPECTS WITHIN THE NATIONAL RURAL DEVELOPMENT PROGRAMME (NRDP)
NRDP 2007–2013 is financing programme for rural areas and especially attend-ance is addressed to the environmental problems. The programme is divided into 4 axes (with 22 measures) and 2 distinct measures. First at all, for all the public or private investment projects it is necessary to obtain the environment agreement, in accordance with the national legislation in force. More than this, the investment projects that can significantly affect the environment due to, among others, their type, size or localisation represent the subject of the strategic environmental assess-ment (SEA) before the issuance of the environment agreement. SEA establishes the measures for preventing, reducing, and where possible, compensating the sig-nificant adverse effects of the project over the environment factors and contributes to the decision making process for issuing/rejecting the environment agreement. Another way to stimulate environmental concerns into the projects financed by NRDP is by the score awarded through the evaluation criteria used to approve the projects. Table 2 synthesises the measures that have scores for environmental problems in the evaluation criteria and the importance of those factors in the total score that a project could obtain.
Also, the projects financed by Leader axis contribute to the improvement of the local governance and promotion of the endogenous potential of the territories10. Measures 41 and 421, by which local action groups will implement local develop-ment strategies in the selected territories with a view to achieving the objectives of the axes 1, 2 and 3 from EAFRD, according to the strategy drawn up at local level and materialised in projects individually made or through cooperation with other LAGs/partnerships10. For the measures 41 and 421 of Axis Leader, the pay-ment in advance is being granted to the beneficiaries who submit projects for the above mentioned measures10.
1182
Table 2. Importance of environmental factors on the evaluation of projects financed by NRDPAxis Measure Scores for environmental problems Distinct
budget for environ-mental
problemsI 112 15 points out of a maximum of 100 points – 15% no
121 (on line appli-cation)
(a) The vegetal sector – 24 points out of a max. of 100 points (24%)(b) Animal breeding sector – 14 points out of a max. of 100 points (14%)(c) Standards for animal breeding sector – 15 points out of a max. of 100 points (15%)Note: For applications on c) priority before 14.10.2013, the score for environmental problems was 55%.
yes
121 (fam-ily farm)
(a) The vegetal sector – 20 points out of a max. of 100 points (20%)(b) Animal breeding sector – 17 points out of a max. of 100 points (17%)
yes
122 30 points out of a max. of 100 points (30%) no123 (a) units that implement standards for raw milk – 18 points
out of a max. of 100 points (18%)(b) units that do not implement standards for raw milk – 15 points out of a max. of 100 points (15%)
yes
125 (sub-measure 125a*)
15 points out of a max. of 50 points (30%) yes
125 (sub-measure 125c**)
50 points out of a max. Of 50 points (100%) no
141 15 points out of a max. of 100 points (15%)Note: For applications made before 14.10.2013 in order to ful-fill EU standards for water protection against nitrate pollution from agricultural sources, the score for environmental prob-lems was of 30 points. To obtain the score, the applicant had to prove he accessed measure 121 for doing such investments.
no
II 221 15 points out of a max. of 100 points (15%).Note: For benefitting of this score, the farmer have to respect Good Agricultural and Environmental Conditions for the land that remain not afforested.
no
III 312 5 points out of a max. of 100 points (5%) yes313*** 10 points out of a max. of 100 points (10%) no322 25 points out of a max. of 100 points (25%) no
Note: * – 125a – ‘Irrigation and other land improvement works’; ** – ‘Construction, reconstruction and modernisation of infrastructure for prevention and flood protection’; *** – only sub-measures ‘Investments for the infrastructure related to accommodation facilities’ and ‘Investments for leisure activities’.
1183
We have to make some observations based on the information in Table 2. There are measures (that have distinct budgets for environment) that finance investments included into European Economic Recovery Plan (EERP). For axis 1, additional funding of the measures 121, 123 and 125 cover investments in renewable energy, in the energy usage efficiency, in new technologies that contribute to ensuring a sustainable development and in perennial energetic cultures, but also investments for water management savings by carrying out investments in efficient irrigation systems, inclusively of those for water storage and for waste water treatment, for producing biogas using organic wastes and improving the efficiency of nitrogen fertilisers usage and storage. For axis 3, measure 312 is supplemented through funds of EERP for the purchase of equipments for producing energy from renew-able sources. Also, we have to note that for measures 112 and 141, the score is awarded only for the applicants that access also the measure for agro-environment (measure 214).
Another impact on the environment is the support offered by the measures from axis 2. This axis includes measures that grant single area payments for dif-ferent reasons and that do not have scores for evaluation. In this respect, measure 211 gives support for mountain areas and 212 for less favoured areas-other than mountain area, but this support is conditioned by the farmers agreement to re-spect Good Agricultural and Environmental Conditions (GAEC). Measure 214 consists in paying a single area payment to farmers who voluntarily undertake agri-environment commitments for a period of 5 years from the date of taking the commitment. So, the measure supports the sustainable development of rural areas, the payments granted under this measure encouraging farmers to introduce or continue to apply agricultural production methods compatible with the protection and improvement of the environment, in particular biodiversity, landscape and its features, natural resources and genetic diversity. Supplementary, we can notice that the agri-environmental training for farmers is eligible under measures 111 and 143, which could have impact on the environment, but in the criteria section there is not a criterion related to the environmental problems.
Another way to stimulate sustainable investments is by increasing support in-tensity for some measures. Increasing the support intensity by 10% within Measure 121 for investments on improving the efficiency of nitrogen fertilisers, installations for waste water treatment in agricultural holdings and within the processing and trading processes, is addressed to compensate the additional costs supported by the farmers by adaptation of the agriculture and forestry to the climate changes, taking into consideration that these actions do not produce profit. But this increase is only for projects that do not include production and use of renewable energy and are not associative forms. Also, the aid increase by 10% for investments made into the natural protected areas (Natura 2000 network).
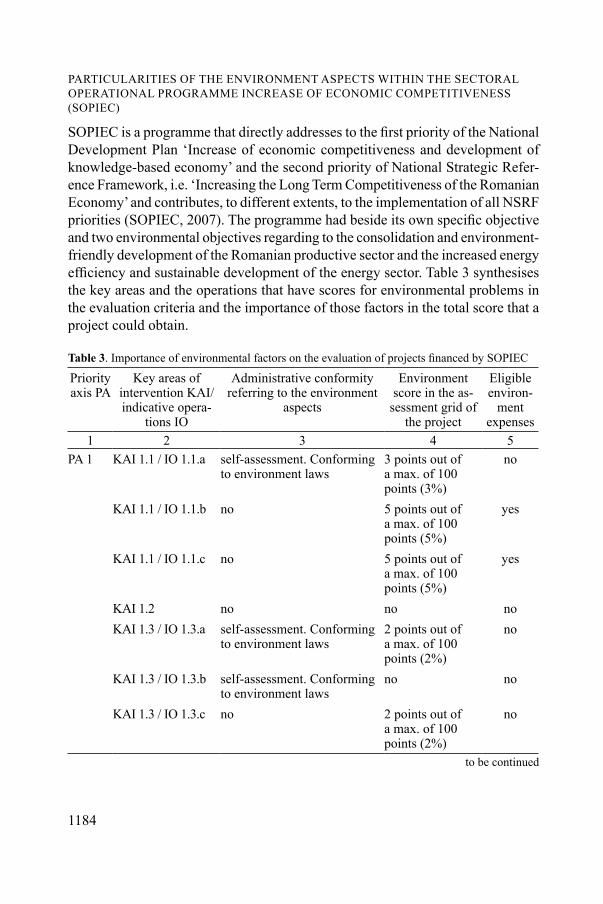
1184
PARTICULARITIES OF THE ENVIRONMENT ASPECTS WITHIN THE SECTORAL OPERATIONAL PROGRAMME INCREASE OF ECONOMIC COMPETITIVENESS (SOPIEC)
SOPIEC is a programme that directly addresses to the first priority of the National Development Plan ‘Increase of economic competitiveness and development of knowledge-based economy’ and the second priority of National Strategic Refer-ence Framework, i.e. ‘Increasing the Long Term Competitiveness of the Romanian Economy’ and contributes, to different extents, to the implementation of all NSRF priorities (SOPIEC, 2007). The programme had beside its own specific objective and two environmental objectives regarding to the consolidation and environment-friendly development of the Romanian productive sector and the increased energy efficiency and sustainable development of the energy sector. Table 3 synthesises the key areas and the operations that have scores for environmental problems in the evaluation criteria and the importance of those factors in the total score that a project could obtain.
Table 3. Importance of environmental factors on the evaluation of projects financed by SOPIEC
Priority axis PA
Key areas of intervention KAI/ indicative opera-
tions IO
Administrative conformity referring to the environment
aspects
Environment score in the as-
sessment grid of the project
Eligible environ-
ment expenses
1 2 3 4 5PA 1 KAI 1.1 / IO 1.1.a self-assessment. Conforming
to environment laws 3 points out of a max. of 100 points (3%)
no
KAI 1.1 / IO 1.1.b no 5 points out of a max. of 100 points (5%)
yes
KAI 1.1 / IO 1.1.c no 5 points out of a max. of 100 points (5%)
yes
KAI 1.2 no no noKAI 1.3 / IO 1.3.a self-assessment. Conforming
to environment laws2 points out of a max. of 100 points (2%)
no
KAI 1.3 / IO 1.3.b self-assessment. Conforming to environment laws
no no
KAI 1.3 / IO 1.3.c no 2 points out of a max. of 100 points (2%)
no
to be continued
1185
1 2 3 4 5PA2 KAI 2.1 / IO 2.1.1 self-assessment. Contribution
to the environment protec-tion and to the reducing of the consumptions (feedstock, materials, energy, fuel)
no no
KAI 2.1 / IO 2.1.2 no no noKAI 2.2 / IO 2.2.1 no no yesKAI 2.2 / IO 2.2.2 canceled action cancelled action cancelled
actionKAI 2.2 / IO 2.2.3 no no yesKAI 2.2 / IO 2.2.4 no no noKAI 2.3 / IO 2.3.1 self-assessment. Contribution
to the environment protec-tion and to the reducing of the consumptions (feedstock, materials, energy, fuel)
no no
KAI 2.3 / IO 2.3.2 self-assessment. Contribution to the environment protec-tion and to the reducing of the consumptions (feedstock, materials, energy, fuel)
no no
KAI 2.3 / IO 2.3.3 self-assessment. Contribution to the environment protec-tion and to the reducing of the consumptions (feedstock, materials, energy, fuel)
no no
PA3 KAI 3.1 / IO 3.1.1 no no noKAI 3.1 / IO 3.1.2 no No NoKAI 3.1 / IO 3.1.3 no No NoKAI 3.1 / IO 3.1.4 no No NoKAI 3.2 / IO 3.2.1 no No NoKAI 3.2 / IO 3.2.2 no no noKAI 3.2 / IO 3.2.3 no no noKAI 3.2 / IO 3.2.4 no no noKAI 3.3 / IO 3.3.1 no no noKAI 3.3 / IO 3.3.2 no no no
Continuation of Table 3
to be continued
1186
1 2 3 4 5PA 4 KAI 4.1 / IO 4.1.1 self-assessment. environment
criteria. Evidence of legal step in obtaining the environment agreement
5 points out of a max. of 100 points (5%)
yes
KAI 4.1 / IO 4.1.2 self-assessment. environment criteria. Evidence of legal step in obtaining the environment agreement
no yes
KAI 4.1 / IO 4.1.3 self-assessment. environment criteria. Conforming to envi-ronment laws. Existence of the environment agreement
no no
KAI 4.2 / IO 4.2.1 self-assessment. Environment criteria. Evidence of legal step in obtaining the environment agreement
no yes
KAI 4.3 / IO 4.3.1 environment impact assess-ment according to the 85/337/EEC Directive
no no
PA 5 KAI 5.1 / IO 5.1.1 no no noKAI 5.1 / IO 5.1.2 no no no
We can notice that SOPIEC 2007–2013 allowed for environmental aspects only non significant score (max. 5%) in the assessment grid of the projects and only for six indicative operations. The remainder operations do not require or mark the environment criteria in the evaluation of the projects. Also, the eligible environment expenses are limited just for seven indicative operations and they refer to the support for implementation and certification of environment management systems (or EMAS registration). Although the programme states that sustains the environment friendly investments in some indicative operations, we do not identify the quantifying environmental aspects that matter in the evaluation of the projects.
According to Table 3, there are criteria for proving the conformity with the environment laws, especially by self-assessment. Only IO 4.3.1 benefits by the Environment Impact Assessment according to the 85/337/EEC Directive.
PARTICULARITIES OF THE ENVIRONMENT ASPECTS WITHIN THE REGIONAL OPERATIONAL PROGRAMME (ROP)
Analysis of terms regarding funding requirements for environmental measures. As regards the technical and financial evaluation, as results from documents at the beneficiaries disposal, the evaluation guidelines mention that the minimum score
Continuation of Table 3
1187
in the evaluation grid for the sub criterion ‘Environment protection and sustainable development’ is awarded if the eligibility criterion is met. If the evaluators award lower scores than the minimum from the grid, they have to explain their decision by making clear references to the regulations and laws that the applicants have not observed in their funding applications. We will now further detail the particular aspects of the evaluation process.
KAI 2/3.1 – Environmental protection and energy efficiency (maximum 6 points):– 3 points – The project meets the minimum legal requirements on environ-
mental protection and energy efficiency – (according to the urban planning certifi-cate and environmental technical sheet – no environmental impact, no significant environmental impact, significant impact and has started the procedure to get the environmental agreement)
– 4 points – planned works for collecting and discharging water from the road. There are special areas planned for collecting waste from the parking lots along the route and their discharge has been taken into account (there are waste collection services in the nearby towns or villages, which can ensure the discharge of waste). The file contains measures for land restoration after the project implementation (building banks, levelling, planting trees and grass); the general estimate contains the costs of these works.
– 6 points – water collection and discharge works are planned. There are special areas planned for collecting waste from the parking lots along the route and their discharge has been taken into account (there are waste collection services in the nearby towns or villages, which can ensure the discharge of waste). The file contains measures for land restoration after the project implementation. The rehabilitated road is an important support for public transportation (there are approved routes, used for permanent connections between different towns or villages that also use the rehabilitated road segment).
KAI 3.2/KAI 3.4 – Environmental protection, sustainable development and energy efficiency (maximum 6 points):
(a) The projects implements measures to improve environmental quality, for sustainable development and increase of energy efficiency (The estimate includes environmental protection works, the feasibility study plans the use of E.C. certi-fied materials, the feasibility study plans the observance of the latest standards of energy efficiency in buildings, other measures) (6 points).
(b) The project meets the minimum legal requirements regarding environmen-tal protection, sustainable development and energy efficiency (3 points).
KAI 4.1 – Sustainable development and energy efficiency (maximum 6 points):(a) The project implements measures to improve environmental quality and to
increase energy efficiency – 6 points. In addition to commitments to observe the minimum legal requirements, there are additional actions foreseen for environmen-
1188
tal protection and (promoting) energy preservation/increasing energy efficiency as well as methods to implement them. Scoring will take into account, among others, the feasibility of actions within the project budget context, the effectiveness of implementation methods, and the efficiency of implementation methods.
(b) The project meets the minimum legal requirements on environmental protection and energy efficiency – 3 points. The minimum law-regulated require-ments are identified.
KAI 4.3 – Promotion of sustainable development (environment protection and energy efficiency):
(a) The project implements measures to improve environmental quality and to increase energy efficiency >3<=6.
(b) The project observes the minimum legal requirements on environmental protection and energy efficiency >1<=3.
(c) The project observes the minimum legal requirements on environmental protection and energy efficiency >1<=3.
KAI 5.1 – Sustainable development and energy efficiency (maximum 6 points)– 3 points – The project meets the minimum legal requirements on environ-
mental protection and energy efficiency (according to the urban planning certifi-cate and environmental technical sheet – no environmental impact, no significant environmental impact, significant impact and has started the procedure to get the environmental agreement).
– 4 points – There are works planned for waste collection; the general estimate plans the costs of these works.
– 6 points – There are works planned for waste collection; the file includes measures for land restoration after the project implementation (green areas land-scaping, planting trees) the general estimate plans the costs of these works.
KAI 5.2 (a) The project implements measures to improve environmental quality and
increase energy efficiency. >4≤6. The applicants identify the potential impact on water, air, soil and underground, noise and vibrations and so on, during the investment period and during operation. They present all the measures in place to reduce the impact of construction works during the investment period and waste management measures during the operations period. All works and endowments necessary for environmental protection and mentioned in the land register and the written items from the technical and economical documentation are found in the general estimate or in the individual estimate. The applicant gives reasons for the technical solution adopted based on the conclusions of the energy efficiency audit (if the case).
(b) The project mentions measures to improve environmental quality and increase energy efficiency. >2 ≤ 4. The applicant partly identifies the potential
1189
impact on waters, air, soil and the underground, noise and vibrations and so on during the investment period and during the operation period. Only part of the measures to reduce the impact of construction work during the investment period and waste management measures during the operation period are presented. The necessary works and endowments for the increase of energy efficiency mentioned in the land register and written items in the technical and economic file are partly found in the general or individual estimate.
(c) The project observes the minimum legal requirements on environmental protection and energy efficiency. Environmental protection and energy efficiency measures are in general presented through references to the specific laws in force. The necessary works and endowments for environmental protection and energy efficiency increase are not found in the general or individual estimate 1 ≤ 2.
KAI 5.3 – Sustainable development (maximum 6 points). (a) The project implements innovative environmental protection measures –
3 ≤ 6 points. (b) The project meets the minimum legal requirements on environmental
protection – 0 < 3 points.
RESULTS AND DISCUSSION
Analyses of the manner of application of the evaluation criteria for ROP in the selection process are presented in Table 4. On this stage, we have identified the following significant aspects found in most of the applications: Materials and ma-chinery that meet the standards on energy efficiency and environmental protection are proposed; Standards on the energy efficiency of buildings are observed; the proposed works control thermal energy losses; The projects have carried out an energy efficiency audit; The applicant has described the sustainable development context and the project contribution to sustainable development; In the land regis-ter, the applicant has foreseen measures to improve environmental quality, waste management measures, land restoration, water, air and noise protection measures; Summary measures to improve environmental protection conditions are foreseen; Measures are mentioned, but they are not detailed.

1190
Table 4. Scoring criteria for environmental sample analysed projectsName of the pro-gramme
Axis KAI Criteria Scoring Project Assess-ment score
Score
ROP 1 1.1 1.14. Sustainability and energy efficiency
maximum 6 >3<=6 >1<=3
1 4.00 5.002 4.003 6.004 6.005 5.00
ROP 3 3.1 2.7. Environmental protectionand sustain-able development (max 6 pct)
maximum 6 >3<=6 >1<=3
1 5.00 4.672 5.003 4.00
ROP 3 3.2 Environmental protec-tion and sustainable de-velopment (max 6 pct)
maximum 6 >3<=6 >1<=3
1 4.00 4.00
ROP 3 3.4 Environmental protec-tionand sustainable de-velopment (max 6 pct)
maximum 6 a) – 6 b) – 3
1 4.00 4.672 5.003 5.00
ROP 4 4.1 Environmental protec-tion and sustainable development
maximum 6a) – 6b) – 3
1 5.00 5.00
ROP 4 4.3 1.4. Promoting sustain-able elopment (environ-mental protectionand energy efficiency)
maximum 6 >3<=6 >1<=3
1 1.50 2.962 2.503 3.004 3.005 4.006 3.507 3.008 2.009 3.00
10 1.0011 6.0012 3.0013 3.00
ROP 5 5.1 Sustainable development and energy efficiency
maximum 6a) – 6b) – 3
1 3.00 3.00
As regard the financing of environmental issues by NRDP, in Table 5 is ana-lysed the impact of financing environmental problems through a distinct budget in case of measures 121, 123, 125 and 312 (on the base of the final reports of selection public available). On the data in the table we could see that all the measures had an insignificant impact on the environment, just 13.43% of the projects having a
1191
distinct budget for environmental problems, but as regard the money budgeted for that direction, the percentage is just 1.46%.
Table 5. Projects financed by NRDP and analysed for inclusion of investments by EERP budgetsMeasure No of pro-
jects with budgets for
environment different
of 0
Total num-ber of
projects analysed
% Value of budg-ets for environ-ment different
Total value of budgets of projects analysed
%
121 22 661 3.33 2642270.38 282976458 0.93– animal sector 18 238 7.56 2161670.74 171905255 1.26– vegetal sector 4 423 0.95 480599.64 111071203 0.43123 44 1322 3.33 5284540.76 565952916 0.93125 a 88 2644 3.33 10569081.52 1131905832 0.93312 972 3755 25.89 33263869.63 1561033839 2.13Total 1126 8382 13.43 51759762.29 3541869045 1.46Source: authors adaptation from the public data provided by www.apadrp.ro.
As regards measures 112 and 141, which impose the necessity to access measure 214 ‘Agri-environmental payments’ as a condition to receive score for environmental issues in the application form, the situation for the session 2012 is seen in Table 6.
Table 6. Impact on the measures 112 and 141 on the environmental problemsMeasure No of
projectsNo of projects that ac-cessed measure 214
No of projects that did not access measure 214
%
112 986 318 668 32.25114 870 5 865 0.57
Total 1856 323 1533 17.40Source: authors adaptation from the public data provided by www.apadrp.ro.
Data in Table 6 show that an insignificant number of projects (for measure 141) or not many projects (for measure 114) accessed measure 214, so the envi-ronmental problems were not of big importance for farmers.
CONCLUSIONS
Environmental measures are insufficient stimulated in the three mentioned pro-grammes ROP, NPRD and SOPIEC by the management authorities that administrate those programmes and the potential beneficiaries introduce in their budgets and in the projects a low level of the environmental investments (ROP – the medium score

1192
is 4.6 points out of a max. 6 points; SOPIEC 1.5 points out of a max. 3 points or 3 points out of a max. 5 points for sustainable development criteria in two studied indicative operations).
Based on the study, we formulate some suggestions for improvement of access-ing funds for environmental issues in other EU funds, excepting that for environ-ment. First, there is a need to increase the visibility of environmental measures that are eligible for funding within the funding guidelines by introducing a distinctive section providing concrete information on eligible expenditure, types of activities, specific conditions, environmental impact evaluation, documentation, method of evaluation. This section should be, in our opinion, identical for all EU-funded programmes. Secondly, it is needed to increase the weight of evaluation criteria for environmental aspects from a maximum of 10% for the period 2007–2013 to a minimum of 15% for the period 2014–2020; in the case of ROP and NPRD, this increase should be achieved by increasing the score for the specific criterion related to an already implemented environmental standard or to a standard cur-rently in implementation. Thirdly, considering the lack of transparency of internal procedures used by intermediary organisations for the administrative evaluation of eligible activities and projects and for project evaluation, and considering the bottlenecks that project beneficiaries face because of these internal procedures containing new information, requirements and documents, which beneficiaries had no previous knowledge of, we suggest that the evaluation (scoring) guidelines of all funding programmes be approved by the management authority and placed at the beneficiaries’ disposal in a transparent manner. Finally, for the problems connected to the administrative documents required from the beneficiaries (urban planning certificates, documents issued by the environmental regulating authority and others) we suggest replacing all these documents with a self-evaluation sheet drawn up by the beneficiary and endorsed by a specialised environmental consult-ant to be used as a beneficiaries declaration on honour to meet all environmental requirements, under the sanction of rejecting their expenditure during the refund application stage.
REFERENCES1. M. POPA, M. GLEVITZKY, D. M. POPA, G.-A. DUMITREL: Study Regarding the Water Con-
tamination and the Negative Effects on the Population from the Blaj Area, Romania. J Environ Prot Ecol, 15 (4), 1543 (2014).
2. O. FALUP, I. MIRCEA, R. IVAN, I. IONEL: Novel Approach for the Current State of Greenhouse Gases Emissions. Romanian Case Study. J Environ Prot Ecol, 15 (3), 807 (2014).
3. K. PAPATHEODOROU, N. KLIMIS, B. MARGARIS, K. NTOUROS, K. EVANGELIDIS, A. KONSTANTINIDIS: An Overview of the EU Actions towards Natural Hazard Prevention and Management: Current Status and Future Trends. J Environ Prot Ecol, 15 (2), 433 (2014).

1193
4. L. UNGUREANU, L. STEFANESCU, M. CONSTANTINESCU, C. BARBU, V. MATEI: Optimum Management of Renewable and Exhaustible Resources. J Environ Prot Ecol, 14 (3), 1155 (2013).
5. S. UKU, I. MALOLLARI: Environmental and Economic Analysis of Irrigation Technologies for Improving Water Usage. J Environ Prot Ecol, 14 (1), 314 (2013).
6. I. KAIMAKAMIS, S. AGGELOPOULOS, A. PAVLOUDI: Agricultural Production and Climate Changes. A Case of Greece. J Environ Prot Ecol, 14 (2), 693 (2013).
7. S. A. ROTARU: Offer Funding for Environmental Protection in Romania. Rev General Manage, 18 (2), 78 (2013).
8. M. NECULITA, L. M. MOGA: Specialisation and Concentration of European Funds for Agri-culture and Fisheries in Central and Eastern European Countries. J Environ Prot Ecol, 15 (2), 660 (2014).
9. CEEweb for Biodivesity: Rural Development Programmes Performance in Central and Eastern Europe. Lessons Learnt and Policy Recommendations. 2013.
10. Ministry of Agriculture and Rural Development of Romania: National Rural Development Programme 2007–2013. Consolidated Version 2013.
Received 9 June 2015 Revised 25 July 2015
1194
* For correspondence.
Journal of Environmental Protection and Ecology 16, No 3, 1194–1202 (2015)
Environmental economics
ASSESSING THE IMPACT OF CORPORATE GOVERNANCE AND ECONOMIC DEVELOPMENT ON ENVIRONMENTAL PERFORMANCE: EMPIRICAL EVIDENCE FROM CROSS-COUNTRY SURVEY
P. R. RACHISANa, C. BOTA-AVRAMb*, I. RALUCAc, A. GROSANUb aFaculty of Business, Department of Business, Babes-Bolyai University, 7 Horea Street, Cluj Napoca, Romani bFaculty of Economics and Business Administration, Babes-Bolyai University, 58–60 Teodor Mihali Street, Cluj Napoca, Romania E-mail: [email protected] c‘1 Decembrie 1918’ University, 11–13 Nicolae Iorga Street, Alba Iulia, Romania
Abstract. The purpose of this empirical study is to investigate the extent to which some certain corporate governance characteristics and level of development exerts a positive and direct influence on the environmental performance. There are some studies that have emphasised the influence of various factors on environmental performance, but too few are addressing the influence of corporate governance and economic development on environmental performance, therefore our study intends to fill this gap. The analysis is using a cross-country approach, for a large sample of 125 countries from worldwide. A multiple regression analysis was applied over some certain indicators measuring corporate governance dimensions and level of development (as independent variables), computed by World Economic Forum in its series of reports – The Global Competitiveness Report 2014–2015 selected for 125 countries, while Environmental Performance Index from 2014 Environmental Per-formance Index Full Report was dependent variable. Our findings suggest that corporate governance dimensions together with level of development are good predictors for environmental performance.
Keywords: environmental performance, corporate governance, income classes, stage of develop-ment, multiple regression.
AIMS AND BACKGROUND
Environmental performance is one of increasing interest topics that the world continuously looks for answers today. This interest for ensuring environmental per-formance is supported by a lot of pressure exerted by the stakeholders, employees, customers, governments, social actors on managers to reduce the costs taking also in consideration the environmental impacts of their operations1. According to some academics2, environmental performance is about the entity relative performance in ensuring compliance with environmental regulations and policies, by looking for
1195
solutions to prevent environmental crises and disasters, while providing training for employees for environmental issues.
Prior literature is examining the influence of various external and internal factors on environmental performance. For instance, there are many studies investi-gating the linkage between stock prices and environmental performance, revealing that environmental performance is somewhat relevant for investors, but the results provided by literature are mixed3–7. Other scholars8 reviews the external factors that could have an impact on environmental performance of companies in South Africa, considering natural, social, economic and institutional environmental factors, while some authors9 found that, at European level, the entities with higher environmental performance disclose more information on the environmental impact, which is somewhat explained by the potential advantages provided for the users of financial and non-financial reporting in supporting their decisional process. But too few stud-ies are investigating the links between corporate governance dimensions and level of development and environmental performance. As some academics admits10–12 the linkage between economic performance and environmental performance has been too less empirically tested until now.
Specific gaps in the literature that emerge from these considerations and which the study addresses are whether corporate governance and level of development does influences environmental performance. By exploring the impact of some fac-tors on environmental performance, through a cross-country approach, this study is intended to achieve the following goals:
● To assess the influence of corporate governance dimensions on environmen-tal performance by providing empirical evidences in this regard;
● To evaluate the impact of level of development on environmental perfor-mance, through empirical tests;
● To provide suggestions for further development of an appropriate framework for ensuring environmental performance.
EXPERIMENTAL
The Environmental Performance Index is computed by the Yale Centre for Envi-ronmental Law and Policy (YCELP) and the Centre for International Earth Science Information Network (CIESIN) at Columbia University, in collaboration with the Samuel Family Foundation and the World Economic Forum. This index represents a method of quantifying and assessing the environmental performance of a state policies. First report – Pilot Environmental Performance Index was published in 2002 and before was preceded by the Environmental Sustainability Index, pub-lished in period 1999–2005. Until now, five EPI reports have been disclosed (the Pilot 2006 Environmental Performance Index, and the 2008, 2010, 2012, 2014 Environmental Performance Index). According to the authors of these reports the Environmental Performance Index (EPI) ranks ‘how well countries perform on

1196
high-priority environmental issues in two broad policy areas: protection of human health from environmental harm and protection of ecosystems. Within these two policy objectives the EPI scores country performance in nine issue areas comprised of 20 indicators. Indicators in the EPI measure how close countries are to meeting internationally established targets or, in the absence of agreed-upon targets, how they compare to the range of observed countries’13 .
The Global Competitiveness Report issued by the World Economic Forum is regarded as being one of the most comprehensive assessment reports on global competitiveness, including a range of significant indicators that highlight very im-portant information about the economic development and the necessary conditions for ensuring long-term prosperity. The advantages of using the information provided by this global report are various and some of them are given by the following:
● This report provides information for a significant number of variables (approximately 115 variables) grouped on 12 pillars that influence the level of competitiveness at each country-level.
● All the indicators and variables are computed by using the same meth-odology which ensures for researchers the necessary conditions for developing comparative studies.
● Finally, another relevant advantage is the significant number of countries included in the assessment report, which provides information for the same range of indicators, which allow developing comprehensive cross-country studies includ-ing larges samples of countries from all over the world.
The third dataset used was given by the classification of the economies of all countries with population of more than 30 000 citizens divided on income groups such as low income, lower middle income, upper middle income, high income non OECD, high income OECD reported in the World Bank report ‘Country and Lending Groups’ issued in July 2014. Within this report, the experts from World Bank classified the economies using as main criterion the gross national income (GNI) per capita. These income classifications are set each year on July 1, starting from the premise of establishing the validity of this official classification during the World Bank fiscal year (which ends on June 30).
Considering the major objective of this study, analysing the influence of some corporate governance characteristics and level of development on environmental performance, from the 2014 Environmental Performance Index Full Report and World Competitiveness Report 2014–2015 were extracted data for all selected in-dicators and the multiple regression statistical method was applied trying to obtain the premises in order to validate or invalidate the research hypotheses:
H0: Corporate governance, through its dimensions, efficacy of corporate boards and ethical behaviour of companies positively influences environmental performance.
H1: Economic development positively influences environmental performance.The variables used and data sources for these variables are disclosed in Table 1.

1197
Tabl
e 1.
Var
iabl
es a
nd d
ata
sour
ces
Varia
ble
nam
eTy
pe o
f var
iabl
eD
escr
iptio
nSo
urce
No
of sa
mpl
ed
coun
tries
12
34
5En
viro
nmen
tal
Perf
orm
ance
Inde
x (E
PI_S
core
)
depe
nden
t var
i-ab
leit
rang
es a
ppro
xim
atel
y fr
om 1
= e
xtre
mel
y w
eak
to 7
=
extre
mel
y st
rong
The
2014
Env
i-ro
nmen
tal P
erfo
r-m
ance
Inde
x
125
coun
tries
Effic
acy
of c
orpo
rate
bo
ards
(Effi
cacy
_B
oard
)
inde
pend
ent
varia
ble
it ra
nges
app
roxi
mat
ely
from
1 =
man
agem
ent h
as li
ttle
acco
unta
bilit
y to
inve
stor
s and
boa
rds t
o 7
= in
vest
ors a
nd
boar
ds e
xert
stro
ng su
perv
isio
n of
man
agem
ent d
ecis
ions
Wor
ld C
ompe
ti-tiv
enes
s Rep
ort
2014
–20
15
125
coun
tries
Ethi
cal b
ehav
iour
of
firm
s (Et
hic_
Beh
av-
iour
)
inde
pend
ent
varia
ble
it ra
nges
from
app
roxi
mat
ely
from
1 =
am
ong
the
wor
st in
th
e w
orld
to 7
= a
mon
g th
e be
st in
the
wor
ldW
orld
Com
peti-
tiven
ess R
epor
t 20
14 –
2015
125
coun
tries
Inco
me
clas
ses (
In-
com
e_C
lass
)in
depe
nden
t va
riabl
eec
onom
ies a
re d
ivid
ed a
ccor
ding
to 2
011
GN
I per
cap
ita,
usin
g th
e w
orld
ban
k at
las m
etho
d, re
sulti
ng th
e fo
llow
ing
grou
ps:
– lo
w in
com
e, $
1.02
5 or
less
– lo
wer
mid
dle
inco
me,
$1.
026
– $4
.035
;–
uppe
r mid
dle
inco
me,
$4.
036
– $1
2.47
5;–
high
inco
me,
$12
.476
or m
ore,
cla
ssifi
ed a
lso in
non
-OEC
D
and
OEC
D m
embe
rs.
Wor
ld B
ank
repo
rt ‘C
ount
ry a
nd
Lend
ing
Gro
ups’
issu
ed in
July
201
4125
coun
tries
to b
e co
ntin
ued
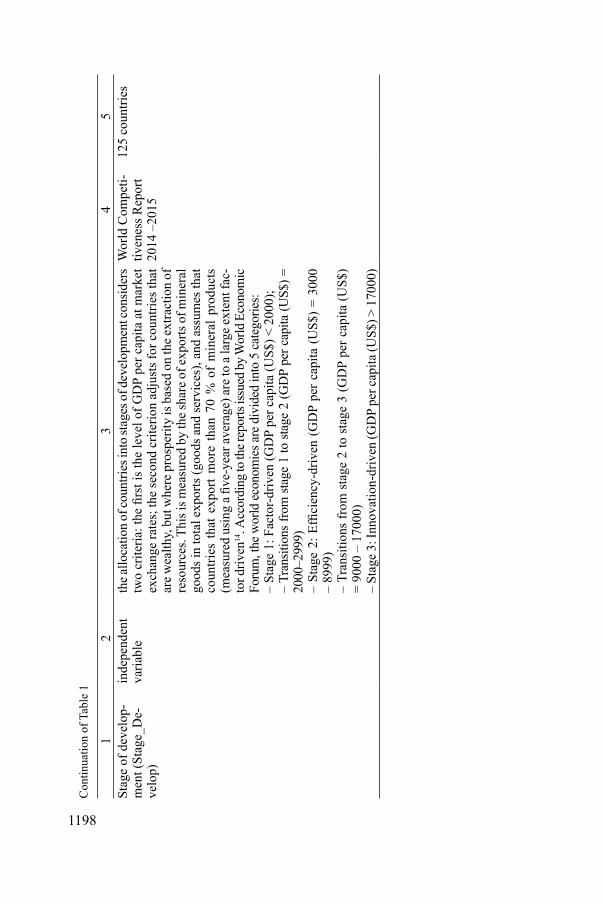
1198
12
34
5St
age
of d
evel
op-
men
t (St
age_
De-
velo
p)
inde
pend
ent
varia
ble
the a
lloca
tion
of co
untri
es in
to st
ages
of d
evel
opm
ent c
onsid
ers
two
crite
ria: t
he fi
rst i
s the
leve
l of G
DP
per c
apita
at m
arke
t ex
chan
ge ra
tes;
the
seco
nd c
riter
ion
adju
sts f
or c
ount
ries t
hat
are w
ealth
y, b
ut w
here
pro
sper
ity is
bas
ed o
n th
e ext
ract
ion
of
reso
urce
s. Th
is is
mea
sure
d by
the s
hare
of e
xpor
ts o
f min
eral
go
ods i
n to
tal e
xpor
ts (g
oods
and
serv
ices
), an
d as
sum
es th
at
coun
tries
tha
t ex
port
mor
e th
an 7
0 %
of
min
eral
pro
duct
s (m
easu
red
usin
g a
five-
year
ave
rage
) are
to a
larg
e ex
tent
fac-
tor d
riven
14. A
ccor
ding
to th
e rep
orts
issue
d by W
orld
Eco
nom
ic
Foru
m, t
he w
orld
econ
omie
s are
div
ided
into
5 ca
tego
ries:
– St
age
1: F
acto
r-driv
en (G
DP
per c
apita
(US$
) < 2
000)
;–
Tran
sitio
ns fr
om st
age
1 to
stag
e 2
(GD
P pe
r cap
ita (U
S$) =
20
00–2
999)
– St
age
2: E
ffici
ency
-driv
en (G
DP
per c
apita
(US$
) = 3
000
– 89
99)
– Tr
ansi
tions
from
sta
ge 2
to s
tage
3 (G
DP
per c
apita
(US$
) =
9000
– 1
7000
)–
Stag
e 3: I
nnov
atio
n-dr
iven
(GD
P pe
r cap
ita (U
S$) >
170
00)
Wor
ld C
ompe
ti-tiv
enes
s Rep
ort
2014
–20
15
125
coun
tries
Con
tinua
tion
of T
able
1
1199
RESULTS AND DISCUSSION
A cross-country regression was developed in order to empirically research the validity or non-validity of the research hypotheses formulated above. The scores assigned to the environmental performance were regressed on the ranks of the independent variables such as efficacy of the corporate boards, ethical behaviour of firms, income classes and stage of development. The descriptive statistics are disclosed in Table 2, while the main results of regression analysis are reported within Tables 3, 4 and 5. As one can note the best models are the ones that includes both corporate governance and level of development as independent variables.
The adjusted R2 of the third model is 81.6% which from statistically point of view means that the variance of dependent variable (environmental performance) is explained in proportion of 81.6% by the independent variables considered in the regression model (efficacy of the corporate boards, ethical behaviour of the compa-nies, income classification and stage of development). The statistic F-test reveals that the regression equation for the second and third model is highly significant (with an F = 172.053, p < 0.001 – model 2; and F = 138.466, p < 0.001 – model 3) which means that is very unlikely that the regressions results to be determined by a sampling bias. Analysing the regression coefficients it can be noticed that the influence of independent variable expressing economic development in terms of income classification and stage of development is bigger than those of efficacy of the corporate boards and ethical behaviour of firms.
Proceeding to checking for possible outliers (that might affect the stability of regression model in the sense that eliminating these extreme cases, the regression coefficients may change significantly) one can notice that the Cook distance value is not greater than 1 (0.119). Thus, this test confirms that there were no outliers before processing to the multiple regression analysis.
Finally, the empirically findings obtained allow us to validate the research hypothesis formulated above, that corporate governance characteristics such as efficacy of corporate board and ethical behaviour and economic development in terms of income classification and stage of development significantly influence the environmental performance, even if there is necessary additional empirical research in order in investigate the influence of such factors in combination with other determinant factors empirically proved by prior scholarship literature.
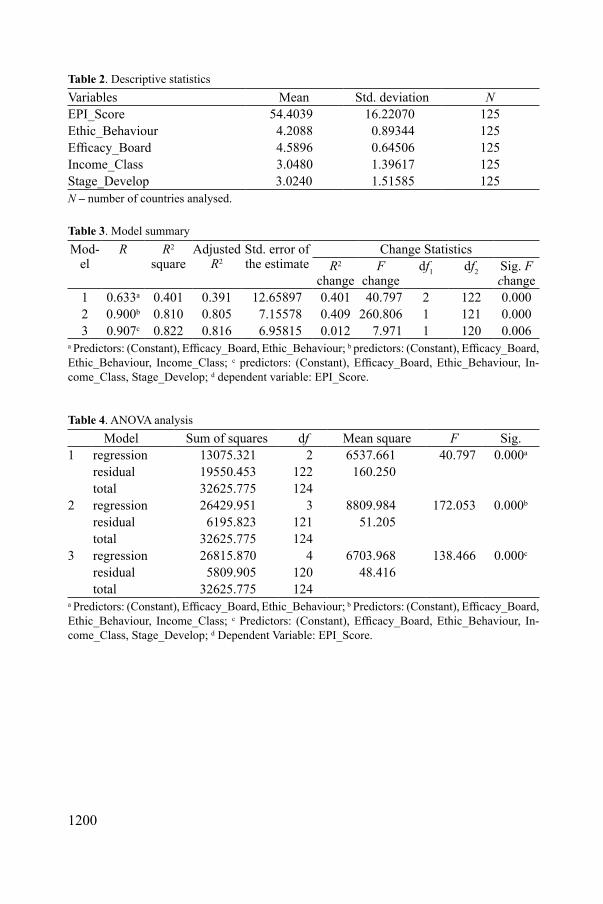
1200
Table 2. Descriptive statisticsVariables Mean Std. deviation NEPI_Score 54.4039 16.22070 125Ethic_Behaviour 4.2088 0.89344 125Efficacy_Board 4.5896 0.64506 125Income_Class 3.0480 1.39617 125Stage_Develop 3.0240 1.51585 125N – number of countries analysed.
Table 3. Model summaryMod-
elR R2
squareAdjusted
R2Std. error of the estimate
Change StatisticsR2
changeF
changedf1 df2 Sig. F
change1 0.633a 0.401 0.391 12.65897 0.401 40.797 2 122 0.0002 0.900b 0.810 0.805 7.15578 0.409 260.806 1 121 0.0003 0.907c 0.822 0.816 6.95815 0.012 7.971 1 120 0.006
a Predictors: (Constant), Efficacy_Board, Ethic_Behaviour; b predictors: (Constant), Efficacy_Board, Ethic_Behaviour, Income_Class; c predictors: (Constant), Efficacy_Board, Ethic_Behaviour, In-come_Class, Stage_Develop; d dependent variable: EPI_Score.
Table 4. ANOVA analysisModel Sum of squares df Mean square F Sig.
1 regression 13075.321 2 6537.661 40.797 0.000a
residual 19550.453 122 160.250total 32625.775 124
2 regression 26429.951 3 8809.984 172.053 0.000b
residual 6195.823 121 51.205total 32625.775 124
3 regression 26815.870 4 6703.968 138.466 0.000c
residual 5809.905 120 48.416total 32625.775 124
a Predictors: (Constant), Efficacy_Board, Ethic_Behaviour; b Predictors: (Constant), Efficacy_Board, Ethic_Behaviour, Income_Class; c Predictors: (Constant), Efficacy_Board, Ethic_Behaviour, In-come_Class, Stage_Develop; d Dependent Variable: EPI_Score.

1201
Table 5. Coefficients of regression modelsModel Unstandardised
coefficientsStand-ardised coeffi-cientsbeta
t Sig. Correlations Collinearity statistics
coeffi-cient B
std. error
zero-order
partial part toler-ance
VIF
(Constant) 2.781 8.417 0.330 0.742Ethic_Behaviour 10.560 2.168 0.582 4.871 0.000 0.632 0.403 0.341 0.344 0.903Efficacy_Board 1.564 3.003 0.062 0.521 0.603 0.533 0.047 0.036 0.344 0.903(Constant) 12.005 4.792 2.505 0.014Ethic_Behaviour 0.788 1.367 0.043 0.576 0.566 0.632 0.052 0.023 0.277 0.611Efficacy_Board 2.158 1.698 0.086 1.271 0.206 0.533 0.115 0.050 0.344 0.905Income_Class 9.574 0.593 0.824 16.150 0.000 0.894 0.826 0.640 0.603 0.659(Constant) 13.346 4.684 2.850 0.005Ethic_Behaviour 0.951 1.330 0.052 0.715 0.476 0.632 0.065 0.028 0.276 0.618Efficacy_Board 1.645 1.661 0.065 0.991 0.324 0.533 0.090 0.038 0.340 0.940Income_Class 7.073 1.057 0.609 6.693 0.000 0.894 0.521 0.258 0.179 0.575Stage_Develop 2.628 0.931 0.246 2.823 0.006 0.853 0.250 0.109 0.196 0.098a Dependent variable: EPI_Score.
CONCLUSIONS
This study developed empirical models in order to evaluate the influence of some of the corporate governance dimensions (such as efficacy of corporate boards and ethical behaviour of firms) and economic development (in terms of income clas-sification and stage of development) on environmental performance. The findings reveal the significant influence of selected independent variables.
By developing such a study and presenting an overview of the main results, the authors do hope to stimulate further research on this problematic issue for a much complex of determinant factors, provoking constructive debates within this field, with the perspective of including some other relevant variables that might affect environmental performance. Also, the authors admit that additional research is required to further explore the impact of the corporate governance dimensions that have been emphasised as being significant, and probably a challenge of the future will be to look for potential solutions that might have a contribution to the overcoming of the obstacles that might negatively affect the process of ensuring of high environmental performance.
REFERENCES1. O. R. IVAN, D. I. TOPOR: Environmental Management Accounting (EMA): The Environmental
Cost Inductors in the Accounting Process-Study Case Wine Production. J Environ Prot Ecol, 14 (3), 1195 (2013).

1202
2. R. NISHANT, T. S. H., TEO, M. GOH, S. KRISHNAN: Does Environmental Performance Af-fect Organizational Performance? Evidence from Green IT Organizations. In: Proc. of the 33rd International Conference on Information Systems, Orlando, FL, USA, 2012.
3. C. DASCALU, C. I. LUNGU, Ch. CARAIANI: Eco-cost Challenges for Environmental Protec-tion. J Environ Prot Ecol, 9 (4), 925 (2008).
4. A. MIDDLETON: Value Relevance of Firms’ Integral Environmental Performance: Evidence from Russia. J Account Public Policy, http://dx.doi.org/10.1016/j.jaccpubpol.2014.12.001 (2015).
5. R. W. INGRAM, K. B. FRAZIER: Environmental Performance and Corporate Disclosure. J Ac-count Res, 18 (2), 614 (1980).
6. D. CORMIER, M. MAGNAN: Research Note: Investors’ Assessment of Implicit Environmental Liabilities: An Empirical Investigation. J Account Public Policy, 16, 215 (1997).
7. M. E. BARTH, M. F. MCNICHOLS: Estimation and Market Valuation of Environmental Li-abilities Relating to Superfund Sites. J Account Res, 32 (Suppl.), 177 (1994).
8. R. PEART: External Factors Influencing the Environmental Performance of South African Firms. South Afr J Sci, 97, 2 (2001).
9. C. I. LUNGU, Ch. CARAIANI, C. DASCALU: Reporting green information from environmental management perspective, J Environ Prot Ecol, 10 (2), 524 (2009).
10. M. WAGNER: The Link Of Environmental and Economic Performance: Drivers and Limitations of Sustainability Integration. J Bus Res, 68, 1306 (2015).
11. D. C. DABIJA, C. M. POP: Green Marketing-factor of Competitiveness in Retailing. Environ Eng Manag J, 12 (2), 393 (2013).
12. M. V. ACHIM, S. N. BORLEA: Environmental Performances–Way to Boost up Financial Per-formances of Companies. Environ Eng and Manag J, 13 (4), 991 (2014).
13. A. HSU, J. EMERSON, M. LEVY, A. de SHERBININ, L. JOHNSON, O. MALIK, J. SCHWARTZ, M. JAITEH: The 2014 Environmental Performance Index. New Haven, CT: Yale Center for Environmental Law & Policy. Available: www.epi.yale.edu, 2014.
14. K. SCHWAB, X. SALA-I-MARTIN: The Global Competitiveness Report 2014–2015. Geneva, World Economic Forum. Available: http://www3.weforum.org/docs/WEF_GlobalCompetitive-nessReport_2014-15.pdf, 2015.
Received 17 June 2015 Revised 28 July 2015

1203
* For correspondence.
Journal of Environmental Protection and Ecology 16, No 3, 1203–1211 (2015)
Environmental economics
SOLUTIONS FOR THE CAPITALISATION OF THE ENERGETIC POTENTIAL OF SLUDGE COLLECTED IN DANUTONI WASTEWATER TREATMENT PLANT
D. C. PETRILEAN*, S. I. IRIMIE
University of Petrosani, 20 University Street, 332 006 Petrosani, Romania E-mail: [email protected]
Abstract. Considering the composition of wastewater sludge, a comparative analysis of 3 energetic usage solutions of the biogas is carried out. The energetic and economic performances are brought forward as well as the environmental impact through the use of biogas for a hot water generator and for a heat recovery diesel electricity generator.
Keywords: biogas, thermal generator, diesel electricity generator, performance.
AIMS AND BACKGROUND
In Romania, the proportion of biogas used for the energetic potential represents 7.7% (Ref. 1). The EU, on the other hand, uses 8% of the biogas produced by the wastewater treatment plants. There are different technical solutions for the usage of waste water treatment plants produced biogas, such as: burning it by steam or hot water generators, using it for thermal engines for the drive of different equipments such as pumps, blower, fans, compressors, etc., supplying electricity generating groups, as well as using it in cogenerating installations (electric or thermal energy) or trigeneration installations (electricity, heat, cold)2.
PROBLEM FORMULATION
The paper brings forward the comparison between the energetic, economic and environmental performances of the cogeneration installation of Danutoni Waste Water Treatment Plant (WWTP), Petrosani. The compared solutions, considering the equipment existent on site and the evolution in time of its operation considers 3 scenarios: biogas burning by the hot water generator to ensure the requirements of thermal energy; supplying with biogas the electricity generator to cover the internal electric energy consumption; using cogeneration based on the production of biogas.
The energetic performances are expressed based on the energetic analysis in order to have a correct comparison criterion of the forms of energy with different
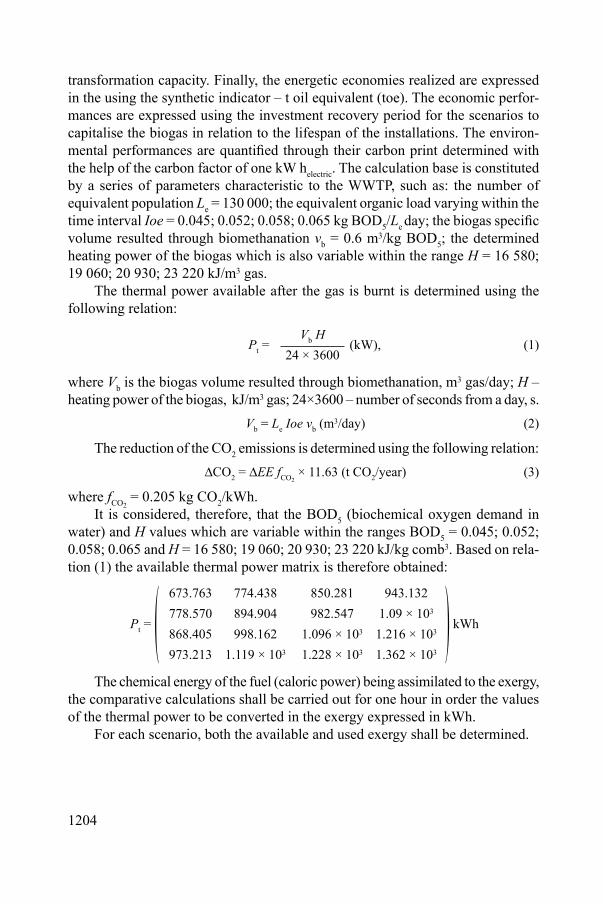
1204
transformation capacity. Finally, the energetic economies realized are expressed in the using the synthetic indicator – t oil equivalent (toe). The economic perfor-mances are expressed using the investment recovery period for the scenarios to capitalise the biogas in relation to the lifespan of the installations. The environ-mental performances are quantified through their carbon print determined with the help of the carbon factor of one kW helectric. The calculation base is constituted by a series of parameters characteristic to the WWTP, such as: the number of equivalent population Le = 130 000; the equivalent organic load varying within the time interval Ioe = 0.045; 0.052; 0.058; 0.065 kg BOD5/Le day; the biogas specific volume resulted through biomethanation vb = 0.6 m3/kg BOD5; the determined heating power of the biogas which is also variable within the range H = 16 580; 19 060; 20 930; 23 220 kJ/m3 gas.
The thermal power available after the gas is burnt is determined using the following relation:
Pt = Vb H (kW), (1)
24 × 3600
where Vb is the biogas volume resulted through biomethanation, m3 gas/day; H – heating power of the biogas, kJ/m3 gas; 24×3600 – number of seconds from a day, s. Vb = Le Ioe vb (m3/day) (2)
The reduction of the CO2 emissions is determined using the following relation: ∆CO2 = ∆EE fCO2
× 11.63 (t CO2/year) (3)
where fCO2 = 0.205 kg CO2/kWh.
It is considered, therefore, that the BOD5 (biochemical oxygen demand in water) and H values which are variable within the ranges BOD5 = 0.045; 0.052; 0.058; 0.065 and H = 16 580; 19 060; 20 930; 23 220 kJ/kg comb3. Based on rela-tion (1) the available thermal power matrix is therefore obtained:
Pt = ( 673.763 774.438 850.281 943.132 ) kWh778.570 894.904 982.547 1.09 × 10³
868.405 998.162 1.096 × 10³ 1.216 × 10³
973.213 1.119 × 10³ 1.228 × 10³ 1.362 × 10³
The chemical energy of the fuel (caloric power) being assimilated to the exergy, the comparative calculations shall be carried out for one hour in order the values of the thermal power to be converted in the exergy expressed in kWh.
For each scenario, both the available and used exergy shall be determined.
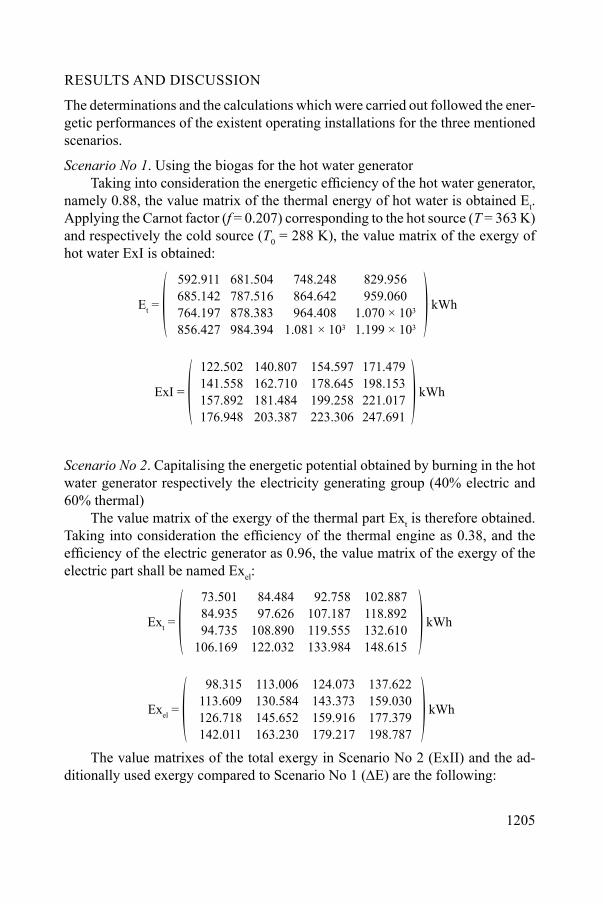
1205
RESULTS AND DISCUSSION
The determinations and the calculations which were carried out followed the ener-getic performances of the existent operating installations for the three mentioned scenarios.
Scenario No 1. Using the biogas for the hot water generatorTaking into consideration the energetic efficiency of the hot water generator,
namely 0.88, the value matrix of the thermal energy of hot water is obtained Et. Applying the Carnot factor (f = 0.207) corresponding to the hot source (T = 363 K) and respectively the cold source (T0 = 288 K), the value matrix of the exergy of hot water ExI is obtained:
Et = ( 592.911 681.504 748.248 829.956 ) kWh685.142 787.516 864.642 959.060764.197 878.383 964.408 1.070 × 10³
856.427 984.394 1.081 × 10³ 1.199 × 10³
ExI = ( 122.502 140.807 154.597 171.479 ) kWh141.558 162.710 178.645 198.153157.892 181.484 199.258 221.017176.948 203.387 223.306 247.691
Scenario No 2. Capitalising the energetic potential obtained by burning in the hot water generator respectively the electricity generating group (40% electric and 60% thermal)
The value matrix of the exergy of the thermal part Ext is therefore obtained. Taking into consideration the efficiency of the thermal engine as 0.38, and the efficiency of the electric generator as 0.96, the value matrix of the exergy of the electric part shall be named Exel:
Ext = ( 73.501 84.484 92.758 102.887 ) kWh 84.935 97.626 107.187 118.892 94.735 108.890 119.555 132.610106.169 122.032 133.984 148.615
Exel = ( 98.315 113.006 124.073 137.622 ) kWh113.609 130.584 143.373 159.030126.718 145.652 159.916 177.379142.011 163.230 179.217 198.787
The value matrixes of the total exergy in Scenario No 2 (ExII) and the ad-ditionally used exergy compared to Scenario No 1 (DE) are the following:
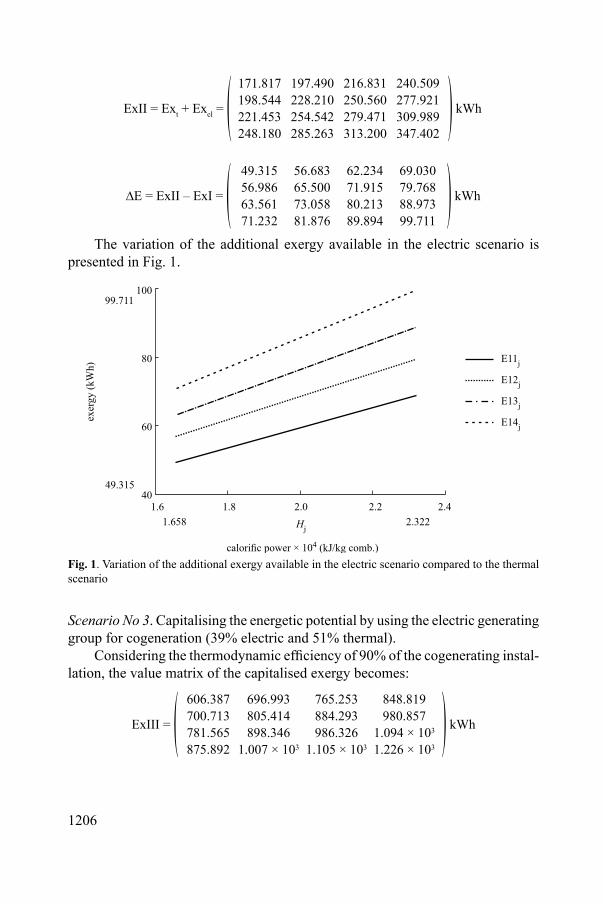
1206
ExII = Ext + Exel = ( 171.817 197.490 216.831 240.509 ) kWh198.544 228.210 250.560 277.921221.453 254.542 279.471 309.989248.180 285.263 313.200 347.402
∆E = ExII – ExI = ( 49.315 56.683 62.234 69.030 ) kWh56.986 65.500 71.915 79.76863.561 73.058 80.213 88.97371.232 81.876 89.894 99.711
The variation of the additional exergy available in the electric scenario is presented in Fig. 1.
Fig. 1. Variation of the additional exergy available in the electric scenario compared to the thermal scenario
Scenario No 3. Capitalising the energetic potential by using the electric generating group for cogeneration (39% electric and 51% thermal).
Considering the thermodynamic efficiency of 90% of the cogenerating instal-lation, the value matrix of the capitalised exergy becomes:
ExIII = ( 606.387 696.993 765.253 848.819 ) kWh700.713 805.414 884.293 980.857781.565 898.346 986.326 1.094 × 10³
875.892 1.007 × 10³ 1.105 × 10³ 1.226 × 10³

1207
The additionally capitalised exergy compared to Scenario No 1 (i.e. 51% thermally capitalised) (DEt1) and the exergy capitalised compared to Scenario No 2 (i.e. 39% electrically capitalised) (DEt2) becomes:
∆Et1 = ExIII – ExI = ( 483.884 556.186 610.657 677.340 ) kWh559.155 642.704 705.648 782.704623.673 716.862 787.068 873.016698.944 803.380 882.059 978.380
∆Et2 = ExIII – ExII = ( 434.570 499.503 548.422 608.310 ) kWh502.169 577.203 633.732 702.936560.112 643.804 706.855 784.044627.712 721.504 792.165 878.670
The variation of the additional exergy available in the cogeneration scenario compared to the electric scenario is represented in Fig. 2, while the variation of the additional exergy available in the cogeneration scenario compared to the thermal one is presented in Fig. 3.
Fig. 2. Variation of the additional exergy available in the cogeneration scenario compared to the electric one depending on the BOD5 and H variables

1208
Fig. 3. Variation of the additional exergy available in the cogeneration scenario compared to the thermal one depending on the BOD5 and H variables
Acknowledging the cost of the investment Ci = 3.1×10⁵ Euro, the number of operating hours t = 4.32×10³ hours/an, the price of kWh of electric energy is 0.069 Euro/kWh and the price of kWh of thermal energy is 0.033 Euro/kWh, the value matrix of the annual economy of thermal and electric energy was determined:
∆ETOT = ( 343.459 394.778 433.441 480.773 ) tep/an396.886 456.188 500.866 555.560442.681 508.826 558.658 619.663496.107 570.236 626.082 694.450
Financially expressing the energy savings realised considering the Scenario No 3 and considering the cost of the investment the recovery period for the variable values of BOD5 and the caloric power H were therefore determined (Figs 4 and 5).
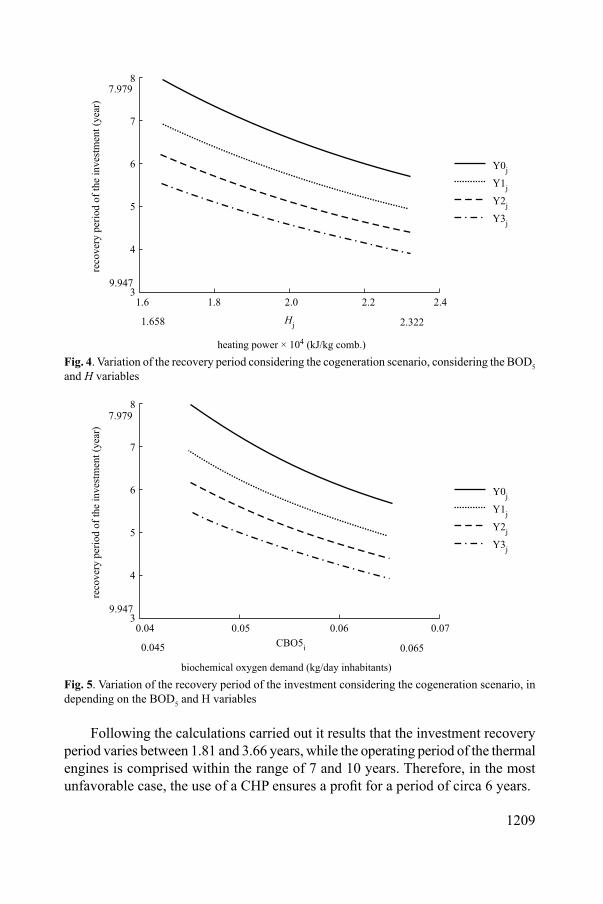
1209
Fig. 4. Variation of the recovery period considering the cogeneration scenario, considering the BOD5 and H variables
Fig. 5. Variation of the recovery period of the investment considering the cogeneration scenario, in depending on the BOD5 and H variables
Following the calculations carried out it results that the investment recovery period varies between 1.81 and 3.66 years, while the operating period of the thermal engines is comprised within the range of 7 and 10 years. Therefore, in the most unfavorable case, the use of a CHP ensures a profit for a period of circa 6 years.
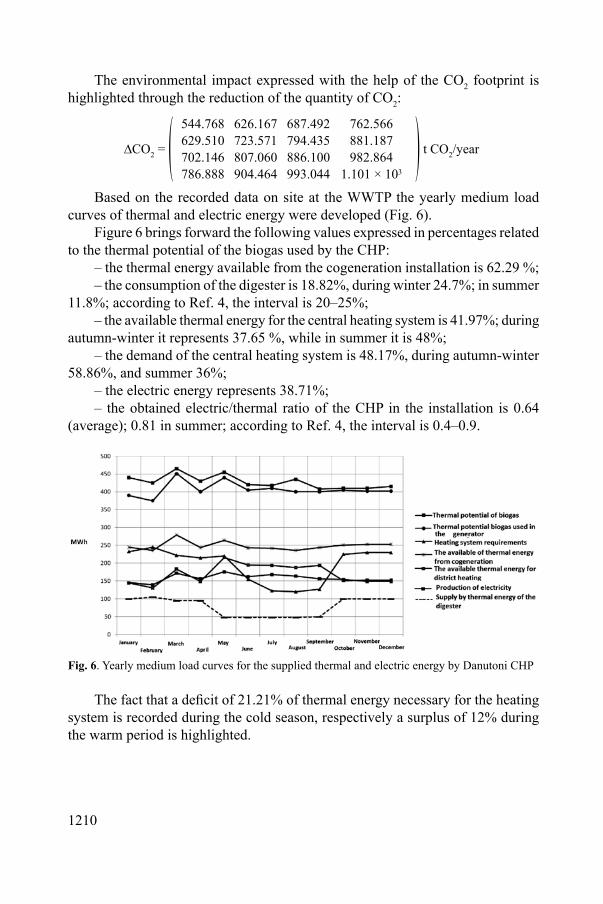
1210
The environmental impact expressed with the help of the CO2 footprint is highlighted through the reduction of the quantity of CO2:
∆CO2 = ( 544.768 626.167 687.492 762.566 ) t CO2/year629.510 723.571 794.435 881.187702.146 807.060 886.100 982.864786.888 904.464 993.044 1.101 × 10³
Based on the recorded data on site at the WWTP the yearly medium load curves of thermal and electric energy were developed (Fig. 6).
Figure 6 brings forward the following values expressed in percentages related to the thermal potential of the biogas used by the CHP:
– the thermal energy available from the cogeneration installation is 62.29 %;– the consumption of the digester is 18.82%, during winter 24.7%; in summer
11.8%; according to Ref. 4, the interval is 20–25%;– the available thermal energy for the central heating system is 41.97%; during
autumn-winter it represents 37.65 %, while in summer it is 48%;– the demand of the central heating system is 48.17%, during autumn-winter
58.86%, and summer 36%;– the electric energy represents 38.71%;– the obtained electric/thermal ratio of the CHP in the installation is 0.64
(average); 0.81 in summer; according to Ref. 4, the interval is 0.4–0.9.
Fig. 6. Yearly medium load curves for the supplied thermal and electric energy by Danutoni CHP
The fact that a deficit of 21.21% of thermal energy necessary for the heating system is recorded during the cold season, respectively a surplus of 12% during the warm period is highlighted.
1211
CONCLUSIONS
The calculations and experimental determinations carried out on site at Danutoni Waste Water Treatment Plant highlight the fact that the most efficient way to capi-talise biogas is through electric and thermal energy cogeneration.
Considering Scenario No 1 the capitalisation of the exergetic potential of biogas is carried out for 18–20%, in the case of Scenario No 2 for 70–80%, while in the case of Scenario No 3 for 80–90%.
The extension and rehabilitation of the waste water network supplying the WWTP and the optimum operation during the entire year of the biogas generation installation allow for the WWTP to give up the consumption of natural gas and lead to its energetic autonomy.
The obtained diagrams may be used as a data base for carrying out energetic audits and to assess the energetic efficiency of the biogas generation installations of the Waste Water Treatment Plants.
REFERENCES1. A. E. CIOABLA, I. IONEL, G. TRIF-TORDAI, A. IRIMESCU, I.VETRES.: Study on the Qual-
ity of Biogas Obtained from Agricultural Residues during Anaerobic Fermentation. J Environ Prot Ecol, 14 (1), 247 (2014).
2. D. COMAN, A. LECA: Advanced Technologies for Energy Cogeneration Using Fossil Fuels. EMERG VII, AGIR Publishing House, Bucharest, 2013.
3. V. NIKOLICI: The Production and Use of Biogas to Obtain Energy. http://www.nikolicivasilie.ro/lucrari-stiintifice/Biogaz%20curs.pdf, 2006.
4. D. RUTZ, R. MERGNER, R. JANSSEN: Sustainable Heat Use of Biogas Plants. WIP Renew-able Energies, Munich, Germany, 2012, www.biogasheat.org.
Received 9 June 2015 Revised 21 July 2015
1212
* For correspondence.
Journal of Environmental Protection and Ecology 16, No 3, 1212–1220 (2015)
Environmental economics
BIOMASS: ECONOMICAL, SOCIAL AND ENVIRONMENTAL ASPECTS IN BIOGAS PLANTS IMPLEMENTATION
S.-C. VACa*, G.-E. POPITAb
aFaculty of Horticulture, University of Agricultural Sciences and Veterinary Medicine of Cluj Napoca, 3–5 Manastur Street, 400 372 Cluj-Napoca, Romania E-mail: [email protected] bFaculty of Environmental Science and Engineering, Babes Bolyai University, 30 Fantanele Street, 400 294 Cluj-Napoca, Romania
Abstract. Research on the use of biomass contribution to the sustainable development of the studied areas was performed worldwide, the impact being assessed on three components: economic, social and environmental. In Romania, the highest potential in renewable energy production is biomass. In this paper, we present our studies that assessed or optimised the economic, social and environmental aspects of the implementation of CEFA project, biogas plant producing by anaerobic digestion of biomass, as a model and an opportunity to boost sustainable development in Romania. This tech-nology was studied, grant financed and applied on the first time in Romania through this project. Nevertheless, there is a recent trend to integrate economic, environmental and social aspects in the assessment and optimisation of biomass supply chains. The conclusion is that biomass brings signifi-cant contributions to sustainable development, at least due to the following aspects: protects natural anthropic resources, contribute to environmental protection by neutralizing many organic materials, stimulate works and creating new jobs, farmers boosting in diversifying agricultural production in terms of biomass production.
Keywords: biomass, biogas plant, bioeconomy, sustainable development, renewable energy.
AIMS AND BACKGROUND
The aim of this work is to reveal that biomass production and using in biogas plants is not only a renewable resource, but also a significant opportunity for sustainable development, in terms of economic, social and environment policies.
It was estimated that biomass, as an alternative energy source, currently con-tributes 14% of world primary energy consumption1. Recent studies related to the renewable energy sector in Romania2 see that institutional actions together with environmental policy instruments are key factors for efficient utilisation of renew-able energy. Their recovery can bring a major contribution to rural development and to the progress of local communities.
Both, in Romania and in the entire European Union (EU), there is an increasing interest in intensifying the production and use of biomass, to replace fossil fuels

1213
for the production of heat, electricity and transportation fuels3. Biomass usage as a source of energy is of interest because is renewable, potentially sustainable and relatively environmentally friendly source of energy4–6. On the other hand, research on the feasibility of investment on renewable resources reveals that the use of biomass with a high capacity plant represents one of the most profitable methods of obtaining electricity7.
International organisations, such as the International Energy Agency, encour-age the use of biomass waste and residues for energy production because it can generate profit, contribute to the mitigation of greenhouse gas emissions, and help communities to diversify their energy sources and achieve energy independency without threatening the world food supply8,9.
Research on waste management and on the acceptance of the use of renewable energies in rural areas was conducted in Serbia10, Scotland11, France12, Greece13, Nigeria14. The analysis was accomplished in terms of three components of sustain-able development: economic, social and environmental. Experiences related to the exploitation of biomass as an energy source were made in China15. Their results demonstrated that such projects consume agricultural residues, provide energy for local communities and increase the income of rural residents.
Taking as a model the Clean Development Mechanism (CDM) of the Kyoto Protocol, in India16 and Thailand17 were conducted studies on biomass gasification projects, because they directly displace greenhouse gas emissions while contribute to sustainable rural development. But there are no studies to analyse in terms of sustainable development and the energy production from such resources. Based on these considerations and taking as a starting point CEFA that it might have the implementation of a project of biogas production from biomass on rural areas in Romania, where such a project is conducted.
CEFA project is implemented by SC Global ARM SRL in the industrial park, located on a land area of 33 462 m2 inside the village Cefa, Bihor county, Romania. The project was initiated in 2008, benefits from a grant offered by the Ministry of Environment from Romania and is still in implementation period due to bureaucratic financial issues. Basically, the project consists in construction and operation of a facility, to produce biogas by anaerobic digestion of biomass and green electricity transformation using a powerful technology applied in many other countries respecting the environmental protection, but on the first time in Romania7,18,19.
EXPERIMENTAL
Romania, as a member of the EU, has aligned with its policies on protecting the environment, its limited resources (fossil fuels), waste recycling, finding and pro-moting alternative energy sources20, the development of appropriate technologies,
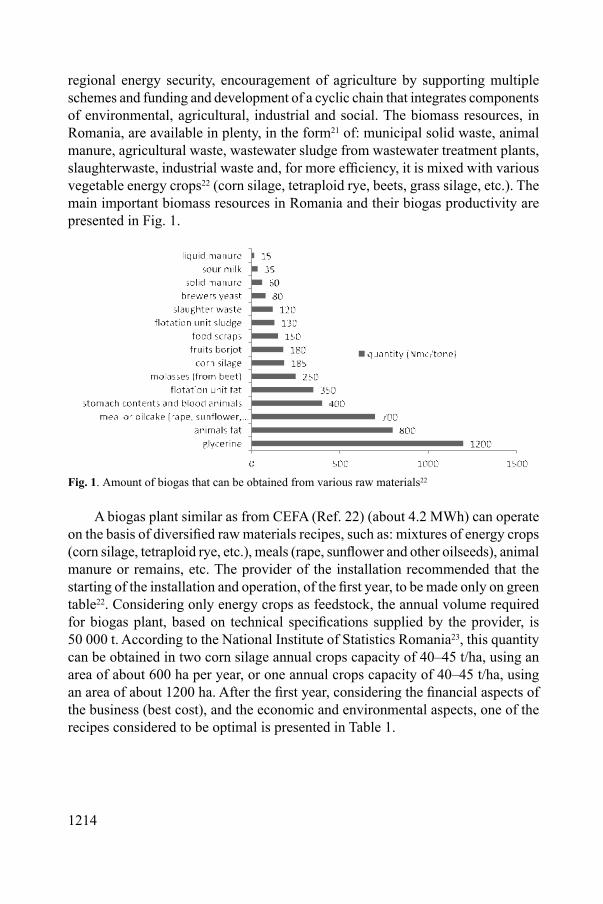
1214
regional energy security, encouragement of agriculture by supporting multiple schemes and funding and development of a cyclic chain that integrates components of environmental, agricultural, industrial and social. The biomass resources, in Romania, are available in plenty, in the form21 of: municipal solid waste, animal manure, agricultural waste, wastewater sludge from wastewater treatment plants, slaughterwaste, industrial waste and, for more efficiency, it is mixed with various vegetable energy crops22 (corn silage, tetraploid rye, beets, grass silage, etc.). The main important biomass resources in Romania and their biogas productivity are presented in Fig. 1.
Fig. 1. Amount of biogas that can be obtained from various raw materials22
A biogas plant similar as from CEFA (Ref. 22) (about 4.2 MWh) can operate on the basis of diversified raw materials recipes, such as: mixtures of energy crops (corn silage, tetraploid rye, etc.), meals (rape, sunflower and other oilseeds), animal manure or remains, etc. The provider of the installation recommended that the starting of the installation and operation, of the first year, to be made only on green table22. Considering only energy crops as feedstock, the annual volume required for biogas plant, based on technical specifications supplied by the provider, is 50 000 t. According to the National Institute of Statistics Romania23, this quantity can be obtained in two corn silage annual crops capacity of 40–45 t/ha, using an area of about 600 ha per year, or one annual crops capacity of 40–45 t/ha, using an area of about 1200 ha. After the first year, considering the financial aspects of the business (best cost), and the economic and environmental aspects, one of the recipes considered to be optimal is presented in Table 1.

1215
Table 1. Average annual quantities of raw materials used in the production of biogas22
Raw material Amount (t/year)Glycerine 1000 Meals (especially rape) 2000 Liquid animal manure 22000 Animal waste from slaughter (containing stomach, intestines, blood) 3600Corn silage 30000 Recoverable wastewater containing amino acids 500
The average annual production of rape, in Romania, is 2.5 t/ha (Ref. 23). By cold pressing is obtained pure oil (about one-third) and meal (two-thirds). From total amount of oil, about 80% are converted into biodiesel by esterification process and the rest is pure glycerine24. So, 2000 t of rape meals and 1000 t of glycerine can be obtained from 6250 ha of land cultivated with rape:
– for every 1 ha rape cultivated result about 1.6 t of meal (two-thirds) and 0.8 t of pure oil (one-third), that means about 0.8 × 20% = 0.16 t of glycerine;
– 1000 t of glycerine can be obtained from 1000/0.16 = 6250 ha rape cultivated;– backwards, from 6250 ha rape cultivated can be obtained:6250 × 0.16 = 1000 t of glycerine and6250 × 1.60 = 10 000 t of meal.The difference meal, apparently left unused, can be used as a substitute for
other components when they are in insufficient quantities (recoverable wastewater containing aminoacids, animal manure and slaughter waste).
Using the provided data above, from about 750 ha of cultivated land can be obtained 30 000 tons of corn silage:
– at a productivity of 40 t/ha, result 30 000/40 = 750 ha corn silage cultivated.Thus, to ensure raw material in terms of energy crops is necessary to cultivate
about 7000 ha of land (Table 2).
Table 2. Land areas that must be cultivated to ensure the raw material of energy crops (personal processing)
Raw material Needed quantity (t/year) Worked cultivated landCorn silage 30000 750 ha (corn silage)Meals (especially rape) 2000 1250 ha (rape)Glycerine 1000 6250 ha (same rape)Total 7000 ha
According to the Romanian Order 1182/22.11.2005 of the Ministry of En-vironment and Water25, in Table 3 is presented the chemical composition of the liquid animal manure.
1216
Table 3. Chemical composition of liquid animal manure25
Species Chemical composition (%) Amount of urine that can be col-lected from an animal (l/year)N P2O5 K2O
Equines 0.5–1.6 traces 0.6–1.8 800–1200Cattle 0.2–1.0 traces 0.2–1.0 2000–3000Swine 0.4–0.5 0.05–0.07 0.8–1.0 500–900
Taking into consideration an average of the figures above and that the animal urine density is quite similar to water, a quantity of 22 000 t/year of liquid animal manure, can be obtained from:
– 22 000.000/1000 = 22 000 equines, or– 22 000.000/2500 = 8800 cattle, or– 22 000.000/675 = 32 590 swine.Considering the chemical composition described above, to get a chemical bal-
anced compost from the anaerobic fermentation, that will return to the cultivated areas as fertiliser, is appropriate to use liquid animal manure from all 3 categories, in the fermentation process.
According to NISR (Ref. 23), in Romania the average size of farms in the EU-27 is 14.3 and 3.45 ha. The 7000 ha required to obtain energy crops for biogas plant operation at CEFA assume the exclusive involvement of over 2000 farms in the North-West of Romania, in the 522 482 total of the region, as follows:
– 7000/3.45 = 2029 individual farms;– 7 159 000 workers/3856 000 farms = 1.86 workers/farm;– 1.86 × 2029 farms = 3774 individual persons working.Regarding farm animals, it can made the following estimates:– 22 000 equines/(73 456 equines North-West/522 482 farms NW) = 156 480
equines farms NW, over the 49 980 total of the region (about total of NW and Centre regions together);
– 8800 cattle/(347 021 cattle NW/522 482 farms NW) = 13 250 cattle farms NW, in the 119 444 total of the region;
– 32 590 swine/(688 256 swine NW/522 482 farms NW) = 24 750 swine farms NW, in the 204 767 total of the region.
RESULTS AND DISCUSSION
All the above calculations are made for the operation of a biogas plants that generate 4.2 MWh! And it could be installed at least a few hundred of MWh in all North-West region of Romania. Extending the implementation of similar projects, that benefit absolutely similar and necessity of their placement in rural or peri-urban areas (close to the raw material, both rural agriculture and municipal waste and industries, and away from heavily populated areas), do nothing but multiply these benefits to all stakeholders, which translates into an important contribution to the

1217
sustainable development: fostering agriculture, supporting small and medium-sized enterprises (SMEs), benefits to the environment, social education and benefits.
Consequently, it can be appreciated that such businesses stimulates the work in agriculture. From this point of view, it should be mentioned that the entire North-West region of Romania area has a high agricultural potential and 6 times lower productivity than the European average, thus fulfilling all the conditions for an intensive energy crops, with low climate sensitivity given that in the last 20 years the uncultivated agricultural land in Romania is very extended26,27.
At the same time, energy crops (corn silage, tetraploid rye, soybean, rape, sunflower, beet) is an important business opportunity for farms located in the vi-cinity of investment place, diversification of production, reduction of dependence on fodder crops and incomes growth for both suppliers of agricultural products as well as producer of energy from biogas.
On the other hand, following the process of obtaining anaerobic biogas, a quality organic fertiliser is been derived21, which should be used as fertiliser in agriculture (sludge fermentation) which is rich in minerals, namely: phosphorus (P2O5), potassium (K2O), calcium (CaO) and magnesium (MgO). The minerals composition is shown in Table 4.
Table 4. Average composition of sludge fermentation fertilising substances22
Dry matter (DM) (%/kg sludge)
Organic dry matter
(DM)
pH Ntotal (% in DM)
P2O5(% in DM)
K2O(% in DM)
CaO(% in DM)
MgO(% in DM)
10 62 8.3 13 7.7 4.3 8.5 0.87
At an estimated required amount of 50 t of fertiliser/ha/year, it follows that will be required an agricultural land area of approximately 440 ha to capitalise the amount of the produced fertiliser. After removal of the fermenter, the effluent may be processed by mechanical separation to yield a solid phase and a liquid organic substance commonly known as ‘filtrate’. The solid phase is rich in fibber, a peat moss with similar physical characteristics which may be used to improve the soil. The liquid phase, a stabilised organic solution, has a high value as a fertiliser. It consists of a combination of nitrogen, phosphorus and potassium 3–4.5% (dry matter) and can be spread directly on the cultivated land. The ammonia content of the ‘filtrate’ is up to two times higher than the stored manure (not fermented).
Fermentation increases the uptake of nitrogen over normal values of 30–60%, not decrease the phosphate absorption, its assimilation degree remained at 50% and the potassium carbonate is absorbed at a rate of 75–100%. Due to the fact that ammonia is slowly released, immediately after application to the soil, if the ‘filtrate’ is not properly managed, there is the risk to a quickly evaporation from the composition of the ‘filtrate’ in comparison with the unprocessed manure. The correct application of the dispersion has to be made as close as possible to the
1218
ground and preferably by direct injection into the ground, in which case the am-monia risk of loss is very low. Successful applications include the use of anaerobic fermentation residue as fertiliser on crops, as an amendment to improve soil and as additives in aquaculture.
From the combustion plant of the engines results flue gas, in the form of car-bon oxides (CO: 650–1100 mg/m3N), nitrogen oxides (NO2: 150–270 mg/m3N) and sulphur residual oxides (SO2: 80–110 mg/m3N), which are emitted into the atmosphere as exhaust gases22. All these values are within the limits prescribed by law 104/2011 (Ref. 28). Still, to minimise SO2 emissions, biogas passes through a biological desulphurisation process.
The chimney for the flue gas dispersion in the atmosphere has a height of 10 m. At a nominal operating under the two gas engines a volume of about 1568 biogas N m3/h, respectively 37 632 N m3/day, is consumed. Maximum emission values are achieved only when the engine starts and stops. In order to reduce time to reach the motors operating temperature, they have electric preheating cooling water. The conclusion that can be drawn is that the flue gas emissions are far below the minimum allowed according to the current legislation.
CONCLUSIONS
The investment project to CEFA started in 2008, the year of its release, as the first project of producing electricity from biomass in Romania with biogas production as intermediary. The anaerobic digestion technology, at that time, was for the first time studied, grant financed and applied through this project in our country.
Even today, when some similar companies try to implement or use similar technologies, the project presents many elements of originality, by its own unique-ness at a time, by exploiting the technology at a very low level in Romania at the moment, with all the benefits that it entails. Therefore, it is desirable that this ap-proach, absolutely original and innovative in Romania, to be taken from as many investors and transformed in a short time in successful recipe, both economically, and in terms of social and environmental policies.
Renewable energy is an area that promises reliable investment for sustainable development in Romania, at least due to the following aspects: stimulation works to protect the environment and balancing the ecosystem to diversify agricultural production in terms of biomass production, infusion of capital in rural areas and creating new jobs, development of competitive markets, farmers boosting in ac-cessing grants and funding for sustainable development.
All the above mentioned aspects can help to develop and stabilise the country economy, mainly in rural areas, making its contribution to the conservation of both natural and healthy environment.

1219
REFERENCES1. Infomediu Europe. J Environ Ecol, http://www.infomediu.eu, 2013.2. S. E. COLESCA, C. N. CIOCOIU: An Overview of the Romanian Renewable Energy Sector.
Renew Sust Energ Rev, 24, 149 (2013).3. M. F. DEMIRBAS, M. BALAT, H. BALAT: Potential Contribution of Biomass to the Sustainable
Energy Development. Energy Convers Manag, 50, 1746 (2009).4. D. L. KLASS: Biomass for Renewable Energy Fuels and Chemicals. Elsevier, 1998.5. R. E. H. SIMS: Bioenergy Options for a Cleaner Environment in Developed and Developing
Countries. Elsevier, 2004.6. D. DEUBLEIN, A. STEINHAUSER (Eds): Biogas from Waste and Renewable Resources.
Wiley – VCH, 2008.7. S. C. VAC: Economic and Financial Analysis of Renewable Sources of Energy. Academic Press,
Cluj-Napoca, 2014.8. IEA BIOENERGY: Potential Contribution of Bioenergy to the World’s Future Energy Demand.
OECD/IEA, Paris, 2007.9. M. CICEKLI, N. T. BARLAS: Transformation of Today Greenhouses into High Technology
Vertical Farming Systems for Metropolitan Regions. J Environ Protect Ecol, 15 (4), 1779 (2014).10. G. STEFANOVIC, H. SKRIJELJ, I. RISTOVIC, B. MILUTINOVIC, O. MILOSEVIC, S. POPO-
VIC: Sustainable Waste Management Model-Case Study: Novi Pazar. J Environ Protect Ecol, 15 (3), 1005 (2014).
11. A. H. M. SHAMSUZZOHA, A. GRANT, J. CLARKE: Implementation of Renewable Energy in Scottish Rural Area: A Social Study. Renew Sust Energ Rev, 16 (1), 185 (2012).
12. B. GABRIELLE, L. BAMIÈRE, N. CALDES, S. DeCARA, G. DECOCQ, F. FERCHAUD, C. LOYCE, E. PELZER, Y. PEREZ, J. WOHLFAHRT, G. RICHARD: Paving the Way for Sustainable Bioenergy in Europe: Technological Options and Research Avenues for Large-scale Biomass Feedstock Supply. Renew Sust Energ Rev, 33, 11 (2014).
13. K. PATLITZIANAS, K. KARAGOUNIS: The Progress of RES Environment in the Most Recent Member States of the EU. Renew Energ, 36 (2), 429 (2011).
14. S. O. OYEDEPO: Towards Achieving Energy for Sustainable Development in Nigeria. Renew Sust Energ Rev, 34, 255 (2014).
15. Y. H. ZHENG, Z. F. LI, S. F. FENG, M. LUCAS, G. L. WU, Y. LI, G. M. JIANG: Biomass Energy Utilization in Rural Areas May Contribute to Alleviating Energy Crisis and Global Warming: A Case Study in a Typical Agro-village of Shandong, China. Renew Sust Energ Rev, 14 (9), 3132 (2010).
16. P. PUROHIT: Economic Potential of Biomass Gasification Projects under Clean Development Mechanism in India. J Clean Prod, 17, 181 (2009).
17. P. PARNPHUMEESUP, S. A. KERR: Stakeholder Preferences towards the Sustainable Develop-ment of CDM Projects: Lessons from Biomass (Rice Husk) CDM Project in Thailand. Energ Policy, 39, 3591 (2011).
18. P. R. VENKATESWARA, S. S. BARAL, R. DEY, S. MUTNURI: Biogas Generation Potential by Anaerobic Digestion for Sustainable Energy Development in India. Renew Sust Energ Rev, 14, 2086 (2010).
19. A. E. CIOABLA, I. IONEL, D. BISORCA, I. NEAMT, G. A. DUMITREL: Small-scale Biogas Production Using Residual Sludge as Substrate. J Environ Protect Ecol, 14 (4), 1777 (2013).
20. Law No 220/2008 on Establishing the Promotion System of Energy Production from Renewable Energy Sources.
21. GD 1844/2005 Updated, on the Promotion of Biofuels and Other Renewable Fuels for Transport. MO No 44/2006.
22. SC Global ARM SRL: Feasibility Study ‘Industrial Complex for Biogas Production and Trans-forming It into Electricity’. CEFA, Bihor County, Romania, 2008.

1220
23. National Institute of Statistics Romania (NISR): General Agricultural Census 2010, http://www.insse.ro/cms/files/RGA2010/.
24. Operational Programme: Romania-Bulgaria Cross-Border Cooperation Programme 2007–2013, Biofuels – Source of Common Sustainable Development in the Cross-border Cooperation Area. http://biofuels.dbioro.eu/rapita.php.
25. Order 1182/22.11.2005 of the Ministry of Environment and Water, on the Code of Good Agricultural Practice for the Protection of Waters against Pollution Caused by Nitrates from Agricultural Sources.
26. S. C. VAC, C. B. POCOL, C. E. POPITA: Renewable Energy – Investment for Sustainable Rural Development in Romania. B UASVM Hortic, 70 (2), 399 (2013).
27. Regional Development Agency North-West, Regional Development Plan 2014–2020, www.nord-vest.ro.
28. Law No 104/2011 on Ambient Air Quality.
Received 9 June 2015 Revised 23 July 2015

1221
JOURNAL OF ENVIRONMENTAL PROTECTION AND ECOLOGY
Official Journal of the Balkan Environmental Association
MESSAGE OF PROF. DR. F. VOSNIAKOS, PRESIDENT OF B.EN.A.
Dear All,
I am very pleased to announce you that the Impact Factor (IF) of JEPE for 2014 is 0.838!!!
This big success make all of us to be more responsible scientifically and more ambitious to become the IF this year more than 1.000!
I told you four years ago it is no dream to increase our IF and it can be done as long as all authors just keep the rules and present papers of high level. Continue this good work! Congratulation to all of you!
Best RegardsProf. Dr. F. K.Vosniakos
Journal of Environmental Protection and Ecology 16, No 3, 1221 (2015)
Information
1222
Journal of Environmental Protection and Ecology 16, No 3, 1222 (2015)
Information
B.EN.A.Balkan Environmental Association
TU-BENA OFFICE OPENING
On 16th September 2015 it was organised the Official opening of the new National Turkish Bureau of BENA (TU-BENA) in the Urban and Environmental Planning and Research Centre of Istanbul Technical University (ITU). The opening was made by the Vice Rector of ITU Prof. Dr. Ali Fuat Aydin. The new Chair of TU-BENA Prof. Dr. A. Yildizci replaced the retiring Chair Prof. Dr. H. H. Tok. Dr. H. H. Tok was awarded by the President of the International Board of BENA, Prof. Dr. F. K. Vosniakos, the Diploma of Excellence for his 15 years fruitful contribution to BENA in Turkey. The TU-BENA consists of the Chair Prof. Dr. A. Yildizci, Vice-Chair Ass. Prof. Dr. Η. Ε. Tuncay and its members Prof. Dr. Y. Kurucu, Ass. Prof. Dr. N. Ciliz, Prof. Dr. O. Demirel and Ass. Prof. Dr C. Y. Demec.
The opening was honored by the Vice-President of BENA International Board Dr. C. Zanbak and the Secretariat of the B.EN.A. International S. E. Europe Re-search, Dr. M. Golumbeanu.
1223
Journal of Environmental Protection and Ecology 16, No 3, 1223 (2015)
Errata
ERRATA
The author N.-B. DELIA of paper: ‘ASSESSING THE DEGREE OF DISPER-SION AND DISTRIBUTION OF HEAVY METALS IN SOIL AND PLANTS ASSOCIATED WITH AREA OF INFLUENCE OF A COAL POWER PLANT’ by N.-B. DELIA, published in book 2, vol. 16 (2015), 453–460, should be D. NICA-BADEA.
The name of Dr. E. BICA was omitted from the the authors team (a typing error) of paper ‘EVOLUTION OF INDUSTRIALISATION AND POLLU-TION IN CRAIOVA. THE CURRENT STATE OF THE MANAGEMENT OF SUSTAINABLE DEVELOPMENT’ by M. C. NEGULESCU, C. M. BARBU, S. MOISE, I. V. MATEI, I. PANDELICA, I. C. BARBU, published in book 2, vol. 16 (2015), 470–478 and the title of the paper with authors should be ‘EVOLU-TION OF INDUSTRIALISATION AND POLLUTION IN CRAIOVA. THE CURRENT STATE OF THE MANAGEMENT OF SUSTAINABLE DEVEL-OPMENT’ by M. C. NEGULESCU, C. M. BARBU, E. BICA, S. MOISE, I. V. MATEI, I. PANDELICA, I. C. BARBU.
1224
Journal of Environmental Protection and Ecology – JEPE of B.EN.A. (www.jepe.gr)
Call for papers Rapid Publication Journal
INSTRUCTION FOR AUTHORS
The language of the Journal is exclusively English. Contributions will be con sid ered only if they have not been previously published or been submitted elsewhere. The manuscripts must be submitted only by active B.EN.A. members (at least one-year old member) and should be submitted only in electronic form. Receipt of a con tri-bution for con sid er ation will be acknowledged immediately by the Edi torial Office. The acknowledge ment will indicate the paper reference number assigned to the con-tribution. Authors are particularly asked to quote this number on all sub se quent cor-respondence. The manuscripts are subjected to preliminary evaluation by the Editorial Board, and after selecting and receiving the refe rees consent they are forwarded to the appointed referees. The period of evaluation is 2–4 months. In case of negative report, the manuscripts are processed to other referees.
MANUSCRIPT PREPARATION
Authors are requested to prepare the manuscripts considering the following options: double-space, 2.5-cm margins on all sides, Times New Roman font, and ca. 60 char-acters per line and 30 lines per page or about 1800 characters per page (standard page). Use an English keyboard layout and the Symbol Font for Greek letters and mathematical symbols. All tables, figures, with their legends must be inserted within the text following their citation.
The length of manuscripts should be as follows: articles – max. 7 pages (not more than 13 standard pages including references, tables and figures), for review articles – max. 10 pages (not more than 18 standard pages), and for short communications – max. 3 pages (not more than 7 standard pages).
ORGANISATION
The title page should include the title, authors and their affiliations, complete address of the author to whom correspondence should be sent and an Abstract.Abstract – should not exceed 200 words and should give the subjects and con clusions of the article and all results of general interest. References and com pound numbers should not be mentioned in the Abstract. Maximum five key words should follow the Abstract.Aims – should include brief and clear remarks outlining the specific purpose of the work.
1225
Background – a short summary of the background material including num bered ref-erences.Experimental – should be sufficiently detailed (but concise) to guarantee re pro ducibil ity.Results and Discussion – should indicate the logic used for the in ter pre tation of data without lengthy speculations. Authors submitting material on purely theo retical prob lems or on a new experimental technique might unite the sections Ex peri men tal, Results and Discussion into one section under the heading Dis cussion.
Conclusions – short summary of the main achievements of the research.
References – should be typed at the end of the manuscript sheet and numbered in the order of their first mention in the text. They should be indicated by superscript Arabic numerical in the text. Abbre viations of journal titles should follow the style used in Chemical Abstracts Service Source Index, 1970 edition and supplements. Sequence and punctuation of references should be:1. F. K. VOSNIAKOS, K. S. FARMAKIS: Radioactive Releases from Nuclear and
Ther mo elec tric Power Plant Operation and Their Effect to the En vi ronment of Northern Greece. J En vi ron Prot Ecol, 1 (2), 255 (2000).
2. E. P. PAPANIKOLAU, P. KRITIDIS: Contamination of the Agricultural Land of Greece with Cs-137 and Its Effect on Crops. In: Intern. Conf. on Radioactivity in the Mediterranean Areas, Barcelona, May 1988, 457–466.
3. K. TASCHNER: Environmental Management and Audit Scheme. EEB In dus try Hand book (Eds C. Key, K. Tashner). Brussels, Belgium, 1998.
In preparing the list of References attention must be drawn to the following points:(a) Names of all authors of cited publications should be given;(b) Only the initials of first and middle names should be given.
Tables – each bearing a brief title should be num bered in Arabic numerals and placed in order of their mention in the text. Tables must be created using table format feature.
Figures and captions – figures must be numbered consecutively together with cap-tions. Illustrations must fit the format of the Journal and should not exceed 12×18 cm. For best results, illustrations are to be black and white, and submitted in the actual size at which they will appear in the Journal.
Chemical structures should be produced with the use of a drawing program such as ChemDraw or ChemWindows, and other graphics in Microsoft Excell or Microsoft PowerPoint format. Particular attention is drawn to the use of SI system of units, and IUPAC recommendations regarding symbols, units, and terminology.
Chemical equations must be supplied using equation editor.
ELECTRONIC SUBMISSION OF MANUSCRIPTS
Manuscripts should be submitted only in electronic form. Submission not in elec-tronic form may face a delay in publication. All text (including the title page, abstract,

1226
keywords, all sections of the manu script, figure captions, and references) and tabular material should be in one file. The manuscript must be prepared using MS Word 6.0 and above. Manuscripts in PDF are not accepted.
SUBMISSION OF MANUSCRIPTSManuscripts should be sent to the following address:
Prof. Dr. Fokion VosniakosBALKAN ENVIRONMENTAL ASSOCIATION (B.EN.A.)Alexander Technological Educational Institution, P.O. Box 141, 57 400 Sindos, Thessaloniki, GREECEE-mail: [email protected]://www.jepe.gr; http://www.ge.teithe.gr/~bena
All manuscripts are subject to critical review and the names of referees will not be dis closed to the authors. The manuscript sent back to the au thor for revision should be returned within 2 months. Oth er wise it will be considered with drawn. Revised manu-scripts are gen erally sent back to the original referees for comments, unless (in case of minor revisions) the editors accept them without seeking further opinions. Proofs should be corrected and re turned as soon as possible.
View publication statsView publication stats