Smoking-related Behaviour and Attitudes, 2007 - Smokefree ...
136
Omnibus Survey Report No. 36 Smoking-related Behaviour and Attitudes, 2007 A report on research using the National Statistics Omnibus Survey produced on behalf of the NHS Information Centre for health and social care Deborah Lader Office for National Statistics Government Buildings, Cardiff Road, Newport, NP10 8XG
-
Upload
khangminh22 -
Category
Documents
-
view
0 -
download
0
Transcript of Smoking-related Behaviour and Attitudes, 2007 - Smokefree ...

Omnibus Survey Report No. 36
Smoking-related Behaviour and Attitudes, 2007
A report on research using the National Statistics Omnibus Survey produced on behalf of the NHS Information Centre for health and social care
Deborah Lader
Office for National Statistics
Government Buildings,
Cardiff Road, Newport,
NP10 8XG

ISBN 978-1-85774-674-7
A National Statistics publication
National Statistics are produced to high
professional standards set out in the National
Statistics Code of Practice. They are produced
free from political influence.
About us
The Office for National Statistics
The Office for National Statistics (ONS) is the
executive office of the UK Statistics Authority,
a non-ministerial department which reports
directly to Parliament. ONS is the UK
government’s single largest statistical
producer. It compiles information about the
UK’s society and economy which provides
evidence for policy and decision-making and
in the allocation of resources.
The Director of ONS is also the National
Statistician.
Contacts
This publication
For information about the content of this
publication, contact Omnibus Survey
Tel: 01633 455810
Email: [email protected]
Other customer and media enquiries
ONS Customer Contact Centre
Tel: 0845 601 3034
International: +44 (0)845 601 3034
Minicom: 01633 812399
Email: [email protected]
Fax: 01633 652747
Post: Room 1015, Government Buildings,
Cardiff Road, Newport, South Wales
NP10 8XG
You can find more information about our
other statistical releases at
www.statistics.gov.uk
Copyright and reproduction
© Crown copyright 2008
Published with the permission of the Office for
Public Sector Information (OPSI)
You may use this publication (excluding logos)
free of charge in any format for research,
private study or internal circulation within an
organisation providing it is used accurately
and not in a misleading context. The material
must be acknowledged as Crown copyright and
you must give the title of the source
publication. Where we have identified any
third party copyright material you will need to
obtain permission from the copyright holders
concerned.
For re-use of this material you must apply for a
Click-Use Public Sector Information (PSI)
Licence from:
Office of Public Sector Information, Crown
Copyright Licensing and Public Sector
Information, St Clements House, 2–16
Colegate, Norwich NR3 1BQ
Tel: 01603 621000
www.opsi.gov.uk/click-use/index.htm

Smoking-related Behaviour and Attitudes, 2007
Office for National Statistics i
Table of contents
List of tables ............................................................................................................. iii
List of figures...........................................................................................................viii
Conventions and symbols .........................................................................................ix
Summary ................................................................................................................... 1
1: Introduction .........................................................................................................4
2: Smoking behaviour and habits ............................................................................6
3: Giving up smoking ............................................................................................. 13 Wanting to give up smoking .................................................................................................13 Intending to give up smoking ...............................................................................................14 The relationship between wanting to and intending to give up smoking ............................15
4: Attempts to give up smoking ............................................................................ 30 Previous attempts to give up smoking ................................................................................. 30 Help giving up smoking ....................................................................................................... 33
5: Awareness of health issues related to smoking.................................................58 Awareness of relative risk of smoking ................................................................................. 58 Awareness of the effect of second-hand smoking................................................................ 58
6: Attitudes related to smoking..............................................................................72 Smoking in the home ........................................................................................................... 72 Non-smokers' attitudes towards people smoking near them.............................................. 72 Smokers’ behaviour in the presence of non-smokers .......................................................... 74 Smoking restrictions at work ............................................................................................... 76
7: Views about restrictions on smoking in public ...................................................87 Views on smoking restrictions in public places ................................................................... 87 Taxation on tobacco ............................................................................................................. 89 Increase in legal age of purchase of tobacco ........................................................................ 89
Appendix A: The NS Omnibus Survey ..................................................................103 The sample ......................................................................................................................... 103 Weighting ........................................................................................................................... 103 Fieldwork............................................................................................................................ 104 Questions............................................................................................................................ 104 Response rates.................................................................................................................... 104
Appendix B: The Questions ...................................................................................106

Smoking-related Behaviour and Attitudes, 2007
Office for National Statistics ii
Appendix C: Bibliography/reference .................................................................... 124

Smoking-related Behaviour and Attitudes, 2007
Office for National Statistics iii
List of tables
Table 2.1 Cigarette smoking status: by sex, 1996-2007 .......................................................................... 8
Table 2.2 Prevalence of cigarette smoking: by sex and socio-economic classification, 2001-2007 ....... 9
Table 2.3 Daily cigarette consumption: by sex, 1996-2007 .................................................................. 10
Table 2.4 Time between waking and the first cigarette: by sex, 1996-2007 .......................................... 11
Table 2.5 Time between waking and the first cigarette: by number of cigarettes smoked per day,
2007 ................................................................................................................................12
Table 3.1 Views on giving up smoking: by sex, 1997-2007 ....................................................................17
Table 3.2 Views on giving up smoking: by number of cigarettes smoked per day, 2007 ......................18
Table 3.3 Views on giving up smoking: by whether have tried to give up smoking in the last five years,
2007 ................................................................................................................................18
Table 3.4 Views on giving up smoking: by whether have tried to give up smoking in the last year,
2007 ................................................................................................................................19
Table 3.5 Main reasons for wanting to stop smoking: by sex, 1996-2007............................................ 20
Table 3.6 Main reasons for wanting to stop smoking: by number of cigarettes smoked per day,
2007 ................................................................................................................................21
Table 3.7 When smokers intend to give up smoking: by sex, 1999-2007 ............................................. 22
Table 3.8 When smokers intend to give up smoking: by socio-economic classification and by presence
of children in the household, 2007 ...................................................................................... 23
Table 3.9 When smokers intend to give up smoking: by number of cigarettes smoked per day,
2007 ............................................................................................................................... 23
Table 3.10 When smokers intend to give up smoking: by whether they have tried to give up smoking
in the last five years, 2007 ................................................................................................... 24
Table 3.11 When smokers intend to give up smoking: by whether have tried to give up smoking in the
last year, 2007 ...................................................................................................................... 24
Table 3.12 Likelihood of smoking a year from now: by smoking status, 1999-2007............................ 25
Table 3.13 Likelihood of smokers still smoking a year from now: by whether intend to give up
smoking, 2007...................................................................................................................... 26
Table 3.14 Likelihood of smokers still smoking a year from now: 1999-2007 ..................................... 26
Table 3.15 When smokers intend to give up smoking: by whether they want to give up smoking, 1999-
2007 ............................................................................................................................... 27
Table 3.16 Whether smokers want to and intend to give up smoking: 1999-2007............................... 28
Table 3.17 Whether smokers want to and intend to give up smoking: by sex, 2007 ............................ 28
Table 3.18 Whether smokers want to and intend to give up smoking: by number of cigarettes smoked
per day, 2007........................................................................................................................ 29

Smoking-related Behaviour and Attitudes, 2007
Office for National Statistics iv
Table 3.19 Whether smokers want to and intend to give up smoking: by socio-economic classification
and by presence of children in the household, 2007 ........................................................... 29
Table 4.1 Ever tried to give up smoking: by sex, 1999-2007................................................................. 36
Table 4.2 Ever tried to give up smoking: by socio-economic classification and by presence of children
in the household, 2007......................................................................................................... 36
Table 4.3 Ever tried to give up smoking: by number of cigarettes smoked per day, 2007................... 37
Table 4.4 Attempts to give up smoking in last five years: by sex, 1999-2007....................................... 37
Table 4.5 Attempts to give up smoking in past five years: by number of cigarettes smoked per day,
2007 ............................................................................................................................... 37
Table 4.6 Attempts to give up smoking in the last year: 1999-2007..................................................... 38
Table 4.7 Number of attempts to give up smoking in the last year: 1999-2007 ................................... 38
Table 4.8 Length of time gave up for the last time stopped smoking: 1999-2007 ............................... 39
Table 4.9 Length of time gave up for the last time stopped smoking: by sex, 2007............................. 39
Table 4.10 Length of time gave up for the last time stopped smoking: by number of cigarettes smoked
per day, 2007........................................................................................................................ 40
Table 4.11 Main reasons for starting smoking again: 2002-2007......................................................... 40
Table 4.12 Main reasons for not trying to give up smoking: 2002-2007...............................................41
Table 4.13 People who have tried to get smokers to quit: 1999-2007 ...................................................41
Table 4.14 People who have tried to get smokers to quit: by sex, 2007................................................ 42
Table 4.15 People who have tried to get smokers to quit: by number of cigarettes smoked per day,
2007 ............................................................................................................................... 42
Table 4.16 Length of time since stopped smoking: by sex, 1999-2007................................................. 43
Table 4.17 Length of time since stopped smoking: by age, 2007 .......................................................... 44
Table 4.18 Length of time since stopped smoking: by number of cigarettes smoked per day, 2007 ... 44
Table 4.19 Main reasons for having stopped smoking: 1996-2007 ...................................................... 45
Table 4.20 Main reasons for having stopped smoking: by sex and by age, 2007................................. 46
Table 4.21 Main reasons for having stopped smoking: by number of cigarettes smoked per day,
2007 ............................................................................................................................... 47
Table 4.22 Main reasons for having stopped smoking: by length of time since stopped, 2007........... 48
Table 4.23 Sources of help and advice used in the last year: by sex, 1999-2007.................................. 49
Table 4.24 Sources of help and advice used in the last year: by socio-economic classification, 2007..51
Table 4.25 Sources of help and advice used in the last year: by number of cigarettes smoked per day,
2007 ............................................................................................................................... 52
Table 4.26 Source of advice on smoking in the last five years: 1996-2007 .......................................... 53
Table 4.27 Source of advice on smoking in the last five years: by sex, 2007 ........................................ 54

Smoking-related Behaviour and Attitudes, 2007
Office for National Statistics v
Table 4.28 Source of advice on smoking in the last five years: by number of cigarettes smoked per
day, 2007.............................................................................................................................. 54
Table 4.29 Source of advice on smoking in the last five years: by socio-economic classification,
2007 ............................................................................................................................... 55
Table 4.30 Type of advice given in the last five years, and whether it was helpful or not: by sex, 1996-
2007 ............................................................................................................................... 56
Table 4.31 Whether ex-smokers were given advice on smoking in the last five years: 1999-2007 .......57
Table 5.1 What people think is the main cause of death before the age of 65 in the United Kingdom:
1996-2007 ............................................................................................................................ 62
Table 5.2 What people think is the main cause of death before the age of 65 in the United Kingdom:
by smoking status, 2007 ...................................................................................................... 62
Table 5.3 What people think is the main cause of death before the age of 65 in the United Kingdom:
by age and sex, 2007 ............................................................................................................ 63
Table 5.4 Views on whether or not living with a smoker increases a child's risk of certain medical
conditions: 1996-2007 ......................................................................................................... 64
Table 5.5 Views on whether or not living with a smoker increases a child's risk of certain medical
conditions: by smoking status, 2007 ................................................................................... 65
Table 5.6 Views on whether or not living with a smoker increases a child's risk of certain medical
conditions: by sex and by age, 2007 .................................................................................... 66
Table 5.7 Views on whether or not living with a smoker increases a child's risk of certain medical
conditions: by socio-economic classification and by presence of children under 16 in
household, 2007................................................................................................................... 67
Table 5.8 Views on whether or not second-hand smoking increases a non-smoking adult's risk of
certain medical conditions: 1996-2007 ............................................................................... 68
Table 5.9 Views on whether or not second-hand smoking increases a non-smoking adult's risk of
certain medical conditions: by smoking status, 2007 ......................................................... 69
Table 5.10 Views on whether or not second-hand smoking increases a non-smoking adult's risk of
certain medical conditions: by sex and by age, 2007 .......................................................... 70
Table 5.11 Views on whether or not second-hand smoking increases a non-smoking adult's risk of
certain medical conditions: by socio-economic classification and by presence of children
under 16 in household, 2007 ................................................................................................71
Table 6.1 Extent to which smoking is allowed in peoples’ homes: by smoking status, 2006 and
2007 ................................................................................................................................77
Table 6.2 Extent to which smoking is allowed in peoples’ homes: by smoking status, 2007................77
Table 6.3 Extent to which smoking is allowed in peoples’ homes: by sex and by age, 2007................ 78
Table 6.4 Extent to which smoking is allowed in peoples’ homes: by socio-economic classification and
by presence of children under 16 in household, 2007......................................................... 78
Table 6.5 Extent to which smoking is allowed in peoples’ homes: by views on whether or not living
with a smoker increases a child's risk of certain medical conditions, 2007........................ 79

Smoking-related Behaviour and Attitudes, 2007
Office for National Statistics vi
Table 6.6 Extent to which smoking is allowed in peoples’ homes: by views on whether or not second-
hand smoking increases a non-smoking adult's risk of certain medical conditions, 2007. 79
Table 6.7 Non-smokers' attitude to people smoking near them: 1997-2007........................................80
Table 6.8 Non-smokers' attitude to people smoking near them: by sex and by smoking status,
2007 ...............................................................................................................................80
Table 6.9 Non-smokers' reasons for saying that they would mind if smokers smoke near them: 1997-
2007 ................................................................................................................................81
Table 6.10 Non-smokers' attitude to people smoking near them: by views on whether or not second-
hand smoking increases a non-smoking adult's risk of certain medical conditions, 2007..81
Table 6.11 Smokers' behaviour in a room with non-smokers: 1997-2007 ............................................ 82
Table 6.12 Smokers' behaviour in a room with non-smokers: by number of cigarettes smoked and by
sex, 2007 .............................................................................................................................. 83
Table 6.13 Smokers' behaviour in a room with non-smokers: by views on whether or not living with a
smoker increases a child's risk of certain medical conditions, 2007................................... 83
Table 6.14 Smokers' behaviour in a room with non-smokers: by views on whether or not second-hand
smoking increases a non-smoking adult's risk of certain medical conditions, 2007.......... 84
Table 6.15 Restrictions on smoking where person currently works: : by smoking status, 2007.......... 85
Table 6.16 Restrictions on smoking where person currently works: by sex, 2007............................... 85
Table 6.17 Restrictions on smoking where person currently works: by socio-economic classification,
2007 ............................................................................................................................... 86
Table 7.1 Agreement with smoking restrictions in certain places: by smoking status, 2007 ................91
Table 7.1 Agreement with smoking restrictions in certain places: by smoking status, 2007 ................91
Table 7.2 Agreement with smoking restrictions in certain places: by sex and by age, 2007.................91
Table 7.3 Agreement with smoking restrictions in certain places: by socio-economic classification and
by presence of children under 16 in household, 2007......................................................... 92
Table 7.4 Agreement with smoking restrictions in places where there are, or likely to be, children: by
parental status and smoking status, 2007 ........................................................................... 93
Table 7.5 Agreement with smoking restrictions in places where there are, or likely to be, children: by
parental status, by sex and by age, 2007 ............................................................................. 94
Table 7.6 Agreement with smoking restrictions in places where there are, or likely to be, children: by
parental status and socio-economic classification, 2007 .................................................... 95
Table 7.7 Agreement with new legislation on smoking restrictions in public places: by smoking status,
2007 ............................................................................................................................... 96
Table 7.8 Agreement with new legislation on smoking restrictions in public places: by sex and by age,
2007 ............................................................................................................................... 96
Table 7.9 Agreement with new legislation on smoking restrictions in public places: by socio-economic
classification and by presence of children under 16 in household, 2007............................ 97

Smoking-related Behaviour and Attitudes, 2007
Office for National Statistics vii
Table 7.10 Changes in visiting pubs since smoking restrictions introduced: by smoking status,
2007 ............................................................................................................................... 98
Table 7.11 Changes in visiting pubs since smoking restrictions introduced: by sex and by age, 2007. 98
Table 7.12 Changes in visiting pubs since smoking restrictions introduced: by socio-economic
classification and by presence of children under 16 in household, 2007............................ 99
Table 7.13 Views on acceptable amount of tax increase: 1996-2007 .................................................... 99
Table 7.14 Views on acceptable amount of tax increase: by smoking status, 2007 ............................ 100
Table 7.15 Views on acceptable amount of tax increase: by sex and by age, 2007 ............................. 100
Table 7.16 Views on government legislation increasing legal age of purchase of tobacco: by smoking
status, 2007 .........................................................................................................................101
Table 7.17 Views on government legislation increasing legal age of purchase of tobacco: by sex and by
age, 2007 .............................................................................................................................101
Table 7.18 Views on government legislation increasing legal age of purchase of tobacco: by socio-
economic classification, 2007 ............................................................................................ 102

Smoking-related Behaviour and Attitudes, 2007
Office for National Statistics viii
List of figures
Figure 4.1 People who have tried to get smokers to quit: by sex, 2007................................................... 32
Figure 4.2 Source of advice on smoking in the last five years: by sex, 2007........................................... 34
Figure 5.1 Views on whether or not living with a smoker increases a child’s risk of certain medical
conditions: 2007 .................................................................................................................. 60
Figure 5.2 Views on whether or not second-hand smoking increases a non-smoking adult’s risk of
certain medical conditions: 2007 .........................................................................................61
Figure 6.1 Non-smokers’ reasons for saying they would mind if smokers smoke near them: 2007 ...... 73
Figure 6.2 Smokers’ behaviour when they are with adult non-smokers and children: by number of
cigarettes smoked a day, 2007 ..............................................................................................75
Figure 6.3 Percentage of smokers’ who would not smoke at all when they are with adult non-smokers
and children: 1997-2007 ...................................................................................................... 76
Figure 7.1 Percentage of people agreeing with the ban on smoking in certain places: 2007.................. 87

Smoking-related Behaviour and Attitudes, 2007
Office for National Statistics ix
Conventions and symbols
Presentation of data
A percentage may be quoted in the text for a single category that is identifiable in the
tables only by summing two or more component percentages. In order to avoid rounding
errors, the percentage has been recalculated for the single category and therefore may
differ by one percentage point from the sum of the percentages derived from the tables.
The row or column percentages may add to 99 per cent or 101 per cent because of
rounding.
0 per cent in the tables indicates that fewer than 0.5 per cent of respondents gave this
answer. Instances where no answers for a particular response were given are indicated in
the tables by '-'.
A few people failed to answer some questions. These ‘no answers’ have been excluded from
the analysis, and so tables that describe the same population have slightly varying bases.
Small bases are associated with relatively high sampling errors and this affects the
reliability of estimates. In general, percentage distribution is shown if the base is 50 or
more. Where the base is smaller than this, actual numbers are shown within square
brackets. Where estimates are considered unreliable due to relatively high sampling error,
generally if the base is less than 100, figures in the tables are presented with a turquoise
shaded background.
Sampling error
Since the data in this report were obtained from a sample of the population, they are
subject to sampling error. The Omnibus survey has a multi-stage sample design, and this
has been taken into account when identifying statistically significant differences in the
report.
Design effects were calculated for age or sex comparisons and were usually between 1.0
and 1.2. For other comparisons, an estimated design effect of 1.2 was used. Any differences
mentioned in the report are statistically significant at the 95 per cent confidence level,
unless otherwise stated.
It is important to remember that factors other than sampling errors can affect the
reliability of the results obtained from any survey. Other sources of inaccuracy include, for
example, non-response bias and under-reporting, which are more difficult to quantify.
Weighting
Because only one household member is interviewed at each address, people in households
containing few adults have a higher probability of selection than those in households with
many. Where the unit of analysis is individual adults, as it is for this module, a weighting
factor is applied to correct for this unequal probability of selection. This was the weighting
system used for previous reports.
The weighting system used for 2007 figures also adjusts for some non-response bias by
calibrating the Omnibus sample to ONS population totals. The weighting ensures that the
weighted sample distribution across regions and across age-sex groups matches that in the

Smoking-related Behaviour and Attitudes, 2007
Office for National Statistics x
population. Tables in this report show the 2007 estimates and bases weighted to
population totals, and the bases are also shown unweighted.
The tables in this report showing time-series data also give 2007 estimates weighted only
for unequal probability of selection (as in previous years) to give an indication of the effect
of the revised weighting system. There appeared to be little effect on the estimates by
introducing the new weighting system. When comparing the 2007 estimates and those
from previous years, the 2007 figures used in the commentary are those based on the old
weighting system unless figures from previous years aren’t quoted. Care should be taken
when comparing 2007 estimates based on the new weighting system with those from
previous reports using the old weighting system.

Summary
Smoking-related Behaviour and Attitudes, 2007
Office for National Statistics 1
Summary
Smoking behaviour and habits (Chapter 2)
• 11 per cent of smokers reported that they smoked their first
cigarette of the day within five minutes of waking up. Smoking
within five minutes of waking was much more common among
those who smoked at least 20 cigarettes per day (24 per cent) than
it was among those who smoked 10 – 19 cigarettes per day (10 per
cent) or those who smoked fewer than 10 a day (2 per cent).
Giving up smoking (Chapter 3)
• The percentage of current smokers who said they would like to
give up smoking (73 per cent in 2007 using the old weighting
system) was similar to figures for previous years (for example, 72
per cent wanted to give up in 2005 and 2006 and 73 per cent in
2004).
• Overall, 86 per cent of smokers who wanted to give up mentioned
at least one health-related reason for wanting to give up smoking.
The most common reason, mentioned by 71 per cent, was that it
would be better for their health in general. Over a quarter of
smokers (27 per cent) said they wanted to give up smoking
because they could not afford to smoke or considered smoking a
waste of money. Seven per cent of smokers said they wanted to
give up smoking due to the ban on smoking in public places.
• Over half (57 per cent) of smokers said that they intended to give
up smoking within the next 12 months – this was similar to the
figures for previous years.
• Smokers who had made a serious attempt to give up smoking in
the past five years were more likely to say that they intended to
give up (86 per cent) than were those who had not (64 per cent).
Attempts to give up smoking (Chapter 4)
• Nearly four-fifths (79 per cent) of current smokers had tried to
give up smoking in the past, and three-fifths (60 per cent) of
current smokers had made a serious attempt in the past five years.
This was similar to the percentage found in previous years.
• About a quarter (26 per cent) of ex-smokers had given up within
the past five years.
• 53 per cent of smokers had sought some kind of advice or help for
stopping smoking in the last year and 54 per cent had received
advice from a medical professional in the past five years.

Summary
Smoking-related Behaviour and Attitudes, 2007
Office for National Statistics 2
Awareness of health risks associated with smoking (Chapter 5)
• Forty two per cent of people thought that smoking was
responsible for the most premature deaths (deaths before the age
of 65) in the United Kingdom. This was statistically significantly
lower than the 46 per cent who mentioned it in 2006.
• Awareness of the effects of second-hand smoking was widespread.
Respectively, 91 per cent and 85 per cent of respondents thought
that a child’s risk of getting chest infections and asthma were
increased by living with a smoker. The percentages were similar to
those found in 2006.
• Over 80 per cent thought that second-hand smoking would
increase a non-smoking adult’s risk of lung cancer, bronchitis and
asthma. Compared to 2006, the percentages who thought second-
hand smoking would increase a non-smoking adult’s risk of
bronchitis and heart disease were slightly lower.
Attitudes related to smoking (Chapter 6)
• About two-thirds (67 per cent) said that smoking was not allowed
at all in their home, a statistically significant increase since 2006
when 61 per cent of people said this. Around a fifth (21 per cent)
said it was allowed in some rooms or at some times and only 12
per cent said it was allowed anywhere.
• 59 per cent of those who did not smoke (54 per cent of men and
64 per cent of women) said they would mind if other people
smoked near them. The 2007 figure using the old weighting
system was 60 per cent, similar to the 2005 and 2006 percentages
(62 per cent and 60 per cent respectively).
• 79 per cent of smokers said they did not smoke at all when they
are in a room with a child and 13 per cent said they would smoke
fewer cigarettes in the presence of a child.
• The percentage of smokers who would not smoke at all in front of
children has increased over the survey years from 54 per cent in
1997 to 78 per cent in 2007 (using old weighting scheme for
comparability).
• The majority of smokers said they would modify their smoking in
a room with adult non-smokers – 48 per cent would not smoke at
all and 33 per cent would smoke fewer cigarettes.
• Over three-fifths (62 per cent) of people who were in work said
that smoking was not allowed at all on the premises where they
worked in accordance with the smoke-free law and a further 31
per cent said there was no smoking allowed on the premises or the
grounds where they work.
Views on smoking restrictions in public places (Chapter 7)
• In 2007, the vast majority of those interviewed agreed with the
restrictions on smoking at work (86 per cent), and the smoking
ban in restaurants (94 per cent), in indoor shopping centres (92

Summary
Smoking-related Behaviour and Attitudes, 2007
Office for National Statistics 3
per cent), in indoor sports and leisure centres (95 per cent), in
indoor areas at railway and bus stations (85 per cent) and in other
public places such as banks and post offices (96 per cent). 94 per
cent of respondents agreed that there should be smoking
restrictions in places where there are, or are likely to be, children
under the age of 16. A smaller percentage of people, 75 per cent,
agreed with restrictions on smoking in pubs.
• 80 per cent of respondents said they agreed with the legislation
that banned smoking in enclosed public places – 61 per cent
strongly agreed and 19 per cent agreed. Fourteen per cent of
people disagreed – with 6 per cent disagreeing strongly
• Around three-quarters of people (73 per cent) said they visited
pubs about as often nowadays as before the smoking ban, but 11
per cent said they went more often before the smoking
restrictions were in place. The remaining 16 per cent said they
went less often before the smoking ban.

1: Introduction
Smoking-related Behaviour and Attitudes, 2007
Office for National Statistics 4
1: Introduction
This report presents the results of a survey on smoking behaviour and
attitudes. This was the twelfth in a series of studies carried out for the
Department of Health and the NHS Information Centre for health and
social care and was conducted in Great Britain in October and November
2007 as part of the National Statistics Omnibus Survey. Earlier surveys
were carried out in November and December 1995 and 1996 and 1997 and
in October and November 1999 – 2006.
The first three surveys in the series were designed to monitor smoking
behaviour, people's awareness of the effect of smoking and second-hand
smoking, and attitudes towards smoking, tobacco advertising and smoking
restrictions. Targets relating to the prevalence of smoking are monitored
by other surveys1, but the Omnibus survey has been used to monitor
changes in attitudes towards smoking in general and towards smoking in
public places.
In December 1998, the Department of Health published Smoking Kills – a
White Paper on tobacco, which set out practical measures to reduce
smoking. In 2004, the Department of Health released a new Public Health
White Paper - Choosing Health: Making healthier choices easier, which
builds on the 1998 proposals.
In September 2000, the first ever smoking inequalities target was set in
the Cancer Plan, and was repeated in the Public Service Agreement in
2004. This aimed to reduce smoking rates among adults to 21 per cent or
less and among manual groups to 26 per cent or less by 2010. Health
inequalities were made a key priority for the NHS in the Priorities and
Planning Framework (PPF) for 2003-06. A key target for the NHS was to
increase the number of people giving up smoking, with a particular focus
on disadvantaged groups and areas.
One of the measures proposed in the 1998 White Paper was to end tobacco
advertising and tobacco sponsorship and promotion2. The questions on
people’s knowledge of restrictions on tobacco advertising and their
attitudes towards tobacco advertising and sponsorship were therefore not
included in the 1999 survey. In their place, the section on giving up
smoking was expanded, and has been repeated in subsequent years. In
2002 two new questions were added to look at difficulties respondents
have when trying to give up smoking.
In 2003, the section on people's attitudes to smoking restrictions in public
places was expanded to ask about indoor shopping centres, indoor sports
and leisure centres and indoor areas at railway and bus stations. In order
1 The results from GHS 2006 survey are available on-line at: http://www.statistics.gov.uk/statbase/Product.asp?vlnk=5756 2 See the Tobacco Advertising and Promotion Act 2002 which can be accessed at http://www.legislation.hmso.gov.uk/acts/acts2002/20020036.htm

1: Introduction
Smoking-related Behaviour and Attitudes, 2007
Office for National Statistics 5
to get a better picture of people's awareness of the risk of second-hand
smoke to children, respondents were also asked whether they thought
there should be restrictions on smoking in places where there are, or are
likely to be, children under the age of 16. Further questions were added on
the type of smoking restriction people would favour in pubs and how often
they would visit pubs if these restrictions were in place.
A comprehensive ban on smoking in all enclosed public places was
introduced from March 2006 in Scotland, April 2007 in Wales and from
July 2007 in England 3,4. Respondents were therefore asked a slightly
different set of questions in 2007 about their views on smoking
restrictions to those in previous years to reflect the change in legislation.
In addition to examining trends, the analysis in this report also explores
the relationship between various smoking-related attitudes and
behaviour5. The key topics examined and presented in this report include:
• smoking behaviour and habits (Chapter 2)
• views about giving up smoking (Chapter 3)
• attempts to stop smoking (Chapter 4)
• awareness of health issues related to smoking (Chapter 5)
• attitudes towards smoking (Chapter 6)
• views about restrictions on smoking (Chapter 7).
3 The Health Bill can be accessed at: http://www.publications.parliament.uk/pa/ld200506/ldbills/076/2006076.htm 4 The Smoking, Health and Social Care (Scotland) Bill was published on December 17, 2004. 5 See Appendix A for more information on the survey, and Appendix B for a list of all the questions asked.

2: Smoking behaviour and habits
Smoking-related Behaviour and Attitudes, 2007
Office for National Statistics 6
2: Smoking behaviour and habits
As discussed previously, the weighting system used for 2007 figures also
adjusts for some non-response bias by calibrating the Omnibus sample to
ONS population totals. The tables in this report showing time-series data
also give 2007 estimates weighted only for unequal probability of selection
(as in previous years) to give an indication of the effect of the revised
weighting system. When comparing the 2007 estimates and those from
previous years, the 2007 figures used in the commentary are those based
on the old weighting system.
In 2007, 22 per cent of adults aged 16 and over smoked. Although smoking
has decreased in prevalence since 1996 (28 per cent), the proportion of
current cigarette smokers (22 per cent), ex-smokers (27 per cent) and
lifetime non-smokers (51 per cent) has not changed significantly in recent
years.
A higher proportion of men than women were current cigarette smokers
(25 per cent compared with 20 per cent). Men were more likely than
women to have given up smoking cigarettes (28 per cent compared with 23
per cent). Conversely, women were more likely than men to have never
smoked (57 per cent of women compared with 47 per cent of men).
The key source of data for monitoring change in the prevalence of cigarette
smoking in the adult population is the General Household Survey (GHS).
The relevant GHS questions were included in the NS Omnibus Survey to
help interpret the other data related to smoking6. Prevalence rates in the
Omnibus Survey were similar as those found in the GHS: for example, in
2006 the GHS found that 23 per cent of men, 21 per cent of women and 22
per cent of the whole adult population smoked.
Table 2.1
Those people in routine or manual occupations were more likely to smoke
than those in managerial or professional occupations (30 per cent
compared with 16 per cent). This was true for men (36 per cent compared
with 15 per cent) and for women (25 per cent compared with 18 per cent)
and is similar to findings from previous years. Those in routine and
manual occupations were also more likely to smoke (30 per cent) than
those in intermediate occupations (19 per cent).
Table 2.2
Just over two fifths of smokers (43 per cent) smoked 10-19 cigarettes per
day, just under a third (32 per cent) smoked fewer than 10 and just under
a quarter (24 per cent) smoked 20 or more per day. The number of
cigarettes consumed daily by smokers has decreased since 1996, but has
remained fairly static since 2004 : for example 33 per cent smoked 20 or
6 The results from the GHS 2006 survey are available online at : http://www.statistics.gov.uk/statbase/Product.asp?vlnk=5756

2: Smoking behaviour and habits
Smoking-related Behaviour and Attitudes, 2007
Office for National Statistics 7
more a day in 1996 compared with 26 per cent in 2004 and 26 per cent in
2007. This overall decrease was evident among men (the percentage of
men who smoked 20 or more a day fell from 38 per cent in 1996 to 26 per
cent in 2007) but not among women.
Although it appeared that men continue to be heavier smokers than
women, on average, the difference was not statistically significant.
Table 2.3
As an indicator of dependence, smokers were asked how soon after waking
they smoked their first cigarette of the day, and 11 per cent reported having
done so within five minutes of waking up.
Smoking within five minutes of waking was much more common among
those who smoked at least 20 cigarettes per day (24 per cent) than it was
among those who smoked 10–19 cigarettes per day (10 per cent). Those
who smoked 10-19 cigarettes a day were also significantly more likely to
smoke within five minutes of waking than those who smoked fewer than
ten cigarettes per day (2 per cent). Conversely, more than a half (55 per
cent) of those who smoked fewer than 10 cigarettes a day waited at least
two hours before lighting up in the morning, compared with 13 per cent of
those who smoked 10-19 cigarettes and 3 per cent of those who smoked 20
or more a day.
Tables 2.4 - 2.5

2: Smoking behaviour and habits
Smoking-related Behaviour and Attitudes, 2007
Office for National Statistics 8
Table 2.1 Cigarette smoking status: by sex, 1996-2007
All persons aged 16 and over Cigarette smoking 1996 1997 1999 2000 2001 2002 2003 2004 2005 2006 2007 * 2007 ** status Men % % % % % % % % % % % % Current cigarette smoker 28 26 27 26 26 26 26 23 25 26 24 25 Ex-regular cigarette smoker 32 32 34 34 32 30 29 30 29 30 30 28 Never or only occasionally smoked cigarettes 39 41 39 40 43 44 45 47 45 44 46 47 Unweighted base 1027 Weighted base (000s) ** 22,265 Weighted base * 1787 1711 1644 1594 1547 1747 1628 1651 1088 1088 1058 Women Current cigarette smoker 28 27 26 26 23 24 22 23 23 23 20 20 Ex-regular cigarette smoker 19 23 22 22 21 23 22 25 22 24 24 23 Never or only occasionally smoked cigarettes 52 50 52 51 56 54 56 52 55 52 56 57 Unweighted base 1253 Weighted base (000s) ** 24,003 Weighted base * 1911 2006 1916 1734 1946 2074 1891 1899 1314 1262 1220 All Current cigarette smoker 28 26 27 26 24 25 24 23 24 24 22 22 Ex-regular cigarette smoker 26 27 28 28 25 26 25 27 25 27 27 25 Never or only occasionally smoked cigarettes 46 46 46 46 50 49 51 50 51 49 51 52 Unweighted base 2280 Weighted base (000s) ** 46,268 Weighted base * 3698 3717 3560 3328 3495 3821 3519 3550 2402 2348 2278 1996-2006 percentages and bases weighted for unequal chance of selection * weighted for unequal chance of selection ** weighted to population totals

2: Smoking behaviour and habits
Smoking-related Behaviour and Attitudes, 2007
Office for National Statistics 9
Table 2.2 Prevalence of cigarette smoking: by sex and socio-economic classification, 2001-2007
All persons aged 16 and over Socio-economic 2001 2002 2003 2004 2005 2006 2007 * 2007 ** 2007 2007 2007 classification Weighted
base * Unweighted
base Weighted
base (000s) **
Percentage smoking cigarettes
Men Managerial and professional occupations
17 17 16 16 16 13 15 15 431 419 8,907
Intermediate occupations
26 31 26 21 28 20 19 23 155 154 3,256
Routine and manual occupations
33 34 36 30 35 37 35 36 403 402 8,257
Total1 26 26 26 23 25 26 24 25 1058 1027 22,265 Women Managerial and professional occupations
20 16 15 18 16 18 18 18 382 405 7,376
Intermediate occupations
22 22 16 20 21 19 16 16 258 263 5,006
Routine and manual occupations
27 30 34 29 30 29 25 25 436 469 8,369
Total1 23 24 23 23 22 23 20 20 1220 1253 24,003 All Managerial and professional occupations
18 16 16 17 16 16 16 16 814 824 16,283
Intermediate occupations
24 25 19 21 24 19 17 19 413 417 8,262
Routine and manual occupations
30 32 34 29 32 33 30 30 839 871 16,626
Total1 24 25 24 23 24 24 22 22 2278 2280 46,268 2001-2006 percentages and bases weighted for unequal chance of selection Bases for earlier years can be found in Omnibus reports for each year. * weighted for unequal chance of selection ** weighted to population totals ' Those who could not be classified (full-time students, those who had never worked or were long-term unemployed, and those whose occupation was not stated or inadequately described) are not shown as separate categories, but are included in the total.

2: Smoking behaviour and habits
Smoking-related Behaviour and Attitudes, 2007
Office for National Statistics 10
Table 2.3 Daily cigarette consumption: by sex, 1996-2007
All smokers Number of cigarettes 1996 1997 1999 2000 2001 2002 2003 2004 2005 2006 2007 * 2007 ** smoked per day Men % % % % % % % % % % % %
20 or more 38 32 36 34 37 35 34 32 34 29 26 25 10-19 37 43 38 39 40 41 40 36 40 45 44 42 Fewer than 10 25 25 25 27 23 24 27 32 26 26 30 33 Unweighted base 254 Weighted base (000s) ** 5,632 Weighted base * 506 448 446 414 396 456 423 375 273 280 256 Women
20 or more 28 29 24 32 25 26 26 21 23 21 25 23 10-19 41 42 47 37 41 42 45 44 43 49 45 44 Fewer than 10 31 29 29 31 34 32 29 35 34 30 30 32 Unweighted base 264 Weighted base (000s) ** 4,750 Weighted base * 539 536 502 452 448 488 425 433 297 291 240 All 20 or more 33 30 30 33 31 30 30 26 28 25 26 24 10-19 39 42 43 38 41 42 43 40 42 47 45 43 Fewer than 10 28 27 27 29 29 28 28 34 30 28 30 32 Unweighted base 518 Weighted base (000s) ** 10,382 Weighted base * 1045 984 948 866 844 944 848 808 570 571 496 1996-2006 percentages and bases weighted for unequal chance of selection * weighted for unequal chance of selection ** weighted to population totals

2: Smoking behaviour and habits
Smoking-related Behaviour and Attitudes, 2007
Office for National Statistics 11
Table 2.4 Time between waking and the first cigarette: by sex, 1996-2007
All smokers Time between waking 1996 1997 1999 2000 2001 2002 2003 2004 2005 2006 2007 * 2007 ** and the first cigarette Men % % % % % % % % % % % % Less than 5 minutes 13 14 15 14 12 14 13 10 12 18 11 10 5-14 minutes 16 15 14 17 17 14 18 15 15 16 17 16 15-29 minutes 17 12 16 15 15 16 13 14 16 13 13 14 30 mins but less than 1 hour 19 18 17 19 22 21 19 31 24 21 20 20 1 hour but less than 2 hours 13 14 16 14 13 16 14 14 15 14 16 17 2 hours and over 22 26 22 23 21 19 23 27 19 18 21 23
Unweighted base 253 Weighted base (000s) ** 5,608 Weighted base * 505 449 443 416 397 458 418 376 274 280 255 Women Less than 5 minutes 12 12 11 12 14 10 12 12 15 13 13 12 5-14 minutes 15 16 12 15 14 15 13 16 13 16 15 16 15-29 minutes 15 12 14 14 12 12 15 12 13 13 13 12 30 mins but less than 1 hour 17 19 19 20 16 20 15 14 17 22 22 21 1 hour but less than 2 hours 14 16 16 14 16 15 17 16 13 10 14 13 2 hours and over 26 26 29 25 28 28 27 31 29 26 24 26 Unweighted base 266 Weighted base (000s) ** 4,773 Weighted base * 538 536 504 455 447 484 424 433 299 292 243 All Less than 5 minutes 13 13 13 13 13 12 13 11 13 15 12 11 5-14 minutes 15 15 13 16 15 14 15 15 14 16 16 16 15-29 minutes 16 12 15 14 14 14 14 13 15 13 13 13 30 mins but less than 1 hour 18 19 18 19 19 20 17 17 20 22 21 21 1 hour but less than 2 hours 14 15 16 14 15 16 16 15 14 12 15 15 2 hours and over 24 26 26 24 25 24 25 29 24 22 22 24 Unweighted base 519 Weighted base (000s) ** 10,381 Weighted base * 1043 983 949 867 845 942 843 809 571 570 498 1996-2006 percentages and bases weighted for unequal chance of selection * weighted for unequal chance of selection ** weighted to population totals

2: Smoking behaviour and habits
Smoking-related Behaviour and Attitudes, 2007
Office for National Statistics 12
Table 2.5 Time between waking and the first cigarette: by number of cigarettes smoked per day, 2007
All smokers Time between waking Number of cigarettes a day Total and the first cigarette 20 or more 10-19 Fewer than 10 % % % % Less than 5 minutes 24 10 2 11 5-14 minutes 28 19 2 16 15-29 minutes 19 12 9 13 30 mins but less than 1 hour 20 25 16 21 1 hour but less than 2 hours 6 20 16 15 2 hours and over 3 13 55 24 Unweighted base 135 221 161 517 Weighted Base (000s) * 2,515 4,491 3,351 10,358 * weighted to population totals

3: Giving up smoking
Smoking-related Behaviour and Attitudes, 2007
Office for National Statistics 13
3: Giving up smoking
Wanting to give up smoking In order to meet the targets for reducing the prevalence of cigarette
smoking set out in the Smoking Kills White Paper, the Public Health White
Paper and the Cancer Plan, people have to be discouraged from starting to
smoke, and current smokers have to be encouraged to stop.
Smokers who want to give up
Seventy four per cent of current smokers said that they wanted to give up
smoking. This was similar to previous years (for example, comparing the
figures weighted on the old system, 73 per cent of smokers wanted to give
up in 2007, 72 per cent in 2005 and 2006 and 73 per cent in 2004).
Twenty five per cent of smokers said that they very much wanted to stop
smoking, and a further quarter (24 per cent) said they wanted to stop
“quite a lot”.
Although it appeared that men smokers were more likely than women
smokers to want to give up smoking (77 per cent compared with 70 per
cent respectively), the difference was not statistically significant. There
were no statistically significant differences in the percentage of smokers
who wanted to give up smoking when cigarette consumption was looked
at.
Tables 3.1 - 3.2
Those who had made a serious attempt to give up in the last five years
were more likely to say that they wanted to give up very much, than were
those who had not tried to stop smoking in the past five years (34 per cent
and 13 per cent respectively). Similarly, adults who had tried to give up
smoking within the past year were more likely to state that they very much
wanted to stop than those who had not tried to do so (42 per cent
compared with 24 per cent).
Tables 3.3 - 3.4
Reasons for wanting to give up smoking
Those who wanted to give up smoking were asked why they wanted to do
so and up to three of their answers were recorded. An extra category was
included in 2007, to reflect the introduction of the ban on smoking in
enclosed public places. The vast majority (86 per cent) of smokers who
wanted to stop smoking gave at least one health reason for wanting to give
up smoking:
• 71 per cent said it was because it would be better for their health in
general
• 22 per cent said that giving up smoking would reduce their risk of
getting a smoking related illness
• 17 per cent said it was because of health problems they had at present.

3: Giving up smoking
Smoking-related Behaviour and Attitudes, 2007
Office for National Statistics 14
After health reasons, the next most common reason given for wanting to
give up smoking was a financial one - 27 per cent could not afford to
smoke or considered smoking a waste of money. Twenty per cent said they
wanted to give up because of family pressure and 15 per cent said it was
because of the effect of smoking on children. The reasons given were very
similar to those reported in previous years. A small number, 7 per cent,
said they wanted to give up because of the ban on smoking in public
places.
There were no statistically significant differences between adults who
smoked 20 or more cigarettes a day and those who smoked fewer
cigarettes a day.
Tables 3.5 - 3.6
Intending to give up smoking As well as being asked whether they would like to stop smoking, smokers
were asked whether they actually intended to do so. Seventy-seven per
cent of smokers said they intended to give up smoking at some point in the
future. Comparing the percentages based on the old weighting system, 76
per cent of smokers intended to give up smoking in 2007, an increase from
70 per cent in 1999, but there was no significant change since 2004. Most
smokers intended to stop smoking one month or more after the survey
question was asked; only 12 per cent of smokers intended to give up within
the next month and this has remained stable since 1999.
In 2007, there were no statistically significant differences between the
proportions of men and women who intended to give up smoking.
However, there were differences between men and women in changes over
time in the proportions intending to give up smoking. There was a
significant increase in the proportion of men who intended to give up
smoking from 69 per cent in 1999 to 78 per cent in 2007. For women, the
proportions intending to stop smoking did not increase significantly over
the same time period (71 per cent in 1999 compared with 73 per cent in
2007) 7.
Table 3.7
There were no statistically significant differences in intentions to stop
smoking by socio-economic class, whether there were children under the
age of 16 present in the household or number of cigarettes smoked per
day.
Tables 3.8 - 3.9
Tables 3.10 and 3.11 suggest that individuals do not abandon their
attempts to quit smoking after relapsing but may try again. Smokers who
had made a serious attempt to give up smoking in the past five years were
more likely to say that they intended to give up (86 per cent) than were
7 The apparent increase between 1999 and 2005 and 2006 was not statistically significant.

3: Giving up smoking
Smoking-related Behaviour and Attitudes, 2007
Office for National Statistics 15
those who had not (64 per cent). Although it appeared that smokers who
had made an attempt to give up in the last year were more likely to intend
to give up compared with smokers who had tried to give up in the past five
years but not in the past year, the difference was not statistically
significant.
Tables 3.10 - 3.11
All adults – smokers and non-smokers - were asked to assess the
likelihood that they would be smoking in 12 month’s time. Nearly two
fifths of current smokers (39 per cent) said that they would definitely or
probably be smoking in 12 months and over a quarter (28 per cent) said
they would definitely or probably not be smoking in a year. The majority
of ex-smokers (96 per cent) stated that they would definitely or probably
not have resumed smoking a year later. These proportions are similar to
those reported in 2005 and 2006.
Table 3.12
Smokers who intended to give up smoking within the next 12 months were
the most likely to state that they would probably or definitely not be
smoking in a year. Almost half (44 per cent) of those who intended to give
up smoking within a year predicted that they would definitely or probably
not be smoking in 12 month’s time compared with 7 per cent of those who
had no intention of quitting.
There were no statistically significant differences in expectations over
time.
Tables 3.13 - 3.14
The relationship between wanting to and intending to give up smoking Smokers who said they wanted to give up smoking were more likely to say
that they intended to stop smoking at some point in the future (94 per
cent) than those who did not want to give up (28 per cent). Over a third
(36 per cent) of smokers both wanted to give up and intended to do so in
the next six months, but 19 per cent neither wanted to give up nor
intended to do so.
Tables 3.15 - 3.16
Tables 3.17 to 3.19 present information about desire and resolve together
for different sub-groups. Men were more likely than women to say they
want to give up but don’t intend to do so in the next six months. The
likelihood of those who smoked fewer than 10 cigarettes a day wanting to
give up smoking and intending to do so within the next six months was
greater than for people who smoked 20 or more a day (46 per cent and 28
per cent respectively) . Conversely, people who smoked 10 or more a day
were more likely than those who smoked fewer than 10 a day to both want
to and intend to stop smoking after six months (39 per cent compared with
23 per cent).
Smokers with children in the household were no more likely than those
without children present to want and intend to give up smoking. Smokers

3: Giving up smoking
Smoking-related Behaviour and Attitudes, 2007
Office for National Statistics 16
in routine and manual occupations were no more likely than those in
managerial and professional occupations to want to or intend to give up
smoking.
Tables 3.17 - 3.19

3: Giving up smoking
Smoking-related Behaviour and Attitudes, 2007
Office for National Statistics 17
Table 3.1 Views on giving up smoking: by sex, 1997-2007
All smokers Views on giving up smoking 1997 1999 2000 2001 2002 2003 2004 2005 2006 2007 * 2007 ** Men % % % % % % % % % % % Would like to give up: Very much indeed .. 29 29 29 26 24 32 24 24 28 27 Quite a lot .. 20 20 18 24 24 24 24 29 28 27 A fair amount .. 16 16 17 13 14 12 17 13 12 12 A little .. 6 6 8 8 8 6 9 7 10 11 Total would like to give up 68 72 71 72 71 71 74 74 72 77 77 Would not like to give up 32 28 29 28 29 29 26 26 28 23 23 Unweighted base 250 Weighted base (000s) ** 5,497 Weighted base * 449 447 414 390 454 423 373 269 279 251 Women Would like to give up: Very much indeed .. 30 32 27 26 25 25 29 22 23 23 Quite a lot .. 22 20 26 22 20 24 23 25 21 21 A fair amount .. 12 15 14 15 19 16 14 18 16 16 A little .. 8 5 7 7 7 8 5 6 9 10 Total would like to give up 74 72 71 73 70 70 72 71 72 69 70 Would not like to give up 26 28 29 27 30 30 28 29 28 31 30 Unweighted base 264 Weighted base (000s) ** 4,752 Weighted base * 536 503 454 446 482 426 431 295 292 240 All Would like to give up: Very much indeed .. 30 30 28 26 24 28 27 23 26 25 Quite a lot .. 21 20 22 23 22 24 23 27 24 24 A fair amount .. 14 16 15 14 17 14 15 15 14 14 A little .. 7 6 7 8 7 7 7 7 9 11 Total would like to give up 71 72 71 72 70 70 73 72 72 73 74 Would not like to give up 29 28 29 28 30 30 27 28 28 27 26 Unweighted base 514 Weighted base (000s) ** 10,249 Weighted base * 987 950 868 836 936 849 804 564 571 491 .. data not available. 1997-2006 percentages and bases weighted for unequal chance of selection * weighted for unequal chance of selection ** weighted to population totals

3: Giving up smoking
Smoking-related Behaviour and Attitudes, 2007
Office for National Statistics 18
Table 3.2 Views on giving up smoking: by number of cigarettes smoked per day, 2007
All smokers
Views on giving up Number of cigarettes per day Total smoking 20 or 10-19 Fewer more than 10 Would like to give up: % % % % Very much indeed 29 22 26 25 Quite a lot 26 25 22 24 A fair amount 10 14 15 14 A little 8 12 10 11 Total would like to give up 73 74 74 74 Would not like to give up 27 26 26 26 Unweighted base 134 218 160 514 Weighted base (000s) * 2,508 4,435 3,284 10,249
* weighted to population totals
Table 3.3 Views on giving up smoking: by whether have tried to give up smoking in the last five years, 2007
All smokers
Views on giving up Attempted Not attempted Total smoking to give up in to give up in last 5 years last 5 years Would like to give up: % % %
Very much indeed 34 13 25 Quite a lot 27 20 24 A fair amount 11 17 14 A little 10 12 11 Total would like to give up 82 61 74 Would not like to give up 18 39 26 Unweighted base 311 203 514 Weighted base (000s) * 6,170 4,079 10,249
* weighted to population totals

3: Giving up smoking
Smoking-related Behaviour and Attitudes, 2007
Office for National Statistics 19
Table 3.4 Views on giving up smoking: by whether have tried to give up smoking in the last year, 2007
Smokers who have tried to give up smoking in the last 5 years
Views on giving up Attempted Not attempted Total smoking to give up in to give up in last year last year Would like to give up: % % %
Very much indeed 42 24 34 Quite a lot 27 27 27 A fair amount 8 15 11 A little 10 10 10 Total would like to give up 87 76 82 Would not like to give up 13 24 18 Unweighted base 166 145 311 Weighted base (000s) * 3,202 2,968 6,170
* weighted to population totals

3: Giving up smoking
Smoking-related Behaviour and Attitudes, 2007
Office for National Statistics 20
Table 3.5 Main reasons for wanting to stop smoking: by sex, 1996-2007
Smokers who want to stop smoking Reasons for wanting 1996 1997 1999 2000 2001 2002 2003 2004 2005 2006 2007 * 2007 ** to stop smoking Men Percentage giving reason for wanting to stop smoking Better for health in general 64 72 75 76 75 72 73 72 70 68 74 75 Less risk of getting smoking related illness 32 36 33 38 34 30 21 27 28 32 26 26 Present health problems 17 16 13 15 14 18 15 14 17 14 17 15 At least one health reason 83 88 89 91 90 89 86 91 83 88 88 87 Financial reasons 34 40 35 38 28 25 26 21 28 28 28 27 Family pressure 15 11 18 22 20 13 15 16 22 14 22 23 Harms children 14 16 12 10 10 10 13 15 14 11 14 13 Ban on smoking in public places .. .. .. .. .. .. .. .. .. .. 6 6 Doctor's advice 7 3 7 6 7 4 5 5 6 4 5 5 Pregnancy 1 1 1 - 0 0 - 1 - - 0 0 Other 4 3 4 4 2 3 3 1 3 3 1 1 Gave more than one reason 59 63 66 73 62 52 49 53 58 51 62 61 Unweighted base 190 Weighted base (000s) ** 4,220 Weighted base * 351 305 319 292 279 321 299 278 200 202 190 Women Better for health in general 65 68 68 73 63 63 62 66 79 69 66 67 Less risk of getting smoking related illness 26 33 29 40 28 30 22 28 39 22 19 18 Present health problems 16 17 13 17 17 14 18 17 12 16 21 20 At least one health reason 83 88 84 90 84 83 81 85 90 83 83 83 Financial reasons 37 39 36 44 32 30 31 31 30 24 28 26 Family pressure 14 16 21 18 19 19 14 20 24 20 16 16 Harms children 22 24 24 18 20 16 23 16 25 16 18 18 Ban on smoking in public places .. .. .. .. .. .. .. .. .. .. 7 8 Doctor's advice 9 8 7 6 7 4 7 6 7 5 4 4 Pregnancy 2 3 4 5 3 2 2 1 2 5 3 4 Other 2 4 3 3 5 4 2 3 3 2 1 2 Gave more than one reason 60 73 67 79 63 56 56 58 77 53 56 55 Unweighted base 189 Weighted base (000s) ** 3,334 Weighted base * 361 398 362 322 327 336 297 311 209 208 166

3: Giving up smoking
Smoking-related Behaviour and Attitudes, 2007
Office for National Statistics 21
Table 3.6 Main reasons for wanting to stop smoking: by number of cigarettes smoked per day, 2007
Smokers who want to stop smoking Reasons for wanting 1996 1997 1999 2000 2001 2002 2003 2004 2005 2006 2007 * 2007 ** to stop smoking All Percentage giving reason for wanting to stop smoking Better for health in general 65 70 71 75 68 68 67 68 75 69 70 71 Less risk of getting smoking related illness 29 34 31 39 31 30 22 27 34 26 22 22 Present health problems 17 16 13 16 16 16 16 15 14 15 19 17 At least one health reason 83 88 87 91 87 86 84 88 87 85 86 86 Financial reasons 36 39 35 41 31 28 28 26 29 26 28 27 Family pressure 14 14 19 20 19 16 15 18 23 17 20 20 Harms children 18 21 18 14 15 13 18 16 20 14 16 15 Ban on smoking in public places .. .. .. .. .. .. .. .. .. .. 6 7 Doctor's advice 8 6 7 6 7 4 6 6 7 5 5 5 Pregnancy 1 2 3 3 2 1 1 1 1 2 2 2 Other 3 4 3 4 4 4 3 2 3 3 1 1 Gave more than one reason 59 68 66 76 62 54 52 55 68 52 59 58 Unweighted base 379 Weighted base (000s) ** 7,554 Weighted base * 712 703 681 617 606 657 596 589 409 410 356 Percentages sum to more than 100 as smokers could give more than one answer. 1996-2006 percentages and bases weighted for unequal chance of selection * weighted for unequal chance of selection ** weighted to population totals .. code added in 2007
Smokers who want to stop smoking Number of cigarettes per day Total Reasons for wanting to stop
smoking 20 and 10-19 Fewer over than 10 Percentage giving reason for wanting to stop
smoking Better for health in general 70 70 73 71 Less risk of getting smoking related illness 23 19 27 22 Present health problems 20 20 13 17 At least one health reason 86 83 89 86 Financial reasons 30 28 23 27 Family pressure 19 25 15 20 Harms children 16 14 16 15 Ban on smoking in public places 8 7 6 7 Doctor's advice 9 4 2 5 Pregnancy 0 2 4 2 Other 1 1 1 1 Gave more than one reason 62 61 53 58 Unweighted base 100 157 120 379 Weighted base (000s) * 1,803 3,225 2,414 7,442 * weighted to population totals Percentages sum to more than 100 as smokers could give more than one answer.

3: Giving up smoking
Smoking-related Behaviour and Attitudes, 2007
Office for National Statistics 22
Table 3.7 When smokers intend to give up smoking: by sex, 1999-2007
All smokers When smokers intend 1999 2000 2001 2002 2003 2004 2005 2006 2007 * 2007 ** to give up smoking Men % % % % % % % % % % Within the next month 12 12 7 10 12 14 12 10 11 12 Within the next 6 months+ 33 29 28 31 34 42 31 34 34 34 Within the next year+ 49 46 46 47 53 58 50 54 58 58 In more than a year 20 21 27 21 20 20 24 24 20 21 Total intend to give up 69 68 72 69 73 78 74 79 78 79 Do not intend to give up 31 32 28 31 27 22 26 21 22 21 Unweighted base 252 Weighted base (000s) ** 5,585 Weighted base * 435 413 393 449 422 370 273 277 254 Women Within the next month 12 10 12 9 10 13 13 12 12 12 Within the next 6 months+ 34 30 36 31 33 39 35 38 39 39 Within the next year+ 53 50 48 51 54 52 57 58 55 56 In more than a year 17 23 19 20 17 19 20 18 17 18 Total intend to give up 71 73 77 72 71 72 77 76 73 75 Do not intend to give up 29 27 23 28 29 28 23 24 27 25 Unweighted base 261 Weighted base (000s) ** 4,690 Weighted base * 496 446 444 483 414 427 295 283 235 All Within the next month 12 11 9 10 11 13 12 11 12 12 Within the next 6 months+ 34 29 31 32 33 40 33 36 36 36 Within the next year+ 52 48 51 51 53 55 53 56 56 57 In more than a year 18 22 23 20 19 19 22 21 19 20 Total intend to give up 70 71 75 70 72 75 76 77 76 77 Do not intend to give up 30 29 25 30 28 25 24 23 24 23 Unweighted base 513 Weighted base (000s) ** 10,276 Weighted base * 931 859 837 932 836 797 568 560 489 1999-2006 percentages and bases weighted for unequal chance of selection * weighted for unequal chance of selection ** weighted to population totals + These are cumulative percentages showing total number of smokers who said they intended to give up smoking within the stated period.
3: Giving up smoking
Smoking-related Behaviour and Attitudes, 2007
Office for National Statistics 23
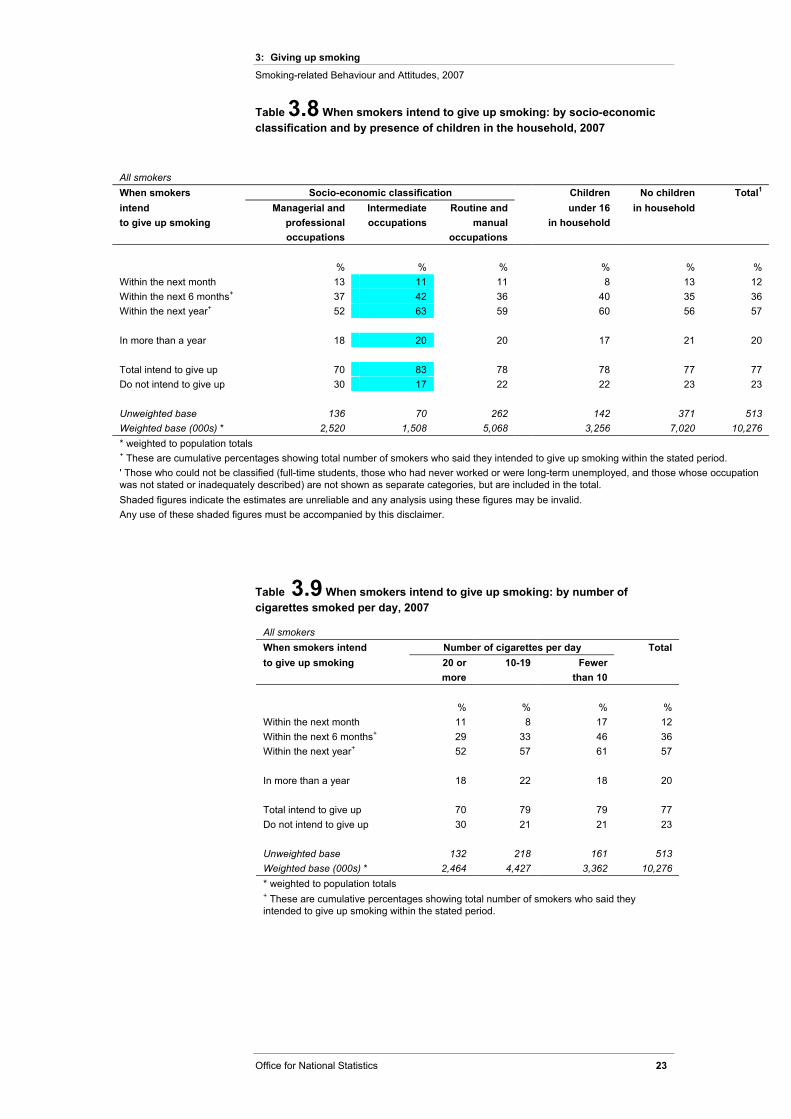
Table 3.8 When smokers intend to give up smoking: by socio-economic classification and by presence of children in the household, 2007
Table 3.9 When smokers intend to give up smoking: by number of cigarettes smoked per day, 2007
All smokers When smokers intend Number of cigarettes per day Total to give up smoking 20 or 10-19 Fewer more than 10 % % % % Within the next month 11 8 17 12 Within the next 6 months+ 29 33 46 36 Within the next year+ 52 57 61 57 In more than a year 18 22 18 20 Total intend to give up 70 79 79 77 Do not intend to give up 30 21 21 23 Unweighted base 132 218 161 513 Weighted base (000s) * 2,464 4,427 3,362 10,276 * weighted to population totals + These are cumulative percentages showing total number of smokers who said they intended to give up smoking within the stated period.
All smokers When smokers Socio-economic classification Children No children Total1
intend Managerial and Intermediate Routine and under 16 in household to give up smoking professional occupations manual in household occupations occupations % % % % % % Within the next month 13 11 11 8 13 12 Within the next 6 months+ 37 42 36 40 35 36 Within the next year+ 52 63 59 60 56 57 In more than a year 18 20 20 17 21 20 Total intend to give up 70 83 78 78 77 77 Do not intend to give up 30 17 22 22 23 23 Unweighted base 136 70 262 142 371 513 Weighted base (000s) * 2,520 1,508 5,068 3,256 7,020 10,276 * weighted to population totals + These are cumulative percentages showing total number of smokers who said they intended to give up smoking within the stated period. ' Those who could not be classified (full-time students, those who had never worked or were long-term unemployed, and those whose occupation was not stated or inadequately described) are not shown as separate categories, but are included in the total. Shaded figures indicate the estimates are unreliable and any analysis using these figures may be invalid. Any use of these shaded figures must be accompanied by this disclaimer.

3: Giving up smoking
Smoking-related Behaviour and Attitudes, 2007
Office for National Statistics 24
Table 3.10 When smokers intend to give up smoking: by whether they have tried to give up smoking in the last five years, 2007
All smokers When smokers intend Attempted Not attempted Total to give up smoking to give up in to give up in last 5 years last 5 years % % % Within the next month 14 8 12 Within the next 6 months+ 45 23 36 Within the next year+ 69 40 57 In more than a year 16 24 20 Total intend to give up 86 64 77 Do not intend to give up 14 36 23 Unweighted base 308 205 513 Weighted base (000s) * 6,114 4,162 10,276 * weighted to population totals + These are cumulative percentages showing total number of smokers who said they intended to give up smoking within the stated period.
Table 3.11 When smokers intend to give up smoking: by whether have tried to give up smoking in the last year, 2007
Smokers who have tried to give up smoking in the last 5 years When smokers intend Attempted Not attempted Total to give up smoking to give up in to give up in last year last year % % % Within the next month 21 6 14 Within the next 6 months+ 58 31 45 Within the next year+ 80 57 69 In more than a year 9 24 16 Total intend to give up 90 82 86 Do not intend to give up 10 18 14 Unweighted base 166 142 308 Weighted base (000s) * 3,203 2,911 6,114 * weighted to population totals + These are cumulative percentages showing total number of smokers who said they intended to give up smoking within the stated period.

3: Giving up smoking
Smoking-related Behaviour and Attitudes, 2007
Office for National Statistics 25
Table 3.12 Likelihood of smoking a year from now: by smoking status, 1999-2007
All persons aged 16 and over 1999 2000 2001 2002 2003 2004 2005 2006 2007 * 2007 **
Current smokers % % % % % % % % % % Definitely will be smoking 19 20 18 21 20 16 15 18 17 16 Probably will be smoking 29 32 27 29 26 24 27 28 22 23 Might or might not be smoking 23 26 29 26 29 28 31 28 33 34 Probably will not be smoking 18 16 17 17 20 20 21 17 21 21 Definitely will not be smoking 11 5 9 7 6 11 7 10 7 7 Unweighted base 518 Weighted base (000s) ** 10,368 Weighted base * 942 865 842 934 844 803 565 567 495 Ex-regular smokers Definitely will be smoking 2 2 2 1 2 1 2 1 2 2 Probably will be smoking 2 1 1 1 1 1 0 1 1 1 Might or might not be smoking 1 2 3 2 2 1 1 1 1 1 Probably will not be smoking 6 6 4 4 6 5 6 5 6 6 Definitely will not be smoking 88 89 90 92 89 92 91 92 91 90 Unweighted base 629 Weighted base (000s) ** 11,769 Weighted base * 977 921 887 998 879 960 609 633 615 Never smoked regularly Definitely will be smoking 1 1 1 1 1 1 1 1 1 1 Probably will be smoking 0 0 1 0 0 1 1 1 0 0 Might or might not be smoking 0 0 0 0 0 0 0 0 0 1 Probably will not be smoking 2 2 3 2 1 1 1 1 1 2 Definitely will not be smoking 96 96 96 97 97 97 97 96 97 97 Unweighted base 1128 Weighted base (000s) ** 23,992 Weighted base * 1629 1535 1761 1878 1790 1775 1221 1140 1162 All Definitely will be smoking 6 6 5 6 6 4 4 5 5 4 Probably will be smoking 8 9 7 7 7 6 7 7 5 6 Might or might not be smoking 7 8 8 7 8 7 7 7 8 8 Probably will not be smoking 7 7 7 6 7 7 7 6 7 7 Definitely will not be smoking 71 70 73 74 73 76 74 74 76 75 Unweighted base 2275 Weighted base (000s) ** 46,129 Weighted base * 3548 3321 3490 3810 3513 3538 2395 2340 2272 1999-2006 percentages and bases weighted for unequal chance of selection * weighted for unequal chance of selection ** weighted to population totals

3: Giving up smoking
Smoking-related Behaviour and Attitudes, 2007
Office for National Statistics 26
Table 3.13 Likelihood of smokers still smoking a year from now: by whether intend to give up smoking, 2007
All smokers Likelihood of smoking Intend to give up smoking: Do not intend Total a year from now within the next in more than to give up 12 months a year % % % % Definitely will be smoking 1 13 54 15 Probably will be smoking 13 52 22 22 Might or might not be smoking 42 29 18 34 Probably will not be smoking 34 5 3 21 Definitely will not be smoking 10 1 4 7 Unweighted base 292 88 132 512 Weighted base (000s) * 5,862 2,023 2,366 10,251 * weighted to population totals Shaded figures indicate the estimates are unreliable and any analysis using these figures may be invalid. Any use of these shaded figures must be accompanied by this disclaimer.
Table 3.14 Likelihood of smokers still smoking a year from now: 1999-2007
Smokers who intend to give up smoking within the next year Likelihood of smoking 1999 2000 2001 2002 2003 2004 2005 2006 2007 * 2007 ** a year from now
% % % % % % % % % % Definitely will be smoking 3 2 0 1 1 0 0 1 0 1 Probably will be smoking 19 16 13 17 11 10 11 17 13 13 Might or might not be smoking 33 40 39 35 42 37 43 38 42 42 Probably will not be smoking 30 31 32 33 36 34 34 28 35 34 Definitely will not be smoking 15 10 16 15 10 18 12 16 10 10 Unweighted base 292 Weighted base (000s) ** 5,862 Weighted base * 478 412 433 463 443 438 303 313 276 1999-2006 percentages and bases weighted for unequal chance of selection * weighted for unequal chance of selection ** weighted to population totals

3: Giving up smoking
Smoking-related Behaviour and Attitudes, 2007
Office for National Statistics 27
Table 3.15 When smokers intend to give up smoking: by whether they want to give up smoking, 1999-2007
All smokers When smokers intend to give up smoking 1999 2000 2001 2002 2003 2004 2005 2006 2007 * 2007 ** Those who would like to give up: Within the next month 17 16 13 14 16 18 17 16 16 16 Within the next 6 months+ 46 42 44 44 47 53 46 49 49 48 Within the next year+ 70 67 70 68 73 72 73 75 74 74 In more than a year 19 25 23 23 21 22 23 20 19 20 Total intend to give up 89 92 92 91 94 94 96 95 93 94 Do not intend to give up 11 8 8 9 6 6 4 5 7 6
Unweighted base 374 Weighted base (000s) ** 7,504 Weighted base * 669 606 596 649 583 579 408 399 355 Those who would not like to give up: Within the next month 0 - 0 1 - 0 - 1 1 0 Within the next 6 months+ 3 1 2 3 2 4 1 5 4 4 Within the next year+ 5 4 8 8 8 9 4 10 9 10 In more than a year 17 15 21 14 14 13 20 24 16 18 Total intend to give up 22 19 30 23 22 22 23 34 25 28 Do not intend to give up 78 81 70 77 78 78 77 66 75 72 Unweighted base 134 Weighted base (000s) ** 2,624 Weighted base * 259 249 231 276 251 213 154 161 128 All Within the next month 12 11 9 10 11 13 12 11 12 12 Within the next 6 months+ 34 29 32 32 33 40 33 36 36 36 Within the next year+ 52 48 52 51 53 55 53 56 56 57 In more than a year 18 22 23 20 19 19 22 21 19 20 Total intend to give up 70 70 75 71 72 75 76 77 76 77 Do not intend to give up 30 30 25 29 28 25 24 23 24 23 Unweighted base 513 Weighted base (000s) ** 10,276 Weighted base * 928 855 827 925 834 797 562 560 483 + These are cumulative percentages showing total number of smokers who said they intended to give up smoking within the stated period. 1999-2006 percentages and bases weighted for unequal chance of selection * weighted for unequal chance of selection ** weighted to population totals

3: Giving up smoking
Smoking-related Behaviour and Attitudes, 2007
Office for National Statistics 28
Table 3.16 Whether smokers want to and intend to give up smoking: 1999-2007
All smokers Whether smokers want 1999 2000 2001 2002 2003 2004 2005 2006 2007 * 2007 ** or intend to stop Want to give up and intend % % % % % % % % % % to in next 6 months 33 30 32 31 33 39 33 35 36 36 Want to give up and intend to in more than 6 months 31 36 35 33 33 30 36 33 33 34 Want to give up but do not intend to 8 6 6 6 4 4 3 4 5 5 Do not want to give up but intend to 6 6 8 7 7 6 6 10 6 7 Do not want to give up and do not intend to 22 24 20 23 24 21 21 19 20 19 Unweighted base 508 Weighted base (000s) ** 10,128 Weighted base * 927 855 827 926 834 792 563 559 483 1999-2006 percentages and bases weighted for unequal chance of selection * weighted for unequal chance of selection ** weighted to population totals
Table 3.17 Whether smokers want to and intend to give up smoking: by sex, 2007
All smokers Whether smokers want Men Women Total or intend to stop % % % Want to give up and intend to in next 6 months 34 38 36 Want to give up and intend to in more than 6 months 39 28 34 Want to give up but do not intend to 4 5 5 Do not want to give up but intend to 6 9 7 Do not want to give up and do not intend to 17 21 19 Unweighted base 249 259 508 Weighted base (000s) * 5,458 4,670 10,128 * weighted to population totals
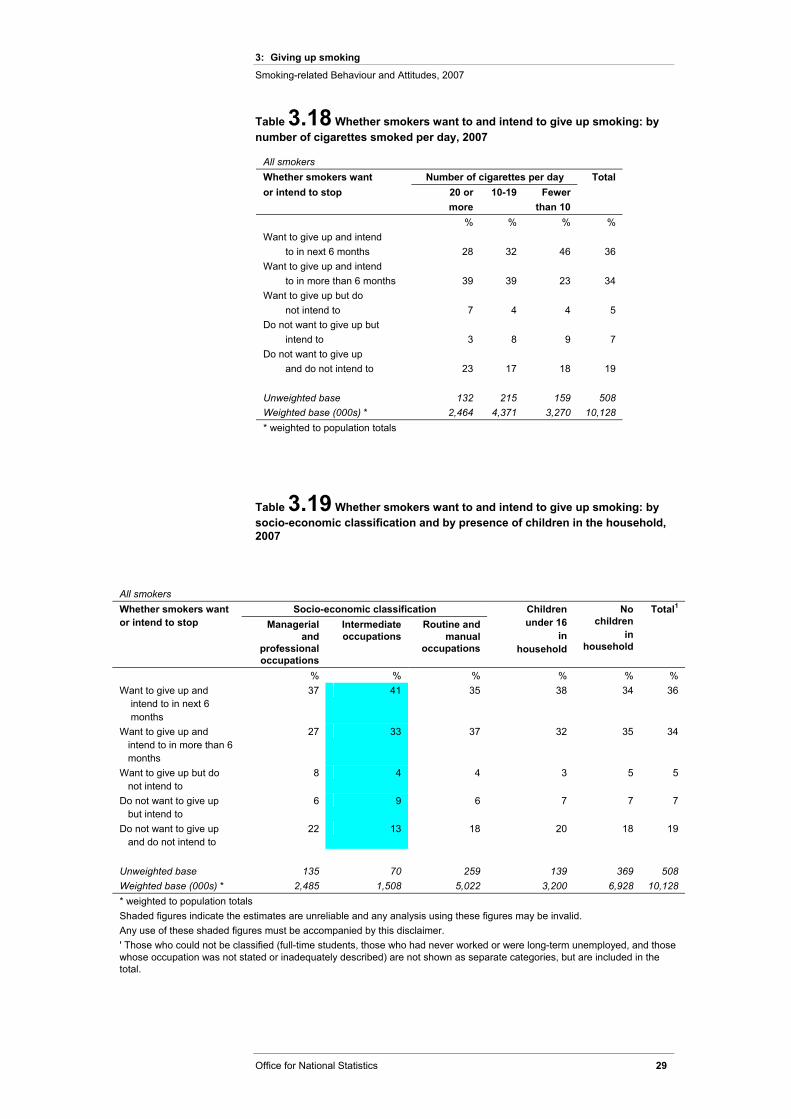
3: Giving up smoking
Smoking-related Behaviour and Attitudes, 2007
Office for National Statistics 29
Table 3.18 Whether smokers want to and intend to give up smoking: by number of cigarettes smoked per day, 2007
All smokers Whether smokers want Number of cigarettes per day Total or intend to stop 20 or 10-19 Fewer more than 10 % % % % Want to give up and intend to in next 6 months 28 32 46 36 Want to give up and intend to in more than 6 months 39 39 23 34 Want to give up but do not intend to 7 4 4 5 Do not want to give up but intend to 3 8 9 7 Do not want to give up and do not intend to 23 17 18 19 Unweighted base 132 215 159 508 Weighted base (000s) * 2,464 4,371 3,270 10,128 * weighted to population totals
Table 3.19 Whether smokers want to and intend to give up smoking: by socio-economic classification and by presence of children in the household, 2007
All smokers Socio-economic classification Total1 Whether smokers want
or intend to stop Managerial and
professional occupations
Intermediate occupations
Routine and manual
occupations
Children under 16
in household
No children
in household
% % % % % % Want to give up and intend to in next 6 months
37 41 35 38 34 36
Want to give up and intend to in more than 6 months
27 33 37 32 35 34
Want to give up but do not intend to
8 4 4 3 5 5
Do not want to give up but intend to
6 9 6 7 7 7
Do not want to give up and do not intend to
22 13 18 20 18 19
Unweighted base 135 70 259 139 369 508 Weighted base (000s) * 2,485 1,508 5,022 3,200 6,928 10,128 * weighted to population totals Shaded figures indicate the estimates are unreliable and any analysis using these figures may be invalid. Any use of these shaded figures must be accompanied by this disclaimer. ' Those who could not be classified (full-time students, those who had never worked or were long-term unemployed, and those whose occupation was not stated or inadequately described) are not shown as separate categories, but are included in the total.

4: Attempts to give up smoking
Smoking-related Behaviour and Attitudes, 2007
Office for National Statistics 30
4: Attempts to give up smoking
Previous attempts to give up smoking
Current smokers
As in previous years, nearly four-fifths (79 per cent) of current smokers
had tried to give up smoking in the past.
The percentage of smokers who had ever tried to give up smoking did not
vary significantly by sex, socio-economic class or presence of children in
the household. Those who smoked 20 or more cigarettes a day were more
likely to have tried to give up than lighter smokers (87 per cent compared
with 77 per cent of those who smoked 10-19 per day and 76 per cent of
those who smoked fewer than 10 cigarettes a day).
Tables 4.1 - 4.3
Smokers were also asked if they had made a serious attempt to stop
smoking in the past five years and 60 per cent said that they had, a
significant increase since 1999, when the question was first included (52
per cent). There was no statistically significant difference in relation to the
number of cigarettes smoked per day or sex.
Tables 4.4 - 4.5
Three-tenths (31 per cent) of all smokers had tried to give up in the past
year and there was no difference between men and women. The
proportion of smokers who had tried to give up in the past year has
increased from 22 per cent in 2000 to 31 per cent in 2007.
Smokers who had tried to give up smoking in the past year were asked how
many attempts they had made. Table 4.7 shows that some smokers made
repeated attempts to give up – 18 per cent had made three or more
attempts in the past year. The percentage of smokers who had made only
one attempt to quit has not changed significantly since 2000.
Tables 4.6 - 4.7
Current smokers who had ever tried to give up were asked how long they
had given up for on the last occasion. Table 4.8 shows that although
almost one third (28 per cent) of smokers had successfully given up
previously for six months or more, only 7 per cent of smokers had stopped
smoking for more than two years.
A fifth(19 per cent) of smokers had given up for a week and a further 52
per cent had given up for more than a week, but for less than six months.
These figures were very similar to those found in previous years.
Table 4.8
There was no significant difference between male and female smokers or
between those who smoked different amounts per day in the proportions
who had stopped smoking in the past for more than six months.
Tables 4.9 - 4.10

4: Attempts to give up smoking
Smoking-related Behaviour and Attitudes, 2007
Office for National Statistics 31
Smokers who had stopped smoking for more than a day in the last 12
months were asked why they had started to smoke again. A third (34 per
cent) said they had started again because they found life too stressful, 24
per cent mentioned that they liked smoking, 14 per cent said they started
again because they missed the habit and similar percentages said that their
friends smoked (17 per cent) or that they could not cope with their
cravings (11 per cent). Seventeen per cent gave more than one reason.
Compared with previous years, in 2007, smokers were more likely to say
that they started again because they liked smoking.
Table 4.11
Likewise, smokers who wanted to give up smoking were asked why they
had never tried to stop or why they had not succeeded in stopping for
more than one day. The reasons they gave were similar to those given by
smokers who had stopped for more than one day: 34 per cent said they
found life too stressful and 33 per cent said that they had a lack of
commitment to quitting. A further 24 per cent said that they liked smoking
and 10 per cent could not cope with the cravings. Nineteen per cent of
respondents gave more than one reason for not trying to stop or not
succeeding in stopping for more than a day.
Table 4.12
As a measure of support in giving up smoking, all smokers were asked if
anyone had been trying to get them to quit smoking in the last year, and if
so, who. Fifty five per cent said someone had been trying to get them to
stop smoking, and this tended to be a partner (22 per cent), son or
daughter (17 per cent) or a parent (16 per cent). There were no statistically
significant differences compared with previous years.
Women were more likely than men to say that their children were
encouraging them to quit (22 per cent and 13 per cent respectively).
Although it appeared that women were more likely than men to say their
friends had tried to get them to quit smoking, the difference was not
statistically significant. People who smoked 20 or more cigarettes a day
were more likely than those who smoked fewer than 10 cigarettes a day to
say that their children had been trying to get them to stop smoking: 24 per
cent of smokers who smoked 20 or more cigarettes a day said their
children were trying to make them quit compared with 9 per cent of those
who smoked fewer than ten a day.
Figure 4.1 and Tables 4.13 - 4.15

4: Attempts to give up smoking
Smoking-related Behaviour and Attitudes, 2007
Office for National Statistics 32
0
5
10
15
20
25
Partner/spouse Children Parents Friend Sibling Workmate Other
Percentage
MenWomen
Figure 4.1 People who have tried to get smokers to quit: by sex, 2007
Ex-cigarette smokers
Respondents who said they used to smoke regularly but no longer did were
asked how long ago they stopped smoking cigarettes. Nearly three-
quarters (73 per cent) had stopped smoking five or more years ago, a
similar percentage to previous years. There were no statistically significant
differences between men and women or among people with different
cigarette consumption levels.
Tables 4.16 - 4.18
To allow the factors related to someone successfully giving up to be
examined, all surveys in this series have asked ex-smokers about their
reasons for giving up smoking.
Sixty nine per cent of ex-smokers mentioned at least one health reason for
giving up smoking and a sixth (17 per cent) gave a financial reason. A
further 13 per cent of ex-smokers mentioned family pressure as a reason
for giving up smoking, which is in line with previous years with the
exception of 2005. Men were more likely than women to give at least one
health reason (75 per cent of men mentioned a health reason compared
with 63 per cent of women). Those who had smoked fewer than 10
cigarettes a day were less likely than other smokers to mention a doctor’s
advice as a reason for giving up smoking.

4: Attempts to give up smoking
Smoking-related Behaviour and Attitudes, 2007
Office for National Statistics 33
Ex-smokers who had given up smoking 20 or more years ago were less
likely to give at least one health-related reason than were smokers who
had given up 5-19 years ago.
Tables 4.19 - 4.22
Help giving up smoking
Seeking advice and help for quitting smoking
Since 1999, the NS Omnibus Survey has included questions about the
sources of help and advice sought in the past year by smokers wanting to
give up. From 2000, the questions covering Nicotine Replacement
Therapy (NRT) (gums, patches or inhalators) were amended to allow
people to distinguish between prescription and non-prescription NRT and
whether they paid for it. The questions were asked of current smokers and
of those who had given up smoking in the past year. In previous reports
results were shown for these two groups separately: in 2006 and 2007,
however, numbers were too small for their information to be shown.
Table 4.23 shows the sources of help and advice used by current smokers
(that is those that have failed to give up smoking or who have not tried).
Overall, in 2007, 53 per cent of smokers had sought some kind of help or
advice for stopping smoking. Two fifths (41 per cent) of smokers said they
had read leaflets and/or booklets on how to stop smoking. A smaller
percentage had asked a doctor or health professional for help (16 per cent),
been referred or self-referred to a stop smoking group (9 per cent) or
called a smokers’ helpline (5 per cent).
Thirty two per cent had used NRT, Zyban or another drug, to help them
stop smoking, a significant increase from 2005. Most of this increase was
due to free prescription and bought non-prescription NRT. It should be
noted that the percentages of current smokers who sought help who
obtained NRT and other stop-smoking drugs through different methods
sum to more than the total as respondents could give more than one
answer.
There were no statistically significant differences in the help or advice used
by male and female smokers or smokers in different socio-economic
classes.
Those who smoked 20 or more cigarettes a day were more likely than
other smokers to have asked a doctor or other health professional for help,
been referred to a self-help group or to have had NRT and other prescribed
drugs to stop smoking.
Tables 4.23 - 4.25
Advice from health professionals
Smokers were also asked whether they had been given advice on smoking
by members of the medical profession in the five years before the
interview. From 2003, smokers were asked specifically about receiving
advice from consultants or hospital doctors.

4: Attempts to give up smoking
Smoking-related Behaviour and Attitudes, 2007
Office for National Statistics 34
0
5
10
15
20
25
30
35
40
45
50
GP Someone else at thesurgery
Pharmacist Consultant/hospitaldoctor
Other health professional
Percentage
MenWomen
In 2007, 54 per cent of all current smokers said that they had been given
advice in the last five years. The percentage of smokers who reported that
they had been given advice, had not increased statistically significantly
since 2005. The most common source of advice was the person’s own GP
(44 per cent) and just under a quarter (24 per cent) said they had been
given advice from someone else at the surgery. Fourteen per cent had been
given advice by a consultant or hospital doctor and only eight per cent had
been given advice from a pharmacist. Twelve per cent mentioned that they
had received advice on smoking from a variety of other medical personnel
(specialists, midwives, nurses).
Female smokers were more likely than male smokers to have been given
advice by medical professionals (61 per cent of women smokers had been
given advice compared with 49 per cent of men smokers).
Figure 4.2 Source of advice on smoking in the last five years: by sex, 2007
People who smoked fewer than 10 cigarettes a day were less likely than
those who smoked 20 or more to say that they had been given advice on
smoking by their GP, someone else at the surgery, a pharmacist or a
consultant or hospital doctor. There were no statistically significant
differences in the percentage of smokers in different socio-economic
groups who had been given advice on smoking.
Tables 4.26 - 4.29
In the majority of cases (76 per cent) the advice was in the form of
discussion about smoking (this may have been with or without literature),

4: Attempts to give up smoking
Smoking-related Behaviour and Attitudes, 2007
Office for National Statistics 35
with 24 per cent of smokers being given printed literature only. The
percentage of smokers who had been given literature only increased from
15 per cent in 1996 to 22 per cent (using old weighting scheme for
comparability) in 2007. Overall, three-fifths (59 per cent) said that they
had found the advice helpful, with men and women smokers equally likely
to find the advice they had received helpful.
Table 4.30
Overall, 40 per cent of those who had stopped smoking in the past five
years said they had received advice in the past five years. Compared with
current smokers, ex-smokers who had been given advice on smoking in the
five years before the interview were more likely to say that the advice was
helpful (82 per cent, table not shown, compared with 59 per cent of
current smokers). However, this result should be interpreted with caution
because it may be related to the fact that the person had successfully given
up smoking.
Table 4.31

4: Attempts to give up smoking
Smoking-related Behaviour and Attitudes, 2007
Office for National Statistics 36
Table 4.1 Ever tried to give up smoking: by sex, 1999-2007
Table 4.2 Ever tried to give up smoking: by socio-economic classification and by presence of children in the household, 2007
All smokers Socio-economic classification Children No children Total1
Attempts at giving Managerial and Intermediate Routine and under 16 in household up smoking professional occupations manual in occupations occupations household % % % % % % Has ever tried to give up 84 86 76 80 79 79 Has not ever tried to give up 16 14 24 20 21 21 Unweighted base 139 73 263 142 378 520 Weighted base (000s) * 2,612 1,540 5,074 3,256 7,149 10,405 * weighted to population totals Shaded figures indicate the estimates are unreliable and any analysis using these figures may be invalid. Any use of these shaded figures must be accompanied by this disclaimer. ' Those who could not be classified (full-time students, those who had never worked or were long-term unemployed, and those whose occupation was not stated or inadequately described) are not shown as separate categories, but are included in the total.
All smokers Ever tried to give 1999 2000 2001 2002 2003 2004 2005 2006 2007 * 2007 ** 2007 2007 2007 up smoking Weighted Unweighted Weighted base * base base
(000s) ** Percentage who had ever tried to give up smoking Men 76 78 77 78 79 72 78 77 79 79 256 254 5,632 Women 78 78 81 80 76 76 82 79 81 79 241 266 4,773 All 77 78 79 79 78 74 80 78 80 79 497 520 10,405 Bases for earlier years can be found in Omnibus reports for each year. 1999-2006 percentages weighted for unequal chance of selection * weighted for unequal chance of selection ** weighted to population totals

4: Attempts to give up smoking
Smoking-related Behaviour and Attitudes, 2007
Office for National Statistics 37
Table 4.3 Ever tried to give up smoking: by number of cigarettes smoked per day, 2007
All smokers
Attempts at giving Number of cigarettes per day Total up smoking 20 or 10-19 Fewer more than 10 % % % % Has ever tried to give up 87 77 76 79 Has not ever tried to give up 13 23 24 21 Unweighted base 135 221 162 520 Weighted base (000s) * 2,515 4,491 3,375 10,405
* weighted to population totals
Table 4.4 Attempts to give up smoking in last five years: by sex, 1999-2007
All smokers Made a serious 1999 2000 2001 2002 2003 2004 2005 2006 2007 * 2007 ** 2007 2007 2007 attempt in Weighted Unweighted Weighted past 5 years base * base base
(000s) ** Percentage who have made a serious attempt to stop smoking in past 5 years Men 48 50 51 49 50 48 54 56 57 58 256 254 5,632 Women 55 49 57 57 54 50 56 60 62 62 241 264 4,750 All 52 50 54 53 52 50 55 58 60 60 497 518 10,382 Bases for earlier years can be found in Omnibus reports for each year. 1999-2006 percentages weighted for unequal chance of selection * weighted for unequal chance of selection ** weighted to population totals
Table 4.5 Attempts to give up smoking in past five years: by number of cigarettes smoked per day, 2007
All smokers Made a serious Number of cigarettes per day Total attempt in past 5 years 20 or 10-19 Fewer more than 10 % % % %
Has tried to give up in past 5 years 62 58 59 60 Has not tried to give up in past 5 years
38 42 41 40
Unweighted base 135 221 162 518 Weighted base (000s) * 2,515 4,491 3,375 10,382 * weighted to population totals

4: Attempts to give up smoking
Smoking-related Behaviour and Attitudes, 2007
Office for National Statistics 38
Table 4.6 Attempts to give up smoking in the last year: 1999-2007
Table 4.7 Number of attempts to give up smoking in the last year: 1999-2007
Smokers who have tried to give up in past year Number of attempts at giving 1999 2000 2001 2002 2003 2004 2005 2006 2007 * 2007 ** up smoking % % % % % % % % % % One 44 58 58 60 61 60 58 55 58 59 Two 28 18 20 25 22 23 20 26 22 22 Three or more 28 24 22 15 17 17 22 19 19 18 Unweighted base 165 Weighted base (000s) ** 3,149 Weighted base * 244 193 203 218 198 205 153 167 151 1999-2006 percentages and bases weighted for unequal chance of selection * weighted for unequal chance of selection ** weighted to population totals
All smokers Tried to give up 1999 2000 2001 2002 2003 2004 2005 2006 2007 * 2007 ** 2007 2007 2007 smoking Weighted Unweighted Weighted in last year base ** base base
(000s) ** Percentage who have tried to stop smoking in last year Men 23 24 21 20 22 24 24 27 30 30 256 254 5,632 Women 28 20 27 26 24 27 29 31 32 32 241 266 4,773 All 26 22 24 23 23 25 27 29 31 31 497 520 10,405 Bases for earlier years can be found in Omnibus reports for each year. 1999-2006 percentages weighted for unequal chance of selection * weighted for unequal chance of selection ** weighted to population totals

4: Attempts to give up smoking
Smoking-related Behaviour and Attitudes, 2007
Office for National Statistics 39
Table 4.8 Length of time gave up for the last time stopped smoking: 1999-2007
Smokers who had tried to give up Length of time gave up smoking
1999 2000 2001 2002 2003 2004 2005 2006 2007 * 2007 **
% % % % % % % % % % A week 23 23 20 24 22 19 23 20 18 19 2 weeks 10 10 9 10 8 10 9 13 10 10 3-4 weeks 11 11 13 11 11 14 14 10 12 13 5-9 weeks 10 11 12 10 12 10 11 12 13 12 10 - 25 weeks 13 14 14 12 14 13 14 15 19 17 6-12 months 16 17 18 19 16 19 18 17 17 17 More than 1 year, but less than 2
8 33 5 30 5 32 6 35 8 32 4 33 4 29 6 30 4 28 4 28
2 years or more 9 8 9 10 8 10 7 8 7 7
Unweighted base 419 Weighted base (000s) **
8,188
Weighted base * 723 667 666 743 661 598 454 445 398 1999-2006 percentages and bases weighted for unequal chance of selection * weighted for unequal chance of selection ** weighted to population totals
Table 4.9 Length of time gave up for the last time stopped smoking: by sex, 2007
Smokers who had tried to give up Length of time gave up Men Women Total smoking % % % Less than 6 months 75 69 72 6 months or more 25 31 28 Unweighted base 202 217 419 Weighted base (000s) * 4,401 3,786 8,188 * weighted to population totals

4: Attempts to give up smoking
Smoking-related Behaviour and Attitudes, 2007
Office for National Statistics 40
Table 4.10 Length of time gave up for the last time stopped smoking: by number of cigarettes smoked per day, 2007
Smokers who had tried to give up
Length of time gave up Number of cigarettes per day Total smoking 20 or 10-19 Fewer more than 10 % % % % Less than 6 months 72 74 69 72 6 months or more 28 26 31 28 Unweighted base 115 177 126 419 Weighted base (000s) * 2,159 3,442 2,523 8,188
* weighted to population totals
Table 4.11 Main reasons for starting smoking again: 2002-2007
Smokers who gave up for at least one day in past year Reasons for starting smoking again 2002 2003 2004 2005 2006 2007 * 2007 ** Percentage giving reason for starting smoking again Life too stressful/just not a good time 34 38 34 34 42 36 34 Missed the habit/something to do with my hands 17 17 16 13 14 14 14 I like smoking 16 15 15 15 12 23 24 My friends smoke 14 11 14 14 19 15 17 Couldn't cope with the cravings 12 14 9 13 12 12 11 Put on weight 3 3 3 2 3 6 5 My spouse/partner smokes 4 5 5 4 4 4 4 Was drinking/ in pub* .. .. .. 4 3 1 1 Reason for quitting no longer applied + .. .. .. 4 2 0 0 Other 20 18 23 14 10 14 14 Gave more than one reason 16 14 16 14 19 18 17 Unweighted base 293 Weighted base (000s) ** 6,175 Weighted base * 433 421 420 292 280 284 2002-2006 percentages and bases weighted for unequal chance of selection * weighted for unequal chance of selection ** weighted to population totals Percentages sum to more than 100 as respondents could give more than one answer. + These categories were created in '2005' and '2006' when reassigning 'Other ' responses, and were not in the original list which interviewers used to code responses.

4: Attempts to give up smoking
Smoking-related Behaviour and Attitudes, 2007
Office for National Statistics 41
Table 4.12 Main reasons for not trying to give up smoking: 2002-2007
Table 4.13 People who have tried to get smokers to quit: 1999-2007
All smokers People who tried to get them 1999 2000 2001 2002 2003 2004 2005 2006 2007 * 2007 ** to quit smoking in last year? Percentage mentioning: Partner/spouse 22 21 20 19 19 24 24 16 22 22 Children 18 19 15 15 15 17 22 17 18 17 Parents 15 12 12 12 12 11 14 12 14 16 Friend 10 9 8 6 7 8 10 9 8 8 Sibling 5 3 3 2 1 3 2 4 4 3 Workmate 3 2 2 2 2 2 2 1 3 3 Other 6 5 4 5 6 6 7 6 10 9 Someone 55 52 49 48 48 53 57 49 57 55 No one 45 48 51 52 52 47 43 51 43 45 Unweighted base 520 Weighted base (000s) ** 10,405 Weighted base * 950 871 845 946 851 811 570 573 497 1999-2006 percentages and bases weighted for unequal chance of selection * weighted for unequal chance of selection ** weighted to population totals Percentages sum to more than the total saying someone encouraged them to quit smoking as respondents could give more than one answer.
Smokers who want to give up but who have not succeeded for more than one day Reasons for not trying to stop smoking 2002 2003 2004 2005 2006 2007 * 2007 **
% % % % % % % Life too stressful/just not a good time 29 36 26 35 33 33 34 Lack of commitment to quitting 29 27 31 31 34 33 33 I like smoking 15 18 23 21 15 24 24 Couldn't cope with the cravings 15 15 8 18 13 10 10 Would miss the habit/something to do with my hands 13 11 9 10 10 9 9 My friends smoke 6 7 6 4 6 7 6 Worried about putting on weight 5 3 5 7 9 4 4 My spouse/partner smokes 5 3 5 6 3 7 6 Other 16 10 12 6 9 8 8 Gave more than one reason 21 21 18 28 26 21 19
Unweighted base 140 Weighted base (000s) ** 2,736 Weighted base * 300 251 239 162 178 136 2002-2006 percentages and bases weighted for unequal chance of selection * weighted for unequal chance of selection ** weighted to population totals Percentages sum to more than 100 as respondents could give more than one answer.

4: Attempts to give up smoking
Smoking-related Behaviour and Attitudes, 2007
Office for National Statistics 42
Table 4.14 People who have tried to get smokers to quit: by sex, 2007
All smokers People who tried to get them Men Women Total to quit smoking in last year? Percentage mentioning: Partner/spouse 21 22 22 Children 13 22 17 Parents 16 15 16 Friend 6 10 8 Sibling 3 4 3 Workmate 4 2 3 Other 11 7 9 Someone 53 58 55 No one 47 42 45 Unweighted base 254 266 520 Weighted base (000s) * 5,632 4,773 10,405 * weighted to population totals Percentages sum to more than the total saying someone encouraged them to quit smoking as respondents could give more than one answer.
Table 4.15 People who have tried to get smokers to quit: by number of cigarettes smoked per day, 2007
All smokers
Number of cigarettes per day People who tried to get them to quit smoking in last year? 20 or more 10-19 Fewer
than 10
Total
Percentage mentioning: Partner/spouse 24 21 22 22 Children 24 18 9 17 Parents 13 15 18 16 Friend 10 7 7 8 Sibling 2 4 5 3 Workmate 2 4 2 3 Other 14 8 5 9 Someone 56 59 49 55 No one 44 41 51 45 Unweighted base 135 221 162 520 Weighted base (000s) * 2,515 4,491 3,375 10,405
* weighted to population totals Percentages sum to more than the total saying someone encouraged them to quit smoking as respondents could give more than one answer.

4: Attempts to give up smoking
Smoking-related Behaviour and Attitudes, 2007
Office for National Statistics 43
Table 4.16 Length of time since stopped smoking: by sex, 1999-2007
Ex-smokers
1999 2000 2001 2002 2003 2004 2005 2006 2007 * 2007 ** Length of time since stopped smoking
Men % % % % % % % % % % Less than a year 4 7 4 6 6 8 5 9 10 11 1-4 years 12 14 13 14 10 13 16 10 10 13 5-9 years 14 13 11 10 11 15 12 11 15 16 10-14 years 14 11 12 14 11 11 7 10 11 11 15-19 years 12 10 11 12 10 9 12 14 8 8 20-24 years 12 15 16 14 15 11 10 12 8 8 25 years or more 31 31 33 32 38 33 38 34 37 33 Unweighted base 318 Weighted base (000s) ** 6,174 Weighted base * 557 533 487 528 470 490 319 327 317 Women Less than a year 9 6 7 10 8 10 13 10 9 9 1-4 years 13 14 20 19 16 16 19 13 19 21 5-9 years 15 11 15 11 15 16 13 14 18 18 10-14 years 15 15 13 11 15 12 8 13 7 7 15-19 years 13 12 9 9 9 11 9 10 8 8 20-24 years 14 14 14 11 14 12 11 9 9 8 25 years or more 22 28 22 28 23 24 27 30 29 28 Unweighted base 310 Weighted base (000s) ** 5,567 Weighted base * 419 390 400 472 405 471 289 305 296 All Less than a year 6 6 6 8 7 9 9 9 10 10 1-4 years 13 14 16 16 12 14 17 12 15 16 5-9 years 14 12 13 10 13 15 12 12 17 17 10-14 years 14 13 13 12 13 11 8 11 9 9 15-19 years 12 11 10 10 10 10 11 12 8 8 20-24 years 13 14 15 13 14 12 10 11 9 8 25 years or more 27 30 28 30 31 29 33 32 33 31 Unweighted base 628 Weighted base (000s) ** 11,741 Weighted base * 976 923 887 1000 875 961 608 632 613 1999-2006 percentages and bases weighted for unequal chance of selection * weighted for unequal chance of selection ** weighted to population totals

4: Attempts to give up smoking
Smoking-related Behaviour and Attitudes, 2007
Office for National Statistics 44
Table 4.17 Length of time since stopped smoking: by age, 2007
Table 4.18 Length of time since stopped smoking: by number of cigarettes smoked per day, 2007
Ex-smokers Number of cigarettes per day when
smoked Total
20 or 10-19 Fewer
Length of time since stopped smoking
more than 10 % % % % Less than a year 8 14 10 10 1-4 years 11 18 23 16 5-9 years 17 17 16 17 10-14 years 8 10 10 9 15-19 years 10 7 6 8 20-24 years 9 7 8 8 25 years or more 36 26 27 31 Unweighted base 287 198 140 628 Weighted base (000s) * 4,984 3,851 2,849 11,741 * weighted to population totals
Ex-smokers Length of time Age Total since stopped smoking 16-24 25-44 45-64 65 and over % % % % Less than a year [11] 16 6 2 10 1-4 years [11] 29 10 8 16 5-9 years [2] 25 21 9 17 10-14 years [0] 15 8 8 9 15-19 years [0] 10 9 8 8 20-24 years [0] 4 11 9 8 25 years or more [0] 2 34 56 31 Unweighted base 24 131 233 240 628 Weighted base (000s) * 803 2,874 4,268 3,797 11,741 * weighted to population totals

4: Attempts to give up smoking
Smoking-related Behaviour and Attitudes, 2007
Office for National Statistics 45
Table 4.19 Main reasons for having stopped smoking: 1996-2007
Ex-smokers Reasons for having stopped
1996 1997 1999 2000 2001 2002 2003 2004 2005 2006 2007 * 2007 **
Percentage giving reason for having stopped smoking Better for health in general 48 50 53 55 50 53 52 53 62 54 58 59 Less risk of getting smoking related illness
12 15 18 18 15 14 13 15 18 13 18 19
Present health problems 15 14 13 13 12 15 12 13 12 11 14 13 At least one health reason 64 65 67 67 64 68 66 68 71 65 69 69 Financial reasons 24 22 25 24 20 19 22 18 21 16 18 17 Family pressure 13 14 12 15 11 14 12 13 20 15 13 13 Harms children 8 10 8 9 8 8 7 8 9 10 8 8 Doctor's advice 5 6 7 6 8 5 4 6 10 6 5 5 Pregnancy 6 8 6 6 5 7 7 8 6 10 8 8 Ban on smoking in public places
.. .. .. .. .. .. .. .. .. .. 1 1
Other 12 17 14 17 19 11 14 10 9 10 5 5 Gave more than one reason
32 42 41 44 36 36 33 34 45 34 36 36
Unweighted base 629 Weighted base (000s) ** 11,199 Weighted base * 944 1018 975 919 884 999 876 960 609 635 587 1996-2006 percentages and bases weighted for unequal chance of selection * weighted for unequal chance of selection ** weighted to population totals Percentages sum to more than 100 as respondents could give more than one answer. .. code added in 2007

4: Attempts to give up smoking
Smoking-related Behaviour and Attitudes, 2007
Office for National Statistics 46
Table 4.20 Main reasons for having stopped smoking: by sex and by age, 2007
Ex-smokers Reasons for having stopped Sex Age Total Men Women 16-24 25-44 45-64 65 and over Percentage giving reason for having stopped smoking Better for health in general 64 54 [11] 66 64 52 59 Less risk of getting smoking related illness 22 16 [3] 25 22 12 19 Present health problems 14 12 [0] 6 12 23 13 At least one health reason 75 63 [12] 72 72 67 69 Financial reasons 18 15 [4] 12 16 22 17 Family pressure 14 13 [3] 14 13 12 13 Harms children 5 12 [2] 13 11 3 8 Doctor's advice 5 4 [0] 1 6 8 5 Pregnancy 1 16 [6] 13 8 2 8 Ban on smoking in public places 1 1 [2] 1 1 1 1 Other 6 4 [1] 6 4 6 5 Gave more than one reason 37 34 [6] 39 40 31 36 Unweighted base 319 310 24 131 234 240 629 Weighted base (000s) * 5,843 5,356 803 2,756 4,130 3,511 11,199 * weighted to population totals Percentages sum to more than 100 as respondents could give more than one answer.

4: Attempts to give up smoking
Smoking-related Behaviour and Attitudes, 2007
Office for National Statistics 47
Table 4.21 Main reasons for having stopped smoking: by number of cigarettes smoked per day, 2007
Ex-smokers Reasons for having stopped Number of cigarettes per day when
smoked Total
20 or 10-19 Fewer more than 10 Percentage giving reason for having stopped smoking Better for health in general 61 58 57 59 Less risk of getting smoking related illness 18 20 20 19 Present health problems 17 11 8 13 At least one health reason 74 67 65 69 Financial reasons 19 12 18 17 Family pressure 13 15 11 13 Harms children 8 8 9 8 Doctor's advice 8 3 1 5 Pregnancy 6 11 7 8 Ban on smoking in public places 2 1 1 1 Other 5 5 6 5 Gave more than one reason 41 33 30 36 Unweighted base 287 199 140 629 Weighted base (000s) * 4,827 3,728 2,610 11,199 * weighted to population totals Percentages sum to more than 100 as respondents could give more than one answer.

4: Attempts to give up smoking
Smoking-related Behaviour and Attitudes, 2007
Office for National Statistics 48
Table 4.22 Main reasons for having stopped smoking: by length of time since stopped, 2007
Ex-smokers Reasons for having stopped Length of time since stopped Total Less than 5-19 20 years 5 years years or more Percentage giving reason for having stopped smoking Better for health in general 57 64 57 59 Less risk of getting smoking related illness 22 20 16 19 Present health problems 12 18 10 13 At least one health reason 70 77 62 69 Financial reasons 11 15 22 17 Family pressure 18 10 12 13 Harms children 8 10 8 8 Doctor's advice 6 6 3 5 Pregnancy 10 7 8 8 Ban on smoking in public places 4 1 - 1 Other 5 3 7 5 Gave more than one reason 37 37 34 36 Unweighted base 147 203 278 629 Weighted base (000s) * 3,068 3,938 4,193 11,199 * weighted to population totals Percentages sum to more than 100 as respondents could give more than one answer.

4: Attempts to give up smoking
Smoking-related Behaviour and Attitudes, 2007
Office for National Statistics 49
Table 4.23 Sources of help and advice used in the last year: by sex, 1999-2007
All smokers Source of help or advice 1999 2000 2001 2002 2003 2004 2005 2006 2007 * 2007 **
Men Percentage who had: Read leaflets/booklets on how to stop 34 26 23 25 25 32 27 32 38 38 Asked doctor or other health prof for help 4 5 7 10 9 12 11 13 18 16 Called a smokers' telephone helpline 2 2 2 4 4 4 4 3 5 5 Been referred/self-referred to stop smoking group
2 2 2 4 3 6 4 9 9 8
Bought non-prescription NRT + .. 10 8 8 8 9 9 13 16 17 Free non-prescription NRT + .. 0 0 - - 1 - 1 4 4 Paid for prescription NRT + .. 1 0 2 2 2 4 3 3 2 Free prescription NRT + .. - 1 3 4 5 3 8 10 9 Prescribed other 'stop smoking' drugs + .. 1 2 2 0 1 1 1 2 2 Had any NRT/other prescribed drugs to help stop smoking
12 12 11 14 14 16 16 26 32 32
Sought any help or advice 40 32 32 33 34 41 39 49 51 51 Did not seek help or advice 60 68 68 67 66 59 61 51 49 49 Unweighted base 254 Weighted base (000s) ** Weighted base * 447 416 397 456 425 378 274 281 256 5,632 Women Read leaflets/booklets on how to stop 40 35 37 30 32 38 39 40 46 44 Asked doctor or other health prof for help 6 10 12 11 13 17 19 21 18 17 Called a smokers' telephone helpline 4 3 6 3 5 6 7 7 5 5 Been referred/self-referred to stop smoking group
1 2 4 4 7 8 10 11 12 11
Bought non-prescription NRT + .. 10 11 8 10 12 12 10 16 15 Free non-prescription NRT + .. 0 0 0 1 0 1 2 5 4 Paid for prescription NRT + .. 1 1 1 4 4 5 5 5 4 Free prescription NRT + .. 1 3 4 7 7 6 13 10 10 Prescribed other 'stop smoking' drugs + .. 1 2 0 2 1 1 1 2 1 Had any NRT/other prescribed drugs to help stop smoking
22 13 16 14 22 23 22 30 32 31
Sought any help or advice 48 41 44 39 44 47 53 52 56 55 Did not seek help or advice 52 59 56 61 56 53 47 48 44 45 Unweighted base 266 Weighted base (000s) ** 4,773 Weighted base * 503 456 448 488 426 433 297 291 241

4: Attempts to give up smoking
Smoking-related Behaviour and Attitudes, 2007
Office for National Statistics 50
All smokers Source of help or advice 1999 2000 2001 2002 2003 2004 2005 2006 2007 * 2007 ** All Percentage who had: Read leaflets/booklets on how to stop 38 31 30 28 29 35 33 36 41 41 Asked doctor or other health prof for help 5 7 10 10 11 15 15 17 18 16 Called a smokers' telephone helpline 3 3 4 3 4 5 6 5 5 5 Been referred/self-referred to stop smoking group
1 2 3 4 5 7 8 10 10 9
Bought non-prescription NRT + .. 10 10 8 9 10 11 12 16 16 Free non-prescription NRT + .. 0 0 0 0 1 1 2 4 4 Paid for prescription NRT + .. 1 0 2 3 3 4 4 4 3 Free prescription NRT + .. 0 2 4 5 6 5 11 10 10 Prescribed other 'stop smoking' drugs + .. 1 2 1 1 1 1 1 2 2 Had any NRT/other prescribed drugs to help stop smoking
17 12 13 14 18 19 19 28 32 32
Sought any help or advice 44 37 38 36 39 44 46 51 54 53 Did not seek help or advice 56 63 62 64 61 56 54 49 46 47 Unweighted base 520 Weighted base (000s) ** 10,405 Weighted base * 950 872 846 944 851 811 571 572 497 1999-2006 percentages and bases weighted for unequal chance of selection * weighted for unequal chance of selection
** weighted to population totals + Question changed between 1999 and 2000. Percentages sum to more than the total saying they sought help or advice as respondents could give more than one answer.

4: Attempts to give up smoking
Smoking-related Behaviour and Attitudes, 2007
Office for National Statistics 51
Table 4.24 Sources of help and advice used in the last year: by socio-economic classification, 2007
All smokers Source of help or advice Socio-economic classification Total1
Managerial and Intermediate Routine and professional occupations manual occupations occupations Percentage who had: Read leaflets/booklets on how to stop 39 37 40 41 Asked doctor or other health prof for help 14 15 19 16 Called a smokers' telephone helpline 4 2 6 5 Been referred/self-referred to stop smoking group 10 8 9 9 Bought non-prescription NRT 18 25 12 16 Free non-prescription NRT 4 2 4 4 Paid for prescription NRT 4 3 3 3 Free prescription NRT 5 10 11 10 Prescribed other 'stop smoking' drugs 2 - 2 2 Had any NRT/other prescribed drugs to help stop smoking
30 37 28 32
Sought help or advice 51 56 52 53 Did not seek help or advice 49 44 48 47 Unweighted base 139 73 263 520 Weighted base (000s) * 2,612 1,540 5,074 10,405 * weighted to population totals Shaded figures indicate the estimates are unreliable and any analysis using these figures may be invalid. Any use of these shaded figures must be accompanied by this disclaimer. Percentages sum to more than the total saying they sought help or advice as people could give more than one answer. ' Those who could not be classified (full-time students, those who had never worked or were long-term unemployed, and those whose occupation was not stated or inadequately described) are not shown as separate categories, but are included in the total.

4: Attempts to give up smoking
Smoking-related Behaviour and Attitudes, 2007
Office for National Statistics 52
Table 4.25 Sources of help and advice used in the last year: by number of cigarettes smoked per day, 2007
All smokers Source of help or advice Number of cigarettes per day Total 20 or 10-19 Fewer more than 10 Percentage who had: Read leaflets/booklets on how to stop 42 43 36 41 Asked doctor or other health prof for help 27 14 12 16 Called a smokers' telephone helpline 8 3 5 5 Been referred/self-referred to stop smoking group 14 10 4 9 Bought non-prescription NRT 18 18 12 16 Free non-prescription NRT 6 4 2 4 Paid for prescription NRT 4 2 3 3 Free prescription NRT 12 11 5 10 Prescribed other 'stop smoking' drugs 4 1 1 2 Had any NRT/other prescribed drugs to help stop smoking 38 34 23 32 Sought help or advice 57 57 45 53 Did not seek help or advice 43 43 55 47 Unweighted base 135 221 162 520 Weighted base (000s) * 2,515 4,491 3,375 10,405 * weighted to population totals Percentages sum to more than the total saying they sought help or advice as people could give more than one answer.

4: Attempts to give up smoking
Smoking-related Behaviour and Attitudes, 2007
Office for National Statistics 53
Table 4.26 Source of advice on smoking in the last five years: 1996-2007
All smokers Source of advice 1996 1997 1999 2000 2001 2002 2003 2004 2005 2006 2007 * 2007 **
Received advice from: GP 38 34 37 35 32 35 36 37 41 42 46 44 Someone else at the surgery 13 11 13 12 15 14 17 19 23 22 25 24 Pharmacist 2 2 3 4 5 2 5 6 6 8 8 8 Consultant/hospital doctor + .. .. .. .. .. .. 12 11 12 11 15 14 Other health professional 11 10 12 9 9 8 6 4 8 10 12 12 Any of the above 46 43 45 44 42 42 46 44 52 54 57 54 Unweighted base 520 Weighted base (000s) ** 10,405 Weighted base * 1047 985 950 871 844 941 850 811 569 572 497 1996-2006 percentages weighted for unequal chance of selection * weighted for unequal chance of selection ** weighted to population totals Percentages sum to more than the 'Any of the above' total as people could give more than one answer. + extra category added in 2003

4: Attempts to give up smoking
Smoking-related Behaviour and Attitudes, 2007
Office for National Statistics 54
Table 4.27 Source of advice on smoking in the last five years: by sex, 2007
All smokers Source of advice Men Women Total
Received advice from: GP 41 47 44 Someone else at the surgery 23 24 24 Pharmacist 7 8 8 Consultant/hospital doctor 16 13 14 Other health professional 11 14 12 Any of the above 49 61 54 Unweighted base 254 266 520 Weighted base (000s) * 5,632 4,773 10,405 * weighted to population totals Percentages sum to more than the 'Any of the above' total as people could give more than one answer.
Table 4.28 Source of advice on smoking in the last five years: by number of cigarettes smoked per day, 2007
All smokers Source of advice Number of cigarettes per day Total
20 or 10-19 Fewer more than 10 Received advice from: GP 60 48 26 44 Someone else at the surgery 34 23 16 24 Pharmacist 12 8 4 8 Consultant/hospital doctor 19 15 9 14 Other health professional 11 13 12 12 Any of the above 67 58 40 54 Unweighted base 135 221 162 520 Weighted base (000s) * 2,515 4,991 3,375 10,405 * weighted to population totals Percentages sum to more than the 'Any of the above' total as people could give more than one answer.

4: Attempts to give up smoking
Smoking-related Behaviour and Attitudes, 2007
Office for National Statistics 55
Table 4.29 Source of advice on smoking in the last five years: by socio-economic classification, 2007
All smokers Source of advice Socio-economic classification Total1
Managerial and Intermediate Routine and professional occupations manual occupations occupations Received advice from: GP 43 42 47 44 Someone else at the surgery 28 29 22 24 Pharmacist 7 11 7 8 Consultant/hospital doctor 14 9 16 14 Other health professional 16 9 9 12 Any of the above 57 47 56 54 Unweighted base 139 73 263 520 Weighted base (000s) * 2,612 1,540 5,074 10,405 * weighted to population totals Percentages sum to more than the 'Any of the above' total as people could give more than one answer. Shaded figures indicate the estimates are unreliable and any analysis using these figures may be invalid. Any use of these shaded figures must be accompanied by this disclaimer. ' Those who could not be classified (full-time students, those who had never worked or were long-term unemployed, and those whose occupation was not stated or inadequately described) are not shown as separate categories, but are included in the total.

4: Attempts to give up smoking
Smoking-related Behaviour and Attitudes, 2007
Office for National Statistics 56
Table 4.30 Type of advice given in the last five years, and whether it was helpful or not: by sex, 1996- 2007
Current smokers given advice Type of advice 1996 1997 1999 2000 2001 2002 2003 2004 2005 2006 2007 * 2007 **
Men % % % % % % % % % % % % Type of advice Discussion and literature 86 87 88 82 84 87 85 77 83 82 75 73 Literature only 14 13 12 18 16 13 15 23 17 18 25 27 Whether helpful % % % % % % % % % % % % Yes 56 52 52 45 58 54 55 59 62 60 59 57 No 44 48 48 55 42 46 45 41 38 40 41 43 Unweighted base 125 Weighted base (000s) ** 2,707 Weighted base * 252 175 180 166 142 168 185 151 126 131 129 Women Type of advice Discussion and literature 83 85 82 87 86 86 81 82 80 80 80 78 Literature only 17 15 18 13 14 14 19 18 20 20 20 22 Whether helpful Yes 42 53 45 47 50 50 66 59 56 62 63 61 No 58 47 55 53 50 50 34 41 44 38 37 39 Unweighted base 172 Weighted base (000s) ** 2,929 Weighted base * 303 245 248 212 202 223 203 216 178 186 151 All Type of advice Discussion and literature 85 86 85 85 85 86 83 80 82 81 78 76 Literature only 15 14 15 15 15 14 17 20 18 19 22 24 Whether helpful Yes 48 52 48 46 53 52 60 59 59 61 61 59 No 52 48 52 54 47 48 40 41 41 39 39 41 Unweighted base 297 Weighted base (000s) ** 5,635 Weighted base * 555 420 428 378 344 391 388 367 302 317 280 1996-2006 percentages weighted for unequal chance of selection * weighted for unequal chance of selection ** weighted to population totals

4: Attempts to give up smoking
Smoking-related Behaviour and Attitudes, 2007
Office for National Statistics 57
Table 4.31 Whether ex-smokers were given advice on smoking in the last five years: 1999-2007
Ex-regular smokers who gave up smoking in the last five years Whether given advice when smoked 1999 2000 2001 2002 2003 2004 2005 2006 2007 * 2007 ** Percentage been given advice: Been given advice 35 48 36 35 32 35 45 48 44 40 Unweighted base 148 Weighted base (000s) ** 3,165 Weighted base * 189 183 195 238 169 221 159 135 151 1999-2006 percentages weighted for unequal chance of selection * weighted for unequal chance of selection ** weighted to population totals

5: Awareness of health issues related to smoking
Smoking-related Behaviour and Attitudes, 2007
Office for National Statistics 58
5: Awareness of health issues related to smoking
Awareness of relative risk of smoking In order to gain an insight into awareness of the risks of smoking,
respondents were asked which of a list of possible causes they thought was
responsible for most premature deaths (deaths before the age of 65) in the
United Kingdom. The question was asked at the beginning of the section
on smoking, so that answers would not be influenced by the questions on
smoking behaviour and attitudes that followed. Answers to this kind of
question should be interpreted with caution because the concept of cause
of premature death is complex and likely to mean different things to
different people.
The most frequently mentioned cause of most premature deaths was
smoking – 42 per cent of people mentioned it in 2007, significantly lower
than the 46 per cent who mentioned it in 2006.
The next most common answer was road accidents (35 per cent) followed
by alcohol misuse (12 per cent) and illicit drugs (6 per cent). Although it is
difficult to give an accurate estimate of the actual number of premature
deaths attributable to each of the causes covered, public perception of the
risks of death due to road accidents compared with those due to smoking
are clearly wrong. In the United Kingdom, fewer than 3,000 people under
69 die in road accidents each year compared with an estimate of almost
33,000 deaths of people under age 65 from smoking8.
Smokers were significantly less likely than any other group to say that
smoking causes the most premature deaths: 34 per cent of those who
smoked mentioned smoking as the main cause of premature death
compared with 42 per cent of those who had never smoked.
Men were no more likely than women to say that smoking causes the most
deaths under the age of 65 (42 per cent of men compared with 40 per cent
of women). The youngest age group (aged 16-24) were the least likely to
think that smoking was the main cause of premature death (28 per cent of
those aged 16-24 compared with 45 per cent of those aged 25-64 and 39
per cent of those aged 65 and over).
Tables 5.1 - 5.3
Awareness of the effect of second-hand smoking To evaluate awareness of the effect of second-hand smoking, respondents
were asked whether or not they thought that living with a smoker
increased a child’s risk of a range of medical conditions known, or thought,
8 Peto, R., Lopez, A., Boreham, J., Thun, M. and Heath, C.J. (2004) Mortality from smoking in developed countries full data available from http://www.ctsu.ox.ac.uk/~tobacco/C4308.pdf

5: Awareness of health issues related to smoking
Smoking-related Behaviour and Attitudes, 2007
Office for National Statistics 59
to be caused or exacerbated by second-hand smoking. These conditions
included asthma, ear infections, cot death, chest infections, and other
infections. Respondents were then asked a similar set of questions about
whether or not second-hand smoking would increase a non-smoking
adult‘s risk of asthma, lung cancer, heart disease, bronchitis, and coughs
and colds. One further health problem was included on both lists -
diabetes - the risk of which is not medically proven to be increased by
either active or second-hand smoking. At both questions, nearly a fifth
said they thought that the risk of becoming diabetic would be increased by
second-hand smoking.
Of all the health problems covered in the survey, people appeared to be the
most aware of the effect of living with a smoker on a child's risk of chest
infections and asthma (91 per cent and 85 per cent respectively). These
were also the two health problems for which the percentage who could not
answer was lowest - 2 per cent and 4 per cent respectively, indicating that
people were confident about their answers.
People appeared to be least aware of the effect of living with a smoker on a
child's risk of ear infections. Only a third (34 per cent) of people thought
that the risk of ear infections would be increased by living with a smoker
and a further fifth (18 per cent) were unable to say whether it would or not.
The percentages of people who thought that living with a smoker would
increase a child’s risk of the specified medical conditions were similar to
the figures for previous years.
Ex-smokers and those who had never smoked regularly tended to be either
more aware of the risks of living with a smoker than current smokers, or
more prepared to acknowledge them. For example, of respondents who
had never smoked, 91 per cent said that they thought living with a smoker
increased a child’s risk of asthma compared with only 64 per cent of those
who smoked 20 or more cigarettes a day. Women were more aware than
men of the link between living with a smoker and cot death (62 per cent of
women and 52 per cent of men said they thought it increased the risk).
People in the oldest age group tended to be less likely to think that living
with a smoker increased the risk of cot death compared with those aged
25-64, and less likely to think it increased the risk of other infections
compared with those aged 16-44.
People who were living in a household with children were more likely than
those with no children in the household to think that living with a smoker
increased the risk of cot death, ear infections or other infections. Those in
routine and manual occupations were less likely than those in managerial
and professional occupations to think that living with a smoker increased
the risk of asthma, but there were no other statistically significant
differences.
Tables 5.4 - 5.7 and Figure 5.1

5: Awareness of health issues related to smoking
Smoking-related Behaviour and Attitudes, 2007
Office for National Statistics 60
0%
10%
20%
30%
40%
50%
60%
70%
80%
90%
100%
Chest infection Asthma Other infections Cot death Ear infections Diabetes
Increase risk Does not increase risk Can't say
Figure 5.1 Views on whether or not living with a smoker increases a child’s risk of certain medical conditions: 2007
Eighty per cent or more of respondents thought that a non-smoking adult's
risk of lung cancer, bronchitis and asthma would be increased by second-
hand smoking. Slightly fewer said that second-hand smoking would
increase the risk of heart disease (74 per cent) and coughs and colds (69
per cent).
In 2007, the percentages who thought second-hand smoking would
increase a non-smoking adult’s risk of bronchitis and heart disease, were
slightly lower than those found in recent years.
As with knowledge about the effect of second-hand smoking on children,
people who had never smoked or who no longer did were more likely than
smokers to be aware of the effect of second-hand smoking on adults. Men
were more likely than women to say that second-hand smoke increased the
risk of diabetes, but there were no other statistically significant differences
between men and women. There were some differences in knowledge by
age. For example, those in the oldest age group were less likely than those
in the youngest age group to be aware of the effect of second-hand
smoking on the risk of lung cancer and coughs and colds in adults.
Those in managerial and professional occupations were more likely than
those in routine and manual occupations to think that second-hand smoke
increases the risk of lung cancer and bronchitis. People who were living in
a household with children were more likely than those with no children in
the household to think that second-hand smoking increased the risk of
lung cancer, asthma and heart disease among non-smoking adults.

5: Awareness of health issues related to smoking
Smoking-related Behaviour and Attitudes, 2007
Office for National Statistics 61
0%
20%
40%
60%
80%
100%
Lung cancer Bronchitis Asthma Heart disease Coughs and colds Diabetes
Increases risk Does not increase risk Can't say
Tables 5.8 - 5.11 and Figure 5.2
Figure 5.2 Views on whether or not second-hand smoking increases a non-smoking adult’s risk of certain medical conditions: 2007

5: Awareness of health issues related to smoking
Smoking-related Behaviour and Attitudes, 2007
Office for National Statistics 62
Table 5.1 What people think is the main cause of death before the age of 65 in the United Kingdom: 1996-2007
Table 5.2 What people think is the main cause of death before the age of 65 in the United Kingdom: by smoking status, 2007
All persons aged 16 and over Main cause of death Smoking status Total before age 65 20 or more Fewer than All Ex-regular Never per day 20 per day current smokers smoked smokers regularly % % % % % % Smoking 40 32 34 46 42 42 Road accidents 31 41 38 31 36 35 Alcohol misuse 14 12 12 12 11 12 Illicit drugs 7 9 8 4 5 6 Accidents at work 2 2 2 2 2 2 AIDS 4 1 1 1 1 1 Murder/manslaughter 1 3 3 3 3 3 Unweighted base 132 375 508 613 1106 2234 Weighted base (000s) * 2,466 7,704 10,180 11,483 23,543 45,196 * weighted to population totals
All persons aged 16 and over Main cause of death 1996 1997 1999 2000 2001 2002 2003 2004 2005 2006 2007 * 2007 ** before age 65
% % % % % % % % % % % % Smoking 43 45 46 44 49 47 48 54 48 46 42 42 Road accidents 43 40 39 42 36 35 35 30 33 33 34 35 Alcohol misuse 4 4 4 4 4 6 6 6 8 10 11 12 Illicit drugs 6 5 6 6 6 7 6 5 6 6 6 6 Accidents at work 2 2 2 2 2 2 2 2 2 2 2 2 AIDS 1 1 1 1 2 1 2 2 1 1 1 1 Murder/manslaughter 1 1 1 1 1 1 1 1 1 3 3 3 Unweighted base 2234 Weighted base (000s) ** 45,196 Weighted base * 3624 3648 3460 3305 3434 3751 3487 3492 2370 2311 2236 1996-2006 percentages and bases weighted for unequal chance of selection * weighted for unequal chance of selection ** weighted to population totals

5: Awareness of health issues related to smoking
Smoking-related Behaviour and Attitudes, 2007
Office for National Statistics 63
Table 5.3 What people think is the main cause of death before the age of 65 in the United Kingdom: by age and sex, 2007
All persons aged 16 and over Main cause of Age Total death before age 65 16-24 25-44 45-64 65 and
over Men % % % % % Smoking 19 49 47 41 42 Road accidents 46 31 33 27 33 Alcohol misuse 12 14 11 17 13 Illicit drugs 11 1 5 8 5 Accidents at work 3 2 3 2 2 AIDS 2 1 0 3 1 Murder/manslaughter 7 2 0 1 2 Unweighted base 73 333 358 246 1010 Weighted base (000s) * 3,280 7,635 7,116 3,841 21,872 Women Smoking 36 41 43 38 40 Road accidents 52 36 35 30 37 Alcohol misuse 8 12 9 9 10 Illicit drugs 1 5 7 11 6 Accidents at work - 1 1 4 2 AIDS - 0 1 2 1 Murder/manslaughter 2 4 4 3 4 Unweighted base 104 406 414 300 1224 Weighted base (000s) * 3,288 7,881 7,419 4,902 23,489 All Smoking 28 45 45 39 42 Road accidents 49 33 34 29 35 Alcohol misuse 10 13 10 13 12 Illicit drugs 6 3 6 10 6 Accidents at work 2 1 2 3 2 AIDS 1 1 0 3 1 Murder/manslaughter 5 3 2 2 3 Unweighted base 177 739 772 546 2234 Weighted base (000s) * 6,568 15,517 14,534 8,743 45,196 * weighted to population totals Shaded figures indicate the estimates are unreliable and any analysis using these figures may be invalid. Any use of these shaded figures must be accompanied by this disclaimer.

5: Awareness of health issues related to smoking
Smoking-related Behaviour and Attitudes, 2007
Office for National Statistics 64
Table 5.4 Views on whether or not living with a smoker increases a child's risk of certain medical conditions: 1996-2007
All persons aged 16 and over Condition 1996 1997 1999 2000 2001 2002 2003 2004 2005 2006 2007 * 2007 **
Chest infection % % % % % % % % % % % % Increases risk 91 91 89 90 90 90 90 90 91 91 91 91 Does not increase risk 7 6 8 8 7 7 8 8 7 7 7 7 Can't say 3 3 3 2 3 3 2 2 2 1 2 2 Asthma Increases risk 84 85 83 84 82 83 84 85 86 86 85 85 Does not increase risk 11 10 12 12 12 12 12 11 10 11 12 12 Can't say 6 5 5 4 6 5 4 4 4 3 4 4 Other infections Increases risk 66 66 63 64 62 62 63 67 64 69 66 66 Does not increase risk 23 22 28 28 29 30 30 26 27 25 26 25 Can't say 12 12 9 8 10 8 7 7 9 7 8 8 Cot death Increases risk 53 53 53 54 55 54 56 57 59 57 58 57 Does not increase risk 28 26 32 31 28 31 31 29 28 31 29 29 Can't say 19 21 16 15 16 15 13 14 14 12 13 14 Ear infections Increases risk 29 36 32 31 28 30 32 34 35 36 35 34 Does not increase risk 27 36 48 48 50 49 51 47 46 46 48 48 Can't say 44 27 21 21 21 22 17 18 19 18 18 18 Diabetes Increases risk 18 19 15 16 15 15 16 20 22 23 18 18 Does not increase risk 51 50 62 61 62 64 66 61 59 59 63 64 Can't say 32 32 23 23 23 21 18 20 19 18 18 18 Unweighted base 2275 Weighted base (000s) ** 46,138 Weighted base * 3696 3718 3547 3327 3493 3818 3517 3545 2403 2347 2273 1996-2006 percentages and bases weighted for unequal chance of selection * weighted for unequal chance of selection ** weighted to population totals

5: Awareness of health issues related to smoking
Smoking-related Behaviour and Attitudes, 2007
Office for National Statistics 65
Table 5.5 Views on whether or not living with a smoker increases a child's risk of certain medical conditions: by smoking status, 2007
All persons aged 16 and over Whether increases Smoking status Total risk 20 or more Fewer than All Ex-regular Never per day 20 per day current smokers smoked smokers regularly Percentage saying living with a smoker increased the risk of the complaint Chest infections 78 87 85 90 94 91 Asthma 64 75 73 83 91 85 Other infections 47 59 56 64 71 66 Cot death 41 51 48 55 62 57 Ear infections 22 26 25 34 38 34 Diabetes 16 12 13 19 20 18 Percentage saying living with a smoker did not increase the risk of the complaint Chest infection 18 9 12 8 5 7 Asthma 30 19 22 13 6 12 Other infections 44 32 35 27 20 25 Cot death 47 33 37 30 26 29 Ear infections 63 58 59 46 45 48 Diabetes 72 68 69 61 62 64 Percentage who did not know whether living with a smoker increased the risk of the complaint or not Chest infections 4 3 3 2 2 2 Asthma 6 6 6 4 2 4 Other infections 10 8 9 9 8 8 Cot death 12 16 15 15 12 14 Ear infections 15 16 16 20 17 18 Diabetes 12 20 18 19 17 18 Unweighted base 135 383 520 627 1128 2275 Weighted base (000s) * 2,515 7,867 10,405 11,733 24,001 46,138 * weighted to population totals

5: Awareness of health issues related to smoking
Smoking-related Behaviour and Attitudes, 2007
Office for National Statistics 66
Table 5.6 Views on whether or not living with a smoker increases a child's risk of certain medical conditions: by sex and by age, 2007
All persons aged 16 and over Whether increases Sex Age Total
risk Men Women 16-24 25-44 45-64 65 and over
Percentage saying living with a smoker increased the risk of the complaint Chest infections 90 92 90 92 90 92 91 Asthma 85 85 85 88 84 82 85 Other infections 68 65 70 72 63 59 66 Cot death 52 62 53 64 59 46 57 Ear infections 32 36 27 37 37 30 34 Diabetes 20 17 15 19 19 20 18 Percentage saying living with a smoker did not increase the risk of the complaint Chest infections 7 7 9 6 8 6 7 Asthma 11 12 13 8 13 13 12 Other infections 24 27 23 20 30 28 25 Cot death 32 27 37 24 28 34 29 Ear infections 48 48 60 44 46 50 48 Diabetes 61 66 71 64 64 57 64 Percentage who did not know whether living with a smoker increased the risk of the complaint or not Chest infections 3 1 1 2 2 3 2 Asthma 4 3 2 4 3 5 4 Other infections 8 9 7 8 7 13 8 Cot death 16 11 10 12 13 20 14 Ear infections 20 16 12 19 17 21 18 Diabetes 19 17 14 18 17 23 18 Unweighted base 1024 1251 179 753 779 564 2275 Weighted base (000s) * 22,215 23,924 6,656 15,751 14,719 9,012 46,138 * weighted to population totals

5: Awareness of health issues related to smoking
Smoking-related Behaviour and Attitudes, 2007
Office for National Statistics 67
Table 5.7 Views on whether or not living with a smoker increases a child's risk of certain medical conditions: by socio-economic classification and by presence of children under 16 in household, 2007
All persons aged 16 and over Whether increases Socio-economic classification Children No children Total1 risk Managerial and Intermediate Routine and under 16 in household professional occupations manual in household occupations occupations Percentage saying living with a smoker increased the risk of the complaint Chest infections 92 90 90 91 91 91 Asthma 87 85 83 87 84 85 Other infections 66 66 64 70 65 66 Cot death 59 56 56 74 51 57 Ear infections 36 36 34 41 32 34 Diabetes 18 18 19 19 18 18 Percentage saying living with a smoker did not increase the risk of the complaint Chest infections 6 8 8 8 7 7 Asthma 10 11 13 11 12 12 Other infections 26 25 28 24 26 25 Cot death 26 30 31 18 34 29 Ear infections 45 47 48 46 49 48 Diabetes 64 62 63 63 64 64 Percentage who did not know whether living with a smoker increased the risk of the complaint or not Chest infections 2 2 2 1 2 2 Asthma 3 4 4 2 4 4 Other infections 8 10 8 6 9 8 Cot death 16 13 13 8 16 14 Ear infections 19 17 18 13 19 18 Diabetes 18 20 18 18 18 18 Unweighted base 822 416 870 554 1721 2275 Weighted base (000s) *
16,245 8,249 16,581 13,045 33,093 46,138
* weighted to population totals ' Those who could not be classified (full-time students, those who had never worked or were long-term unemployed, and those whose occupation was not stated or inadequately described) are not shown as separate categories, but are included in the total.

5: Awareness of health issues related to smoking
Smoking-related Behaviour and Attitudes, 2007
Office for National Statistics 68
Table 5.8 Views on whether or not second-hand smoking increases a non-smoking adult's risk of certain medical conditions: 1996-2007
All persons aged 16 and over Condition 1996 1997 1999 2000 2001 2002 2003 2004 2005 2006 2007 * 2007 ** Lung cancer % % % % % % % % % % % % Increases risk 83 86 84 85 86 86 85 88 88 89 87 88 Does not increase risk 12 11 12 12 10 10 12 9 9 9 10 10 Can't say 5 4 4 3 4 4 2 3 3 2 3 3 Bronchitis Increases risk 84 86 84 86 85 85 85 86 87 88 85 85 Does not increase risk 12 10 12 11 11 11 13 11 9 10 12 12 Can't say 4 4 4 3 4 4 2 3 4 2 3 3 Asthma Increases risk 79 81 80 81 80 81 81 82 83 82 79 80 Does not increase risk 14 14 16 15 15 14 16 14 13 14 16 16 Can't say 6 6 4 4 5 5 3 4 4 3 4 4 Heart disease Increases risk 68 74 68 70 69 69 69 76 79 77 73 74 Does not increase risk 22 19 25 23 24 25 26 19 16 19 21 20 Can't say 10 7 7 7 7 7 6 5 6 4 6 6 Coughs and colds Increases risk 68 70 67 69 68 69 68 68 68 73 68 69 Does not increase risk 27 25 29 28 29 27 30 29 28 25 28 27 Can't say 5 5 4 4 3 4 2 3 4 2 4 4 Diabetes Increases risk 17 20 16 16 14 15 17 21 22 24 19 19 Does not increase risk 50 48 61 60 62 61 65 58 56 57 61 62 Can't say 33 32 24 24 24 23 19 21 21 19 20 19 Unweighted base 2275 Weighted base (000s) ** 46,138 Weighted base * 3696 3716 3546 3328 3493 3820 3517 3546 2403 2347 2273 1996-2006 percentages and bases weighted for unequal chance of selection * weighted for unequal chance of selection ** weighted to population totals

5: Awareness of health issues related to smoking
Smoking-related Behaviour and Attitudes, 2007
Office for National Statistics 69
Table 5.9 Views on whether or not second-hand smoking increases a non-smoking adult's risk of certain medical conditions: by smoking status, 2007
All persons aged 16 and over Whether increases Smoking status Total risk 20 or more Fewer than All Ex-regular Never
per day 20 per day current smokers smoked smokers regularly
Percentage saying second-hand smoking increased the risk of the complaint Lung cancer 62 79 75 86 94 88 Bronchitis 70 76 74 86 89 85 Asthma 62 70 68 77 86 80 Heart Disease 57 66 64 74 77 74 Coughs and colds 50 58 56 71 73 69 Diabetes 13 14 14 19 21 19 Percentage saying second-hand smoking did not increase the risk of the complaint Lung cancer 33 16 20 11 5 10 Bronchitis 25 17 19 12 9 12 Asthma 34 24 27 18 10 16 Heart Disease 39 24 27 20 18 20 Coughs and colds 46 35 38 25 24 27 Diabetes 76 66 69 59 59 62
Percentage who did not know whether second-hand smoking increased the risk of the complaint or not Lung cancer 5 5 5 3 2 3 Bronchitis 5 7 6 2 2 3 Asthma 4 6 6 5 4 4 Heart Disease 4 10 8 6 5 6 Coughs and colds 4 7 6 4 3 4 Diabetes 10 20 17 21 19 19 Unweighted base 135 383 520 627 1128 2275 Weighted base (000s) * 2,515 7,867 10,405 11,733 24,001 46,138
* weighted to population totals

5: Awareness of health issues related to smoking
Smoking-related Behaviour and Attitudes, 2007
Office for National Statistics 70
Table 5.10 Views on whether or not second-hand smoking increases a non-smoking adult's risk of certain medical conditions: by sex and by age, 2007
All persons aged 16 and over Whether increases Sex Age Total risk Men Women 16-24 25-44 45-64 65 and over Percentage saying second-hand smoking increased the risk of the complaint Lung cancer 89 87 91 90 86 84 88 Bronchitis 86 84 81 85 85 86 85 Asthma 80 79 82 81 77 79 80 Heart Disease 76 72 74 74 73 74 74 Coughs and colds 70 68 77 69 66 66 69 Diabetes 22 17 16 19 20 21 19 Percentage saying second-hand smoking did not increase the risk of the complaint Lung cancer 8 11 7 7 13 10 10 Bronchitis 10 13 15 11 12 11 12 Asthma 15 17 17 15 18 13 16 Heart Disease 18 23 18 21 21 20 20 Coughs and colds 25 30 21 27 30 28 27 Diabetes 58 64 70 62 63 53 62 Percentage who did not know whether second-hand smoking increased the risk of the complaint or
not Lung cancer 3 2 2 3 2 5 3 Bronchitis 4 3 4 4 3 3 3 Asthma 5 4 1 4 5 8 4 Heart Disease 7 6 8 5 6 7 6 Coughs and colds 5 3 2 4 4 6 4 Diabetes 20 19 14 19 18 26 19 Unweighted base 1024 1251 179 753 779 564 2275 Weighted base (000s) * 22,215 23,924 6,656 15,751 14,719 9,012 46,138 * weighted to population totals

5: Awareness of health issues related to smoking
Smoking-related Behaviour and Attitudes, 2007
Office for National Statistics 71
Table 5.11 Views on whether or not second-hand smoking increases a non-smoking adult's risk of certain medical conditions: by socio-economic classification and by presence of children under 16 in household, 2007
All persons aged 16 and over Whether increases Socio-economic classification Children No children Total1
risk Managerial and Intermediate Routine and under 16 in household professional occupations manual in household occupations occupations Percentage saying second-hand smoking increased the risk of the complaint Lung cancer 91 86 84 91 87 88 Bronchitis 88 86 82 87 84 85 Asthma 80 79 77 83 78 80 Heart Disease 73 72 73 78 72 74 Coughs and colds 67 66 69 71 68 69 Diabetes 17 17 22 20 19 19 Percentage saying second-hand smoking did not increase the risk of the complaint Lung cancer 7 11 13 9 10 10 Bronchitis 10 12 14 11 12 12 Asthma 16 16 18 15 17 16 Heart Disease 21 21 21 18 21 20 Coughs and colds 28 30 27 26 28 27 Diabetes 63 62 59 61 62 62 Percentage who did not know whether second-hand smoking increased the risk of the complaint or not Lung cancer 2 3 4 2 3 3 Bronchitis 3 2 4 2 4 3 Asthma 4 5 5 3 5 4 Heart Disease 6 7 5 4 7 6 Coughs and colds 5 4 4 3 4 4 Diabetes 20 21 18 19 19 19 Unweighted base 822 416 870 554 1721 2275 Weighted base (000s) * 16,245 8,249 16,581 13,045 33,093 46,138 * weighted to population totals ' Those who could not be classified (full-time students, those who had never worked or were long-term unemployed, and those whose occupation was not stated or inadequately described) are not shown as separate categories, but are included in the total.

6: Attitudes related to smoking
Smoking-related Behaviour and Attitudes, 2007
Office for National Statistics 72
6: Attitudes related to smoking
Smoking in the home In 2006, a new question asked respondents about the extent to which
smoking was allowed inside their home. They were asked to think about if
and where smoking was allowed (rather than who was allowed to smoke).
The question was repeated in 2007, and about two-thirds (67 per cent)
said that smoking was not allowed at all in their home, a statistically
significant increase since 2006 when 61 per cent of people said this. A fifth
(21 per cent) said it was allowed in some rooms or at some times and only
12 per cent said it was allowed everywhere.
People who smoked 20 or more cigarettes a day were the least likely to say
that smoking was not allowed at all – only 11 per cent of those who smoked
20 or more a day said so compared with 38 per cent of those who smoked
fewer than 20 cigarettes a day and 81 per cent of those who had never
smoked.
There were no statistically significant differences between men and
women, or between people in different age groups.
Tables 6.1 - 6.3
Respondents in routine and manual occupations were less likely than
others to report that they did not allow smoking anywhere (59 per cent
compared with 72 per cent of those in professional and managerial
occupations, and 70 per cent of those in intermediate occupational
groups). People who were living in a household with children were more
likely to say that they did not allow smoking anywhere (75 per cent did not
allow it compared with 64 per cent of those in all adult households).
Table 6.4
Those who were aware of the potential harm to children and non-smoking
adults of second-hand smoking were more likely than others to say that
smoking was not allowed at all in their home. For example, 72 per cent of
people who were aware of the effect of second-hand smoke on a child’s risk
of asthma did not allow smoking at all in their home compared with 36 per
cent of those who were not aware of the risk.
Tables 6.5 - 6.6
Non-smokers' attitudes towards people smoking near them Non-smokers (that is, both ex-smokers and those who had never smoked)
were asked if they would mind if other people smoked near them and 59
per cent of non-smokers said they would mind.
Using the old weighting scheme for comparison, the percentage in 2007
(60 per cent) was similar to the percentages since 2004 (60 per cent or
higher) and slightly higher than in years prior to this. Women non-
smokers were more likely than men non-smokers to mind people smoking
near them (64 per cent compared with 54 per cent respectively).

6: Attitudes related to smoking
Smoking-related Behaviour and Attitudes, 2007
Office for National Statistics 73
0
10
20
30
40
50
60
70
Unplea
sant
smell
Makes
clot
hes s
mell
Bad fo
r my h
ealth
Affects
brea
thing
/asthm
a
Gets in
my e
yes
Makes
me c
ough
Makes
me f
eel s
ick
Give m
e a he
adac
heOthe
r
Percentage
Respondents who had never smoked regularly were also more likely to
mind smokers smoking near them (65 per cent compared with 47 per cent
of ex-smokers).
The main reasons why non-smokers said they would mind if people
smoked near them were the smell of cigarette smoke (65 per cent), the
perceived health effects of second-hand smoking (56 per cent) and the
residual smell of smoke on clothing (51 per cent). A sizeable percentage of
non-smokers also mentioned that cigarette smoke affected their breathing
(28 per cent), got in their eyes (25 per cent) or made them cough (22 per
cent). The percentage of non-smokers who said they minded if smokers
smoked near them because it was bad for their health increased
significantly from 47 per cent in 2006 to 56 per cent in 2007.
Figure 6.1 and Tables 6.7 - 6.9
Figure 6.1 Non-smokers’ reasons for saying they would mind if smokers smoke near them: 2007

6: Attitudes related to smoking
Smoking-related Behaviour and Attitudes, 2007
Office for National Statistics 74
Non-smokers who were aware of the health effects of second-hand
smoking were also more likely to mind smokers smoking near them. For
example, 64 per cent of those who said that second-hand smoking would
increase the risk of asthma in a non-smoking adult would mind if someone
smoked near them compared with 32 per cent of those who were not
aware of the risk of asthma.
Table 6.10
Smokers’ behaviour in the presence of non-smokers Smokers were asked if they modified their smoking behaviour when in a
room with non-smoking adults or children.
The majority of smokers (81 per cent) said that they modified their
behaviour when in the presence of non-smoking adults: 48 per cent did
not smoke at all and 33 per cent smoked fewer cigarettes. This was similar
to previous years.
Although it appeared that people who smoked fewer than 20 cigarettes a
day were more likely to modify their behaviour in front of adults than
those who did not, the differences were not statistically significant.
Women were no more likely than men to modify their smoking behaviour
in the presence of non-smoking adults. Generally, respondents who knew
of the effects of second-hand smoking on adults and children were more
likely to change their smoking behaviour than smokers who were not
aware of the effects.
Smokers tended to impose stricter controls on their smoking in the
presence of children than in a room of adult non-smokers. In 2007,
• A greater percentage of smokers said that they would limit their
smoking in a room with children than said they would do so in the
presence of adult non-smokers (92 per cent compared with 81 per
cent)
• 79 per cent of smokers said they would not smoke at all if they
were in a room with children compared with 48 per cent who
would not smoke at all in a room with adult non-smokers
• 83 per cent of those who smoked fewer than 20 cigarettes a day
would not smoke at all in front of a child while only 50 per cent
would abstain in front of an adult non-smoker. The figures for
those who smoked 20 or more cigarettes a day were 67 per cent
and 45 per cent respectively.
The percentage of smokers who would not smoke at all in front of children
has increased over the survey years from 54 per cent in 1997 to 78 per cent
in 2007 (using old weighting scheme for comparability).
Smokers who were aware of the potential harm to children of second-hand
smoking were more likely than other smokers to say they did not smoke at
all when they were in a room with children. For example, 83 per cent of
smokers who were aware of the effect of second-hand smoke on a child’s
risk of asthma did not smoke at all in front of children compared with 68

6: Attitudes related to smoking
Smoking-related Behaviour and Attitudes, 2007
Office for National Statistics 75
0%
20%
40%
60%
80%
100%
20 cigarettesand over a
day
Fewer than20 cigarettes
a day
All smokers 20 cigarettesand over a
day
Fewer than20 cigarettes
a day
All smokers
Behaviour with ... Adult non-smokers Children
Perc
enta
ge Other (eg ask permission)Do not smoke at allSmoke fewer cigarettesSmoke the same number of cigarettes
per cent of those who were not aware of the risk.
Tables 6.11 - 6.14 and Figures 6.2 and 6.3
Figure 6.2 Smokers’ behaviour when they are with adult non-smokers and children: by number of cigarettes smoked a day, 2007

6: Attitudes related to smoking
Smoking-related Behaviour and Attitudes, 2007
Office for National Statistics 76
0
10
20
30
40
50
60
70
80
90
1997 1999 2000 2001 2002 2003 2004 2005 2006 2007
Year
Percentage
childrenadult non-smokers
Figure 6.3 Percentage of smokers’ who would not smoke at all when they are with adult non-smokers and children: 1997-2007
Smoking restrictions at work A comprehensive ban on smoking in all enclosed public places was
introduced from March 2006 in Scotland, April 2007 in Wales and from
July 2007 in England. Respondents were therefore asked a slightly
different question in 2007 about the smoking restrictions in their
workplace to that in previous years to reflect this change in legislation.
The 93 per cent of working respondents who worked with other people all
said that, in accordance with the smoke-free law, smoking was banned in
the building where they worked. One third of working respondents said
that smoking was not allowed in the grounds either.
Women were more likely than men9 to work at premises that banned
smoking in the grounds as well as in enclosed places in accordance with
the legislation. There were no statistically significant differences between
people in different socio-economic groups.
Tables 6.15-6.17
9 It should be noted that men are more likely than women to work in outdoor jobs (for example, construction or agriculture) where smoking restrictions are less appropriate.

6: Attitudes related to smoking
Smoking-related Behaviour and Attitudes, 2007
Office for National Statistics 77
Table 6.1 Extent to which smoking is allowed in peoples’ homes: by smoking status, 2006 and 2007
All persons aged 16 and over Extent to which smoking 2006 2007 * 2007 ** is allowed % % % Smoking is not allowed at all 61 67 67 Smoking is allowed in 26 21 21 some rooms or at some times Smoking is allowed anywhere 13 12 12 Unweighted base 2266 Weighted base (000s) ** 45,921 Weighted base * 2333 2261 2006 percentages and base weighted for unequal chance of selection * weighted for unequal chance of selection ** weighted to population totals
Table 6.2 Extent to which smoking is allowed in peoples’ homes: by smoking status, 2007
All persons aged 16 and over Extent to which smoking Smoking status Total is allowed 20 or more Fewer than All Ex- Never per day 20 per day current smokers smoked smokers regularly % % % % % % Smoking is not allowed at all 11 38 31 69 81 67 Smoking is allowed in 53 37 41 20 13 21 some rooms or at some times Smoking is allowed anywhere 36 25 28 11 6 12 Unweighted base 135 381 518 627 1121 2266 Weighted base (000s) * 2,515 7,836 10,374 11,720 23,827 45,921 * weighted to population totals

6: Attitudes related to smoking
Smoking-related Behaviour and Attitudes, 2007
Office for National Statistics 78
Table 6.3 Extent to which smoking is allowed in peoples’ homes: by sex and by age, 2007
All persons aged 16 and over Sex Age Total Extent to which smoking
is allowed Men Women 16-24 25-44 45-64 65 and over
% % % % % % % Smoking is not allowed at all 66 68 65 70 65 67 67 Smoking is allowed in some rooms or at some times
21 21 22 21 23 18 21
Smoking is allowed anywhere 13 11 13 10 13 15 12 Unweighted base 1021 1245 179 751 778 558 2266 Weighted base (000s) * 22,155 23,766 6,656 15,696 14,675 8,894 45,921 * weighted to population totals
Table 6.4 Extent to which smoking is allowed in peoples’ homes: by socio-economic classification and by presence of children under 16 in household, 2007
All persons aged 16 and over Socio-economic classification Children No children Total1
Managerial and Intermediate Routine and under 16 in household Extent to which smoking is allowed
professional occupations manual in household occupations occupations % % % % % % Smoking is not allowed at all 72 70 59 75 64 67 Smoking is allowed in some rooms or at some times
18 19 25 18 22 21
Smoking is allowed anywhere 9 10 16 7 14 12 Unweighted base 818 414 869 554 1712 2266 Weighted base (000s) * 16,149 8,193 16,569 13,045 32,875 45,921 * weighted to population totals ' Those who could not be classified (full-time students, those who had never worked or were long-term unemployed, and those whose occupation was not stated or inadequately described) are not shown as separate categories, but are included in the total.

6: Attitudes related to smoking
Smoking-related Behaviour and Attitudes, 2007
Office for National Statistics 79
Table 6.5 Extent to which smoking is allowed in peoples’ homes: by views on whether or not living with a smoker increases a child's risk of certain medical conditions, 2007
Table 6.6 Extent to which smoking is allowed in peoples’ homes: by views on whether or not second-hand smoking increases a non-smoking adult's risk of certain medical conditions, 2007
All persons aged 16 and over Second-hand smoking increases a non-smoking adult's risk of … Total + Extent to which
smoking is allowed
Lung cancer Bronchitis Asthma Heart disease Coughs and colds
Diabetes
Yes No Yes No Yes No Yes No Yes No Yes No
% % % % % % % % % % % % % Smoking is not allowed at all
71 32 71 43 73 41 72 51 71 57 74 63 67
Smoking is allowed in some rooms or at some times
19 39 20 29 18 34 18 30 19 26 16 24 21
Smoking is allowed anywhere
10 29 10 28 9 25 9 19 10 17 10 13 12
Unweighted base 1964 229 1927 260 1779 376 1652 471 1537 635 423 1391 2266 Weighted base (000s) * 40,182 4,459 38,898 5,453 36,452 7,413 33,748 9,364 31,532 12,540 8,779 28,103 45,921 * weighted to population totals + includes people who said they did not know if second-hand smoking increases the risk of having a certain condition.
All persons aged 16 and over Living with a smoker increases a child's risk of … Total + Extent to which
smoking is allowed
Chest infections Asthma Other infections Cot death Ear infections Diabetes
Yes No Yes No Yes No Yes No Yes No Yes No % % % % % % % % % % % % % Smoking is not allowed at all
70 40 72 36 73 51 74 54 76 60 73 64 67
Smoking is allowed in some rooms or at some times
20 34 18 38 18 29 17 29 17 25 17 23 21
Smoking is allowed anywhere
11 26 10 26 9 20 8 17 7 15 11 12 12
Unweighted base 2055 162 1912 266 1472 593 1273 665 775 1082 404 1430 2266 Weighted base (000s) *
41,774 3,238 39,034 5,289 30,356 11,683 26,258 13,353 15,794 22,052 8,441 28,986 45,921
* weighted to population totals + includes people who said they did not know if second-hand smoking increases the risk of having a certain condition.

6: Attitudes related to smoking
Smoking-related Behaviour and Attitudes, 2007
Office for National Statistics 80
Table 6.7 Non-smokers' attitude to people smoking near them: 1997-2007
Table 6.8 Non-smokers' attitude to people smoking near them: by sex and by smoking status, 2007
All non-smokers aged 16 and over Attitude 1997 1999 2000 2001 2002 2003 2004 2005 2006 2007 * 2007 **
% % % % % % % % % % % Would mind if people smoke near them 56 54 55 55 55 56 60 62 60 60 59 Would not mind 35 37 34 34 35 36 32 29 32 29 30 It depends 9 9 11 11 10 8 8 9 8 11 11 Unweighted base 1755 Weighted base (000s) ** 35,735 Weighted base * 2730 2609 2455 2645 2872 2667 2733 1830 1774 1776 1997-2006 percentages and bases weighted for unequal chance of selection * weighted for unequal chance of selection ** weighted to population totals
All non-smokers aged 16 and over Attitude Sex Smoking status Total Men Women Ex-
smokers Never
smoked
regularly % % % % % Would mind if people smoke near them
54 64 47 65 59
Would not mind 34 26 42 24 30 It depends 12 10 11 11 11 Unweighted base 771 984 629 1126 1755 Weighted base (000s) * 16,593 19,142 11,769 23,966 35,735 * weighted to population totals

6: Attitudes related to smoking
Smoking-related Behaviour and Attitudes, 2007
Office for National Statistics 81
Table 6.9 Non-smokers' reasons for saying that they would mind if smokers smoke near them: 1997-2007
Table 6.10 Non-smokers' attitude to people smoking near them: by views on whether or not second-hand smoking increases a non-smoking adult's risk of certain medical conditions, 2007
All non-smokers aged 16 and over Attitude Second-hand smoking increases a non-smoking adult's risk of: Total +
Lung cancer Bronchitis Asthma Heart disease Coughs and colds
Diabetes
Yes No Yes No Yes No Yes No Yes No Yes No % % % % % % % % % % % % %
Would mind if people smoke near them
62 18 62 31 64 32 64 43 63 48 64 56 59
Would not mind 26 72 26 57 25 57 26 44 25 41 28 32 30 It depends 12 9 11 12 11 11 10 14 12 11 8 12 11 Unweighted base 1596 118 1551 156 1450 228 1332 320 1253 437 353 1040 1755 Weighted base (000s) *
32,586 2,394 31,387 3,474 29,637 4,641 27,242 6,530 25,854 8,652 7,386 21,138 35,735
* weighted to population totals + includes people who said they did not know if second-hand smoking increases the risk of having a certain condition.
All non-smokers aged 16 and over who mind if smokers smoke near them Reason 1997 1999 2000 2001 2002 2003 2004 2005 2006 2007 * 2007 ** Health reasons Percentage giving the reason Bad for my health 45 46 51 43 43 40 45 46 47 56 56 Affects breathing/asthma 21 25 23 21 19 22 23 25 29 28 28 Makes me cough 17 21 23 17 15 14 17 18 23 23 22 Gets in my eyes 18 20 21 17 15 17 16 18 21 26 25 Makes me feel sick 9 8 9 9 8 10 9 10 11 14 13 Gives me a headache 4 6 7 4 4 5 6 7 9 11 11 Other reasons Unpleasant smell 61 62 65 61 64 64 61 64 66 66 65 Makes clothes smell 37 39 40 36 37 42 42 50 54 52 51 Other 19 13 15 17 13 10 10 13 10 8 8 Unweighted base 1054 Weighted base (000s) ** 21,065 Weighted base * 1529 1406 1352 1462 1581 1492 1643 1131 1063 1062 1997-2006 percentages and bases weighted for unequal chance of selection * weighted for unequal chance of selection ** weighted to population totals Percentages add up to more than 100% because some people gave more than one reason.

6: Attitudes related to smoking
Smoking-related Behaviour and Attitudes, 2007
Office for National Statistics 82
Table 6.11 Smokers' behaviour in a room with non-smokers: 1997-2007
All smokers aged 16 and over Behaviour in a room with:
1997 1999 2000 2001 2002 2003 2004 2005 2006 2007 * 2007 **
... adult non-smokers % % % % % % % % % % % Smoke the same number of cigarettes
12 12 11 12 11 14 14 14 18 13 14
Smoke fewer cigarettes 37 34 34 34 30 36 38 34 33 32 33 Do not smoke at all 45
82 49
83 50
85 48
82 52
82 46
82 45
83 47
81 44
78 49
81 48
81
Other (eg ask permission)
6 5 4 6 7 5 3 5 4 6 5
... children Smoke the same number of cigarettes
10 8 6 8 8 6 6 4 6 5 5
Smoke fewer cigarettes 32 30 25 26 21 24 25 21 23 14 13 Do not smoke at all 54
86 60
90 67
92 63
90 66
87 68
92 67
92 74
95 68
91 78
92 79
92
Other (eg ask permission)
3 2 2 3 5 3 2 1 2 3 3
Unweighted base 519 Weighted base (000s) **
10,397
Weighted base * 985 945 867 843 941 850 808 568 571 497 1997-2006 percentages and bases weighted for unequal chance of selection * weighted for unequal chance of selection ** weighted to population totals

6: Attitudes related to smoking
Smoking-related Behaviour and Attitudes, 2007
Office for National Statistics 83
Table 6.12 Smokers' behaviour in a room with non-smokers: by number of cigarettes smoked and by sex, 2007
Table 6.13 Smokers' behaviour in a room with non-smokers: by views on whether or not living with a smoker increases a child's risk of certain medical conditions, 2007
All smokers aged 16 and over Living with a smoker increases a child's risk of … Behaviour in a room
with: Chest infections
Asthma Other infections
Cot death Ear infections
Diabetes Total +
Yes No Yes No Yes No Yes No Yes No Yes No ... adult non-smokers % % % % % % % % % % % % % Smoke the same number of cigarettes
12 28 11 17 10 19 13 14 6 18 5 16 14
Smoke fewer cigarettes 33 36 33 35 34 30 30 38 28 31 27 32 33 Do not smoke at all 50 32 51 42 52 43 52 43 59 46 63 46 48 Other (eg ask permission)
5 5 5 6 4 8 5 5 6 5 5 5 5
... children Smoke the same number of cigarettes
4 12 3 10 2 8 2 8 1 6 - 5 5
Smoke fewer cigarettes 13 19 12 17 13 16 13 16 8 15 10 16 13 Do not smoke at all 80 66 83 68 83 72 83 73 88 77 88 76 79 Other (eg ask permission)
3 3 2 5 2 4 2 4 3 3 2 3 3
Unweighted base 441 60 375 113 279 192 241 196 139 300 68 358 519 Weighted base (000s) * 8,849 1,191 7,555 2,268 5,834 3,644 5,034 3,828 2,637 6,105 1,360 7,119 10,397 * weighted to population totals + includes people who said they did not know if second-hand smoking increases the risk of having a certain condition. Shaded figures indicate the estimates are unreliable and any analysis using these figures may be invalid. Any use of these shaded figures must be accompanied by this disclaimer.
All smokers aged 16 and over Behaviour in a room with: Number of cigarettes per
day Sex Total
20 or more
Fewer than 20
Men Women
... adult non-smokers % % % % % Smoke the same number of cigarettes 16 13 13 15 14 Smoke fewer cigarettes 30 34 31 35 33 Do not smoke at all 45 50 52 44 48 Other (eg ask permission) 8 4 4 6 5 ... children Smoke the same number of cigarettes 8 4 5 4 5 Smoke fewer cigarettes 19 12 11 16 13 Do not smoke at all 67 83 81 76 79 Other (eg ask permission) 6 2 3 3 3 Unweighted base 134 383 253 266 519 Weighted base (000s) * 2,507 7,812 5,569 4,773 10,397 * weighted to population totals

6: Attitudes related to smoking
Smoking-related Behaviour and Attitudes, 2007
Office for National Statistics 84
Table 6.14 Smokers' behaviour in a room with non-smokers: by views on whether or not second-hand smoking increases a non-smoking adult's risk of certain medical conditions, 2007
All smokers aged 16 and over Second-hand smoking increases a non-smoking adult's risk of … Behaviour in a room
with: Lung cancer Bronchitis Asthma Heart disease
Coughs and colds
Diabetes Total +
Yes No Yes No Yes No Yes No Yes No Yes No % % ... adult non-smokers % % % % % % % % % % % Smoke the same number of cigarettes
13 18 12 17 13 16 12 16 11 20 3 17 14
Smoke fewer cigarettes 33 32 32 35 31 37 32 35 33 34 30 32 33 Do not smoke at all 50 42 51 44 52 41 51 44 53 40 62 46 48 Other (eg ask permission)
4 9 5 4 4 7 5 6 4 6 4 5 5
... children Smoke the same number of cigarettes
4 9 3 7 2 11 3 8 2 7 - 5 5
Smoke fewer cigarettes 11 22 11 25 13 15 12 19 11 18 10 15 13 Do not smoke at all 82 67 83 65 82 70 82 71 84 71 86 77 79 Other (eg ask permission)
3 2 3 3 2 4 3 2 2 3 4 2 3
Unweighted base 378 112 387 104 338 149 329 152 292 200 71 358 519 Weighted base (000s) * 7,812 2,079 7,742 1,979 7,013 2,787 6,687 2,848 5,849 3,929 1,413 7,117 10,397 * weighted to population totals + includes people who said they did not know if second-hand smoking increases the risk of having a certain condition. Shaded figures indicate the estimates are unreliable and any analysis using these figures may be invalid. Any use of these shaded figures must be accompanied by this disclaimer.

6: Attitudes related to smoking
Smoking-related Behaviour and Attitudes, 2007
Office for National Statistics 85
Table 6.15 Restrictions on smoking where person currently works: : by smoking status, 2007
People aged 16 and over currently working Smoking status Total Level of restriction Current Ex- Never smokers smokers smoked regularly % % % % No smoking at all on the premises, 33 33 30 31 including the grounds No smoking in enclosed places in 60 60 63 62 accordance with the smoke-free law Don't work in a building with others 7 7 7 7 Unweighted base 303 307 672 1282 Weighted base (000s) * 6,738 6,226 14,967 27,930 * weighted to population totals
Table 6.16 Restrictions on smoking where person currently works: by sex, 2007
People aged 16 and over currently working Level of restriction Men Women Total % % % No smoking at all on the premises, 27 36 31 including the grounds No smoking in enclosed places in 64 59 62 accordance with the smoke-free law Don't work in a building with others 9 4 7 Unweighted base 636 646 1282 Weighted base (000s) * 15,124 12,806 27,930 * weighted to population totals

6: Attitudes related to smoking
Smoking-related Behaviour and Attitudes, 2007
Office for National Statistics 86
Table 6.17 Restrictions on smoking where person currently works: by socio-economic classification, 2007
People aged 16 and over currently working Level of restriction Socio-economic classification: Total1
Managerial and Intermediate Routine and professional occupations manual occupations occupations % % % % No smoking at all on the premises, including the grounds
35 23 32 31
No smoking in enclosed places in accordance with the smoke-free law
59 59 64 62
Don't work in a building with others
5 18 4 7
Unweighted base 579 253 415 1282 Weighted base (000s) * 12,224 5,338 9,272 27,930 * weighted to population totals ' Those who could not be classified (full-time students, those who had never worked or were long-term unemployed, and those whose occupation was not stated or inadequately described) are not shown as separate categories, but are included in the total.

7: Views about restrictions on smoking in public
Smoking-related Behaviour and Attitudes, 2007
Office for National Statistics 87
0
10
20
30
40
50
60
70
80
90
100
in pubs in indoor areas inrailway/bus stations
at work in indoor sportsand leisure centres
in restaurants in indoor shoppingcentres
in other publicplaces
Percentage
7: Views about restrictions on smoking in public
Views on smoking restrictions in public places As discussed in Chapter 1, new legislation has been introduced making
enclosed public places smoke-free from March 2006 in Scotland, from
April 2007 in Wales and from July 2007 in England. The questions from
previous years asking respondents whether they thought there should be
restrictions on smoking in certain places were therefore reworded to
reflect this change and the 2007 results are not comparable with those
from previous years.
In 2007, the vast majority of those interviewed agreed with the restrictions
on smoking at work (86 per cent), and the ban on smoking in restaurants
(94 per cent), in indoor shopping centres (92 per cent), in indoor sports
and leisure centres (95 per cent), in indoor areas at railway and bus
stations (85 per cent) and in other public places such as banks and post
offices (96 per cent). A smaller percentage of people, 75 per cent, agreed
with the ban on smoking in pubs.
Table 7.1 and Figure 7.1
Figure 7.1 Percentage of people agreeing with the ban on smoking in certain places: 2007

7: Views about restrictions on smoking in public
Smoking-related Behaviour and Attitudes, 2007
Office for National Statistics 88
Non-smokers were more likely to agree with the ban on smoking in certain
places than current smokers – for example, 94 per cent of those who had
never smoked and 87 per cent of ex-smokers were in favour of the smoking
restrictions at work compared with 65 per cent of current smokers. There
were no statistically significant differences between men and women.
The extent of the support for the smoking ban among different age groups
and socio-economic classes varied for the different locations, but generally
those in younger age groups, and those in routine and manual occupations
were less likely to be in favour of the new smoking ban at work, in pubs
and in indoor areas at railway/bus stations.
Tables 7.1 - 7.3
In order to gain a better picture of people's sensitivity to the risk of
second-hand smoke to children, respondents were asked whether they
agreed with smoking restrictions in places where there are, or are likely to
be, children under the age of 16.
Tables 7.4 to 7.6 show people’s views on smoking restrictions by whether
or not they are a parent of (or the partner of a parent of) a child under 16
in the household.
Overall, the vast majority (94 per cent) of people agreed with smoking
restrictions in places where there are, or are likely to be, children under
the age of 16. Parents (and their partners) were no more likely to agree
with these restrictions than non-parents (95 per cent and 94 per cent
respectively).
Among both parents and non-parents, non-smokers were more likely than
smokers to favour smoking restrictions where children were likely to be
present.
There were no statistically significant differences between men and
women, among different age groups or among different socio-economic
classes.
Tables 7.4 - 7.6
As well as asking respondents for their views on the smoking ban in
specific places, respondents were asked whether they agreed with the new
legislation banning smoking in enclosed public places. Overall, 80 per cent
of people said they agreed with the smoking ban – 61 per cent strongly
agreed and 19 per cent agreed. Fourteen per cent of people disagreed – 6
per cent disagreed strongly and 8 per cent disagreed. Those who had never
smoked were more likely to strongly agree with the smoking ban – 77 per
cent agreed strongly compared with 60 per cent of ex-smokers and only 25
per cent of current smokers.
Although men were as likely as women to agree with the legislation, they
were less likely to strongly agree with it (59 per cent of men and 64 per
cent of women strongly agreed with the legislation). There were no
statistically significant differences between those in different age groups.

7: Views about restrictions on smoking in public
Smoking-related Behaviour and Attitudes, 2007
Office for National Statistics 89
Those in routine and manual socio-economic groups were less likely to
agree strongly with the smoking ban (55 per cent compared with 66 per
cent of those in managerial and professional groups).
Tables 7.7 - 7.9
Respondents were asked how often they visited pubs before smoking was
banned in indoor areas. Again, the question has changed from previous
years to reflect the introduction of the new legislation and so it is not
possible to look at change over time. The tables exclude those respondents
who said they did not go to pubs.
About three-quarters (73 per cent) of respondents said they used to visit
pubs about as often as they did nowadays, 11 per cent said they went more
often before the smoking restrictions were in place and 16 per cent went
less often before. Those who smoked were particularly likely to say they
visited pubs more often before there was a smoking ban in place (21 per
cent said they did, compared with only 7 per cent of those who had never
smoked).
There were no differences between men and women or those in different
socio-economic groups. Those aged 25 to 44 were more likely than those in
the oldest age groups to say they went to pubs more often before the
smoking ban.
People with children in the household were not significantly more likely
than those in all adult households to say they went to the pub more or less
often before the smoking ban.
Tables 7.10 - 7.12
Taxation on tobacco People were asked how they thought tax increases directed at smokers
should relate to inflation. In 2007, half (51 per cent) said that tax on
tobacco should be increased by more than the rate of inflation. This is
similar to the percentages in previous survey years.
There was a wide disparity of views on taxation between smokers and non-
smokers; only 19 per cent of current smokers said that taxation should be
increased by more than the rate of inflation, compared with 64 per cent of
those who had never smoked. About three-fifths (58 per cent) of people
who smoked said that tobacco tax should not be increased at all, whereas
only 13 per cent of those who had never smoked took that view.
There were no marked differences in opinion according to sex or age.
Tables 7.13 - 7.15
Increase in legal age of purchase of tobacco The legal minimum age for the sale of tobacco was raised from 16 to 18 in
October 2007 and a question was asked seeking people's views on this
change in the legislation. The question was incorrectly worded as "The
Government have increased the legal age of purchasing tobacco from 16 to
18 in October 2007. How far do you agree or disagree with this change in

7: Views about restrictions on smoking in public
Smoking-related Behaviour and Attitudes, 2007
Office for National Statistics 90
legislation?" The tables and commentary therefore refer to the legal
minimum age for the purchase of tobacco rather than for the sale of
tobacco. It is unlikely that the incorrect question wording would effect
people's views on the legislation.
The vast majority (86 per cent) agreed with the change: 56 per cent agreed
strongly and 30 per cent agreed. Only 7 per cent disagreed with the new
law. Those who had never smoked and ex-smokers were more likely than
current smokers to agree with the increase in the minimum age of
purchase of tobacco (89 per cent and 86 per cent agreed respectively
compared with 77 per cent of current smokers).
There were no differences between men and women or those in different
socio-economic groups. Those aged 16-24 were less likely than those aged
25 and over to agree with the increase in the minimum age for purchase of
tobacco: 58 per cent of those aged 25 to 64 agreed strongly compared with
only 45 per cent of those aged 16 to 24. Although people with children
under 16 in the household were no more likely to generally agree with the
change in the minimum age for purchase of tobacco, they were more likely
than those in all adult households to agree strongly.
Tables 7.16 - 7.18

7: Views about restrictions on smoking in public
Smoking-related Behaviour and Attitudes, 2007
Office for National Statistics 91
Table 7.1 Agreement with smoking restrictions in certain places: by smoking status, 2007
All persons aged 16 and over Smoking status Total Agreement with 20 or more Fewer than All Ex- Never smoking ban … per day 20 per day current smokers smoked smokers regularly Percentage agreeing with smoking ban … ... at work 50 70 65 87 94 86 ... in restaurants 84 87 86 82 98 94 ... in pubs 31 50 46 76 87 75 … in indoor shopping centres 74 84 82 92 96 92 … in indoor sports and leisure centres 87 90 90 96 97 95 … in indoor areas in railway/bus stations 57 66 64 85 93 85 ... in other public places 87 93 92 96 97 96 Unweighted base 134 381 517 627 1124 2268 Weighted base (000s) * 2,507 7,828 10,359 11,752 23,920 46,030 * weighted to population totals
Table 7.2 Agreement with smoking restrictions in certain places: by sex and by age, 2007
All persons aged 16 and over Sex Age Total Agreement with Men Women 16-24 25-44 45-64 65 and smoking ban … over Percentage agreeing with smoking ban … ... at work 84 87 77 89 87 84 86 ... in restaurants 94 93 92 93 95 95 94 ... in pubs 73 76 70 74 77 77 75 … in indoor shopping centres 91 92 92 93 90 91 92 … in indoor sports and leisure centres 95 95 96 96 95 92 95 … in indoor areas in railway/bus stations 83 86 75 86 87 85 85 ... in other public places 96 96 95 97 96 94 96 Unweighted base 1024 1244 179 752 778 559 2268 Weighted base (000s) * 22,237 23,793 6,656 15,729 14,698 8,941 46,030 * weighted to population totals

7: Views about restrictions on smoking in public
Smoking-related Behaviour and Attitudes, 2007
Office for National Statistics 92
Table 7.3 Agreement with smoking restrictions in certain places: by socio-economic classification and by presence of children under 16 in household, 2007
All persons aged 16 and over Socio-economic classification: Children No children Total1
Managerial and Intermediate Routine and under 16 in household Agreement with professional occupations manual in household smoking ban … occupations occupations Percentage agreeing with smoking ban … ... at work 92 87 80 87 85 86 ... in restaurants 95 92 94 93 94 94 ... in pubs 80 75 69 78 73 75 … in indoor shopping centres
93 93 89 93 91 92
… in indoor sports and leisure centres
97 94 94 96 95 95
… in indoor areas in railway/bus stations
88 85 82 87 84 85
... in other public places 98 95 94 96 95 96 Unweighted base 822 414 866 554 1714 2268 Weighted base (000s) * 16,261 8,215 16,529 13,045 32,985 46,030 * weighted to population totals ' Those who could not be classified (full-time students, those who had never worked or were long-term unemployed, and those whose occupation was not stated or inadequately described) are not shown as separate categories, but are included in the total.

7: Views about restrictions on smoking in public
Smoking-related Behaviour and Attitudes, 2007
Office for National Statistics 93
Table 7.4 Agreement with smoking restrictions in places where there are, or likely to be, children: by parental status and smoking status, 2007
All persons aged 16 and over Smoking status Total Whether a parent 20 or more Fewer than All Ex- Never (or partner of a parent) of child aged per day 20 per day current smokers smoked 0-15 in household smokers regularly Percentage agreeing with smoking restrictions in places where there are children Parent/partner of parent [20] 90 86 98 98 95 Not parent/partner of parent 89 89 88 92 96 94 All 84 89 88 93 97 94 Unweighted base Parent/partner of parent 28 100 129 105 267 501 Not parent/partner of parent 106 282 389 523 858 1770 All 134 382 518 628 1125 2271 Weighted base (000s) * Parent/partner of parent 620 2,057 2,690 2,299 5,934 10,923 Not parent/partner of parent 1,887 5,795 7,692 9,457 18,000 35,149 All 2,507 7,852 10,382 11,755 23,934 46,071 * weighted to population totals

7: Views about restrictions on smoking in public
Smoking-related Behaviour and Attitudes, 2007
Office for National Statistics 94
Table 7.5 Agreement with smoking restrictions in places where there are, or likely to be, children: by parental status, by sex and by age, 2007
All persons aged 16 and over Whether a parent Sex Age Total (or partner of a parent) of child aged Men Women 16-24 25-44 45-64 65 and 0-15 in household over Percentage agreeing with smoking restrictions in places where there are children Parent/partner of parent 95 95 [30] 96 93 .. 95 Not parent/partner of parent 93 94 93 95 94 93 94 All 93 95 92 95 94 93 94 Unweighted base Parent/partner of parent 192 309 33 363 104 1 501 Not parent/partner of parent 831 939 145 388 675 562 1770 All 1023 1248 178 751 779 563 2271 Weighted base (000s) * Parent/partner of parent 4,966 5,956 706 7,632 2,559 25 10,923 Not parent/partner of parent 17,241 17,907 5,935 8,075 12,160 8,978 35,149 All 22,208 23,864 6,641 15,708 14,719 9,004 46,071 * weighted to population totals

7: Views about restrictions on smoking in public
Smoking-related Behaviour and Attitudes, 2007
Office for National Statistics 95
Table 7.6 Agreement with smoking restrictions in places where there are, or likely to be, children: by parental status and socio-economic classification, 2007
All persons aged 16 and over Socio-economic classification: Total1
Whether a parent (or Managerial and Intermediate Routine and partner of a parent) child aged professional occupations manual of 0-15 in household occupations occupations Percentage agreeing with smoking restrictions in places where there are children Parent/partner of parent 97 94 94 95 Not parent/partner of parent 93 94 93 94 All 94 94 94 94 Unweighted base Parent/partner of parent 199 87 175 501 Not parent/partner of parent 623 330 692 1770 All 822 417 867 2271 Weighted base (000s) * Parent/partner of parent 4,584 1,784 3,702 10,923 Not parent/partner of parent 11,677 6,478 12,837 35,149 All 16,261 8,262 16,538 46,071 * weighted to population totals ' Those who could not be classified (full-time students, those who had never worked or were long-term unemployed, and those whose occupation was not stated or inadequately described) are not shown as separate categories, but are included in the total. Shaded figures indicate the estimates are unreliable and any analysis using these figures may be invalid. Any use of these shaded figures must be accompanied by this disclaimer.

7: Views about restrictions on smoking in public
Smoking-related Behaviour and Attitudes, 2007
Office for National Statistics 96
Table 7.7 Agreement with new legislation on smoking restrictions in public places: by smoking status, 2007
All persons aged 16 and over Smoking status Total Views on legislation which made 20 or more Fewer than All Ex- Never all enclosed public places per day 20 per day current smokers smoked and workplaces smoke-free smokers regularly % % % % % % Strongly agree 15 28 25 60 77 61 Agree 24 32 30 18 14 19 Neither agree nor disagree 12 11 12 8 4 6 Disagree 20 14 15 8 4 8 Strongly disagree 29 15 18 5 1 6 Unweighted base 134 381 517 629 1126 2272 Weighted base (000s) * 2,507 7,823 10,353 11,769 23,955 46,077 * weighted to population totals
Table 7.8 Agreement with new legislation on smoking restrictions in public places: by sex and by age, 2007
All persons aged 16 and over Views on legislation which made Sex Age Total all enclosed public places Men Women 16-24 25-44 45-64 65 and and workplaces smoke-free over % % % % % % % Strongly agree 59 64 56 64 62 60 61 Agree 20 17 20 17 18 21 19 Neither agree nor disagree 6 7 9 6 5 8 6 Disagree 8 7 10 7 7 7 8 Strongly disagree 7 6 6 6 7 4 6 Unweighted base 1024 1248 178 752 779 563 2272 Weighted base (000s) * 22,212 23,865 6,625 15,729 14,719 9,005 46,077 * weighted to population totals

7: Views about restrictions on smoking in public
Smoking-related Behaviour and Attitudes, 2007
Office for National Statistics 97
Table 7.9 Agreement with new legislation on smoking restrictions in public places: by socio-economic classification and by presence of children under 16 in household, 2007
All persons aged 16 and over Socio-economic classification: Children
under 16 in household
No children
in household
Total1 Views on legislation which made all enclosed public places and workplaces smoke-free
Managerial and professional occupations
Intermediate occupations
Routine and manual
occupations
% % % % % % Strongly agree 66 61 55 64 60 61 Agree 18 18 20 19 19 19 Neither agree nor disagree 5 8 8 5 7 6 Disagree 6 7 9 7 8 8 Strongly disagree 5 5 8 6 6 6 Unweighted base 822 416 868 553 1719 2272 Weighted base (000s) * 16,261 8,230 16,561 13,014 33,063 46,077 * weighted to population totals ' Those who could not be classified (full-time students, those who had never worked or were long-term unemployed, and those whose occupation was not stated or inadequately described) are not shown as separate categories, but are included in the total.

7: Views about restrictions on smoking in public
Smoking-related Behaviour and Attitudes, 2007
Office for National Statistics 98
Table 7.10 Changes in visiting pubs since smoking restrictions introduced: by smoking status, 2007
Those aged 16 and over who go to pubs Current Ex- Never Total
smokers smokers smoked How often did you visit pubs before had smoking restrictions
regularly % % % % More often than nowadays 21 9 7 11 About the same as nowadays 63 80 75 73 Less often than nowadays 16 11 18 16 Unweighted base 402 481 867 1750 Weighted base (000s) * 8,320 9,160 18,630 36,110 * weighted to population totals
Table 7.11 Changes in visiting pubs since smoking restrictions introduced: by sex and by age, 2007
Those aged 16 and over who go to pubs How often did you visit pubs Sex Age Total before had smoking restrictions Men Women 16-24 25-44 45-64 65 and over % % % % % % % More often than nowadays 10 11 9 13 11 7 11 About the same as nowadays 74 72 70 73 73 78 73 Less often than nowadays 15 17 21 14 16 15 16 Unweighted base 857 893 148 644 642 316 1750 Weighted base (000s) * 18,833 17,277 5,436 13,448 12,112 5,113 36,110 * weighted to population totals

7: Views about restrictions on smoking in public
Smoking-related Behaviour and Attitudes, 2007
Office for National Statistics 99
Table 7.12 Changes in visiting pubs since smoking restrictions introduced: by socio-economic classification and by presence of children under 16 in household, 2007
Those aged 16 and over who go to pubs Socio-economic classification: How often did you visit
pubs before had smoking restrictions
Managerial and
professional occupations
Intermediate occupations
Routine and manual
occupations
Children under 16 in household
No children in
household
Total1
% % % % % % More often than nowadays 10 10 12 10 11 11 About the same as nowadays 73 77 73 73 74 73 Less often than nowadays 17 13 15 17 16 16 Unweighted base 698 324 612 440 1310 1750 Weighted base (000s) * 13,924 6,523 12,114 10,136 25,974 36,110 * weighted to population totals ' Those who could not be classified (full-time students, those who had never worked or were long-term unemployed, and those whose occupation was not stated or inadequately described) are not shown as separate categories, but are included in the total.
Table 7.13 Views on acceptable amount of tax increase: 1996-2007
All persons aged 16 and over Acceptable amount of increase
1996 1997 1999 2000 2001 2002 2003 2004 2005 2006 2007 * 2007 **
% % % % % % % % % % % %
A lot more than inflation 36 35 34 32 30 31 32 33 34 32 34 34 Just above inflation 16 18 14 14 17 16 18 18 17 18 17 17 In line with inflation 28 28 24 27 26 26 25 24 24 21 23 23 None at all 21 20 28 27 27 27 26 26 26 29 25 26 Unweighted base 2239 Weighted base (000s) ** 45,529 Weighted base * 3611 3626 3450 3221 3385 3703 3440 3426 2346 2277 2240 1996-2006 percentages and bases weighted for unequal chance of selection * weighted for unequal chance of selection ** weighted to population totals

7: Views about restrictions on smoking in public
Smoking-related Behaviour and Attitudes, 2007
Office for National Statistics 100
Table 7.14 Views on acceptable amount of tax increase: by smoking status, 2007
All persons aged 16 and over Acceptable amount of increase Smoking status Total
20 or more Fewer than All Ex- Never per day 20 per day current smokers smoked smokers regularly
% % % % % % A lot more than inflation 6 13 12 33 44 34 Just above inflation 9 6 7 20 20 17 In line with inflation 27 22 23 24 22 23 None at all 58 58 58 24 13 26 Unweighted base 132 380 514 617 1108 2239 Weighted base (000s) * 2,484 7,829 10,336 11,573 23,621 45,529 * weighted to population totals
Table 7.15 Views on acceptable amount of tax increase: by sex and by age, 2007
All persons aged 16 and over Sex Age Total Acceptable amount of
increase Men Women 16-24 25-44 45-64 65 and over
% % % % % % % A lot more than inflation 33 34 30 36 35 31 34 Just above inflation 18 16 18 18 17 15 17 In line with inflation 22 24 16 23 24 25 23 None at all 27 25 35 23 24 28 26 Unweighted base 1014 1225 179 742 770 548 2239 Weighted base (000s) * 22,072 23,458 6,656 15,552 14,589 8,732 45,529 * weighted to population totals

7: Views about restrictions on smoking in public
Smoking-related Behaviour and Attitudes, 2007
Office for National Statistics 101
Table 7.16 Views on government legislation increasing legal age of purchase of tobacco: by smoking status, 2007
All persons aged 16 and over Agreement with government Smoking status Total legislation increasing legal Current Ex- Never age of purchase of tobacco smokers smokers smoked
regularly % % % % Strongly agree 42 52 64 56 Agree 35 34 25 30 Neither agree nor disagree 11 7 7 8 Disagree 8 5 3 5 Strongly disagree 4 2 1 2 Unweighted base 515 626 1121 2262 Weighted base (000s) * 10,332 11,721 23,862 45,915 * weighted to population totals
Table 7.17 Views on government legislation increasing legal age of purchase of tobacco: by sex and by age, 2007
All persons aged 16 and over Sex Age Total
Men Women 16-24 25-44 45-64 65 and over
Agreement with government legislation increasing legal age of purchase of tobacco
% % % % % % Strongly agree 54 57 45 58 58 57 56 Agree 31 28 31 29 28 33 30 Neither agree nor disagree 8 8 15 7 7 6 8 Disagree 4 5 5 4 5 3 5 Strongly disagree 2 2 4 1 2 1 2 Unweighted base 1018 1244 178 746 775 563 2262 Weighted base (000s) * 22,068 23,847 6,602 15,648 14,636 9,029 45,915 * weighted to population totals

7: Views about restrictions on smoking in public
Smoking-related Behaviour and Attitudes, 2007
Office for National Statistics 102
Table 7.18 Views on government legislation increasing legal age of purchase of tobacco: by socio-economic classification, 2007
All persons aged 16 and over
Socio-economic classification: Children No children Total1
under 16 in household Agreement with government legislation increasing legal age of purchase of tobacco
Managerial and professional occupations
Intermediate occupations
Routine and manual
occupations in household
% % % % % % Strongly agree 57 57 54 60 54 56 Agree 29 31 31 28 31 30 Neither agree nor disagree 8 8 9 6 9 8 Disagree 4 4 5 4 5 5 Strongly disagree 1 0 2 2 2 2 Unweighted base 817 414 865 552 1710 2262 Weighted base (000s) * 16,144 8,226 16,497 12,989 32,926 45,915 * weighted to population totals ' Those who could not be classified (full-time students, those who had never worked or were long-term unemployed, and those whose occupation was not stated or inadequately described) are not shown as separate categories, but are included in the total.

Smoking-related Behaviour and Attitudes, 2007
Office for National Statistics 103
Appendix A: The NS Omnibus Survey
The Omnibus Survey is a multi-purpose survey carried out by the Office
for National Statistics for use by government departments and other
public or non-profit making bodies. Interviewing is carried out every
month10 and each month’s questionnaire covers a variety of topics,
reflecting different users’ requirements.
The sample Interviews are conducted with approximately 1,200 adults (aged 16 or
over) in private households in Great Britain each month. The Omnibus
Survey uses the Postcode Address File of small users as its sampling
frame; all private household addresses in Great Britain are included in this
frame. A new sample of 67 postal sectors is selected for each month and is
stratified by: region; the proportion of households where the household
reference person is in the National Statistics Socio-economic Classification
(NS-SEC) categories 1 to 3 (i.e. employers in large organisations; higher
managerial occupations; and higher professional employees/self-
employed); and the proportion of people who are aged over 65. The postal
sectors are selected with probability proportionate to size and, within each
sector, 30 addresses (delivery points) are selected randomly.
If an address contains more than one household, the interviewer uses a
standard ONS procedure to randomly select where to interview – this may
be at one or more households11. In households with more than one adult
member, just one person aged 16 or over is selected for interview with the
use of a Kish grid. Proxy interviews are not taken.
Weighting Because only one household member is interviewed at each address,
people in households containing few adults have a higher probability of
selection than those in households with many. Where the unit of analysis
is individual adults, as it is for this module, a weighting factor is applied to
correct for this unequal probability of selection.
The weighting system used for 2007 figures in this report also adjusts for
some non-response bias by calibrating the Omnibus sample to ONS
population totals. Despite the considerable efforts made by interviewers to
maximize response rates, approximately 30% of selected individuals
10 The Omnibus survey was previously conducted in eight months of the year, with a larger monthly set sample size of 3,000 addresses, and an achieved monthly sample of about 1,800 interviews. 11 The procedure for dealing with multi-household addresses was changed in 2005 to reduce bias caused by the under-representation of multi-household addresses and is now an ONS standard method.

Smoking-related Behaviour and Attitudes, 2007
Office for National Statistics 104
decline to take part or cannot be contacted. Differential non-response
among key subgroups in the population is especially problematic because
it can result in biased estimates being produced.
The weighting ensures that the weighted sample distribution across
regions and across age-sex groups matches that in the population.
Consequently, respondents belonging to sub-groups that are prone to high
levels of non-response are assigned higher weights. For example, young
males living in London have a lower response rate and are therefore
assigned higher weights than are males living in other regions.
Grossing up the data by age and sex and by region to ONS population
totals will reduce the standard errors of survey estimates if the survey
variable is correlated with age, sex and region.
Fieldwork Interviews are carried out in respondent’s homes by interviewers who have
been trained to carry out a range of ONS surveys. Advance letters are sent
to all addresses giving a brief explanation of the survey. Interviewers must
make at least three calls at an address at different times of the day and
week to establish contact.
As with all ONS surveys, a quality check on fieldwork is carried out by re-
interviewing a proportion of respondents.
The smoking module was included in the October and November Omnibus
months.
Questions The module of questions (which are shown in Appendix B) was developed
in conjunction with the Department of Health and the NHS Information
Centre for health and social care.
Response rates The small users’ Postcode Address File includes some business addresses
and other addresses, such as new and empty properties, at which no
private households are living. The expected proportion of such addresses,
which are classified as ineligible, is about 9-10 per cent. They are
eliminated from the set sample before the response rate is calculated.

Smoking-related Behaviour and Attitudes, 2007
Office for National Statistics 105
The response rate for the October and November 2007 Omnibus surveys
was 62 per cent, as shown below:
† Unknown eligibility also includes a proportion of unallocated cases.
†† Ineligible addresses also include a proportion of unallocated cases
Set sample of addresses 4,020 100%
††Ineligible addresses 350 9%
Eligible addresses 3,670 91%
Eligible Households 3,692 100%
No interview – refusal 1,030 28%
† Unknown eligibility 21 1%
No interview – non-contact 351 10%
Interviews 2,290 62%

Smoking-related Behaviour and Attitudes, 2007
Office for National Statistics 106
Appendix B: The Questions
MODDOC.QInter.M130
October 2007
ASK ALWAYS:
Intro Now I'd like to ask you some questions about a completely different subject.
(1) Press <1> to Continue
ASK ALWAYS:
M130_1 SHOWCARD X1 This next question asks you about causes of death. Which of these do you think causes the most deaths before the age of 65 in the UK each year?
(1) Road accidents (2) Accidents at work (3) AIDS (4) Smoking (5) Murder and manslaughter (6) Illicit drugs (7) Alcohol misuse
ASK ALWAYS:
M130_2 I'm now going to ask you some questions about smoking. Do you smoke cigarettes at all nowadays?
(1) Yes (2) No
ASK IF: smoker nowadays
M130_3 How many cigarettes a day do you usually smoke at weekends?
0..200
ASK IF: smoker nowadays
M130_4 How many cigarettes a day do you usually smoke on weekdays?
0..200

Smoking-related Behaviour and Attitudes, 2007
Office for National Statistics 107
ASK IF: smoker nowadays
M130_5 Do you usually smoke packeted cigarettes, hand-rolled cigarettes or both? Interviewer: If respondent says both - prompt 'Is that mainly packeted or mainly hand-rolled cigarettes?'
(1) Packeted (2) Hand-rolled (3) Both packeted and hand-rolled, but mainly packeted (4) Both packeted and hand-rolled, but mainly hand-rolled
ASK IF: not smoker nowadays
M130_6 Have you ever smoked cigarettes regularly?
(1) Yes (2) No
ASK IF: not smoker nowadays AND: ever smoked regularly
M130_7 About how many cigarettes a day did you smoke when you smoked regularly?
0..200
ASK ALWAYS:
M130_8 Do you smoke at least one cigar of any kind per month nowadays?
(1) Yes (2) No
ASK IF: Ask men only
M130_9 Do you smoke a pipe at all nowadays?
(1) Yes (2) No
ASK IF: smokes cigarettes nowadays
M130_10 How soon after waking do you smoke your first cigarette of the day?
(1) Less than 5 minutes (2) 5-14 minutes (3) 15-29 minutes (4) 30 mins but less than 1 hour (5) 1 hour but less than 2 hours (6) 2 hours or more

Smoking-related Behaviour and Attitudes, 2007
Office for National Statistics 108
ASK IF: smokes nowadays - cigarettes, cigars, or pipe
M130_11 Would you like to give up smoking?
(1) Yes (2) No
ASK IF: smokes nowadays - cigarettes, cigars, or pipe AND: like to give up
M130_12 How much would you like to give up smoking, ... Interviewer: Running Prompt
(1) A little, (2) a fair amount, (3) quite a lot, (4) or very much indeed?
ASK IF: smokes nowadays - cigarettes, cigars, or pipe AND: like to give up
M130_13 SHOWCARD X13 What are your main reasons for wanting to give up?
SET [3] OF (1) Because of a health problem I have at present (2) Better for my health in general (3) Less risk of getting smoking related illnesses (4) Doctor said I should stop (5) Ban on smoking in enclosed public places (6) Family/friends wanted me to stop (7) Financial reasons (can't afford it) (8) Pregnancy (9) Worried about the effect on my children (10) Other (Specify)
ASK IF: smokes nowadays - cigarettes, cigars, or pipe AND: like to give up AND: q13oth IN M130_13
Spec13 Please specify other reasons
STRING[200]

Smoking-related Behaviour and Attitudes, 2007
Office for National Statistics 109
ASK IF: smokes nowadays - cigarettes, cigars, or pipe
M130_14 Which of the following statements best describes you.... Interviewer: Running Prompt
(1) I intend to give up smoking within the next month, (2) I intend to give up smoking within the next 6 months, (3) I intend to give up smoking within the next year, (4) I intend to give up smoking, but not in the next year, (5) I have no intention of giving up smoking?
ASK IF: smokes nowadays - cigarettes, cigars, or pipe
M130_14a Have you ever tried to give up?
(1) Yes (2) No
ASK IF: smokes nowadays - cigarettes, cigars, or pipe AND: Has tried to give up
M130_15 Have you made a serious attempt to give up smoking in the last five years, that is since ^QSetUP.THISMTH ^QSetUP.YEAR5?
(1) Yes (2) No
ASK IF: smokes nowadays - cigarettes, cigars, or pipe AND: Has tried to give up AND: Serious attempt to give up in last 5 years
M130_15a Have you tried to give up in the last 12 months?
(1) Yes (2) No
ASK IF: smokes nowadays - cigarettes, cigars, or pipe AND: Has tried to give up AND: Serious attempt to give up in last 5 years AND: Tried to give up in last year
M130_15b How many times have you tried to give up smoking in the last year?
1..50

Smoking-related Behaviour and Attitudes, 2007
Office for National Statistics 110
ASK IF: smokes nowadays - cigarettes, cigars, or pipe AND: Has tried to give up
M130_15c Thinking about the last time you attempted to give up, how long did this attempt last? Please record whether years, months or weeks and actually how long at next question If less than a week record as zero weeks
(1) years (2) months (3) weeks
ASK IF: smokes nowadays - cigarettes, cigars, or pipe AND: Has tried to give up
INT15 How many ^M130_15c was this? Ask or code the number here If less than a week record as zero weeks
0..99
ASK IF: smokes nowadays - cigarettes, cigars, or pipe
M130_15d May I just check, have you succeeded in stopping smoking for more than a day in the last 12 months?
(1) Yes (2) No
ASK IF: (M130_2 = Yes) AND (M130_15d = Yes)
M130_15eM Why did you start smoking again after the last time you tried to give up? Please give your main reasons. Interviewer: Code all that apply
SET [8] OF (1) My spouse/partner smokes (2) My friends smoke (3) Life too stressful/just not a good time (4) Couldn't cope with the cravings (5) Missed the habit/something to do with my hands (6) Put on weight (7) I like smoking (8) Other (Specify)

Smoking-related Behaviour and Attitudes, 2007
Office for National Statistics 111
ASK IF: (M130_2 = Yes) AND (M130_15d = Yes) AND: Other IN M130_15eM
SPEC15eM Record other reason
STRING[255]
ASK IF: ((M130_2 = Yes) AND (M130_11 = Yes)) AND (M130_15d = No)
M130_15fM Why do you think you haven't succeeded in stopping smoking or why haven't you tried to give up in the last 12 months? Interviewer: Code all that apply
SET [9] OF (1) My spouse/partner smokes (2) My friends smoke (3) Life too stressful/just not a good time (4) Couldn't cope with the cravings (5) Would miss the habit/something to do with my hands (6) Worried about putting on weight (7) I like smoking too much (8) Lack of commitment to quitting (9) Other (Specify)
ASK IF: ((M130_2 = Yes) AND (M130_11 = Yes)) AND (M130_15d = No) AND: Other IN M130_15fM
SPEC15f Record other reason
STRING[255]
ASK IF: has given up smoking
M130_18 How long ago is it since you stopped smoking cigarettes? Interviewer: Please record whether years, months or weeks and actually how long at next question If less than a week record as zero weeks
(1) years (2) months (3) weeks
ASK IF: has given up smoking
INT18 How many ^M130_18 ago was this? Ask or code the number here
0..99

Smoking-related Behaviour and Attitudes, 2007
Office for National Statistics 112
ASK IF: has given up smoking
M130_21 SHOWCARD X13 What were your main reasons for wanting to give up smoking cigarettes?
SET [3] OF (1) Because of a health problem I have at present (2) Better for my health in general (3) Less risk of getting smoking related illnesses (4) Doctor said I should stop (5) Ban on smoking in enclosed public places (6) Family/friends wanted me to stop (7) Financial reasons (can't afford it) (8) Pregnancy (9) Worried about the effect on my children (10) Other (Specify)
ASK IF: has given up smoking AND: q13oth IN M130_21
Spec21 Please specify other reasons
STRING[200]
ASK ALWAYS:
m130_21a A year from now, how likely do you think it is that you will be smoking?
(1) Definitely will be smoking (2) Probably will be smoking (3) Might or might not be smoking (4) Probably will not be smoking (5) Definitely will not be smoking
ASK IF: smokes now or if gave up less than 5 years ago
M130_22a In the last 5 years, have you been given advice on smoking by your GP?
(1) Yes (2) No
ASK IF: smokes now or if gave up less than 5 years ago
M130_22b In the last 5 years, have you been given advice on smoking by someone else who works at the surgery or health centre?
(1) Yes (2) No

Smoking-related Behaviour and Attitudes, 2007
Office for National Statistics 113
ASK IF: smokes now or if gave up less than 5 years ago
M130_22c In the last 5 years, have you been given advice on smoking by a pharmacist?
(1) Yes (2) No
ASK IF: smokes now or if gave up less than 5 years ago
M130_22e In the last 5 years, have you been given advice on smoking by a consultant or a hospital doctor?
(1) Yes (2) No
ASK IF: smokes now or if gave up less than 5 years ago
M130_22d In the last 5 years, have you been given advice on smoking by any other health professional?
(1) Yes (2) No
ASK IF: smokes now or if gave up less than 5 years ago AND: M130_22d = Yes
SPEC22d Please specify who the other medical person was
STRING[200]
ASK IF: smokes now or if gave up less than 5 years ago AND: any advice given by GP or any other relevant person
M130_23 And may I just check, was the advice you received part of general health advice or was it connected with a particular health problem you were concerned about?
(1) General advice (2) Particular health problem (3) Both
ASK IF: smokes now or if gave up less than 5 years ago AND: any advice given by GP or any other relevant person
M130_24 (On any of these occasions) Did you have a discussion about giving up smoking, or were you just given something to take away and read? Interviewer: If both code 1 for discussion
(1) Discussion (2) Literature only

Smoking-related Behaviour and Attitudes, 2007
Office for National Statistics 114
ASK IF: smokes now or if gave up less than 5 years ago AND: any advice given by GP or any other relevant person
M130_25 Did you find the advice helpful?
(1) Yes (2) No
ASK IF: smokes now or gave up in last year
M130_25a Have you in the past year done any of the following.... Rung the NHS Smoking Helpline, Quitline, or an alternative?
(1) Yes (2) No
ASK IF: smokes now or gave up in last year
M130_25b (Have you in the past year....) Asked the doctor or other health professionals for help to quit?
(1) Yes (2) No
ASK IF: smokes now or gave up in last year
M130_25c (Have you in the past year ....) Been referred/self referred to a stop smoking group/clinic/ service?
(1) Yes (2) No
ASK IF: smokes now or gave up in last year
M130_25M SHOWCARD X25 (Have you in the past year.....) Had any Nicotine Replacement Therapy (NRT), such as gums, patches, inhalator, or other drugs designed to help people quit smoking? Please choose your answers from the card. Interviewer: Code all that apply
SET [5] OF (1) I have been prescribed Nicotine Replacement Therapy (NRT) and my prescription was free (2) I have been prescribed Nicotine Replacement Therapy (NRT) and paid for my prescription (including by pre-payment certificate) (3) I have been given free Nicotine Replacement Therapy (NRT) (i.e. from an NHS smoking cessation

Smoking-related Behaviour and Attitudes, 2007
Office for National Statistics 115
clinic), without a prescription (4) I have bought Nicotine Replacement Therapy (NRT) over the counter, without a prescription (5) I have been prescribed other drugs to help me stop smoking, with or without NRT(please specify) (6) I have not had any NRT, or other prescribed drugs, to help me stop smoking
ASK IF: smokes now or gave up in last year AND: OthDrug IN M130_25M
Spec25M Please specify 'Other prescribed drugs'
STRING[200]
ASK IF: smokes now or gave up in last year
M130_25f (Have you in the past year ....) Read any leaflets/booklets on how to stop smoking?
(1) Yes (2) No
ASK IF: Smokes nowadays
M130_25g During the last year has anybody been trying to get you to quit smoking?
(1) Yes (2) No
ASK IF: Smokes nowadays AND: M130_25g = Yes
M13025hM Who has been trying to get you to quit smoking?
SET [7] OF (1) Partner/spouse (2) Parents (3) Children (4) Sibling (5) Friend (6) Work mate (7) Other

Smoking-related Behaviour and Attitudes, 2007
Office for National Statistics 116
ASK ALWAYS:
M130_31 Do you think the government should increase the tax on cigarettes ... Running Prompt
(1) much more than the rate of inflation, (2) just above the rate of inflation, (3) only in line with inflation, (4) or, not at all?
ASK ALWAYS:
M130_44 SHOWCARD X31 Which statement best describes the rules on smoking inside your home. Please think about if and where smoking is allowed rather than who is allowed to smoke?
(1) Smoking is not allowed at all (2) Smoking is allowed in some rooms or at some times (3) Smoking is allowed anywhere (4) Don't know(Spontaneous Only)
ASK ALWAYS:
M130_32A Do you think that living with someone who smokes does, or does not, increase a child's risk of... asthma?
(1) Increases risk (2) Does not increase risk
ASK ALWAYS:
M130_32b (Do you think that living with someone who smokes does, or does not, increase a child's risk of...) ear infections?
(1) Increases risk (2) Does not increase risk
ASK ALWAYS:
M130_32c (Do you think that living with someone who smokes does, or does not, increase a child's risk of...) diabetes?
(1) Increases risk (2) Does not increase risk

Smoking-related Behaviour and Attitudes, 2007
Office for National Statistics 117
ASK ALWAYS:
M130_32d (Do you think that living with someone who smokes does, or does not, increase a child's risk of...) cot death?
(1) Increases risk (2) Does not increase risk
ASK ALWAYS:
M130_32e (Do you think that living with someone who smokes does, or does not, increase a child's risk of...) chest infections?
(1) Increases risk (2) Does not increase risk
ASK ALWAYS:
M130_32f (Do you think that living with someone who smokes does, or does not, increase a child's risk of...) other infections?
(1) Increases risk (2) Does not increase risk
ASK ALWAYS:
M130_33a Do you think that breathing someone else's smoke increases the risk of a non-smoker getting... asthma?
(1) Increases risk (2) Does not increase risk
ASK ALWAYS:
M130_33b (Do you think that breathing someone else's smoke increases the risk of a non-smoker getting...) lung cancer?
(1) Increases risk (2) Does not increase risk
ASK ALWAYS:
M130_33c (Do you think that breathing someone else's smoke increases the risk of a non-smoker getting...) diabetes?
(1) Increases risk (2) Does not increase risk

Smoking-related Behaviour and Attitudes, 2007
Office for National Statistics 118
ASK ALWAYS:
M130_33d (Do you think that breathing someone else's smoke increases the risk of a non-smoker getting...) heart disease?
(1) Increases risk (2) Does not increase risk
ASK ALWAYS:
M130_33e (Do you think that breathing someone else's smoke increases the risk of a non-smoker getting...) bronchitis?
(1) Increases risk (2) Does not increase risk
ASK ALWAYS:
M130_33f (Do you think that breathing someone else's smoke increases the risk of a non-smoker getting...) coughs and colds?
(1) Increases risk (2) Does not increase risk
COMPUTE IF: QSETUP.COUNTRY = England
Txt2 := 'smoking is now no longer allowed in enclosed public places and workplaces by law. What is your opinion on the legislation which made'
COMPUTE IF: QSETUP.COUNTRY = Wales
Txt2 := 'smoking is now no longer allowed in enclosed public places and workplaces by law. What is your opinion on the legislation which made'
COMPUTE IF: QSETUP.COUNTRY = Scotland
Txt2 := 'smoking is now no longer allowed in enclosed public places and workplaces by law. What is your opinion on the legislation which made'

Smoking-related Behaviour and Attitudes, 2007
Office for National Statistics 119
ASK ALWAYS:
M130_42 SHOWCARD X42 ^Txt2 all enclosed public places and workplaces, including pubs, smokefree?
(1) Strongly agree (2) Agree (3) Neither agree nor disagree (4) Disagree (5) Strongly disagree
COMPUTE IF: ((QSETUP.COUNTRY = England) OR (QSETUP.COUNTRY = Wales)) OR (QSETUP.COUNTRY = Scotland)
Txt1 := 'with the ban on smoking'
ASK ALWAYS:
M130_34a SHOWCARD X34 How far do you agree or disagree with the restrictions on smoking at work?
(1) Agree strongly (2) Agree (3) Neither agree nor disagree/don't mind (4) Disagree (5) Disagree strongly
ASK IF: currently working
M130_35 SHOWCARD X35 What sort of restrictions are there on smoking where you work in addition to enclosed public places?
(1) No smoking in enclosed places in accordance with the smoke-free law (2) No smoking at all on the premises, including the grounds (3) Don't work in a building with other people
ASK ALWAYS:
M130_34b SHOWCARD X34 (How far do you agree or disagree ^Txt1...) in restaurants?
(1) Agree strongly (2) Agree (3) Neither agree nor disagree/don't mind (4) Disagree (5) Disagree strongly

Smoking-related Behaviour and Attitudes, 2007
Office for National Statistics 120
ASK ALWAYS:
M130_34c SHOWCARD X34 (How far do you agree or disagree ^Txt1 ...) in pubs?
(1) Agree strongly (2) Agree (3) Neither agree nor disagree/don't mind (4) Disagree (5) Disagree strongly
ASK ALWAYS:
M130_34e SHOWCARD X34 (How far do you agree or disagree ^Txt1...) in indoor shopping centres?
(1) Agree strongly (2) Agree (3) Neither agree nor disagree/don't mind (4) Disagree (5) Disagree strongly
ASK ALWAYS:
M130_34f SHOWCARD X34 (How far do you agree or disagree ^Txt1...) in indoor sports and leisure centres?
(1) Agree strongly (2) Agree (3) Neither agree nor disagree/don't mind (4) Disagree (5) Disagree strongly
ASK ALWAYS:
M130_34g SHOWCARD X34 (How far do you agree or disagree ^Txt1...) in indoor areas at railway and bus stations?
(1) Agree strongly (2) Agree (3) Neither agree nor disagree/don't mind (4) Disagree (5) Disagree strongly

Smoking-related Behaviour and Attitudes, 2007
Office for National Statistics 121
ASK ALWAYS:
M130_34d SHOWCARD X34 (How far do you agree or disagree ^Txt1...) in public places such as banks and post offices?
(1) Agree strongly (2) Agree (3) Neither agree nor disagree/don't mind (4) Disagree (5) Disagree strongly
ASK ALWAYS:
M130_35a SHOWCARD X34 (How far do you agree or disagree with the restrictions on smoking...) in places where there are, or are likely to be, children under the age of 16?
(1) Agree strongly (2) Agree (3) Neither agree nor disagree/don't mind (4) Disagree (5) Disagree strongly
COMPUTE IF: ((QSETUP.COUNTRY = England) OR (QSETUP.COUNTRY = Wales)) OR (QSETUP.COUNTRY = Scotland)
Txt3 := 'Before the smoking restriction came into place in pubs, did'
ASK ALWAYS:
M130_43 ^Txt3 you visit them...
(1) More often than you do nowadays, (2) Less often than you do nowadays, (3) Or about the same as you do nowadays? (4) Don't go to pubs (Spontaneous Only)
ASK IF: Smoker
M130_36 If you are in a room with adults who don't smoke, do you ..... Interviewer: Running Prompt
(1) Smoke the same number of cigarettes as usual (2) Smoke fewer cigarettes (3) Or do you not smoke at all? (4) Other

Smoking-related Behaviour and Attitudes, 2007
Office for National Statistics 122
ASK IF: Smoker AND: M130_36 = Q36Oth
SPEC36 Specify 'Other'
STRING[200]
ASK IF: Smoker
M130_37 And if you are in a room with children, do you ...... Interviewer: Running Prompt
(1) Smoke the same number of cigarettes as usual (2) Smoke fewer cigarettes (3) Or do you not smoke at all? (4) Other
ASK IF: Smoker AND: M130_37 = Q36Oth
SPEC37 Specify 'Other'
STRING[200]
ASK IF: smokes now or gave up in last year AND: Parent of child
M130_37a How likely, if at all, do you think it is that your smoking will influence whether or not the children in this household become smokers?
(1) Very likely (2) Fairly likely (3) Fairly unlikely (4) Very unlikely
ASK ALWAYS:
M130_45 SHOWCARD X45 The Government have increased the legal age of purchasing tobacco from 16 to 18 in October 2007. How far do you agree or disagree with this change in legislation?
(1) Agree strongly (2) Agree (3) Neither agree nor disagree/don't mind (4) Disagree (5) Disagree strongly

Smoking-related Behaviour and Attitudes, 2007
Office for National Statistics 123
ASK IF: Non smoker
M130_38 In general, do you mind if other people smoke near you, or not?
(1) Yes (2) No (3) It depends
ASK IF: Non smoker AND: M130_38 = Q38DEP
SPEC38 Please specify 'it depends'
STRING[200]
ASK IF: Non smoker AND: Minds if others smoke near them
M13039M Why is that? Interviewer: Code all that apply
SET [9] OF (1) Affects my breathing/makes my asthma worse (2) Makes me cough (3) Gives me a headache (4) Makes my clothes smell (5) Gets in my eyes (6) Unpleasant smell (7) Makes me feel sick (8) Bad for my health (9) Other
ASK IF: Non smoker AND: Minds if others smoke near them AND: Q39Oth IN M13039M
SPEC39 Please specify 'other'
STRING[200]

Smoking-related Behaviour and Attitudes, 2007
Office for National Statistics 124
Appendix C: Bibliography/reference
Previous reports in the Omnibus smoking series
Smoking-related behaviour and attitudes. Fiona Dawe and Eileen Goddard. TSO (1997)
Smoking-related behaviour and attitudes, 1997. Stephanie Freeth. Office for National Statistics (1998)
Smoking Related Behaviour and Attitudes, 1999. Deborah Lader and Howard Meltzer. Office for National Statistics (2000)
Smoking Related Behaviour and Attitudes, 2000. Deborah Lader and Howard Meltzer. Office for National Statistics (2001)
Smoking Related Behaviour and Attitudes, 2001. Deborah Lader and Howard Meltzer. Office for National Statistics (2001) Also available on-line at http://www.statistics.gov.uk/downloads/theme_health/Smoking_Related_2001.pdf
Smoking Related Behaviour and Attitudes, 2002. Deborah Lader and Howard Meltzer. Office for National Statistics (2003) Also available on-line at http://www.statistics.gov.uk/downloads/theme_health/Smoking_Related_2002.pdf
Smoking-related Behaviour and Attitudes, 2003. Deborah Lader and Eileen Goddard. Office for National Statistics (2004) Also available on-line at http://www.dh.gov.uk/en/Publicationsandstatistics/Publications/PublicationsStatistics/DH_4085157
Smoking-related Behaviour and Attitudes, 2004. Deborah Lader and Eileen Goddard. Office for National Statistics (2005) Also available on-line at http://www.dh.gov.uk/en/Publicationsandstatistics/Publications/PublicationsStatistics/DH_4114728
Smoking-related Behaviour and Attitudes, 2005. Tamara Taylor, Deborah Lader, Aimee Bryant, Laura Keyse, McDuff Theodore Joloza. Office for National Statistics (2006) Also available on-line at http://www.statistics.gov.uk/statbase/Product.asp?vlnk=1638
Smoking-related Behaviour and Attitudes, 2006. Deborah Lader. Office for National Statistics (2007)
Also available on-line at http://www.statistics.gov.uk/statbase/Product.asp?vlnk=1638
Other relevant publications
Department of Health (1998) Smoking Kills. A White Paper on Tobacco, TSO: London. Also available on-line at: http://www.archive.official-documents.co.uk/document/cm41/4177/contents.htm
Department of Health (2004) Choosing Health: Making healthier choices easier. A public health white paper TSO: London. Also available on-line at: http://www.dh.gov.uk/en/Publicationsandstatistics/Publications/PublicationsPolicyAndGuidance/DH_4094550
Department of Health (2000) The NHS Cancer Plan TSO: London. Also available on-line at: http://www.dh.gov.uk/en/Publicationsandstatistics/Publications/PublicationsPolicyAndGuidance/DH_4009609
Department of Health (2004) Spending review 2004 Public Service Agreement TSO: London. Technical note available on-line at http://www.dh.gov.uk/assetRoot/04/08/69/19/04086919.pdf
Department of Health (2001) Priorities and Planning Framework (PPF) for 2003-06 "Improvement, Expansion and reform: the next three years" TSO: London. Also available on-line at
Goddard E (2008) General Household Survey: Smoking and Drinking among adults, 2006. Available on-line at http://www.statistics.gov.uk/statbase/Product.asp?vlnk=5756