Smart Digital Analysis Technology for Air-Cooled Plant - jgc ...
26
Presentation Title (Front Cover ver.1) © 2019 JGC Corporation AIRLIZE SM - Smart Digital Analysis Technology for Air-Cooled Plant JGC Technology Forum 2019 Xidong Hu EN Technology Center, PT Division Contact: [email protected]
-
Upload
khangminh22 -
Category
Documents
-
view
2 -
download
0
Transcript of Smart Digital Analysis Technology for Air-Cooled Plant - jgc ...

Presentation Title(Front Cover ver.1)
© 2019 JGC Corporation
AIRLIZESM- Smart Digital Analysis Technology for Air-Cooled Plant
JGC Technology Forum 2019
Xidong HuEN Technology Center, PT Division
Contact: [email protected]

Copyright 2019 JG
C All Rights Reserved
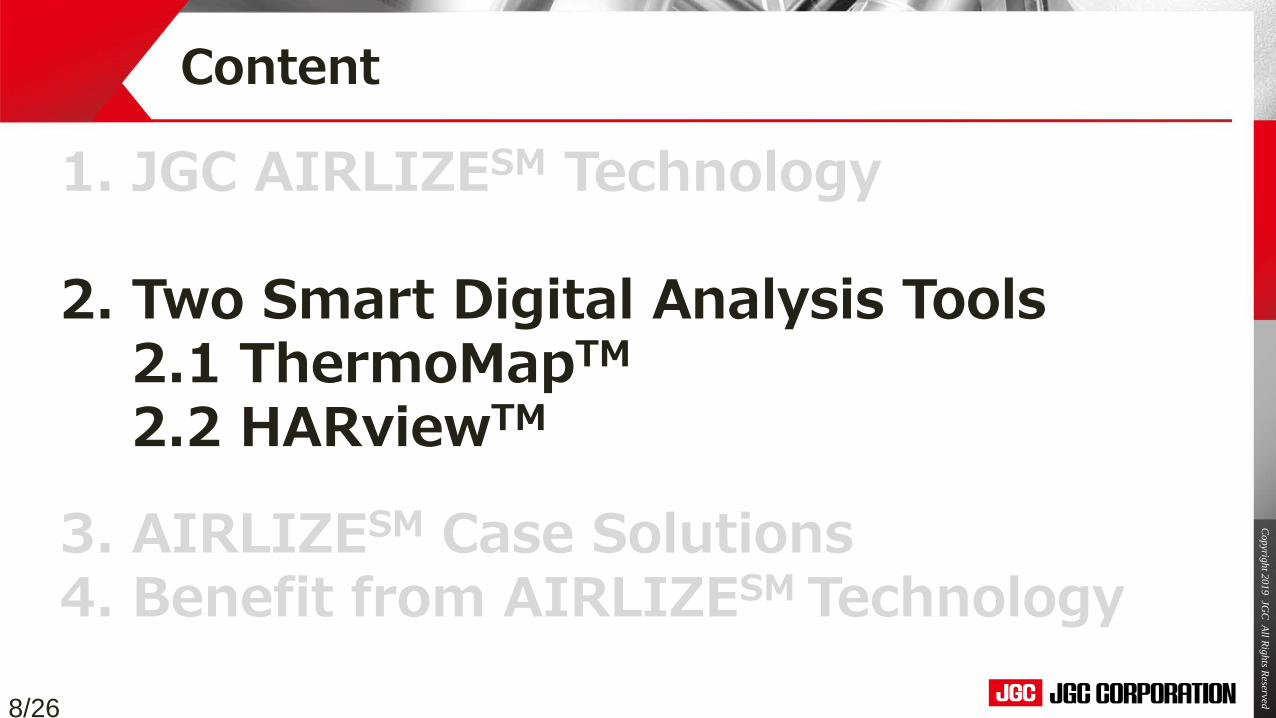
Content
1. JGC AIRLIZESM Technology
2. Two Smart Digital Analysis Tools2.1 ThermoMapTM
2.2 HARviewTM
3. AIRLIZESM Case Solutions4. Benefit from AIRLIZESM Technology
2/26

Copyright 2019 JG
C All Rights Reserved
Content
1. JGC AIRLIZESM Technology
2. Two Smart Digital Analysis Tools2.1 ThermoMapTM
2.2 HARviewTM
3. AIRLIZESM Case Solutions4. Benefit from AIRLIZESM Technology
3/26

Copyright 2019 JG
C All Rights Reserved
1. JGC AIRLIZESM Technology
Hot Spot Appears and Affect Equipment Performance
Production Reduction during Summer
Unstable Operation Under Unstable Wind Conditions
Do you have the following concerns?
Summer Summer
4/26

Copyright 2019 JG
C All Rights Reserved
AIRLIZESM is JGC’s Technology Brand of Comprehensive Life Cycle Engineering Support Services for Air-Cooled Plants (ACHE, GT, Cooling Tower etc.)
AIRLIZE is Aimed to Control Air to Minimize Hot Spot and Weather Impact Maximize Production and Plant Availability
What is AIRLIZESM ?
1. JGC AIRLIZESM Technology
Note: From Google Picture
5/26

Copyright 2019 JG
C All Rights Reserved
Phase-1:Plant Survey
Phase-2:Identify Bottlenecks
Phase-3:Implement & Improve
• Identify bottlenecks• Study mitigations using
AIRLIZE Technology
• Collect data • Analyze data
• Engineering design • Implement
Phase-4: Evaluate
• Evaluate effectiveness of countermeasures
Steps toward Maximum & More Stable Production
1. JGC AIRLIZESM Technology
For Existing Plants:
6/26

Copyright 2019 JG
C All Rights Reserved
LNG3 =Technology-Driven Workshop & Consulting
1. JGC AIRLIZESM Technology
AIRLIZE: One of the LNG3
Technologies, but Not Limited to LNG Plants
7/26
Copyright 2019 JG
C All Rights Reserved
Content
1. JGC AIRLIZESM Technology
2. Two Smart Digital Analysis Tools2.1 ThermoMapTM
2.2 HARviewTM
3. AIRLIZESM Case Solutions4. Benefit from AIRLIZESM Technology
8/26

Copyright 2019 JG
C All Rights Reserved
2. Two Smart Digital Analysis Tools2.1 ThermoMapTM-Real-time Air Temperature Mapping
Thermal Couple
(1) Traditional Temperature Measurement
TR1
TR 2GT
GT
GT GT
Wind
Wind
Hot Air
Why conventional single-point temperature sensors are not sufficient for capturing the hot spot in time?
- Unsteady hot spot when wind speed & direction changes- Limited temperature data points for only some fixed locations- Enormous sensors are required to capture the temperature distribution for a large area
Hot Spot => Reduce Plant Performance
Note: From Google Picture
9/26
Air Cooler Heat Exchanger
Copyright 2019 JG
C All Rights Reserved
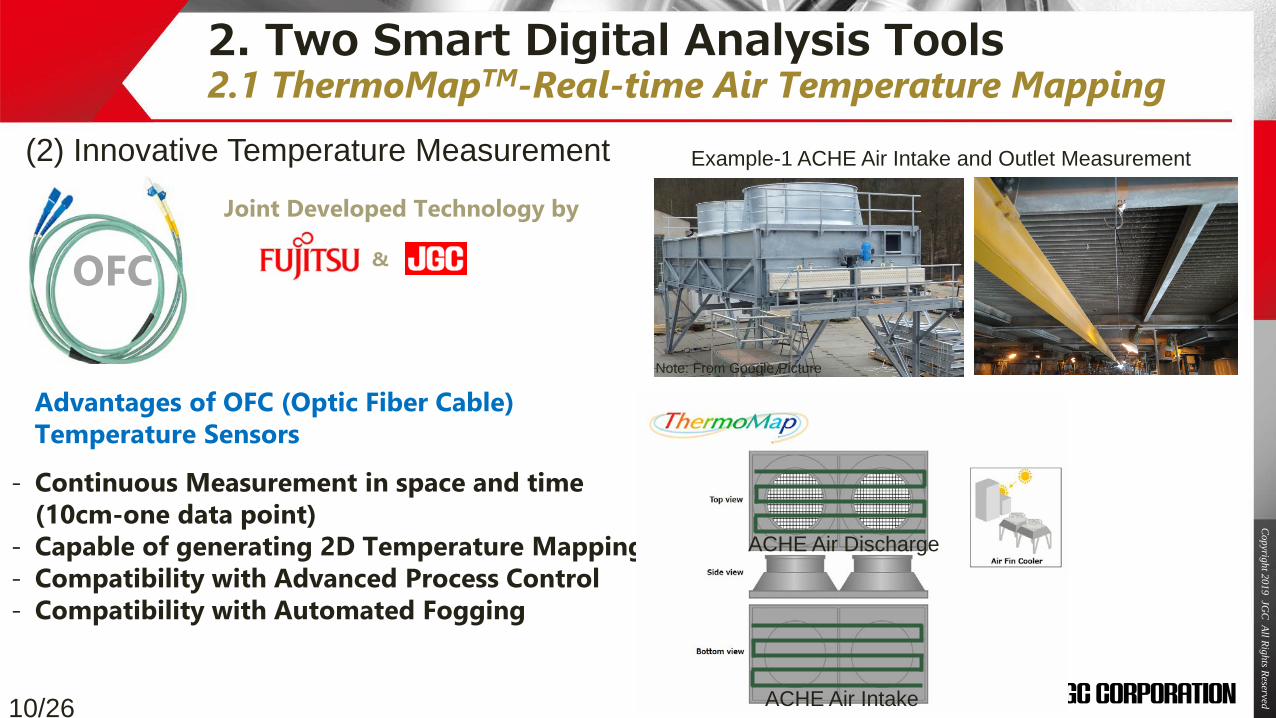
Advantages of OFC (Optic Fiber Cable) Temperature Sensors
- Continuous Measurement in space and time(10cm-one data point)
- Capable of generating 2D Temperature Mapping- Compatibility with Advanced Process Control- Compatibility with Automated Fogging
Joint Developed Technology by
&OFC
2. Two Smart Digital Analysis Tools2.1 ThermoMapTM-Real-time Air Temperature Mapping
Example-1 ACHE Air Intake and Outlet Measurement (2) Innovative Temperature Measurement
ACHE Air Discharge
ACHE Air Intake
ACHE Air Discharge
ACHE Air Intake
Note: From Google Picture
10/26
Copyright 2019 JG
C All Rights Reserved
2. Two Smart Digital Analysis Tools2.1 ThermoMapTM-Real-time Air Temperature Mapping
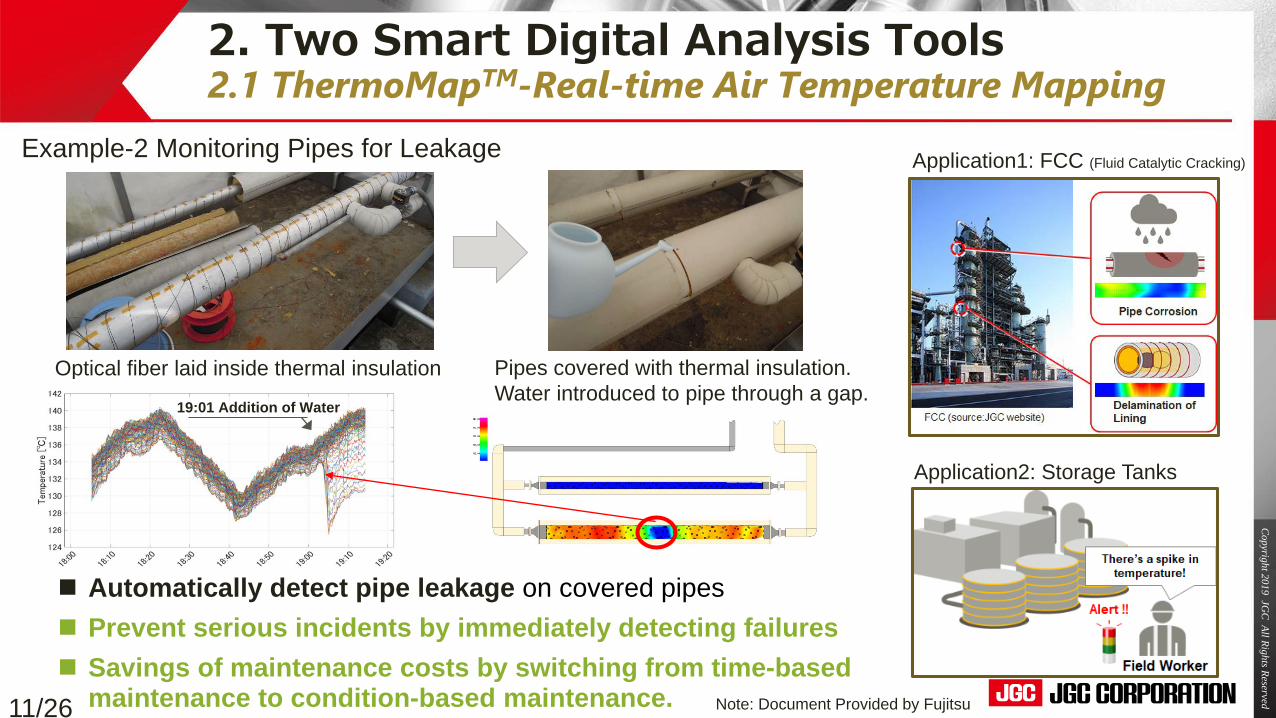
Example-2 Monitoring Pipes for Leakage
Automatically detect pipe leakage on covered pipes Prevent serious incidents by immediately detecting failures Savings of maintenance costs by switching from time-based
maintenance to condition-based maintenance.
Pipes covered with thermal insulation.Water introduced to pipe through a gap.
Optical fiber laid inside thermal insulation
19:01 Addition of Water
Application1: FCC (Fluid Catalytic Cracking)
Application2: Storage Tanks
11/26 Note: Document Provided by Fujitsu

Copyright 2019 JG
C All Rights Reserved
Optical Fiber Thermometer Infrared Thermography
Method Contact Contact Non-contact
Measurement Range -190~340℃ -200~1200℃ -40~2000℃
MeasurementArea
Very Large(2~15km/ch 1~6ch/set)
1 point(One cable for single point)
Small(20° of view angle)
Cable-less
Number ofMeasurement points
So many(Tens of thousands)
1 Relies on pixel number(Several thousand)
Use for Atmospheric Temperature Measurement Yes Yes No
Use in ExplosionProof Areas Yes No No
Temperature Accuracy Good Very Good Relies on material of object
Measurement Variation for each sensor point No Yes Relies on material of object
Many pointsand serial dataare suitable for
analysis
Signal
Optical Fiber
32°C
41°C
36°C
Signal
2. Two Smart Digital Analysis Tools2.1 ThermoMapTM-Real-time Air Temperature Mapping
12/26
Note:Document Provided by Fujitsu

Copyright 2019 JG
C All Rights Reserved
2. Two Smart Digital Analysis Tools2.2 HARviewTM-Innovation for Air Control in Air-Cooled Plants
Weather condition has significant impact on the performance of air used equipment.
Weather dependent hot spot results in air temperature increase and finally reduce the equipment performance.
Plant Area Higher Ambient Temperature=> Lower Production
Ambient Temperature versus Production
Note: From Google Picture
13/26
Copyright 2019 JG
C All Rights Reserved
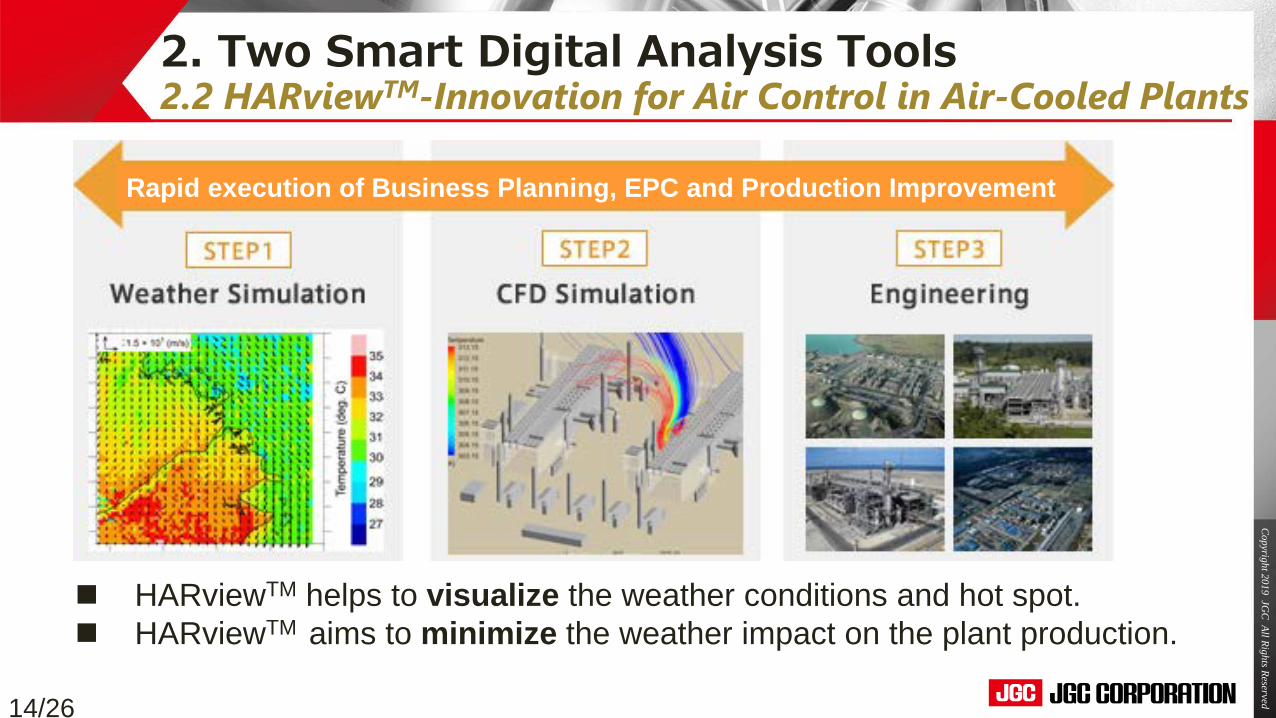
2. Two Smart Digital Analysis Tools2.2 HARviewTM-Innovation for Air Control in Air-Cooled Plants
HARviewTM helps to visualize the weather conditions and hot spot. HARviewTM aims to minimize the weather impact on the plant production.
Rapid execution of Business Planning, EPC and Production Improvement
14/26

Copyright 2019 JG
C All Rights Reserved
2. Two Smart Digital Analysis Tools2.2 HARviewTM-Innovation for Air Control in Air-Cooled Plants
Technology-1 : Weather SimulationWeather Simulation versus Actual Measurement
Technology-2: CFD Analysis
0.4 1.5 3.2 1.0 1.1 1.10.2 0.5 1.2 0.8 0.8 0.90.3 0.3 0.7 0.7 0.6 0.70.3 0.2 0.3 0.6 0.6 0.60.2 0.1 0.1 0.6 0.5 0.60.1 0.1 0.1 0.8 0.6 0.50.2 0.1 0.1 1.0 0.8 0.60.3 0.3 0.3 1.5 1.1 0.70.6 0.6 0.6 2.1 1.6 0.9
0.2 0.2 0.1 0.9 1.0 1.2 1.5 1.3 1.1 2.9 2.1 1.20.1 0.1 0.1 0.9 1.3 1.7 2.1 1.9 1.6 2.8 1.9 1.30.0 0.1 0.4 0.5 1.2 1.9 3.1 2.7 2.5 2.3 1.5 1.50.0 0.2 0.6 0.2 0.8 1.8 4.4 4.0 3.8 3.0 1.9 1.90.0 0.1 0.3 0.1 0.5 1.3 6.0 5.6 4.9 5.1 3.2 2.70.0 0.0 0.1 0.1 0.3 1.0 7.4 6.7 5.6 6.2 3.9 3.20.0 0.0 0.0 0.1 0.4 0.9 7.9 7.4 6.6 5.6 3.9 3.40.0 0.0 0.0 0.3 0.6 1.4 8.0 7.6 7.3 4.3 3.5 3.50.0 0.0 0.0 0.8 1.6 2.5 7.8 7.5 7.1 3.3 3.3 3.60.0 0.0 0.1 1.5 3.0 3.9 7.4 6.9 6.1 3.2 3.3 3.70.0 0.0 0.1 1.6 3.7 4.7 6.9 6.1 4.6 3.5 3.2 3.60.0 0.1 0.2 1.0 2.8 4.8 6.6 5.9 4.4 3.8 2.9 3.00.0 0.1 0.2 0.7 2.0 4.2 6.2 5.7 5.1 3.7 3.1 2.70.0 0.0 0.1 0.5 1.5 3.2 5.6 5.1 4.8 3.5 3.1 2.80.1 0.1 0.1 0.4 1.0 2.1 4.8 4.2 3.9 3.4 3.2 2.80.3 0.2 0.2 0.4 0.7 1.2 4.3 3.9 3.6 3.5 3.3 2.90.8 0.6 0.4 0.4 0.5 0.8 4.2 3.8 3.6 3.4 3.2 2.80.7 0.5 0.4 0.3 0.4 0.6 4.2 3.9 3.6 3.3 3.0 2.50.3 0.2 0.2 0.1 0.2 0.4 4.2 3.8 3.5 2.9 2.6 2.10.1 0.1 0.1 0.1 0.1 0.2 3.9 3.5 3.2 2.5 2.2 1.80.1 0.0 0.1 0.0 0.1 0.2 3.5 3.1 2.7 2.1 1.7 1.50.0 0.0 0.0 0.0 0.1 0.1 2.9 2.5 2.1 1.6 1.4 1.30.0 0.0 0.1 0.1 0.1 0.1 2.3 1.9 1.5 1.2 1.1 1.30.0 0.1 0.1 0.2 0.2 0.3 1.7 1.4 1.1 0.9 1.0 1.40.1 0.3 0.7 0.5 0.6 1.0 1.2 1.1 1.0 0.9 1.0 1.50.3 1.3 2.5 1.6 1.9 2.6 1.1 1.2 1.4 1.2 1.2 1.5
052E1105 052E1103 051E1105 051E1103
052E1004
052E1005
052E1003
052E1001
0.1 0.2 0.3
0.1
031E1002 1.1
1.3 4.6
1.3
052E1006
1.4
032E1002
022E1004
052E1002
0.7 1.9
1.8
051E1004
051E1005
051E1002051E1003
051E1001
051E1006
051E1101
021E10031.0 0.9 1.0
021E10041.1 1.0 0.8
052E1101
022E1003
0.2 0.6 0.8 1.1
1.8 3.1 3.0 4.02.0 2.9 2.6 4.01.1 2.0 2.2 3.70.5 2.8 1.1 1.8
1.0 0.90.8 0.4 1.4 1.4
052E1105 1.5 3.3 052E1103 051E1105 051E1103
0.3 1.3
0.4
0.5 1.3
052E1002 051E1002
1.1
2.2 1.3
0.8 0.2 3.6 2.3
0.9 0.8 4.3
051E1101
0.3 0.3 1.6
0.3 0.2 052E11010.7 0.5
0.3 0.3
1.1 0.5 4.2 2.8
052E10060.4 1.9
0.4 2.1
051E1001
0.6 0.3 5.8 4.6
0.7 -0.1 052E1001 6.6 5.5
4.3
2.5 3.4051E1003
0.2 1.2 1.3 3.2
0.8 2.9052E1003
6.8 5.3
7.1 6.4 2.6 4.0
051E10062.9
0.1 -0.1
021E1003
0.9
2.7
1.6 1.3 1.5
2.2 051E1004
0.5 0.1 3.7 2.6
0.6
032E1002 031E1002
022E1003
022E1004 021E1004
0.0 0.2
0.5
1.5
2.6
2.5
2.0
0.9
3.1
3.4
2.3051E1005
0.1
1.4
1.5
0.7
0.9
0.9
0.6 1.0
1.4
1.6
1.3
1.2
0.2
0.4
1.10.7
1.9
1.8
0.5
1.1
1.0
1.3
0.8
2.3 2.8
0.1
1.7 052E1004
052E10050.4 0.1 5.5
CFD simulation Actual MeasurementACHE Intake Temperature Comparison
15/26

Copyright 2019 JG
C All Rights Reserved
Content
1. JGC AIRLIZESM Technology
2. Two Smart Digital Analysis Tools2.1 ThermoMapTM
2.2 HARviewTM
3. AIRLIZESM Case Solutions4. Benefit from AIRLIZESM Technology
16/26

Copyright 2019 JG
C All Rights Reserved
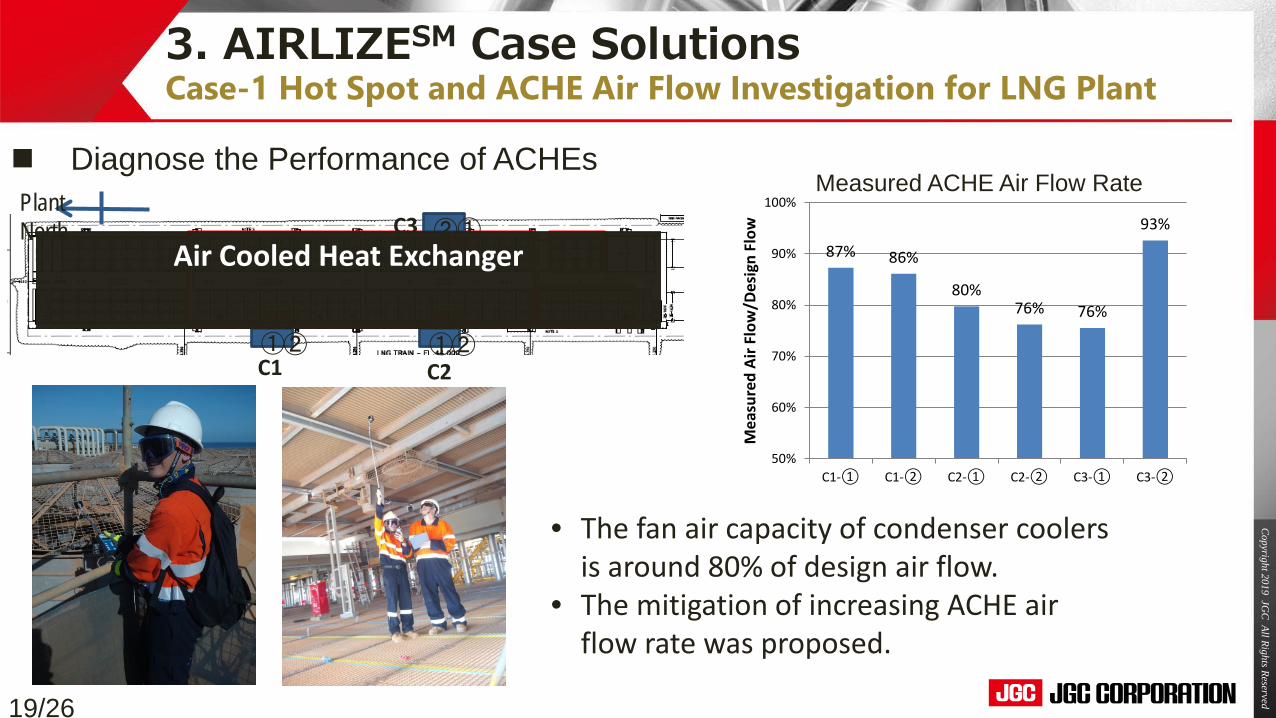
Plant Type: LNG PlantActivity: Hot Spot and ACHE Air Flow Investigation
3. AIRLIZESM Case SolutionsCase-1 Hot Spot and ACHE Air Flow Investigation for LNG Plant
Visualize Air Flow Measure ACHE Air Flow Measure Temp
0
5
10
15
20
25N
NNE
NE
ENE
E
ESE
SE
SSES
SSW
SW
WSW
W
WNW
NW
NNW
Wind Rose_16th April-24th April
<1<2<3<4<5<6<7<8<9<10<11<12
Analyze Weather Data
Note: From Chevron HP
17/26
The picture has been deleted.
The picture has been deleted.

Copyright 2019 JG
C All Rights Reserved
MR-GT PR-GTGT Intake
SEHot Spot
ΔT: +10℃
Wind Direction Change= 180°within 5 minutes
Hot Spot ΔT: +10℃
Heat SourceNW
13:00:00 14:00:00 15:00:00 16:00:00
NW NW
SE
13:00 14:00 15:00 16:00
3. AIRLIZESM Case SolutionsCase-1 Hot Spot and ACHE Air Flow Investigation for LNG Plant
Investigate Impact of Wind Change on Hot Spot Occurrence through Data Analysis
Air Cooled Heat Exchanger
18/26
The picture
has been deleted.
Copyright 2019 JG
C All Rights Reserved
C2C1
C3Plant North
①② ①②
①②87% 86%
80%76% 76%
93%
50%
60%
70%
80%
90%
100%
C1-① C1-② C2-① C2-② C3-① C3-②
Mea
sure
d Ai
r Flo
w/D
esig
n Fl
ow
3. AIRLIZESM Case SolutionsCase-1 Hot Spot and ACHE Air Flow Investigation for LNG Plant
• The fan air capacity of condenser coolers is around 80% of design air flow.
• The mitigation of increasing ACHE air flow rate was proposed.
Measured ACHE Air Flow Rate Diagnose the Performance of ACHEs
Air Cooled Heat Exchanger
19/26

Copyright 2019 JG
C All Rights Reserved
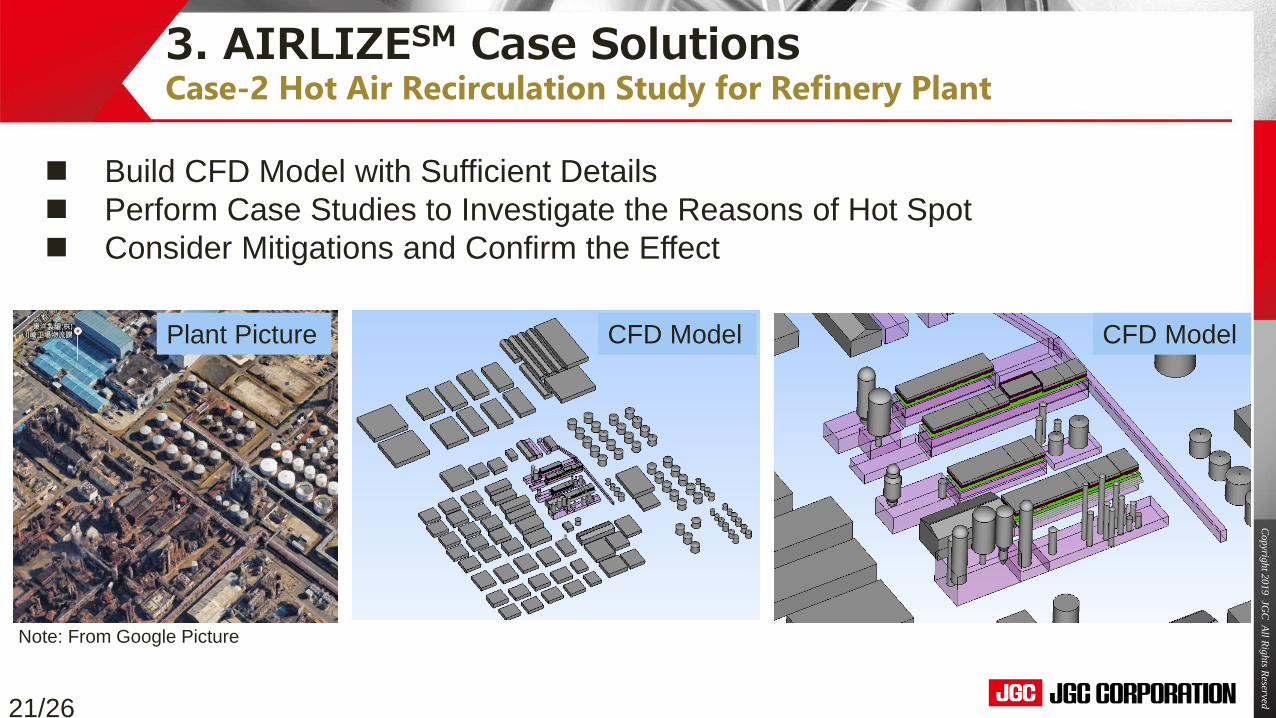
3. AIRLIZESM Case SolutionsCase-2 Hot Air Recirculation Study for Refinery Plant
Plant Type: Refinery PlantActivity: Hot Air Recirculation CFD Study and Mitigation Proposal
Note: From Google Picture
20/26
Copyright 2019 JG
C All Rights Reserved
3. AIRLIZESM Case SolutionsCase-2 Hot Air Recirculation Study for Refinery Plant
Build CFD Model with Sufficient Details Perform Case Studies to Investigate the Reasons of Hot Spot Consider Mitigations and Confirm the Effect
CFD Model CFD ModelPlant Picture
Note: From Google Picture
21/26
Copyright 2019 JG
C All Rights Reserved
3. AIRLIZESM Case SolutionsCase-2 Hot Air Recirculation Study for Refinery Plant
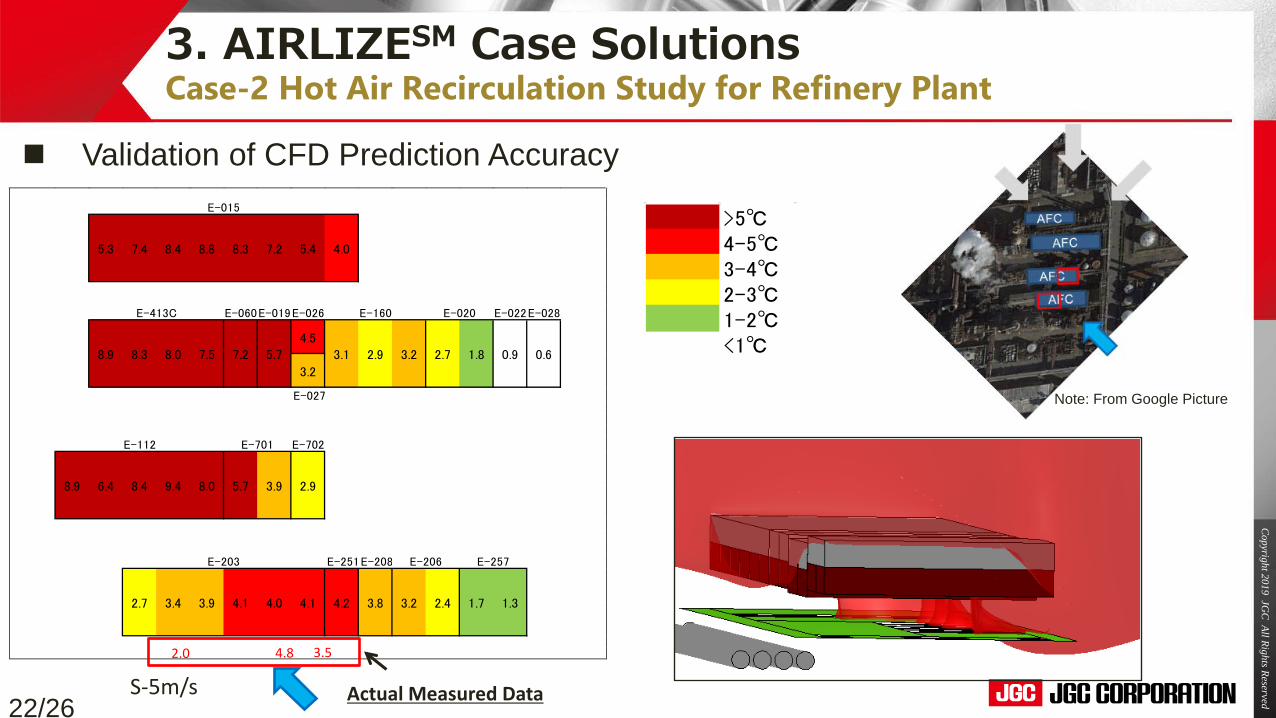
Validation of CFD Prediction Accuracy
E-060E-019E-026 E-022E-028
4.5
3.2
E-027
E-702
E-251E-208
E-015
5.3 7.4 8.4 8.8 8.3 7.2 5.4 4.0
0.6
E-413C E-160 E-020
8.9 8.3 8.0 7.5 7.2 5.7 3.1 2.9 3.2 2.7 1.8 0.9
E-112 E-701
8.9 6.4 8.4 9.4 8.0 5.7 3.9
1.3
2.9
E-203 E-206 E-257
2.7 3.4 3.9 4.1 4.0 4.1 4.2 3.8 3.2 2.4 1.7
S-5m/s3.54.82.0
Actual Measured Data
>5℃4-5℃3-4℃2-3℃1-2℃<1℃
Note: From Google Picture
22/26
Copyright 2019 JG
C All Rights Reserved
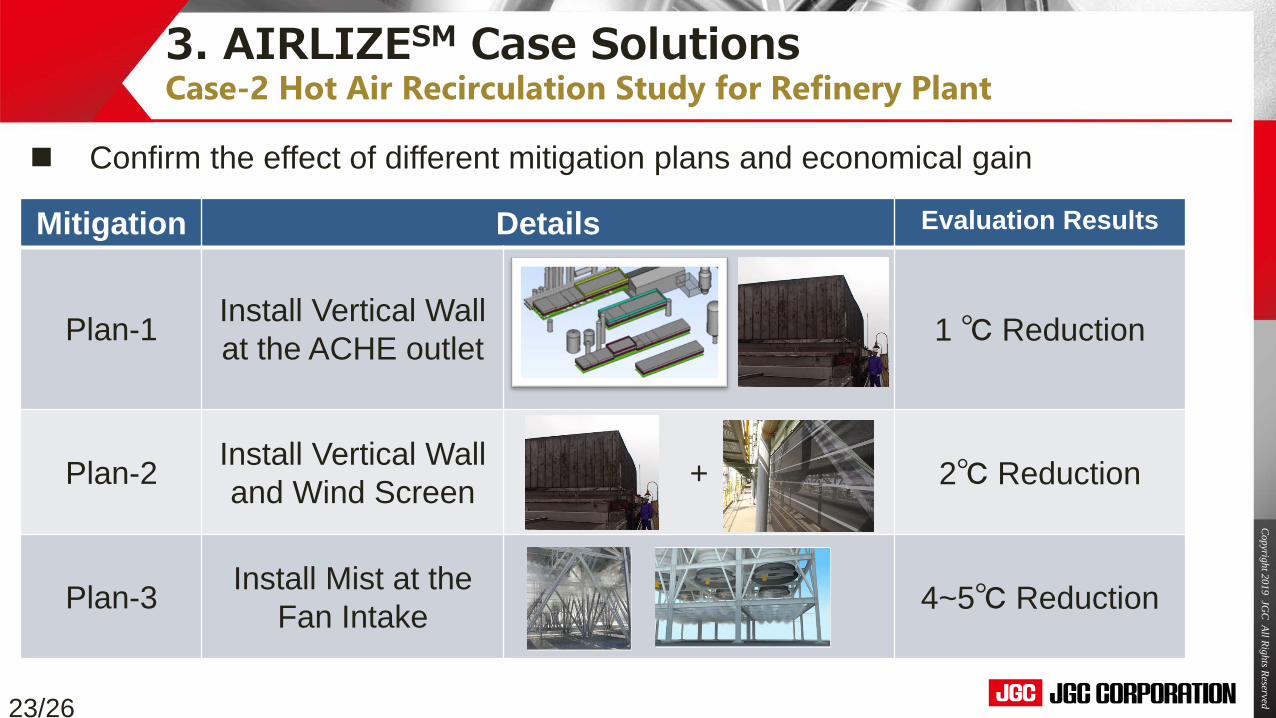
3. AIRLIZESM Case SolutionsCase-2 Hot Air Recirculation Study for Refinery Plant
Confirm the effect of different mitigation plans and economical gain
Mitigation Details Evaluation Results
Plan-1 Install Vertical Wall at the ACHE outlet 1 ℃ Reduction
Plan-2 Install Vertical Wall and Wind Screen + 2℃ Reduction
Plan-3 Install Mist at the Fan Intake 4~5℃ Reduction
23/26
Copyright 2019 JG
C All Rights Reserved
Content
1. JGC AIRLIZESM Technology
2. Two Smart Digital Analysis Tools2.1 ThermoMapTM
2.2 HARviewTM
3. AIRLIZESM Case Solutions4. Benefit from AIRLIZESM Technology
24/26

Copyright 2019 JG
C All Rights Reserved
AIRLIZEWorkshop
HAR Digital Business Case Study(Weather Analysis, Operational Data Analysis)
HAR Digital Demonstration(CFD, HAR Predictive Model Development, Verification)
HAR DigitalImplementation(APC, Predictive Model Installation)
ThermpMapInstallation & Reinforce HAR Digital
HARView Diagnosis(CFD, Aircooler and GT Performance Survey)
ANNUAL LNG INCREASE
2~3%PER TRAIN
1 MONTH 3 MONTH 6~10 MONTH
8~12 MONTH6 MONTH
HARView Mitigation(Wind Screen, Fogging, Ventilation Improvement)
8~12 MONTH
ANNUAL LNG INCREASE
2~3%PER Train
ANNUAL LNG INCREASE
1~2%PER Train
Initiative 1 : HARViewTM, ThermoMapTM
Initiative 2 : HAR Digital
4. Benefit from AIRLIZESM Technology- An Example for LNG Plant
25/26

Copyright 2019 JG
C All Rights Reserved
Thanks for Your Attention!
26/26