Spatial Differentiation of Non-Grain Production on Cultivated ...
Upload
independentCategory
view
0download
0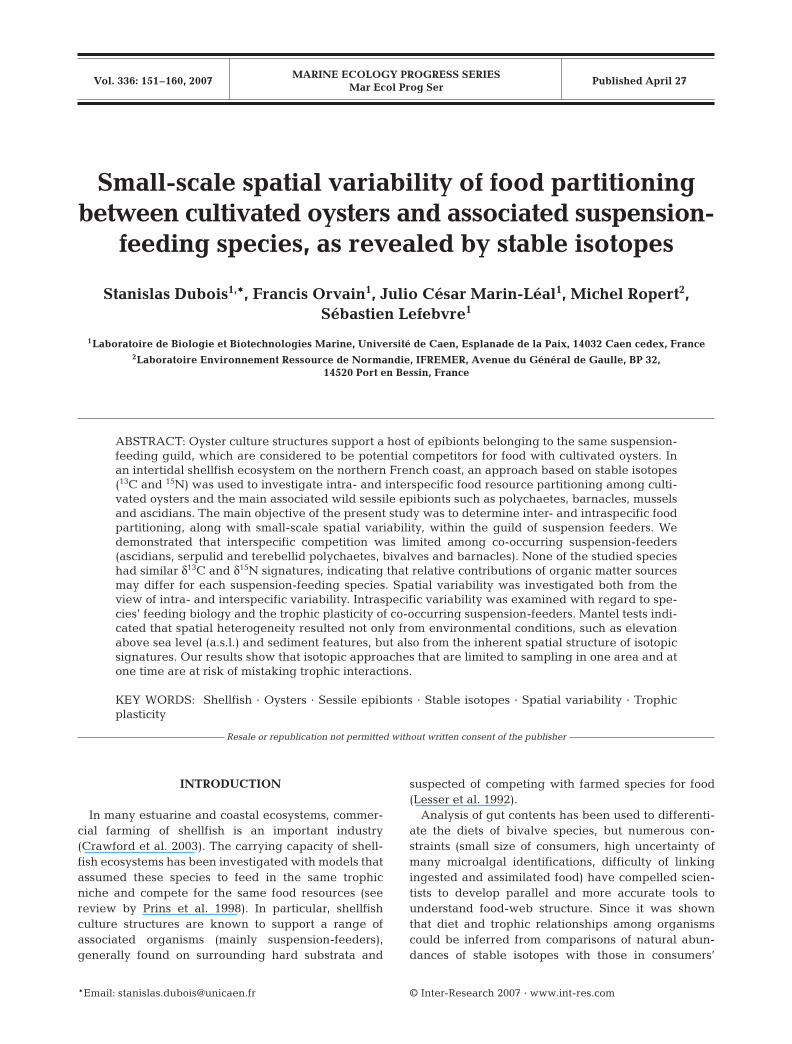
MARINE ECOLOGY PROGRESS SERIESMar Ecol Prog Ser
Vol. 336: 151–160, 2007 Published April 27
INTRODUCTION
In many estuarine and coastal ecosystems, commer-cial farming of shellfish is an important industry(Crawford et al. 2003). The carrying capacity of shell-fish ecosystems has been investigated with models thatassumed these species to feed in the same trophicniche and compete for the same food resources (seereview by Prins et al. 1998). In particular, shellfishculture structures are known to support a range ofassociated organisms (mainly suspension-feeders),generally found on surrounding hard substrata and
suspected of competing with farmed species for food(Lesser et al. 1992).
Analysis of gut contents has been used to differenti-ate the diets of bivalve species, but numerous con-straints (small size of consumers, high uncertainty ofmany microalgal identifications, difficulty of linkingingested and assimilated food) have compelled scien-tists to develop parallel and more accurate tools tounderstand food-web structure. Since it was shownthat diet and trophic relationships among organismscould be inferred from comparisons of natural abun-dances of stable isotopes with those in consumers’
© Inter-Research 2007 · www.int-res.com*Email: [email protected]
Small-scale spatial variability of food partitioningbetween cultivated oysters and associated suspension-
feeding species, as revealed by stable isotopes
Stanislas Dubois1,*, Francis Orvain1, Julio César Marin-Léal1, Michel Ropert2, Sébastien Lefebvre1
1Laboratoire de Biologie et Biotechnologies Marine, Université de Caen, Esplanade de la Paix, 14032 Caen cedex, France2Laboratoire Environnement Ressource de Normandie, IFREMER, Avenue du Général de Gaulle, BP 32,
14520 Port en Bessin, France
ABSTRACT: Oyster culture structures support a host of epibionts belonging to the same suspension-feeding guild, which are considered to be potential competitors for food with cultivated oysters. Inan intertidal shellfish ecosystem on the northern French coast, an approach based on stable isotopes(13C and 15N) was used to investigate intra- and interspecific food resource partitioning among culti-vated oysters and the main associated wild sessile epibionts such as polychaetes, barnacles, musselsand ascidians. The main objective of the present study was to determine inter- and intraspecific foodpartitioning, along with small-scale spatial variability, within the guild of suspension feeders. Wedemonstrated that interspecific competition was limited among co-occurring suspension-feeders(ascidians, serpulid and terebellid polychaetes, bivalves and barnacles). None of the studied specieshad similar δ13C and δ15N signatures, indicating that relative contributions of organic matter sourcesmay differ for each suspension-feeding species. Spatial variability was investigated both from theview of intra- and interspecific variability. Intraspecific variability was examined with regard to spe-cies’ feeding biology and the trophic plasticity of co-occurring suspension-feeders. Mantel tests indi-cated that spatial heterogeneity resulted not only from environmental conditions, such as elevationabove sea level (a.s.l.) and sediment features, but also from the inherent spatial structure of isotopicsignatures. Our results show that isotopic approaches that are limited to sampling in one area and atone time are at risk of mistaking trophic interactions.
KEY WORDS: Shellfish · Oysters · Sessile epibionts · Stable isotopes · Spatial variability · Trophicplasticity
Resale or republication not permitted without written consent of the publisher
Mar Ecol Prog Ser 336: 151–160, 2007
tissues (DeNiro & Epstein 1978), stable isotopes haveincreasingly been used to identify organisms’ diets andpotential food resources (Fry 2006). The carbon andnitrogen isotopic compositions of consumer tissues arethus functions of the ratios of 13C to 12C (δ13C) and 15Nto 14N (δ15N) of each food resource, the relative propor-tion of each food source assimilated, and isotopic frac-tionation, as defined by step-wise enrichment at eachtrophic level (Vander Zanden & Rasmussen 2001).
Few studies have focused on oyster diets using thestable isotopic approach (e.g. Riera & Richard 1996,Riera 1998, Hsieh et al. 2000), and even less informa-tion is available on food competition between farmedoysters and their potential competitors. Food competi-tion between oysters Crassostrea gigas and the inva-sive gastropod Crepidula fornicata was investigatedusing δ13C and δ15N analysis (Riera et al. 2002); how-ever, there are few data concerning common sessileepibionts—such as mussels, barnacles, serpulids orascidians—associated with farmed oysters.
Although several studies have already shown thatisotopic signatures of resources and consumers mayvary greatly over time (Rolff 2000), evidence of spatialvariation is scarce because many studies are limited toa single sampling site (e.g. Kharlamenko et al. 2001,Riera et al. 2002). Typically, large-scale spatial varia-tions have been analysed, such as between 2 inter-connected but different ecosystems (Marguillier et al.1997), between upper and lower shores of an entire
estuarine ecosystem (Deegan & Garritt 1997, Hsieh etal. 2002), or along a river gradient (Kikuchi & Wada1996). To our knowledge, the only previous study ofsmall-scale spatial variability dealt with species asso-ciated with seagrass meadows in a semi-enclosedMediterranean basin (Vizzini & Mazzola 2006).
The aim of our study was to analyze small-scale spa-tial variability of food partitioning between cultivatedoysters and associated wild sessile epibionts in anintertidal shellfish ecosystem, using a dual stable iso-tope approach (δ13C and δ15N). We included classicepibionts such as barnacles and serpulids and othercommon sessile suspension-feeders that were attachedto the rearing structures (ascidians and mussels), inaddition to terebellids living in soft sediments beneaththe oyster cultures.
MATERIALS AND METHODS
Study area. The Bay of Veys is located in the westernpart of the Bay of Seine within the eastern EnglishChannel (Fig. 1). The sandy subtidal area is approx.80 km2, with a tidal range of 8 m (macrotidal, semi-diurnal regime) during spring tides and a depth of<20 m at low tide. The area of oyster-rearing structures(3 km2) is located in the intertidal area (approx.40 km2), which is dominated by soft sediments withsome inclusions of hard substrata in the eastern part.
152
Oyster farm
2
2
3
3
3
3
3
3 4
4
44
43.
5
2
22
2
21.5
2
2.5
2.5
2.5
2.5 2.5
3.53.5
2.5
3.5
2.5
N
500 m
sampling point
oysters
Elevation (m, a.s.l.)
1
2
7
5
6
4
3
352000351000
193500192500
191500
350000
352000351000350000
Cap d'Antifer
Le Havre
CaenPort-en-Bessin
Cherbourg
30 m
30 m
Bay of Seine
Bay of Veys
20 km
NB
CarentanIsigny
Utah beach
Omaha beach
VireTa
ute
Grandcamp
Bay of Veys
0 m
0 m
5 m
5 m
10 m
10 m
N
3 kmIntertidal
Supratidal
Shellfish structures
C
France
A C
B
Fig. 1. (A) Location of the Bay of Veys on the northern French coast, (B) detail of the Bay of Veys (dashed lines: depth), (C) 7 sampling sites within the Bay of Veys. a.s.l.: above sea level. Coordinates in NTF (system) Lambert II (projection)

Dubois et al.: Food partitioning in suspension-feeders
This macrotidal estuary is characterized by inputs offreshwater coming mainly from the Vire river, whichcontributes an average discharge of 19 m3 s–1.
Sampling strategy. Oyster farming covers about3 km2 in the eastern intertidal part of the bay. Typi-cally, oysters are reared off-bottom in plastic culturebags on iron tables. Our sampling area was small com-pared with the whole estuarine ecosystem (Fig. 1). Atthis small scale, as defined by the oyster-culture struc-tures, 7 sampling sites were selected to span the widestextent of the structures. Sampling sites were deter-mined according to 2 environmental variables (Table 1):(1) elevation above sea level (a.s.l. i.e. above meanspring low water), which is directly related to the timeavailable for feeding, and (2) percentage of mud (par-ticles <65 µm) in the surface 10 cm of sediments, whichis directly correlated with local turbidity and benthicmicroalgal biomass (van de Koppel et al. 2001). Those2 parameters were of primary importance in spatialvariations in production of the oyster Crassostrea gigasin the same area (Costil et al. 2005), and were relatedto variations in δ13C and δ34S values of consumers in atidal flat estuary (Hsieh et al. 2002). All sites werelocated between +1.65 and +2.20 m a.s.l. except Site 7,which was +3.50 m (Table 1). Sites 1 and 2 were onhard substrata, and other sites were on soft-bottom.
Specimens from each selected site were collected inApril 2005 and included Pacific oysters Crassostreagigas and the main associated sessile epifauna, namelythe common mussel Mytilus edulis, the acorn barnacleElminius modestus, the polychaete tubeworm Pomato-ceros lamarcki, the polychaete sand mason worm Lan-ice conchilega and the sea squirt Ascidiella aspersa.Oysters were sampled from culture bags that had notbeen moved for at least 1 yr. Other epibionts, i.e. M.edulis, E. modestus, P. lamarcki and A. aspersa, werescraped from the plastic bags or oyster shells them-selves. Polychaetes were collected with a TASM corer(40 cm core depth; Ropert & Dauvin 2000) frombeneath the oyster bags. Occasionally, 1 or 2 speciesdid not occur at a sampling site (Table 1).
Owing to hydrodynamic advection, dispersion andsediment resuspension, suspension-feeders in thisintertidal ecosystem fed on a mixture of organic matteroriginating from 3 main point sources that are mixedby tides twice daily over the study area (Lundsgaard &Olesen 1996). First, marine water coming from theopen sea provided marine suspended particulate or-ganic matter (POM) that was mainly composed ofphytoplankton. Second, river inputs supplied sus-pended terrestrial organic matter (TOM) composed ofdetritus and freshwater microalgae. Third, wave andtidal action resuspended organic matter from the 2previous sources and from green macroalgae detritus(hereafter green algae Ulva sp.; ULV) and microphyto-benthos (MPB). Due to currents, marine and terrestrialwater bodies are well-mixed and hence assumed to behomogeneous in isotopic signatures with regard toboth POM and TOM. We assumed that sedimentedorganic matter that was resuspended each tide wasmostly located in a restricted area (around Site 4), ascorrelated with the percentage of mud (Table 1; seealso van de Koppel 2001). At this scale, isotopic signa-tures of ULV and MPB in sediments were assumed tobe spatially homogenous (Guest & Connolly 2004,Vizzini & Mazzola 2006). Therefore, potential mixturevariations in isotopic signatures over the study arearesulted from variations in the food source compositionof the mixture and not from spatial variation of the iso-topic signature of 1 food source.
Food resources were sampled every 2 mo for 1 yrbefore specimen collection. POM from marine and ter-restrial origins was sampled where these sources wereundiluted; POM was sampled by collecting water fromthe open sea (approx. 3 km from the oyster cultures) athigh tide and from 0.5 m below the surface; TOM wascollected from Vire river freshwater 2 km upstreamfrom the river mouth; MPB and ULV were sampledclose to Site 4 (Fig. 1C). MPB was collected by scrapingthe first several mm of sediments, followed by anextraction using density centrifugation in Ludox HS-40% (SPCI). ULV was composed of both fresh and
153
Site Coordinates Sediment Elevation (m a.s.l.) Mud O M S B T A
1 49° 23’ 29.0” N, 01° 04’ 50.7” W Hard substrate 1.75 ND + + + + – –2 49° 23’ 23.7” N, 01° 05’ 08.9” W Pebbles 1.70 5 + + + + + +3 49° 23’ 18.4” N, 01° 05’ 46.6” W Sand 1.65 2 + + + + + +4 49° 22’ 56.6” N, 01° 05’ 58.9” W Sandy mud 2.20 15 + + + + + +5 49° 22’ 11.1” N, 01° 06’ 05.3” W Sand 2.20 1 + + + + – + 6 49° 23’ 07.6” N, 01° 06’ 21.8” W Sand 2.20 1 + + + + + –
Table 1. Description of sampling sites within oyster farms in the Bay of Veys, and presence/absence (+/–) of co-occurring speciesat each site. Mud: mud particles (<65 µm) in surface 10 cm of sediments. O: oyster Crassostrea gigas, M: mussel Mytilus edulis,S: serpulid polychaete Pomatoceros lamarcki, B: barnacle Elminius modestus, T: terebellid polychaete Lanice conchilega,
A: ascidian Ascidiella aspersa. ND: no data. See Fig. 1 for locations
Mar Ecol Prog Ser 336: 151–160, 2007
freshly stranded leaves and collected was by hand.Annual means of food resource signatures were usedrather than time-specific values, because isotopic sig-natures of organisms’ tissues integrate information onassimilation of food over long time periods (Vanderklift& Ponsard 2003).
Preparation and analysis. Organisms were keptalive for 12 h in filtered seawater from the study area,to allow for evacuation of their gut contents. Next, oys-ters and mussels were removed from their calcareousshells, serpulid worms were extracted from their tube,and barnacles were dissected with the aid of a binocu-lar microscope to remove calcified wall-plates andappendages. Thus, no treatment with HCl was usedto remove carbonates in order to avoid significantchanges in δ15N isotopic composition (Kaehler &Pakhomov 2001). Subsequently, invertebrates werecarefully washed with distilled water, and whole indi-viduals were maintained at –80°C. Several studieshave shown that isotopic signature of different tissues(gonad, muscle, and bone) reflect diet over differenttime periods, depending on tissue turnover rate(Sarakinos et al. 2002). Thus, to reduce factors thatcomplicate explanation of variability, all tissues wereground together. For each site, individuals from thesame species were arbitrarily placed in 2 groups: eachgroup consisted of 10 individual oysters or mussels, 20individual ascidians or polychaetes, or 50 barnacles.For POM and TOM, water was filtered on precom-busted Whatman GF/F filters. Filters were freeze-dried, acidified with the vapour of 1M HCl to removecarbonates, and kept at –80°C until preparation foranalysis. MPB was extracted from sediment using themethod of Blanchard et al. (1988); ULV was collectedby hand and treated in the same manner as the inver-tebrates. Samples were then freeze-dried and groundto powder with a pestle and mortar.
Approximately 1 mg of invertebrate sample (2 ana-lytical replicates) and 10 mg of food-source sample (4analytical replicates) were used for continuous flowisotope ratio spectrometry (CF-IRMS) analysis using aEuropa Scientific ANCA-NT 20-20 Stable IsotopeAnalyser with ANCA-NT Solid/Liquid PreparationModule (Europa Scientific). The analytical precision(SD, n = 5) was 0.2‰ for both N and C, as estimatedfrom standards analysed along with the samples.Working standards were 1 mg leucine prepared byfreeze-drying 50 µl of a 20 mg ml–1 stock solution intin cups, and calibrated against ‘Europa flour’ andInternational Atomic Energy Agency (IAEA) standardsN1 and N2. Carbon and nitrogen stable isotopicratios were expressed in δ notation according thefollowing equation:
δX(‰) = [(Rsample ÷ Rstandard) – 1] × 103 (1)
where X is 13C or 15N and R is the ratio 13C/12C or15N/14N. Standards used were Pee-Dee Belemnite(PDB) for carbon and atmospheric N2 for nitrogen.
Contribution of food resources to organisms’ diets.As a quantitative approach to estimating the relativecontribution of food sources to organisms’ diets, we useda dual isotope, 4-source mixing model (IsoSource,Phillips & Gregg 2003); this model provided the range ofpossible source contributions to a diet when there are toomany sources to allow a unique solution. As is usual forstudies dealing with food source contributions, fraction-ation—i.e. step-wise enrichment in 13C and 15N at eachtrophic level—was considered here to be consistent foreach species and equal to 1‰ and 3.5‰ per trophiclevel, respectively (e.g. Deegan & Garritt 1997, Kaehleret al. 2000, Kharlamenko et al. 2001, Hsieh et al. 2002,Riera et al. 2002). The mixing model software IsoSourcewas used to calculate all possible combinations of sourceproportions that sum to 100% using a specified incre-ment of 1% (after Benstead et al. 2006). Predicted iso-tope values of mixtures (i.e. organisms) were computedusing linear mixing model equations that preserve massbalance. All combinations that matched within a speci-fied tolerance of 0.1% were averaged to representmeans of source proportions.
Data analyses. Mantel analyses were performed totest for spatial differences in stable isotopic signaturesamong sampling sites (Fortin & Gurevitch 2001). Thesenon-parametric tests are most appropriate when dataare spatially auto-correlated; the tests are based ondistance matrices and permutation tests, and areused to detect the presence of inherent spatial auto-correlation and to distinguish the effects of measuredenvironmental conditions (i.e. elevation and percent-age of mud in sediment) from other spatial effects. A4-matrix Mantel test was performed to examine rela-tionships between: (1) the variable distance matrix Athat contains the differences in isotopic signaturesamong the 7 stations, (2) the distance matrix B thatcontains the Euclidian spatial distances among the 7stations, and (3) 2 environmental-condition distancematrices that contain the differences between all pairsof data in elevation (matrix C) and mud content (matrixD). Before the normalized Mantel statistic r was com-puted, each distance matrix was first standardizedindividually by subtracting the mean of all elements inthe matrix from each observation and then dividingby the SD (Fortin & Gurevitch 2001). For instance, rAB
was calculated by summing the cross products of thestandardized (std) matrices A and B divided by n – 1:
for i ≠ j (2)
The reference distribution was established by ran-domly shuffling the elements of the distance matrix B
rstdA stdB
n 1i 1
nij ijj 1
n
=−
= =∑ ∑
154
Dubois et al.: Food partitioning in suspension-feeders
1000 times. The significance of the observed Mantel rstatistic was obtained by estimating the number oftimes that values of the reference distribution weresmaller or greater than the Mantel statistic of theactual data, under the null hypothesis that the ob-served spatial variation could have been obtained byany random arrangement in space within the entiresampling area. These tests were performed with algo-rithms computed using Matlab 7.
In all statistical tests, a significance level of p < 0.01was used to ensure a level of detection superior to theanalytical precision (0.2‰).
RESULTS
Inter-and intraspecific variations in isotopic signatures
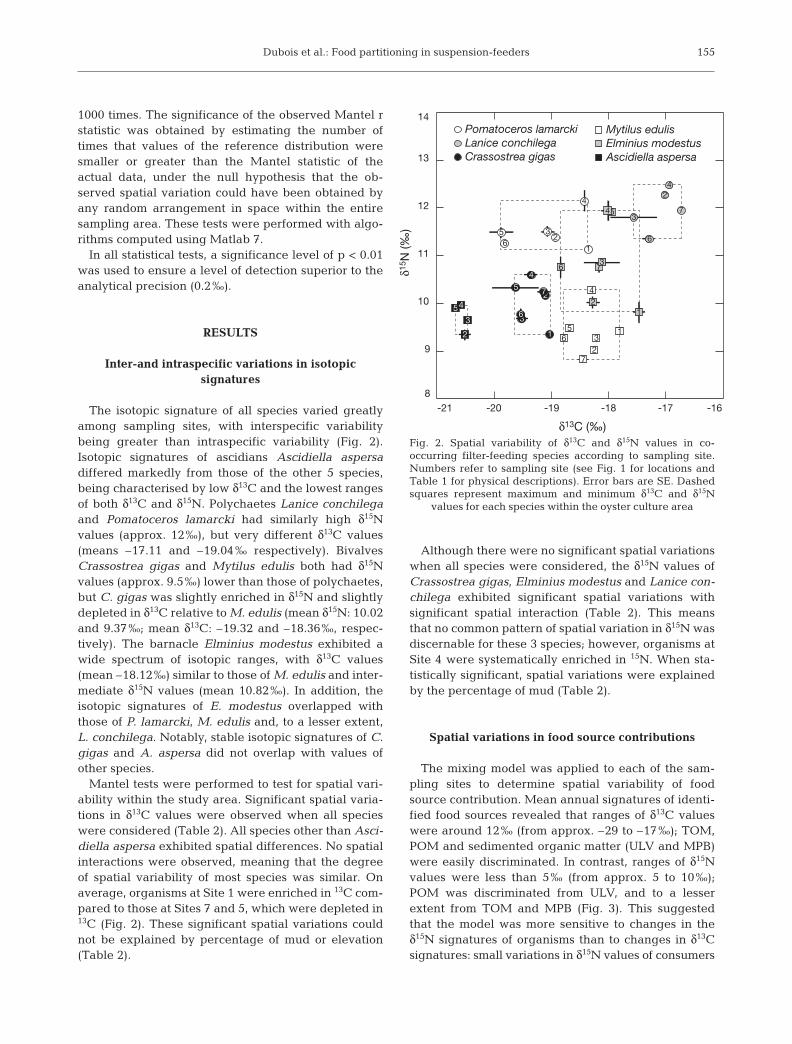
The isotopic signature of all species varied greatlyamong sampling sites, with interspecific variabilitybeing greater than intraspecific variability (Fig. 2).Isotopic signatures of ascidians Ascidiella aspersadiffered markedly from those of the other 5 species,being characterised by low δ13C and the lowest rangesof both δ13C and δ15N. Polychaetes Lanice conchilegaand Pomatoceros lamarcki had similarly high δ15Nvalues (approx. 12‰), but very different δ13C values(means –17.11 and –19.04‰ respectively). BivalvesCrassostrea gigas and Mytilus edulis both had δ15Nvalues (approx. 9.5‰) lower than those of polychaetes,but C. gigas was slightly enriched in δ15N and slightlydepleted in δ13C relative to M. edulis (mean δ15N: 10.02and 9.37‰; mean δ13C: –19.32 and –18.36‰, respec-tively). The barnacle Elminius modestus exhibited awide spectrum of isotopic ranges, with δ13C values(mean –18.12‰) similar to those of M. edulis and inter-mediate δ15N values (mean 10.82‰). In addition, theisotopic signatures of E. modestus overlapped withthose of P. lamarcki, M. edulis and, to a lesser extent,L. conchilega. Notably, stable isotopic signatures of C.gigas and A. aspersa did not overlap with values ofother species.
Mantel tests were performed to test for spatial vari-ability within the study area. Significant spatial varia-tions in δ13C values were observed when all specieswere considered (Table 2). All species other than Asci-diella aspersa exhibited spatial differences. No spatialinteractions were observed, meaning that the degreeof spatial variability of most species was similar. Onaverage, organisms at Site 1 were enriched in 13C com-pared to those at Sites 7 and 5, which were depleted in13C (Fig. 2). These significant spatial variations couldnot be explained by percentage of mud or elevation(Table 2).
Although there were no significant spatial variationswhen all species were considered, the δ15N values ofCrassostrea gigas, Elminius modestus and Lanice con-chilega exhibited significant spatial variations withsignificant spatial interaction (Table 2). This meansthat no common pattern of spatial variation in δ15N wasdiscernable for these 3 species; however, organisms atSite 4 were systematically enriched in 15N. When sta-tistically significant, spatial variations were explainedby the percentage of mud (Table 2).
Spatial variations in food source contributions
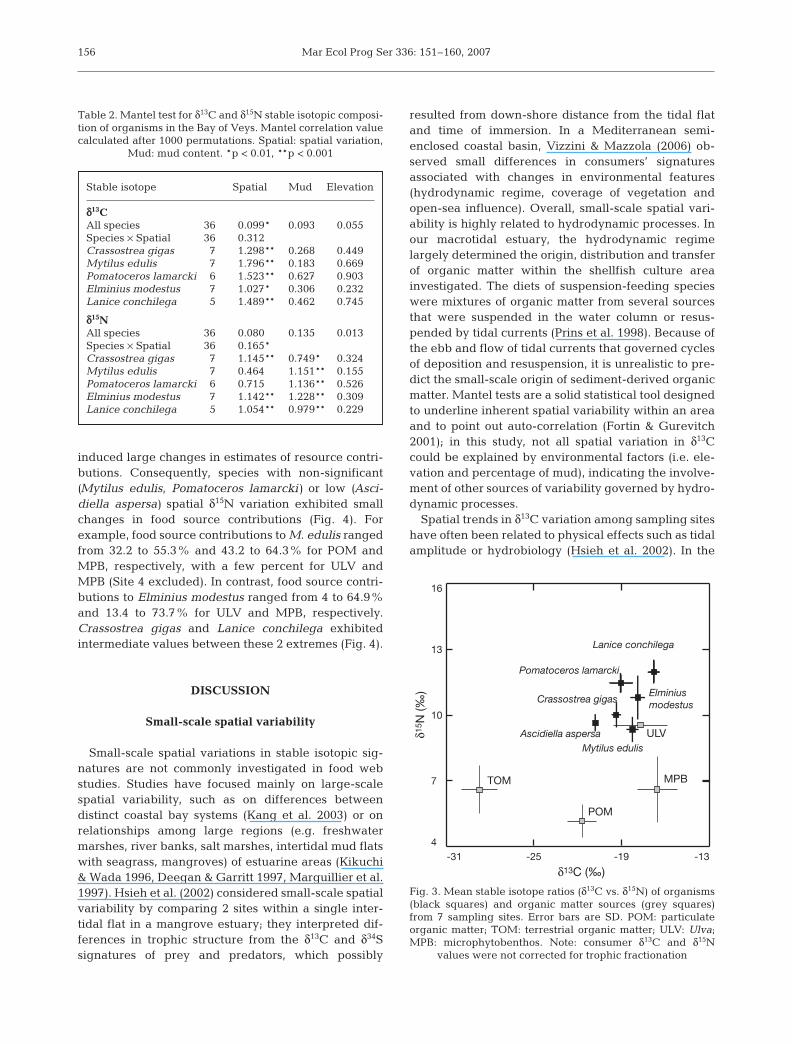
The mixing model was applied to each of the sam-pling sites to determine spatial variability of foodsource contribution. Mean annual signatures of identi-fied food sources revealed that ranges of δ13C valueswere around 12‰ (from approx. –29 to –17‰); TOM,POM and sedimented organic matter (ULV and MPB)were easily discriminated. In contrast, ranges of δ15Nvalues were less than 5‰ (from approx. 5 to 10‰);POM was discriminated from ULV, and to a lesserextent from TOM and MPB (Fig. 3). This suggestedthat the model was more sensitive to changes in theδ15N signatures of organisms than to changes in δ13Csignatures: small variations in δ15N values of consumers
155
-21 -20 -19 -18 -17 -168
10
11
13
9
12
14Pomatoceros lamarckiLanice conchilegaCrassostrea gigas
Mytilus edulisElminius modestusAscidiella aspersa
2
2
3
4
7
6
2
3
4
7
61
3
4
6
52
1
3
4
65
5
76
4
3
21
5
76
4
3
21
5
7
6
4
3
2
15
7
6
4
32
11
2
3
4
7
6
5
1
2
3
4
7
6
5
5 4
3
2
54
3
2
δ15N
(‰)
δ13C (‰)Fig. 2. Spatial variability of δ13C and δ15N values in co-occurring filter-feeding species according to sampling site.Numbers refer to sampling site (see Fig. 1 for locations andTable 1 for physical descriptions). Error bars are SE. Dashedsquares represent maximum and minimum δ13C and δ15N
values for each species within the oyster culture area
Mar Ecol Prog Ser 336: 151–160, 2007
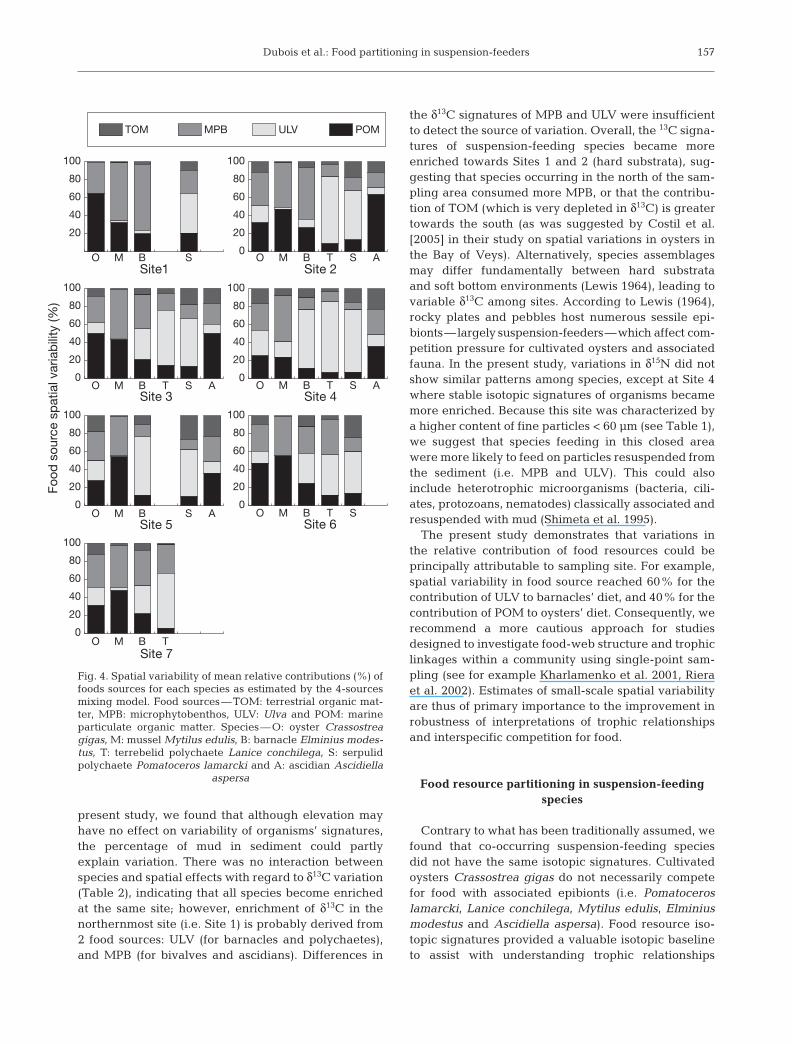
induced large changes in estimates of resource contri-butions. Consequently, species with non-significant(Mytilus edulis, Pomatoceros lamarcki) or low (Asci-diella aspersa) spatial δ15N variation exhibited smallchanges in food source contributions (Fig. 4). Forexample, food source contributions to M. edulis rangedfrom 32.2 to 55.3% and 43.2 to 64.3% for POM andMPB, respectively, with a few percent for ULV andMPB (Site 4 excluded). In contrast, food source contri-butions to Elminius modestus ranged from 4 to 64.9%and 13.4 to 73.7% for ULV and MPB, respectively.Crassostrea gigas and Lanice conchilega exhibitedintermediate values between these 2 extremes (Fig. 4).
DISCUSSION
Small-scale spatial variability
Small-scale spatial variations in stable isotopic sig-natures are not commonly investigated in food webstudies. Studies have focused mainly on large-scalespatial variability, such as on differences betweendistinct coastal bay systems (Kang et al. 2003) or onrelationships among large regions (e.g. freshwatermarshes, river banks, salt marshes, intertidal mud flatswith seagrass, mangroves) of estuarine areas (Kikuchi& Wada 1996, Deegan & Garritt 1997, Marguillier et al.1997). Hsieh et al. (2002) considered small-scale spatialvariability by comparing 2 sites within a single inter-tidal flat in a mangrove estuary; they interpreted dif-ferences in trophic structure from the δ13C and δ34Ssignatures of prey and predators, which possibly
resulted from down-shore distance from the tidal flatand time of immersion. In a Mediterranean semi-enclosed coastal basin, Vizzini & Mazzola (2006) ob-served small differences in consumers’ signaturesassociated with changes in environmental features(hydrodynamic regime, coverage of vegetation andopen-sea influence). Overall, small-scale spatial vari-ability is highly related to hydrodynamic processes. Inour macrotidal estuary, the hydrodynamic regimelargely determined the origin, distribution and transferof organic matter within the shellfish culture areainvestigated. The diets of suspension-feeding specieswere mixtures of organic matter from several sourcesthat were suspended in the water column or resus-pended by tidal currents (Prins et al. 1998). Because ofthe ebb and flow of tidal currents that governed cyclesof deposition and resuspension, it is unrealistic to pre-dict the small-scale origin of sediment-derived organicmatter. Mantel tests are a solid statistical tool designedto underline inherent spatial variability within an areaand to point out auto-correlation (Fortin & Gurevitch2001); in this study, not all spatial variation in δ13Ccould be explained by environmental factors (i.e. ele-vation and percentage of mud), indicating the involve-ment of other sources of variability governed by hydro-dynamic processes.
Spatial trends in δ13C variation among sampling siteshave often been related to physical effects such as tidalamplitude or hydrobiology (Hsieh et al. 2002). In the
156
-31 -25 -19 -134
7
10
13
16
δ15 N
(‰)
δ13C (‰)
TOM
POM
ULV
MPB
Crassostrea gigas
Pomatoceros lamarcki
Mytilus edulisAscidiella aspersa
Lanice conchilega
Elminiusmodestus
Fig. 3. Mean stable isotope ratios (δ13C vs. δ15N) of organisms(black squares) and organic matter sources (grey squares)from 7 sampling sites. Error bars are SD. POM: particulateorganic matter; TOM: terrestrial organic matter; ULV: Ulva;MPB: microphytobenthos. Note: consumer δ13C and δ15N
values were not corrected for trophic fractionation
Stable isotope Spatial Mud Elevation
δδ13CAll species 36 0.099* 0.093 0.055 Species × Spatial 36 0.312 Crassostrea gigas 7 1.298** 0.268 0.449 Mytilus edulis 7 1.796** 0.183 0.669 Pomatoceros lamarcki 6 1.523** 0.627 0.903 Elminius modestus 7 1.027* 0.306 0.232 Lanice conchilega 5 1.489** 0.462 0.745
δδ15NAll species 36 0.080 0.135 0.013 Species × Spatial 36 0.165* Crassostrea gigas 7 1.145** 0.749* 0.324Mytilus edulis 7 0.464 1.151** 0.155Pomatoceros lamarcki 6 0.715 1.136** 0.526Elminius modestus 7 1.142** 1.228** 0.309Lanice conchilega 5 1.054** 0.979** 0.229
Table 2. Mantel test for δ13C and δ15N stable isotopic composi-tion of organisms in the Bay of Veys. Mantel correlation valuecalculated after 1000 permutations. Spatial: spatial variation,
Mud: mud content. *p < 0.01, **p < 0.001
Dubois et al.: Food partitioning in suspension-feeders
present study, we found that although elevation mayhave no effect on variability of organisms’ signatures,the percentage of mud in sediment could partlyexplain variation. There was no interaction betweenspecies and spatial effects with regard to δ13C variation(Table 2), indicating that all species become enrichedat the same site; however, enrichment of δ13C in thenorthernmost site (i.e. Site 1) is probably derived from2 food sources: ULV (for barnacles and polychaetes),and MPB (for bivalves and ascidians). Differences in
the δ13C signatures of MPB and ULV were insufficientto detect the source of variation. Overall, the 13C signa-tures of suspension-feeding species became moreenriched towards Sites 1 and 2 (hard substrata), sug-gesting that species occurring in the north of the sam-pling area consumed more MPB, or that the contribu-tion of TOM (which is very depleted in δ13C) is greatertowards the south (as was suggested by Costil et al.[2005] in their study on spatial variations in oysters inthe Bay of Veys). Alternatively, species assemblagesmay differ fundamentally between hard substrataand soft bottom environments (Lewis 1964), leading tovariable δ13C among sites. According to Lewis (1964),rocky plates and pebbles host numerous sessile epi-bionts—largely suspension-feeders—which affect com-petition pressure for cultivated oysters and associatedfauna. In the present study, variations in δ15N did notshow similar patterns among species, except at Site 4where stable isotopic signatures of organisms becamemore enriched. Because this site was characterized bya higher content of fine particles < 60 µm (see Table 1),we suggest that species feeding in this closed areawere more likely to feed on particles resuspended fromthe sediment (i.e. MPB and ULV). This could alsoinclude heterotrophic microorganisms (bacteria, cili-ates, protozoans, nematodes) classically associated andresuspended with mud (Shimeta et al. 1995).
The present study demonstrates that variations inthe relative contribution of food resources could beprincipally attributable to sampling site. For example,spatial variability in food source reached 60% for thecontribution of ULV to barnacles’ diet, and 40% for thecontribution of POM to oysters’ diet. Consequently, werecommend a more cautious approach for studiesdesigned to investigate food-web structure and trophiclinkages within a community using single-point sam-pling (see for example Kharlamenko et al. 2001, Rieraet al. 2002). Estimates of small-scale spatial variabilityare thus of primary importance to the improvement inrobustness of interpretations of trophic relationshipsand interspecific competition for food.
Food resource partitioning in suspension-feedingspecies
Contrary to what has been traditionally assumed, wefound that co-occurring suspension-feeding speciesdid not have the same isotopic signatures. Cultivatedoysters Crassostrea gigas do not necessarily competefor food with associated epibionts (i.e. Pomatoceroslamarcki, Lanice conchilega, Mytilus edulis, Elminiusmodestus and Ascidiella aspersa). Food resource iso-topic signatures provided a valuable isotopic baselineto assist with understanding trophic relationships
157
TOM
Food
sou
rce
spat
ial v
aria
bili
ty (%
)
MPB ULV POM
20
40
60
80
100
Site1
0
20
40
60
80
100
ASTBMOSBMO
ASTBMO
STBMOASBMO
ASTBMO
TBMO
Site 2
0
20
40
60
80
100
Site 3
0
20
40
60
80
100
Site 4
0
20
40
60
80
100
Site 6
0
20
40
60
80
100
Site 7
0
20
40
60
80
100
Site 5
Fig. 4. Spatial variability of mean relative contributions (%) offoods sources for each species as estimated by the 4-sourcesmixing model. Food sources—TOM: terrestrial organic mat-ter, MPB: microphytobenthos, ULV: Ulva and POM: marineparticulate organic matter. Species—O: oyster Crassostreagigas, M: mussel Mytilus edulis, B: barnacle Elminius modes-tus, T: terrebelid polychaete Lanice conchilega, S: serpulidpolychaete Pomatoceros lamarcki and A: ascidian Ascidiella
aspersa
Mar Ecol Prog Ser 336: 151–160, 2007
among organisms in this system (Post 2002). POM andMPB may support large parts of the diets of cultivatedand wild suspension-feeders, especially bivalves andascidians. In addition, ULV made extremely variablecontributions to suspension-feeders’ diets, contributingmore to the diets of polychaetes and barnacles asrevealed by these species’ high δ15N values. Contraryto other selected food resources, TOM did not con-tribute greatly to the diets of suspension-feedingspecies; however, the contribution of TOM was lessvariable than that of other food sources.
In shellfish estuaries, both terrestrial and marineorganic matter, along with macroalgae and MPB, areclassically recognized as the main food sources forsuspension-feedings species (Riera & Richard 1997,Riera 1998 and references therein). It is well knownthat marine phytoplankton contributes to suspension-feeders’ diets; for example, in Marennes-Oléron Bay(French Atlantic coast), it was revealed that 70% oftotal annual cockle production originated from MPBsources (Sauriau & Kang 2000). However, the contribu-tion of MPB is still debated (Kang et al. 2003). The con-tributions of TOM to suspension-feeders’ diets arereported to be highly variable. Isotopic approacheshave proven the importance of organic matter fromterrigenous sources to suspension-feeders in largeestuaries on the Atlantic coast, such as Marennes-Oléron Bay (Riera & Richard 1997). In contrast, con-sumer dependence on riverine TOM was minimal inthe Plum Island Sound estuary (USA) (Deegan & Gar-ritt 1997). In our macrotidal estuary, moderate fresh-water inputs are largely overpowered during hightides, and TOM did not appear to contribute greatly tothe diets of oysters and other suspension-feeders. Ourδ15N results also demonstrated that, despite being ofunequal importance, contributions of green algal tothe diets of suspension-feeding species (shown by theexample of Ulva sp.) could not be excluded. This wasshown especially for polychaetes Lanice conchilegaand Pomatoceros lamarcki and the barnacle Elminiusmodestus. In coastal ecosystems, a significant fractionof macroalgal biomass is dislodged and fragmented bycurrents and waves before being integrated in sedi-ments. Macroalgal fragments may thus enter coastalfood webs through different pathways, for examplethrough detrital food chains, as shown in Marenne-Oléron Bay (Riera 1998) and in Possyet Bay, Russia(Kharlamenko et al. 2001).
Quantitative estimates via the 4-sources mixingmodel (Philipps & Gregg 2003) should be interpretedcautiously. Indeed, Moseman et al. (2004) recentlypointed out that in estuarine environments, the num-ber of potential primary producers contributing to thefood web is often greater than expected, and that themore potential sources of food, the greater the uncer-
tainty in determining which sources make importantcontributions to a diet. In this regard, mathematicalsolutions of the mixing model are not always biologi-cally relevant; consumers’ isotopic signatures that canbe identified by 4 sources will always have a solutionthat involves 4 food items, even if a solution can befound with only 3 of them. In this study, bivalves andascidians fed only on TOM, POM and MPB, but thecontribution of ULV could not be excluded for barna-cles and polychaetes on the basis of δ15N values.Therefore, quantitative estimates of ULV contributionsfor bivalves and ascidians should be considered cau-tiously. In addition, we demonstrated that ranges ofδ15N (from approx. 5‰ for POM to 10‰ for ULV) weremuch smaller than ranges of δ13C (from approx. –29‰for TOM to 17‰ for ULV or MPB). Consequently, smallvariations in consumers’ δ15N values induced largevariations in estimates of ULV contribution, whereasestimates of POM and MPB contributions remainedless sensitive. Estimates using the mixing model arealso limited by fractionation values; although step-wiseenrichment in 13C and 15N at each trophic level is gen-erally assumed to be consistent among species (e.g.Deegan & Garritt 1997, Kaehler et al. 2000, Kharla-menko et al. 2001, Hsieh et al. 2002, Riera et al. 2002),it is increasingly considered to be a potential source ofvariation when determining sources of nutrition andtrophic relationships (Vander Zanden & Rasmussen2001, Vanderklift & Ponsard 2003).
Feeding processes and isotopic signatures
The studied species exhibited differences in intra-and interspecific variability, even though they allbelonged to the same feeding guild; thus, severalsuspension-feeding species can potentially utilize thesame food resources without having similar isotopicsignatures by consuming the food items in differentproportions. Our isotopic results support the concept ofsmall-scale trophic plasticity of suspension-feedingspecies. Trophic plasticity is a common mechanism inconsumers, which allows them to adapt to environ-mental availability of food items (Pinnegar & Polunin2000). This was recently demonstrated at a similarscale to that of the present study in a semi-enclosedMediterranean basin for fish species associated withseagrass meadows (Vizzini & Mazzola 2006). Therewas an obvious contrast between the intraspecific vari-ability of the barnacle Elminius modestus and that ofthe ascidian Ascidiella aspersa, whereas other suspen-sion feeders exhibited intermediate intraspecific rangesin δ13C and δ15N. The limited intraspecific variabilityof ascidian signatures suggested that A. aspersa isless capable of trophic plasticity (thus tending to be atrophic specialist) than other suspension feeding
158
Dubois et al.: Food partitioning in suspension-feeders
species such as E. modestus (trophic generalist). So,regardless of sampling site or composition of availablefood resource, the ascidian exhibited the same isotopicsignature; in contrast, the signature of the barnaclewas dependent on sampling site.
Even if all 6 species belong to the same suspension-feeding guild, ecophysiological studies on suspension-feeders have emphasized that there are great differ-ences in filtration rates and in retention efficiencies(see review by Riisgård & Larsen 2000); ascidians andbivalves are active suspension-feeders, extracting par-ticles from the water with bands of active cilia,whereas polychaetes and barnacles do not activelypump water through a filter. For instance, the greattrophic plasticity of the barnacle E. modestus mayresult from their feeding mechanism: specifically,extension of feather-like legs (cirri) into the ambientflow allows them to feed on large motile particles suchas Artemia nauplii as well as on small particles (Pullen& LaBarbera 1991). Thus, we suggest that the barnaclepopulation showed a large degree of intraspecific vari-ability because it was composed of generalist indi-viduals all consuming a wide range of food items (Bol-nick et al. 2003). Intraspecific variability in barnacles’isotopic signature was closely related to spatial vari-ability of food resources, because barnacles do notpossess any particle selection mechanism.
The consistent signature of ascidians, which likewisedo not select particles (instead trapping particles on acontinually-produced mucus net, Petersen et al. 1997),did not support the same interpretation. We proposethat ascidians do not feed continuously when sub-merged. In our intertidal estuarine bay, resuspension ofinorganic particles from the sediment, owing to highvelocity currents during ebb or flow tide, generateshigh concentrations in the water column that are knownto interfere with the feeding activity of suspension-feeding species in general (e.g. Hawkins et al. 1996). Itis likely that ascidians could be more affected by theseconditions than other species, and that they filter-feedin the water column only around high tide when hydro-dynamic conditions are most stable, thereby consuminglower amounts of inorganic particles. A good exampleof trophic plasticity is given through comparison ofoysters with mussels: both species have very closedfeeding processes and a capacity for particle selection(Riisgård & Larsen 2000). Oysters exhibited larger spa-tial variations in isotopic signatures than did mussels.Both species fed on the same mixture, but oysters ap-peared to be capable of greater trophic plasticity thandid mussels, for which MPB and POM almost exclu-sively contributed to the diet at all sampling sites.
Unexpectedly, both serpulid and terebellid poly-chaete species probably fed on Ulva fragments. Thetubiculous terebellid Lanice conchilega colonized soft-
sediments underneath oyster tables. Its sand tube pro-trudes above the sediment surface by a few centime-tres (Ropert & Dauvin 2000); thus, it could have easilyaccessed both MPB and green macroalgae fragmentsthat were resuspended. Particles are collected throughfunnel-shaped tentacular filaments. In contrast tospecimens colonizing the sediment, worms adhering tooyster shells at about 30 to 40 cm above the sedimenthad consumed lower proportions of MPB, as suggestedby more depleted δ13C values.
CONCLUSIONS
The diets of suspension-feeding species that inhabitintertidal areas were largely dependent on the natureand quantity of the organic particles transported andresuspended by the flood tide during immersion. Ouranalysis of small-scale spatial variability in the isotopiccomposition of suspension-feeding species provided abroader perspective for the determination of dietaryoverlap and potential competition for food betweenspecies. We demonstrated that cultivated and wild sus-pension-feeders do not necessary compete for food,and that feeding mechanisms are of fundamentalimportance in understanding the partioning of foodresources and dietary overlap of co-occurring species.We also provided evidence that a sampling designcapturing only an instantaneous snapshot of stableisotopic signatures could lead to the misinterpretationof interspecific trophic relationships in an ecosystem.
Acknowledgements. This study was supported by a post-graduate fellowship funded by the regional council of BasseNormandie within the POMOYSTER program financed byDirection Régionale de l’Environnement (DIREN), Agence del’eau and Direction Régionale des Affaires Maritimes (DRAM).We are grateful to Dr. C. M. Scrimgeour and M. P. Batailléfor technical assistance with stable isotope analysis andE. Leroullier for assistance with laboratory preparation. Weacknowledge Dr. J. E. Purcell and Dr. S. M. Gaudron for Eng-lish corrections. Thanks are due to 3 anonymous referees forhelpful comments.
LITERATURE CITED
Benstead JP, March JG, Fry B, Ewel, KC, Pringle CM (2006)Testing isosource: stable isotope analysis of a tropical fisherywith diverse organic matter sources. Ecology 87:326–333
Blanchard G, Chrétiennot-Dinet MJ, Dinet A, Robert JM(1988) Méthode simplifiée pour l’extraction du micro-phytobenthos des sédiments marins par le gel de siliceLudox. CR Biol 307:569–576
Bolnick D, Svanback R, Fordyce J, Yang L, Davis J, Hulsey C,Forister C (2003) The ecology of individuals: incidenceand implications of individuals specialization. Am Nat161:1–28
Costil K, Royer J, Ropert M, Soletchnik P, Mathieu M (2005)
159
Mar Ecol Prog Ser 336: 151–160, 2007
Spatio-temporal variations in biological performances andsummer mortality of the Pacific oyster Crassostrea gigas inNormandy (France). Helgol Mar Res 59:286–300
Crawford CM, Macleod CKA, Mitchell IM (2003) Effects ofshellfish farming on the benthic environment. Aquacul-ture 224:117–140
Deegan LA, Garritt RH (1997) Evidence for spatial variabilityin estuarine food webs. Mar Ecol Prog Ser 147:31–47
DeNiro MJ, Epstein S (1978) Influence of diet on the distribu-tion of carbon isotopes in animals. Geochim CosmochimActa 42:495–506
Fortin MJ, Gurevitch J (2001) Mantel tests: spatial structure infield experiments. In: Scheiner SM, Gurevitch J (eds)Design and analysis of ecological experiments. OxfordUniversity Press, New York, p 308–326
Fry B (2006) Stable isotope ecology. Springer, HeidelbergGuest MA, Connolly RM (2004) Fine-scale movement and
assimilation of carbon in saltmarsh and mangrove habitatby resident animals. Aquat Ecol 38:599–609
Hawkins AJS, Smith RFM, Bayne BL, Heral M (1996) Novelobservations underlying the fast growth of suspension-feeding shellfish in turbid environments: Mytilus edulis.Mar Ecol Prog Ser 131:179–190
Hsieh HL, Kao WY, Chen CP, Liu PJ (2000) Detrital flowsthrough the feeding pathway of the oyster Crassostreagigas in a tropical shallow lagoon: δ13C signals. Mar Biol136:677–684
Hsieh HL, Chen CP, Chen YG, Yang HH (2002) Diversity ofbenthic organic matter flows through polychaetes andcrabs in a mangrove estuary: δ13C and δ34S signals. MarEcol Prog Ser 227:145–155
Kaehler S, Pakhomov EA (2001) Effects of storage and preser-vation on the δ13C and δ15N signatures of selected marineorganisms. Mar Ecol Prog Ser 219:299–304
Kaehler S, Pakhomov EA, McQuaid CD (2000) Trophic struc-ture of the marine food web at the Prince Edward Islands(Southern Ocean) determined by δ13C and δ15N analysis.Mar Ecol Prog Ser 208:13–20
Kang CK, Kim JB, Lee KS, Lee PY, Hong JS (2003) Trophicimportance of benthic microalgae to macrozoobenthos incoastal bay systems in Korea: dual stable C and N isotopeanalyses. Mar Ecol Prog Ser 259:79–92
Kharlamenko VI, Kiyashko SI, Imbs AB, Vyshkvartzev DI(2001) Identification of food sources of invertebrates fromthe seagrass Zostera marina community using carbon andsulfur stable isotope ratio and fatty acid analyses. Mar EcolProg Ser 220:103–117
Kikuchi E, Wada E (1996) Carbon and nitrogen stable isotoperatios of deposit-feeding polychaetes in the NanakitaRiver Estuary, Japan. Hydrobiologia 321:69–75
Lesser MP, Shumway SE, Cucci T, Smith J (1992) Impact offouling organisms on mussel rope culture: interspecificcompetition for food among suspension-feeding inverte-brates. J Exp Mar Biol Ecol 165:91–102
Lewis JR (1964) The ecology of rocky shores. English Univer-sity Press, London
Lundsgaard C, Olesen M (1996) The origin of sedimentingdetrital matter in a coastal system. Limnol Oceanogr 42:1001–1005
Marguillier S, van der Velde G, Dehairs F, Hemminga MA,Rajagopal S (1997) Trophic relationships in an interlinkedmangrove-seagrass ecosystem as traced by δ13C and δ15N.Mar Ecol Prog Ser 151:115–121
Moseman SM, Levin LA, Currin C, Forder C (2004) Coloniza-tion, succession, and nutrition of macrobenthic assem-blages in a restored wetland at Tijuana Estuary, Califor-nia. Estuar Coast Shelf Sci 60:755–770
Petersen JK, Schou O, Thor P (1997) In situ growth of the ascid-ian Ciona intestinalis (L.) and the blue mussel Mytilus edulisin an eelgrass meadow. J Exp Mar Biol Ecol 218:1–11
Phillips DL, Gregg JW (2003) Source partitioning using stableisotopes: coping with too many sources. Oecologia 136:261–269
Pinnegar JK, Polunin NVC (2000) Contributions of stable-iso-tope data to elucidating food webs of Mediterraneanrocky littoral fishes. Oecologia 122:399–409
Post DM (2002) Using stable isotopes to estimate trophic posi-tion: models, methods, and assumptions. Ecology 83:703–718
Prins TC, Smaal AC, Dame RF (1998) A review of feedbacksbetween bivalve grazing and ecosystem processes. AquatEcol 31:349–359
Pullen J, LaBarbera M (1991) Modes of feeding in aggrega-tions of barnacles and the shape of aggregations. Biol Bull(Woods Hole) 181:442–452
Riera P (1998) δ15N of organic matter sources and benthicinvertebrates along an estuarine gradient in Marennes-Oléron bay (France): implications for the study of trophicstructure. Mar Ecol Prog Ser 166:143–150
Riera P, Richard P (1996) Isotopic determination of foodsources of Crassostrea gigas along a trophic gradient inthe estuarine Bay of Marennes-Oléron. Estuar Coast ShelfSci 42:347–360
Riera P, Richard P (1997) Temporal variation of δ13C in partic-ulate organic matter and oyster Crassostrea gigas inMarennes-Oléron Bay (France): effect of freshwater inflow.Mar Ecol Prog Ser 147:105–115
Riera P, Stal LJ, Nieuwenhuize J (2002) δ13C versus δ15N of co-occurring molluscs within a community dominated byCrassostrea gigas and Crepidula fornicata (Oosterschelde,The Netherlands). Mar Ecol Prog Ser 240:291–295
Riisgård HU, Larsen PS (2000) Comparative ecophysiology ofactive zoobenthic filter feeding, essence of current knowl-edge. J Sea Res 44:169–193
Rolff C (2000) Seasonal variation in δ13C and δ15N of size-frac-tionated plankton at a coastal station in the northern Balticproper. Mar Ecol Prog Ser 203:47–65
Ropert M, Dauvin JC (2000) Renewal and accumulation of aLanice conchilega (Pallas) population in the baie des Veys,western Bay of Seine. Oceanol Acta 23:529–546
Sarakinos HC, Johnson ML, Vander Zanden MJ (2002) A syn-thesis of tissue-preservation effects on carbon and nitro-gen stable isotope signatures. Can J Zool 80:381–387
Sauriau PG, Kang CK (2000) Stable isotope evidence of ben-thic microalgae-based growth and secondary productionin the suspension feeder Cerastoderma edule (Mollusca,Bivalvia) in the Marennes-Oléron Bay. Hydrobiologia 440:317–329
Shimeta J, Jumars PA, Lessard EJ (1995) Influences of turbu-lence on resuspension feeding by planktonic protozoa;experiments in laminar shear fields. Limnol Oceanogr 40:845–859
van de Koppel J, Herman PMJ, Thoolen P, Heip CHR (2001)Do alternate stable states occur in natural ecosystems?Evidence from a tidal flat. Ecology 82:3449–3461
Vander Zanden MJ, Rasmussen JB (2001) Variation in δ15Nand δ13C trophic fractionation: implications for aquaticfood web studies. Limnol Oceanogr 46:2061–2066
Vanderklift MA, Ponsard S (2003) Sources of variation in con-sumer-diet δ15N enrichment: a meta-analysis. Oecologia136:169–182
Vizzini S, Mazzola A (2006) Sources and transfer of organicmatter in food webs of a Mediterranean coastal environ-ment: evidence for spatial variability. Estuar Coast ShelfSci 66:459–467
160
Editorial responsibility: Otto Kinne (Editor-in-Chief),Oldendorf/Luhe, Germany
Submitted: February 17, 2006; Accepted: July 28, 2006Proofs received from author(s): April 9, 2007
Copyright © 2022 FDOKUMEN