SLatin America and the Caribbean, - Technical Departnlent
174
SLatin America and the Caribbean, - Technical Departnlent Regional Studies Program. Report No. 18 Private Financing of Higher Education in Latin America and the Caribbean by Sam Carison Human Resources Division July 1992 Papers in this series are not formal publications of the World Bank. They present preliminary and unpolished results of country analysis or research that is circulated to encourage discussion and comment; any citation and the use of this paper should take vecount of its provisional character. The .iodings, interpretations, and conclusions expressed in this paper are entirely those of the author(s) and should not be attributed in any manner to the World Bank, its affiliated organizations, members of its Board of Executive Directors or the countries they represent. Public Disclosure Authorized Public Disclosure Authorized Public Disclosure Authorized Public Disclosure Authorized
-
Upload
khangminh22 -
Category
Documents
-
view
0 -
download
0
Transcript of SLatin America and the Caribbean, - Technical Departnlent

SLatin America and the Caribbean,- Technical Departnlent
Regional Studies Program.
Report No. 18
Private Financing of Higher Educationin Latin America and the Caribbean
by
Sam Carison
Human Resources Division
July 1992
Papers in this series are not formal publications of the World Bank. They present preliminary and unpolished results of country analysis or research
that is circulated to encourage discussion and comment; any citation and the use of this paper should take vecount of its provisional character. The
.iodings, interpretations, and conclusions expressed in this paper are entirely those of the author(s) and should not be attributed in any manner to
the World Bank, its affiliated organizations, members of its Board of Executive Directors or the countries they represent.
Pub
lic D
iscl
osur
e A
utho
rized
Pub
lic D
iscl
osur
e A
utho
rized
Pub
lic D
iscl
osur
e A
utho
rized
Pub
lic D
iscl
osur
e A
utho
rized

This report was prepared by Sam Carlson (LATHR). It has benefitted greatly from the guidance and comments of peerreviewers Jee-Peng Tan (SASVP), Douglas Albrecht (PHREE), Nicholas Barr (EC2HR) and William Saint (AFTED).Additional comments from George Psacharopoulos, David Hughart (LATDR), Laurence Wolff and Julian Schweitzer (LATHR)were extremely helpful in making revisions. Guozhong Xie (EA3IE), Hongyu Yang, Haeduck Lee and Judy Baker (LATHR)assisted with the statistical analysis of hcusehold survey data, while Barbara Diallo (LATHR) provided professional computing4nd formatting support. Douglas Albrecht (PHREE) designed several of the student loan financial models used in this report,and the research of Mr. Albrecht and Adrian Ziderman (PHREE) was particularly important for setting this regional study ina global context.

ABSTRACT
The purpose of this study is to contribute directly t he current debate on highereducation finance reform in Latin America and the Caribbean kLAC), on both practical andtheoretical levels. Given macroeconomic constraints, increasing demand for higher educationand the need to improve the efficiency and equity of public expenditures, the objective is toanaly:,e the potential for increased stulent fees, expanded student loan schemes and effectivescholarship programs. These private sources of finance may be among the most importzntelements of public higher education reform in Latin America.
By mobilizing affordable private financing LAC governments could increase the totalresources going into public higher education by about 35 percent in real terms. This is basedon tuition fees equal to 30 percent of higher education unit costs. These fees would beaffordable by about 40 percent of LAC households. Student loan programs would be requiredfor another 40 percent of students, while the remaining 20 percent of the student body wouldneed scholarships (which could be financed by tuition revenue). Tuition fees set between 25 to35 percent of higher education unit costs appear to reflect the optimum balance of all financial,institutional and political factors.
Student loan programs in Latin America and the Caribbean recover an average of 40percent of the money disbursed (in net present value terms), and cover less than 8 percent, onaverage, of the higher education student body in each country. Adopting reforms suggested inthis report, it should be possible to increase this recovery to at least 50 percent, while at thesame time expanding loan programs to cover up to 60 percent of the student body. Privatizationof some or all loan program services, so as to max-mize administrative and financial efficiency,should be considered as an alternative or complement to existing public programs.

CONTENTS
Chapter Page
Executive Summary ....................................... i
1 Introduction ........................................... 1
2 Trends in Higher Eiucation Finance in Latin America and the Caribbean ..... 6Public Expenditures ................................... 6Private Expenditures .................................. 10Equity ........................................... 12
3 The Ability to Pay for Higher Education ......................... 23Student Fees ....................................... 23Willingness to Pay for Higher Education ...................... 34Student Loan Repayments ............................... 38
4 Student Loan Programs in Latin America and the Caribbean ............. 41Background ........................................ 41Financial Analysis of Student Loan Programs ................... 47Administration of Student Loan Programs ..................... 59Options for Reform of Student Loan Programs .................. 62Loan Program Privatization .............................. 73Alternative Lending Scenarios ............................ 75
5 Scholarships for HigherEducation ............................. 79Loans Versus Scholarships .............................. 84
6 Political Feasibility of Higher Education Finance Reform ............... 86Political Strategy forReform ............................. 93
7 Synthesis: Fees, Loans and Scholarships ........................ 100
Bibliography/Sources .................................... 103

Annex A: Trends in Higher Education Enrollments and Expenditures
Annex B: Selected Tables and Graphs from Household Survey Data andStudent Loan Program Simulations
Annex C: The Economics of Higher Education and Implications for Reform
Annex D: Summary of APJCE Student Loan Questionnaire Responses
Annex E: Checklist for Designing Student Loan Programs
Annex F: Feasibility of Using Social Security Institutes for Student LoanCollection
Annex G: Household Survey Data Description
Annex H: Sources for Determination of Higher Education Unit Costs

ExEcUTIVE -AORY
1. The purpose of this study is to contribute directly to tne current debate on highereducation finance reform in Latin America and the Caribbean (LAC), on both practicaland theoretical levels. Given macroeconomic constraints, increasing demand for highereducation and the need to improve the efficiency and equity of public expenditures, theobjective is to analyze the potential for increased student fees, expanded student loanschemes and effective scholarship programs. These private sources of finance may beamong the most important elements of public higher education reform in Latin America.
POTENTIAL NEW PRIVATE FINANCING FOR H.E.RELATIVE TO CURRENT PUBLIC H.E. SPENDING
INDEX * 100140
130*
120-
110
100 ,
1 2 3 4 6 6 7 8 9 10 11 12 13 14 16 16 17 18 19 20
YEARS
- PUBLIC SPENDING - NEW PRIVATE FUNDS
Base tlne Index Includes 1% annualgrowth In real public expenditures.
Figure 1
2. Figure 1 shows that by mobilizing affordable private financing LAC governmentscould increase the total resources going into public higher education by 35 percent in realterms.1' This is based on tuition fees equal to 25-35 percent of unit costs, which would
1/ This is based on computer models which simulate the net effects of tuition fees, student loan schemesand scholarship programs. The index shown reflects weighted average composite indices for Mexico,Brazil, Argentina, Venezuela and Colombia (each country is shown individually in Annex B).

- ii -
be equivalent to about one-half of estimated urit instructional costs. These fees wouldbe affordable by about 40 percent of LAC households. Student loan programs would berequired for another 40 percent of students. It is estimated these programs would recoverabout 50 percent of the money disbursed in net present value. The remaining 20 percentof the student body would need scholarships, which could be financed from tuitionrevenue. While higher fee levels might result in greater cost recovery, especially ifstudent loan programs become more efficient, the political and financial start-up costs ofsuch a policy are likely to be prohibitive. Lower fee levels would clearly mean lesspolitical pressure and lower start-up costs, but the improvements in cost recovery,efficiency and equity would be so limited as to question whether the reforms wereworthwhile. Tuition fees set at 25 to 35 percent of higher education unit costs appearto reflect the optimum balance of all financial, institutional and political factors."
3. Trends in Higher Education Finance in LNC Compared to most other regions ofthe world, Latin America spends a larger share of the government budget on educationand a greater proportion of the education budget is allocated to higher education. In1989 more than 25 percent of LAC government education spending went to highereducation, up from 16 percent in 1970 and 23 percent in 1980. In large part, this isbecause total higher education enrollment in Latin America increased twelve-fold between1960 and 1985 and the enrollment rate (weighted average) increased from 6 to 22percent. Since publicly-funded institutions accounted for much of the growth in highereducation enrollments, government expenditures on higher education increased, as well.
4. Over the next 20 years the demand for higher education in LAC will rise even more,due to population growth and increasing enrollment ratios at lower levels. Unfortunately,adverse macroeconomic conditions and intersectoral competition for public funds havereduced most governments' ability to finance education (at all levels), such that even noweducation is underfunded in most LAC countries. For efficiency, equity and scarcityreasons alternative financial resources for higher education must be found; the currentsystem is unsustainable. The logical solution is to tap the ability and willingness ofprivate households to invest in higher education.
5. Private Financinp LAC countries currently charge public higher education tuitionfees equal to just 7 percent, on average, of total unit costs (with a range from 0 to 26percent). However, students pay for other incremental, non-tuition higher educationcosts (such as food, rent, books, transportation, etc.), which together with tuition
2/ Unit costs include all public higher education expenditures (instruction, research, extension, etc.),whereas unit instructional costs include only those costs directly related to providing instruction. Thelatter are estimated to be about 60 percent of total unit costs.
3/ Obviously, tuition fees will and should be determined on a country-by-country basis; this suggestedtuition fee level reflects averages for the LAC region as a whole.

- iii -
constitute total financial costs.!' To these financial costs should be added theopportunity cost of foregone earnings, to calculate total private economic costs of highereducation. In all LA.C countries, these non-tuition expenses are greater than publictuition fees currently .. iarged, and greater than the unit costs of public higher education(except Brazil). This suggests that non-tuition expenses are the greatest financial oustacleto higher education, not tuition fees.
6. Equity Free (or low charge) public higher education has not meant equal accessto higher education. In fact, because most Latin American public higher education is free(or very low charge), it has resulted in rationing. Those who are admitted into publichigher education institutions are generally those who score highest on entrance exams,which in most cases requires access to quality (often private) primary and secondaryeducation.Y The poor have restricted access to quality lower education and are the leastable to afford the private costs of higher education, especially foregone earnings' Infact, a 1987 study showed that students from families in the upper two income quintilesre( ve about 75 percent of LAC higher education subsidies, while those from familiesn .e ower twe mcome quintiles receive just 13 percent of LAC higher education
subsidie,.-' Finally, tecause much of the public revenues needed to finance free publichi gher education in LAC come from non-progressive commodity taxes rather than incometaxes, it is -ften society at large, including the poor, which subsidizes higher educationfor the we'-off, a truly perverse equity impact.
Ability to Pay For Higher Education
7. Ability to Pay Tuition Fees Recent household survey data suggests that theaverage Latin American household could afford to pay an estimated 28 percent of thetotal financial costs of higher education, by contributing 10 percent of annual income.'Meanwhile, students from the wealthiest 30 percent of LAC households could afford topay 70 percent of the total financial costs of higher education, which would be equivaient
I/ These incremental costs are those which higher education students would not incur if they were notenrolled in school, and are particularly relevant for students who must relocate to attend highereducation.
J/ In the case of higher education systems with open admissions in LAC, testing at the end of the firstyear typically selects those who will continue on to the second year, so that in effect *admissions* takesplace after the first year rather than before it - the rationing effect is the same. If there is no selection,then it is quality rather than access which is rationed.
§/ This argues for increased student loans to the most disadvantaged students to finance this lost income.
2/ Petrei, 1987.
8/ Note that this examines finan.ial costs (which include total unit costs, plus all non-tuition expenses),and does not include the foregone earnings of students.

- iv -
to more than 100 percent of public higher education unit costs. At the other end of thespectrum, students from the poorest 30 percent of Latin American households couldafford to pay just 15 percent of total costs, mainly through loans.2' Obviously, thesecalculations are based on averages and are therefore only indicative. Nevertheless, itprovides strong evidence of the ability to pay tuition fees at LAC public higher educationinstitutions, which has been a contentious issue in the debate on higher education finance.
8. Willinness to Pay Tuition Fees The tuition fees which students should be willingto pay for higher education can be estimated by discounting into net present value acertain percentage of higher education graduate income over 20 years, and then breakingthis down into yearly tuition payments.L' For the region as a whole, "worthwhile"tuition fees range from 13 percent of higher education unit costs in Argentina, to 88percent of unit costs in Guatemala, with a weighted average (by enrollment) of about 30percent of unit co5ts. Note that this 3C per-ent weighted average corresponds closely tothe 4bility of LAC households to pay for higher education.
Student Loan Programs
9. Description and General Characteristics Student loan programs exist in at least20 LAC countries. About half of the programs are private, although almost all areheavily financed by national governments. Few students actually receive student loans,however, from less than 1 percent (Guatemala) to 21 percent (Chile). Low coverage isnot a function of student demand, but rather of loan prngram resources. Because allprograms are subsidized they are far from self-sufficient and require annual infusions ofadditional public funds, the size of which determine the number and amount of loansavailable each year. While internal sources of funds have grown over time (e.g. fromloan repayments), they remain relatively small because of high interest rate subsidies,default rates and administrative costs.
10. Loan Recovery LAC student loan recovery averages about 40 percent in netpresent value terms. This is based on financial models developed in the World Bankwhich forecast loan program cash flows over a 25-year period, and information providedby fifteen LAC student loan programs. The models incorporate interest rate subsidies,administrative costs, default rates, and grace and repayment periods, to estimate howmuch of the money lent to the student is actually recovered by the loan program in netpresent value terms.
2/ For the average LAC household, 10 percent of annual income was used to calculate affordable privatefinancing. For the wealthiest 30 percent of LAC households, 15 percent of annual income was used,while for the poorest 30 percent of LAC households, just 5 percent of annual income was used.
)0/ The analysis used 5 percent of higher education graduate income over 20 years, discounted at 5percent, to determine the 'value' of higher education.

11. Default Rates Default rates were difficult to determine, but are estimated atbetween 2 and 40 percent, with the average around 15 percent. One important factorbehind high default rates is that repayment burdens are unreasonably high in the firstyears after graduation, because rzpayment periods are too short (meaning payments arehigh), and many graduates do not find fully productive employment immediately aftergraduation.
12. Impact Loan programs in LAC ha, not yet been used as a means of costrecovery of public higher education expenditures because of low coverage and heavyinterest rate subsidization, not to mention high inflation. Rather, student loans have beenprimarily a means 'o help students finance the living and maintenance costs (i.e. non-tuition expenses) of higher education.
13. Administrative Analysis Many loan programs in Latin America lack qualified,trained personnel, in part because salaries are low relative to what could be earned in theprivate sector. Another problem is the scarcity of information technology hardware andsoftware, which is necessary for financial and statistical projections. Thirdly, financialconstraints prevent expansion of programs which could generate administrative economiesof scale. Interestingly, nearly all loan programs surveyed mentioned political favoritismas a major source of administrative inefficiency. In general, the analysis indicates thatprivate loan schemes function more efficiently than public loan programs, although theyoffer loans to far fewer students.
Options for Reform of Student Loan Programs
(1) Positive (though subsidized) Interest Rates
14. Loan programs should charge positive real interest rates, although it is recognizedthat student loan interest rates are likely to remain somewhat subsidized because ofpoitical pressures and capital market failure. These rates should be variable, indexedto inflation and/or commercial interest rates. Furthermore, continued subsidizationrequires improved targeting (see Option 5).
- vi -
(2) Longer Loan Repayment Periods
15. Loan programs should lengthen their reoayment periods, in order to reducemonthly payments and the likelihood of default. A 10-year repayment would beaffordable for most higher education graduates, yet would avoid the excessive interestsubsidy losses of longer repayment plans. By contrast, most LAC programs requirerepayments in less than 5 years, a response to hyperinflation in the 1980s. Now thatinflation has slowed in most countries, the repayment pcriod should be extended, whilemaintaining positive real interest rates.
(3) Repayment Schedules Which Corre! 'd ., Graduate Earnings
16. 10 percent of higher education graduate earnings is w.,ely accepted as themaximum reasonable level of repayment. This calls for a modified repayment streamwhich more closely parallels higher education graduate age-earning profi! , That is,instead of making loan repayments of equal amounts every month, repayments should bebased on a percentage of the graduate's income. In general, this means repaymentswould be low at first, but would increase in value as the earnings of graduates increaseover time.
(4) Default Reduction Measures
17. Student loan programs should increase their loan collection efforts, because manygraduates can afford to repay loans, yet choose not to. Collection efforts include: (a)authorization of loan programs to pass along defaulters' names to other institutions (e.g.credit agencies, social security institutes, the internal revenue service, banks, employers,etc.), which could deduct required amounts from borrowers, or withhold services; (b)simplification of payment procedures through automatic employer or bank accountdeduction; (c) requiring borrowers to take out default insurance; (d) publishing the namesof defaulters in newspapers; (e) seizure and sale of guarantor collateral; and (f) the useof private collection agencies, whose fee would paid by the borrower as a penalty.
(5) Increased Targeting of Student Loans
18. Tuition fee in. ases will increase the demand for student loans, which meansimproved targeting criteria are required. The targeting criteria most often cited aremeans testing (i.e. analysis of household income) and academic performance. Based onmeans testing, a "sliding scale" can be applied such that the loan is calculated to bridgethe gap between expected parental contributions and higher education cost s. For familiesin the greatest need, care should be taken not to propose loans whic ., will result inunbearable repayments, meaning that average higher education graduate earnings shouldbe considered in calculating the level of an affordable loan. Particularly for poorstudents, financial aid should not be restricted to covering the direct tuition costs ofhigher education, but should cover tuition, books, living costs and even opportunity

- vii -
costs, so that stud.nts may attend school full-time. A recent study esimated the cost ofthis targeting procedure in Jamaica at US$40 per loan which, given the relatively highvalue of the loans disbursed, is quite reasonable.L'
(6) Personnel Incentives and Technology Upgrading
19. Revised incentive structures (both positive and punitive) for loan program staffare essential. For example, payment of loan collection sta:f should be at least partiallycommission-based, and loan application reviewers could receive bonuses for meetingtargeting criteria. In addition, loan programs should allocate more resources to stafftraining, and to the acquisition of simple computer hardware ant software, for improvedfinancial management of loan funds.
(7) Counseling and Follow-Up
20. All loan programs need to increase their counseling of loan beneficiaries,explaining repayment procedures and default sanctions to both loan applicants ana newgraduates. Secondly, experience has shown that the first year after school is the mcstcritical; during this time patterns for repayment are developed and graduates are ingreatest flux. Loan programs should make special efforts to track students during thisfirst year, and only universities which assist loan programs in following students aftergraduation should be eligible for loans.
- (8) Private Loan Schemes
21. An alternative or complement to a reformed public sector loan program is aprivate loan scheme. This may be particularly appropriate if a country is considering amajor expansion in lending coverage and volume, because in many LAC countriesprivate financial institutions are relatively well developed and could handle the technical,administrative and financial responsibilities of an expanded loan program more efficientlythan public institutions. In this case, governments could provide partial (not total)coverage of the default and interest rate risks, in order to stimulate private financialsector participation.
JJ/ Grosh, 1992.

-viii -
Costs and Benefits of Expanded Student Loan Programs
22. Start-Up Costs For the first 5-8 years, public higher education expenditures mightactualiy be greater with a loan program than without it, because of administrative costs(which are particularly high during the start-up period), and the time it takes borrowersto enter the repayment period. Simulations indicate "start-up costs" of about US$30 perborrower, for a program to f-aance tuition fees equal to 25 percent of unit costs. Thesecosts could be further reduced if lending was contracted out to commercial banks, inexchange for contributions tc the loan program's initial capital fund. Furthermore,international development agenzies could play an important role in financing these start-up costs if the private sector does not.
23. Benefits If (a) the average level of loan recovery for the region's student loanprograms could be increased to 50 percent, (b) loan programs were expanded to cover60 percent of the student population, and (c) public higher education institutionsestablished fees equal to 25 percent of their unit costs, then over a 25-year period LACgovernments could reduce their expenditures on higher education by some 20 percent.12
Over time these savings could go to improving the quality of higher education and/or toincreasing primary education expenditures. Compared to current levels of primaryeducation spending in LAC, these savings on higher education could result in increasesin public primary education spending on the order of 30 percent once loan programswere fully established.
Scholarships for Higher Education
24. Some students' household incomes are so low that the loans required to attendhigher education would be so great as to make their loan repayments unbearable, mostlikely leading to default. Al,rnatively, high loan amounts and the uncertainty ofinvesting in higher education might lead some qualified students to avoid borrowingaltogether ("risk aversion"), resulting in a socially inefficient and inequitable exclusionof talented higher education candidates. In both cases, scholarships are preferred.
25. This report assumes that funding for scholarships would come from earmarkingone-half of tuition revenue. Analysis suggests that as tuition fees rise beyond 35 percentof unit costs, the percentage of students who could be offered scholarships actuallydeclines. This is because as fees increase, the percentage of students who can afford topay decreases, and the size of the scholarship increases. The optimum fee level for the
12/ The additional savings which might be generated through the payment of school fees by moreprivileged students (who would not need loans) are not considered here, on the assumption that thesesavings would go to finance scholarships andlor be turned over to the universities for their ownpurposes. That is, this estimate of savings is rather conservative because fee revenue from non-borrowers is not factored in.
- ix -
purposes of scholarship coverage appears to be around 30 percent of public highereducation unit costs.
Political Strategy for Increased Private Financing of Higher Education
26. The first step in a political strategy for reform is to establish the facts concerninghigher education financing, enrollment, demograpnics, efficiency and equity. This is atask best undertaken by an independent research institution (internal or external), so asto maximize public acceptance of the analysis. The second step is to initiate aneducational campaign and national debate in the media concerning higher educationfinance reform. This would increase the sense of the people's "ownership" of thedebate's conclusions, and the accountability of public higher education students to societyat large.
27. Thirdly, through negotiation, mechanisms need to be developed for distributingthe net additional resources mobilized by public higher education finance reform in sucha way as to maximize political support for the reform process. One such mechanismwould be to earmark additional resources for three education funds, corresponding tomajor stakeholders in the reform: one for university professors; another forunderprivileged and/or academically gifted students; and a third for basic education(grades 1-9) teachers. The funds would play an important role in building politicalsupport for finance reforms and would demonstrate that any fiscal savings would remainwithin the education sector. The key point here is to focus the resources on people whocan be mobilized to support the reforms.
28. To further reduce opposition it is recommended that fee increases and loanprogram strengthening be "grandfathered", so that presently enrolled students retainbenefits and the reforms are enacted incrementally with each incoming class. Feeincreases could be introduced on a small scale, with yearly increases which keep up withinflation. Over time, if public expenditures on higher education are held constant innominal terms, inflation will gradually shift the balance from public to private financing.
Synthesis: Fees, Loans and Scholarships
29. The ovekall conclusion of this report is that tuition fees could reasonably be raisedto between 25 and 35 percent of higher education unit costs. This is based on analysisof: the ability and willingness to pay for higher education; the feasibility of student loanprograms; and the need to offer scholarships to the disadvantaged and/or academicallygifted. In other words, there is analytical convergence of these three components ofprivate higher education finance.
30. At this tuition level, (a) most LAC households could afford to pay fees and/ortake out student loans, (b) public higher education expenditures could be lower than they

are now, (c) the start-up costs of a loan program would be affordable, and (d) politicalopposition should be manageable. By raising fees to 30 percent of unit costs,governments could argue that fees would not unreasonably reduce access to highereducation for the middle class (recall that the real factors to access are quality basiceducation and the ability to forego earnings), while they would tap the resources of thosewho could afford to pay and finance targeted scholarships for the poor out of tuitionrevenue. This would improve the equity, efficiency and qualit of higher education.
31. Fee levels exceeding 35 percent of unit costs might result in greater resourcemobilization, but only if (a) political resistance can be overcome, anj (b) loans programscan be expanded to cover almost the entire student body, and their efficiency can begreatly improved. Moreover, higher tuition fees might induce unproductive rent-seekingbehavior on the part of higher education students, who attempt to conceal their householdincomes and use political connections in order to government subsidies and/or grants.
32. By implementing these reforms LAC governments could increase the totalresources going into public higher education by an average of 35 percent in real terms.This would provide funds for improvements in higher education access and quality, andfree up public resources which could then be allocated to lower educational levels. Bothmeasures would improve the supply of trained and trainable manpower in Latin Americanand the Caribbean, which is increasingly necessary for the region to compete successfullyin today's global economy.

CHAPTER 1
INTRODUCTION
1.1 The purpose of this study is to contribute directly to the current debate on highereducation finance reform in Latin America, on both practical and theoretical levels.Given macroeconomic constraints, increasing demand for higher education and the needto increase the efficiency and equity of. government expenditures, the objective is toanalyze the potential for increased student fees, expanded student loan schemes andeffective scholarship programs.
1.2 While a wide range of options exist for expanding higher education financing,such as voucher systems, tax credits, sale of university services, etc., this study focuseson student financing through tuition fees and loan programs. Student loan programs area particularly attractive option in Latin America because they already exist in manycountries, and because administrative systems are sophisticated enough to operate loanprograms effectively.
1.3 More specifically, the study analyzes (a) student willingness and capacity to payschool fees and repay student loans, and (b) the balance between targeted scholarshipsand student loans. In addition, this report aims to improve the feasibility, organizationand implementation of student loan schemes. Used here, the term "feasibility"encompasses financial, administrative and political dimensions.
The Problem and Issues to be Addressed
1.4 Between 1960 and 1989 total higher education enrollments in Latin Americaincreased twelve-fold, and enrollment rates (weighted average) increased from 6 to 22percent. In fact, enrollnent ratios in the region are now ten Limes those in AnglophoneAfrica and more than double those in South Asia.0' Since publicly-funded institutionshave accounted for much of the growth in higher education enrollments, governmentexpenditure3 on higher education have increased as well. In 1989 25 percent ofgovernment education spending went to higher education, up from 16 percent in 1970and 23 percent in 1980 (see Table 1.1). Over the next 20 yexs the demand for highereducation Latin America will rise still more, due to population growth and increasingenrollment ratios at the secondary level. Because unit costs for higher education arerelatively high and rising (compared with basic education), the demand for expenditures(public and private) on higher education will increase even more.
I3/ Winlder, 1990.

-2-
Table 1.1Latin America
Allocation of Public Recurrent Expenditureon Education, by Level, 1965 - 1987
(percentages)
1965 1970 1975 1980 1989
Primary 62.4 57.4 51.6 50.9 45.8
Secondary 23.3 26.7 25.0 25.6 28.8
Higher 14.3 15.9 23.4 23.5 25.4
Source: World Bank, 1986; UNESCO Statistical Yearbook, 1991
1.5 In recent years, however, adverse macroeconomic conditions and keen intersectoralcompetition for public funds have reduced most governments' ability to continue expandingeducation, such that even now education is underfinanced. In view of Latin America's relativelylow projected economic growth rates and rising higher education demand, financing difficultieswill only intensify.1 4' Alternative financial resources must be found; the current system isunsustainable.
1.6 The logical solution is to tap the ability and willingness of private households to investin higher education. That is, the high public cost of higher education can be partially recovered
by introducing (or increasing) fees for higher education, at the same time as student loanprograms are established (or expanded), so that students who need to can borrow to pay these
fees and repay their loans out of their future income. Selective scholarships, some based on
need and others on merit, would be maintained to preserve equity and encourage academicperformance. Lastly, in view of the fact that many of the benefits of higher education are
enjoyed by the individual as opposed to society (as evidenced by higher private than social rates
of return to higher education), it is reasonable for governments to ask for increased privatecontributions.
Rationale for Student Loan Programs
1.7 Student loan programs have the potential to improve the efficiency, equity and stabilityof higher education spending, while reducing the fiscal cost to the public sector. Demandefficiency (getting students with the greatest potential social productivity into school) may
increase because student quality, performance and finishing times (input-output ratios) should
14/ In essence, LAC governments have attempted to massify what was designed to be an elite system,
leading predictably to financial unsustainability.

-3-
improve, as the applicait pool expands via loan programs and students perceive a greaterfinancial stake in their studies. Supply efficiency may increase as students behave more likeinvestors (comparing marginal costs and benefits), choosing schools which offer education andtraining with the maximum economic value.
1.8 With regard to equity, if loans are extended to cover living expenses (and even foregoneearnings) of students from poor families, a fairer distribution of higher education opportunitieswould result. Secondly, given that (a) a high percentage of government revenues used to financepublic education come from non-progressive commodity taxes (about 40% for Latin America andthe Caribbean) and (b) most students in higher education come from middle- and upper- classfamilies, reducing public expenditures on higher education via tuition fees and student loanswould reduce the extent to which the poor now subsidize the rich. In addition, future equitywould be enhanced by a loan program if such a program expanded higher education access andenrollment, as higher education graduates typically earn more than those with lower educations.Finally, while every effort must be made to ensure that no competent student is excluded fromhigher education because s/he cannot afford it, some poorer students may be forced todiscontinue their studies if fees are introduced. But such an equity loss must be weighed againstthe equity gains resulting from a potential shift in education expenditures towards basic educationwhich higher education fees and loan programs might eventually permit.
1.9 By diversifying sources of funds (away from the public sector), a student loan programwould also provide greater long-term stability to education financing. That is, public highereducation expenditures often fluctuate considerably from year to year (depending on overallmacroeconomic conditions), making efficient multi-year educational investmnrts and programsdifficult to implement. By mobilizing private sources of financing, a student loan programwould lessen the impact of these public financing swings.
1.10 Perhaps most importantly, student loan programs would address one of the central issuesin higher education today: financial constraints. By tapping the willingness of private householdsto invest in education, additional resources would be mobilized.
1.11 Admittedly, the experience to date of student loan programs in Latin America (andaround in the world, in both developed and developing countries) has not been terriblyencouraging. The problems are numerous and can be categorized under the headings offinancial, administrative and political constraints. On the financial side, heavily subsidizedinterest rates, poorly conceived payment streams, high inflation and inappropriate lendingprocedures have prevented even theoretical self-sustainability. Higher than expectedadministrative costs, low repayment rates, and inadequate incentives (positive and negative) tocollect and repay loans, have further impaired the financial health of loan schemes. Finally,political resistance to loan programs in combination with increased tuition fees has been well-organized, articulate and effective in preventing their implementation. Overcoming these threecategories of problems is one of the objectives of this study.

Methodology
1.12 For the preparation of this report this study analyzed and synthesized information fromfive sources:
a. existing literature on student loans;b. 1989 household survey data from 13 LAC countries;c. a questionnaire distributed to 20 Latin American student loan programs;d. six commissioned case studies of student loan programs in Latin America
and the Caribbean (Colombia, Chile, Brazil, Venezuela, Mexico andJamaica);
e. student loan simulation models developed in the World BankL".
1.13 Each source targeted a different aspect of private finance analysis. The review ofexisting literature was the most general, providing background information and helping to focusthe report. The household survey tapes provided invaluable information for the calculation ofhousehold and higher education graduate incomes, used to determine ability to pay. Thequestionnaire gathered information from administrators of student loan programs concerning (a)the financial, administrative and political problems they face implementing such programs, and(b) their suggestions for minimizing or resolving these problems. Supplementing thesequestionnaires, the commissioned case studies provided in-depth information concerning theactual functioning of several student loan schemes and the prospects for establishing newprograms. Finally, the student loan simulation models permitted the financial analysis ofexisting LAC student loan programs and the effects of implementing suggested reforms. Thatis, existing LAC loan programs were compared to computer-simulated programs to assess theirrelative impacts on repayment burdens, the probability of default, and overall loan recovery.
Enrolhment Forecasts
1.14 A sound estimate of higher educatio. enrollments over the next 25 years, under bothstatus quo and reform scenarios, is obviously important in making financial projections. Withrespect to the status quo scenario, it is highly unlikely the high-growth trend in publicenrollments through the 1970s and 1980s can be sustained under current financing patterns (inpart this report is intended to address that problem); growth will have to slow down. As for theimpact of finance reforms on enrollments, several effects are possible: raising tuition fees mightreduce demand, and a portion of official enrollments (based on "professional" and "ghost"students) might disappear; on the other hand, expanding student loan and scholarship programs
ji/ The author especially wishes to thank Doug Albrecht (PHREE) and Guozhong Xie (AS1CO) whodeveloped the financial models. Without them this study would not have been possible.

-5-
might make higher education more accessible, thereby raising demandA' Uncertainty leadsto the following assumption: population growth, enhanced financing mechanisms, risingsecondary enrollments, and the increased importance of higher education will more thancompensate for enrollment cuts due to tuition increases. For this report a 1 percent annualincrease in public higher education enrollments was used in making financial projections.
Organization of Report
1.15 This report flows from description to analysis and then synthesis. In Chapter 2background information and financial trends are described in order to provide a context for theprivate financing of higher education in Latin America and the Caribbean. Next, in Chapters3, 4 and 5 the three elements of private higher education finance are analyzed as follows: tuitionfees and the ability to pay (Chapter 3); student loan schemes and their performance in LAC(Chapter 4); and then scholarship programs and their financial sources (Chapter 5). Followingthe financial chapters is a discussion of the political factors behind Latin American highereducation finance reform (Chapter 6), which analyzes probable winners and losers and proposesa strategy for a political coalition supporting reform. This allows the reader to choose whichaspects of private finance are the most relevant, rather than reading the entire report. Finally,Chapter 7 is a synthesis chapter, which attempts to tie together in a meaningful way the analysispresented in Chapters 3-6. At the risk of over-generalization it tries to arrive at normativestatements as to the optimal ranges of tuition fees, student loans and scholarships. But first, itis important to discuss more global trends in higher education finance in Latin America and theCaribbean, a subject to which we now turn.
16/ In the case of Chile, the reforms led to a slight decline in public enrollments of less than one-half apercent per year between 1980 and 1990, while private enrollments grew from zero to levels roughlyequal to public enrollments.

CHAPTER 2
TRENDS IN HIGHER EDUCATION FINANCE IN LATIN AMERICA AND THE CARIBBEAN
Public Exnenditures
2.1 As shown in Figure 2, government expenditures in Latin America and the Caribbean onhigher education increased from 23 percent of total education expenditures in 1980 to more than25 percent in 1989. Not surprisingly, there is considerable range in this expenditure category,from 14 percent in Ecuador to 40 percent in Costa Rica (see Annex A, p. 3).' At the sametime primary eGucation spending as a percentage of total education spending has steadilydecreased. Given estimated social and private rates of return to different levels of education,and the fact that tertiary enrollments in LAC constitute just one-tenth of primary enrollments,such high public expenditures for higher education do not appear justifiable. (See Annex A, p.7. for rat- of return estimates.)
Public Recurrent Education Spendingin LAC by Level, 1965 - 1989
Percent70 -
so -
40-
30-
20 -
1965 1970 1975 1980 1989
Year
Primary Secondary 1 Higher
Figure 2
2.2 Compared to other regions of the world (whether developing or developed), LatinAmerica spends a higher share of the government budget on education and a higher proportionof the education budget is allocated to higher education.!' Obviously, this is closely related
17/ UNESCO Statistical Yearbook, 1991 and 1989.
18/ Winkler, 1990

-7-
to the fact that higher education enrollments in Latin America are higher than in any otherdeveloping region, although below those in most developed countries. On the other hand,compared to East Asian countries with similar levels of GDP/capita (e.g. Korea, Philippines,Indonesia), Latin America places much greater emphasis on public, as opposed to private,financing of higher education.
2.3 In fairness, it must be pointed out that viewed independently of other educational levels,higher education spending in Latin America has declined considerably in real terms. Because
of enrollment increases real spending per student has particularly suffered. A study completed
in 1990 (for Argentina, Brazil, Mexico, Chile and Venezuela) showed that between 1980 and
1985 higher education expenditures per student decreased by an average of 43 percent in real
terms. Thus, while conclusions regarding the privileged status of public higher education
spending are valid, it must be kept in mind that from the perspective of higher education
administrators, professors and students, higher education experienced dramatic funding cuts over
the last decade. This is particularly important when considering questions of political economyand higher education finance reform.
Higher Education Finance Problems in the U.L
Lest Latin American and Caribbean governments believe their region is unique in facingfinancial constraints and pressures for reform, a recent article on university financing in the UnitedStates illustrates that financial problems are widespread. For the first time in 30 years, stategovernments around the nation are spending less .n their public higher education institutions thisacademic year than they did in the year before, according to the Illinois State University's Centerfor Higher Education.
In the State of Virginia, the government recently cut operating subsidies to its 15 publiccolleges, universities and community colleges by US$ 300 million, with another US$ 300 million
cut from building projects. Public per student spending was cut by 11 percent, while tuition fees
were raised 40 percent (to US$3,304), and another 15 percent hike in tuition is planned for 1992.
In the State of Massachusetts, public higher education spending has been cut 30 percentsince 1990, while tuition fees increased 121 percent (to US$8,400) between 1988 and 1992. InCalifornia, public university tuition fees were raised 40 percent for the 1991/92 academic year, withanother 24 percent increase planned for next year. In Maryland, the government recently cut US$160 million from public higher education funding.
The American Association of State Colleges and Universities has described the cuts in publichigher education spending over the last two years as "record breaking", as higher educationinstitutions have been forced not only to raise tuition but also to reduce the number of classes
offered, eliminate some teaching positions and increase class sizes. (Washington Post, 1/29/92)
Box 1

-8-
2.4 Unit Expenditures: Relative to unit expenditures at the primary and secondary level,higher education continues to be much more costly. For the Latin America and Caribbeanregion as a whole, higher education unit costs for 1989 were approximately seven times greaterthan those for primary education (US$1,512 compared to US$220).-9, With respect to thecomparison of higher education unit costs to GDP per capita, a rough 1:1 average ratio emerges(excluding Argentina), albeit with considerable variation. Table 2.1 below shows these public
expenditure ratios for higher and primary education in nine Latin American countries, as wellas a comparison of higher education unit costs to GDP per capita.
Table 2.1Ratio of Public Higher Education Unit Costs to
Primary Unit Costs and GDP/Capita, 1989
Higher UC: Higher UC:Country Primary UC GDP/Capita
Argentina 1.2 0.15Brazil 6.8 1.9Chile 11.7 0.6Colombia 8.3 1.6Ecuador 8.0 1.0Jamaica 16.0 1.45Guatemala 6.2 0.7Mexico 10.5 0.5Venezuela 16.7 .95
Source: UNESCO Statistical Yearbook, 1991; World Development Report 1991
2.5 Higher education unit expenditures include more than simple instructional costs.
Unfortunately, it is difficult to differentiate between these instructional costs and other highereducation expenditures, for example research. While it is a fair estimate that most of the unit
expenditures at the primary level reaches primary students (if only in the form of a teacher infront of them), the same cannot be said of higher education, where funding for research and
other public services is included in the urAit cost calculation (see Text Box 2). Thus, the unit
cost is a kind of index on which tuition fees and student loans can be based; it should not be
interpreted as the target measure under a full cost recovery policy via school fees (in which case
the appropriate measure would be unit instructional costs).
19/ On the other hand, because of rapid enrollment growth in higher education, unit expenditures have
declined considerably in real terms over the last 10 years (from an estimated US$1,580 to US$1,005,in constant 1980 US dollars).

-9-
Unit Costs versus Instructional Costs: Ideally, instructional costs for higher education could beneatly separated from the costs of research, extension, administration and the host of other non-teachingactivities many higher education institutions engage in. This would strengthen a university's (or agovernment's) ability to determine tuition levels, as it is only reasonable to ask students to pay for what theyreceive. Students should not be asked to pay for research (which is a form of public good), extension or othernon-teaching programs (e.g. in Brazil the unit cost figures include some US$2,000 per year spent on operatingpublic teaching hospitals!). This way students (and parents) would know what they were getting for theirmoney and universities could more easily justify tuition fees.
Unfortunately, it is not easy to separate undergraduate, graduate, and research costs, as well as thosefor administration, extension and other activities. Data collection and disaggregation, methodologicaldifferences over expenditure allocation, and the difficulty of estimating costs over time (e.g. publicexpenditures for a subsidized student loan program) make this exercise problematic. Researchers who haveattempted to do this have concluded that the most practical approach is to use a proxy for differentiatinginstructional from research costs: i.e., the weekly teaching load (James, 1977).
Using this proxy, a full-time professor working 40 hours per week but teaching just 24 hours perweek, would result in instructional costs equivalent to 60 percent of the professor's salary; the other 16 hoursthe professor is presumably conducting research. (Note that in most Latin America higher educationinstitutions, for every hour of instruction one hour is allocated for class preparation, so actual teaching timewould be just 12 hours.) As teacher salaries are the main expenditure item for most higher educationinstitutions, the convention is to extend that 60 percent figure to all expenditures, so that one could estimateunit instructional costs to be 60 percent of total unit costs. This figure could then be used to determineappropriate tuition fees for students.
However, this hypothetical proxy simply assumes that when a professor is not teaching s/he is doingresearch. There is little information available regarding the actual use of time by professors in Latin America;in public universities with few or no incentives for scholarship, many professors may simply use that time forclass preparation, another job, or even leisure. In this case, the only higher education activity during the weekis teaching; the professor is simply paid 40 hours for 24 hours of work, and the full cost of the professor (andby extension the total unit cost) should be allocated to instructional expenditures. Furthermore, this proxyignores the significant laboratory and eqipment costs of certain academic specializations (e.g. physics,chemistry, medicine), because it only considers personnel costs. It would be an illuminating exercise forMinistries of Education and higher education systems in Latin America to analyze more closely their highereducation expenditures, especially the use of professors' time, and attempt to disaggregate instructional fromnon-instructional costs. Obviously, this would be different for each. institution as the emphases on research,extension and teaching would be distinct. Tuition fees (in part based on estimates of ability to pay theseinstructional costs) could then be set on this basis.
For the purposes of this report, however, overall unit cost calculations are used. This is largely forthe sake of expediency, as the problems of collecting, analyzing and comparing information across countriesconcerning instructional versus non-instructional expenditureE go beyond the scope of this. study.Furthermore, unit cost calculations have been generalized at the country level (not by institution or field ofstudy), for the purposes of comparison to household income. In other words, institutions with lowinstructional to unit cost ratios are balanced by those with high ratios of instructional to unit costs. Thisallows for generalizations about overall household ability to pay for higher education, while recognizing thatin practice this exercise should be done on the micro-level (e.g., a student's household income, compared toinstructional costs for the particular higher education institution attended).
Box 2

- 10 -
Private Expenditures
2.6 Tuition Fees: While many Latin American and Caribbean countries do not charge tuitionat public higher education institutions, some countries do collect fees. Table 2.2 shows recentdata concerning student fees as a percentage of unit costs in public higher education institutionsin Latin America and the Caribbean. On average (unweighted), LAC countries recover just 7percent of unit costs through school fees. In no case do fees exceed 26 percent of unit costs(C'ile). Relative to other regions, this is below cost recovery levels in Asia and North America,although well above recovery rates in Africa and the Middle East..' However, it should bepointed out that LAC governments are increasingly aware of the need to increase cost recoveryat the higher education level; it is expected that public higher education tuition charges willincrease significantly during the 1990s.
Table 2.2Student Fees as a Percentage of Unit Cost in Public Higher Education Institutions
Country Percentage Year
Argentina 0 1990Barbados 15 1990Bolivia 3 1991Brazil 0 1991Chile 26 1987Colombia 10 1991Costa Rica 16 1991Ecuador 2 1991Guatemala 2 1991Honduras 3 1991Jamaica 25 1991Mexico 0 1991Peru 0 1991Uruguay 0 1991Venezuela 0 1991
Source: APICE Questionnaires; Higher Education Reform in Brazil;Reimers, 1990; Albrecht/Ziderman, 1991b; Hinchcliffe, 1991.
20/ A recent study of 43 countries showed that on average U.S. public higher education institutions recoverabout 25 percent of unit costs through tuition fees, while Indonesia and South Korea collect 25 percentand 24 percent, respectively. It is interesting that among public higher education systems surveyed,Chile recovers the greatest percentage (26 percent). (Albrecht/Ziderman, 1992)

- 11 -
2.7 Non-Tuition Expenditures: Private expenditures include fees paid at both public andprivate higher education institutions, as well as other incremental expenses such as food, rent,books, transportation, exam fees, etc. To these direct costs should be added the opportunity costof foregone earnings. Table 2.3 provides estimates by country of average fees, living expensesand foregone earnings, and compares these costs to GDP per capita. In all cases, total expenseswell exceed GDP per capita.
Table 2.3Private Costs for Public Higher Education, 1989
(US$1989)
Non-Tuition Foregone Total GDP/Country Fees Expenses Earnings Expenses Capita Ratio of
(1) (2) (3) (4) = 1 +2+3 (5) (4):(5)
Brazil 0 2,574 4,477 7,051 2,540 2.8Colombia 190 2,174 1,356 4,561 1,200 3.8Costa Rica 284 1,778 2,197 4,259 1,780 2.4Ecuador 22 2,054 1,376 3,452 1,020 3.4Guatemala 12 2,574 1,440 4,026 910 4.4Honduras 17 2,374 2,958 5,349 900 5.9Mexico 0 1,661 2,284 3,945 2,010 2.0Uruguay 0 1,574 2,034 3,608 2,620 1.4Venezuela 0 2,650 1,916 4,566 2,450 1.9
Source: APICE Questionnaires; Wolff, 1991; Reimers, 1990; Albrecht/Ziderman, 1991b; Hinchcliffe, 1991; Chen-Young, 1990; Household Surveys (see Annex 6).
History of Higher Education Finance: Recent research at the World Bank into the history ofhigher education around the world revealed two interesting facts: (1) until the early 19th centurythe private sector (including the Church) funded most of the development of universities, as opposedto governments, making these institutions wore responsive to student needs; and (2) the rationalefor heavy government funding and provision of higher education (which began in the Europe in themid-1800s) was the preparation of selected individuals for administrative and technical careers inthe civil service, a form of employer-based training. This structure was adopted by manydeveloping countries at independence but then expanded rapidly, in essence a massification of anelite system which has led to financial crisis.
Source:. Albrecht and Ziderman, 1992.
Box 3

- 12 -
2.8 Non-tuition expenses are clearly much greater than tuition fees currently charged. Evenmore striking, however, is the comparison of estimated non-tuition expenses to unit costs, shownin Table 2.4 In all countries surveyed (with the exception of Brazil) non-tuition studentexpenditures exceeded unit costs, suggesting that even if fees are increased to 100 percent of unitcosts, non-tuition expenses will remain the greatest financial obstacle to higher education.
Table 2.4Non-Tuition Student Expenses as a Ratio of Unit Costs
Ratio ofExpenses/Costs
Brazil .5Colombia 1.3Costa Rica 1.1Ecuador 1.8Guatemala 4.2Honduras 2.8Jamaica 1.8Mexico 1.7Peru 1.1Uruguay 1.2Venezuela 1.2
Sources: APICE Questionnaires; Wolff, 1991; Reimers,1990; Albrecht/Ziderman, 199 1b; Chen-Young,1990.
Equity
2.9 The equity dilemma of higher education is acute: if higher education is not subsidizedmany people cannot afford it (a demand-side constraint); if it is heavily subsidized then its sizeis limited by the need to contain costs, or its quality declines, or both (a supply-sideconstraint).' The goal is to find the optimal level of subsidy which minimizes both of theseconstraints.
2.10 Advocates of free public higher education argue that forcing students to pay tuition fees,in addition to already costly living expenses and opportunity costs, reduces the poor's access tohigher education and preserves the privileged status of the wealthy. Similarly, raising studentloan interest rates, requiring loan guarantors (or some form of collateral), and other measuresto increase student loan repayments are also said to hurt the poor in particular, as they are leastable to put up collateral and typically manifest greater "risk-aversion". On the other hand,
21/ Barr, 1992.

- 13 -
proponents of public higher education fees and student loan programs claim they improve socialequity, insofar as they can maintain the educational opportunities of poor students, whileredistributing the costs of higher education for a more equitable sharing of costs and benefits.L
2.11 While each of these statements is partially true they must be examined in a broadercontext, which includes analysis of issues such as: (a) the socioeconomic makeup of highereducation students (within the current environment of heavily subsidized tuition fees); (b) thequality of basic education for the poor; and (c) the -vailability of scholarships and loan programsbased on economic need. It is argued here that access to higher education among low incomestudents is more a function of the latter two issues than of general subsidies for higher education.That is, higher education equity can be improved through better quality primary and secondaryschooling, and targeted financial aid for the poor, accompanied by greater cost recovery amongthe middle and upper classes.
Share of LAC Higher Education SubsidiesReceived by Income Group, 1987
Quintile 54 9%
Ouintile 15%
Quintile 2
2%6%Quintile 3
13%
Figure 3
2.12 Because higher education students throughout Latin America and the Caribbeanoverwhelmingly come from upper- and upper-middle class backgrounds, free (or low tuition)higher education primarily benefits those who can afford to pay (see Chapter 3). A study donein 1987 (Figure 3) shows that students in the highest income group (Quintile 5) receive almost50 percent of all higher education subsidies. By contrast, students from the lowest income group
22/ Woodhall, 1987, p. 72.

- 14 -
(Quintile 1) receive just 5 percent of such subsidies. In other words, the rich benefitted fromfree higher education ten times more than the poor. Interestingly, the over-representation of
youth with high socioeconomic status in higher education (as measured by higher education
enrollment compared to population) is larger in I atin America than it is in Asia, the Middle East
or OECD countries.L'
2.13 This finding is supported by several more recent studies which analyze higher education
enrollments and income distribution. In Venezuela, it was found that the likelihood of a child
in the top two income quintiles attending higher education (80 percent of which is public and
free) is about twenty times greater than that of a child in the lowest two income quintiles. In
Brazil, it was found that 44 percent of all public higher education students come from families
earnings at least ten times the minimum wage per month (roughly US$6,600 per year). Finally,
in Colombia, 66 percent of all higher education students come from families in the top three
income deciles, while just 12 percent come from households in the lowest three income
deciles.'
2.14 In some countries public higher education finance is not only inequitable but also
regressive. For example, in Brazil, elite, high-quality public higher education is offered at no
charge to students (many of who attended expensive private secondary schools to gain admittance
into public higher education), while low-quality private higher education must be paid for by
tower income groups. Moreover, because much of the public revenues needed to finance free
public higher education in Latin America and the Caribbean come from non-progressive
commodity taxes (about 40 percent), it could be said that it is in large part the poor who
subsidize higher education for the rich, a most perverse equity impact.
2.15 Because Latin American public higher education is free (in most cases) it results in
rationing of access and/or quality. This means that those who attend higher education
institutions are those most able to afford the non-tuition expenses and costs of lost wages, and
those who score highest on entrance exams. [The former requires either parental support,
financial aid or night-time study opportunities, all of which are in short supply for poor students.
The latter requires access to high quality (often private) primary and secondary education, rarely
available to low income students.]J& Indeed, the lack of access to secondary education, in
particular, may be the greatest barrier to higher education for children of low socioeconomic
status.' The result of inequitable access is that many higher education students receive
23/ Winkler, 1990
24/ Brazil: Wolff, 1991; Venezuela: Wolff/Brunner, 1992; Colombia: Betancur-Mejia, 1990
25/ In countries with open admission, access becomes function of successful completion of the first year of
study so that lower educational opportunities still determine in large part access to higher education.
If no selection occurs, rationing takes the form of limiting educational quality.
26/ Winkler, 1990.

- 15 -
government subsidies they do not really need, while those individuals who need the subsidiesmost are excluded.
2.16 In short, what was said with respect to the U.K. system of higher education subsidizationapplies also to Latin America: "...to defend grants in higher education on grounds of socialequity is a monstrous perversion of the truth."' Free (or low charge) higher education hasnot meant equal access to higher education opportunities.
2.17 Female Participation in Higher Education: Related to the issue of income equity is genderequity: do females have the same access as males to higher education? In LAC the answer isyes, as seen in Table 2.5. In fact, for the region as a whole female enrollments in highereducation are slightly higher than those of males. The fields of specialization do tend to besomewhat gender-specific, however - women are heavily represented in the teacher training andsocial science programs, while the majority of engineering and the physical sciences students aremen. But so long as tuition fees are not greatly differentiated by area of specialization, currentpatterns and future changes in the private financing of higher education raise few serious genderissues.
Table 2.5Enrollment in Higher Education by Gender, 1990
(percent)
Females Males
Argentina 53 47Brazil 52 48Chile 44 56Colombia 52 48Costa Rica 58 42Jamaica 60 40Mexico 42 58Paraguay 46 54Uruguay 58 42Venezuela 47 53
Average 51 49
Source: UNESCO 1992 Statistical Yearbook
27/ Mark Blaug, 1972, quoted in Woodhall, Student Loans as a Means of Financing Higher Education,World Bank Staff Working Paper, No. 599.

- 16 -
2.18 Case Study for Higher Education EAuity: Chile - Chile provides an excellent test case ofthe impact of higher education reform on equity (see Text Box 4 for a brief description of thatreform). In 1980 tuition fees were raised at public higher education institutions, theestablishment of private institutions was encouraged, and student loan programs were expanded.A recent study on the impact of these reforms (including equity) suggested that raising highereducation fees did not have an adverse impact on equity, in large part because they wereaccompanied by student loan programs targeted on lower income students. Furthermore, thereforms allowed the expansion of higher education to twice its size without increasing publicexpenditures, so that public expenditure increases could be directed to primary education wherethe positive equity effects are greatest.
Chile: Student Socio-Economic StatusBy Father's Education, 1976 - 1984
Percent
60
197619 198Year s
Milliterate I OPrimary IS Secondary University
Figure 4
2.19 Figure 4 shows the socio-economic status of Chilean university students, as indicated bytheir father's education, at three different points in time: 1976, 1981 and 1984 (recall that thereform began in 1980). Comparing the socio-economic background of students over timereveals very little difference before and after the reform; the Chilean higher education remainedskewed towards the upper socio-economic levels, but was no more so after tuition fees wereraised. However, comparing public and private enrollments, more than 40 percent of publicstudents in 1990 came from households in which the father had less than a complete secondaryeducation, whereas less than 15 percent of students in private universities came from such

- 17 -
households' This suggests that the public institutions do offer lower income groups moreeducational opportunities than private institutions, in large part through student loan programswhich are only available to public higher education students.
Chilean Higher Education EnrollmentBy Income Quintile, 1990
Quintile 3
Quintile 2I13%
Quintille 1
Quintile 425%
Quintile 536%
Source: Brunnef and Briones, 1992
Figure 5
2.20 Figure 5 shows higher education enrollment in Chile in 1990 by income quintile. Therecan be little doubt that enrollment patterns remain inequitable. On the other hand, comparingFigure 5 to Figure 3, it would appear that access to higher education in Chile is more equitablethan it is for Latin America as a whole. The lower three income quintiles have higherrepresentation in Chilean higher education than they do for Latin America as a whole, while thehighest quintile has a lower representation. ' Unfortunately, this information is not availablefor Chile from before 1980 so the impact of the reform cannot be determined from this graph.
28/ Brunner and Briones, "Higher Education in Chile: Effects of the 1980 Reform" (draft), prepared forthe World Bank, January 1991.
29/ Note that the figures illustrate slightly different information: Figure 3 shows the share of highereducation subsidies received by each income quintile, while Figure 5 shows higher education enrollmentby income quintile. In this sense the two figures are not directly comparable, but if enrollment is usedas a proxy for public subsidy they can be compared.

- 18 -
2.21 The expansion of student loan programs under the Chilean reform has clearly benefittedthe lower classes. A study done in 1985 on the redistributive impact of public educationalexpenditures indicated that more than 50 percent of public funds allocated to student loanprograms benefitted the poorest 60 percent of society, whereas only 25 percent of direct publicspending on higher education did so (see Table 2.6 below).
Table 2.6Chile: Redistributive Impact of Public Expenditure
Among Different Educational Levels, 1985(percent)
Level Poorest 30% Middle 30% Richest 40%
Preschool 45 35 20
Primary 47 31 22
SecondaryGeneral 37 35 29Vocational 37 37 26
HigherDirect 10 15 75Student Loans 22 29 49
Source: Universidad de Chile/ODEPLAN, Encuesta CASEN, 1985; inCasteneda, Para Combatir la Pobreza: Politica Social yDecentralizaci6n en Chile Durante los '80, CEP, Santiago de Chile,1990.

- 19 -
2.22 This 1985 study was reinforced by a more recent review of the student loan program in1990, shown in Figure 6 below. Here we see that the vast majority of lower income studentswere receiving student loans in 1990, compared to a minority of upper income students. Almost80 percent of the lowest income students obtained student loans in 1990, versus less than 25percent among the wealthiest students. This indicates that higher education reforms have shiftedpublic expenditures from upper- to lower- income groups.
Chile: Percent of Students With LoansBy Income Quintile, 1990
Percent
100 -
601.. . . . . . .. . . . .
40 - . . .. . . . .
20, -. -
I23 4 5
Income GuintileSource: Brunner and Briones, 1992
Figure 6
2.23 Piecing together this analysis, one can say that higher education reform in Chile has hada favorable or neutral impact on equity within higher education, insofar as expanded student loanprograms have directed more public resources to less advantaged Chilean higher educationstudents, while the socioeconomic composition of the public higher education student body hasnot become more skewed towards the upper classes (and in fact appears slightly more equitablethan that of Latin American public higher education students as a whole). In fairness, however,because almost all of the growth in higher education enrollments has occurred in urban areas,it could be said that the reforms have had a negative geographic equity impact. On balance,while it is difficult to make a definitive statement about the positive equity impact of Chile'shigher education reform, the analysis suggests that such a reform in other countries is unlikelyto have a negative impact.
- 20 -
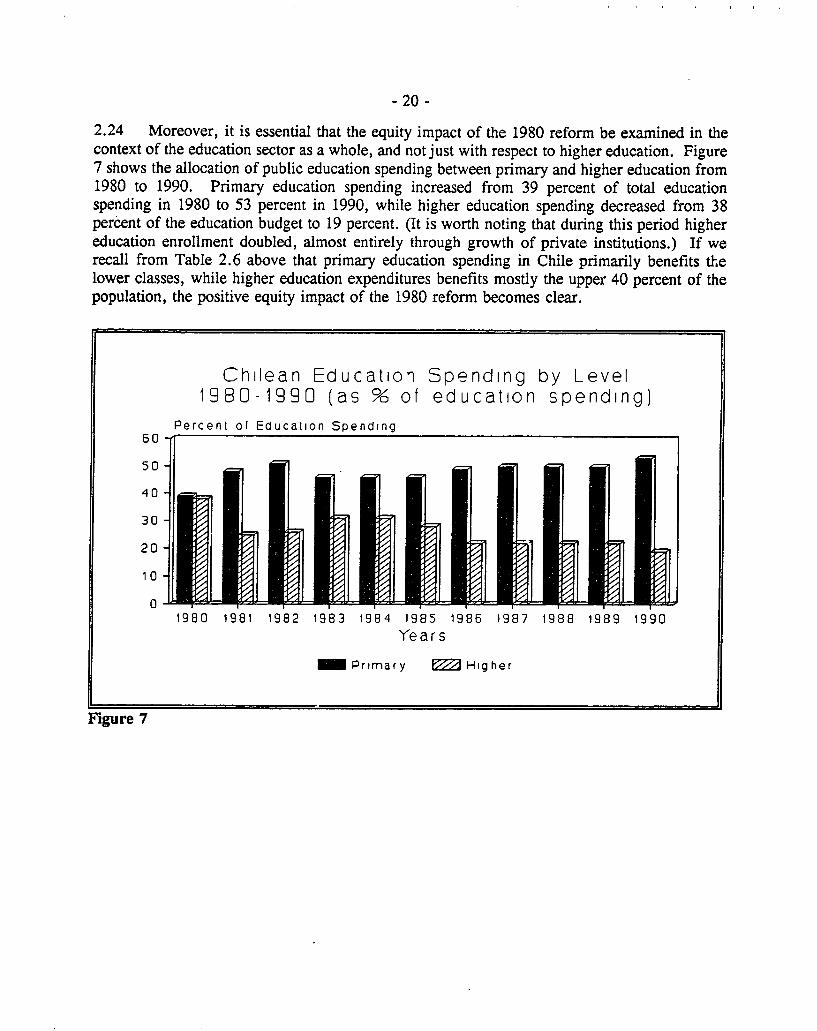
2.24 Moreover, it is essential that the equity impact of the 1980 reform be examined in thecontext of the education sector as a whole, and not just with respect to higher education. Figure7 shows the allocation of public education spending between primary and higher education from1980 to 1990. Primary education spending increased from 39 percent of total educationspending in 1980 to 53 percent in 1990, while higher education spending decreased from 38percent of the education budget to 19 percent. (It is worth noting that during this period highereducation enrollment doubled, almost entirely through growth of private institutions.) If werecall from Table 2.6 above that primary education spending in Chile primarily benefits thelower classes, while higher education expenditures benefits mostly the upper 40 percent of thepopulation, the positive equity impact of the 1980 reform becomes clear.
Chilean Educatioi Spending by Level1980-1990 (as % of education spending)
Percent of Education Spending60-
50 -
40 -
30-
201
10
01980 1981 1982 1983 1984 1985 1986 1987 1988 1989 1990
Ye ars
M Prtmary E Higher
Figure 7

- 21 -
Chile: Case Study of Reform: Before 1980 Chile's higher education system resembled those in many otherLatin American countries. There were 8 autonomous, "free of charge", highly selective universities, entirelyfunded by the public treasury. The 1980 higher education reform changed all that. It deregulated the system;opened up higher education to private initiative; diversified the system to include 4-year professional institutes(PIs) and 2-year technical training centers (17Cs); divided up the 2 national universities into 12 newuniversities and 2 PIs; increased cost recovery through tuition fees; expanded the student loan program; anddiversified funding sources.
The reforms produced the following effects: (1) total higher education enrollment more than doubled,with expansion provided entirely by mushrooming private institutions; (2) Chilean higher education is nowmainly private at non-university levels (PIs and TrCs) and has a dual public/private nature at the universitylevel (85% public); (3) higher education institutions have been established throughout the country, increasingaccess for students in all regions; (4) most higher education is provided by a large number of small privateinstitutions, plus a few medium-sized schools; and (5) the supply of higher education places now exceeds totaldemand.
Finance: The new private institutions are solely dependent on tuition fees for their resources andreceive no public funds. Meanwhile, public institution funding changed from a single source to a diversifiedsystem based on: public institutional core funding; a government-subsidized student loan program; privately-financed tuition fees; the number of highly qualified students each institution enrolls; and competitively-selected research projects. In 1981, 68 percent of public higher education institution funding came from thestate, with 15 percent derived from paid (or deferred) tuition fees, and 17 percent from other sources. Bycontrast, in 1990 public allocations constituted about 34 percent of total income for public institutions, withtuition fees providing about 22 percent, and the remaining 44 percent coming from targeted public allocations,sale of services, research grants and private donations.
Quality: On the whole, the 1980 Reform does not appear to have negatively affected the quality ofthe public institutions, although quality does not seem to have improved either. Lack of reliable informationand limited time-frames make it difficult to offer qualitative assessments about the new private institutions,of which there are 40 universities, 82 PIs and 168 TTCs. With respect to the private universities, they engageonly in teaching (no research), and offer mostly low-cost specializations using part-time teachers. Criticismsof their quality led to the introoction in 1990 of a public accreditation system for private universities.
Efficiency: Higher education enrollment doubled while direct institutional public allocations to highereducation were cut in half. That is, twice the students are being educated at one-half the public cost,compared to 1980, a huge increase in overall efficiency. Internal efficiency, however, does not seem to haveimproved much, if at all: student:teacher ratios remain low, on-time graduation is estimated at less than 40percent, and input-output ratios show an average of 9.2 years of schooling required to produce one graduate(an increase from 7.1 in the late 1970s).
Equity: As discussed elsewhere in this report (para 2.23), the higher education reforms have hada positive or neutral impact on equity. Enrollment remains skewed towards the upper classes (there is littlechange in the socio-economic background of students), but a greater proportion of public higher educationspending is directed towards lower income students (primarily through targeted student loan programs), andthe reforms have permitted a shift in overall education spending from higher to primary education.
In summary, while assessments of the new higher education system are still preliminary, it is clearthat Chile has undertaken a major structural reform which has accommodated the demand for higher educationwhile reducing public expenditures, maintaining quality and efficiency, and improving equity.
Box 4

- 22 -
Summary
2.25 The comparison of public and private expenditures on higher education, the analysis ofthose costs by type (tuition fees, living expenses or opportunity costs), the discussion concerningthe socio-economic background of higher education students, and review of Chile's highereducation reform, permit the following conclusions. (1) Tuition fees (or lack thereof) play onlya secondary role in determining access to higher education. Access to higher education isprimarily a function of educational opportunities at lower levels and ability to afford the overallprivate costs of higher education (including foregone earnings). (2) The current financingsituation is highly inequitable, with the vast share of public higher education expenditures beingabsorbed by upper income groups. (3) Raising higher education fees, establishing or expandingstudent loan programs and offering scholarships to the most deserving have improved both equityand efficiency of public education expenditures. The ability of households to pay these tuitionfees and the feasibility of student loan programs are examined in the next two chapters.

CHAPTER 3
THE ABILITY TO PAY FOR HIGHER EDUCATION
Student Fees
3.1 Using household survey data from Latin America and the Caribbean it is nossible toestimate average financial contributions for higher education which typical families could afford.The analysis suggests that by combining 10 percent of annual income with student loans theaverage household could afford to pay almost 30 percent of the total financial costs of highereducation (which include public higher education unit costs and non-tuition expenses).L'Meanwhile, the wealthiest 30 percent of Latin American households, who presumably would nothave access to targeted student loans, could afford to pay an average of 70 percent of the totalfinancial costs of higher education. This would be equivalent to more than 100 percent of directhigher education unit costs. Note that these calculations do not consider household savings butonly current household income, so that they are probably underestimated (see Text Box 5). Onthe other hand, they provide strong evidence of household ability to pay tuition fees at publichigher education institutions, which has been a contentious issue in the debate on highereducation finance.
3.2 The simplest assessment of ability to pay is to compare average household income topublic higher education unit costs, shown below in Table 3.1. Overall, mean household incomesrange from 2.5 - 6 times greater than total public higher education unit costs, which indicatessome capacity to pay higher education tuition fees.
Table 3.1Ratio of Mean Household Income to Average Public Higher Education Unit Costs
(1989 local currency)
Mean Average PublicHousehold Higher Educ.
Country Income Unit Cost Ratio
Argentina 658,450 103,729 6.3 : 1Brazil 36,064 13,490 2.7 : 1Colombia 2,811,250 728,366 3.9 : 1Costa Rica 355,342 83,700 4.2 : 1Ecuador 2,220,359 591,075 3.8 : 1Guatemala 5,714 1,745 3.3 : 1Jamaica 27,026 10,493 2.6 : 1Mexico 11,197,138 2,471,225 4.5 : 1Venezuela 283,452 77,985 3.6 : 1
Selrce: Household Surveys (see Annex G); 1991 World Development Report.
30/ Note that these costs are not precise calculations but rather averages for public higher educationsystems as a whole; they are intended to be illustrative rather than definitive.
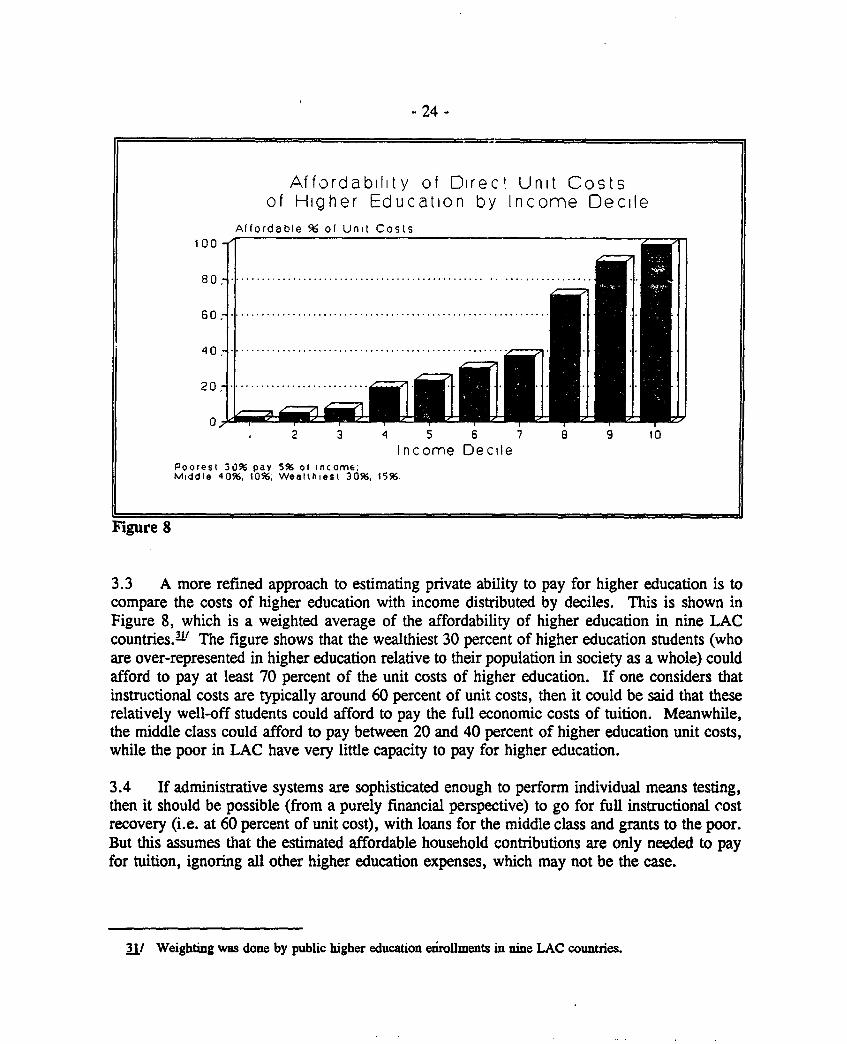
- 24 -
Affordability of Direc t Unit Costsof Higher Education by Income Decile
Affordable % of Unit Costs100-
0.
20... . .. .
2 3 4 5 6 7 8 9 10Income Decile
Poorest 30% pay 5% of income;Middle 40%, 10%; Wealthiest 30%, 15%.
Figure 8
3.3 A more refined approach to estimating private ability to pay for higher education is tocompare the costs of higher education with income distributed by deciles. This is shown inFigure 8, which is a weighted average of the affordability of higher education in nine LACcountriesA' The figure shows that the wealthiest 30 percent of higher education students (whoare over-represented in higher education relative to their population in society as a whole) couldafford to pay at least 70 percent of the unit costs of higher education. If one considers thatinstructional costs are typically around 60 percent of unit costs, then it could be said that theserelatively well-off students could afford to pay the full economic costs of tuition. Meanwhile,the middle class could afford to pay between 20 and 40 percent of higher education unit costs,while the poor in LAC have very little capacity to pay for higher education.
3.4 If administrative systems are sophisticated enough to perform individual means testing,then it should be possible (from a purely financial perspective) to go for full instructional costrecovery (i.e. at 60 percent of unit cost), with loans for the middle class and grants to the poor.But this assumes that the estimated affordable household contributions are only needed to payfor tuition, ignoring all other higher education expenses, which may not be the case.
I/ Weighting was done by public higher education erollments in nine LAC countries.

- 25 -
Affordability of Total FinancialCosts of H. E. by income Decile
Affordable % of Financial Costs100-
60.
40.
20.
0-1 2 3 4 5 6 7 8 9 10
Incorne DecilePoorest 30% pay 5% of income,Middle 40%, 10%; Wealthiest 30%. 15%.
Figure 9
3.5 Figure 9 is a similar to Figure 8, except that the costs in this case are the total financialcosts of higher education (direct unit costs plus estimated non-tuition expenses), not just unitcosts.?' This may be a more valid measure, in that non-tuition expenses are typically greaterthan direct unit costs and so should be factored in when analyzing affordability. In this case,a similar pattern of affordability among income deciles appears, but at significantly lower levels.Only the wealthiest 10 percent of students could afford the total financial costs of highereducation, while middle class could only afford around 20 percent of these costs. Meanwhile,the poor could contribute only token amounts. In sum, while household ability to pay isconsiderably less when non-tuition expenditures for higher education are taken into account, asignificant percentage of the student body should be able to pay tuition fees equal to between 25-35 percent of unit costs.
32/ Analyses of affordability for 9 LAC countries are shown in Annex B.

- 26 -
3.6 Figure 10 below provides a different look at the affordability of higher education,showing the percentage of households who could afford to pay for higher education as tuitionfees rise. Based on income deciles and taking 10 percent of household income as the affordableprivate contribution, Figure 10 shows that as tuition fees (expressed as a percentage of publichigher education unit costs) rise, the affordability of higher education declines almostproportionately. Every 10 percent increase in fees results in 25 percent decrease inaffordability. ' Note that this calculation of affordability is a weighted average (based onenrollment) of the percentage of households which could afford these tuition levels in eachcountry (it is not a simple average LAC household income compared to average LAC highereducation unit costs; it is country-specific). It should also be pointed out that this figurepostulates equitable enrollment among all income deciles, a somewhat optimistic assumption.
Equitable Enrollment: Affordability ofH.E. a, Tuition (% of Unit Cost) Rises
Percent (Weighted Average by Enrollment)
70 -
40 . .
10.-
10
15 25 35 45 55 65Tuition Fee as Percent of Unit Cost
Based on Equitable Enrollment byIncome Decile in LAC
Figure i)
33/ The 10 percent increase is relative to the unit cost. Raising fees from 15 to 25 percent of unit costs isactually a 67 percent increase in the fee.

- 27 -
3.7 Figure 11 below is a similar figure to Figure 10, except that it is based on estimatedactual higher education enrollment by income group (rather than on equitable enrollment). Thatis, the current enrollment pattern, which is highly skewed towards upper income groups, wasassumed instead of a more equitable pattern. Both figures show a linear decline in affordabilityas tuition increases (which is only logical), but Figure 11 demonstrates a different level ofaffordability altogether. 70 percent of today's higher education students could afford tuition feesequal to 25 percent of their unit cost, while under equitable conditions just 50 percent could doso. Whereas 60 percent of higher education students in LAC could pay fees equal to 35 percentof unit costs, only 40 percent could do so if enrollments were evenly distributed across incomegroups. In short, Figure 11 indicates that those students currently enrolled in higher educationin Latin America are those who could most afford to pay tuition fees. (Similar figures forselected individual countries are shown in Annex B.)
Actual Enrollment, Affordability of H.E.as Tuition Fees (% of Unit Cost) Rise
Percent (Weighted Average by Enroillmentl
100 -
2015 25 35 50 60 75 100
Tuition Fee as Percent of Unit CostBased on Estimated Average Enrollmentby Income Quintile in LAC
Figure 11
3.8 The next step is to incorporate the availability of student loans programs into the analysis.First, the ability to pay tuition fees is analyzed, irrespective of living costs. It is assumed onceagain that households could pay up to 10 percent of total income for higher education costs.These amounts, based on 10 percent of total income shown in Table 3.1, are shown in Column1 of Table 3.2 under the heading, "Affordable Tuition Payment".
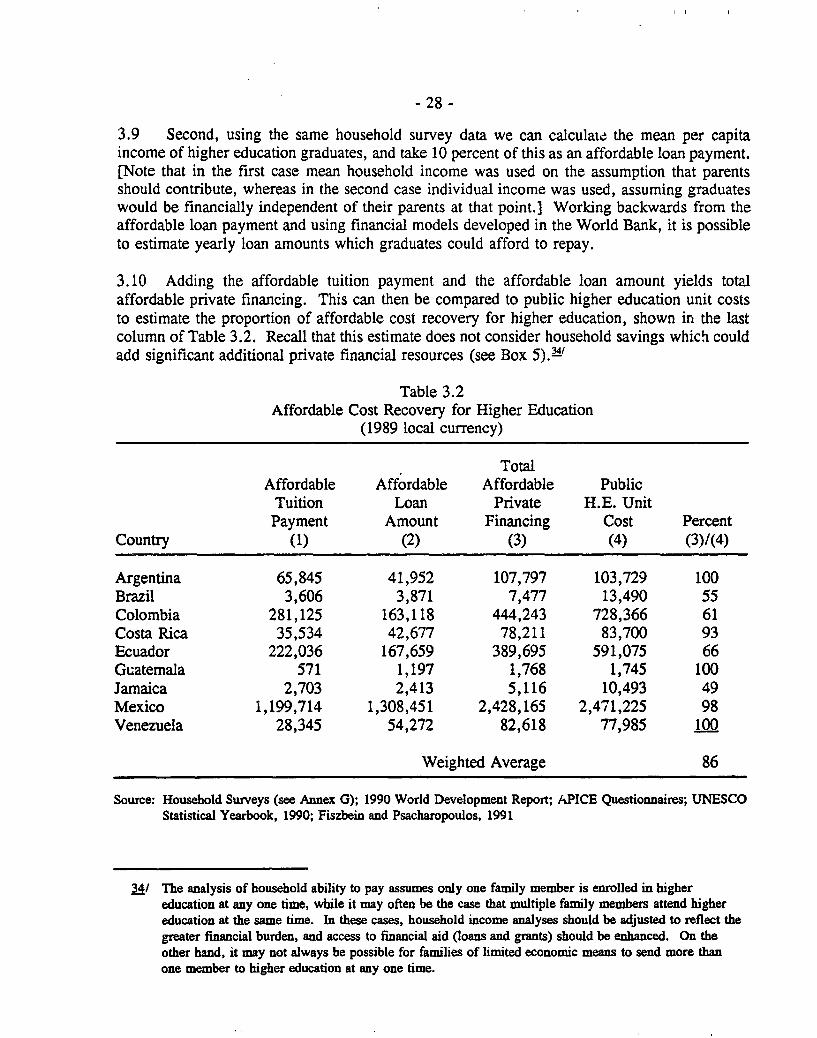
- 28 -
3.9 Second, using the same household survey data we can calculate the mean per capitaincome of higher education graduates, and take 10 percent of this as an affordable loan payment.[Note that in the first case mean household income was used on the assumption that parentsshould contribute, whereas in the second case individual income was used, assuming graduateswould be financially independent of their parents at that point.] Working backwards from theaffordable loan payment and using financial models developed in the World Bank, it is possibleto estimate yearly loan amounts which graduates could afford to repay.
3.10 Adding the affordable tuition payment and the affordable loan amount yields totalaffordable private financing. This can then be compared to public higher education unit coststo estimate the proportion of affordable cost recovery for higher education, shown in the lastcolumn of Table 3.2. Recall that this estimate does not consider household savings which couldadd significant additional private financial resources (see Box 5).2'
Table 3.2Affordable Cost Recovery for Higher Education
(1989 local currency)
TotalAffordable Affordable Affordable Public
Tuition Loan Private H.E. UnitPayment Amount Financing Cost Percent
Country (1) (2) (3) (4) (3)1(4)
Argentina 65,845 41,952 107,797 103,729 100Brazil 3,606 3,871 7,477 13,490 55Colombia 281,125 163,118 444,243 728,366 61Costa Rica 35,534 42,677 78,211 83,700 93Ecuador 222,036 167,659 389,695 591,075 66Guatemala 571 1,197 1,768 1,745 100Jamaica 2,703 2,413 5,116 10,493 49Mexico 1,199,714 1,308,451 2,428,165 2,471,225 98Venezuela 28,345 54,272 82,618 77,985 100
Weighted Average 86
Source: Household Surveys (see Annex G); 1990 World Development Report; APICE Questionnaires; UNESCOStatistical Yearbook, 1990; Fiszbein and Psacharopoulos, 1991
34/ The analysis of household ability to pay assumes only one family member is enrolled in highereducation at any one time, while it may often be the case that multiple family members attend highereducation at the same time. In these cases, household income analyses should be adjusted to reflect thegreater financial burden, and access to financial aid (loans and grants) should be enhanced. On theother hand, it may not always be possible for families of limited economic means to send more thanone member to higher education at any one time.

- 29 -
Saving for College - In countries such as the United States it is a common practice for parents tobegin saving for their childrens' college educations 10-15 years in advance of their childrens' enrollment.Commercial banks and other financial institutions offer savings plans which help parents to accumulate thefunds required for college. One innovative program is a Certificate of Deposit (CD) which is guaranteed toincrease in value by the same rate at which the cost of higher education increases until the CD is redeemed.An index based on the tuition charges at the 500 most popular higher education institutions is used to computethe annual interest rate paid on the CD. In this way parents can control for inflation and tuition increases(which have outpaced inflation over the last 20 years); they know that US$1,000 worth of higher educationtoday will be worth the same in real terms when their children are ready for college. Small automaticmonthly investments make it easy to build up significant savings over this period of time. Increased privatefinancing of higher education in Latin America will depend in part on ider availability of these types offinancial services, in addition to a wider prevalence of a savings mentality for higher education.
In Colombia such financial services are available. The ICETEX student loan program recently soughtand received government authorization to accept domestic savings and pay interest through securities calledTAEs (Ttulos de Ahorro Educativo). These savings bonds guarantee that ICETEX will pay thebeneficiary in installments equal to the value of the total or partial costs of future tuition fees, textsand other academic expenses, according to the type of bond purchased. Class A bonds cover 5years (10 semesters) of schooling, Class B bonds provide 3 years of schooling, and Class C bonds,2 years. The bonds are divided into coupons, each of which is worth one semester of highereducation.
An important aspect of these bonds is their constant value, which protects the bondholderagainst inflation, a particularly attractive feature in Latin America. That is, TAEs are not expressedin pesos but in "Constant Tuition Units" (Unidades de Matrtcula Constante), which increase in valueat the rate of inflation and in accord with average increases in tuition fees for higher education.
TAEs must be held for at least 2 years before they can be redeemed and may be held upto 24 years. Between this time the bondholder may decide when to rede2m each coupon. TAEsmay be purchased in their entirety or in installments (12-60 months), and they may be freely soldand/or traded. They are redeemed through two national banks (one commercial, the other of mixedownership) with a copy of the tuition bill. If the bond coupon value is equal to the required tuitionpayment, the bank transfers money equal to the coupon value to the higher education institution; ifit is greater the same money is transferred and the remainder is given to the bondholder for textbookpurchases and other academic expenses.
The security of thesL oonds is maintained through a bond guarantee fund managed by afinancial institution overseen by banking regulators. This fund cannot be accessed by ICETEX,except for meeting financial obligations to TAE . bondholders. In addition, bondholders areautomatically enrolled in an insurance plan which guarantees the payment of any remaining purchaseinstallments in the event of the bondholder's death or disability before all installments are made.If installments are late, an interest penalty is charged; after 3 consecutive late installments the bondis canceled.
The first bond sale began in July, 1990 and raised over US$8 million, and a second issuewill be released soon, showing considerable interest and capacity among Colombian households tobegin saving for their childrens' higher educations.
Box 5

- 30 -
3.11 Some critics of private higher education finance might argue that this is an unfaircalculation, because it ignores student living and opportunity costs, and does not address thespecial needs of poorer households. With respect to incremental living costs, these wereestimated in the survey of Latin American student loan programs and are shown in Column (2)of Table 3.3 under the heading, "Non-Tuition Higher Education Expenses". ' As foropportunity costs, these are not financial costs and so are not factored into the calculation oftotal annual costs. [Furthermore, many students work part-time while attending higher educationinstitutions, so opportunity costs are difficult to measure.] Combining non-tuition expenses plusunit costs, and comparing this total to total affordable private financing, (Column 1) providesan estimate of average affordable private financing of 28 percent of total financial costs of highereducation, shown in the last column of Table 3.3.
Table 3.3Affordable Cost Recovery for Higher Education
Taking Into Account Non-Tuition Expenses(1989 local currency)
Total Non-Tuition Public TotalAffordable Higher Higher Financial
Private Education Education Higher Ed.Financing Expenses Unit Costs Costs Percent
Country (1) (2) (3) (4)=(2)+(3) (1)/(4)
Brazil 7,477 6,161 13,490 19,651 38Colombia 444,243 831,707 728,366 1,560,073 28Costa Rica 78,211 144,907 83,700 228,607 34Ecuador 389,695 1,081,123 591,075 1,672,198 23Guatemala 1,768 7,249 1,745 8,994 20Jamaica 5,116 18,399 10,493 28,892 18Mexico 2,428,165 4,088,552 2,471,225 6,559,777 37Venezuela 42,962 91,905 77,985 169,700 25
Average = 28
Sources: 1989 Household Surveys (see Annex G); World Development Report; APICE Questionnaires;UNESCO Statistical Yearbook, 1990; Fiszbein and Psacharopoulos, 1991
35/ Note that some experts consider these non-tuition expenses as costs to be incurred whether university-age youth are enrolled in higher education or not, and so should not be considered as additionalincremental costs of higher education. Nevertheless, they are included here for the purposes of makinga robust analysis.

- 31 -
3.12 Looking at average household income obviously misses the large income disparities inmany Latin American countries, Accordingly, the same calculation done in Table 3.3 is donefor economically disadvantaged households, shown in Table 3.4. In this case, 5 percent of themean household income of the poorest 30 percent of the population is used, instead of 10 percentof simple mean household income, to calculate the affordable tuition payment (Column 1).L"Total affordable private financing simply adds Column (1) plus affordable loan amounts (fromTable 3.2), and are shown in Column (2). Total financial costs (Column 3) are taken fromTable 3.3, and once again compared to total affordable private financing (Column 4). Theanalysis suggests that poor households could afford to pay approximately 15 percent of the unitcosts of public higher education, albeit mainly through taking out student loans.
Table 3.4Affordable Cost Recovery for Higher Education Among Disadvantaged Households
(1989 local currency)
Total Total AffordableAffordable Affordable Financial Financing/
Tuition Private Higher Ed. FinancialPayment Financing Costs Costs (%)
Country (1) (2) (3) (4) = (2/3)
Brazil 247 4,118 19,651 21Colombia 33,314 196,432 1,560,073 13Costa Rica 4,389 47,066 228,607 21Ecuador 26,312 193,971 1,672,198 12Guatemala 33 1,230 8,994 14Jamaica 389 2,802 28,892 10Mexico 127,088 1,435,539 6,559,777 22Venezuela 4,139 18,756 169,700 11
Average = 15
Source: 1989 Household Surveys (see Annex G); 1990 World Development Report; APICEQuestionnaires; UNESCO Statistical Yearbook, 1990; Fiszbein and Psacharopouios, 1991
36/ This is based on the assumption that among the poorest households the ability to contribute financiallyto the costs of higher education is approximately half that of society at large, since a larger portion oftheir income is dedicated to satisfying basic human needs.

- 32 -
3.13 At the other end of the spectrum, we can estimate the capacity of the wealthiesthouseholds in Latin America to pay for higher education (recall that students from upper incomehouseholds are "over-represented" in public higher education institutions). In this case, 15percent of the minimum household income of the wealthiest 30 percent of the population wasused, instead of 10 percent of mean household income, to calculate the affordable tuitionpayment (Column 1).L" The analysis suggests that wealthy households could afford an averageof more than 70 percent of the total costs of higher education, which would be equivalent tomore than 100 percent of the unit costs of public higher education. Recalling that public highereducation instructional unit costs average about 60 percent of unit costs, we can also say that fullinstructional cost recovery should be possible among the wealthiest 30 percent of the studentbody. Note that in this case only household income was considered; access to public subsidizedstudent loans was not factored into total private financing because it is assumed that student loanswould be targeted on lower income students.
Table 3.5Affordable Cost Recovery for Higher Education Among Advantaged Households
(1989 local currency)
Public Total Afforda- Afforda-Affordable H.E. Financial bility of bility of
Tuition Unit Higher Ed. Unit TotalPayments Costs Costs Costs (%) Costs (%)
Country (1) (2) (3) (1)/(2) (1)1(3)
Argentina 209,717 103,729 181,524 100 100Brazil 14,028 13,490 19,651 100 71Colombia 969,882 728,366 1,374,641 100 76Costa Rica 114,775 83,700 146,475 100 78Ecuador 726,058 591,075 1,034,381 100 70Guatemala 1,863 1,745 3,054 100 61Jamaica 8,512 10,493 15,363 81 46Mexico 3,851,815 2,471,225 4,324,644 100 89Venezuela 98,721 77,985 136,474 100 65
Weighted Average* = 99 73
* Weighted Average is done by enrollment in public higher education by country.
Note: Total financial costs are slightly lower for wealthy students because most live in urban areas close to highereducation institutions, so housing and transportation costs are lower.
Source: 1989 Household Surveys (see Annex G); 1990 World Development Report; APICE Questionnaires;UNESCO Statistic.4 Yearbook, 1990; Fiszbein and Psacharopoulos, 1991
37/ This is based on the assumption that among the wealthiest households the ability to contributefinancially to the costs of higher education is approximately one and a half times greater than that ofsociety at large, since a lower proportion of their income is dedicated to satisfying basic human needs.

- .33 -
3.14 Finally, the issue can be looked at in a converse manner: instead of estimating whatpercentage of public higher education unit costs could be recovered based on 10 percent ofhousehold income, we can estimate the percentage of household income required to finance 25percent of public higher education costs. This is shown in Table 3.6 and suggests that suchlevels of cost recovery should be well within most Latin American households' financingcapabilities, requiring in most cases between 6-8 percent of mean household income. Note thatthis simple comparison of unit costs to household income does not consider the additionalfinancing which could be raised through student loans and/or personal savings.
Table 3.6Proportion of Household Income Required to
Finance 25 Percent of Public Higher Education Unit Costs(1989 local currency)
25%Public Public Mean Percent
H.E. Unit H.E. Unit Household of IncomeCountry Cost Cost Income Required
Argentina 103,729 25,932 658,450 4Brazil 13,490 3,372 36,064 9Colombia 728,366 182,092 2,811,250 6Costa Rica 83,700 20,925 355,342 6Ecuador 591,075 147,769 2,220,359 7Guatemala 1,745 436 5,714 8Jamaica 10,493 2,623 27,026 10Mexico 2,471,225 617,806 11,197,138 6Venezuela 77,985 19,496 283,452 2
Average = 7
Source: 1989 Household Surveys (see Annex G); 1990 World Development Report; APICEQuestionnaires; UNESCO Statistical Yearbook, 1990; Fiszbein and Psacharopoulos,1991; Gertel, 1991.
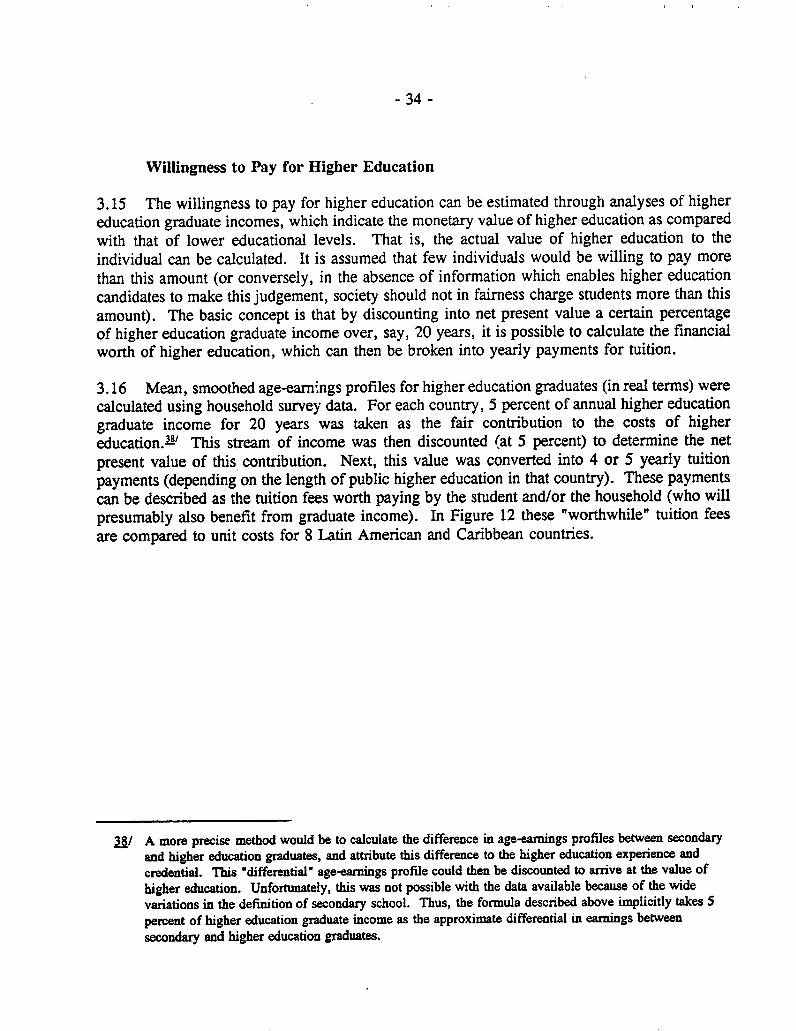
- 34 -
Willingness to Pay for Higher Education
3.15 The willingness to pay for higher education can be estimated through analyses of higher
education graduate incomes, which indicate the monetary value of higher education as comparedwith that of lower educational levels. That is, the actual value of higher education to the
individual can be calculated. It is assumed that few individuals would be willing to pay more
than this amount (or conversely, in the absence of information which enables higher education
candidates to make this judgement, society should not in fairness charge students more than this
amount). The basic concept is that by discounting into net present value a certain percentageof higher education graduate income over, say, 20 years, it is possible to calculate the financial
worth of higher education, which can then be broken into yearly payments for tuition.
3.16 Mean, smoothed age-earnings profiles for higher education graduates (in real terms) were
calculated using household survey data. For each country, 5 percent of annual higher education
graduate income for 20 years was taken as the fair contribution to the costs of higher
educationA' This stream of income was then discounted (at 5 percent) to determine the net
present value of this contribution. Next, this value was converted into 4 or 5 yearly tuition
payments (depending on the length of public higher education in that country). These payments
can be described as the tuition fees worth paying by the student and/or the household (who will
presumably also benefit from graduate income). In Figure 12 these "worthwhile" tuition fees
are compared to unit costs for 8 Latin American and Caribbean countries.
38/ A more precise method would be to calculate the difference in age-earnings profiles between secondaryand higher education graduates, and attribute this difference to the higher education experience andcredential. This "differential" age-earnings profile could then be discounted to arrive at the value of
higher education. Unfortunately, this was not possible with the data available because of the widevariations in the definition of secondary school. Thus, the formula described above implicitly takes 5percent of higher education graduate income as the approximate differential in earnings betweensecondary and higher education graduates.

- 35 -
Worthwhile Tuition Payments, Based onNPV of Earn ings, as a % of Unit Costs
Percent of Unit Cost
100
6 0 . B.. . . . .. . . . . .. . . . . . . . . . .. . . .
Argent. 8razil Chile Colombia Cos.Rica Venez. Ecuador Guate.
Tuition PaymentsEarnings were discounted at 5%
Figure 12
3.17 For the region as a whole it is difficult to generalize, as the suggested tuition fees by
definition reflect the success of higher education graduates in the labor markets of each country.
"Worthwhile" tuition fees range from 13 percent of higher education unit costs in Argentina to
88 percent of unit costs in Guatemala, with a weighted average (by enrollment) of about 30
percent of unit costs. Note that this 30 percent weighted average, reflecting the estimated value
of higher education to graduates, corresponds closely to the average ability of LAC households
to pay for higher education.
3.18 In fact, it is possible to compare country-specific analyses of ability to pay for higher
education and the value of that education as expressed by higher education graduate earnings.
Figure 13 below compares the worthwhile tuition payments (shown in the previous figure) to
affordable tuition payments based on average LAC household income (shown in Table 3.3).
Although not all countries suggest that the value of higher education (expressed by "worthwhile"
tuition payments) bears any relationship to the ability to pay for it (expressed by "affordable"
tuition payments), there is surprising similarity between the two concepts for four of the six
countries. That fact that two distinct methodologies arrive at similar conclusions strengthens the
findings of each.
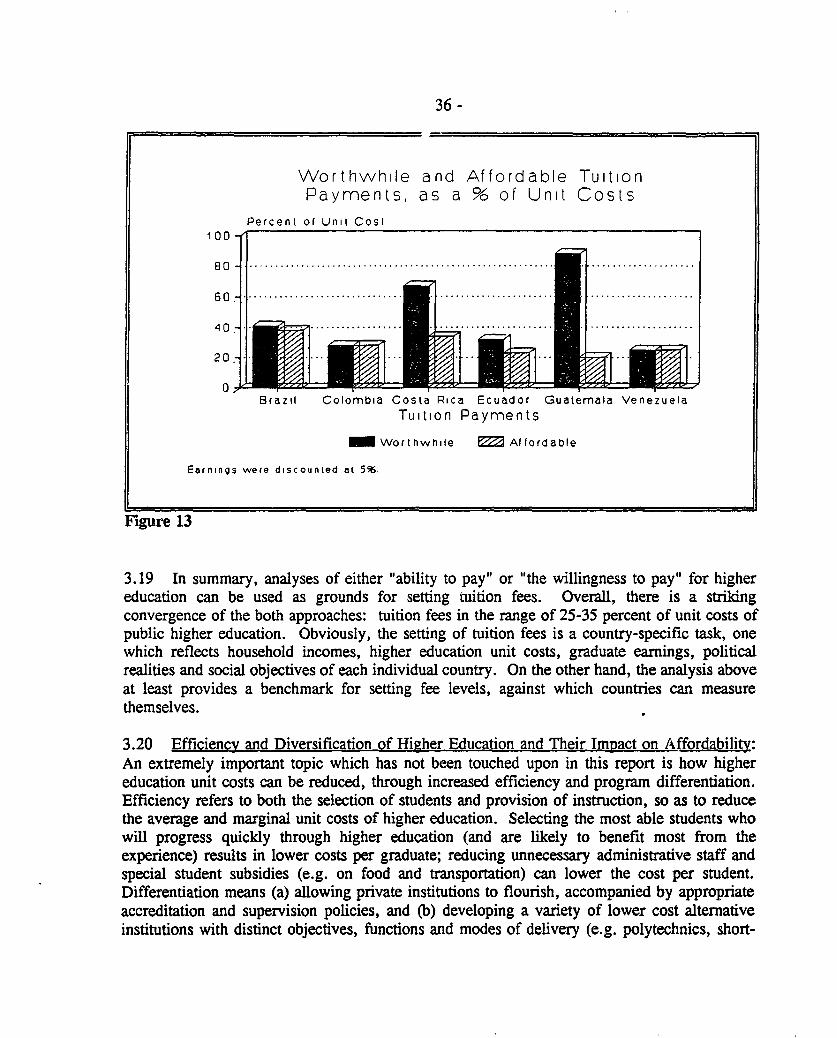
36 -
Worthwhile and Affordable TuitionPayments, as a % of Unit Costs
Percent of Unil Cost100 -1
20.
Brazil Colombia Costa Rica Ecuador Guatemala VenezuelaTuition Payments
M Worthwhile E Affordable
Earnings were discounted at 5%.
Figure 13
3.19 In summary, analyses of either "ability to pay" or "the willingness to pay" for highereducation can be used as grounds for setting tuition fees. Overall, there is a strikingconvergence of the both approaches: tuition fees in the range of 25-35 percent of unit costs ofpublic higher education. Obviously, the setting of tuition fees is a country-specific task, onewhich reflects household incomes, higher education unit costs, graduate earnings, politicalrealities and social objectives of each individual country. On the other hand, the analysis aboveat least provides a benchmark for setting fee levels, against which countries can measurethemselves.
3.20 Efficiency and Diversification of Higher Education and Their Impact on Affordability:An extremely important topic which has not been touched upon in this report is how highereducation unit costs can be reduced, through increased efficiency and program differentiation.Efficiency refers to both the selection of students and provision of instruction, so as to reducethe average and marginal unit costs of higher education. Selecting the most able students whowill progress quickly through higher education (and are likely to benefit most from theexperience) results in lower costs per graduate; reducing unnecessary administrative staff andspecial student subsidies (e.g. on food and transportation) can lower the cost per student.Differentiation means (a) allowing private institutions to flourish, accompanied by appropriateaccreditation and supervision policies, and (b) developing a variety of lower cost alternativeinstitutions with distinct objectives, functions and modes of delivery (e.g. polytechnics, short-

- 37 -
cycle professional and technical institutes, community colleges, distance education programs,etc.). Lower unit costs make higher education more affordable for everyone, an importantobjective in increasing higher education access.
3.21 At the systemic level, changes in the funding formulas for higher education can increaseefficiency and stimulate differentiation. For example, input-based funding which combinesprojected enrollments and standard unit costs provides objective criteria for resource allocationand assures sufficient resources for each student. Such a formula could be described as a kindof voucher paid to public institutions on behalf of students, which makes the system more"consumer-driven", although it carries the risk that institutions will focus on expandingenrollment (real, or "ghost") regardless of quality and internal efficiency. Output-based fundingallocates public resources on the basis of the number of graduates (or some other "product",such as research), encouraging institutions to increase their internal efficiency. Here the concernis excessive emphasis on quantity of graduates, as opposed to their quality. Perhaps the bestformula incorporates both input- and output-based funding (so as to balance the quantity andquality considerations). In any event, basing public allocations on "performance" (as opposedto some bureaucratically negotiated process) can provide higher education institutions withincentives to manage resources more efficiently and be more responsive to labor markets.P'Finally, all public higher education institutions should be allowed to keep whatever income theycan generate from the private sector, from sources such as the sale of research and consultancyservices, and contracts with industry (which may provide scholarships and/or establishfoundations). Such funding diversification can lower the need for cost recovery from students.
3.22 Quality of Higher Education: Another important issue not considered in this report is thequality of higher education received by students. This has an obvious impact on highereducation finance in that it greatly influences the benefits accruing to students (and society) upongraduation, as well as their willingness to pay for higher education (the two should be moreclosely linked). Higher quality may mean increased public higher education spending, or itcome from resources generated through increased efficiency and system differentiation. Overthe medium term, improved quality should increase students' (and the families') acceptance ofhigher tuition fees, which could then go to additional quality investments financed by privatesources - a virtuous circle. The complex issue of higher education quality goes beyond thescope of this report, however, and deserves greater attention elsewhere. The point is raised onlyto remind readers that private higher education finance cannot be separated from what is being"purchased", although in this study the quality and unit costs of higher education are taken asgiven.
391 Salmi, Jamil. (1992) "H;gher Education and Economic Development: Strategies for Reform".Washington, D.C.: World Bank Policy Brief.

- 38 -
Equity and Risk Aversion
The equity considerations of student loans are no less important than financial efficiency.While loans can be an important tool to assist people meet their educational costs, disadvantagedindividuals are less likely to be willing to borrow than middle class students. This is called "riskaversion", and has been confirmed in empirical studies in several developed countries, most notablySweden (Reuterberg and Svennson, 1991).
The main problem is the uncertainty regarding the returns to higher education; there is therisk of failure, and of poor employment possibilities after graduation. These risks may be greaterfor students whose parents did not attend higher education; private returns to higher education arelikely to be lower for poorer students who lack family connections than they are for wealthierstudents (Barr 1990).
To minimize this aversion to risk, most governments subsiOize student loans. However, thisundermines one of the rationales of loan programs, which is to increase higher education costrecovery. More effective measures to reduce risk would be to limit repayment burdens by: linkingpayments to income; imposing payment ceilings; and providing payment exemptions when incomefalls below a specified level. This is a form of built-in "loan rescheduling", which allows overallloan recovery to be maintained, while encouraging lower income students to borrow to finance theirhigher education studies.
Source: Albrecht and Ziderman, 1991
Box 6
Student Loan Repayments
3.23 The previous sections analyzed the ability and willingness of students and their familiesto pay tuition fees. In this section the ability of higher education graduates to repay studentloans is examined. In this case, "ability" is measured by comparing 10 percent of averagehigher education graduate income to student loan repayments. These repayments were calculatedusing the loan parameters of current LAC loan schemes and model loan programs developed inthe World Bank. In the first case, graduate earnings, as indicated in the 1989 HouseholdSurveys, were adjusted to 1994 levels by the average inflation rate prevailing in 1989, becausethe nominal and commercial interest rates being used by each loan program reflected the currentrate of inflation. In the case of the model loan programs, repayments were calculated using thesame parameters simulated elsewhere in this report: a loan equal to 25 percent of unit cost, 40percent interest rate subsidization (i.e., 3% nominal rate, 5% commercial rate, no inflation); 5-year disbursement; 1 year of grace; and a 10-year repayment period. Graduate earnings were

- 39 -
not adjusted in this case because zero inflation and real positive interest rates were assumed inthe forecast n scheme. The results are shown below in Table 3.7.
3.24 Table 3.7 illustrates two important points: repayment obligations under current loanschemes represent a considerable burden on higher education graduates (even with their earningsadjusted for inflation), while those under the model programs were much more bearable. Thiswas true even though the model programs assumed positive real interest rates, in large partbecause the repayment period was lengthened to 10 years instead of the typical 4-5 year periodunder current LAC loan schemes. This means that many higher education graduates may beunable to repay their loans, but mainly because these loans are poorly structured.
Table 3.7Student Loan Payments as a Percentageof Higher Education Graduate Earnings
(percent)
Payments PaymentsUnder Current Under Model
LAC Loan Schemes Loan Schemesas a % of as a % of
Country Mean Income Mean Income
Argentina n.a. 6Brazil 4 5Colombia 9 6Costa Rica 20 3Ecuador 24 5Guatemala 37 3Jamaica 18 9Mexico 9 3Venezuela 5 11
Average 15 6
Source: 1989 Household Surveys (see Annex G); 1990 WorldDevelopment Report; APICE Questionnaires; UNESCOStatistical Yearbook, 1990; Fiszbein and Psacharopoulos, 1991;Gertel, 1991.
- 40 -
3.25 Low ability to repay loans among higher education graduates can be linked to twoessential factors: (i) repayment periods under current LAC loan schemes are too short (meaningannual payments are high), and (ii) many graduates have yet to find fully productive employmentso soon after graduation. On the other hand, under the model loan schemes almost all graduatescan afford their loan payments, except for those in the lowest graduate income decile. Theselow-income graduates may have: specialized in fields not demanded by the labor market, beenpoor students, postponed searching for employment in order to enjoy their leisure time.experienced bad luck, or come from educational backgrounds which did not sufficiently preparethem for higher education. At any rate, a ten percent default rIte is probably the lowest whichcan be expected for a student loan program.
Conclusion
3.26 While illustrative in nature, and ignoring the fact that household incomes and highereducation institutional unit cost vary widely, this chapter has provided strong evidence of thecapacity of Latin American households to contribute to the costs of higher education. MostLatin American countries should be able to carry out a similar exercise for themselves, usingthe most recent household survey data and unit cost figures by public higher educationinstitution. This could be part of a consensus-building process for higher education financereform and would provide important information as to the most appropriate tuition levels forhigher education. As for the availability and feasibility of student loan programs required tocomplement the introduction (or increase) of tuition fees, this topic is examined in the followingchapter.

CHAPTER 4
STUDENT LOAN PROGRAMS IN LATIN AMERICA AND THE CARIBBEAN
Background
4.1 Student loan programs in Latin America and the Caribbean (LAC) originated in 1950,with the creation of the Colombian Institute for Educational Credit and Technical Studies Abroad(ICETEX). The successful experience of ICETEX led numerous other countries to follow suitduring the 1960s and 1970s, such that Latin America and the Caribbean now has more studentloan programs than any other region. Programs exist in twenty LAC countries, includingArgentina, Bolivia, Barbados, Brazil, Colombia, Costa Rica, Chile, the Dominican Republic,Ecuador, El Salvador, Honduras, Jamaica, Mexico, Nicaragua, Panama, Peru, Trinidad andTobago, and Venezuela. The Caribbean Development Bank also operates a student loanprogram for eleven small island countries. All of these programs are subsidized.
Objectives/Rationale
4.2 Subsidized student loan programs generally share common objectives, which can bedescribed as:
a. promoting equal access to higher education, by helping poorer students to financetheir studies;
b. contributing to national development, by lending for study programs whosegraduates work in fields of high social value (e.g. teaching);
c. providing a reliable source of finance for higher education.
4.3 To these three objectives a fourth should be added, which is not shared by LAC studentloan programs but rather held by governments more broadly:
d. reduced public spending on higher education and/or the provision of more highereducation opportunities (public or private) at lower public unit costs.
4.4 Perhaps the most compelling argument for subsidized student loan programs whichaccompany the introduction or increase in student fees is that students from poor families maybe shut out (Objective A above). One way of analyzing whether this argument has more thanintuitive appeal is to compare the socioeconomic profiles of students in low cost-recovery publichigher education systems with those in higher cost-recovery systems, testing the hypothesis thatthere would be a greater proportion of students from lower income backgrounds in the former(e.g. Venezuela) than in the latter (e.g. Chile). Unfortunately, all Latin American countrieswhich have introduced or increased tuition fees have simultaneously expanded their loanprograms, so such a neat comparison is not possible. Furthermore, the socioeconomic profilesof Venezuelan and Chilean higher education students use different methodologies, making evenrough comparisons misleading. Nonetheless, it is fair to say that, in general, low cost-recoverysystems have a greater proportion of low-incomri students than high cost-recovery systems, butthe magnitude of this difference cannot be measured at this time.

- 42 -
4.5 On the other hand, Chile's higher education reform experience allows us to compare thesocioeconomic profile of students in public institutions (eligible for student loans) with those inprivate ones (ineligible for loans), testing the hypothesis that there are more low-income studentsenrolled in public institutions than in private, even though tuition fees are roughly the same.Figure 14 shows this is indeed the case: 75 percent of public university students come fromfamilies whose fathers have only a primary or secondary education, versus just 42 percent ofprivate students, and the proportion of private students from university-level households isalmost two and one-half times greater than that of public students. In view of the fact that 44percent of public students receive loans (targeted by income), it is fair to say that without studentloan programs the increase ;n tuition fees which was part of the Chilean reform would havereduced access to higher education among poor students. This provides a strong rationale forexpanded student loan programs in the context of rising tuition charges, in either public orprivate institutions.
Parental Education of HE Students inChile, Publ:c Vs Private, 1984
Percent60-
50 -
40 -
30 -
20-
10 -
0II,terale Primary Secondary University
Education Level
Public Private
Figure 14

- 43 -
Coverage
4.6 Depending on the loan program, educational credit may be provided to finance students'tuition fees and/or their living expenses. 42 percent of LAC loan programs surveyed financeonly tuition, while more than 50 percent finance both tuition and living expenses. In cases ofjoint financing, one loan is made to cover all types of expenses, rather than making two separateloans, but usually the bulk ot the loan goes to pay tuition costs. For living expenses the loansare only partial, which makes it difficult for some rural students (and urban students living incities without universities) to pursue higher education, because they cannot afford to relocate.
4.7 All LAC programs surveyed offered loans for both private and public higher educationinstitutions (except for Chile), ranging from technological institutes and teacher training schools,to full universities. While some countries also finance secondary and post-graduate education,most lending is for the undergraduate level. Targeting further, some countries limit loans tohigh national priority areas of study. In some cases, loans are also available for study abroad,although resources to finance this expensive option have dwindled considerably. It is estimatedthat financing for overseas study (where it exists) only covers about 30 percent of tuition costs(on average), and even less for living expenses.
Table 4.1Student Loans as a Percentage of Higher Education Enrollment, (1987)
Students PercentageTotal Receiving Receiving
Country Enrollment Loans Loans
Bolivia 101,869 137 1Brazil 1,470,555 224,722 15Chile 249,482 53,168 21Colombia 434,623 40,845 9Costa Rica 71,585 4,345 6Ecuador\1 186,618 2,287 1Guatemala 51,860 40 <1Honduras 37,386 748 2Jamaica\2 12,054 2,312 19Venezuela 467,371 13,360 <3
\1: 1988\i: 1986
Sources: APICE Questionnaires; UNESCO Statistical Yearbook, 1990;Calhau, 1990; Chen-Young, 1990; Reyes Posada, 1990;Betancur-Mejia, 1990; Brunner and Briones, 1992.

- 44 -
4.8 Unfortunately, the coverage of student loans as a proportion of student enrollmentremains low. Table 4.1 shows loan coverage for nine countries, in which the proportion variesfrom less than one percent (Guatemala) to 21 percent (Chile). Low coverage is not a functionof student demand, but rather of loan program resources. Because all programs are subsidized(typically in the form of lower than market interest rates), they are not self-sufficient and requireannual infusions of additional funds. Usually it is the size of these infusions which determinethe number and amount of loans available each year. In other words, like most public serviceswhich are price-controlled, student loan interest subsidization results in rationing.
Financial Sources
4.9 By far the greatest sources of financing for Latin American student loan programs arenational governments. While some loan programs have diversified their resource base, othersrely exclusively on government resources. Probably the most diversified program is ICETEXin Colombia (see Figure 15 and Text Box 7), with 10 different sources of funds. Otherimportant sources have been central or commercial banks (Costa Rica, El Salvador, Colombia,Jamaica, Mexico). In fact, Costa Rica's loan program by law now receives 5 percent each yearof all commercial bank net profits. Concessional funds from the Inter-American Bank and/orUSAID have also been important, although this flow has dried up considerably in the last fewyears. In addition, there are national lotteries in Brazil, while in Ecuador oil revenues andpayroll taxes have been significant sources of funds. In Guatemala, the DIFOBE programoperates almost exclusively with funds from private companies, which are supposed to donateUS$2,000 to DIFOBE for every foreign expert they hire. Finally, in most countries privatedonations are sought and encouraged by governments through tax incentivesA0'
4.10 Internal sources of funds have become more important over time but remain relativelysmall. Loan repayments provide about 20% of ICETEX's financial resources (this percentageis rising as loans with higher interest rates enter the repayment stage), although much less formost other programs. In part this is a function of age: a revolving student loan fund whichrelies wholly on internal sources (interest and principle payments, investment income, sales ofservices, etc.) is estimated to require between 10 and 20 years, before reaching full repaymentinflow, and some programs have not been in existence this longA' But more importantly,the low contribution of internal sources of funds is due to heavy inierest rate subsidization, highdefault rates and administrative costs, and gererous repayment periods. These are the issuesstudent loan programs must address if they are io increase their financial feasibility; they formmuch of the subject matter of this chapter.
40/ Woodhall, p. 37.
41/ Herick et.al, 1974, p. 24.

- 45 -
Repayment Terms
4.11 Repayment terms for all Latin American student loan programs are generous relative tonormal commercial lending. Typically, interest rates are subsidized, grace periods are extendedafter completing higher education to allow time for job hunting, and in many cases it is possibleto postpone or renegotiate repayments if borrowers are in financial difficulty. While all loanprograms apply certain sanctions in the event of default, these are often delayed, waived orerratically enforced, so that few borrowers fear the consequences of non-repayment. Table 4.2shows some programs' lending rates relative to commercial terms.
Table 4.2Commercial and Student Loan Program Lending Rates, 1990
(in percent)
StudentCommercial Loan Subsidization
Country Rate Rate Rate
Bolivia 22 10 55Colombia 36 24 33Costa Rica 34 19 44Ecuador 47 32 32Guatemala 21 16 24Honduras 26 12 54Mexico (Sonora) 41 25 39Venezuela 41 10 76
Note: Using a somewhat different approach which calculated the "hiddengrant" to students based on real interest rates and repayment periods,a different World Bank study (Albrecht and Ziderman, 1991) revealedsimilar subsidization levels.
Source: APICE Questionnaires

- 46 -
Source of Funds for Colombia's ICETEX Student Loan Program
1. One of the most impressive aspects of ICETEX is its diversified financial base. The largest source ofmoney (22%) for student loans comes from Regional Development Funds (RDFs). These funds are allocated byColombian congressmen, municipalities and departmental assemblies, and administered through ICETEX, whichselects applicants based on intellectual merit and financial need.
II. The second largest resoui.;e(21%) within the financial structureof ICETEX is portfolio recovery. ICETEX FINANCIAL SOURCES, 1989ICETEX loan arrears are just 12.4% US$and in present value terms itrecovers at least 53% of the value ofloans disbursed, after deducting Trust Fundsinterest subsidies, administrativecosts and default. In summary, Bank Credit Portfolio Rocoverywhile ICETEX is clearly not entirely 1a 21%
self-financing, the high percentage ofloan repayment demonstrates that c o Nat'i Gov'tstudent loan recovery is indeed TAE 1%possible, notwithstanding interest 7%subsidies and other costs. Inteest investmenta
191
M. Because ICETEX operationsare classified as a "development 22%activity", it has access to arediscount credit window through theCentral Bank, which means it has a Figure 15special credit quota at an annualinterest rate of 6%. Interest income is also an important source of financing, and will become more so as the 1985interest increase takes full effect. ICETEX also derives a significant portion of its resources from investments(19%), which have increased steadily as ICETEX has built its capital base and improved the performance of itsinvestment funds. Education Savings Bonds (TAEs - Tftulo de Ahorro Educativo) are another source of funds (7%),through which ICETEX accepts domestic savings and pays interest through the TAEs. These bonds guarantee thatICETEX will pay the beneficiary in installments equal to the value of the total or partial costs of future tuition fees,texts and other academic expenses. An important aspect of these bonds is their constant value, which protects thebondholder against inflation.
IV. Finally, about 9% of ICETEX's loan resources come from 180 trust funds. These trust funds areadministered by ICETEX on behalf of a wide range of public and private entities, ranging from trade associations,corporations, universities (public and private), government ministries, departments and municipalities, and foreignagencies. A contract specifies the fund's objectives, amounts to be contributed and disbursed, candidate selection,repayment terms, and institutions for study. In return for its services ICETEX charges commissions, which provideanother 4% of ICETEX's resources. In conclusion, ICETEX has demonstrated that through financial sourcediversification it is possible to offer subsidized student loans and expand the capital base at the same time.
Box 7
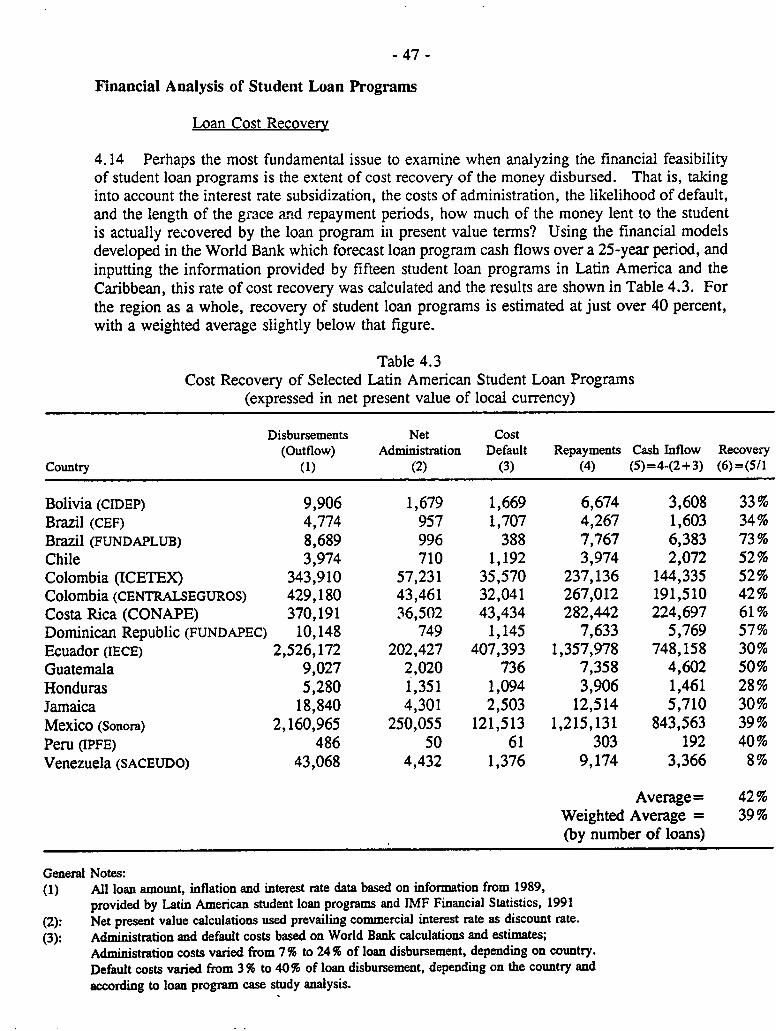
- 47 -
Financial Analysis of Student Loan Programs
Loan Cost Recovery
4.14 Perhaps the most fundamental issue to examine when analyzing the financial feasibilityof student loan programs is the extent of cost recovery of the money disbursed. That is, takinginto account the interest rate subsidization, the costs of administration, the likelihood of default,and the length of the grace and repayment periods, how much of the money lent to the studentis actually recovered by the loan program in present value terms? Using the financial modelsdeveloped in the World Bank which forecast loan program cash flows over a 25-year period, andinputting the information provided by fifteen student loan programs in Latin America and theCaribbean, this rate of cost recovery was calculated and the results are shown in Table 4.3. Forthe region as a whole, recovery of student loan programs is estimated at just over 40 percent,with a weighted average slightly below that figure.
Table 4.3Cost Recovery of Selected Latin American Student Loan Programs
(expressed in net present value of local currency)
Disbursements Net Cost(Outflow) Administration Default Repayments Cash Inflow Recovery
Country (1) (2) (3) (4) (5)= 4-(2+ 3) (6)=(5/1
Bolivia (CIDEP) 9,906 1,679 1,669 6,674 3,608 33%Brazil (CEF) 4,774 957 1,707 4,267 1,603 34%Brazil (FUNDAPLUB) 8,689 996 388 7,767 6,383 73%Chile 3,974 710 1,192 3,974 2,072 52%Colombia (ICETEX) 343,910 57,231 35,570 237,136 144,335 52%Colombia (CENTRALSEGUROS) 429,180 43,461 32,041 267,012 191,510 42%Costa Rica (CONAPE) 370,191 36,502 43,434 282,442 224,697 61%Dominican Republic (FUNDAPEC) 10,148 749 1,145 7,633 5,769 57%Ecuador (IECE) 2,526,172 202,427 407,393 1,357,978 748,158 30%Guatemala 9,027 2,020 736 7,358 4,602 50%Honduras 5,280 1,351 1,094 3,906 1,461 28%Jamaica 18,840 4,301 2,503 12,514 5,710 30%Mexico (Sonora) 2,160,965 250,055 121,513 1,215,131 843,563 39%Peru (IPFE) 486 50 61 303 192 40%Venezuela (SACEUDO) 43,068 4,432 1,376 9,174 3,366 8%
Average= 42%Weighted Average = 39%(by number of loans)
General Notes:(1) All loan amount, inflation and interest rate data based on information from 1989,
provided by Latin American student loan programs and IMF Financial Statistics, 1991(2): Net present value calculations used prevailing commercial interest rate as discount rate.(3): Administration and default costs based on World Bank calculations and estimates;
Administration costs varied from 7% to 24% of loan disbursement, depending on country.Default costs varied from 3% to 40% of loan disbursement, depending on the country andaccording to loan program case study analysis.

- 48 -
4.15 The first column labeled "Disbursements" is a simple calculation of the sum of the loanamounts disbursed during the period of higher education study (typically 4-5 years), discountedby the opportunity cost of capital (in this case the prevailing commercial interest rate). Thiscolumn can be considered the loan programs' cash outflow.
4.16 Column's (2), (3) and (4) make up the net cash inflow of the loan schemes. Column (2)is the estimated cost of administering the loan and depends on the administrative efficiency ofthe program, as well as on the length of the repayment period (obviously, the longer therepayment period, the higher the administrative costs). Column (3) is the estimated cost ofdefault, calculated by multiplying the outstanding balance of the loan due each year by thelikelihood of default, summing up those annual costs and discounting them by the opportunitycost of capital. Column (4) is a calculation of the net present value of the loan repaymentsassuming all borrowers meet their obligations until the loan is paid off. Note that because ofinterest rate subsidization even if all borrowers repaid in full, and on time, cost recovery wouldstill be well below 100 percent. Column (5) simply subtracts the costs of administration and thelosses due to default from the repayment stream to calculate the net cash inflow.
4.17 Finally, in Column (6) the net cash inflow is expressed as a percentage of the net cashoutflow to determine total cost recovery. As can be seen, the extent of cost recovery variesgreatly, between 8 percent (SACEUDO) and 73 percent (FUNDAPLUB). Interestingly, bothof these programs are private, suggesting that private loan schemes are not necessarily moreefficient than public programs. The primary determinant of this cost recovery was the level ofinterest rate subsidization (Table 4.2), followed by the rate of default.
Default
4.18 In some cases, particularly the small private programs surveyed, default was very low(around 3%). This is because of the close contact maintained between the lender and borrower,the relative ease of keeping track of just a few students, and the necessity of the program torecover its costs or go out of business (not having access to government funds). In other cases,the default rate was as high as 40%, because of poor record-keeping, geographic dispersion ofborrowers, lack of loan collection incentives, and the difficulty of tracking many students.
4.19 Other studies of student loan default rates in Latin America have found similarly wide-ranging experiences. In 1974 (Herrick et al) analyzed the ICETEX loan scheme in Colombiaand reported that between 1953 and 1968 the program suffered an annual loss of about 5percent. In view of the administrative competence and experience of ICETEX, Herrickdetermined this was probably the lowest default rate which could be expected. Generalizingmore broadly, Herrick et al concluded that a 10 percent default rate was probably reasonable formost programs (the US Student Loan Program averages a 17 percent default rate). It isinteresting to note that since 1974 the rate of default among ICETEX borrowers has risen to an
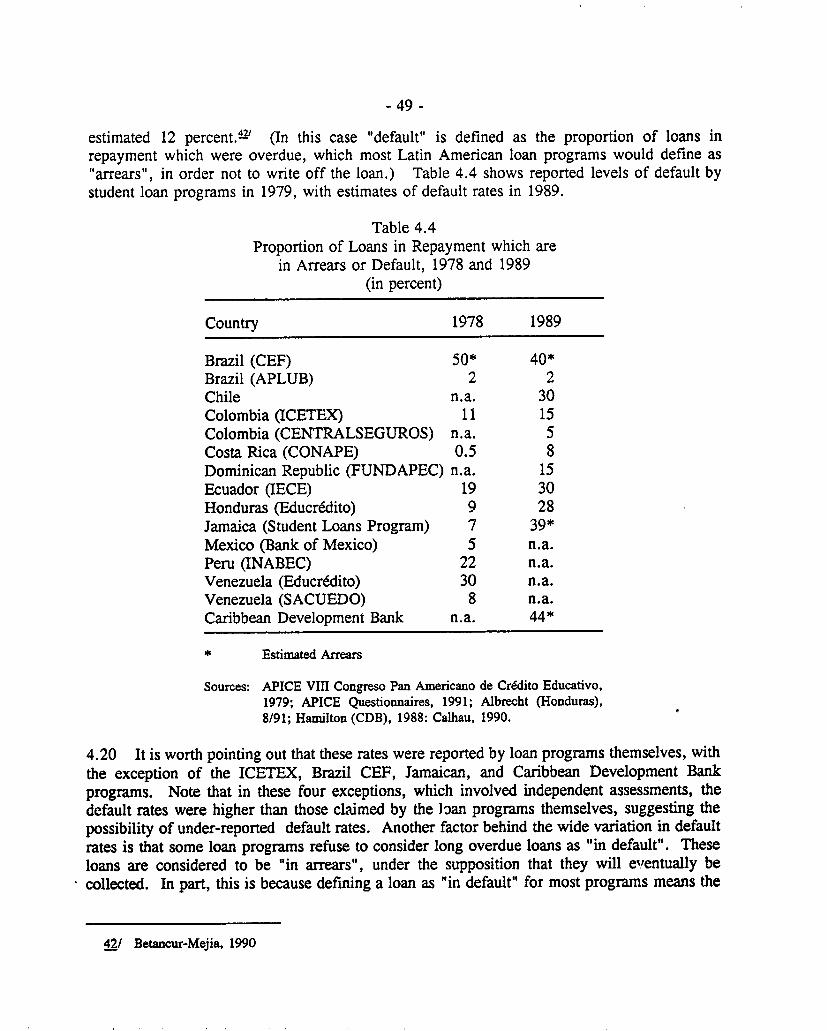
- 49 -
estimated 12 percentA' (In this case "default" is defined as the proportion of loans inrepayment which were overdue, which most Latin American loan programs would define as"arrears", in order not to write off the loan.) Table 4.4 shows reported levels of default bystudent loan programs in 1979, with estimates of default rates in 1989.
Table 4.4Proportion of Loans in Repayment which are
in Arrears or Default, 1978 and 1989(in percent)
Country 1978 1989
Brazil (CEF) 50* 40*Brazil (APLUB) 2 2Chile n.a. 30Colombia (ICETEX) 11 15Colombia (CENTRALSEGUROS) n.a. 5Costa Rica (CONAPE) 0.5 8Dominican Republic (FUNDAPEC) n.a. 15Ecuador (IECE) 19 30Honduras (Educr6dito) 9 28Jamaica (Student Loans Program) 7 39*Mexico (Bank of Mexico) 5 n.a.Peru (INABEC) 22 n.a.Venezuela (Educr6dito) 30 n.a.Venezuela (SACUEDO) 8 n.a.Caribbean Development Bank n.a. 44*
* Estimated Arrears
Sources: APICE VIII Congreso Pan Americano de Cr6dito Educativo,1979; APICE Questionnaires, 1991; Albrecht (Honduras),8/91; Hamilton (CDB), 1988: Calhau, 1990.
4.20 It is worth pointing out that these rates were reported by loan programs themselves, with
the exception of the ICETEX, Brazil CEF, Jamaican, and Caribbean Development Bankprograms. Note that in these four exceptions, which involved independent assessments, thedefault rates were higher than those claimed by the loan programs themselves, suggesting thepossibility of under-reported default rates. Another factor behind the wide variation in defaultrates is that some loan programs refuse to consider long overdue loans as "in default". These
loans are considered to be "in arrears", under the supposition that they will eventually becollected. In part, this is because defining a loan as "in default" for most programs means the
42/ Betancur-Mejia, 1990

- 50 -
loan is written off and no further efforts to coliect will be made. Not surprisingly, loanprograms are reluctant to do this and may consider loans which are years overdue still in activerepayment.
4.21 One important factor in default rates is the burden of loan payments on borrowers.While there is no fixed rule as to the proportion of income which could reasonably be dedicatedtowards repaying student loans, the figure of 10 percent of earnings is widely accepted as beingthe maximum level of repayment.L' By contrast, a recent seminar on student loan programsin LAC indicated that repayment burdens are considerably greater, as seen in Table 4.5.
Table. 4.5Estimated Percentage of Graduate Income
Required to Meet Loan Repayment Obligations(in percent)
Country Percentof Income
Colombia 40Costa Rica 18Peru 20-30Bolivia 23Chile 5
Source Loan Administrator Estimates, IIEPIUNESCORegional Forum on Student Loans in LAC, June1992.
Cost Recovery of Unit Institutional Expenditures
4.22 Despite the fact that many of the loan programs analyzed above are designed to helpfinance non-tuition expenses of higher education (such as food, rent, books, transportation, examand thesis fees, etc.), it is possible to estimate the potential cost recovery of public highereducation expenditures on the assumption that the loans replace what are now direct tuitionsubsidies. That is, current public higher education expenditures may be compared with whatthey would be if the loans replaced tuition subsidies, factoring in the number of loans presentlymade each year, the loan amounts and the extent of loan cost recovery. As can be seen in Table4.6 potential savings on public higher education expenditures made possible by student loanprograms are estimated at less than 8 percent for the Latin American region as a whole. Inshort, Latin American loan programs as presently functioning do not generate much basis forhigher education cost recovery; their primary function is to increase access, not to reducegovernment expenditures for higher education.
43/ Dominguez, 1973, in Woodhall, 1983.

- 51 -
4.23 On the other hand, this figure of roughly 8 percent cost recovery potential is primarilya factor of loan program coverage and of heavily subsidized interest rates, rather than ofinherent incapacity. Furthermore, student loan programs have supported the growth of privatehigher education institutions, which has helped to satisfy overall demand. Thus, while loanprograms have not recovered public expenditures they have restrained public spending from whatit might have been in the absence of loan programs and private higher education institutions.
Table 4.6Government Savings by Replacing Direct Subsidies with Loans Over a 25 Year Period
Expressed in Net Present Value Terms, 1989(with current loan coverage)
Current Government Percent ofLoan Savings Higher Education
Coverage (US$ million) BudgetCountry (1) (2) (3)
Argentina 0 0 0Bolivia (CIDEP) 137 2.0 1Brazil (CEF) 224,722 3,400 9Chile 53,188 317 10Colombia (ICETEX) 15,241 57 10Costa Rica (CONAPE) 1,034 45 13Dominican Republic (FUNDAPEC) 443 13.7 36Ecuador (IECE) 1,300 23.6 12Guatemala 1,134 17 .1Jamaica 284 1.8 1Mexico (Sonora) 4,141 10.9 .3Venezuela (SACEUDO) 2,672 1.9 .1
Total: 251,108 Weighted Average = 8.2
General Notes:(1): All loan number, amount and interest rate data based on APICE Questionnaires for 1989.
Administration and default costs based on World Bank calculations and estimates;Administration costs varied from 7% to 24% of loan disbursement, depending on country.Default costs varied from 3% to 40% of loan disbursement, depending on the country.
(2): Net present value calculations used prevailing commercial interest rate as discount rate.(3): Assumed constant higher education expenditures in real terms for 25 years.
4.24 In fact, if the average level of cost recovery for Latin American and Caribbean studentloan programs increased to 50 percent in net present value terms at the same time as loanprograms expanded to cover more of the student population, the potential for significant costrecovery becomes clear. More specifically, if public higher education institutions establishedfees equal to 25 percent of their unit costs, and 75 percent of the student body took out loansto pay these fees, over a 25-year period Latin American government could reduce their

- 52 -
expenditures on higher education by some 20 percent (see Table 4.7). Note that this calculadondoes not take into account the additional government revenue from those students who couldafford to pay the tuition fees, on the assumption that these revenues would go to scholarshipsfor those students who could afford neither fees nor loans, with whatever remainder going to theinstitutions themselves for their own purposes. In short, student loan programs are not apanacea for solving the problems of higher education finance, but they are one importantinstrument to be used in conjunction with fee increases, scholarship programs and greaterinternal efficiency at the higher education level.
Table 4.7Government Savings by Replacing Direct Subsidies with Loans Over a 25 Year Period
Expressed in Net Present Value Terms, 1989(with expanded loan coverage)
FORECAST FORECAST FORECAST60-80 % Total NPV NPV
Public Government Savings PercentHigher Ed. By Charging of HigherEnrollment 25% of Unit Cost EducationCoverage (US million $) Budget
Country (1) (2) (3)
Argentina 659,477 903 17Brazil (CEF) 470,689 5,429 18Colombia (ICETEX) 260,774 2,509 19Costa Rica (CONAPE) 46,130 239 19Ecuador (IECE) 91,183 517 48Guatemala 23,959 78 23Jamaica 7,232 80 15Mexico (Sonora) 575,160 2,386 11Venezuela (SACEUDO) 299,353 3,401 39
Weighted Average = 20
General Notes:(1): Assumed coverage of 60% of public higher education enrollment, except for Brazil (70%)
and Costa Rica (80%). Assumptions based on Household Survey Data and Ability to Pay Analysis(2): Assumes 40% interest subsidization; 4-year disbursement; 1-year grace period;
10-year repayment period; 20% default rate; administration rate, 18% of loan;1 % annual growth in number of students. Assumptions translate into NPV Cost Recovery of 50%.
Sources:Costa Rica: CONARE, Estadfstica de la Educaci6n Superior, 1989; UNESCO Statistical Yearbook, 1991;Brazil: Wolff, 1991; Venezuela: Wolff, 1992; Mexico: Primer Informe de Gobierno, 1989; Ecuador*Posada, 1990; Jamaica: Hinchcliffe, 1991; Winkler, 1990; APICE Questionnaires.
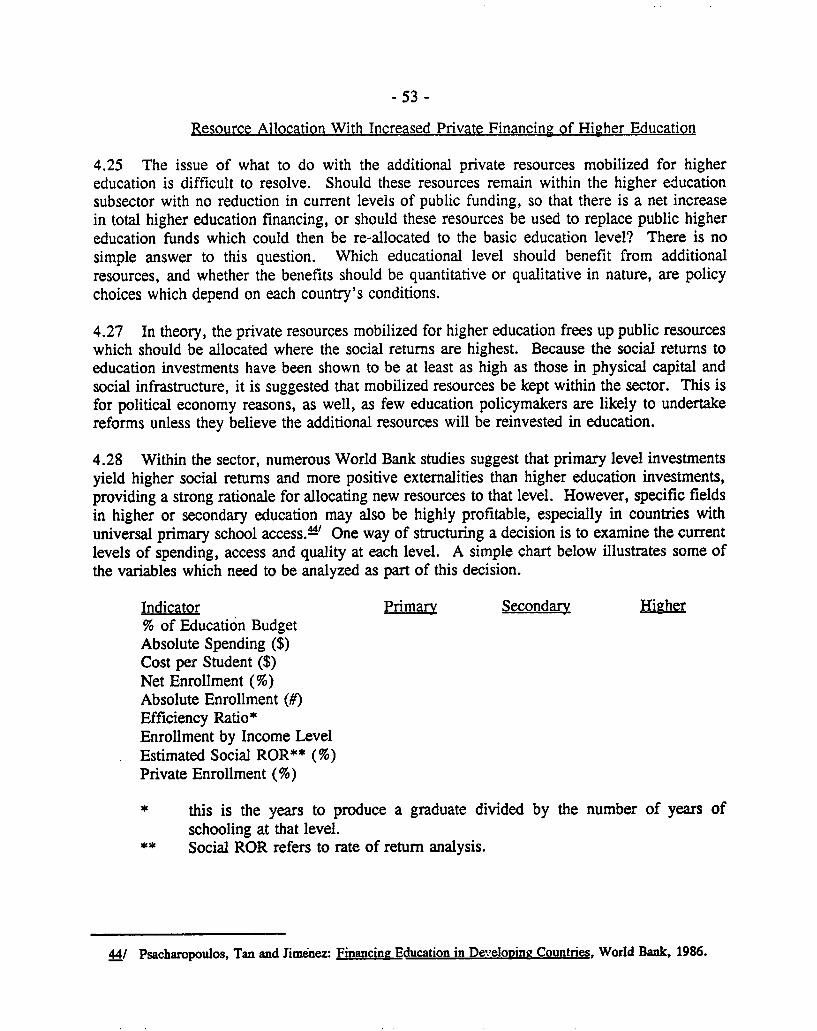
- 53 -
Resource Allocation With Increased Private Financing of Higher Education
4.25 The issue of what to do with the additional private resources mobilized for highereducation is difficult to resolve. Should these resources remain within the higher educationsubsector with no reduction in current levels of public funding, so that there is a net increasein total higher education financing, or should these resources be used to replace public highereducation funds which could then be re-allocated to the basic education level? There is nosimple answer to this question. Which educational level should benefit from additionalresources, and whether the benefits should be quantitative or qualitative in nature, are policychoices which depend on each country's conditions.
4.27 In theory, the private resources mobilized for higher education frees up public resourceswhich should be allocated where the social returns are highest. Because the social returns toeducation investments have been shown to be at least as high as those in physical capital andsocial infrastructure, it is suggested that mobilized resources be kept within the sector. This isfor political economy reasons, as well, as few education policymakers are likely to undertakereforms unless they believe the additional resources will be reinvested in education.
4.28 Within the sector, numerous World Bank studies suggest that primary level investmentsyield higher social returns and more positive externalities than higher education investments,providing a strong rationale for allocating new resources to that level. However, specific fieldsin higher or secondary education may also be highly profitable, especially in countries withuniversal primary school access.-' One way of structuring a decision is to examine the currentlevels of spending, access and quality at each level. A simple chart below illustrates some ofthe variables which need to be analyzed as part of this decision.
Indicator Primary Secondary Higher% of Education BudgetAbsolute Spending ($)Cost per Student ($)Net Enrollment (%)Absolute Enrollment (#)Efficiency Ratio*Enrollment by Income Level
. Estimated Social ROR** (%)Private Enrollment (%)
* this is the years to produce a graduate divided by the number of years ofschooling at that level.
** Social ROR refers to rate of return analysis.
44/ Psacharopoulos, Tan and Jimenez: Financing Education in Developing Countries, World Bank, 1986.

-54-
4.29 For example, in a country with a low-quality, incomplete-access basic education subsectorand a relatively high-quality, high-access public higher education system, it would probablyimprove the efficiency and equity of public spending if resources were shifted from highereducation to primary education. In a country with a well-developed, high-quality basic educationsystem and only a very limited public higher education system, it might be better if privatefinancing was added to public spending at the higher education level. In fact, investingresources now in higher education, in order to improve its internal efficiency, might also be thebest way to free up future resources for basic education. Finally, it is the right of each countryto define its own strategy and priorities for educational development, irrespective of the relativeexpenditures between higher and basic education levels.
4.30 In sum, a priori it is not possible to prescribe resource reallocation from higher to basiceducation, although it might be said that for the Latin American region as a whole public highereducation spending is excessive relative to basic education financing.
The Potential for Resource Transfers from Higher to Primary Education
4.31 Following this line of reasoning, the next logical question is what proportion of thesavings estimated in Table 4.7 might go to increasing primary education expenditures, and whatwould these savings represent in terms of current levels of primary education spending. InFigures 16 and 17 potential primary education expenditures are shown for several LatinAmerican and Caribbean countries, comparing them to current levels (represented by the Index= 100). Note that it is assumed both primary and higher education expenditures will increasein real terms by 1 percent per year; this is not shown because we are interested in comparingprimary education expenditures with and without the transfers from the higher education budget.
4.32 It is interesting to see that in the first few years primary education expenditures mightactually decline in order to finance the start-up costs of the loan program, if the resources forthe loan program could not be generated elsewhere. After six years the loan program wouldbegin to generate net savings as the first borrcwers enter the repayment period. These savings,which we assume for the purposes of this figure are transferred to primary education, wouldcontinue to build until year 15, at which point the loan program would stabilize. It is worthpointing out that these savings are only those generated by replacing 25 percent of the publichigher education subsidy with a loan. The additional savings which might be generated throughthe payment of school fees by more privileged students (who would not need loans) are notconsidered here, on the assumption that these savings would go to finance scholarships and/orbe turned over to the universities for their own purposes. That is, this estimate of savings israther conservative: just 50% loan recovery is assumed (in net present value terms), and feerevenue from non-borrowers is not factored in.!W
45/ The loan simulations assumed a loan equal to 25 percent of the unit cost, a 4-year disbursement period,1 year of grace, 10-year repayment, 20 percent default rate, 18 percent administrative costs, 40 percentinterest rate subsidization, yielding 50 percent loan recovery in net present value terms. Based on
(continued...)

-55-
Primary Education ExpendituresWith Savings from Higher Education
Index 100
200-
150-
1001
50
1 2 3 4 5 6 7 8 9 10 i1i2131415 6i71 i91 202122232425Years
- Index -4- Colombia -*- Ecuador -G- Mexico --x-- Venezuela
Figure 16
4.33 Figure 16 shows potential primary education expenditures for Colombia, Ecuador,Mexico and Venezuela. The most striking case is Venezuela, which could conceivably doubleits primary education spendingA' Meanwhile, Colombia could potentially increase its primaryeducation expenditures by about 80 percent, Ecuador could raise its primary spending by 50percent, and Mexico could do so by about 30 percent. In short, it is clear that considerablepotential exists for primary education spending increases through the expansion of student loanprograms.
45/( ... continued)household survey data, th- percentage of students needing loans varied by country, ranging from 60 to80 percent, assuming equitable higher education enrollments, and enrollments were assumed to grow by
1 percent per year for 25 years.
46/ In 1988 Venezuela spent 36% of its education budget on higher education, and just 21% on primary, sosavings at the higher education level could have a proportionally greater impact at the primaryeducation level. Source: UNESCO 1991 Statistical Yearbook

- 56 -
Primary Education ExpendituresWith Savings from Higher Education
Index 100
150
130 -
120
110
1 2 3 4 5 6 7 8 9 10 1 12 13 14 15 16 17 18 19 20 21 22 23 24 25Years
- Index -+- Aigentina -l- Orazil a Costa Pica -N-Jamaica
Figure 17
4.34 Figure 17 is a similar graph for Argentina, Brazil, Costa Rica and Jamaica. Looking atindividual countries, we see that the greatest potential increases in primary expenditures is inCosta Rica, where spending could increase by 40 percent in real terms. The country with thesecond highest potential primary education expenditures is Jamaica, which could increase itsspending by about 25 percent. Brazil could conceivably increase its primary expenditures bymore than 10 percent, while Argentina could raise its primary education spending by a little lessthan that amount.'' In summary, while not all savings at the higher education level are likelyto be transferred directly to primary education (nor should they be), the exercise above suggeststhat the potential for such resource transfers is considerable and merits serious attention.
47/ Note that these calculations of Brazilian primary education spending include all public spending(federal, state and municipal).

- 57 -
Start-Up Costs for National Student Loan Programs
4.35 The last issue concerning national student loan programs are the estimated start-up costs.These costs include administrative expenses and disbursements to students before the firstborrowers enter the repayment period. In fact, for the first 5-8 years public higher educationexpenditures might actually be greater with a loan program than without it, especially if loansare extended to private higher education students. In Figures 16 and 17 these net negative cashflows can be seen during the first six years of the programs. After this time the net cash flowsto the public treasury become positive as tuition revenue and loan repayments begin to outweighloan disbursements (even though the loan program itself will experience a net negative cashflow). Table 4.8 below provides an estimate of these start-up costs. -'
Table 4.8Student Loan Program Start-up Costs
(in millions of 1989 local currency and US $)
NPV NPV NPVPublic NPV Loan Program Net Net
Higher Ed. Fee Start-Up Start-Up Start-UpEducation Revenue Costs Costs Costs
Country Enrollment ('89 LX) ('89 LX) ('89 LX) ('89 US$)
Argentina 824,346 17,089 43,183 26,094 62Brazil 627,585 1,128 3,770 2,642 932Colombia 434,623 42,178 120,843 78,665 206Costa Rica 57,663 321 2,456 2,135 26Ecuador 151,971 17,952 34,289 16,337 31Guatemala 39,932 13 26 16 4.5Jamaica 12,054 10 58 47 8Mexico 783,704 387,061 739,309 352,247 143Venezuela 498,921 7,776 14,854 7,076 204
\1 Assumes one-half of fee revenue is kept by higher education institutions for their own uses.
48/ Based on a student loan program with: 4 years of disbursement, 1 year of grace, 10 years repayment,20 percent default, 10 percent administrative costs, and 40 percent interest rate subsidization, whichresults in a 50 percent cost recovery ratio. The percentage of students who can afford to pay fees was'determined by analyzing mean household income and varies between 10 and 30 percent. Thepercentage of students taking out loans varies between 60 and 80 percent; for simplicity's sake it wasassumed 10 percent of all students would receive full scholarships.

- 58 -
4.36 The analysis above suggests that the start-up costs of such a loan program, or theexpansion of existing ones in the instances where programs already exist, are not unreasonable,averaging approximately US$30 per borrower over 25 years. This is especially so given thepotentially huge savings on higher education such a loan program could help generate. Theconclusion from this exercise is that even assuming no improvement in student loan costrecovery (and there is ample room for such improvement as will be seen in the next section),expansion of existing programs could mobilize significant private sources of financing for highereducation such that higher education spending could be reduced and/or made more efficient byexpanding access at lower unit costs.
Case Study: Venezuela
A special report for the World Bank concerning the feasibility of introducing studentloan schemes to finance higher education in Venezuela was prepared in 1990 (Reimers,1990). The results of this report can be summarized as follows:
The main finding of the analysis is that student loans to supplement private resourcesfor financing of higher education is a viable alterative which would increase resources forthe university sector while preserving equity. In the worst case, that is even if moststudents needed loans to pay their tuition and even if just a few of them repaid those loans,the loans would have the effect of making what is now an indirect subsidy explicit, allowingthe- implementation of some measures that could reduce wastage in the universities byreducing the amount of time it takes a student to graduate (at present it takes the publicuniversity system from 9-29 years to produce one graduate of the 5-year system).
A scenario in which tuition fees cover only a portion of the average unit cost (25percent), and where loans are used to assist students from families whose income would notbe sufficient to pay these fees, is preferred over a scenario in which tuition covers a greaterpercentage of the average costs (which would have the effect of requiring loan assistanceto more students). The former would generate fee revenues which would be more thandouble the amount needed to finance the loans for those who could not afford the fees.Furthermore, up-front.fee revenues are preferable to longer term loan repayments, whichare always somewhat uncertain given inflation and default rates. Finally, this proposalcould be entirely self-financing, as students would graduate with debt burdens that couldbe repaid by spending at most 6 percent of minimum university graduate salaries over aperiod 2 to 3 times the period in which the loan was disbursed.
Box 8

- 59 -
Administration of Student Loan Programs
Administrative Structures
4.37 LAC student loan programs can be divided into those which are public (40 percent),private (50 percent) or of mixed character (10 percent). All three types have advantages anddisadvantages. There are well-functioning public institutions (ICETEX and CONAPE) andprivate institutions (FUNDAPLUB and CENTRALSEGUROS), as well as poorly functioninginstitutions of both kinds. The public programs have better access to direct government budgetallocations and can more easily undertake legal proceedings in the event of default (e.g., usingthe income tax service to deduct loan payments). They also have greater capacity to raise fundsfrom international donors and can use the backing of the gevernment to mobilize funds throughbond sales and earmarking of taxes and/or payrolls. On the other hand, public programs lackthe incentives of the private sector to recover loans. They tend to be unwieldy, less efficientinternally, with little autonomy over personnel and salary levels. Heavy government regulationon the use of funds prohibits use of optimum financial management practices, especially inhedging against inflation and investing capital funds. Finally, public programs tend to be moresusceptible to political pressures than private loan schemes.
4.38 Private programs (not surprisingly) have the opposite advantages and disadvantages.Compared to public programs, they are more agile in terms of financial management, moresuccessful at raising funds from the private sector (especially large companies and universities),more efficient in their internal processes, with greater flexibility to change lending terms (e.g.,interest rates) and maximize staff productivity. They are also more immune to politicalinfluence. But private programs typically cover far fewer students than public schemes, becauseof their limited access to funds which can be lent at subsidized rates. Lastly, they have greaterdifficulty in imposing sanctions on defaulters.
4.39 Perhaps the optimal structure is mixed, that is, private, autonomous, and non-profit, withlegal recognition that the program is in the public interest and as such may receive directgovernment subsidies and government guarantees on loans. This structure is observed in thecase of FUNDAPEC in the Dominican Republic, which receives annual transfers from thegovernment, as well as funds from the InterAmerican Development Bank, but retains authorityover all lending terms, personnel decisions, capital investments, etc. In the final analysis, thereis no one best administrative structure. Each program needs to determine what structure is bestfor their particular country, in order to maximize: access to funds, sanctions in the case ofdefault, and autonomy for internal efficiency.!'
49/ Rodriguez, 1992.

- 60 -
Administrative Constraints
4.40 The administrative difficulties involved in running a student loan program are not unlikethose in other public-interest financial institutions and fall into four categories: human, technical,financial and political.
4.41 Human: Most loan programs in Latin America suffer from shortages in qualified, trainedpersonnel, in part because salaries are low relative to what could be earned in the private sector.Knowledge of basic principles of finance is limited to a few technical staff; proficiency withcomputers (virtually a prerequisite for financial institutions in developed countries) is quiterestricted; investment skills, particularly for diversification of risk and hedging against inflation,is very scarce; and too often lower level employees lack the necessary work incentives to carryout their jobs efficiently.
4.42 There is also a lack of systemic planning and evaluation within student loan programs.Therefore, few studies exist concerning the targeting impact of the loan programs, the successof borrowers, or the need for additional or different modes of lending. Information systems arepoorly developed and rarely provide information needed for negotiating with universities,Ministries of Finance and Education, and international organizations.
4.43 Technical: Here the problems are related to the availability of information technologyhardware and software, necessary to ensure accurate financial projections and up-to-datestatistical information for planning, research and daily operations. Particularly in high-inflationcountries, of which there are still several in Latin America, the capacity to manipulate variablessuch as interest rates and repayment schedules, and to devise measures to minimizedecapitalization, is vital. The survey of Latin American loan programs indicates that while mosthave computerized accounting systems, few have automated their loan processing, investmentand beneficiary monitoring procedures. This means services of lower quality and efficiency, aswell as higher than necessary administrative personnel costs.
4.44 Financial: Financial constraints determine many of the human and technical constraintsdescribed above, reducing loan programs' abilities to (a) hire high-quality staff, who aretypically more expensive; (b) make investments in technology, which could speed up andincrease the value of loan recovery; and (c) offer loan counseling services (such as thosedescribed in the next section). In a broader sense, though, financial constraints often make itimpossible to expand lending programs such that administrative economies of scale could begenerated, either through greater coverage or higher loan value amounts. Finally, the strongsocial objectives of student loan programs (especially those which are public) means manyprograms are constrained from raising the interest rates they charge. It is worth noting thatamong LAC student loan programs most public schemes charge negative real rates of interest,while all private schemes surveyed charge positive real interest rates (even though all programsare non-profit).

- 61 -
4.45 Political: While difficult to document, nearly all loan programs surveyed mentionedpolitical factors as a major source of administrative inefficiency. More specifically, many loanprograms have historically been forced to extend loans only to students favored by politicallypowerful groups. Favoritism might be according to regional bias, political affiliation, kinship,or other criteria. The effect of such political pressure is reduced targeting (e.g., based oneconomic need and academic merit), lending to students who could afford to pay highereducation fees, lax enforcement of repayment obligations , and exhaustion of program resourcessuch that loan programs suffer decapitalization. This is especially the case for publicallyadministered programs.
Administrative Costs
4.46 The actual administrative costs of student loan programs were difficult to determine, inpart because the loan programs surveyed used different methodologies for reporting theiroperating costs. As a percentage of the net present value of the loans disbursed, estimatedadministrative costs varied from 7 to 24 percent, with a mean around 15 percent. That is, forevery US$1,000 disbursed student loan programs spent an estimated US$150 on administrativecosts.
4.47 This estimate of administrative costs was partially substantiated by case studies of studentloan programs in Colombia and Jamaica. In Colombia, total administrative costs were calculatedat US$148 per loan, with an average loan size of US$1,050. In Jamaica administrative costswere estimated at US$337 per loan, with an average loan size of US$1,045. Note that thesecosts include keeping track of the students and the amounts of principal and interest due throughall the years of loan disbursement and repaymnit (up to a fifteen year cycle). As both apercentage of the loan disbursement and in absolute US dollar terms, the Colombian student loanprogram is much more efficient. This is partly due to the fact that the repayment period onstudent loans in Colombia is only half as long as that in Jamaicp, so the costs of trackingborrowers and processing repayments is greatly reduced. Perhaps more importantly, loweradministrative costs are due to economies of scale: the Colombian loan scheme extends 14 timesas many loans as the Jamaican program, and has computerized most of its operations. This isan important lesson for those considering major expansions of student loan programsA0'
Targeting
4.48 With respect to the ability of loan programs to target loans on the financially needy, theexperience has been mixed. In general, student loans for higher education benefit the middleclass. This is because middle class students form the bulk of the loan applicant pool, are ableto find credible guarantors, and have had the necessary access to quality education at lower
50/ This discussion draws heavily from: Grosh, Margaret and Juoy Bu. (1992) From Platitudes toPractice: Targeting Social Programs in Latin America. Washington, D.C.: World Bank LATHRTechnical Series Report

- 62 -
levels. Most students from poor backgrounds never enroll in higher education because they:cannot afford the private costs of higher education, especially foregone earnings; lack access toquality basic education which would enable them to meet entrance requirements; and are hardpressed to find guarantors. This is not to say, however, that loan programs lack the capacityto target. 12 of the 14 student loan programs surveyed do administer some form of means testsfor applicants, typically requiring household income information. Furthermore, 10 of the 14programs give higher priority to low income loan applicants. A recent study estimated the cost-f this targeting procedure in Jamaica at US$40 per loan which, given the relatively high valueof the loans disbursed, is quite reasonable.L' In sum, most student loan programs can and dotarget loans on the most needy, but because the applicant pool is so heavily skewed towards themiddle and upper classes, this targeting effort has little impact.
Options for Reform of Student Loan Programs
(1) Positive (though subsidized) Interest Rates
4.49 Loan programs should charge positive real interest rates, altht -h it is recognized thatbecause of political factors (and arguable capital market failure) student loan interest rates arelikely to remain somewhat subsidized. Furthermore, rather than fixing interest rates for theduration of the loan, student loan rates should be allowed to vary according to inflation and/orcommercial interest rates. For example, loan interest rates could be pegged at 3 percent aboveinflation, or at 80 percent of the prevailing commercial rate. A variable interest rate isimportant for the loan program to more accurately forecast cash flows in real terms, and it hasthe added advantage of maintaining the level of the interest subsidy constant."'
4.50 In Latin America several loan programs now apply such a variable rate. Brazil's CEFand FUNDAPLUB vary interest rates with inflation; the Dominican Republic's FUNDAPECuses a standard 80 percent of the commercial rate; Peru's IPFE indexes interest rates to CentralBank rates; and the State of Sonora (Mexico) loan program ties rates on postgraduate studentloans to government treasury bond rates. This should become standard practice for all studentloan programs, especially in Latin America which has a history of high inflation.
(2) Repayment Periods
4.51 The determination of the appropriate repayment period is difficult. On the one hand, alonger period stretches out payments, making them more manageable financially and reducingthe risk of default. On the other hand, the longer the repayment period the greater the financialloss to the program due to the interest subsidies. Simulations of student loan financial modelsindicate that a 10-year repayment period would be affordable for most higher educationborrowers, while not resulting in excessive interest subsidy losses. By contrast, most Latin
51/ Ibid.
2/ Albrecht and Ziderman, 1991

h

- 64 -
Colombia Age-Earnings Profile (10%),Relative to Student Loan Payments
Pesos/Year (Thousands)700
600 -
600 -
400-
300 -
200
100-
0"22 23 24 25 26 27 28 29 30 31 32
Age
- Earnings Mortgage Graduated
Figure 18
4.54 In Figure 18 the age-earnings profile of Colombian higher education graduates aged 23
to 32 is shown, adjusted for inflation. Note that these earnings are actually juqt 10 percent of
total earnings, for the purposes of comparing affordable payments to actual .,at repayment
obligations, so that the interest rate on the graduated loan matches inflation (explaining the
dramatic increase in salaries and payments over time). Repayments under the mortgage loan
(see as a straight line) must be made in just 4 years, which requires loan payments equal to
approximately 20 percent of graduates' earnings in the first years after leaving school. In
contrast, the graduated loan keeps payments to about 10 percent of income, which reduces the
likelihood of default, lengthens the repayment period to eight years, and still recovers the same
amount of money in net present value terms. This is not only good for the loan program but
also for the borrower.

- 65 -
Costa Rica Age-Earnings Profile (10%)Relative to Student Loan Payments
Colones|Year (Thousandsl
000
600 -
400 -
200 -
022 24 26 28 30 32 34 36 38
Age
-Earnings -- Mortgage +Graduated
Figure 19
4.55 Figures 19 provides a similar analysis for Costa Rica, comparing higher educationgraduate earnings to loan repayments forecast by using flat mortgage and graduated repaymentprograms. In Costa Rica the difference in repayment streams is considerable, with fla+ mortgagepayments representing approximately 50 percent of higher education graduate earnings (recallthat in the graph only 10 percent of graduate earnings are shown).L' By lengthening therepayment period, keeping payments low at first and increasing them over time as earnings rise(peaking at 15 percent of income), the risk of default could be significantly reduced. Onceagain, the graduated repayment program would generate the same percentage of cost recoveryas that forecast by the mortgage repayment program. This is an important lesson for all studentloan programs: by matching repayment obligations to average higher education graduateearnings, the likelihood of loan recovery can be greatly enhanced. Furthermore, simplespreadsheet software programs readily available make this relatively simple to do.
531 Note that estimates in Table 4.5 of the percentage of income required to repay loans differ from those
in Figures 18 and 19. This may reflect changes in the labor market between 1989 (when household
survey data was collected) and 1992 (when information for Table 4.5 was collected). The difference
may also be due simply to the fact that Table 4.5 is based on loan program administrators' bestestimates, rather than on quantitative survey data.

- 66 -
(5) Reducing Default
4.56 Sanctions Lengthening repayment streams and/or structuring them to correspond tohigher education graduate age-earnings profiles will go a long ways to increasing theaffordability of loan repayments, thereby reducing the probability of default. Yet beyond theissue of affordability is simple evasion. Many graduates may be able to afford to pay yet choosenot to. To guard against this, student loan programs must diligently pursue borrowers who failto make their payments. This means increased legal authority and willingness to apply higherinterest on overdue payments, seize collateral, oblige loan guarantors to repay, publicize thenames of defaulters, and initiate legal proceedings against defaulters.
4.57 Although in Latin America almost all loan programs already require loan guarantors andsome form of collateral, legal and administrative delays in obliging payment by guarantorsand/or seizing collateral are a problem. These delays need to be minimized by strengtheningthe legal authority and collection incentives of loan programs. Additional measures mightinclude authorization of loan programs to pass along defaulters' names to other importantinstitutions such as: (a) credit agencies, which could identify defaulters when they apply forhousing or car loans; (b) social security institutes, which could deduct required payments fromindividual accounts or reduce defaulters' access to services; (c) the internal revenue service, sothat payments can be automatically deducted from any tax refunds; (d) banks, who could deductthe required payment from the defaulter's account for a fee charged to the defaulter; and/or (e)employers, who might be required to deduct payments from defaulters' paychecks (so-called,"garnishing"). Furthermore, borrowers might be required to furnish monthly bank accountstatements to loan programs, so that administrators can assess ability to repay loans (as is donein Peru), or provide copies of their income tax statements (as is done in the DominicanRepublic). In Bolivia, authorization to use the income tax system to collect loans in arrears hassignificantly reduced default.
4.58 Incentives Equally important as legal authority to sanction defaulters are incentivesamong loan program administrators to go after borrowers who neglect their repaymentobligations. One measure would be to offer loan collection officers a bonus for overdue loanscollected (perhaps a percentage of the amount collected). Awards might be offered to thecollection officer who collected the highest value of loans overdue, thus fostering healthycompetition among collection officers. In El Salvador, the use of students (typically borrowersthemselves) to chase down defaulters at the places of work and/or residence has been anothereffective measure; these individuals have been selected for their willingness to travel by publictransportation, track down defaulters and personally request payment, a task which civil serviceloan administrators may resent doing. In Honduras, a similar default reduction programcontracts with private locator and collection agencies, which have reduced the default rate from90 to 2 percent.!' This is also done in the Dominican Republic, Bolivia and Colombia, with
54 Albrecht and Ziderman, 1991.

-67-
the latter passing on the cost of the private collection agencies to the defaulter, in the form ofadditional financial penalties.
4.59 Simplification Simplification of payment procedures may also reduce default. Forexample, automatic bank account deduction procedures can be arranged, so that borrowers donot have to send in checks monthly, but rather authorize the loan program to deduct requiredamounts from their bank account each month (as is done in Colombia). Similar arrangementscould be made with the borrower's employer, so that loan payments are deducted automaticallyfrom wages and forwarded to the loan program each month.
4.60 Insurance Another step to reduce default would be to require borrowers to take outdefault insurance, with the premium taken out of the initial loan disbursements. This is alreadydone in Costa Rica and Colombia, while in Brazil and Guatemala insurance policies againstdisability or death are required. More extreme sanctions for default include refusal to issuepassports or driver's licenses to loan defaulters. The former is used in several Caribbeancountries in which restrictions on travel abroad are strong incentives to repay. Where feasiblethis could be adopted in other countries, as well.
4.61 Social Security Institutes as Loan Collection Mechanisms One possibility for improvingloan repayment is the use of Social Security Institutes (SSIs) as collection mechanisms, insofaras these institutes are well-developed in Latin America, typically cover much of the country, andare well-linked to payroll systems such that payments into social security systems are automaticin most cases. This option was examined through a survey of Latin American loan programsand interviews with social security experts.
4.62 Among those loan programs who responded, only one reported using the SSI forrepayment (Nicaragua, which is not currently functioning), and no other program expressed aninterest in using the local SSI (with the exception of Costa Rica). Among private loan programsthere is an obvious problem of using a public health agency to collect their loans. Among publicloan programs there was near universal consensus that the SSIs do not have the capacity, speed,efficiency, information systems and legal structures required. In fact, one program (Ecuador)currently receives a 0.5% payroll tax through the SSI, but there have been so many problemsin transferring these funds that the Ecuador program preferred to "do without" this possibleassistance.
4.63 Looking deeper into loan program responses, there seems to be a common fear that SSIsare too powerful politically, and yet too weak institutionally, to work effectively with loanprograms. That is, loan program administrators foresaw major difficulties in actually receivingthe money they would be due (with little recourse in the event of non-payment by the SSI), andtoo much inefficiency and incompetence within SSIs to achieve loan recovery. In its owncomments to the individual loan program responses, the Pan American Association ofEducational Credit Institutions (APICE) described Latin American SSIs as having too manyfinancial and administrative problems themselves to render feasible their use for loan recovery.

- 68 -
4.64 In fact, Carmela Mesa-Lago's recent study of LAC Social Security Institutes suggestedthe need to search for alternative methods of financing to reduce the risk of evasion and delay;this does not give much hope for reducing loan payment evasion and delay via these institutions,attractive though the idea may sound (see Annex F for a lengthier discussion of this point). Onthe other hand, increasing attention is now being paid to reform of Social Security Institutes, sothat it is not unreasonable to think that in the future they might be an effective vehicle for loancollection. The topic merits further study with a view towards medium-term student loanprogram design.
Box 8: Ghana: Using Social Security for Student Loan Repayment
In 1989 the Ghanaian government began to charge university students for housing andmeals. At the same time, it offered students an optional loan worth about US$ 200 to helpmeet these costs. The interesting feature of this loan was the collection mechanism - the socialsecurity system. Graduates repay their loans through their standard social security deduction,which goes to their loan account in the Ministry of Education rather than to their own socialsecurity benefit account until the loan is paid off. The social security tax rate remains thesame; students simply defer making contributions to their own retirement accounts during theloan repayment period. Repayments are based on the standard 5 percent social security payrolldeduction, plus the employer's 12 percent contlibution. By definition they do not begin untilthe borrower finds a job.
Beyond the administrative and accounting problems this policy implies, a number ofissues arise. The first is a large interest subsidy on the loan. The second is whether theborrower actually makes any contribution. Because repayments are mad, to the governmentregardless of whether the worker borrowed money or not, no additional revenues are collectedby the government. This means the social security system may be subsidizing universityeducation. This paradox is explained by the fact that workers usually accumulate maximumretirement benefits some years before retirement, but contribute to the social security systemso long as they are working. Therefore, even if borrowers delay four years before startingto accumulate their retirement benefits (because their payments are going to pay off their loan),their normal work life may be such that borrowers work four or five years beyond the periodnormally required to accumulate full retirement benefits, so that they get full retirementbenefits after all. Ultimately, the government may have to find extra resources for the socialsecurity system.
Source: Albrecht and Ziderman, 1991
Box 10

-69-
(5) Increased Targeting of Student Loans
4.65 Tuition fee increases will increase the demand for student loans, which means improvedtargeting criteria for allocating loans is required. By limiting student loans to those who trulyneed and/or deserve them, the rationing process can be made more efficient and equitable, andsubsidized student loans can have the most beneficial impact. The targeting criteria most oftencited are means testing and academic performance.
4.66 Means testing implies examining the family income of loan applicants. This may be byincome tax statements, parental occupation, ownership of valuable assets (home or car),neighborhood of residence, or even parents' education. Based on such examination the financialneed of students can be determined. If desired, loan applicants can be ranked according to need(as is done in Brazil), which may be useful is allocating scarce public funds. Efforts to assessfinancial need purely on the individual loan applicant's income are unlikely to be productive,however, as few students have significant sources of income. On the other hand, householdincome analysis should be adjusted for the number of dependents (particularly those who mightalso be enrolled in higher education).
4.67 Based on this analysis a "sliding scale" could be applied, such that the loan is calculatedto bridge the gap between expected parental contributions (based, for example, on 5-10% ofannual income) and higher education costs. For families in the greatest need, care should betaken not to propose loans which will result in unbearable repayments, meaning that averagehigher education graduate earnings should be considered in calculating the level of an affordableloan. If students need more than this amount consideration should be given to extendingscholarship funds to finance the difference bet-veen financial need and affordable loan amounts.Particularly for poor students, financial aid should not be restricted to covering the direct tuitioncosts of higher education, but should cover tuition, books, living costs and even opportunitycosts, so that students may attend school full-time.
4.68 Academic merit is the other popular targeting criteria, as measured by studentperformance on standardized tests, university entrance exams, secondary school grades or someother such evaluation instrument. Targeting by ability mreans those students least likely to repeatand/or dropout are selected, and it constitutes a potentially powerful performance incentive. Asa secondary measure, loan eligibility during the period of higher education study should remaindependent on attendance, achievement of satisfactory grades, academic honor (i.e. no cheatingor suspension), and provision of up-to-date address information (including that of the familyand/or loan guarantors). Depending on the objectives of the student loan program, the twotargeting criteria can be used together to select only those in need and showing academicpromise, or they can be used separately to produce a mix of students (some financiallydisadvantaged and others academically gifted).
4.69 Earlier reference was made to the fact that in the case of higher education it is difficultfor student loan targeting to produce truly progressive outcomes, because the loan applicant pooldraws heavily from middle- and upper-income groups. On the other hand, expansion of student

-70-
loan programs should expand the applicant pool to include more lower income students. Thiswould be especially so if public hig.er education finance reform permitted increased basiceducation investments in poor areas. 1 he important point here is that targeting appears to beboth cost-effective and feasible from an administrati- and technical perspectiveA'
4.70 Additional limits on student loans should be placed on the total amount and/or durationof the loans. That is, student loans should not be open-ended so long as the student is enrolled,as this provides no incentive to graduate. Making the loan available only for a number of yearsequivalent to the prescribed period of study would encourage students to apply themselves totheir studies and graduate within the lending "time envelope". The same is true of limits ontotal lending amounts, which has the added value of preventing students from borrowing beyondwhat they can afford, thereby zeducing the chances of default. One attractive variation on thisis a kind of loan voucher used in Denmark, which entitles the student to borrow from a fixedamount as he or she chooses (the amount is enough to finance four years of schooling). Thisprovides flexibility in attendance, especially important for part-time (and night-time) students,while maintaining the incentive to graduate within a four-year period of enrollment.L'
(6) Revised Incentives for Loan Program Personnel
4.71 An important reform for student loan programs would be revised personnel policieswhich reward high quality staff. In fact, this was cited by 75 percent of all loan programssurveyed as the greatest priority for improving program administration.
4.72 More specifically, revised incentive structures for loan program staff are probably moreimportant than investments in technology. For example, loan repayment personnel should becompensL ed in part on a commission basis, whereby they receive a percentage of each loanrepayment to encourage diligent follow-up of beneficiaries. Administrators should be rewardedfor lowering the ratio of administrative costs to loan portfolio value, while investment fundmanagers should be paid in part on the basis of the performance of their capital investments.Finance Division Chiefs could receive a bonus for every non-governmental contribution theyraise (e.g. from foundations, employer associations, or external donors). The point is, loanprograms need to operate more as private sector self-financing entities, which means institutingmonetary incentives for improved performance.
4.73 As part of this process, information on administrative expenditures and personnel shouldbe refined, standardized and kept up-to-date. This information can be used to monitor andreward the performance of loan program staff. In some cases, unneeded and/or incompetentpersonnel may need to be dismissed. Strong management leadership is required for this processto succeed.
551 Grosh, Margaret and Judy Baker. (1992) From Platitudes to Practice: Targeting Social Programs inLatin America. Washington, D.C.: World Bank LATHR Technical Series Report.
56I Albrecht and Zidernan, 1991

-71 -
(7) Personnel and Technology Upgrading
4.74 Loan programs need to devote more resources for staff training courses in financialmanagement, and for the acquisition of simple computer hardware and software (which wouldinclude training in their usage and applications). At a minimum, loan programs should haveautomated loan application and registration processes, as well as loan payments, status ofindi"idual accounts, and up-to-date lists of delinquent borrowers. Computerization is not apanacea, however. Personnel must be trained in their use and their application with appropriatesoftware so that equipment is properly utilized. Otherwise, automation will be a cost withoutgreater benefits.
(8) Additional Administrative Reforms
4.75 Counseling All loan programs should increase their counseling of loan beneficiaries.Training sessions could be held twice a year (at the beginning and just before the end of theschool year), at which attendance would be required for new and terminating beneficiaries. Atthis time the terms and conditions of the loans can be explained, as well as the sanctionsimposed in the event repayment obligations are not honored. Sample repayment tables could beexplained. Collaboration between loan programs and higher education institutions in the designand implementation of these seminars would be important.
4.76 More specifically, students must understand: how their payments are calculated; the legalobligation of repayment even if they drop out of school; their rights and responsibilities,including the range of repayment options; the requirement to provide current address informationto the lending institution; and the importance of not over-borrowing, in order to minimize futuremonthly payments. Pamphlets containing this information could be distributed during thetraining sessions. Simple lessons in post-graduation budgeting might also be useful. Whilecounseling would imply additional costs and the hiring of loan cunselors who would travel toselected institutions to give seminars, it should more than pay fo itself in the form of increasedrepayment.
4.77 Follow-Up. Experience has shown that the first year after school is the most critical.This is when patterns for repayment or non-payment are developed. It is also when graduatesare typically in greatest flux, relocating to new jobs, incurring new financial responsibilities, etc.Loan programs need to track students during this time, sending follow-up letters, making phonecalls, and generally reminding students of their obligations. In addition, loan programs shouldplay a more supportive role, offering information as to where students can receive job placementinformation.
4.78 Beyond the first year after graduation, loan programs should conduct periodic monitoringstudies of loan beneficiaries. Two objectives could be achieved with this activity: understandingcauses of default and identifying ways to improve lending services. This would require intetalia information regarding the job placement rate of graduates; what careers offered the greatestemployment opportunities; school dropout rates; and reasons provided by graduates for loan

-72-
default. Understanding the causes of default may lead to corrective actions, such as increasingstudents' knowledge of their responsibilities, strengthening job placement information, orimproving the quality of higher education.
(9) Increased Responsibility of Higher Education Institutions and Ministry ofEducation
4.79 Information Flow. In addition to offering assistance to loan programs in the provision ofloan counseling seminars, higher education institutions must fulfill their responsibilities inreporting student grades, student addresses, graduation and dropout lists, and any job placementinformation they might have. In a more general sense, higher education institutions would helpby raising the quality of the education offered, so that fewer students dropout and more studentsacquire the necessary skills to find employment after graduation.
4.80 Increase Retention Rates. Studies have shown that in the United States half of alldefaulters drop out before completing their post-secondary education.' Drop outs raxely findjobs enabling them to meet their financial obligations, and/or -efuse to pay their loans becausethey feel dissatisfied with what they received in exchange. Reducing dropout means: improvingscreening of students so that those enrolled have a reasonable chance of success; monitoringstudent attendance; increasing academic counseling services; and providing accurate informationto prospective students regarding completion rates, additional costs of attendance and programrequirements, so that they can evaluate their likelihood of graduation before becoming indebted.
4.81 Certification. Ministries of Education could play an important role in ensuring that allhigher education institutions are of sufficiently high quality.' This might mean evaluatinginstitutions for default rates, graduation rates, licensure rates (in the case of technologicalinstitutes), and diligence in providing information to loan programs. In the event ofunsatisfactory evaluation, the Ministry should declare that institution ineligible for student loans.
4.82 Facilitate. Ministries of Education should support loan programs and higher educationinstitutions in their efforts to provide information to student borrowers. This might meanproduction and distribution to secondary schools of student loan information, or evendevelopment of debt management materials for use in loan counseling seminars. Promptprovision to loan programs of loan applicants' academic qualifications is also necessary.
(10) Political Autonomy
4.83 Student loan programs must focus on economic need and academic merit. This meansa commitment from political actors to refrain from using loan programs for their own purposes.
57/ Reducing Student Loan Defaults - A Plan for Action, U.S. Department of Education, Office ofPlanning, BAdget and Evaluation, 1990.
58/ Ibid.
- 73 -
One way to encourage this would be to make the loan application and selection process moretransparent, which might include independent audits of the selection process and/or the annualpublication in national newspapers of loan selection criteria and the extent to which loanselection that year matched these criteria. It may also mean fines, property seizures and othersanctions of a few particularly successful but delinquent borrowers, with extensive publicity toserve as a public warning.
Loan Program Privatization
4.84 An alternative or complement to a reformed public-sector loan program (so that itoperates more like a private sector entity) is to privatize all or part of the loan program. Thismay be particularly appropriate if a country is considering a major expansion in lendingcoverage and volume, because in many countries private financial institutions are relatively welldeveloped anJ could in most cases handle the technical and administrative responsibilities of anexpanded loan program more efficiently than public institutions. Even more importantly,commercial banks by nature have the profit incentive to lend and collect large numbers of loans.On the other hand, there are several cases of public loan programs functioning quite well duringand after expansion; the ICETEX program in Colombia stands out for its broad coverage,diverse funding sources, efficiency and professionalism.
4.85 One option would be for the government to simply contract with private banks and/orother financial institutions to assess the credit risk of loan applicants, to secure collateral,disburse loans and oversee loan collection. Even if the contract terms between the governmentand private institutions enable banks to earn significant profits, such contracts might save thegovernment money by improving loan program financial performance and reducing the need forannual infusions of public money. Furthermore, using commercial banks would mean thegovernment would not have to put up the initial capital outlay for the loan program (or at leastnot all of it). It would also mean avoiding the establishment of a potentially costlyadministrative apparatus to handle the program.
4.86 Most analysts agree that public sector funds for loan programs will continue to benecessary, because of various market failures in the functioning of private capital markets asthey relate to higher education. However, this is not to say that all money should come fromthe public sector; private banks would have an intc rest in lending to more credit-worthy students(i.e., wealthier students, who offer greater repayment security), because of the normalopportunities for profit and their interest in securing new customers (who are likely to haverelatively high incomes). All that may be needed to overcome market failures is governmentsharing of the interest rate and/or default risks through government guarantees. For example,if commercial interest rates rise significantly after fixed-rate stuaent loans are made, thegovernment might reimburse private lenders for one-half the value of the rate increase, so thatthe lender is not stuck with a loss-making 10-year low-interest loan. Alternatively, 50 percentof the value of any loan might be government-insured; in the event of default banks would notabsorb the entire loss but would still have the incentive to go after defaulters. These twoexamples which equally divided the interest and default risks between the government and theprivate sector are purely illustrative; the actual division of risk would have to be negotiated.

- 74 -
Student Loans in the United States -
1 Perhaps the most notable example of a largely privatized program is the U.S.Stafford Loan Program. Under this program, students satisfying financial need criteriahave access to subsidized loans from private commercial banks at a fixed rate. Thegovernment guarantees the loan against default and pays the interest rate subsidy to thelender. For example, on a fixed-rate student loan at 8 percent with commercial lendingrates at 10 percent, the government reimburses the bank for this 2 percent difference, sothat the commercial bank is in effect making a floating interest rate loan (i.e. it has nointerest rate risk). In the event of default the bank turns the loan over to the governmentfor payment (i.e. it has no default risk, either). This is an example of a program which hasprovided too much security to commercial banks; rather than sharing the interest rate anddefault risks the government absorbs them completely, which encourages banks to make toomany high-risk loans.
2 Under this scheme there is little incentive for banks to screen loan applicants forcreditworthiness or go after delinquent borrowers; they simply disburse the loans, chargethe government the prevailing interest rates, and turn over any bad loans to the Departmentof Education. With no one controlling for the quality of either the students receiving loansor the institutions attended, and with no incentive to chase delinquent borrowers, the defaultrate on U.S. student loans is currently estimated at 17 percent, at a cost of about US$2billion in FY 1990. It is highest (33 percent) among students attending private tradeschools (some of which do not require secondary education degrees), but just 7 percentamong students attending four-year institutions.
3. In June 1992 Congress passed a US$100 billion higher education bill, increasing theaccess to loans for middle- and upper-income students. Under the legislation any family,regardless of income, can qualify for a 9 percent government student loan, which requiresimmediate payment (instead of waiting until after graduation). Maximum loan sizes forstudents from families with incomes below US$42,000 was increased 20% to US$3,700,and family equity in homes or farms will no longer be considered in determining eligibilityfor subsidized loans. It is worth noting that the bill includes a 5-year US$500 million pilotprogram aimed at eliminating private banks from the student loan system and making thefederal government the direct lender. Supporters of direct loans say this will save US$275million over five years, and some of these loans include the option to repay based onstudents' post-graduate income (rather than on a fixed payment basis). Finally, the billprovides additional financial aid to students who agree to teach in underserved areas as partof a new Teachers Corps, a form of in-kind payment on student loans.
sources: Reducing Student Loan Defaults: A Plan for Action. US Department of Educ.-tion, 1990;and The Washington Post, 7/1/92, pp. A-1 and A-18.
Box 11

- 75 -
4.87 Finally, loan collection may be the most logical service to be privatized, as banks andcollection agencies would have a clear incentive tr, go after delinquent borrowers and ensure
repayment so long as they received a percentage of the loan paymentA' On the other hand,public lending institutions have better contacts with other public agencies, such as income taxauthorities, passport agencies, motor vehicle registrars, etc. so that in the event of default strongsanctions can be applied. This may be particularly important for student loans which are often
made with little collateral or other security against default. It is worth pointing out, however,that there is nothing preventing the use of the private sector to collect and the public sector to
apply sanctions in the event of default.
Alternative Lending Scenarios
4.88 The discussion so far has focussed only on student loans with payments fixed in equalamounts, or in graduated amounts so that payments roughly parallel higher education graduate
age-earnings profiles. However, there are several other lending strategies which bearmentioning, including: income-contingent loans; graduate taxes (a kind of equity finance);employer taxes; and national service. This section briefly describes these alternatives and
suggests they be evaluated whenever increased higher education cost recovery is considered.
These alternatives might be viable substitutes to an expanded traditional student loan program,
or they might be complements (e.g. a student loan could be paid off through national service).
Income-Contingent Loans
4.89 The case for income-contingent loans extends the recommendation made earlier callingfor student loan repayments which correspond to graduate earnings. Simply put, such a schemewould require all higher education graduates to repay their student loans with a certain
percentage of their income, whatever it was. This idea is based on a set of propositions best
stated by Nicholas Barr:f'
(a) higher education produces a major private benefits, so the individual should payat least part of the costs of higher education;
(b) for efficiency and equity reasons private funding of public higher educationshould be primarily the responsibility of the student, not the family, who shouldbe able to borrow against future earnings;
(c) because higher education is a risky investment (such that capital markets do notwork) the government should protect both the borrower (i.e. the student) and thelender against these risks.
5/ This is currently done in Honduras, Bolivia, Colombia and the Dominican Republic, and a similar
policy may be introduced in Venezuela's FundAyacucho Student Loan Program.
60/ Barr, 1991

- 76 -
4.90 These propositions imply that loan repayments should be based on the post-graduationincome of the individual student, and when other guarantors cannot be secured the governmentshould guarantee the loan. Grants should be maintained but targeted, to promote highereducation access for disadvantaged and/or gifted students. Loans should not be heavilysubsidized because they are essentially a device for providing students access to higher futureearnings; equity objectives should be pursued explicitly through grants. Finally, becauseindustry benefits from the increased productivity of higher education graduates they shouldcontribute to public higher education via a payroll tax.
4.91 Perhaps the most important factor in considering this alternative is the capacity of thenational income tax system. That is, the national tax service and not the loan program mustcollect. the repayments, verify the amounts, and credit each borrower's loan account accurately.Unfortunately, for many LAC countries such a broad-based tax system does not exist (e.g.Venezuela, which depends on oil for most revenues), or where it does taxpayer noncomplianceis extremely high (and may be higher than current student loan default rates)A' Under thesecircumstances such a loan scheme would not be feasible. On the other hand, in smaller LACcountries (e.g. Costa Rica and Jamaica) income tax administration is better such that this typeof loan program might be possible; and income tax reforms in several large LAC countries (e.g.Colombia and Argentina) suggest that income-contingent loans may soon be possibleelsewhere.'
Graduate Taxes
4.92 A graduate tax is basically equity financing: by subsidizing higher education the stateacquires a share (i.e. ownership) in the creation of human capital.0' This increased humarcapital generates a future stream of benefits in the form cf increased earnings, a portion of whichis owed the state as a kind of dividend for its equity share. Like the income-contingent loan,higher education graduates would repay the state with a percentage of their income. However,unlike the income-contingent loan (in which repayments end when the loan is paid off), thegraduate tax entitles the government to a share of the graduate's income throughout his/herworking life lhe graduate tax can also be seen as a user charge: for each year of highereducation ati. led the tax increases. The government thus assumes the risks of human capitalinvestments which are minimized by spreading them out over all students (just like an insurancecompany) .6'
6/ For example, in ArgeLtina the number of taxpayers declined 43 percent between 1987 and 1989.taxpayers simply stopped paying taxes Source: Vazquez-Caro, Reid and Bird (192)
62/ Income-contingent loans have been introduced in Sweden and Australia; it is too soon to see if they willfunction as well as planned.
6/ Equity financing of higher education was first proposed by Milton Friedman.
64/ This section on graduate *axes borrows heavily from Albrecht an,4 derman (1992).
- 77 -
4.93 Although proposed in several countries (e.g. Argentina, 1986) a graduate tax has neverbeen tried. Its drawbacks are similar to those for income-contingent loans in that an efficientincome tax collection system is necessary, including the ability to cost-effectively track downself-employed professionals (many of whom avoid paying income taxes in LAC). Theadvantages of such a tax are: no tuition has to be charged (and no loan interest must be paid)at public higher education institutions, avoiding all the political problems which that involves;more money can be generated relative to loan schemes because payments are made for 40 yearsor so and typically increase with age as earnings rise; the scheme is relatively simple in that thegovernment collects a certain p.-centage of income from all graduates without having to keepindividual loan accounts.
4.94 Income-contingent loans and graduate taxes could be highly complementary, if the formerwere used to help students attend fee-charging institutions (public or private) while the latterrecovered costs from heavily subsidized public institutions. Alternatively, the graduate tax couldbe used to recover instructional costs, while those students who needed additional financing topay for non-tuition expenses could take out income-contingent loans.
National Service and Work-Study
4.95 Simply put, both national service and work-study plans would accept the labor of highereducation students in exchange for subsidized tuition. For instance, higher education studentswho agree to work as teachers upon graduation (especially in rural areas) could be exemptedfrom tuition fees. Such programs already exist in Nepal, Indonesia, Yemen and Mexico,generating important social benefits. Alternatively, students could work part-time for no or littlepay at the higher education institution they were attending in exchange for reduced tuition fees(e.g. as library assistants, researchers, kitchen help, groundskeepers, etc.). For both programstuition fees would have to be charged (or raised) at public higher education institutions toprovide a basis for program participation, in which case loans should also be offered for thosestudents who prefer to pay for higher education out of their future earnings.
4.96 Unfortunately, in many LAC countries jobs are in short supply, making these programsless attractive. That is, competition between students and other workers for jobs has led unionsto strongly oppose national service-type proposals. In addition, replacing older, generally poorerlow-wage workers with higher education students kimany of whom come from privilegedbackgrounds and have high future earnings) would most likely have a negative equity impact.Finally, national service programs would generate no additional financial resources for highereducation, leaving the foremost problem unsolved. In summary, these programs should beconsidered as additional elements in possible private 11nancing "packages", but they do notaddress the financial crisis faced by public higher education institutions.

-78-
4.97 A brief outline of two of these lending alternatives and how they defer from standardfixed-payment student loans is shown below.
Table 4.9Student Loans Verses Graduate Taxes: Contrasts and Similarities
Mortgage Loan Income Contingent Loan Graduate Tax
Government Provides Government Provides Government AcquiresStudent Loans to Student Loans to Share in HumanPay Fees or Living Pay Fees or Living Capital EquityCosts Costs
Government Recovery Government Recovery Government Shareof Costs of Costs in Benefits
Loan Pays Fees Loan Pays Fees Tax Applies to(Tuition or Living) (Tuition or Living) Subsidized Education
Payments Accrue to Payments Accrue to Taxes Accrue toLoan Fund Loan Fund the Treasury
Level of Annual Level of Payment Level of TaxPayments Fixed Contingent on Payments Contingent
Annual Income on Annual Income
Annual Payments Annual Payments Tax Payments aa Declining a Fixed Proportion Fixed PropordonProportion of Income of Income of Income
Fixed Term Payment Payment Obligation Tax ObligationObligation Until Loan Repaid While in Employment
Loan Disbursement Loan Disbursement No DisbursementInstitutions Institutions
Need to Maintain Need to Maintain No IndividualIndividual Accounts Individual Accounts Accounts
Source: Reproduced from Albrecht and Ziderman, 1991
CHAPTER 5
SCHOLARSHIPS FOR HIGHER EDUCATION
5.1 Some higher education students will be able to afford neither tuition fees nor studentloans. Their household incomes are so low that the loans they would require to attend highereducation would be so great as to make their loan repayments unbearable, most likely leadingto default. Alternatively, high loan amounts for an uncertain investment in higher educationmight lead many qualified, poor students to avoid borrowing altogether ("risk aversion"),resulting in a socially inefficient and inequitable exclusion of talented higher educationcandidates. For these students (and for some academically-gifted students, whatever theirhousehold income), student scholarships would be the most appropriate financing mechanism.
5.2 While a range of sources exist to finance student scholarships for higher education, (suchas private firms, trade associations, community groups, special government grants, foreigndonors, etc.), perhaps the most appealing financing source would be higher education studentsthemselves. That is, funds raised from charging tuition could then be used to pay for studentscholarships. Beyond being a simple and relatively dependable source of financing, such a planwould have an appealing equity impact, as well.
5.3 At the same time, if higher education institutions are going to support any policy forincreased tuition fees, they must be shown that they have something to gain from it. In otherwords, the funds raised from tuition fees would most likely have to be divided up betweenhigher education institutions and scholarship programs. The institutions would then haveadditional net resources to use as they saw fit, while the scholarship program would have astable source of funding. For the purposes of tius study, it has been assumed that one-half ofall tuition fees raised would go to student scholarships.
5.4 Under this assumption, it is possible to estimate the scholarship resources (in US dollarterms) and the number of scholarships which could be financed, as tuition fees vary. Householdsurvey income data (by deciles) was used to calculate the tuition revenue from higher educationstudents, varying the fee from 10 to 100 percent of the unit cost. Note that even if studentscould not afford to pay the full tuition amount, it was assumed students from the lowest 3income deciles would pay at least 5 percent of their household income, while those in the middle4 income deciles would pay 10 percent, and those in the upper 3 income deciles would pay 15percent, of their household income. Total tuition revenue was then halved, following theassumption above, to calculate available scholarship resourc-s. Finally, the scholarshipresources were divided by the amount of financial aid package (defined as the tuition fee, plusliving expenses equal to 25 percent of unit costs), to calculate the percentage of the student bodywhich could be offered scholarships under different tuition fee scenarios. The results of thisanalysis are shown in Figures 20-23.

- 80 -
Scholarship Revenue as Fees Increase(US 1989 $)
1989 US $ (Millions)
50-
40-
30-
20-
10
10 20 30 40 50 60 70 80 90 100
Tuition Fee Charged as % of Unit Cost
- Argentina Costa Rica I Ecuador
-* Guatemala Jamaica
Assume one-half of tuition revenueIa allocated for scholarships.
Figure 20
5.5 In Figure 20 we see that as tuition fees rise from 10 to 100 percent of higher educationunit costs, scholarship resources increase. This is consistent with the concept of marginalpricing (which extracts consumer surplus that might otherwise go untapped), in which eachstudent pays what he or she can afford to pay, up to the tuition amount. Note, however, thatscholarship revenue does not increase linearly, but rather arcs slightly as the percentage ofstudents who can pay higher tuition fees steadily declines. In terms of absolute resources, withtuition fees equal to 30 percent of unit costs, Argentina could raise about US$25 million per yearfor scholarships, while Ecuador could raise around US$20 million, and Costa Rica, US$5million per year.

-81-
Scholarship Revenue as Fees Increase(US 1989 $)
1989 US S (Millions)400
300-
200 -
100
0 j
10 20 80 40 60 60 70 80 90 100
Tuition Fee Charged as % of Unit Cost
- Brazil Colombia - Mexio -*G Venezuela
Assume one-half of TUition RevenueIa Allooated to Scholarships.
Figure 21
5.6 Figure 21 is similar to Figure 20, in that it shows scholarship resources steadily
increasing with tuition fees, with increases becoming smaller with each rise in tuition. Because
of the large size of these four countries' higher education systems, the absolute amounts of
scholarship resources which could be generated through tuition fees is quite remarkable. With
fees set at 30 percent of unit costs, Brazil could raise over US$200 million per year for
scholarships, while Venezuela could generate more than US$100 million per year. Mexico and
Colombia could both raise about US$75 million per year at these fee levels. This provides
strong evidence of the potential for mobilizing private financial resources from those students
who can afford to pay, so that those who cannot afford to pay are not excluded from higher
education. Herein lies one of the most attractive equity elements of private financing of public
higher education.

- 82 -
Percent of Student Body on Scholarship(Tuition Plus Living Expenses'
Percent of Student Body
20 -
16
10i-
10 20 80 40 50 60 70 80 90 100
Tuition Fee Charged as % of Unit Cost
- Argentina Costa Rica - Ecuador
a Guatemala Jameioa
Living Expenses Estimated at 25% ofHigher Education Unit Coste
Figure 22
5.7 Figures 22 and 23 show the percentage of the student body which could be offered
scholarships, financed by tuition fees at varying levels of unit costs. (Recall that the estimated
scholarship includes the tuition fee, plus a grant to cover living expenses equal to 25 percent of
unit costs.) In this case, we see that the percentage of students on scholarships rises with tuition
fees until fees reach about 35 percent of unit costs, at which point the coverage begins to
decline. This is because as fees rise so does the size of the scholarship, while increases in
scholarship revenues decline (recall Figures 20 and 21). With fees set at 35 percent of unit
costs, the percentage of the student body which could be offered scholarships varies between 13
and 23 perctnt.

-83 -
Percent of Student Body on Scholarahip(Tuition plus Living Expenses)
Percent of Student Body
14 -
12
10 20 30 40 60 60 70 80 90 100Tuition Fee Charged as % of Unit Cost
- Brazil -- Colombia -*- Mexico - - Venezuela
Living Expenses Estimated at 25% ofHigher Education Unit Costs
Figure 23
5.8 Obviously, maximization of scholarship revenues and coverage is only one objective(which if taken to its extreme would mean provision of public higher education at no charge foreveryone, exactly the kind of generalized subsidy LAC needs to avoid). Secondly, scholarshipresources need not only come from tuition revenues; private foundations, firms, governmentsubsidies, etc. are all important potential sources of funds for scholarships and should beexplored. Furthermore, reducing public expenditures on higher education and/or increasing theefficiency of those expenditures so that a greater number of students can be served with the samefunds may be even more important than mobilizing additional funds. On the other hand, theanalysis above provides an illustration of the potential of tuition fees for mobilizing scholarshipresources, and it is important insofar as it suggests an optimum range for tuition levels.

-84-
Loans Versus Scholarshins
5.9 As mentioned above there are cases in which scholarships may be the most appropriatefinancing mechanism for higher education. This is especially so where student loan programsare functioning poorly and show few prospects of undertaking reforms. On the other hand, solong as student loan recovery can be reliably estimated to be at least 40 percent in net presentvalue terms, loans are probably the preferred instrument for the average higher educationstudent. Unfortunately, loan recovery is an output measure of a loan progr.m, which in somecases is difficult to estimate beforehand. In this sense, it may be helpful to define certaincriteria related to loan inputs to determine the balance between loans and scholarships.
5.10 One criteria might be administrative costs. For example, if administrative costs as aproportion of the value of loans disbursed are likely to greater than 30 percent, it might be morecost-effective to simply provide targeted scholarships, rather than incur loan programadministrative and collection costs. One way to estimate these costs is to compare loan programpersonnel costs to the value of the loans disbursed in a given year, a relatively simple exercise.
5.11 Another criteria is the estimated likelihood of default, and its relation to loan size. Thiscan be estimated in advance by using household survey data and comparing average highereducation graduate earnings to projected loan repayments. If these payments are likely to begreater than 25 percent of the applicant's income after graduation, it might be cheaper simplyto offer this applicant a scholarship, thereby avoiding the high risk of default, and the costs ofloan administration and collection. In addition, this exercise would identify groups of risk-averse students, the most promising of whom could be offered scholarships.
5.12 Conversely, loan Pmounts may be too small to be justified. For example, if the requiredloan amount (i.e. the difference between the tuition fee and household ability to pay) is so smallthat the administrative costs of the loan represent more than 40 percent of the loan value, itwould probably be cheaper to provide a scholarship and avoid these costs.
5.13 A fourth criteria is the interest subsidy: if it is politically impossible to reduce the interestsubsidy to less than 60 percent, it would probably be more cost-effective to simply providetargeted scholarships. In this case, the interest subsidy would combine with default, inflationand loan program administrative costs to result in what would most likely be unacceptably lowloan recovery.
5.14 The decision to offer scholarships rather than loans, however, should not be made lightly.Efforts should be made to reform existing loan programs so that loans are available to thestudents who need them and can afford them. Obviously, with the same resources a reasonablywell-functioning loan program could provide higher education financing to a much greaterproportion of the student body than could a scholarship program. This makes student loansmore attractive from both efficiency and equity perspectives; in general, they are the preferredmeans of private financing. Finally, there is no reason why loan programs should not recover

- 85 -
at least 70 percent of the money disbursed in net present value terms, even with interestsubsidies, inflation and a some default.&
5.15 In all cases, scholarships and loans should be targeted on the basis of either financialneed and/or academic ability. Furthermore, they should be offered on an annual basis,conditional upon satisfactory academic performance the previous year. In the final analysis,deciding the income cutoff level (or academic qualification standard) for allocating loans andscholarships is a country-specific task which cannot be easily predetermined. It is an art, nota science, although basic criteria can be used as guidelines to assist in decision-making.
65? For the purposes of projecting additional resources mobilized by loan programs for highereducation, a conservative estimate of 50 percent loan recovery in net present value terms wasused to provide reliability.
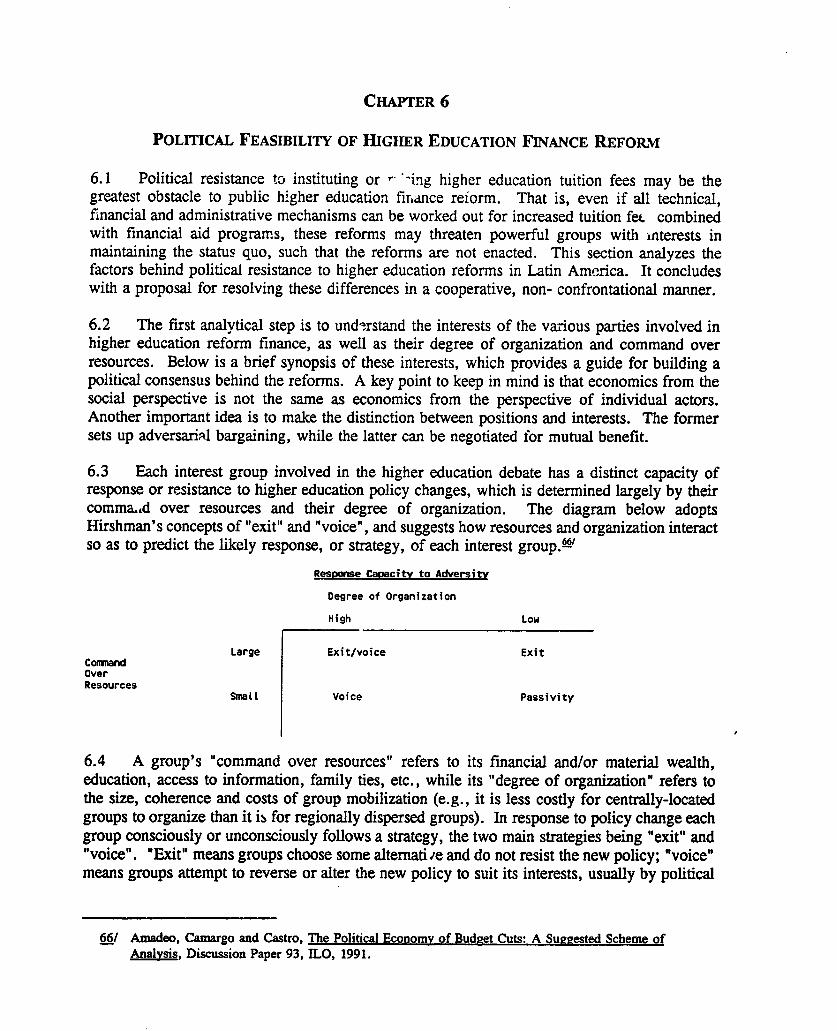
CHAPTER 6
POLITICAL FEASIBILITY OF HIGHER EDUCATION FINANCE REFORM
6.1 Political resistance to instituting or -* -ing higher education tuition fees may be thegreatest obstacle to public higher education firance reiorm. That is, even if all technical,financial and administrative mechanisms can be worked out for increased tuition fe. combinedwith financial aid programs, these reforms may threaten powerful groups with interests inmaintaining the status quo, such that the reforms are not enacted. This section analyzes thefactors behind political resistance to higher education reforms in Latin America. It concludeswith a proposal for resolving these differences in a cooperative, non- confrontational manner.
6.2 The first analytical step is to understand the interests of the various parties involved inhigher education reform finance, as well as their degree of organization and command overresources. Below is a brief synopsis of these interests, which provides a guide for building apolitical consensus behind the reforms. A key point to keep in mind is that economics from thesocial perspective is not the same as economics from the perspective of individual actors.Another important idea is to make the distinction between positions and interests. The formersets up adversarial bargaining, while the latter can be negotiated for mutual benefit.
6.3 Each interest group involved in the higher education debate has a distinct capacity ofresponse or resistance to higher education policy changes, which is determined largely by theircomma.,d over resources and their degree of organization. The diagram below adoptsHirshman's concepts of "exit" and "voice", and suggests how resources and organization interactso as to predict the likely response, or strategy, of each interest group."
Response Capacity to Adversity
Degree of Organization
High Low
Large Exit/voice ExitComandOverResources
SmaLL Voice Passivity
6.4 A group's "command over resources" refers to its financial and/or material wealth,education, access to information, family ties, etc., while its "degree of organization" refers tothe size, coherence and costs of group mobilization (e.g., it is less costly for centrally-locatedgroups to organize than it ib for regionally dispersed groups). In response to policy change eachgroup consciously or unconsciously follows a strategy, the two main strategies being "exit" and"voice". "Exit" means groups choose some alternatire and do not resist the new policy; "voice"means groups attempt to reverse or alter the new policy to suit its interests, usually by political
66/ Amadeo, Camargo and Castro, The Political Economy of Budget Cuts: A Suggested Scheme ofAnalysis, Discussion Paper 93, 1LO, 1991.

-87-
activism. Applying these concepts, an analysis of the interests and likely strategy of the majoractors in the higher education finance ieform debate follows
6.5 Public Hiher Education Students Public university students are probably the greatestpolitical obstacle to higher education finance reform, as they stand to lose significant publicsubsidies and have the most at stake. Their interests lie in maintaining, and if possibleincreasing, the benefits they receive from the government. While these students actually havelittle command over the budget-setting for these benefits, they are capable of a high degree oforganization, which suggests they will play an active "voice" role.
6.6 Indeed, in many Latin American universities, students are well-organized, relativelycentralized, highly politicized and located close to government policy-makers. Furthermore,university students traditionally have been among the most willing to rebel against governmentauthority and engage in confrontational activities, which has occasionally led to violence.Lastly, these students are often the sons and daughters of public sector policymakers and so exertboth personal and financial pressures on their parents. In sum, public university students havethe incentive, willingness and capacity to oppose higher education finance reforms.
6.7 Private Higher Education Students Private higher education students, on the other hand,have an interest in expanded student loan programs. Throughout Latin America private studentspay much higher tuition than their public counterparts, and with rising costs they can beexpected to pay still higher fees in the years to come. A strengthened loan program wouldincrease access to private higher education, especially among the middle and lower classes, aswell as promote student choice. Yet private students are typically much less organized than theirpublic counterparts, in part because of their dispersion and smaller-sized institutions, and manyof them come from relatively wealthy families. With resources, but lacking organization, manyprivate students are likely to exit from the system and not get involved in the reform debate.
6.8 Public Higher Education Professors and Administrators Similar to public highereducation students, public professors typically have little actual command over the resources theyreceive (although they have more than students), but they are exceptionally well-organized. Thismeans they, like their students, will opt for the "voice" strategy. Depending on how theyperceive their interests and how their interests are satisfied, professors will be either stronglyin favor of, or opposed to, finance reforms.
6.9 Paradoxically, public university professors have traditionally opposed higher educationfinance reform, although it is not entirely clear that is where their interests lie. One reason fortheir opposition is they perceive higher tuition fees as meaning reduced government financing,translating into lower salaries, deteriorated working conditions, and fewer research opportunities.Another factor is their traditional alliance with students in pushing for increased public financingof universities. A third factor in Latin America may be the historical political role manyuniversity staff have played in opposing government policies; intellectuals have traditionallyspoken out on the more radical left against conservative regimes. But despite these perceptions,the actual interests of university personnel may lie with higher education reforms.

-88-
6.10 Increased private financing of higher education could mean net gains in overall resourcesavailable to public higher education institutions. Furthermore, some of the fiscal savingsstemming from reduced public subsidization of tuition costs could be directed towardsprofessors' benefits (see below). Tuition fees might also reduce over-enrollment andovercrowding of classes, thereby improving the working conditions for instructors. In otherwords, ample room exists for making higher education finance reform attractive to professors;dialogue is needed to explore areas of greatest interest to them.
6.11 Private Higher Education Institution Professors and Administrators Like privateuniversity students, private institution professors and administrators have 2. interest in privateresource mobilization and expanded student loan programs. Such reforms should increase their
ability to expand, pay higher salaries, recruit the best students (i.e. the most academicallyqualified, regardless of socioeconomic background), and compete in the higher educationmarketplace. Unfortunately, private institution professors have virtually no control overgovernment resources and are weak organizationally in terms of numbers and cohesion. This
inclines them to adopt a rather passive role in the debate, but this could be changed if theirorganization and means of articulating their interests improved. Private institutionadministrators, on the other hand, have been an increasingly strong force for cost recovery; theyneed more opportunities to exercise their "voice" role.
6.12 Basic Education Teachers and Students In pursuit of their self-interest, one would expectbasic education teachers and administrators to support higher education finance reform.Unfortunately, basic education teachers are dispersed geographically throughout the country andhave little say over what resources they actually receive (certainly less than universityprofessors). Their response is to unionize, which has proven to be an important means ofnegotiating for salary increases. However, on the issue of resource allocation between higherand lower educational levels, unions have been remarkably silent, probably reflecting internal
disagreements over their role. Through educational media campaigns, considerable opportunityexists for mobilizing these teachers who are much more numerous than university professors,and in a position to influence public opinion due to their close contact with parents.

- 89 -
Political Debate on Higher Education Finance Reform: The debate on higher education financeis increasingly public throughout Latin America. A number of strategies have been used by would-bereformers to influence public opinion. Perhaps tie most important is a firm grounding in higher educationfinance facts and figures. This has been supported by the Ford Foundation, which has sponsored researchinto issues in highei education in Brazil, Chile and Mexico (most notably, that of the Nucleo de PesquisasSobre Ensino Superior, NUPES, in the University of Sao Paulo).
Ir Brazil, NUPES has begun to publish a series of reports analyzing higher education. These reportsusually are summarized in newspaper articles in the most influential Brazilian newspapers, often promptinga subsequent rebuttal argument. In addition, the former Minister of Finance came out publicly in favor of costrecovery in higher education and a small group of intellectuals supporting reform is now a powerful forcewithin the Ministry of Education. The strategy is one of consensus-building for reform, first among theuniversity rectors, and gradually among other interested part;es. Ministry officials are constantly floatinj newideas which appear in the newspapers, and regularly lobby in Congress for reform. The extent of supportin Congress for reform has been surprising, in particular for cost recovery in public institutions. On the otherhand, a 1985 National Commission on reform failed because the parties involved were trying to protect theirown interests, rather than reach a consensus for the public good.
In Costa Rica, the former Minister of Finance began writing newspaper articles on the inequity andhigh costs of higher education. Attempts were made to reduce budget allocations for higher education. Whilemany other officials were supportive, few were -a outspoken. In this case Congress sided with theuniversities and restored the cuts, while the Presidernt (whose father founded the University of Costa Rica)remained silent (the Minister of Finance has since left th' 3overnment). Attempts at encouraging a "NationalCommission" or outside review of higher education hvvc o, succeeded beause of resistance from Congressas well as from the University Council.
In contrast, the Minister of Education of Mexico asked a small group of internationally renownededucators to prepare a repetn on the future of higher education, to add to earlier work done by a ministeriilgroup. The report was intended inter alia to stimulate debate within Mexican society concerning highereducation finance reform, although the report's recommendations were quite mild. In June 1992 the Rectorof UNAM proposed raising fees to between US$250-650 dollars, depending on the field of study, but studentopposition forced the government to ultimately withdrpw this proposal.
In Venezuela, the higher education debate has been relatively low-level. Government officialsunderstand the problems but consider public statements too risky politically. However, they do appear willingto study the issues and problems of higher education (perhaps with World Bank financing), led by a privateVenezuelan institution (IESA).
In Chile higher education reform was instituted from above in 1981 by a military dictatorship. ANational Commission is now trying to revise the reform while retaining the main objectives. Debates havebeen held throughout the country. The commission is intended to be non-partisan, but there have been someproblems with the politicization of its recommendations.
Source: Wolff, 1992
Box 12
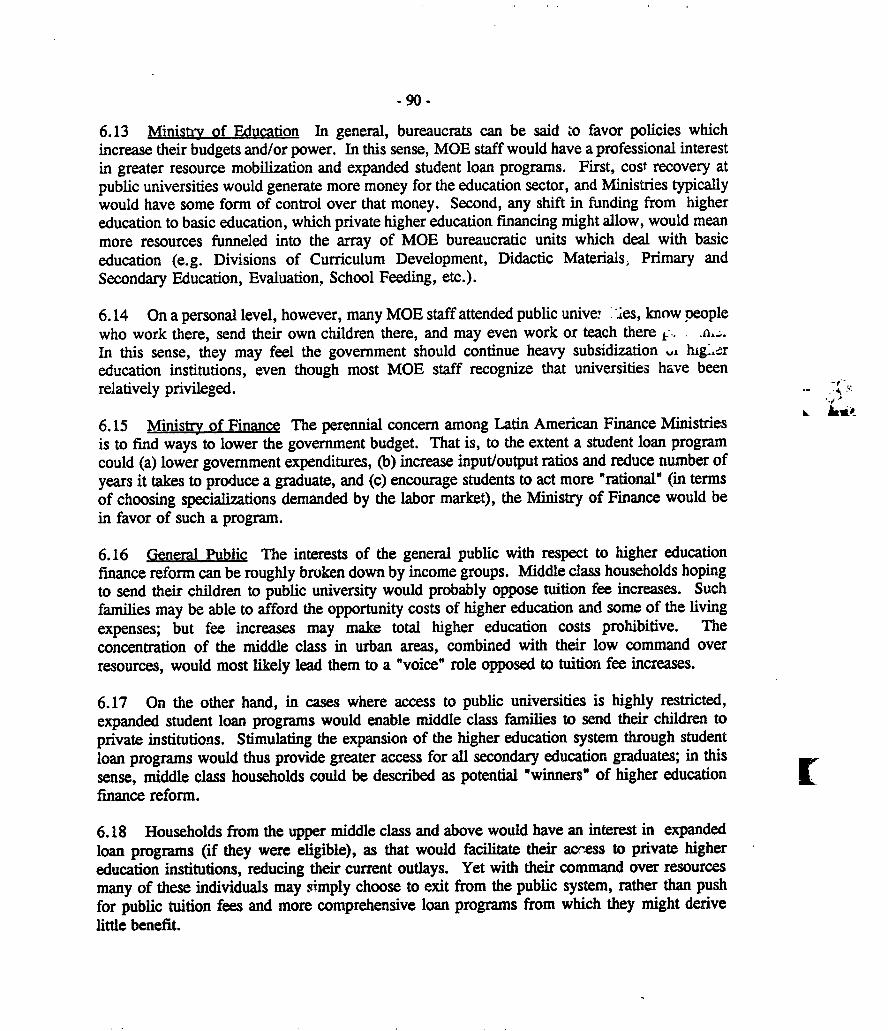
-90-
6.13 Ministry of Education In general, bureaucrats can be said to favor policies whichincrease their budgets and/or power. In this sense, MOE staff would have a professional interestin greater resource mobilization and expanded student loan programs. First, cost recovery atpublic universities would generate more money for the education sector, and Ministries typicallywould have some form of control over that money. Second, any shift in funding from highereducation to basic education, which private higher education financing might allow, would meanmore resources funneled into the array of MOE bureaucratic units which deal with basiceducation (e.g. Divisions of Curriculum Development, Didactic Materials, Primary andSecondary Education, Evaluation, School Feeding, etc.).
6.14 On a personal level, however, many MOE staff attended public unive! .Ies, know veople
who work there, send their own children there, and may even work or teach there .-.In this sense, they may feel the government should continue heavy subsidization a lugUereducation institutions, even though most MOE staff recognize that universities have beenrelatively privileged.
6.15 Ministry of Finance The perennial concern among Latin American Finance Ministriesis to find ways to lower the government budget. That is, to the extent a student loan programcould (a) lower government expenditures, (b) increase input/output ratios and reduce number ofyears it takes to produce a graduate, and (c) encourage students to act more "rational" (in termsof choosing specializations demanded by the labor market), the Ministry of Finance would bein favor of such a program.
6.16 General Public The interests of the general public with respect to higher educationfinance reform can be roughly broken down by income groups. Middle class households hopingto send their children to public university would probably oppose tuition fee increases. Suchfamilies may be able to afford the opportunity costs of higher education and some of the living
expenses; but fee increases may make total higher education costs prohibitive. The
concentration of the middle class in urban areas, combined with their low command overresources, would most likely lead them to a "voice" role opposed to tuition fee increases.
6.17 On the other hand, in cases where access to public universities is highly restricted,expanded student loan programs would enable middle class families to send their children toprivate institutions. Stimulating the expansion of the higher education system through student
loan programs would thus provide greater access for all secondary education graduates; in this
sense, middle class households could be described as potential "winners" of higher education [finance reform.
6.18 Households from the upper middle class and above would have an interest in expandedloan programs (if they were eligible), as that would facilitate their ac-ess to private highereducation institutions, reducing their current outlays. Yet with their command over resourcesmany of these individuals may simply choose to exit from the public system, rather than pushfor public tuition fees and more comprehensive loan programs from which they might derive
little benefit.
- 91 -
6.19 Somewhat paradoxically, lower income households would have an interest in highereducation cost recovery and expanded loan programs, to the extent that such reform permitted(a) a shift in spending to lower education levels, and (b) expanded income-based loan andschola-slup programs. Unfortunately, the poor's lack of resources and low levels of organizationsuggcs: they will play only a passive role.
6.20 In summary, the general public can be expected to roughly split over the issue of highereducation finance reform; the key variable here is the government's effort to educate the public,a topic addressed in the next section.

- 92 -
Political and Legal Obstacles to Higher Education Finance Reform
Efforts to introduce increased tuition fees and expand student loan programs in LatinAmerican public higher education institutions may require changes in several countries' legalsystems. Such changes are obviously highly charged politically. Below is a brief discussion of thelegal systems with respect to higher education finance in several LAC countries.
In Ecuador, according to both the Constitution and legal system it is forbidden to chargetuition fees. Public education is said to be "free" at all levels and this idea that public highereducation should be free has become part of the national culture (Reyes Posada, 1990). On theother hand, fees (although minimal) are in fact being charged, suggesting that the possibility forincreased tuition fees exists, but at the price of a political fight. It appears meaningful tuition feeswill require modification of current laws regarding the public universities. and perhaps of theConstitution. This will mean political support and leadership at the Presidential level.
In Mexico the 1917 Constitution specified twat education provided by the state must be free.This has led to the interpretation that public higher education (which did not really exist at the timethe Constitution was drafted) must also be free. However, the vagueness of the law provides roomfor awnalternative interpretation; the. recent study finarced by the Mexican government concerninghigher education is one step in developing political support behind an interpretation allowing forpublic higher education tuition fees.
In Honduras, the Constitution establishes higher education funding at 6 percent of totalnational expenditures. Related to this is government policy establishing free and open access tohigher education. Proposals to alter either the funding requirements or admissions policies of highereducation have encountered strong opposition.
In Costa Rica, financing of public higher education institutions is guaranteed through Article85 of the Constitution, which established a special fund for higher education, whose income (basedon. 25 percent of income tax revenue,. 100 percent of the tax on real estate transfers,. and. 100 percentof the:tax on brokerage houses) "cannot be abolished nor reduced". In practice, subsidization ofhigher education surpasses even these amounts and is determined though protracted negotiations withthe Ministry of Finance.
Finally, in both Brazil and Venezuela it is illegal for public higher education institutions tocharge tuition fees. This does not mean that exam fees, thesis fees, and other fees cannot be.charged, but it clearly restricts the governments' ability to enact reforms. Moreover, the legal.prohibitions on ttition fees highlight the need for a collaborative approach based on an opendialogue of the issues at stake; otherwise widespread political support to change the laws, and insome cases the Constitution, will be lacking.
Box 13

-93 -
Political Strategy for Reform
Analysis
6.21 The first step is to ground the reform debate in well-documented facts and analysiscovering the issues of efficiency, equity and quality. This would include solid data on: highereducation expenditures (in relative and absolute terms); unit costs by institution; instructionalcosts; research and administr-tive expenditures; socio-economic profiles of higher educationstudents (by type of institution); age-earnings profiles of graduates; years to produce a graduate;drop out rates; test scores, etc.. It would also include expenditure forecasts under different cost-recovery scenarios, using various combinations of student loans and scholarships. This may bestbe undertaken by an independent research institution (national or international), which could becounted on for objectivity by all parties. This grounding in facts is essential before moving onto the next stage: national debate.
Debate
6.22 The second step is education and public dialogue. Universities, the Ministries ofEducation and Finance, the President's Office, etc., should initiate a series of consensus-buildingactivities such as: well-publicized meetings with students' ard teachers' unions; financial studiesundertaken by groups representing the full range of interests; media campaigns (newspapers,radio and TV); and frequent statements by political leaders explaining why reforms arenecessary. This public dialogue needs to begin before the reforms are enacted. If thegovernment can explain to the public why it is attempting to dialogue with students, the studentswill have a difficult time gaining popular support. Without this support the students' ability tooppose higher education finance reforms will be greatly diminished.
6.23 In terms of the substance of this public dialogue, the following issues should be:,ighlighted: equity, especially in terms of who has access to public higher education; internalefficiency (e.g. the high average number of years to graduate); expenditures on highe-1 educationrelative to lower educational levels; and student accountability to society at large, which afterall is financing a large portion of their studies. With respect to the middle class, the governmentneeds to explain that, although somewhat counterintuitive, increasing fees and expanding studentloan program* - improve access to higher education, by expanding private higher educationopportunitie : improving the quality of lower education levels (which greatly determineaccess to u, -ity). It is importa. that fee increases are not so large that the middle class iscaught betveen being too nch to receive scholarships but too poor to afford loans.
6.24 In particular, the "equity message" of higher education finance reform must be madeclear, especially among the poor. Furthermore, the facts concerning the socioeconomic statusof students currently enrolled need to be disseminated, so that the public understands theunfairness of the present situation (i.e. the privileged status of students from wealthybackgrounds). It should be stressed that cost recovery would also promote income-based meanstesting, which could be used to distribute scholarships and determine loan candidacy. Policies

-94-
for special university recruiting in poor and lower middle class areas should be announced, andinformation as to loan application, availability and their terms should be available to all.
6.25 Finally, an attempt should be made to mobilize the upper middle class households insupport of expanded student loan programs for both public and private higher educationinstitutions, perhaps by urging private institutions to play a larger role in convincing theirstudents (and their students' parents) of the importance of the reforms. While relatively few innumber, this group is influential and may play a "swing role" in favor of reform, if they can beconvinced that their interests lie in "voice", rather than "exit" from the debate.
Negotiation and Maximization of 'utugl Interests
6.26 The analysis and debate stages should includr .inancial analysis to determine the extentof resource mobilization and/or fiscal savings stemming from higher education finance reforms.Based on this analysis, mechanisms should be devised for allocating those rescurces in wayswhich maximize political support for the reforms. One such mechanism would be to earmarkresources for three education funds, which correspond to three major stakeholders in the reform:
(a) a scholarship fund for higher education students, to finance either tuition or livingexpenses of students demonstrating the greatest economic need or academicpromise;
(b) a university fund for professors, which might finance sabbaticals for research,laboratory equipment, or even information technology; and
(c) a basic education fund for teachers, to pay for salary bonuses to distinguishedteachers, or leave-time for the purpose of pursuing higher education degrees.
6.27 These funds would play an important role in building political support for finance reformsand would demonstrate that any fiscal savings would remain within the education sector. Notethat while no resource transfers are proposed for basic education instructional materials and/orinfrastructure (high priority areas), to *he extent that expenditures are fungible increasedresources for basic education personnel can free up resources for other priority items. The keypoint he-e is to focus the resources on people who can be mobilized to stpport the reforms.

- 95 -
Political Failures and Success Stories of Higher Education Reform -
Hypothetical calculations of winners and losers of higher education finance reform must beexamined in view of actual past experience with reform efforts. Numerous attempts in the past toreform higher education systems have met with failure as students and other government oppositiongroups have strongly resisted the changes. Other reform programs have succeeded, at leastpartially. What factors explain whether a reform program succeeds or fails? This brief discussionof experience sheds some light on the question.
Over the last decade students created seious political upheavals in Argentina, Bolivia, Peru,Uruguay, Venezuela, Bangladesh, Burma, lndoneia, India, Turkey, Nigeria, Liberia, Niger, Kenya,Uganda, Zimbabwe, Mali ana Senegal. In most cses unrest came from government eff-, s to alterthe higher education system, by restricting admission, decreasing government subsidies, increasingstudent and institutional accountability and performance, constraining the political activism ofstudents, or some combination of the above. At the risk of overgeneralization, these countries'refbrms were characterized by a lack of communication and adversai-al relations between studentsand policy makers, limited national consensus behind the reforms, poorly developed student loanprograms and non-transparent funding mechanisms.
By contrast, Thailand introduced reforms which restricted access to traditional publicuniversities, defusing protests by covering unmet demand with the creation of two large, open,lower-quality universities. . In. Singapore, the expansion of merit scholarships and student loanprograms for poor students allowed the government to introduce cost-recovery in the most expensiveand demanded fields (engineering and basic sciences). In Korea, public higher education tuition feeswere recently increased.to $525 per. year, in large part because government-subsidized student loanprograms were expanded in the late 1980s. Australia successfully introduced cost recovery, in partby emphasizing that the reforms would improve equity. In the case of Chile, the reforms wereintroduced under a tough military dictatorship, and with promises to greatly expand student loanresources. Finally, Brazil, the Philippines and Indonesia have encouraged the development of largeprivate higher education sectors, which has reduced the pressure for public funds.
The lessons to be drawn from these experiences are that: (1) government efforts to explainits financial constraints and build a broad consensus behind reforms, based on accurate informationand public debate, are important; (2) any tuition fee increase must be accompanied by. expandedstudent loan and scholarship programs;. (3) in the short-term tuition revenue should remain withinhigher education, or at least enough of it so that the net effect of reforms is to increase total fundingfor higher education; (4) if possible, it is best to have student loan programs established andfunctioning reasonably well before tuition fees are raised; and (5) regulatory and policy frameworkswhich encourage the development of the private higher education are required to ease demand andmaintain quality in public institutions.
Source: Salmi, 1991 and Woodhall 1991
Box 14

- 96 -
6.28 Higher Education Professors and Administrators It must be emphasized that all peopleworking in higher education institutions must be treated as colleagues in the process, not asadversaries. That is, with increased democratization a factor in most Latin American countries,a successful political agreement will only come from dialogue and involvement of all interestedparties, not from top-down imposition of reforms. It should also be stressed that present levelsof funding for higher education might be maintained, in which case the fee revenue would beadditional money for the universities. '
6.29 Another important element in gaining support from university officials would be increasedautonomy over fef policies and spending in general. This means letting administrators managetheir own finances, increasing their capacity to: reallocate resources in response to changingdemands; mobilize additional sources of funding (e.g. from sale of services, industry contracts,etc.) witheut losing public subsidies; and control the size of enrollments. Increased autonomymust be accompanied by increased accountability, in terms of education quality, financialmanagement and social responsibility.§' Giving more control to administrators over thesources and used of funds should increase their willingness to enact other financial reforms.
6.30 Higher Education Students While almost sure to oppose efforts to raise tuition fees,public higher education students nonetheless should be included in the policy dialogue overhigher education finance reform. The government should make every effort to explain its pointof view, its constraints, and its objectives to students, demonstrating good faith and willingnessto both talk and listen to the students. Detailed plans for establishing both scholarship andstudent loan programs should be presented at the same ime as tuition fee increases arediscussed. Introducing (or increasing) student fees should be presented as a means of increasingthe quality and equity of educatioi students receive.
6.31 To reduce opposition it is recommended that fee increases and loan programs be"grandfathered", N, that presently enrolled students retain benefits and finance reforms areenacted incrementally with each incoming class. Furthermore, the loan programs and feeincreases could be introduced on a very small scale, with yearly increases which keep up withinflation. Over time, if public expenditures are held constant in nominal terms, inflation willgradually shift the balance between public and private financing in favor of the latter. Thistactic (also known as the "salami tactic", as little slices are made each year in real public highereducation expenditures) was used by Sweden to introduce its student loan program in the mid-1960s, and is currently being tried by the British government.
67/ The result of such a policy would be to freeze public higher education spending at current levels (rather
than reduce it), with the reforms essentially financing increased spaces at lower cost (for greaterinternal efficiency) rather than generating additional resources for lower educational levels.
68/ Salmi, Jamil. (1992) "Higher Education and Economic Development: Strategies for Reform".Washington, D.C.: World Bank Policy Brief.

- 97 -
6.32 Another strategy is to avoid charging tuition fees directly, and require instead thatstudents pay an array of indirect fees, such as registration fees, exam fees, insurance premiums,laboratory fees, library access charges, and student activity fees. Insofar as these charges arenot called tuition fees, students may be more willing to pay for them. These fees together couldconstitute significant cost recovery.-
6.33 Among private higher education students, the government should simply solicit theirsupport for expanded student loan programs which are clearly in their best interests. It isimportant that the public understand that private students are often not from the wealthiestfamilies, but rather are those who in many cases could not afford the quality secondary educationrequired for entry into the public higher education institutions. Particularly in the one- to three-year technology and training institutions (as opposed to the typical four- to five- year publicuniversity), private students are just as deserving of public support (through a subsidized loanprogram) as public students. Where possible, these students should be mobilized to demonstratetheir approval of the finance reforms.
Case Study: Kenya In 1991 the Kenyan government introduced a higher education feesequal to roughly US$200, together with almost full cost recovery for studentaccommodation and meals. Needy students are to receive government grants to covertuition fees, while living expenses are to be financed through government loans to allstudents. The policy change prompted street demonstrations, which forced the universitiesto close. Only students: who signed their acceptance of the policy change were allowed toreturn to campus - almost all students did. In early 1992 the universities re-opened but itis still too early to see how the program will work, and political tension remains high.
Source: Saint, 1992.
Box 15
6.34 Basic Education Teachers Primary and secondary teachers need to be mobilized andinvolved in the higher education finance reform debate. The government could approach thebasic education teachers' unions and propose to them a share of the fee increases at the highereducation level, in exchange for their support. In addition, a closer working relationshipbetween the Ministry of Education and the unions could help basic education teachers to improvetheir policy analysis capabilities, which would enhance their ability to articulate their demandsand defend the budget allocations to basic education (and not just for teacher salaries).
6.35 Congress Closely related to the government's attempt to get its message to the peopleis the effort to persuade the Congress of the need for reform. This is essential because in most
69/ Saint, 1992.

- 98 -Latin American countries the Congress controls final budget authority, not the Ministry ofFinance. To the extent these bodies reflect the will of the people, the public dialogue on hghereducation reform should reach Congressional members and encourage them to re-examine theirbudget approvals for higher and lower education. But more targeted efforts at educatingCongressional members are needed, as well. Congressmen should be invited to participate inany interest group task force studying higher education finance (see paragraph 6.21 above), andbe involved in the face-to-face dialogue with high,e!r education students, administrators andprofessors. Whenever possible, they should be encouraged by the President to speak out onthese issues, raising the visibility of the debate. In cases where the Congress authorizes theeducation budget on a line item basis, the involvemtnt of the Congress will be especiallyimportant, as the Ministries of Education and Finance have less power to reallocate funds withinthe sector under these conditions.
Leadership for Political Consensus
6.36 Political leadership for a consensus in support of education finance reform will probablyhave to come from numerous sources, including universities, the Ministries of Education andFinance, the Congress and the Office of the Presidency. At some point, public universities willhave to confront the reality of expanding enrollments and tighter fiscal constraints, and attemptto work out solutions which go beyond closed-door negotiating and public demonstrations. Asa recent paper on higher education funding mechanisms has illustrated, funding by politicalnegotiation rarely promotes either quality or efficiency.' Retired university senioradministrators (e.g. rectors) may also be important in providing a credible, politically acceptblevoice for finance reform.
6.37 At the presidential level, key university "swing" leaders need to be identified and thensupported, bridging the gap between the Ministry of Finance and higher education institutions.These swing leaders should be well-known and trusted by higher education administrators andprofessors; they would be important in changing the debate from one which is adversaria' innature to one which focuses on satisfaction of mutual interests. These individuals could beappointed as special advisors to the president in the discussions concerning public finance ofhigher education. Indeed, presidential and congressional support may very well be the criticalfactor in encouraging such swing leaders to participate constructively in the finance reformdebate.
6.38 In many Latin American countries it is the Ministry of Finance which is leading thedebate on higher education cost-recovery. This is logical, as the public demands forexpenditures of all kinds are greatest at this point and Ministries of Finance are trying toaccommodate them. This is also a good place for external agencies to get involved, as this iswhere funding decisions can be heavily influenced.
70/ Funding Mechanisms for Higher Education: Financing for Stability, Efficiency and Responsiveness,Albrecht and Ziderman, The World Bank, 1991..

- 99 -
6.39 Finally, another potentially influential leadership role could be played by the media andpopular editorialists. The roessage of improved basic education and more equitable highereducation could be taken the people, emphasizing the accountability of publically-fundeduniversities to society and illustrating the inefficiency and inequity of providing heavilysubsidized higher education to students, most of whom could afford to pay increased tuition fees.Again, it may be at the presidential level that such media leaders are identified and encouraged.Business leaders, too, have a role to play in mobilizing resources for quality basic education,which is increasingly a prerequisite for productive labor and economic growth.
6.40 In summary, Latin America's increasingly democratic and pluralistic societies mean thepath to reform lies through dialogue and negotiation, rather than government decree andimposition. While no parties can expect to have all their interests satisfied, the inclusionaryapproach assures that every party is part of the process, and has a stake in it; public highereducation students and the government should not be the only parties involved. By distributingthe benefits of higher education finance reform more equally across public and privateinstitutions, and across educational levels, a viable political coalition for reform should be ableto overcome expected resistance from public higher education students.

CHAPTER 7
SYNrEsis: FEES, LOANS AND SCHOLARSHIPS
7.1 Thus far this report has analyze household ability to pay, the financial and administrativefeasibility of student loan programs, the availability of scholarships, and the political factorsbehind higher education finance reform. What has not been discussed thus far, however, is howthese different elements of finance reform all fit together. That is the subject of this chapter.The result is a convergence of analysis, which suggests that tuition fees could reasonably beraised to between 25 and 35 percent of higher education unit costs, accompanied by expandedstudent loan programs to cover approximately 60 percent of the student body needing suchassistance, as well as a scholarship program to serve roughly 20 percent of the student bodydeserving financial aid according to economic and/or academic criteria. What follows is a step-by-step illustration of this analytical convergence, beginning with a discussion regarding tuitionfees.
Setting Tuition Fees
3.2 From an economics standpoint, there are at least two ways in which to set tuition fees:(a) analyses of ability to pay fees, in relation to total unit and instructional costs; and (b)analyses of willingness to pay, based on higher education graduate incomes. Both of thesetechniques are reviewed below.
Ability to Pay
7.3 The analysis of ability to pay both tuition fees and the non-tuition expenses of highereducation concluded that average Latin American households could afford to pay between 25 and30 percent of the total financial costs of higher education (Table 3.3). That is, combining bothcurrent household income and affordable loan amounts to calculate total affordable privatefinancing, and comparing that amount to public higher education unit costs plus students' livingexpenses, households could finance about one-quarter of those costs.
Willingness to Pay
7.4 This section estimated the actual value of higher education to the individual, assumingassumed that few individuals would be willing to pay more than this amount (or conversely, inthe absence of information which enables higher education candidates to make this judgement,society should not in fairness charge students more than this amount). The basic concept is thatby discounting into net present value a certain percentage of higher education graduate incomeover, say, 20 years, it is possible to calculate the financial worth of higher education, which canthen be broken into yearly payments for tuition.
7.5 For the region as a whole it is difficult to generalize, as the suggested tuition fees, bydefinition, reflect the success of higher education graduates in the labor markets of each country."Worthwhile" tuition fees range from 13 percent of higher education unit costs in Argentina to88 percent of unit costs in Guatemala, with a weighted average (by enrollment) of about 30

- 101 -
percei.t of unit costs. Note that this 30 percent weighted average corresponds closely to theaverage ability of LAC households to pay for higher education. Indeed, because a large poruonof the benefits of higher education accrue to the individual (as opposed to society), householdability to pay should also reflect household willingness to pay.
Loan Programs
Feasibility
7.o The analysis of the financial and administrative feasibility of student loan programs inLAC suggests that, adopting the reforms outlined in this report, it should be possible to raiseloan recovery to at least 50 percent in net present value terms, with ample scope to go as highas 80 percent. As presently operating the programs recover, on average, about 40 percent ofthe money disbursed. This is because of heavily subsidized interest rates, inflation, troublesomedefault rates, and higher than necessary administrative costs. But several LAC student loanprograms have recently undertaken important reforms, and a recent LAC conference on loanprograms suggests the trend is clearly towards much greater financial self-sustainabilitythroughout the region. There is reason for optimism with respect to the financial managementof student loan programs.
7.7 The administrative capacity to expand loan programs to accommodate tuition feeincreases is less certain. Expansion may result in economies of scale for greater efficiency, orit may overburden the ability of loan programs to track and keep accounts on individualborrowers. For this reason multiple loan programs in every country may be best (perhaps onepublic, and one private), so that students have choices and the bes, mechanisms for operatinga loan program can be found for each individual country. In any case, keeping tuition fees ata moderate level (say, at 25 percent of unit costs) would reduce the size and financialcommitment of the loan programs. This way, tuition revenue generated should be greater thanthe amount need to finance the loan program, so that even if no one repays their loan there isa net gain in resources mobilized for higher education.
Start-Up Costs
7.8 Simulations show that the net start-up costs of a loan program when tuiti6n is pegged at25 percent of unit costs are considerably lower than those of a loan program with tuition set at50 percent of unit costs (see Annex B). This is because as fees increase so does the proportionof students needing loans and size of the loan amounts, while increases in fee revenue whichoffset the initial costs of the loan program decline. For a loan program with tuition fees set at25 percent of unit costs the start-up costs are quite reasonable (about US$30 per borrower for25 years), well within the financial capabilities of Latin American countries. When tuitionincreases to 50 percent of unit cost, the start-up costs begin to tax most countries' financingcapacities. Thus, from a practical standpoint of setting up a loan program, the lower tuitionlevel is preferred.

- 102 -
Scholarships
7.9 Scholarship coverage (i.e. the percentage of the student body which could be offeredscholarships generated by tuition fees) varies with the level of tuition fees. In fact, thepercentage of students on scholarships rises with tuition fees until fees reach about 35 percentof unit costs, at which point the coverage begins to decline. This is because as fees rise so doesthe size of the scholarship, while increases in scholarship revenues decline. With fees set at 35percent of unit costs, the percentage of the student body which could be offered scholarshipsvaries between 13 and 23 percent.
Political Feasibility
7.10 The political resistance to public higher education tuition fees is exceptionally strong;there should be few illusions about this. Given this opposition it is important that fee increasesremain reasonable. Charging students 25 percent of the unit cost would mean the governmentwas still financing 75 percent of the unit cost; with taxpayers paying three times more thanstudents, it is difficult for the students to claim they are being unfairly victimized by thesereforms, especially if subsidized student loan and scholarships programs are expanded andtargeted to those who need them most. That is, governments could still claim to be offeringsignificant financial support to students while asking them to contribute what they couldreasonably afford. At this 25 percent level the government could also argue that fees would notreduce access to higher education among the middle class (recall that the real access factors arequality basic education and the ability to forego earnings), while they would tap the resourcesof those who could afford to pay and finance targeted scholarships for the poor. This wouldimprove efficiency and equity within the higher education subsector, as well as in the educationsector as a whole, as reduced higher education spending would permit greater resources for basiceducation.
Conclusion
7.11 This chapter has reviewed earlier analytical chapters of the report which covered:household ability and willingness to pay; student loan program feasibility and cost; the coverageof scholarship programs; and the political factors behind public higher education finance reform.Tieing all of these pieces together, it appears the best overall approach would be for LatinAmerican public higher education institutions to raise tuition fees to between 25 to 35 percentof unit costs, combined with expanded student loan and scholarships programs. While higherfee levels might result in greater cost recovery, especially if student loan programs became moreefficient, the political and financial start-up costs of such a policy are likely to be prohibitive.In addition, higher tuition fees might induce unproductive rent-seeking behavior on the part ofhigher education students, who attempt to conceal their household incomes to obtain governmentgrants and loans. Lower fee levels would clearly mean less political resistance and lower start-up costs, but the reductions in cost recovery, public expenditure efficiency and equity would beso limited as to question whether all the time, money and effort required to enact these reformswere worthwhile. Tuition fees at 25 to 35 percent of higher education unit costs appear toreflect the optimum balance of all these factors, financial, institutional and political.

Bibliography/Sources
Albrecht, Douglas and Adrian Ziderman. (1992) Cost Recovery and Financial Aid for HigherEducation. (draft) Washington, D.C.: The World Bank.
Albrecht, Douglas and Adrian Ziderman. (1991) Deferred Cost Recovery for Higher Education:Student Loan Programs in Developing Countries. Washington, D.C.: World BankDiscussion Paper number 137.
Altbach, P. ed. (1989) Student Political Activism: an international reference handbook,Greenwood Press.
Asociaci6n Pan Americano de Instituciones de Crddito Educativo (APICE). (1989) EfectosSociales y Econ6micos del Cr6dito Educativo.
Amadeo, Edward, Jose Camargo and Claudio Castro. (1991) The Political Economy of BudgetCuts: A Suggested Scheme of Analysis. Geneva: LO Discussion Paper 93.
APICE/World Bank. (1991) Cuestionarios para Instituciones de Cr6dito Educativo.
Balan, Jorge. (1990) "Private Universities within the Argentine Higher Education System:Trends and Prospects", Higher Education.
Barr, Nicholas. (1991) "Income-Contingent Student Loans: an Idea Whose Time Has Come",in G.K. Shaw (Ed.) Economics. Culture and Education: Essays in Honour of MarkBlaug.
Becker, G.S. (1962) "Investment in Human Capital: a Theoretic Analysis", J.P.E., LXX, No.5, Part 2.
Betancur-Mejia, Gabriel. (1990) ICETEX - Assessment of Its Experiences Over 40 years andTheir Replicability. Washington, D.C.: World Bank.
Blaug, Mark. (1990) "Economic Value of Higher Education", NIAS.
Bray, Mark. (1986) "Student Loans and Higher Education", Higher Education.
Brunner, Jose and Briones. (1992) Higher Education in Chile: Effects of the 1980 Reform
(draft). FLASCO-Chile: prepared for the World Bank.
Calhau, Herbert. (1990) Educational Credit in Brazil: The Ministry of Education and,Culture/Federal Savings Bank Loan Program, Brazil: prepared for the World Bank.
Casteneda, Tarcicio. (1990) Para Combatir la Pobreza: Poliftica Social y Descentralizaci6n enChile Durante los '80, Santiago, Chile: CEP.

- 104 -
Chen-Yong & Associates Limited. (1990) A Study of the Students' Revolving Loan Scheme(mimeo). Kingston, Jamaica: prepared for the World Bank.
Creedy, John and Patrick Frangois. (1989) "A Public Choice Approach to the Finance of HigherEducation", mimeo.
Colclough, Christopher. (1990) "Raising Additional Resources for Education in DevelopingCountries: Are Graduate Payroll Taxes Superior to Student Loans", International Journalof Education Development.
Fried, Beatriz and Mario Abuhadba. (1990) "Reforms in Higher Education: the Case of Chilein the 1980's", mimeo.
Gertel. (1991) "Issues and perspectives for Higher Education in Argentina in the 1990s", HigherEducation, 21.
Grosh, Margaret and Judy Baker. (1992) From Platitudes to Practice: Targeting Social Prog niin Latin America. Washington, D.C.: World Bank LATHR Technical Series Repo..
Haddad, Wadi, Martin Carnoy, Rosemary Rinaldi, and Omporn Regel (1990) Education andDevelopment: Evidence for New Priorities. Washington, D.C.: The World Bank.
Hinchcliffe. (1991) Access, Quality and Efficiency in the Caribbean: A Regional Study.prepared for the World Bank.
Jallade, Jean-Pierre. (1973) The Financing of Education: an Examination of Basic Issues.Washington, D.C.: The World Bank.
James, Estelle. (1977). "Product Mix and Cost Disaggregation: a Reinterpretation of theEconomics of Higher Education", The Journal of Human Resources, XIII, 2.
Jimenez, Emmanuel. (1987) Pricing Policy in the Social Sectors. Washington, D.C.: TheWorld Bank.
Johnstone, Bruce. (1986) "Sharing the Costs of College", mimeo.
Kugler, Bernardo and George Psacharopoulos. (1989) "Earnings and Education in Argentina:an Analysis of the 1985 Buenos Aires Household Survey", Economics of EducationReview.
Lockheed. Marlaine and Adrian Verspoor. (1990) Improving Primary Education in DevelopingCountries. Washington, D.C.: The World Bank.
Lewis, Alan, Cedric Sanford, and Norman Thomson. (1980) "Grants or Loans". The Instituteof Economic Affairs.
McMahon and Geske. (1982) Financing Education. University of Illinois.

- 105 -
Mincer, J. (1958) "Investment in Human Capital and Personal Income Distributi-n," LE.,LXVI, No.4.
Mingat and Tan. (1986) "Expanding Education Through User Charges in LDCs: What Can BeAchieved?", Economics of Education Review 5 (3).
Penera, Sebastian and Marcelo Selowsky. (1981) "The Optimal Ability Education Mix and theMisallocation of Resources within Education Magnitude for Developing Countries",Journal of Development Economics.
Petrei, A. Humberto. El Gasto Pdblico Social y Sus Efectos Distributivos. Rio de Janeiro:ECIEL, 1987.
Posada, Alvaro Reyes. (1990) Prefeasibility Study for Expanding Credit Programs for HiherEducation Students in Ecuador. Washington, D.C.: prepared for the World Bank.
Psacharopoulos, George. (1991) The Economic Impact of Education: Lessons for PolicyMakers. Center for Economic C vth.
Psacharopoulos, George. (1990) "Priorities in the Financing of Education", International Journalof Educational Development, Vol. 9.
Psacharopoulos, George. (1985) "Returns to Education: a Further International Update andImplications", Journal of Human Resources, XX, 4.
Psacharopoulos, George and Fiszbein. (1991) "A Cost-Benefit Analysis of EducationalInvestment in Venezuela, 1989", View From LATHR, No. 26. Washington, D.C.: TheWorld Bank.
Psacharopoulos, George and Hongyu Yang. (1991) "Educational Attainment among VenezuelanYouth: an Analysis of its Determinants", International Journal of EducationalDevelopment, Vol.11, No.4.
Reimers, Fernando. (1991) The Role of Organization and Politics ir Government Financing ofEducation: The Effect of 'Structural Adjustment' in Latin America (mimeo).
Reimers, Fernando. (1990) The Feasibility of Introducing Loan Schemes to Finance HigherEducation in Latin America: The Case of Venezuela. Washington, D.C.: The WorldBank.
Reuterberg and Svensson. (1990) "Student Financial Aid in Sweden" Higher Education Policy,Vol.3, No.2.
Rodriguez, Francisco. (1992) An;flisis del Cr6dito Educativo para Postgrados: El caso deAm6rica Latina. BogotA, Colombia: 1992.
Saint, William. (1992) Universities in Africa: Strategies for Stabilization and Revitalization.

- 106 -
Washington, D.C.: World Bank Regional Study, AFTED, 1992.
Salmi, Jamil. (1991) Perspectives on the Financing of Higher Education. Washington, D.C.:World Bank PHREE Background Paper Series No. PHREE/91/45.
Salmi, Jamil. (1992) "Higher Education and Economic Development: Strategies for Reform".Washington, D.C.: World Bank Policy Brief.
Schultz, T.W. (1963) The Economic Value of Education. New York: Columbia UniversityPress.
Seldon, Arthur. (1986) The Riddle of the Voucher, Institute of Economic Affairs.
Tan, Lee, and Mingat. (1984) User Charges for Education: The Ability and Willingness to Payin Malawi. Washington, D.C.: World Bank Staff Working Paper #661.
Tilak. (1990) A Note on Student Loans in Financing Higher Education in India (mimeo).
UNESCO. UNESCO Statistical Yearbook, 1989, 1990 and 1991.
U.S. Department of Education. (1990) Reducing Student Loan Defaults - A Plan for Action.Washington, D.C.
Vazquez-Caro, Jaime, Gary Reid and Richard Bird. (1992) Tax Administration Assessment inLatin America. Washington, D.C.: World Bank LATHR Regional Study No. 13.
Winkler, Donald. (1990) Higher Education in Latin America: Issues of Efficiency and Equity.Washington, D.C.: World Bank Discussion Paper No.77.
Wolff, Laurence. (1991) Higher Education Reform in Brazil, Washington, D.C.: World BankReport No. 9376-BR.
Wolff, Laurence and Jose Brunner. (1992) "Higher Education in Venezuela: Issues and Optionsfor Ref m-" (draft).
Woodhall, Maureen. (1983) Student Loans as a Means of Financing Higher Education: Lessonsfrom International Experience. Washington, D.C.: The World Bank.
Woodhall, Maureen. (1987) Establishing Student Loans in Developing Countries: SomeGuidelines. Washington, D.C.: The World Bank.
Woodhall, Maureen. (1990) Student Loans in Higher Education - Western Europe and the USA.No. 1, Educational Forum Series, IIEP.
Woodhall, Maureen. (1991) Student Loans in Higher Education - Asia, No. 2, EducationalForum Series, IEP.

- 107 -
The World Bank. (1986) Financing Education in Developing Countries. Washington, D.C.: The
World Bank.
The World Bank. (1982-1991) World Development Reports. Washington, D.C.: The World
Bank.

Annex Al of 7
Annex A
Higher Education Enrollnents, Expenditures and Rates of Return
Higher Education Enrollment Rates by Country
Country 1960 1970 1980 1985 1989
Argentina 11.0 13.8 21.6 36.4 40.8 /
Bolivia 3.6 8.6 1/ 16.5 19.5 1/ 22.8
Brazil 1.6 5.3 11.9 11.3 g/ 11.2
Chile 4.0 9.3 13.0 15.9 18.8 1/
Colombia 1.8 4.8 10.6 13.0 13.7
Costa Rica 4.8 10.4 23.0 23.0 26.5
Domincan Republic 1.3 5.3 3.9 18.6 n.a.
Ecuador 2.6 7.7 36.5 33.1 1/ 25.2 1/
El Salvador 1.1 3.4 8.4 16.3 17.1
Guatemala 1.7 3.6 n.a. 8.4 n.a.
Guyana 0.4 1.9 2.6 2.6 4.0
Honduras 1.0 2.2 8.2 9.5 9.7
Mexico 2.6 5.8 14.1 15.6 14.6
Nicaragua 1.2 5.7 14.1 9.8 n.a.
Panama 4.5 6.6 22.0 25.9 21.9 1/
Paraguay 2.6 3.7 8.8 8.9 8.0
Peru 3.6 10.6 19.4 24.3 32.1
Uruguay 7.8 8.4 16.1 31.7 50.4 1/
Venezuela 4.0 10.9 21.4 26.4 27.8 El
1/ 19842/ 19833/ 19734/ 19875/ 1988
Note: Enrollment rates represent ths ratio of higher education enrollments to size
of the 20-24 year old population.
Sources: UNESCO Statistical Yearbook, 1991; 1987; 1972; 1975

Annex A
2 of 7
Higher Education Enrollments by Country Over Time (in 000s)
Country 1950 1960 1970 1980 19851989
Argentina 85.2 180.8 274.6 491.5 846.1 958.5 &/
Bolivia 5.0 12.0 35.3 60.9 g/ 56.6 140.9
Brazil 51.1 95.7 430.5 1,409.2 g/ 1,451.6 4/ 1,518.9
Colombia 10.0 22.7 85.6 271.6 391.5 474.8
Costa Rica 1.5 4.7 15.5 55.6 63.8 77.8
Chile 9.5 1/ 25.5 78.4 145.5 196.9 235.0 2/
Ecuador 4.1 9.4 38.7 269.8 280.6 197.6
El Salvador 1.2 2.4 9.5 16.8 70.5 80.8
Guatemala 2.4 5.2 15.6 50.9 ?/ 48.3 51.9 3/
Guyana n.a. 0.2 1.1 2.5 2.3 3.7
Honduras 0.8 1.7 4.0 25.8 36.6 44.8
Mexico 35.2 78.0 247.6 897.7 1,207.8 1,314.0
Nicaragua 0.6 1.4 9.4 35.3 29.0 26.9 /
Panama 1.5 4.0 8.2 40.4 55.3 51.1 1/
Paraguay 1.7 3.4 8.2 26.9 32.1 31.1
Peru 16.1 31.0 126.2 306.4 452.5 656.3
Dominican Republic 2.3 3.4 23.5 42.4 Z/ 123.7 n.a.
Uruguay 11.7 15.4 n.a. 36.3 77.5
Vei4azuela 6.9 26.5 100.8 307.1 443.1 500.3 1/
I/ 19492/ 19782/ 19864/ 1987
,/ 1988 -
Source: UNESCO, Statistical Yearbook, 1991; 1987; 1972; and 1964.

Annex A3 of 7
Spending on Higher Education on a Percentage
of Total Education Spending
Country 1960 1970 1980 1985 1989
Argentina n.a. 21.0 22.7 19.2 g/ n.a.
Bolivia n.a. 15.4 4/ 17.1 n.a. 23.2 i/)
Brazil 20.1 n.a. 18.9 20.8 2/ 17.6 2/
Chile 21.0 Z/ 37.9 5/ 33.2 20.3 21.6
Colombia 16.9 Z/ 23.9 24.1 22.2 17.9
Costa Rica n.a. 10.4 4/ 26.1 41.4 40.3
Cuba n.a. n.a. 6.9 12.9 14.4
Dominican Republic 16.5 1/ 21.4 23.9 20.8 19.7 2/
Ecuador 21.9 Z/ n.a. n.a. 17.8 13.6
El Salvador n.a. 21.4 14.2 n.a. n.a.
Guatemala n.a. 13.1 n.a. 19.7 1/ n.a.
Guyana 1.0 14.7 15.2 j/ 17.8 n.a.
Honduras n.a. 11.9 19.3 26.5 1/ 20.7 2/
Mexico n.a. 10.4 26.5 29.2 18.1
Nicaragua n.a. 10.0 10.5 23.2 16.0 1)/
Panama 7.4 10.8 13.4 20.4 22.8
Paraguay 20.0 j/ 16.5 n.a. 23.8 n.a.
Peru 10.9 P/ 15.7 §/ 25.2 34.3 4/ n.a.
Uruguay n.a. 19.0 16.1 22.4 21.8 11/
Venezuela n.a. 25.5 39.2 43.4 35.7 11/
Source: UNESCO, Statistical Yearbook, 1991; 1987; 1974; and 1964.
1/ 1982 6/ 19712/ 1984 2f 19613/ 1979 g/ 1962A/ 1968 9/ 19865/ 1969 10 1987
111 1988

Annex A4 of 7
Total Education and Higher EducationExpenditures by Country, 1970 - 1989
(in constant 1985 US$)
Total Edu,ation Expenditures Hieher Education Expenditures
Country 1970 1980 1985 1989 1970 1980 1985 1989
Argentina 1,232 3,347 1,174 674 213 1,148 361 308
Brazil 2,730 2,085 3,646 5,382 1,067 1,251 3,646 3,391(Federal Universities only)
Chile 1,244 1,524 628 591 487 506 127 128
Colombia 226 745 960 884 54 180 213 158
Mexico 1,551 6,509 4,697 4,298 156 1,725 925 778
Venezuela 919 3,346 2,233 2,010 340 1,312 876 717
Note; All data are in millions of 1985 U.S. Dollars. Data in the 1979 column for Chile are from 1973.
Data in the 1985 column: for Argentina and Brazil is for 1986; for Venezuela is for 1984.
1970 data on Brazil Higher Education Expenditure is for all universities. 1980 data are for federal
universities only.
Sources: IMF Government Finance Statistics, 1991; 1986; 1982.UNESCO Statistical Yearbook 1991: 1987: 1984: 1982: 1974.Hieher Education Reform in Brazil, The World Bank, 1991.Winkler, Higher Education in Latin America, The World Bank, 1990.

Annex A5 of 7
Higher Education Spending in Latin America(in constant 1985 US$)
Higher Education Budget Budget per Student
Est.
Country 1970 1980 1985 1989 1970 1980 1985 1989
Argentina 213 1,148 361 308 939 2,983 507 383
Brazil 1,067 1,251 3,646 3,391 5,508 3,950 3,431 5,444(FederalUniversitiesonly)
Chile 487 506 127 128 9,408 5,350 960 813
Colombia 54 180 213 158 1,169 1,786 1,395 853
Mexico 156 1,725 925 778 741 2,261 923 713
Venezuela 340 1,312 876 717 3,791 4,910 2,382 1,727
Note: All data are in 1985 prices. Budget amounts are in millions of U.S. dollars, while per student amountsare stated in single dollar amounts.
Data in the 1970 columns for Chile refer to 1973.
Data in the 1985 columns: for Argentina and Brazil is for 1986; for Venezuela is for 1984.
Also, note that per student amounts are based on enrollment in public higher education.
1970 data on Brazil for all universities. 1980 data for federal universities only.
Sources: IMF Government Finance Statistics, 1991; 1986; 1982.UNESCO Statistical Yearbook 1991; 1989; 1984; 1982; 1974.Higher Education Reform in Brazil, The World Bank, 1991.Winkler, Higher Education in Latin America, The World Bank, 1990.
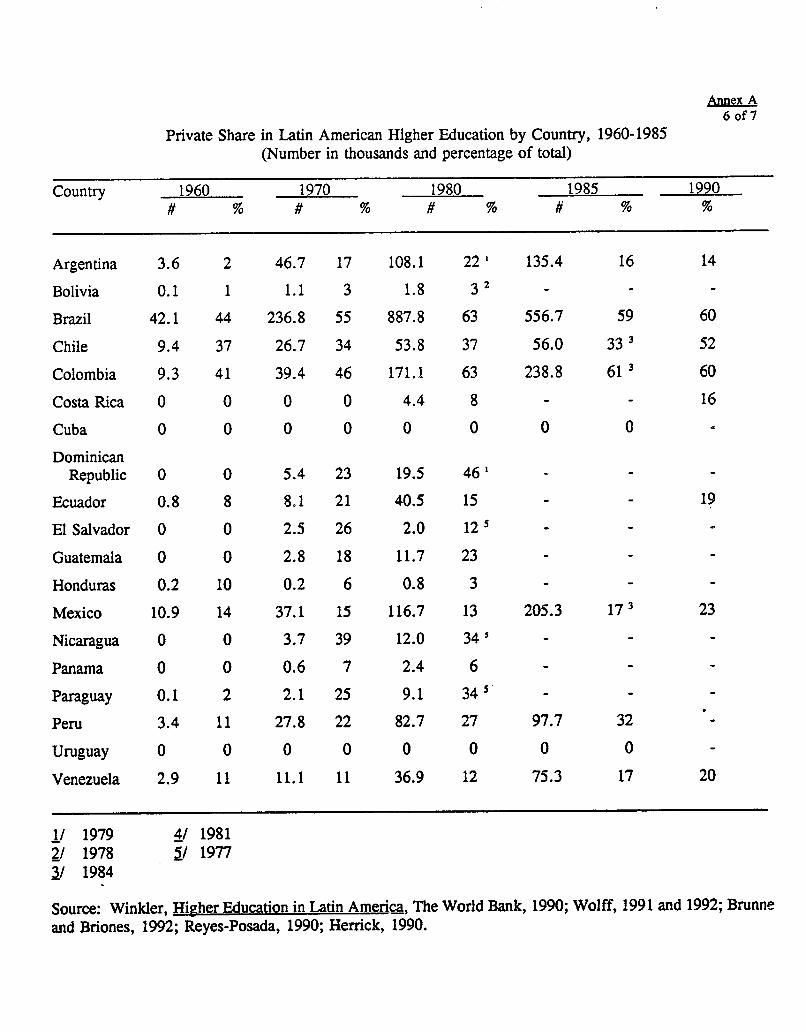
Annex A6 of 7
Private Share in Latin American Higher Education by Country, 1960-1985(Number in thousands and percentage of total)
Country 1960 1970 1980 1985 1990
Argentina 3.6 2 46.7 17 108.1 22' 135.4 16 14
Bolivia 0.1 1 1.1 3 1.8 3 2 - - -
Brazil 42.1 44 236.8 55 887.8 63 556.7 59 60
Chile 9.4 37 26.7 34 53.8 37 56.0 33 1 52
Colombia 9.3 41 39.4 46 171.1 63 238.8 61 3 60
Costa Rica 0 0 0 0 4.4 8 - - 16
Cuba 0 0 0 0 0 0 0 0 -
DominicanRepublic 0 0 5.4 23 19.5 46' - - -
Ecuador 0.8 8 8.1 21 40.5 15 - - 19
El Salvador 0 0 2.5 26 2.0 12 s - .
Guatemala 0 0 2.8 18 11.7 23 - -
Honduras 0.2 10 0.2 6 0.8 3 - - -
Mexico 10.9 14 37.1 15 116.7 13 205.3 17 3 23
Nicaragua 0 0 3.7 39 12.0 34 S - -
Panama 0 0 0.6 7 2.4 6 - -
Paraguay 0.1 2 2.1 25 9.1 34 5 - -
Peru 3.4 11 27.8 22 82.7 27 97.7 32
Uruguay 0 0 0 0 0 0 0 0 -
Venezuela 2.9 11 11.1 11 36.9 12 75.3 17 20
1/ 1979 4/ 19812/ 1978 1/ 19771/ 1984
Source: Winkler, Higher Education in Latin America, The World Bank, 1990; Wolff, 1991 and 1992; Brunne
and Briones, 1992; Reyes-Posada, 1990; Herrick, 1990.

Annex7 of
Private and Social Rates of Return to Education
Social Private
Country/Region Year Primary Secondary Higher Primary Secondary Higher
Argentina 1975 16.7 <.4 7.1 30.0 9.0 11.0
Brazil 1970 23.5 13.1 24.7 13.9
1980 12.7 18.1 18.2
Chile 1959 24.0 16.9 12.2
1982 12.1 9.0 6.8 27.8 11.2 10.1
Colombia 1976 18.4 24.9
1985 7.0 9.0 13.0
Mexico 1963 25.0 17.0 23.0 32.0 23.0 29.0
Paraguay 1982 14.0 11.0 13.0
Peru 1974 34.3 9 0 15.0
1980 41.4 3.3 16.1
1985 12.7 i.6 10.9
Venezuela 1957 82.0 17.0 23.0 18.0 27.0
1975 16.4 14.6 11.2 24.5 20.2 21.5
1984 17.5 10.5 8.7 * 24.3 12.4 15.0*
1989 18.2 9.0 * 7.30 27.4 12.0** 12.0 #
Averages
Latin America 14.0 17.7
1980 or earlier data 16.5 22.4
data after 1980 8.9 12.0
Africa 45.0 26.0 32.0
Industrialized Countnes 12.0 12.0
Sources: Argentina: Kugler and Pascharopoulos (1988); Brazil:
Pacharopoulos (1987a); Chile: Rivares (1986); Colombia: Mohan (1985); Peru: Steloner ct a1. (1987); Venezuela: Fiuzbein and
Pascharopoulos (1991); Psacharopoulos (1988); other countries fiot Psacharopoulos (195).
* Numbers given are for all higher education; for university education alone, the social resurn was 11.6 in 1975 and 10.7 in 1984, and
the privae return was 23.1 in 1975 and 15.6 in 1984.
** Weighted average of returns for general and technical secondary education
I For university education relative to general accondaty education

Annex BPage 1 of 25
Selected Tables and Graphs From Household Survey Data andStudent Loan Program Simulations
ARGENTINA: Affordability of TotalFinancial Costs of H.E. by Income Decile
Alfordable % of Financial Costs100 -
60 - - - - - - - - **- -- - - - -
0;1 2 3 4- -6 7 8 9- -
Income DecileBottom 30% contribute 5% of income;Middle 40%, 10%; Wealthiest 30%, 15%.
BRAZIL: Affordability of TotalFinancial Costs of H.E. by Income Decile
Affordable % of Financial Costs100-
8 0 .. -.---.- -----------------------------
60 -----
20 .. ....-------------- -
1 2 3 4 5 6 7 8 9 10
Income DecilePoorest 30% pay 5% of Income;Middle 40%, 10%; Wealthiest 30%, 15%

Annex BPage 2 of 25
COLOMBIA: Affordability of TotalFinancial Costs of H.E. by Income Decile
Affordable % of Financial Costs100-
B0.7
60: - - - - - - - - - - -- - - - -
20 ------------------ _-_- - _----
1 2 3 4 5 6 7 8 9 10Income Declie
Poorest 30% pay 5% of Income;Middle 40%, 10%; Wealthiest 30%, 15%.
COSTA RICA: Affordability of TotalFinancial Costs of H.E. by Income Decile
A'fordable % of Financial Costs100-
60.--- . -........-...-..... ......-.--........................ ............. ..
407- .... - - - ------------------------ -- - - -----
1 2 3 4 5 6 7 8 9 10Income Decile
Poorest 30% pay 5% of income;Middle 40%, 10%; Wealthiest 30%, 15%.

Annex BPage 3 of 25
ECUADOR: Affordability of TotalFinancial Costs of H.E. by Income Decile
Affordable % of Financial Costs100 -
20.
1 2 3 4 5 6 7 8 9 10
Income DecilePoorest 30% pay 5% of Income;Middle 40%, 10%; Wealthiest 30%, 15%.
GUATEMALA: Affordability of TotalFinancial Costs of H.E. by Income Decile
Affordable % of Financial Costs100-
8 0 .. . -.- - - - - - -
4 0 -..-.---.-...-----
20. - -.-- - -
1 2 3 4 5 6 7 8 9 10Income Decile
Poorest 30% pay 5% of income;Middle 40%, 10%; Wealthiest 30%, 15%.

Annex BPage 4 of 25
JAMAICA: Affordability of TotalFinancial Costs of H.E. by Income Decile
Affordable % of Financial Costs100-
40.-.- - - - - - - - - - - - - - -
20 ...........-.......-. . .--...-. .
1 2 3 4 5 6 7 8 9 1OIncome Decile
Poorest 30% pay 5% of Income;Middle 40%, 10%; Wealthiest 30%, 15%.
MEXICO: Affordability of TotalFinancial Costs of H.E. by Income Decile
Affordable % of Financial Costs100
.8.. .--.-..-..- . -..- ---- - -- --- --------
60...................~ ......aa
40 -7 -- - - -- --- -- ---A
S 6 7 8 9 10Income Decile
Poorest 30% pay 5% of income;Middle 40%, 10%; Wealthiest 30%, 15%.

AD几eXBPage 5 of 25
江 州

Annex BPage 6 of 25
Potential New Private Financing for Higher Education:Combined Effects of Tuition Fees, Loans and Scholarships
LATIN AMERICA AND THE CARIBBEAN OVERALL
LAC: NEW PRIVATE FUNDING FOR H.E.RELATIVE TO CURRENT PUBLIC H.E. SPENDING
INDEX - 100140
130
120 -
110
100
so
80 L L1 2 3 4 5 6 7 8 9 10 11 12 13 14 15 16 17 18 19 20
YEARS
BASE LINE INDEX NET LOAN
TUITION SCHOLARSHIPS
Base line index includes I% annualgrowth n real pu bi Ic expenditures.
ARGENTINA
ARGENTINA: NEW PRIVATE FUNDING FOR H.E.RELATIVE TO CURRENT PUBLIC H,E. SPENDING
INDEX 100130
120 - a- a a 8 a
110 -
100
go
go1 2 3 4 5 6 7 8 9 10 11 12 13 14 15 16 17 18 19 20
YEARS- BASS LINE INDEX --W-- NET -4- LOAN
-a- TUITION SCHOLARSHIPS
Best line Ind OX Includes 1% annualgrowth if, teal pli bi IC expenditures.

Annex BPage 7 of 25
BRAZIL
BRAZIL: NEW PRIVATE FUNDING FOR H.E.RELATIVE TO CURRENT PUBLIC H.E. SPENDING
INDEX 100160
140 -
120 -
100
1 2 3 4 5 6 7 8 9 10 11 12 13 14 15 16 17 18 19 20YEARS
- -B ASE LINE INDEX NET -*- LOAN
-6- TUITION SCHOLARSHIPS
Base lino index includes i% annualgrowth in real public expenditureo
COLOMBIA
COLCMBIA: NEW PRIVATE FUNDING FOR H.E.RELATIVE TO CURRENT PUBLIC H.E. SPENDING
INDEX - N100130
120
100910
-
-
900
1 2 3 4 5 6 7 8 9 10 11 12 13 14 15 16 17 18 19 20YEARS
- BASS LINE INDEX NET -- LOAN
-w- TUITION SCMCLARSHIPS
Base lIne index includes 1% annualgrowth in real public expendItures.

Annex BPage 8 of 25
MEXICO
MEXICO: NEW PRIVATE FUNDING FOR H.E.RELATIVE TO 'URRENT PUBLIC H.E. SPENDING
INDEX = 100140
130-
120-
110
100r
90
A01 2 3 4 5 6 7 8 9 10 11 12 13 14 15 16 17 18 19 20
YEARS- BASE LINE INDEX NET LOAN
-0- TUITION SCHOLARSHIPS
ease line index includes 1% annualgrowth in rel public expenditures.
VENEZUELA
VENEZUELA: NEW PRIVATE FUNDING FOR H.E.RELATIVE TO CURRENT PUBLIC H.E. SPENDING
INDEX = 100140
130
120
110
100
90
1 2 3 4 5 6 7 8 9 10 11 12 13 14 15 16 17 18 19 20YEARS
- BASE LINE INDEX -4- NET -4- LOAN
- TUITION - SCHOLARSHIPS
Base 1100 index includes 1% annualgrowth in real public expenditures.

Age-Earnings Profiles--- Annex B
Higher Education Graduates Page 9 of 25
(1989)(local currency)
Age Argentina Chile Colombia Costa R. Mexico* Venezuela
22 1514 32512 41191 10397 23825 40402
23 3029 65024 82382 20794 47649 80804
24 4867 83433 96194 20288 79643 126187
25 4788 74147 97;52 20394 61722 105261
26 6230 89451 103779 20328 85033 119689
27 6705 92873 107740 24947 97140 116799
28 5592 103221 106043 26256 110679 124479
29 5479 110849 113811 29331 117822 123156
30 8209 115911 117763 26976 129148 131632
31 9656 122311 124534 28759 137862 134410
32 11089 122400 122790 28886 154816 137396
33 8825 135202 121560 29469 164068 142869
34 9680 154052 133413 29743 187142 150093
35 9412 150203 140518 30367 217221 151344
36 11152 146325 148473 32258 227639 158180
37 11950 128465 151892 33153 238764 165724
38 10203 126944 158477 35216 213066 180251
39 8160 138634 173671 33810 245784 184283
40 9383 154212 165436 33572 240924 194548
41 11506 180432 161963 30341 318382 187500
42 12473 227355 156144 33272 273560 181436
43 9975 226317 153332 33172 309798 174210
44 10023 217119 179102 33011 286101 190298
45 12510 189088 183019 26908 286213 195430
46 18754 193361 205772 23835 275476 185111
47 17817 198328 206706 27365 231062 178025
48 16503 229583 202810 27305 204732 189884
49 10630 241381 203918 25715 194636 204518
50 11582 250580 181527 24462 312436 227195
51 12391 229178 203448 19267 281015 230408
52 11345 284456 199795 20340 227130 227355
53 12151 271530 209429 19873 229068 231263
54 7772 293070 200888 26123 193639 216012
55 7996 255104 187521 33741 213163 230675
56 7399 267737 212456 26122 147953 24133257 11403 227256 210532 26264 331892 270229
58 10631 345522 192937 17419 326350 261698
59 8311 361786 190460 19084 307489 227602
60 6794 343040 205905 16539 129550 224172
61 7788 264950 249333 16539 291167 253952
62 8932 334202 234222 667 383250 280148
63 12972 429210 188841 2058 312000 242543
64 14875 370185 197508 3088 79600 197843
65 17805 273372 173091 5392 119400 163743
*: 1984

A Schematic Diagram of Financial FlowsFor Higher Education
Loan Guarantee (Interest Subsidy
Parental Support Loan Grants
Student Expenses 4 General Taxes
GovernmentFees
Living Expenses User Charges Direct Funding (Taxpayers)
School Expenses Graduate Taxes
Source: Guozhong Xie, 1990

Household Ability to Pay Tuition Fees, by Income Decile, 1989(local currency)
10% 25% 10% 25% 10% 25% 10% 25% 25% %Argentina Unit Brazil Unit Colombia Unit Costa Rice Unit Ecuador Unit
Income Household Cost Household Cost Househnid Cost Household Cost Household CostDecile ' Income 25.932 Income 3,373 Income 182,092 Income 20,925 Income 147,769
I 10,S35 41% 252 7% 36.546 20% 3.909 2% 13.322 9%2 19.095 74% SOS 15% 59.036 32% 9.239 5% 64.390 44%3 25.680 99% 721 21% 104.016 57% 13,148 7% 79.933 54%4 33,581 129% 974 29% 104.016 57% 17,412 10% 113,238 77%5 39.507 152% 1,334 40% 154.619 85% 21.676 12% 128.781 87%6 49,384 190% 1.767 52% 202.410 111% 27.361 15% 164,307 111%7 61,236 236% 2,452 73% 210,844 116% 33,047 18% 204.273 138%8 77.039 297% 3,462 103% 312,049 171% 42.996 24% 290,867 197%9 104.035 401% 5.878 174% 461,045 253% 59,697 33% 335,274 227%
10 238,359 ')19% 18,717 555% 1,166,669 641% 126,857 70% 825,974 559%
Mean 658,450 36.064 2,811,250 355,342 2,220,359
10% % 10% % 10% % 10% %Guatemala Unit Jamaca Unit Mexico Unit Venezuela Unit
Income Household Cost Household Cost Household Cost Household CostDocile Income 436 Income 2,623 Income 617,806 Income 19,496
I 23 5% 486 19% 145,563 24% 5,102 26%2 86 20% 784 30% 257.534 42% 8,220 42%3 86 20% 1,081 41% 358,308 58% 12.188 63%4 137 31% 1,351 52% 459.083 74% 15,590 80%5 189 43% 1,703 65% 582.251 94% 15,873 81%6 257 59% 2,054 78% 739,011 120% 22,393 115%7 349 80% 2,567 98% 940,560 152% 26,644 137%8 440 101% 3.270 125% 1,242,882 201% 34.298 176%9 600 138% 4.511 172% 1,802,739 292% 47.336 243%
10 2.686 616% 9,243 352% 4,658,009 754% 95,807 491%
Mean 5.714 27,026 11,197,138 283,542
Income Sources - Household Income Surveys. Annex 0: Unit Cost Sources - Annex H
tow

Higher Education Graduate Ability to Repay Student Loans, by Estimated Income Decile, 1989Using Simulated Student Loan Models(1989 local currency)
Argentine Loan Payment Brazil loan Payment Colombia Loan Payment Costa Rica Loan Payment Ecuador Loan PaymentHigher Ed. at 25% UC as Higher Ed. at 25% UC as Higher Ed. at 25% UC as Higher Ed. at 25% UC as Higher Ed. at 25% UC asIncome Graduate I of Income Graduate % of Income Graduate % of Income Graduate % of Income Graduate % of IncomeDeclle Income 21,650 Income 1,704 Income 91.986 Income 10,571 Income 74.647
1 112,889 19% 10.418 16% 438.937 21% 114.839 9% 451,156 17%2 183,620 12% 16,945 10% 713.958 13% 186.793 6% 733,833 10%3 217,477 10% 20,070 8% 845.600 11% 221.235 5% 869,141 9%4 235.784 9% 21,759 8% 916.779 10% 239,858 4% 942.301 8%5 262.456 8% 24,220 7% 1,020.486 9% 266,991 4% 1.048.895 7%6 294,869 7% 27,212 6% 1.146.516 9% 299,964 4% 1,178,433 6%7 328.069 7% 30,275 6% 1.275.608 7% 333,738 3% 1,311.119 6%8 384,497 6% 35.483 5% 1.495.012 6% 391.141 3% 1,536,631 5%9 466.055 5% 43,009 4% 1,812.128 5% 474,109 2% 1,862,575 4%10 721.654 3% 66.597 3% 2.805,954 3% 734.124 1% 2.884.068 3%
Mean%I 315.570 29.122 1.227.007 321.023 1.261,165
Guatemala Loan Payment Jamaica Loan Payment Mexico Loan Payment Venezuela Loan PaymentHigher Ed. at 25% UC as Higher Ed. at 25% UC as Higher Ed. at 25% UC as Higher Ed. at 25% UC as
Income Graduate % of Income Graduate % of Income Graduate % of Income Graduate % of IncomeDecile Income 220 Income 1,592 Income 312.092 Income 12,794
1 3.221 7% 6.492 25% 3,520.922 9% 39,333 33%2 5.240 4% 10.559 15% 5,726.998 5% 63.978 20%3 6,206 4% 12,506 13% 6,782,968 5% 75,775 17%4 6.728 3% 13.559 12% 7.353.928 4% 82.153 16%S 7,489 3% 15.093 11% 8.185,811 4% 91.447 14%6 8,414 3% 16,957 9% 9,196,759 3% 102,740 12%7 9.362 2% 18,866 8% 10.232,264 3% 114.308 11%8 10.9"2 2% 22,11 7% 11.992.214 3% 133,969 10%9 13.299 2% 26,801 6% 14,535.955 2% 162.386 8%
10 20,593 1% 41,499 4% 22,507.912 1% 251,444 5%
MeanI 9.005 18,147 9,842.415 109,953
%I: Mean for Higher Education Graduates betweOn the ages of 22 and 30from household survey data.
to
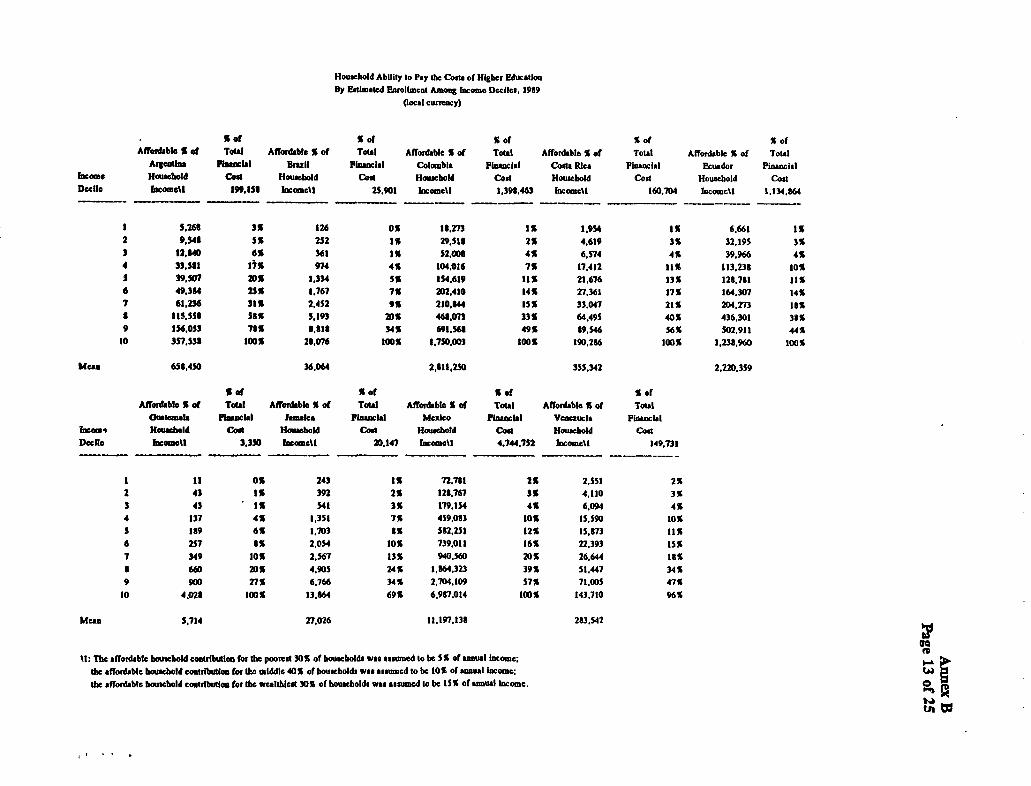
Ноwеьоl дAЫIiry 1оPsy 1ьеСоги of Hfgьer Еймвll оnВу F� tlmated F1uo11meo1 Naag Iocomo Decil и . 1989
р« � 1 eumar)
� f оГ % of f of % of % ofARordabb t ot Тоt в1 А1[огдвЫ е% о( Тои1 Affo гdabe fi of Таи1 А fГогдвЫ е х оГ Тои1 Affoгdabc % ot Тои1At;ealFna Piatnclвl Вnк11 Plaaocial Со1отDlв Floancld СоАаRl св Рi овх iвl Есш дог Pinoacldlх от е HwueDold Соп Н оwеьоl д СоМ Ноивеьоlд CoN Ноwеьоl д CoR Ноиееьоl д СопDee11e l осот еll 199.13 а l осот еll ц .901 l п amell 1, з9 а.46 з ioeomell 16о,704 lncomcU 1.134.a6/
1 3.Tba зfi 126 0% 1а.277 1% 1.95i l% б.бь! 1%2 9,34а 3% ц 2 1х 29,51а 2% 4,619 э% 32,195 3%з 1?, а4о б% эб! 1д s2,ooa 4s б,я 4 � к зя,9 ьв вхб эзs аt 13>< я�r4 4s 1а ,о16 Ts nлl а 11 х из,2 за 1 охs эя,S о? 2о>< 1, зз4 s% 134,61я и % г1, в7 в 1эк 1za,� e1 их6 4я,эы ц % 1,76'1 7% 2о2 м о !4% 2 т,зь1 17% 1ы ,зт и хТ в1. ц б als глs2 яs 2а . ан 1ss з). о4'1 21 х г01.2тз 1 а%а 11s,sst sas s,l яз 2о% 4ы ,тз ззs ьа,4 яs � о% �эь,эоl захя 1s6,os7 7а% а, аи з4 х бяl,s ы 4 ях ая,s4б sвli soz,яll м я1 о этr,s эа loos 2а.мб !оо% 1. � ю .аоЭ 1оо% 19одеь lаох lдзе.9 ьо l аохне. л вs алsо зб.оы 2, е1l, тsо зsт. ц 2 гдю , эs9
1< оГ % ot % ot % ofАпогдаьl е >< ог тои l Апогдвые % ог тоиl АQогдвые f о! тои ! лРl огдвьlе 1бог тои l
а nвl етвl в РlиваеЫ l ет вkв Р1аи с1вl М едl со Р1т лс1вl Yenczuclв Fio вncidlоеот е НоовеЪоl д СоМ Ноовеьоl д СоА Ноwеьоlд Совt Howchold СоаDa11e Еоео®e1l 3. зS0 loeomell 2o.1q Incomoll 1.'144.?32 lпсатеll 1� 9,7з1
1 11 О% 24 э 1% ?2,9а1 2% 2,55! 2 х2 {э 1% з92 2% l2 а.?67 з% 4.110 з% -э 4 з � 1% S1l 3% 179.154 1% 6,094 4%4 137 4f l, зS1 ')1f 459,oa1 t0% 15,590 10%3 1 ая б% l.70э а% 5а2, ц 1 l2% 15.67з 11f6б ц� ех z,os4 1о% � зя,о1! 1ьs гz, зяэ 1ss1 э1я 1о% г.367 1 зх я10.S60 20х гь.б41 1аха ббо 2оя � .90s 2Ах 1. абl. эz з з9 я s1.447 эах9 900 27% 6.7ьб з4% 2.704.109 57% 71.OOS � 7%
10 1,02а 1о0% 1 з, аб4 69 х 6,9а7,о11 IOD% 14 э,710 96%
мс.n s.Tl4 r2. огв 11,192,1эа 2аэ.s42 �ого1l: ТЬеsПorda бte ьоик ьоt дсоМ гl ьиll ооГт tьеpoonR эо% о( ьоик ьоl деwu меитеА to ье516 of вanwll« от е; r
1ьевflогдвЫ еЬоивсbоlд еооl дьиЦооfor 1Ъеmiddle 40% of ьоик ьоl дгw�и аапtтсд to ье lo% о( вт wl iдсот е; W �1ьевflогдаЫ еЬат еьоlд eootdbutleu Гог1ьеvu1W1eR э0% а( ьоик ьоlдгwu и ъитеАW ье15 % of в®иа1 lncome.
м RR�� �

ABILITY TO PAY STUDENT FEES AMONG RICHEST 30% OF LAC HOUSEHOLDS(Ali figures in 1989 local currency)
15% OfAverage Average 15% Income 15% Income
Household Household H.E. H.E. Total as% of as % ofbcouwjyl Incomelyr Annual Annual Student H.B. Unit Cosd H.E. TotalTop 30% of Top 30% of Unit Living Education mean unit Higher EdCountry Population Population costs Expenses CbstsfYr IncomcfYr Costs costs
(1) (2) (3) (4) (S)=(3)+(4) (6)--(3)t(l) (7)=(2)/(3) (8)=(2)/(5)
Argentina 1.398,110 209,717 103,728 77.796 181.524 7% 106% 100%Bran 93.520 14.028 13.490 6.161 19.651 14% 100% 71%Colombia 6,465.877 969.892 728,366 546.275 1,274,641 11% 100% 76%Costs Rica M.167 114,77S 83.700 62,775 146.475 11% 100% 78%Ecuador 4.640,383 726,058 591107S 443.306 1.034.381 12% 100% 70%Guatemala 12.420 1.863 1.745 1,309 3.054 14% 100% 61%Jamaica 56,741 8.512 10,493 7.870 18.363 18% 81% 46%Mexico 2S.678,767 3.851,81S 2,471.225 1.853.419 4,324,644 10% 100% 89%Venezuela S91,470 88,721 77,985 58.489 136,474 13% 100% 65%
Average: 12% 98% 73%
(1): Based on 1989 CEPAL Household Surveys and 1990 World Development Report(2): Based on assumption that with average houseltold size in that countries of 5.3.
wealthiest 30% of houschoMs could spend at least 15% of income for tuition.(3) Gertel, 1991; Higher Education Reform in Brad, Report No.9376-BR;
Coax Rica Basic Education SAR. Report No.9893-CR; A Cost-Benefit Analysis of EducationInvestment In Venezuela. 1989, View from LATHR No.26; Higher Education Credit in Ecuador.Alvaro Reyes Poseds, Nov. IM;
(4): Note that financlal coda an slightly lower for wealthy students because most live In urban armclow to higher education Institutions, so housing and htnsportation costs will be lower.
k4th

ABILITY TO PAY STUDENT FEES AMONG RICHEST 30% OF LAC HOUSEHOLDS(All figures In 1989 local currency)
15% ofAverage Average 15% Income 15% Income
Household Household H.E. N.E. Total as % of as % ofIncome/Yr Income/Yr Annual Annual Student H.E. Unit Cost/ H.E. Total
Top 30% of Top 30% of Unit Living Education Mean Unit Higher Ed.Country Population Population Costs Expenses Costs/Yr Income/Yr Costs Costs
(1) (2) (3) (4) (5)=(3)+(4) (6)=(3)/(I) (7)=(2)/(3) (8)=(2)I(5)
Argentine 1,398.110 209.717 103,728 77.796 181.524 7% 100% 100%Brazil 93.520 14,028 13.490 6.161 19.651 14% 100% 71%Colombia 6.465,877 969,882 728.366 546.275 1,274,641 11% 100% 76%Costa Rica 765,167 114.775 83.700 62.775 146,475 11% 100% 78%Ecuador 4,840,383 726.058 591,075 443,306 1,034.381 12% 100% 70%Guatemala 12.420 1,863 1,745 1.309 3.054 14% 100% 61%Jamaica 56,747 8,512 10,493 7,870 18.363 18% 81% 46%Mexico 25,678,767 3,851,815 2.471,225 1.853,419 4,324.644 10% 100% 89%Venezuela 591,470 88.721 77.985 58,489 136,474 13% 100% 65%
Average: 12% 98% 73%
(1): Based on 19P9 CEPAL Household Surveys and 1990 World Development Report(2): Based on assumption that with average household size In these countries of 5.3,
wealthiest 30% of households could spend at least 15% of Income for tuition.(3) Gertel, 1991; Higher Education Reform In Brazil. Report No.9376-BR;
Costa Rica Basic Education SAR, Report No.9893-CR; A Cost-Benefit Analysis of EducationInvestment in Venezuela, 1989, View from LATIHR No.26; Higher Education Credit In Ecuador,Alvaro Reyes Poseda, Nov.1990;
(4): Note that financial costs are slightly lower for wealthy students because most live In urban areasclose to higher education Institutions, so housing and transportation costs will be lower.
t

Higher Education Graduate Ability to Repay Student Loans, by Estimated Income Decile, 1989Using Simulated Student Loan Models(1989 local currency)
Argentina Loan Payment Brazil Loan Payment Colombia Loan Payment Costa Rica Loan Payment Ecuador Loan PaymentHigher Ed. at 25% UC as Higher Ed. at 25% UC as Higher Ed. at 25% UC as Higher Ed. at 25% UC as Higher Ed. at 25% UC as
Income Graduate % of Income Graduate % of Income Graduate % of Income Graduate % of Income Graduate % of IncomeDecile Income 21,650 Income 1,704 Income 91,986 Income 10,571 Income 74,647
1 112,889 19% 10,418 16% 438,937 21% 114.839 9% 451.156 17%2 183,620 12% 16.945 10% 713,958 13% 186.793 6% 733,833 10%3 217.477 10% 20,070 8% 845,600 11% 221.235 5% 869,141 9%4 235,784 9% 21,759 8% 916.779 10% 239,858 4% 942,301 8%5 262,456 8% 24,220 7% 1,020,486 9% 266.991 4% 1,048,895 7%6 294,869 7% 27,212 6% 1,146.516 8% 299,964 4% 1,178,433 6%7 328,069 7% 30,275 6% 1.275,608 7% 333,738 3% 1,311,119 6%8 384,497 6% 35,483 5% 1,495,012 6% 391.141 3% 1.536,631 5%9 466,055 5% 43,009 4% 1,812.128 5% 474,109 2% 1,862,575 4%
10 721,654 3% 66,597 3% 2.805,954 3% 734.124 1% 2,884,068 3%
Mean%l 315.570 29,122 1,227,007 321,023 1,261,165
Guatemala Loan Payment Jamaica Loan Payment Mexico Loan Payment Venezuela Loan PaymentHigher Ed. at 25% UC as Higher Ed. at 25% UC as Higher Ed. at 25% UC as Higher Ed. at 25% UC as
Income Graduate % of Income Graduate % of Income Graduate % of Income Graduate % of IncomeDecile Income 220 Income 1,592 Income 312,092 Income 12,794
1 3,221 7% 6,492 25% 3,520,922 9% 39,333 33%2 5,240 4% 10.559 15% 5,726,998 5% 63,978 20%3 6,206 4% 12,506 13% 6,782,960 5% 75.775 17%4 6,728 3% 13,559 12% 7,353,928 4% 82,153 16%5 7,489 3% 15,093 11% 8,185,811 4% 91,447 14%6 8.414 3% 16,957 9% 9,196,759 3% 102.740 12%7 9,362 2% 18.866 8% 10,232.264 3% 114.308 11%8 10,972 2% 22,111 7% 11.992,214 3% 133.969 10%9 13.299 2% 26,801 6% 14,535,955 2% 162.386 8%
10 20,593 1% 41.499 4% 22.507,912 1% 251,444 5%
Mean I 9.005 18.147 9,842,415 109,953
11: Mean for Higher Education Graduates between the ages of 22 and 30from household survey data.

Student Loan Program Start-Up CostsWhen Tuition Fee Equals 25% of Unit Cost
(in net present value 1989 currency)
Fee = 25% Public Percent Fcc-Paying PercentPublic H.E. Public H.E. Higher Ed. Enrollment Public Net Present Value Enrollment Net Present Value NPV NPVUnit Cost Unit Cost Enrollment Who Can Higher Ed. Fee Revenucl2* Taking Out Loan Program Start-Up Start-Up Costs 1989 Start-Up Costs
Country (1989 LX) (1989 LX) (1989) Afford Fee Enrollment (1989 LX) Loans (1989 LX) (1989 LX) Ex.Rate (US$)
Argentina 103.729 25,932 824.346 50% 412.173 28,482.255,113 40% 43.183.713.000 14,701,457,887 423 $34.755,220Brazil 13.490 3.373 627.585 20% 125.517 1,127,999.946 70% 3,770.450,000 2.642,450.054 2.834 $932,410,040Colombia 728.366 182,092 434.623 20% 86,925 42.178,093,395 60% 120,843,763,000 78.665.669,605 3F2 57 $205,624,251Costa Rica 83.700 20,925 57,663 10% 5,766 321.526,868 80% 2,456.537.000 2.135,010,132 81 5 $26.196,443Ecuador 591.075 147,769 151.971 30% 45,591 17,952.260,656 60% 34,289,818,000 16,337,557,344 526 35 $31,039,341Guatemala 1,745 436 39,932 30% 11,980 13.926,190 60% 26,600,000 12,673,810 2.8161 54,500.483Jamaica 12,607 3.152 12.054 10% 1,205 10.123,659 60% 58,010,000 47,886.341 5 745 18,335,307Mexico 2,471,224 617,806 783,704 30% 235,111 387.061.649.146 60% 739.309 319,000 352,247,669,854 2461.5 $143,102,852Venezuela 77,985 19,496 498,921 30% 149,676 7.776,043.722 60% 14,852,677,000 7,076,633,278 34 681 S204.049,286
Notes: Estimates of percent enrollment which can afford to pay fees, and take out loansbased on 1989 household income survey data (see Annex G for sources). Those not payingfees or taking out loans are assumed to be on full scholarship.Loan Program Start-Up Costs are based on first six years of program during which not
cash flow is negative. Loan Program assumes 4-year disbursement, 40% interest rate subsidization,10-year repayment. I -year grace, 20% default, 10% administrative costs
*: Assume one-half of fee revenue is turned over to universities for their own uses.
c:%l231slXprogramS

Student Loan Program Start-Up CostsWhen Tuition Fee Equals 50% of Unit Costs
(in Net Present Value 1989 Currency)
Fee = 50% Public Percent Fee-Paying PercentPublic H.E. Public H.E. Higher Ed. Enrollment Public Net Present Value Enrollment Net Present Value NPV NPV
Unit Cost Unit Cost Enrollment Who Can Higher Ed. Fee Revenul2* Taking Out Loan Program Start-Up Start-Up Costs Start-Up CostsCountry (1989 LX) (1989 LX) (1989) Afford Fee Enrollment (1989 LX) Loans (1989 LX) (1989 LX) Ex.Rate (US$)
Argentina 103,729 51,865 824,346 40% 329,738 45,571.608,181 50% 125,876,661.000 80.305,052,819 423 $189,846,461Brazil 13.490 6.745 627.585 10% 62,759 1.127.999.946 80% 8.618,171,000 7,490.171,054 2.834 $2,642,967,909Colombia 728.366 364,183 434.623 20% 86,925 42,178,093.395 70% 281,968.781.000 239,790,687.605 382.57 $626,789,052Costa Rica 83.700 41.850 '57,663 20% 11.533 321,526,868 70% 4.298.940,000 3,977.413.132 81.5 $48,802,615Ecuador 591.075 295,538 151.971 20% 30,394 17.952.260.656 70% 80.009,576.000 62.057.315,344 526.35 S11,901.236Guatemala 1.745 873 39.932 10% 3,993 13,926.190 80% 70,933,000 57,006,810 2.8161 $20.243.177Jamaica 10,493 5,247 12,054 10% 1,205 10,123.659 80% 154.694,000 144,570,341 5.745 $25,164.550Mexico 2,471.224 1,235,612 783.704 20% 156,741 387,061.649,146 70% 1,725,055,776.000 1,337,994,126.854 2461.5 5543.568.607Venezuela 77,985 38,993 498.921 20% 99,784 7,776.043,722 70% 34.656.246,000 26,880,202,278 34.681 $775,069.989
Notew: Estimates of percent enrollment which can afford to pay fees, and take out loansbased on 1989 household income survey data (see Annex 0 for sources). Those not payingfees or taking out loans are assumed to be on full scholarship.Loan Program Start-Up Costs are based on first six years of program during which actcash flow is negative. Loan Program assumes 4-year disbursement, 40% interest rate subsidization,10-year repayment. I-year grace. 20% default, 10% administrative costs
*: Assume one-half of fee revenue is turned over to universities for their own uses.
c:11231slprogramS

GOVERNMENT SAVINGS BY REPLACING DIRECT SUBSIDIES WITH LOANSOVER A TWENTY FIVE YEAR PERIOD - EXPRESSED IN NET PRESENT VALUE TERMS
(with current loan coverage)
1989
FORECAST FORECAST FORECASTNPV 60-80% Total NPV NPV
NPV Percent Public Government Savings PercentCurrent Government of Higher Higher Ed. By Charging of Higher
Loan Savings Education Enrollment 25% of Unit Cost EducationCountry Coverage (US$ million) Budget Coverage (US$ million) Budget
(1) (2) (3) (4) (5) (6)
Argentina 0 0 0% 659,477 903 17%Brazil (CEF) 224.722 3,400 9% 470.689 5.429 18%Colombia (ICETEX) 15,241 57 10% 260.774 2.509 19%Costa Rica (CONAPE) 1.034 45 13% 46,130 239 19%Ecuador (IECE) 1.300 24 12% 91.183 517 48%Guatemala 1.134 17 1% 23.959 78 22%Jamaica 284 2 1% 7.232 80 15%Mexico (Sonora) 4.141 4,141 3% 575,160 2.386 11%Venezuela (SACEUDO) 2,672 2,672 1% 299,353 3.401 39%
Total: 251.108 Average 8% 2,433,957 Weighted Average= 20%
General Notes:
(1): All loan number, amount and interest rate data based on APICE Questionnaires for 1989.Administration and default costs based on World Bank calculations and estimates;
Administration costs varied from 7% to 24% of loan disbursement, depending on country.
Default costs varied from 3% to 20% of loan disbursement, depending on the country.
(2): Net present value calculations used prevailing commercial interest rate as discount rate.
(3): Assumed constant higher education expenditures in real terms for 25 years.
(4): Assumed coverage of 60% of public higher education enrollment,
exce for Brazil (70%) and Costa Rica (80%). Assumptions based on
Household Survey Data and Ability to Pay Analysis
(5): Assumes 40% interest subsidization; 4-year disbursement; I year grace period;
10-year repayment period; 20% default rate; administration cost, 18% of loan; I
1% annual growth in number of students. Assumptions translate into NPV Cost Recovery of 51%.
Sources: Costa Rica: CONARE, Estadistica dole Educacon Superior, 1989; UNESCO Statistical Yearbook, 1991;
Brazil: Wolff. 1991; Venezuela: Wolff, 1992; Mexico: Primer Informe de Goblerno. 1989; tsa
Ecuador: Posada, 1990; Jamaica: i1nchcliffe, 1991; Winkler, 1990; APICE Questionnaires.
c:%1231sttreasury

Tdel Scholershtp Reveдue Deгivod From Tuition Foaat Vвrying 1,аvдво� dlgher Едисацоn Unit Соь1н
(USS l989)
С� � � 1 � о,� � sоч� бо� 7о� вочь 9очь lоояьArgeatlnt 9,529,512 16.845,065 2Э,920,244 Э0,031,226 34,84 Э,201 38,788,569 41,820,789 44,853,009 47,885,228 50,917.448 �8rez11 10д.4ц .б93 1? О.ОЕ2,356 214.892.456 ц 7.4S7,246 287.3 Э0.б46 Э17,204.047 Э40.15 Э.284 355.089.985 370.026.685 384.963.385СоlотЫ а 34,6Э0, Э08 61,??5,462 81,070,3 Э3 9Э,482, Э62 105,894,390 118,306.417 128,345,037 136,619,722 144,894,407 151,078,824Сода Rka 2,537,797 4,610,481 6.289,345 7,438,O5S 8,426,348 9,Э14,б41 10,202,934 11,004,010 11,596,206 12,188,401Ееиада 7,110.967 13.012,180 17.243,280 20.192.228 22.752,110 25,311,992 27.871,87 д 29.90 Э.972 31,191.096 32.044. Э90аиеtетвlв 90 д.416 1.471,533 1.842,691 2,186,885 2,4 Э4,Э24 2,577.509 2,701.229 2,824.948 2.948,668 Э,072, Э871ашаlса d93.Q9d l,539, а43 1,919,2? Э 2,249,S1S 2,54 Э.954 2,764,115 2,923,519 3,033,600 3,143,680 3,253;Мл�гl со зэ,s9аs17 6os76,m а1,610,27 о 96sa3,26s 1 ов,эаs, г7з 1 го,187, гв1 1 зl,989, гв9 141.997, в91 149,a6s,896 1s7,7. !,9 � .Veaewe9a 4d,441.tS6 д7.702, ц 9 115,227.014 1Э4, Э92,399 151,220,787 168,049,1?5 182,6l6,829 f93,835,754 205,054,680 211,252,692
Peroeat of Studmt Водуоа SсЬоl ат�Ъi рFl м ncod ВуTuitioa Foa� at VвryИg Levd� of Highar Education Uuit Coeh
on, � 2og Э� оg go� t19< бо чь то чь вояь 9о чь l оочсм Ееаt и. 1э 19 22 2э 2з 2э 2г 21 21 2ов� n !о 1 э 1э 1 э 1з 1г !г 11 11 1оСоl отЫа t2 16 1В 17 17 17 16 16 15 15Corta R!а 12 17 19 ZO 19 19 18 18 17 16 �peuedot 12 17 1д 11 13 � 17 1? 17 16 fSаиаtетеlв !0 1Э 14 !4 1Э 12 11 11 10 !0. � вдовlоа 12 16 16 16 15 l5 14 l3 12 l2М ецоо 12 17 19 19 1а l8 t8 17 17 16Уеаехидв 12 17 19 18 18 18 17 16 16 1S
Note: ТЬеs оепlтвtа вгеЬакдаа lюиее4оl дabOlty to реу tnhloa fea -tЬеpootat 30R о! LAC Ьon�eholda агеwumed to рау 5 � i оРtheir ам иеl iг�ооте;Ше� 1дд1е40li of LAC 1юикЬоlд� aro ввеишедto реу 109i оЕthelr аатаl inoome; ,
�the wealthlat 40ц ot LAC honeeholdi агевыитедto рву 159i oi Шefr м пивl iaoome;
А
О �
м РР�
й bd
e:11231ei1schorev

LOAN PARAMETERS USED FOR MAKING FINANCIAL LOAN RECOVERY CALCULATIONS
BRAZIL: COLOMBIA. BRAZIL: JAMAICA MEXICO: BOLIVIA: COSTA RICA.Assumptions APLUB ICETEX CEF SONORA CIDEP CONAPELoan Size per year 2.015 82,253 1,107 6,000 677035 2.153 126,407Nominal Interest rate 1 6% 24% 6% 12% 25% 12% 19%Nominal Interest Rate 2 6% 24% 6% 12% 25% 12% 19%Average number of years of loans 5 5 5 4 4 5 3Grace Period 1 0 1 1 1 1 1Repayment Period 1 5 10 5 9 4 5 8
Probability of Default/evasion 5% 15% 40% 27% 10% 25% 8%Probability of deferring Pay 0% 0% 0% 0% 0 0% 0%Inflation Rate 0% 22% 0% 19% 23% 15% 22%Administrative costs (as % ef debt) 2% 4% 4% 2% 3% 4% 2%Number of students receiving loan 1,197 IS.241 224,722 294 4.141 137 1.034Growth rate of number of loans given annually 1.01 1.02 1.01 1.03 1 1.01 1.01Indexing of loans relative to inflation 1 1.22 1 1 1.2 1.15 1.22commercial lending rateldiscount rate. 8% 34% 8% 19% 41.00% 20% 25%fed commercial Interest rate 8% 10% 9% 0% 15% 4% 2%
DOMINICANREPUBLIC: ECUADOR: GUATEMALA: CHILE HONDURAS: VENEZUELA: PERU
Assumptions FUNDAPEC IECE DIFOBE EDUCREDITO SACEUDOLoan Size per year 5,200 541.088 2,481 1,009 1.111 8,011 375Nominal Interest irate 1 14% 26% 16% 1% 12% 10% 294%Nominal Interest Rate 2 14% 30% 16% 1% 12% 10% 294%Average number of years of loan 2 5 4 4 5 6 4Grace Period I 1 1 2 1 1 1Repayment Period 1 3 10 4 10 6 10 2
Probability of Default/evadon 15% 30% 10% 30% 28% IS% 20%Probability of deferring Payments 0% 0% 0% 0% 0% 0% 0%Inflation Rate 19% 39% 14% 0% 15% 30% 328%Administrative costs (as % of debt) 2% 2% 5% 2% 5% 3% 3%Number of students receiving loans 6-A 1.300 to 13,292 208 2.672 20Growth rate or number of loans given annually 1.6 1 1 1.01 1 1.01 1.01Indexing of loans relative to inflation 1.18 1.39 1.134 1 1.15 1.3 1commercial leading ratddiscount rate 24% 44% 21% 1% 18% 36% 334%real commercial Interest rate 5% 4% 6% 1% 3% 5% 1%
Note: LAmn Information was gathered from surveys of loan programs;
Inflation and commercial interest rates from IMF Financial Statistics. December 1991

Sample Printout of Student Loan Financial ModelUsed to Calculate Loan Recovery in Net Present Value
(4 pages)
Assumptions BRAZIL-APLUB
Loan Size per year 2,015Nominal Interest rate 1 6%Nominal Interest Rato 2 6%Avenge number of years of loans SOrace Period IRepayment Period I 5
Probab(iity of Defaultievasion 5%Probability of deferring Payments 0%Inflation Rate 0%Administrative costs (as S of debt) 2%Number of students receiving loans 1.197Growth rate of number of loans given annually 1.01Indexing of loans relative to Inflation ICommercial lending ratediscount rat. 8%Real commercial Interest rate 8%
C:123WBRAl

COUNTRY: BRAZIL
Disburse- Repay- Outstanding Administr. Loss to Net Cash
Year ments ments Balance Cost Default Flow
1 (2,015) 0 (2.015) (40) 0 (2,055)2 (2,015) 0 (4,151) (83) 0 (2,098)3 (2,015) 0 (6,415) (128) 0 (2,143)4 (2,015) 0 (8,815) (176) 0 (2,191)5 (2.015) 0 (11,359) (227) 0 (2,242)6 0 0 (12,040) (241) 0 (241)7 0 2,858 (9.904) (198) (143) 2,5178 0 2,858 (7.640) (153) (143) 2,5639 0 2,858 (5,240) (105) (143) 2.611
10 0 2.858 (2,697) (54) (143) 2,66111 0 2,858 (0) (0) (143) 2,71512 0 0 0 0 (0) 013 0 (0) (0) (0) 0 (0)14 0 0 (0) (0) (0) 015 0 0 (0) (0) (0) 016 0 0 0 0 (0) 017 0 (0) (0) (0) 0 (0)18 0 0 0 0 (0) 019 0 (0) (0) (0) 0 (0)20 0 0 0 0 (0) 021 0 (0) (0) (0) 0 (0)22 0 0 0 0 (0) 023 0 (0) (0) (0) 0 (0)24 0 0 0 0 (0) 025 0 (0) (0) (0) 0 (0)
Present Values (8.689) 7,767 (996) (388) (2,306)(OCC used Is commercial
lending rate)
8.0%COST RECOVERY:
As % of amuunt lent 89% 11% 4% 73%
C:\l23\sl\BRA1

LOAN PORTFOLIO: DISRURSEMENTS AND REVENUE
Thousands
NET CASHCapital Administrative Projected Loss to FLOW
Year Disbursement Costs Revenues Default
1 (2,412) (276) 0 0 (2,688)2 (4.848) (555) 0 0 (5,404)3 (7.308) (837) 0 0 (8,146)4 (9,794) (1,122) 0 0 (10,916)5 (12,303) (1,410) 0 0 (13,713)6 (12,426) (1,424) 0 0 (13,850)7 (12,551) (1,438) 3,421 (171) (10,738)8 (12,676) (1,452) 6,877 (344) (7,595)9 (i2,803) (1,467) 10,367 (518) (4,421)
10 (12,931) (1,482) 13,892 (695) (1,215)II (13,060) (1,496) 17,453 (873) 2,023
12 (13,191) (1,511) 17,627 (881) 2,04313 (13,323) (1,527) 17,803 (890) 2,06414 (13,456) (1,542) 17,981 (899) 2,085
15 (13,591) (1,557) 18,161 (908) 2,10516 (13,727) (1,573) 18,343 (917) 2.12617 (13,864) (1,589) 18,526 (926) 2,148Is (14,002) (1,604) 18,712 (936) 2,16919 (14,142) (1,620) 18,899 (945) 2 19120 (14,284) (1,637) 19,088 (954) 2,21321 (14,427) (1,653) 19,279 (964) 2,23522 (14,571) (1,670) 19,471 (974) 2,25723 (14.717) (1,686) 19,666 (983) 2,280
24 (14,864) (1,703) 19,863 (993) 2,30325 (15,012) (1,720) 20,061 (1,003) 2,326
NPV = ($47,875)
~1

GOVERNMENT SAVINGS BY REPLACING DIRECT SUBSIDIESWITH LOANS(Thousands)
NET CASHSUBSIDY FLOW FROM NET TREASURY
Year REPLACED LOANS SITUATION
I 2,412 (2.688) (276)2 4,848 (5,404) (555)3 7,308 (8.146) (837)4 9,794 (10,916) (1,122)5 12,303 (13,713) (1,410)6 12,426 (13.850) (1,424)7 12,551 (10,738) 1,8128 12,676 (7,595) 5,0819 12,803 (4,421) 8.38210 12,931 (1.215) 11,71611 13,060 2,023 15,08412 13,191 2,043 15,23413 13,323 2,064 15,38714 13,456 2,085 15,541is 13,591 2,105 15,69616 13,727 2,126 15,85317 13,864 2,148 16,01118 14,002 2,169 16,17219 14,142 2,191 16,33320 14,284 2.213 16,49721 14,427 2,235 16,66222 14,571 2,257 16,82823 14,717 2,280 16,99624 14,864 2,303 17,16625 15,012 2,326 17,338
NPV = (47,875) 78,434
C:\l231sl%BRAI

Annex CPage 1 of 4
Annex C
The Economics of Higher Education and Implications for Reform
1. Under the tenets of welfare economics, private competitive markets are called for unlessspecific types of market or other failures occur that require government intervention. In the caseof higher education, this would mean that there would be no justification for public support orprovision unless there were important externalities, failures in credit markets to individuals andinstitutions, and/or problems of equity. Since these do exist there is at least a limitedjustification for public intervention in the provision of higher education.'
2. Justification for State Intervention. "Public goods" are commodities, such as clean air,or services, such as national defense, where the benefits to society cannot be easily dividedamong individuals, and in which those individuals are therefore likely to under-invest.Education is a "quasi-public" good, yielding both private. benefits (in terms of increased income-earning opportunities) and social benefits. However, *he mix of public and private benefitsvaries across educational levels and products. The social benefits or "externalities" of highereducation include (a) generating innovation to improve all peoples' lives through scientificresearch leading to technological applications; (b) preserving, transmitting and improving uponbodies of knowledge in various disciplines needed for social and economic development; (c)training the necessary leaders for a society who can manage the economy and the society, aswell as being a source of innovation for economic development and resolution of socialproblems; (d) nation-building; and (e) promoting a free society through criticism as well asthoughtful and participatory citizens.
3. At the same time, as a quasi-public good, individuals directly benefit to a large extentfrom higher education through increased income, so many of the returns to the investment inhigher education are captured by individuals. For example, in Brazil individuals with 13 ormore years of schooling earn twenty or more times the minimum wage, compared to individualswith 0-4 years of schooling, who earn the minimum wage or less. While the private returns tohigher education in terms of increased income to individuals can be measured, it is very difficultto quantify the social benefits and much depends on the value society places on these them.Nonetheless, it is nenerally acknowledged that these exist and, therefore, some degree ofgovernment support tor higher education is justified in order to ensure adequate generation ofnew knowledge.
4. Public intervention in higher education is also needed to overcome failures in humancapital markets, which prevent private individual and institutional investment in higher education.Furthermore, while individuals may be a source of funds for institutions through tuitionpayments, many individuals lack access to credit because human capital investments are regardedas inherently ri ky, and banks tend not to accept future earnings as collateral for a loan. Ifindividuals have no access to credit, society will under-invest in higher education.
This discussion draws heavily from World Bank Report No. 9376-BR, Higher Education Reform in Brazil,written by Laurence Wolff.
Annex CPage 2 of 4
5. In addition, higher education is expensive, and institutions often lack access to start-upfunds necessary for them to open or expand. In many cases educational institutions cannotafford expensive instructional equipment and materials, given students' limited access to thenecessary capital to cover tuition costs of their education. The under-investment is greatest infields which are both capital and labor intensive, such as science and engineering, and in fieldswhere the social rate of return is greater than the private rate of return, such as basic researchin the social and physical sciences and areas such as public health. Privately financedinstitutions tend to be biased toward less expensive fields that generate high private returns, suchas law and business administration.
6. A final reason why the state should intervene is to pursue goals of equity. Societieshave an interest in equity not only as an ideological principle, but also from an efficiencystandpoint. Education systems are most efficient when access is determined by ability toachieve, not ability to pay. Thus, public intervention serves to ensure that qualified poorindividuals, who in most cases have no access to credit, and who cannot afford to forego incomewhile attending school, have access to education. It also can ensure that poorer regions of acountry, which are most likely to lack the capital resources to begin an institution, can benefitfrom the services provided by a local higher education institution (through attracting commercialdevelopment, improving local industry or agriculture, etc.) Because resources are oftenconcentrated in a few central cities there often is little attention and research addressing theneeds and concerns of remote areas. Relocating individuals to central institutions also resultsin a "brain drain" of these regions.
7. Limits to state intervention, Although there is a case for public intervention in thefinancing of higher education, there is also a strong rationale for limiting that intervention. Thatis, direct beneficiaries should be required to pay part of the costs, and the private provision ofhigher education should be encouraged. This can be argued in terms of increasing both theefficiency and equity of the educational system.
8. Important external efficiency issues are the government's tradeoff between investing inhigher education and investing in other potential areas of public expenditure, and how efficientits investment in higher education is compared with the private sector's. As noted above thereare externalities related to higher education. However, there is also a strong argument fordirecting Latin American public investment on the margin into primary and secondary educationrather than into higher education. In the first place the lower levels offer the greatestexternalities by providing basic literacy and numeracy to the population as a whole, a goal ofall societies. In addition, the lower levels generally offer higher returns in terms of increasedproductivity as measured by individual income compared with the societal costs.
A common misconception is that quality teaching and research in scientific fields occurs in US privateinstitutions without state support. For example student tuition makes up only about 25% of HarvardUniversity's operating income. Most of the remaining funds come through government support forresearch, and through an endowment fund, which accounts for over 25% of annual income.

Annex CPage 3 of 4
9. A useful, although imperfect, means to assess the impacts of education is a rate of returnanalysis. Studies have consistently shown that primary education yields the highest social rateof return, followed by secondary and then higher education. Data from 45 developing countriesyields rates of 24%, 15% and 13% respectively (Psacharopoulos 1985). Finally, private sectorfinancing of primary education would be highly inequitable because of family income constraintsand the long lead time before children become economic assets. Therefore, while all educationwarrants public investment, at the margin, primary education is the most efficient publicinvestment. It also appears that graduate education and research have greater public goodproperties than undergraduate education.
10. Government also has an interest in encouraging guity in society. Complete subsidizationof higher education, at the general taxpayer's expense, is ineuitable because those who attendhigher education often come from wealthier families, and they usually earn the highest salariesafter graduation. As per capita expenditure on higher education is so much greater than at lowerlevels of the education system, public subsidies represent a net transfer of income from the poorto the rich.' In addition, in several Latin American countries (Brazil, Costa Rica) heavilysubsidized tuition in public institutions is being provided to children of the middle and upperincome classes, while those working full time, and with lower incomes, attend evening coursesin fee-paying institutions of lower quality. Therefore, user charges in public institutions, whencombined with mechanisms to assist those who cannot pay (loans and scholarships), will resultin a more equitable distribution of public funds. User charges shift costs onto those who receivebenefits rather than spreading them over a broad tax base of people who receive fewer and moreindirect benefits.
11. Another limitation to state intervention concerns growing budget constraints in the wakeof expansion. The social demand for higher education has exploded over the last few decadesbecause of rising numbers of secondary school graduates and the perceived private benefits touniversity degrees. Many governments have responded to this pressure by rapidly expandingpublic higher education institutions and/or by increasing funds for higher education at theexpense of more pressing priorities. In Latin America, for instance, the percentage of youthsaged 20 to 24 entering higher education increased from 3.0% in 1960 to 16.9% by 1987. Theimpact on government investment in education has been alarming. In 1960 Latin Americangovernments spent 14% of the-ir education budgets on higher education. The share of resourcesclimbed to nearly 24% in 1980.* Meeting the cortinued demand for enrollment in highereducation would mean that primary and secondary education as well as other pressing socialneeds would have fewer public resources.
12. An argument against state provision of higher education is that it encourages inefficiency.
3 Birdsall and James 1990, Psacharopoulos 1986.
* Psacharopoulos, George. 'Higher Education in Developing Countries: The Scenario of the Future", inHigher Education, Vol 21. 1991.

Annex CPage 4 of 4
Throughout the world costs of public institutions are found to be higher than those of privateinstitutions which provide similar services. Because of bureaucratic rules and regulations publicinstitutions are less agile than private ones in responding to changing demands. Furthermorelow or non-existent fees lead to longer periods of enrollment by students in public institutionsand to a lack of pressure for increased internal efficiency.
13. In summary, based on economic theory, Governments should seek to maximize themobilization of individual and private sources of funding for higher education, especially at theundergraduate level. This would include charging tuition to cover the teaching costs ofundergraduate education in public institutions, supporting the growth of the private sector, andtrying to get the public sector to focus most on the areas within higher education which have thegreatest externalities. Government support should especially go to research, with externalitiesin terms of encouraging economic development through technology development, and toinstitutions in backward or underdeveloped regions. To deal with equity issues and capitalmarket failures, governments should support large-scale loan schemes as well as scholarshipsto the needy. Subsidizing students through scholarships and loans rather than directlysubsidizing institutions would mean the Government would place choice of institutions in thehands of students, with resulting encouragement of diversity and cost efficiency of highereducation systems.
14. While these arguments are persuasive, no country in the world has fully established ahigher education system of this sort. This is partly because in the past Governments couldafford the full costs of small public higher education systems which trained only the nation'selite. Another reason that this model has not been fully implemented is that there are a numberof complex practical problems which have to be considered, including, for example, how toeffectively manage large loan schemes, as well as important and non-trivial transition costs inintroducing financial reforms which lead to changes in the missions and clientele of institutions.A final reason lies in the power of associations and pressure groups to resist such changes,which may involve a loss of privileged positions. This often leads governments to financeprivate rather than public goods, and to undertake inefficient programs that yield large benefitsto small groups of politically influential actors, rather than small benefits to widely diffusedgroups, even though the social return to the latter may be greater. Since producer groups arelikely to be better organized than consumer groups, and middle and upper income groups aregenerally more articulate than poorer groups, it is likely that producer and middle class groupswill benefit disproportionately from government policies. Nonetheless, most countries in theworld are finding themselves forced, mainly for financial reasons, to move in the direction ofincreased tuition charges in public institutions, expanded loan schemes, and the growth of privateeducation.

Annex DPage 1 of 8
Annex D: APICE Student Loan Questionnaires
APICE: Asociacion Panamericana de Instituciones de Credito Edicativo
LAC Student Loan Programs Responding to World Bank Survey
Bolivia: Centro Impulsor de Educacion Profesional (CIDEP)Colombia. Instituto Colombiano de Credito Educativo y Estudios Tecnicos
en el Exterior (ICETEX)Colombia: Fundacion Educativa CentralSegurosCosta Rica: Comision Nacional de Prestamos para Educacion (CONAPE)Dominican Republic: Fundacion APEC de Credito Educativo (FUNDAPEC)Ecuador: Instituto Ecuatoriano de Credito Educativo y Becas (IECE)Guatemala: Direccion Para el Fomento de Becas (DIFOBE)Honduras: Instituto de Credito Educativo (EDUCREDITO)Mexico: Instituto de Credito Educativo del,, tado de SonoraNicaragua: INDE - (EDUCREDITO)Peru: Instituto Peruana de Fomento Educativo (IPFE)Uruguay: Universidad Catolica del Uruguay "Danso Antonio Larranaga"
(UCUDAL)Venezuela: Sociedad Administradora de Credito Educativo Para la
Universidad de Oriente (SACEUDO)

Annex DPage 2 of 8
Summary of APICE Student Loan Questionnaire Responses
1. Public vs. Private Educational Credit Institutions (ICEs)
Approximately one-half of APICE institutions are public. It does not seem to mattergreatly what the legal status is; there are well-functioning public institutions (ICETEX andCONAPE) and private institutions (FUNDAPLUB and CENTRALSEGUROS), as well aspoorly functioning institutions of both kinds. 42 percent of the ICEs were public, 8 percentwere mixed and 50 percent were private. The largest ICEs, however, are public (ICETEX,CONAPE) because of the public sector's willingness to contribute greater sums ofconcessionary financing than the private sector.
2. Type of Higher Education Financed: Public vs. Private
All loan programs surveyed offered loans for both private and public higher educationinstitutions, ranging from technological institutes and teacher training schools to fulluniversities. Some countries limit financing to priority areas of study for economicdevelopment. [Note: Chile, which was not surveyed, does not offer loans for private highereducation.]
3. Type of Expense Financed: Tuition, Living Expenses, etc.
42% of the loan programs financed only tuition, while more than 50% financed bothtuition and living expenses. In cases of joint financing, one loan is made to cover all typesof expenses, rather than making two separate loans, but the bulk of the loan still goes to paytuition costs. For living expense financing, the loans are only partial, which makes itdifficult for rural students (and urban students living in cities without universities) to pursuehigher education because they cannot afford to relocate. Financing for overseas study israrely adequate, reaching perhaps 30 percent of tuition costs (on average) and even less forliving expenses.
4. Number of Loans Made:
In general, coverage of total higher education enrollment is low: ICETEX, thelargest of all loan programs surveyed, covered just 6% of total enrollment with 15,241 loansin 1990. No other loan program comes close in terms of numbers of loans extended. CostaRica, Mexico and Brazil offered between 1,000-1,900 loans in 1990, while Bolivia,Guatemala, Honduras, Nicarnaga and Peru all offered less than 175 loans each. [Note:Chile's loan program covers 44 percent of public university students, which is equivalent to21 percent of all students, public and private.]

Annex DPage 3 of 8
There is also great fluctuation over time in the number of loans offered. OnlyICETEX and CONAPE have managed to maintain steady increases, reflecting their goodadministration and sources (and diversification) of funds, while all the others have fluctuatedaccording to yearly financial resources, which are in turn tied to macroeconomic conditionsin the countries.
5. Level of Study Financed:
The vast majority of loans (88%) went to finance undergraduate study, with the restgoing to postgraduate study (12%) and secondary study (less than 1%). In terms of value ofloans disbursed, an even greater proportion went to undergraduate study.
6. Increases in Loan Amounts:
In almost all cases, loan amounts had been increased over the last five years becauseof inflation and resultant increases in tuition fees. Typically, the loan amount covered thecost of tuition (90% in the instance of ICETEX) and in cases where loans are extended tocover living expenses, as well, loan amounts were fixed at about 50% of estimated costs.The big problem in LAC has been hyperinflation, which has raised tuition costs, reduced thenumber of loans that could be made available, and decapitalized loan programs whichoperated on fixed subsidized interest lending rates (i.e. negative real interest rates). Inalmost all cases, however, loans covered the entire time period for higher education (allyears of study).
7. Loan Repayments:
In all but two cases (ICETEX and Peru) loan repayments are made in simple, fixed-payment installments following standard mortgage procedures. Arrangements for moreflexible repayment plans that would more closely follow graduates' age-earnings profiles arenot available. In essence, the fixed payments become a major subsidy - there is a need toshift to higher (ideally floating interest rates, indexed to the commercial rate, say at 5 percentbelow prime) interest rates and longer repayment periods.
8. Amortization Periods:
For undergraduate study amortization periods varied from 1-8 years, with the mostcommon period of 5 years. Many programs use simple rules for determining the length ofthe amortization period, such that the amortization period equals the disbursement period (fora one-year loan, the amortization period is one year; for four years of loans, the amortizationperiod is four years, etc.).
With the longest repayment period at 8 years (Costa Rica), there would seem to bescope for lengthening this period, allowing smaller mortgage payments, especially if move toa step-mortgage scheme for even smaller initial payments. This would also permit higher

Annex DPage 4 of 8
interest rates as payments would be spread out over a longer period and hence would besmaller.
9. Grace Periods:
Grace periods were most commonly set at 6 months, for payments on both interestand principal. Notable exceptions to this are ICETEX, which offers no grace period, andFUNDAPLUB, which offers a nine-month grace period. In all cases, grace periods were thesame no matter whether the loan was for tuition or living expenses.
10. Interest Rates: 1990 - The average interest rate subsidy is about 50 percent of thecommercial rate.
Market Rate Loan Rate SubsidizationICETEX 36 24 33CONAPE 34 19 44BOlivia 22 10 55Guatemala 21 16 24Honduras 35 12 66Sonora/Mex 41 25 39Peru 334 294 12Ecuador 47 32 32Venezuela 41 10 76
11. Non-Governmental Sources of Funds
75% of the loan programs have sources of non-governmental funds, ranging from 6%to 100% of 1990 loan program budgets. Private funds come three ways: (1) donations whichthe program can administer as it sees fit; (2) transfers of money administered by the loanprogram so that students of interest to the private contributors can be funded; (3) legalobligations which stipulate that private employer; must pay a small percentage of theirpayroll to the loan program.
12. Market Investments
70% of the loan programs have the legal right to invest capital funds in the market toexpand portfolio and increase lran amounts and/or quantities. The big problem, however,appears to be excessive government regulation which reduces investment results.
13. Loan Selection Criteria
All loan programs consider economic need as their primary selection criteria; mostprograms also consider academic merit.

Annex DPage 5 of 8
14. Loan Repayments
All loan programs use direct payment to the program as the form of loan repayment.Several programs also offer an automatic discount program from bank accounts so as toavoid transaction time and paperwork.
15. Loan Default
Based purely on the distributed questionnaires, loan default in 1989 was just 3.3percent on average. This is almost surely an underestimation stemming from differences instatistical and MIS systems, the most important of which classifies loans many monthsoverdue as simply in "arrears" and not in default. Nevertheless, LAC loan programadministrators claim that default is not a significant problem for their institutions; what hasdecapitalized the portfolio is not default but hyperinflation.
16. Repayment Security
All loan programs insist on signed promissory contracts between the borrower and theagency (pagare), in which the borrower legal binds him/her self to repay the funds extended.Almost all loan programs require a loan guarantor, wh:le about one-half require some formof collateral. 25% of the institutions reported using private collection agencies (which wouldhave some incentive to collect Ehe loan, e.g. based on amounts recovered), while nonereported deducting overdue payments directly from income taxes.
17. Default Penalties
All loan programs reported applying sanctions in the event of loan default, mosttypically by applying higher interest rates to outstanding payments. The second mostcommon sanction (66%) was the simple seizure of collateral, followed by judicialprocedures. The latter rarely happens, if at all, before 6 months of loan payment default.Only 33% reporting requiring loan co-signers ("guarantors") to pay the defaulted balances.
18. Use of Social Security Institutes for repayments
Only one institute (Nicaragua, which is actually not currently functioning) reportedusing the SSI for repayment now, and no other program expressed an interest in using theSSI (except for Costa Rica). Among private loan programs there is an obvious problem ofusing a public health agency to collect Ican payments for a private loan institution. Amongpublic loan programs there was near universal consensus that the SSIs do not have thecapacity, are too slow and inefficient, lack the appropriate information systems and legalstructures.
In fact, one program (Ecuador) currently receives a 0.5% payroll tax through the SSIbut there have been so many problems in transferring these funds that the Ecuador programpreferred to "do without" this possible assistance.

Annex DPage 6 of 8
Looking deeper into loan program responses, there seems to be a common fear thatSSIs are too powerful, too political, and yet too weak in terms of human and institutionalcapacity. That is, these programs foresaw (1) major difficulties in actually receiving themoney that they would be due, and in having any recourse in such a situation; and (2) toomuch ineffiency and incompetence to function in a way conducive to financial sustainability.APICE in their own comments to the individual loan program responses, described the SSI ashaving too many financial and administrative problems to render feasible the use of SSI forloan recovery.
19. Loan Coverage
Loan Coverage - loan coverage relative to applicants who meet selection criteria isrelatively high. But considerable self-selection of applicants occurs: many potentialborrowers don't borrow because they cannot pay for living expenses, making a tuition loan amoot (or irrelevant) problem. Overall, the loan programs reported that among all loanapplicants who matched loan selection criteria, approximately 70% actually received loans.Here the critical variable is simply the availability of funds: in Bolivia just 10% of thosestudents who qualify receive loans because financial resources are so constrained, whereas inCosta Rica and Sonora/Mexico the proportion of qualified students receiving loans is 90%and 98%, respectively.
20. Follow-Up Studies
60% of the loan programs stated they had carried out at least one follow-up study ofloan beneficiaries, but no such study could be obtained. This highlights a big problem withthe lack of studies and research into graduate follow-up; there is no apparent relationbetween the area of employment and being a loan beneficiary.
Among those programs which had information on loan beneficiary employmentafter graduation from higher education (only Costa Rica, Guatemala, Nicaragua, Mexico, andPeru), 50% of graduates were working in the private sector, 35% in the public sector, 10%in the informal sector and 10% were unemployed.
21. Computerization of Operations
Almost all loan programs have computerized their accounting systems, and most havecomputerized their registration of borrowers. On the input side, however, only two(ICETEX and Sonora/Mex) have computerized loan application. For overall operations,ICETEX, Ecuador, Sonora/Mex, and Peru have all computerized their budgeting and salarypayment systems, although the majority of loan programs have yet to do so.
22. Priorities for Improving Program Operations

Annex DPage 7 of 8
Not surprisingly, the two greatest priorities expressed by the loan programs forimprovements in their operations is (1) an increase in staff salaries (75%) and training forpersonnel (also 75%). This would improve the human resource capacity of the loanprogram, allowing the hiring of experienced, highly qualified staff, and the training of lessexperienced staff (especially in financial management), to improve efficiency. The nextgreatest priority was said to be investments in technology, such as computers and other officeequipment. With so much being done by hand, there are problems with slow processing ofapplications, slow identification of defaulters, slow disbursal of funds, processing mistakes,inability to make swift, prudent investments, etc.
60% of loan programs responding said positive interest rates would be anotherimportant priority for improving their operations, for the obvious reason that negativeinterest rate imply constant dependence on infusion of additional "grant funds" from thegovernment, foundations, external donors, etc. or else the program will become "de-capitalized".
One out of three programs stated that salary incentives to recover loans would be apriority, as would laws which increase the programs' authority and mechanisms for loancollection.
23. Stiffening of Loan Terms
One surprising fact is that the majority (60%) of loan programs stated they would nothave political problems with a strengthening of the terms of the loans, such as interest rateincreases, shorter grace periods, etc.. Those who disagreed with the change stated that loanterm strengthening would hurt the poorest segments of student loan beneficiaries.
In order to reduce any political problems such loan term strengthening might imply,75% of loan programs said an expansion of the loan program to cover more students wouldbe critical, while 60% said that publicity campaigns explaining the change and expansion ofaccess (admission) to higher education institutions would be helpful in reducing politicalpressures.
24. Borrower Information
The average age of borrowers for the loan programs as a whole as 23, with the rangeamong programs from 20-24. Borrowers were roughly evenly distributed among males andfemales, with 48% of all borrowers in 1990 in the feminine category. The range wasconsiderable here, from 21% in Ecuador to 60% in Venezuela.
25. University Charges

Annex DPage 8 of 8
In general, there is an awareness o± the need to raise university charges at publicuniversities. On average, those institutions which do charge fees do not cnarge more than 15percent of actual costs of providing higher education. Similarly, public university studentsonly pay about 15 % of what private students pay for higher education. The most promisingstrategy is to charge according to the ability of students and their families to pay (a planalready in place in Colombia).
83% of the loan programs reported that higher education institutions charged tuitionfees, ranging from US$0 to US$ 200 in public institutions. 66% also said that exam feeswere charged as a way to raise some revenue for the school, while just 50% charged forfood and textbooks. Only 33% of programs stated that higher institutions charged forlodging, although it is not clear how many schools actually have lodging to offer and forwhat percentage of students. 40% charged for health services.
26. Scholarships
More than half of all loan programs reported administering scholarships to highereducation students, in addition to loans. In some cases, funds for these scholarships camefrom outside sources (foundations, Congress, etc.) and the program simply administered theprogram. In other cases, funds for scholarships came from the programs' own resources.Typically, loan and scholarship programs are independent of each other, so that they are notexclusive.
27. Tuition Fees
90% of loan programs stated they would have political problems with an increase instudent fees, although all said that expansion of loan programs to cover more students wouldbe effective in reducing these problems; 75% said increasing access to higher educationinstitutions would reduce these problems. A majority said that publicity campaignsexplaining the need for the tuition increases, and announcing that these increases would beaccompanied by expansion in loan programs and higher education access, would reducepolitical problems. Updating curricula, course offerings and overall quality to reflectchanges in science, technology, econonic liberalization, etc. would also reduce publicresentment.

Annex EAnnex E Page 1 of 2
Checklist for Designing Student Loan Programs
Structure/Polic ORto Descriition
kin"M a. Autonomous The most coman institutional structure is toInstitution Public Body create a pubUcly administered and financed loan
organization to distribute and collect loans.
b. Public Another comon institutional structure utiUzes publcly owned caumercial banksBanks to administer loans.
c. Private ln countries with more developed banking systemsCamercial private banks may be used to allocate loans.Banks (US, Indonesia, Denmark).
d. igher Governments may transfer funds to higher educationEducation institutions for the purpose of administering loans.Institution (China, Chile).
e. Directly Honey is disbursed directly from governmentfrom Govern- ministries or trust fund, and collected by treasury.ment Accounts (Australia, Ghana).
Renarmnt a. Hortgage The most camon approach by which theHechnias type loan capitalized loan is broken into equal monthly payments.
b. lIcome Payments are a fixed portion of monthly orContingent annual income, thus putting a Limit an the debtLoan burden to a graduate (Sweden).
c. Graduated Payments fixed in advance, but increase with time.payments
d. Income Same as IbI except payment may be collectedContingent through the taxation system (Australia).Loan (Tax)
a. Deferral of Repayment is through an already existing payrollSocial tax in which pension benefits do no); begin to accrue untilBenefits the loan is repaid (Ghana).
f. Graduate Students contribute through a Lifetime increase in theirtax/equity tax contribution. (Offered briefly at Talefinance University, proposed in US and UK).
a. Eployer In countries where graduates are scarce, employersContribution contribute to loan or tax repaymentsThrough Tax as a fozm of 'soarcity" tax. Loan repayments ae sharedor Loan between employers and employees in Ghana and China.
h. Rational Repayment through labor that isService socially valuable to and in demand by the society.
fggg a. Heans Selection of credit recipeants on the basisTestit of family or individual (Sweden, Norway) Income.
Or more complex socio-*conmic status indicators (Chile).
b. Ablity Selection of students on the basis of performanceCriteria at secondary school, on national exams or within universities (IadAesia).
Source.- Reproduced from Albrecht and Ziderman, Deferred Cost RecoveryFor Higher Education, World Bank Discussion Paper, No. 137

Annex EPage 2 of 2
c. Priority Priority support for students who study in fieldsAreas of national manpower priority -- e.g. engineering, teacher training,
health. (Colombia, Barbados)
d. Restricted Limitation on availability of funds to a fixed periodLength of study -- as the official duration of a given course. (Brazil.
Denmark)
Inters a. Fixed Real Interest rates can fixed in relation to inflation
Rates. and or floating at either negative, zero percent or positive real rates, or they
Subsidies can float with an index of commercial rates.
b. Differential Students charged different rates of interest basee
Interest on their economic situation, thus targeting morerates subsidized support to needy. (US, Japan).
c. Repayment The length of the repayment period can be varied to
Length achieve a balance between debt burden and financial ffick-cy.
d. Graduated Payments can be calculated so they are smaller in
Annuities the first years and larger later on.
e. Up-front Allow students who are eligible for a subsidized
Discount on loan to have their fees reduced by a fixedTuition percentage if they forgo the loan. (Australia. Israel).
Daul a. Grace Allow students a specified time after graduation
inimization Period before repayment begins, with the assumptionthat they need time to find employment.
b. Income Allow graduates to defer payment during any timeThreshold in which their income falls below a specified
level (Sweden, Kenya, UK).
c. Incentives Where the government is the guarantor onfor the loans, the government discounts the value of
Financial that guarantee sufficiently so that institutions
Agent prefer to collect from the student.
d. Require Requiring an income earning co-signer on a loan
Guarantor who agrees to pay in the event that the graduatedoes not. (Ghana. Barbados. Brazil)
e. Payroll Requiring employees to withhold a portion of salary
Deductions of graduates for the purpose of paying the Loan. (Jamaie&)
f. Income tax Governments to locate individuals that might be in default.to locate through taxation institutions Canadadefaulters
a. Voral Publish lists of defaulters (Jamaica)Pressure
b. Required Require student to pay an up-roant feInsurance to insure against losses that result from
death or debilitating illness or accidents.(Brasil).
i. Bar Further Bar access to further credit if default. (BrasIL)credit
J. Collection Utilize private collection agencies to locate students and
Agencies secure payment. (Sonduras. Colombia).

ANNEX FPage 1 of 3
Annex FThe Feasibility of Using Latin American Social Security Institutes
for Student Loan Collection
1. One suggestion for improving loan repayment that has gained increasing support is theuse of Social Security Institutes (SSIs) as collection mechanisms, on the grounds that theseinstitutes are well-developed in Latin America, typically cover much of the country, and arewell-linked to payroll systems such that payments into social security systems are automaticin most cases. This possibility was examined through a survey of Latin American loanprograms and interviews with social security experts.
2. Among those loan programs surveyed, only one (Nicaragua, which is not currentlyfunctioning) reported using the SSI for repayment, and no other program expressed aninterest in using the local SSI (with the exception of Costa Rica). Among private loanprograms there is an obvious problem of using a public health agency to collect loanpayments for a private loan institution. Among public loan programs there was nearuniversal consensus that the SSI do not have the capacity, are too slow and inefficient, lackthe appropriate information systems and legal structures. In fact, one program (Ecuador)currently receives a 0.5% payroll tax through the SSI but there have been so many problemsin transferring these funds that the Ecuador program stated it preferred to "do without" thisassistance.
3. Looking deeper into loan program responses, there seems to be a common fear thatSSIs are too powerful, too political, and yet too weak in terms of human and institutionalcapacity. That is, these programs foresaw: (1) major difficulties in actually receiving themoney that they would be due, and with little recourse in the event of non-payment by theSSI; and (2) too much ineffiency and incompetence within SSIs to achieve cost recovery. Inits own comments to the individual loan program responses, the Pan American Association ofEducational Credit Institutions (APICE) described Latin American SSIs as having too manyfinancial and administrative problems themselves to render feasible their use for loanrecovery. In fact, Carmela Mesa-Lago's recent study of SSIs suggested the need to searchfor alternative methods of financing to redur . the risk of evasion and delay; this does notgive much hope for reducing loan payment evasion and delay via social security institutions.
4. More specifically, Mesa-Lago's study of SSIs revealed major administrative problems:information, payment processing and accounting deficiencies, lack of comppputerization,legal complexities, managerial inefficiencies, etc. Clearly, throwing student loan programcollection into this state of disarray is not without risk. Loan beneficiaries might well indeedpay their loans via the SSIs, but this is no guarantee at all that the repayment would gettransferred from the SSI to the loan program. Secondly, because administrative costs of theLatin American SSIs are among the highest in the world (Mesa-Lago estimates them at 10-32% of total expenditures), collecting loans through SSIs might well. mean highergovernment salary costs to the SSI. It might actually be cheaper for governments to transfermoney directly to loan programs than pay the administrative costs of loan transfers throughSSIs.

ANNEX FPage 2 of 3
5. One interesting fact is that almost all SSIs in Latin America are running increasingoperating deficits, including the decapitalization of reserves and investment funds. Thismeans that there would be a strong bureaucratic incentive to use whatever student loanrepayments were collected for internal purposes, instead of turning them over to loanprograms. The greater political power of the SSIs relative to student loan programs wouldfurther reinforce this temptation.
6. Another major problem is coverage. Mesa-Lago's recent study on SSIs estimates SSIcoverage as follows: 80-100% in Brazil, Jamaica, Barbados; 60-80% in Chile, Uruguay andCosta Rica; 40-59% in Mexico and Venezuela; 20-40% in Peru, Colombia, Honduras, ElSalvador and the Dominican Republic. Presumably, only people actually covered by the SSIare making any payments to the SSI and so could be expected to repay their loans throughthe SSI system. On the other hand, in some countries (e.g. Argentina) there appear to be toomany social security institutes, such that using them to collect student loan repayments wouldbe doubly complicated.
7. Payment evasion of SSI obligations is yet another concern. It is logical to expect thatloan repayment collection via SSIs would be no greater than SSI payment collection ingeneral. Unfortunately, the recent study of SSIs in Latin America shows extremely highrates of evasion.' Note that the evasion rates are by SSI members (i.e. people registeredwith the SSI), and that non-payment rates by the self-employed are much higher. Manystudent loan beneficiaries do indeed become self-employed businessmen, doctors, lawyers,etc., posing particular problems for debt collection via SSIs. This is exacerbated by the factthat typically self-employed people pay in general about twice the percentage as pay salariedworkers, so that their incentives to avoid are greater. The size of the informal sector inLatin American countries is another way of estimating loan payment evasion under SSI loancollection mechanisms. Informal sectors are estimated for the following countries: Chile,20% of economically active population (EAP); Colombia, 22% of EAP; Costa Rica, 22%;Jamaica, 38%; Mexico, 31, Peru, 62%. Thus, whether viewed from within social securityinstitutes or from beyond the formal employment sector, it appears unlikely SSIs are capableof cost-effectively improving student loan collection rates.
8. Th. ollection of student loan payments through social security institutes in LatinAmerica would be throwing much smaller, potentially efficient systems (with operatingcharacteristics of a private sector financial institutions) into the morass of inefficient,deficitary, politically powerful public institutions whose objectives are the financing of healthand pension funds, not of higher education. This confusion of institutional objectives,interests and capacity is not advisable financially, organizationally or politically for LatinAmerican student loan programs. It would be better to improve loan collection procedures
Evasion Rates: Argentina, 23%; Brazil, 60% of registered SSI members; Jamaica, 44% of registeredSSI members (95% of self-employed); Peru, 33% evasion; Chile, 30% of those registered; Uruguay,27%; Barbados, 96 percent evasion by self-employed). Source: Mesa-Lago, Social Security andProEpcts for Eauity in Latin America World Bank Discussion Paper 140, 1991.

ANNEX FPage 3 of 3
within the student loan programs themselves, combined with legislation which increases theirauthority to pursue and penalize defaulters.
9. On the other hand, increasing attention is now being paid to reform of Social SecurityInstitutes so that it is not unreasonable to think that in the future they might be an effectivevehicle for loan collection. The topic merits further study with a view towards medium-termstudent loan program design.

Annex GPage 1 of 1
Annex G
Household Survey Data Description
Country/ Survey Name Executing Agency Coverage Number of IncomeDate Households Concept
Argentina Encuesta Permanento Instituto Nacional do Metropolitan Area 16,759 Total householdMay 1989 de Hogares (EPH) Estadistica y Censos income
Bolivia Encuesta Integrada Instituto Nacional do 17 urban centers with 37,864 Total householdNovember 1989 do Hogares (Efi) Estadistica (INE) 10,000 or more income
inhabitants
Brazil Pesquisa Nacional por Pundacao Instituto Brasileiro National 70,777 Total householdFourth quarter 1989 Amostra de Domicilios de Geografia y Estadistica income
(PNAD)
Chile Encuesta Nacional del Instituto Nacional de National 32,456 Total householdFourth quarter 1989 Empleo (PIDEH) Estadistica y Censos income
Colombia hncueata Nacional de Departamento Administrativo Barranquilla, Bogota, 17,949 Total householdSeptember 1989 Hogares - Fuerza do Nacional do Estadistica Bucaramanga, Cali, income
Trabajo (ENH) Cartagena, Manizales,Medelin y Pasto
Costa Rica Encuesta do Hogares Direccion General do National 7,637 Total householdJuly 1989 do Propositos Estadistica y Censos income
Multiples (EHPM)
Ecuador Encuesta Periodica Instituto Nacional National 5,558 Total household1987 sobre Empleo y do Emplco income
Desempleo
Guatemala Encuesta Nacional Instituto Nacional do National 10,934 Total householdApr 4-July 24, '89 Socio-Demografica Estadistica income
(ENSD)
Honduras Encucsta Permanente do Direccion General do National 8,648 Total householdSeptember 1989 Hogares de Propositos Estadistica y Censos income
Multiples (EPHPM)
Jamaica Jamaica Survey of Statistical Institute National 2,725 ConsumptionJuly 1989 Living Conditions of Jamaica expenditure
Mexico Encucsta Nacional do Instituto Nacional do National 4,963 Total householdFirst quarter 1984 Ingreso - Gasto do Estadistica Geografis income
los Hogares (ENIGH) e Informatica
Peru Peru LSMS Instituto Cuanto Lima 1,385 ConsumptionJune '90-July '90 expenditure
Venezuela Enouesta do Hogares Oficina Central do National 61,385 Total householdSecond half 1989 per Muestra (EHM) Estadistica c Informaicsa income
Source: Psacharopoulos, Lee and Wood, Poverty and income DasOnbuion in Latm Amerca and the Caribbean: An Update(Discussion Draft #2), The World Bank, March 1992.

Amex HPage 1 of 1
Annex H
Sources for Determination of Higher Education Unit Costs
Argentina: Gertel, "Issues and Perspectives for Higher Educadon in Argentina in the 1990s",Higher Education, 21, 1991.
Brazil: Brazil - Higher Education Reform in Brazil, The World Bank, Report No.9376-BR, 10/91
Colombia: Data furnished by the Instituto Colombiano para el Fomento de la EducacionSuperior (ICFES), 11/91
Costa Rica: Costa Rica - Basic Education Rehabilitation Project SAR, Report no.9893-CR,10/91
Ecuador: Higher Education Credit in Ecuador, report prepared for the World Bank byAlvaro Reyes Posada, 1990
Guatemala: UNESCO 1991 Statistical Yearbook
Jamaica: Access. Quality and Efficiency in Caribbean Education, prepared for the WorldBank by Keith Hinchcliffe, 10/91
Mexico: Data furnished by the Direccion General de Programacion, Planeacion yPresupuesto (DGPPYP) of the Secretaria de Educacion Publica (SEP)
Venezuela: A Cost-Benefit Analysis of Educational Investment in Venezuela, "A View fromLATHR, Fiszbein and Psacharopoulos, 11/91

Other Reports in the Series
No. 1: World Bank Strategy for the Natural Gas Sector in LAC, March 1991
No. 2: Women in Development: Issues for the Latin American and Caribbean Region, April 1991
No. 3: Easing the Poor Through Economic Crisis and Adjustment: The Story of Bolivia's EmergencySocia: Fund, May 1991
No. 4: Direct Credit for Privatized Firms, June 1991
No. 5: Decentralization to Local Government in LAC: National Strategies and Local Response inPlanning, Spending and Management, July 1991
No. 6: Mexico Labor Retraining Program: Poverty Alleviation and Contribution to Growth,August 1991
No. 7: The Evolution, Situation, and Prospects of the Electric Power Sector in the Latin American andCaribbean Countries, August 1991
No. 8: Choice of Nutritional Status Indicators for Young Children in Public Health Programs, September1991
No. 9: Developing Educational Assessment Systems in Latin America, September 1991
No. 10: Women's Employment & Pay in Latin America, October 1991Part I: Overview and Methodology; Part II: Country Case Studies
No. 11: Feeding Latin America's Children: An Analytical Survey of Food Programs,November 1991.
No. 12: Incentive Structure & Resolution of Financ'al Institution Distress: Latin American Experience,November 1991.
No. 13: Tax Administration in Latin America, January 1992.
No. 14: Public Policies and Deforestation: A Case Study of Costa Rica, February 1992
No. 15: Auctioning Credit: Vol. 1: Conceptual Issues; Vol. II: The Case of Chile;Vol. III: The Case of Bolivia, January 1992.
No. 16: Economic Policies and Performance under Alternative Trade Regimes: Latin America During the80s, April 1992.
No. 17: Infrastructure Maintenance in LAC: The Costs of Neglect and Options for Improvement, Volumes1-5, June 1992.